Article

Benchmarking Hyper-Breakpoints for Efficient Virtual Machine Introspection

by
Lukas Beierlieb
1,*,
Alexander Schmitz
2,
Raphael Springer
2,
Christian Dietrich
2 and
Lukas Iffländer
3,*
1
Cyberus Technology GmbH, 01069 Dresden, Germany
2
Institute for Internet Security, Westphalian University of Applied Sciences, 45897 Gelsenkirchen, Germany
3
Faculty of Informatics/Mathematics, Hochschule für Technik und Wirtschaft Dresden—University of Applied Sciences, 01069 Dresden, Germany
*
Authors to whom correspondence should be addressed.
Electronics 2025, 14(3), 534; https://doi.org/10.3390/electronics14030534
Submission received: 28 December 2024 / Revised: 20 January 2025 / Accepted: 27 January 2025 / Published: 28 January 2025
(This article belongs to the Special Issue Computer Architecture & Parallel and Distributed Computing)

Abstract

:
Virtual Machine Introspection (VMI) is a powerful technology used to detect and analyze malicious software inside Virtual Machines (VMs) from outside. Asynchronously accessing the VM’s memory can be insufficient for efficiently monitoring what is happening inside of a VM. Active VMI introduces breakpoints to intercept VM execution at relevant points. Especially for frequently visited breakpoints, and even more so for production systems, it is crucial to keep their performance overhead as low as possible. In this paper, we provide a systematization of existing VMI breakpoint implementation variants, propose workloads to quantify the different performance penalties of breakpoints, and implement them in the benchmarking application bpbench. We used this benchmark to measure that, on an Intel Core i5 7300U, SmartVMI’s breakpoints take around 81 µs to handle, and keeping the breakpoint invisible costs an additional 21 µs per read access. The availability of bpbench facilitates the comparison of disparate breakpoint mechanisms and their performance optimization with immediate feedback.

1. Introduction

Code introspection methods, such as software debugging, play a critical role in analyzing and understanding program and system behavior. They enable the detection, diagnosis, and mitigation of issues, e.g., security-related problems, or facilitate execution performance measurements. Virtual Machine Introspection (VMI) encompasses techniques used to monitor, analyze, and manipulate the internal guest state of a VM from external environments such as the host system or other VMs. This is accomplished by reading and, if necessary, changing the values of the virtual CPU (vCPU) registers and data in the main memory of the monitored VM combined with its semantic interpretation. VMI as a concept was initially introduced by Garfinkel and Rosenblum in 2003 [1]. In practice, it has been used for security and forensic purposes because it enables administrators and defenders to detect and analyze malicious activities within VMs [1]. Hence, there is significant interest in applications within the fast-growing cloud computing environment [2]. VMI-based tracing mechanisms are also used for dynamic malware analysis, manually or highly automated in sandboxes [3,4].
VMI-based intrusion detection or malware analysis systems have several advantages over kernel-mode or user-mode methods that run on the same system (inside the same VM) that is to be monitored. Two important aspects include (i) isolation (sensor isolation from the analysis target) and (ii) transparency (sensor invisible for the analysis target). Virtualization ensures strong isolation between the guest software to be monitored and the sensor software. This makes it significantly more difficult for the attacker to detect and manipulate the monitoring software [5], allowing for more resilient observation. However, a key challenge for VMI applications is to bridge the semantic gap [6], i.e., accurately interpret the guest software semantics based on guest memory. Typically, this involves an in-depth understanding of OS and application data structures [7], possibly derived from debugging symbols or via complex reverse engineering efforts, particularly when facing closed-source guest software. When this key challenge is successfully addressed, VMI monitoring enables comprehensive event tracing and memory analysis, providing critical information on the behavior of the system and application.
Modern VMI solutions primarily perform inspections in response to VM events (e.g., page faults, Control Register 3 (CR3) writes, or breakpoint interrupts). Dangl et al. [8] refer to this reactive approach as active (or synchronous) VMI, while passive VMI tasks are scheduled asynchronously by the outer monitoring software. A key method of active VMI is breakpoints that will be placed by the outer analysis software at particular locations inside the guest code. Whenever such a breakpoint is triggered, the VMI software can analyze the guest state related to the intercepted execution (e.g., reading the function arguments of an invocation). Beyond placing breakpoints, more invasive manipulations of the guest state can be useful. For example, the VMI software DRAKVUF [9] uses function call injections to interact with the guest Operating System (OS) Application Programming Interfaces (APIs) to perform data transfers between the target VM and outer environments, or to invoke process starts (called process injection).
The attempt to create a first standard of a low-level VMI API as an interface between VMI applications and hypervisors with access capabilities led to the libVMI project [10]. This library focuses on accessing VM memory and vCPU registers. It can deal with the Guest Virtual Addresses (GVAs) of the guest process address spaces and is able to translate them into Guest Physical Addresses (GPAs) of the VM. In contrast to Host Physical Addresses (HPAs), GPAs are also virtual addresses from the host’s point of view, but from guest’s perspective, they are the physical addresses (of the VM). The bottom line is that libVMI enables data access addressed via both guest process-related GVAs and GPAs. To translate GVAs into GPAs, the library performs a page table walk on the tables managed by the guest OS in software, efficiently implemented with software-side caching. The existing prerequisite is that libVMI is aware of the guest OS and is able to interpret the required internal data structures of the guest OS. Unfortunately, breakpoint-handling is not covered by libVMI. Only a minimal trap interface is provided, allowing the control flow to be intercepted when a VM event occurs, e.g., page faults, CR3 writes, or breakpoint interrupts. The handling of execution breakpoints with reconstruction and re-execution of the original trapped instruction are typically implemented by the VMI application, if at all. As a result, various concepts and implementations have been developed.
Building on our work developing a VMI infrastructure for the KVM hypervisor to realize security monitoring for Windows guests, we investigate, among other things, the various breakpoint-handling mechanisms employed in different VMI applications. In this paper, we present an overview and classification of these different methods. The VMI software stack on which we focus consists of the virtualization stacks KVM/QEMU and XEN/QEMU, and the VMI applications SmartVMI and DRAKVUF. SmartVMI [11] is a VMI application software based on libVMI, which was developed in the SmartVMI research project [12] by VMI researcher D. Eikenberg (GDATA) and partners. It provides a plugin interface and guest access functionalities to implement custom VMI monitoring logic. A VMI-based guest memory YARA scanner and a guest API call tracer are available as plugins. DRAKVUF [13] is a plugin-agnostic VMI application software for monitoring guest behavior, too. It was developed by T. Lengyel with a focus on stealthiness [14]. There are a lot of plugins and libraries available, targeting different use cases of automated malware analysis used in sandbox solutions. DRAKVUF is also built on top of libVMI but currently only supports the XEN hypervisor as a virtualization back end.
In most use cases, runtime performance is critical for different reasons. For sandboxes, minimizing the overhead from VMI sensor interceptions is advantageous, because the additional cycles spent while the vCPUs are paused extend the real-world execution time without affecting the effective execution time within the VM. Longer execution times reduce the analysis throughput in Sandbox clusters, or provide angles for timing-based evasion checks [15], and should be avoided. Similarly, for VMI on endpoint VMs with user interactions, low-latency VMI interceptions are very important because applications with soft real-time requirements do not tolerate long interruptions. This is especially true for graphical user interface activities in the case of VMs operated by human users. Customers of VMI-monitored VMs expect their systems to be responsive.
For the reasons mentioned above, our research includes micro-benchmarking experiments regarding runtime performance and latencies, from which we present the first results in this paper. In summary, we make the following contributions:
  • We propose and implement a benchmark for x86_64 breakpoint approaches suitable for measuring the execution performance (timing) of VMI-based breakpoint implementations.
  • We provide preliminary results of our breakpoint benchmark workloads for the VMI-based breakpoints implemented in SmartVMI.
The rest of this paper is structured as follows: Section 2 provides a structured overview of existing breakpoint-handling approaches. Section 3 then identifies the relevant performance aspects and defines workloads to benchmark them. Initial measurements for one breakpoint implementation are presented in Section 4, before Section 5 highlights relevant existing works. Finally, Section 6 concludes the paper by summarizing and discussing the results, and giving an outlook to future work.

2. Background

This section provides an overview of existing implementations of hyper-breakpoints, including their strengths, limitations, and trade-offs in Section 2.2, followed by highlighting a possible optimization strategy to avoid false-positive breakpoint hits in Section 2.3. We focus on the x86_64 ISA and the Intel VT-x virtualization extension.

2.1. Breakpoint Basics

User-mode debugging. First, we take a look at classical software breakpoints that debuggers like GDB or WinDBG utilize to debug user-mode programs, while running the debugger as a user-mode program themselves. A debug API provided by the Operating System enables the debugger process to attach to a process to debug (debuggee). This allows the debugger to read and write in the address space and execution states of the debugging process. Given the virtual address of the instruction in the debuggee’s address space where the breakpoint should be placed, the debugger overwrites the first byte of the original instruction of the debuggee code with 0xcc, the opcode of the int3 instruction (breakpoint). When the instruction pointer reaches the breakpoint address and executes the injected breakpoint instruction, a software/exception interrupt is triggered. This causes the CPU to switch to kernel mode and execute the OS interrupt handler. The OS breakpoint-handling mechanism saves contexts, stops threads in the debugging process, and passes a breakpoint event to the attached debugger process. The debugger can inspect the memory and the register states (from saved contexts) of the paused debuggee. To continue execution, the debugger restores the original instruction and switches the thread to single-step execution mode by setting the Trap Flag (TF) in its x64 Flags Register (RFLAGS) register of the thread’s CPU context, before resuming execution of the debuggee. The restored instruction is executed, and immediately afterward, the CPU triggers a debug exception/interrupt again because of single-stepping mode. The debugger’s single-stepping handler finishes the current breakpoint handling by reinserting the int3 breakpoint instruction again, disabling the single-stepping, and resuming debuggee threads.

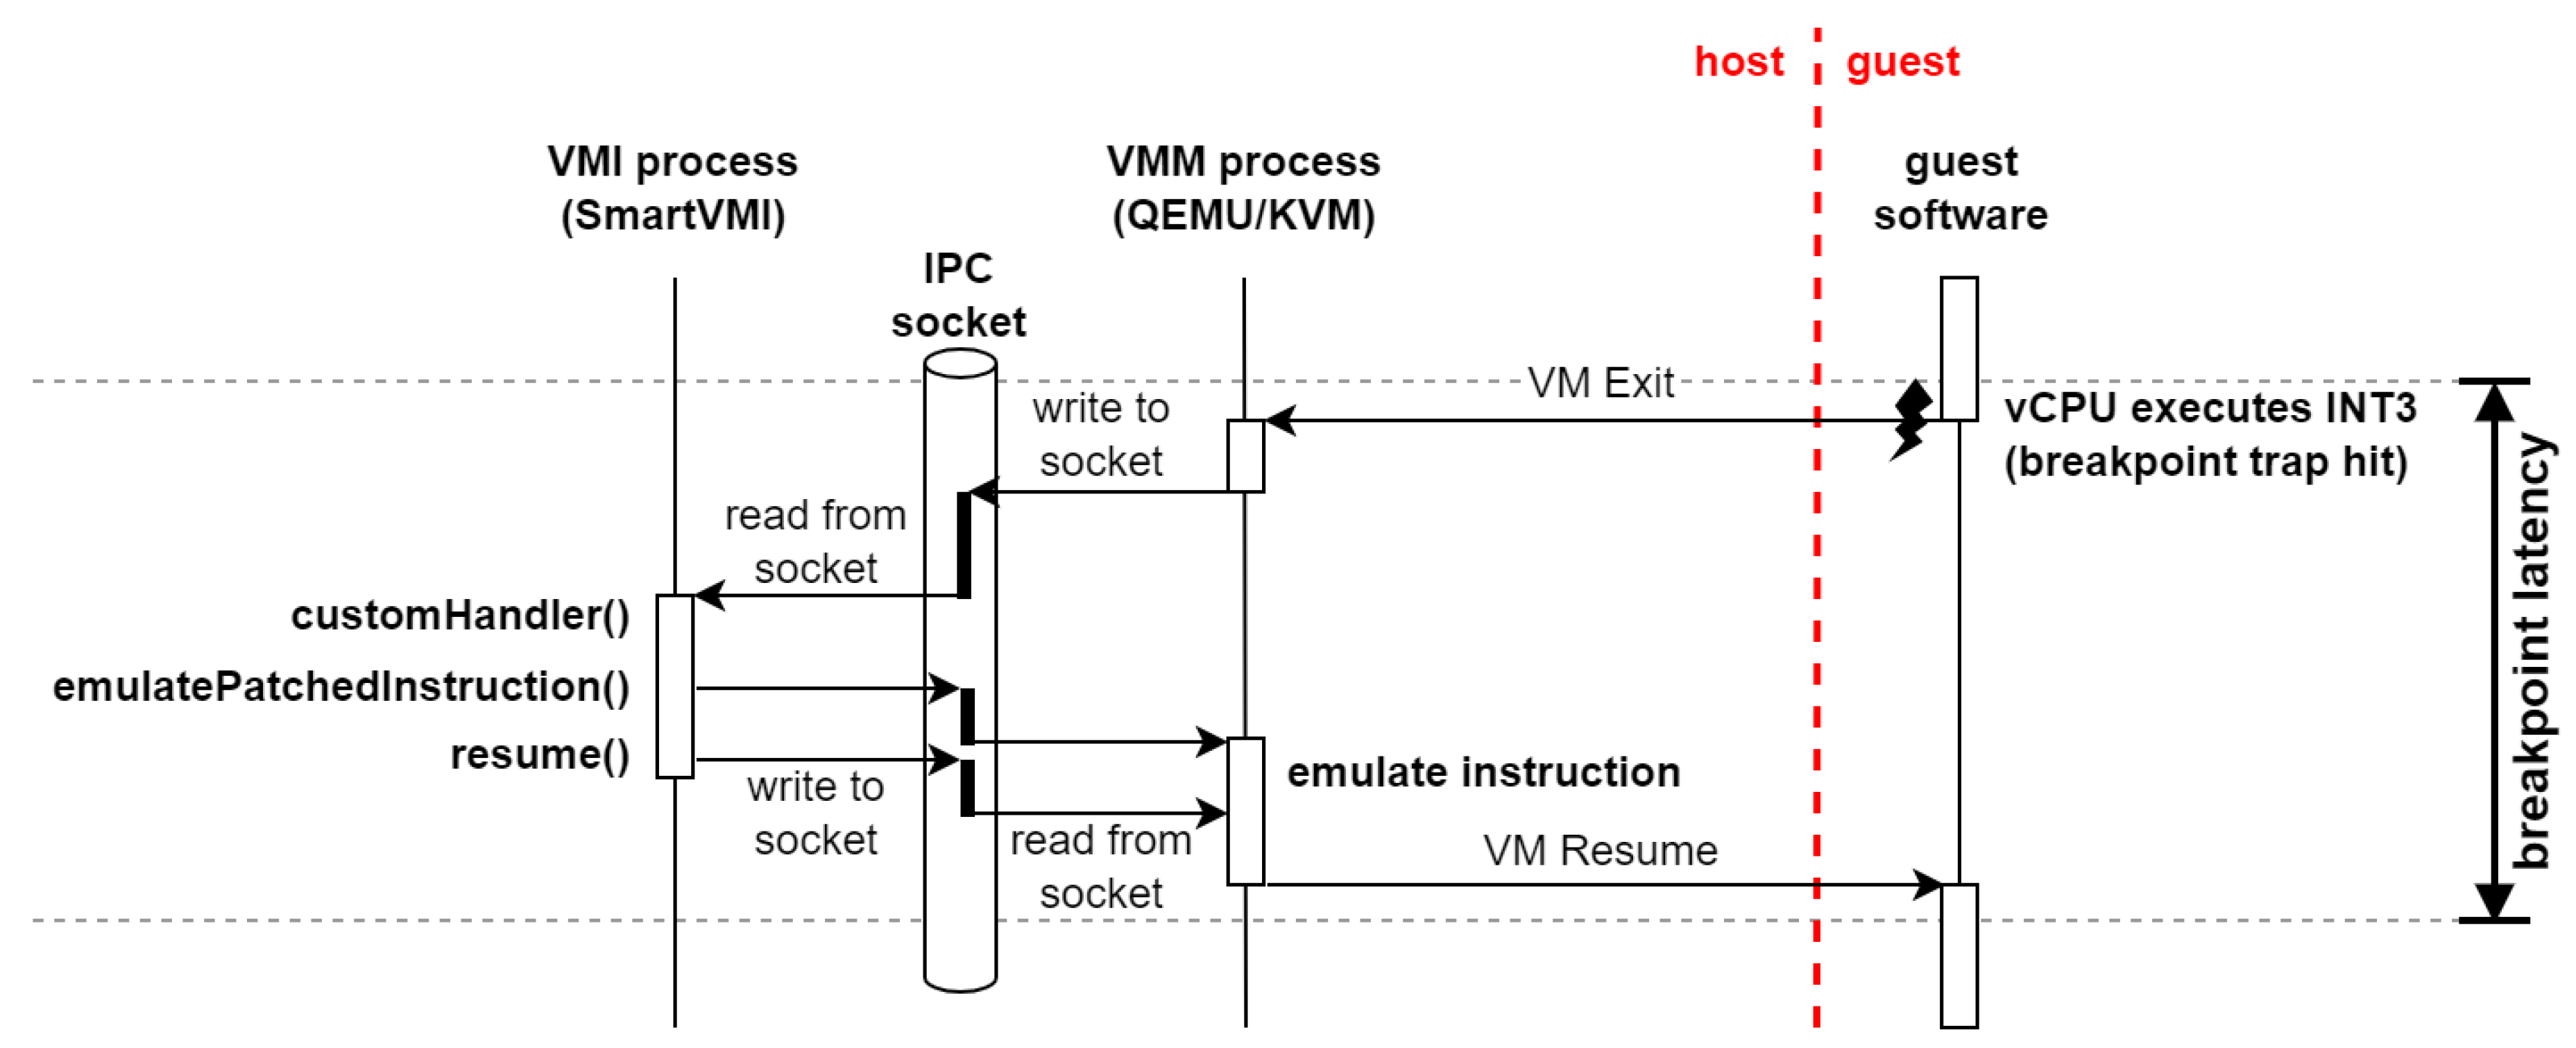
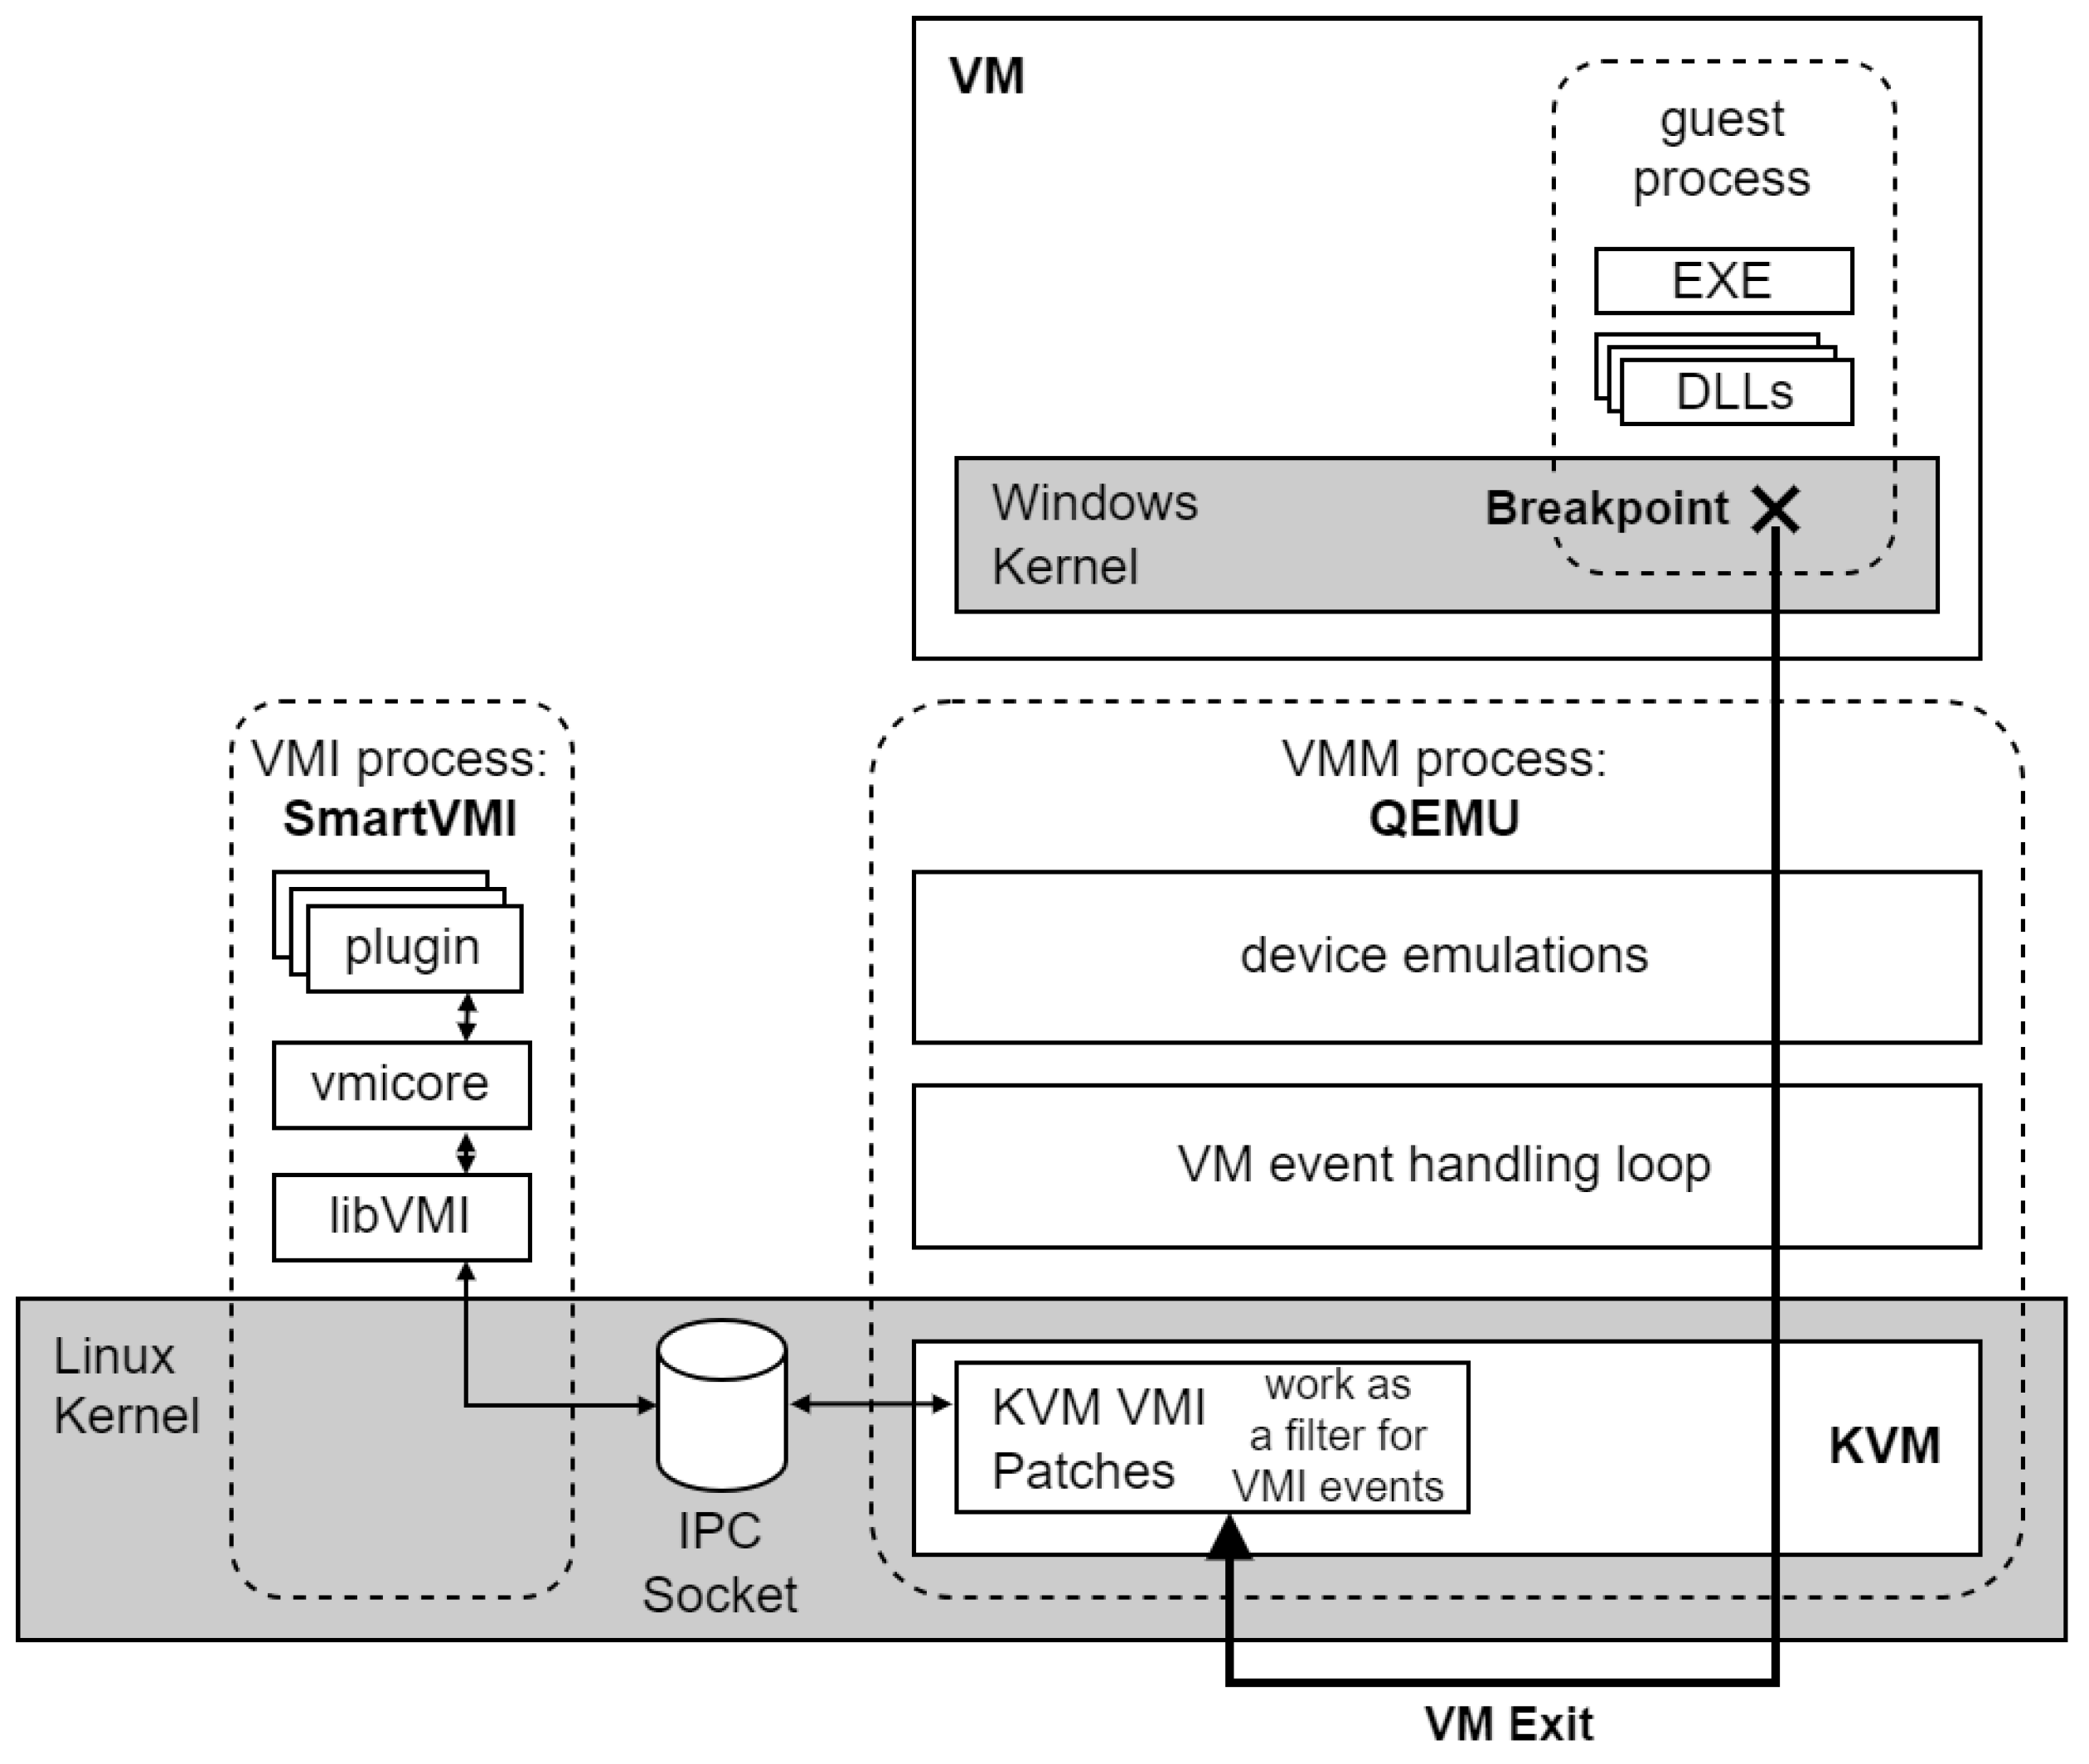
2.2. Breakpoint-Handling Approaches for VMI Debugging

Breakpoint Handling with Single-Stepping (SmartVMI). We continue by inspecting the current SmartVMI breakpoint implementation, a security-oriented VMI implementation. At its core, it is a direct adaptation of the classical software breakpoint approach, with the hypervisor and VMI application taking over the role that the debugger process previously had. Given a guest process and the virtual address (inside of a VM referred to as a GVA) where the breakpoint will be placed, it is not as straightforward to insert the breakpoint. The details are irrelevant to the discussion about breakpoint invocation performance, so we only provide a short summary. SmartVMI has to be aware of some internal data structures of the guest OS to find the process control structure (EPROCESS for Windows) in the kernel space of the guest memory with the guest physical page table base address inside. Next, SmartVMI has to perform a page table walk in the software to translate the given GVA to a GPA, which then can be referenced to write the int3 instruction byte. The described translation is implemented in libVMI used by SmartVMI in an efficient way with software-side caching. It is critical that the software interrupt caused by int3 is not handled by the guest OS’ interrupt handler inside the VM, but instead causes a VM exit and passes control to the hypervisor. This behavior is determined by the Virtual Machine Control Structure (VMCS) and must be addressed in advance by the VMI application. On breakpoint execution, the vCPU is paused, and the hypervisor sends an event with the relevant information to SmartVMI. The SmartVMI breakpoint handler instructs the hypervisor to restore the original instruction and to enable single-stepping. Instead of modifying the TF, the Monitor Trap Flag (MTF) in the VMCS is set, which is the equivalent single-stepping functionality provided by the processor’s virtualization extensions, i.e., the guest will trigger a VM exit after executing an instruction. The vCPU is resumed, executes the original instruction, and traps to the hypervisor again due to single-stepping, which sends an event to SmartVMI. The single-stepping handler reinserts the breakpoint instruction, disables the single-stepping, and resumes the vCPU. The whole process is visualized in Figure 1.
Unfortunately, there is an issue with this approach. It only works reliably for VMs with a single vCPU. In multi-vCPU environments, it generally works, but a race condition can cause missed breakpoints. When one vCPU hits a breakpoint and restores the original instruction to single-step it, other vCPUs can execute the original code without the breakpoint until the single-stepping handler has reinserted the int3 instruction. There are multiple ways to address this. The simplest solution is to halt all other vCPUs while handling a breakpoint hit. This has the additional advantage that the VMI application has the guarantee that no changes to memory can occur, which might be beneficial for scanning through memory (data consistency). However, the overhead and, therefore, the impact on VM performance are considerable.
Breakpoint Handling with Instruction Emulation. Another possibility is to eliminate the single-stepping and utilize instruction emulation instead. Emulation means that the hypervisor reads the x86 instruction bytes from guest memory and performs the instruction in software by reading source register values from the saved vCPU context (part of VMCS) and/or source guest memory locations, calculates the results, and writes them into the vCPU’s destination register and/or guest memory locations. To be exact, instruction emulation in described pure form, which would emulate the instruction currently found at the vCPU’s instruction pointer, would not help much. It would still be necessary to restore the original instruction, again enabling other vCPUs to miss the breakpoint. Instead, the emulation has to be able to accept the original byte as an additional parameter and reconstruct the instruction that should actually be emulated. With that, the int3 can remain in place, and skipping becomes impossible. Figure 2 illustrates the adapted workflow. While theoretically a simple and efficient solution, there exist warnings in the hypervisor documentation about instruction emulation being incomplete, and it might not cover all corner cases. This could lead to system instability [14]. It is important to note that malware might try to strain the instruction emulator with uncommon instructions, such as redundant or unusual combinations of instruction prefixes. A minimal example of a breakpoint handler that leverages the implementation of instruction emulation of libVMI is available (https://github.com/libvmi/libvmi/blob/8f9b010b0261dbc11e2dda5e718b0e9507109232/examples/breakpoint-emulate-example.c (accessed on 16 December 2024)).
Stealthy Breakpoints: PageGuard (SmartVMI). While the use of MTF is transparent to the guest, the same cannot be said for the inserted int3 instruction, which the VM could detect reading the address of the breakpoint. A relevant example of this is software that performs code integrity checks [16]. For example, some malware uses this in anti-analysis checks [17]. Another example is the Windows kernel that contains Kernel Patch Protection (KPP), also called PatchGuard [18], which would cause the system to bluescreen once it detects tampering of the kernel code (driver code excluded) and some important data structures (e.g., System Service Dispatch Table (SSDT)). SmartVMI solves this with a concept referred to as “PageGuard”. Modifications to the Extended Page Tables (EPTs) enable full control over access to the memory. EPT is a crucial component of memory management of hardware-assisted virtualization. While the ”normal“ guest page tables perform the translation from GVA to GPA, another Second Level Address Translation (SLAT) at the host/hypervisor level is necessary to map from GPA to System Physical Address (SPA). A read, write, or execute access to a page is only permitted when the entries of both page table sets have the corresponding permission bit set. Specifically, in the PatchGuard example, the pages storing kernel code have read and execute permission in the entries of the guest page table sets. With active “PageGuard”, the EPT entries of the page table set stores a permission for execution, and neither reading nor writing. When the PatchGuard tries to read from the page where a breakpoint has been inserted, an EPT violation is caused, resulting in a VM exit and consequentially in a memory event notifying SmartVMI. Restoring and single-stepping are not necessary in this case; instead, the hypervisor can be instructed to emulate the read access and deliver the original bytes specified by SmartVMI. Thus, before inserting breakpoints on a page, SmartVMI creates a shadow copy to be able to retrieve the correct content when memory access emulation events occur. This effectively hides the breakpoint for KPP or other integrity checks, including malware-driven checks.
altp2m—alternative guest physical page to machine translation. A different method for breakpoint handling is alternative guest physical to machine translation (altp2m) [14]. It provides multi-vCPU support and guest-invisible breakpoints. The approach does not rely on modifying the guest memory at all; instead, it fully relies on EPT permissions. Similar to how SmartVMI’s “PageGuard” traps read accesses, altp2m activates a “breakpoint” by removing the executable permission on the desired page, i.e., no breakpoint instruction is used anymore; instead, the breakpoint is only a virtual breakpoint. Virtual breakpoint means that the execution of each instruction of the page is intercepted and handled accordingly at the address where the virtual breakpoint is set. Upon execution on a page with a virtual breakpoint, this triggers an EPT violation, yielding control to the hypervisor. However, continuing execution by setting the EPT permission again, single-stepping, removing the permission, and then resuming the vCPU would lead to the same race condition problem as previously discussed with the removal of the int3 instruction. The altp2m solution uses vCPU-specific EPTs, i.e., it is possible to maintain multiple EPTs, and the hypervisor can control for each vCPU individually which EPT it uses. Thus, two EPTs are maintained. The first is missing the executable permission on pages containing virtual breakpoints and is enabled by default (when vCPUs are executing normally). When an EPT violation occurs on a vCPU, altp2m switches the vCPU’s EPT to the second one and activates single-step mode. This second one has the executable permission set, allowing the vCPU to single-step execute the original instruction. All other vCPUs still use the restricted EPT and, therefore, do not miss the virtual breakpoint. After the breakpoint-handling vCPU has single-stepped, it switches back to the first EPT, i.e., the one without executable permission for pages.
With altp2m, there is no extra care necessary to keep the breakpoints stealthy, because virtual breakpoints are invisible by design. Memory reads can happen normally as there are no modifications to the memory. The EPT and its permissions are part of the host/hypervisor environment and inaccessible to the guest software. The trade-off for having no overhead on memory accesses is that there is a significant penalty to the execution speed on pages with virtual breakpoints. A big problem is that the memory access permissions are coarse-grained: they can only be set per page (page granular). The longest valid instructions on x86_64 architecture are 15 bytes in size. Thus, on a completely filled code page, there will be a minimum of 4096 / 15 273 instructions, and in the theoretical worst case, a total of single-byte instructions, and each of them has to be handled as a breakpoint, even if one is only interested in stopping at a single one of them. Considering the likelihood that code is executed more often than read or written, this is a major drawback.
Optimized altp2m—combination with breakpoint instructions (DRAKVUF). The VMI monitoring tool DRAKVUF [13] combines the use of int3 instructions with the altp2m approach of multiple EPTs. Its breakpoint mechanism is also described in [14]. Instead of having multiple EPTs pointing to the same SPA with different permissions, DRAKVUF creates a copy of the page frame where a breakpoint should be inserted. So, we have two page frames, one with the original instruction and one with an int3 instruction at the breakpoint location. One version of the EPT remains unmodified, and can keep pointing to the original page frame with unchanged permissions. The other EPT version points to the page frame; an int3 instruction is inserted. The associated permission on this second EPT version is set to execute-only, and by default, this EPT is the active one on all vCPUs. Thus, when a vCPU’s execution is moving towards the breakpoint and executing instructions on the same page, the execute-only permission allows it to execute all other instructions, which have not been changed, completely normally. When the instruction pointer reaches the breakpoint, the inserted int3 instruction is executed, triggering the breakpoint interrupt, eventually reaching the corresponding handler in DRAKVUF’s VMI application logic. Exactly as with altp2m, a switch of the EPT provides the paused vCPU with the original instruction and execute permission, enabling it to single-step once and then switch the EPT back. Meanwhile, the other vCPUs continue using their respective EPTs and are unaffected. When the breakpoint or any other address on the same page is read (e.g., PatchGuard case), the execute-only permission causes an EPT violation, which is resolved by emulating the read access.
Table 1 summarizes the breakpoint approaches covered in this work.

2.3. Breakpoint Invocation Optimization

There are scenarios where a breakpoint may frequently trigger VM exits that are unrelated to meaningful breakpoint hits, a phenomenon we refer to as false-positive breakpoint hit. Consider the example of detecting file openings of a specific process by setting a breakpoint in the CreateFile function of Windows’ API library kernel32.dll inside the process virtual address space. Such DLLs are shared libraries; to optimize memory utilization, the code of shared libraries exists only once in (guest) physical memory, which is mapped into all the (guest) virtual address spaces. Consequently, inserting a breakpoint instruction inside the (guest) physical page frame (inevitably) enables the breakpoint for all processes. In the given example, kernel32.dll is linked to almost all processes running on a Windows system, and since CreateFile is a frequently invoked API function, this setup has two drawbacks. First, it may lead to breakpoint hits in processes that are outside the scope of the analysis and irrelevant to monitoring. Second, if we use a breakpoint mechanism where every execution in the page with a breakpoint leads to a VM exit, code adjacent to the breakpoint in CreateFile within the same page, even if unrelated to CreateFile, also triggers a VM exit and the breakpoint inspection routine. Both drawbacks are likely to contribute to performance degradation.
In a single-vCPU scenario, only a single process can be actively executing. When the target process is not the active process, the breakpoint can be removed. When the target process is scheduled, the breakpoint has to be activated. SmartVMI implements exactly this. Each process has its individual virtual address space, which is realized by a process-specific page table set. Before a process gets scheduled, the kernel has to instruct the Memory Management Unit (MMU) to use the correct page table set. As what we call “page table set” actually is a four-layer-deep tree of page tables, the MMU of a specific CPU core that executes the thread of the process is informed by writing the (guest) physical address of the root/base page table (called Page Map Level 4 (PML4)) to the CR3 register when the thread is dispatched. SmartVMI instructs the hypervisor to configure VM exit on the CR3 register, which writes and provides an event that informs of the occurrence and the value that is being written. Then, the assigned handler for this event can iterate all process-specific breakpoints and check whether they need to be active for the new process (identified by its CR3 value). All breakpoints that are detected to have to change status can now be enabled or disabled. Finally, the hypervisor can be instructed to let the vCPU resume its execution.
When multiple vCPUs exist, the new CR3 value is not enough to determine whether a breakpoint should be active; the associated CR3 value additionally has to be checked against the active CR3 value of the other vCPUs. This avoids having a breakpoint disabled when it should be active, but it is impossible to avoid false-positive hits in this case. If the target process runs on one vCPU and another process using the same shared library runs on another, the breakpoint has to be active and can be hit by the wrong process.
DRAKVUF’s altp2m method is advantageous because irrelevant breakpoints can be avoided without having to remove int3 instructions from physical memory. DRAKVUF tracks address space/process switches by intercepting CR3 register writes like SmartVMI but switches only the EPT view instead of changing the code. If a vCPU is switched to one of the target processes, DRAKVUF changes the EPT for this vCPU to the version that refers to the manipulated page frames with breakpoint instructions. For other irrelevant processes, the unchanged EPT version that refers to the original page frames is used [9,14].

3. Benchmarking Design

While Section 2 explained the details of the different breakpoint-handling approaches, it also included observations on how certain aspects might impact the performance of some operations. The goal of this work is explicitly not to define a representative workload, which measures all aspects of breakpoint overhead in a realistic scenario. Instead, we want to be able to quantify the hyper-breakpoint overhead in the relevant aspects and be able to compare completely different approaches as well as evaluate the effectiveness of smaller optimizations within the same approach. We want to be able to answer questions like the following:
  • Is it faster to use instruction emulation or perform EPT switches and single-stepping?
  • How expensive is it to handle reads with EPT violations and read emulations?
  • What is the performance penalty for the whole system when a VM exit happens on every context switch to manage breakpoint statuses?
We aim to measure the individual causes of overhead in isolation using specifically targeted micro-benchmarks.

3.1. Workloads

We identify the following specialized workloads that concentrate on a single detail of breakpoint implementation, and, when their results are put together, can provide a full overview of the overhead a breakpoint implementation causes.
  • WL1: Breakpoint execution. This workload is supposed to measure how long it takes the VMI infrastructure to handle a breakpoint. There are a multitude of factors that comprise this latency: VM exits, processing in the hypervisor, communication between the hypervisor and VMI application, processing in the VMI application, and VM entries.
  • WL2: Breakpoint execution + additional instructions. Most of the approaches introduced do not add latency to the execution of an instruction where no breakpoint is placed. However, altp2m effectively also breakpoints all other instructions that are on the same page as the target instruction. The previous workload does not reflect that, so this one is supposed to measure the latency of executing the breakpoint as well as additional instructions that are located on the same page.
  • WL3: Reading the breakpoint. Using EPT permissions to control read accesses to breakpoint locations causes overhead for similar reasons to the breakpoint executions. This workload is designed to quantify this latency by reading from the exact memory location where a breakpoint is placed.
  • WL4: Reading a page with breakpoint. EPT read control has page-granularity, so all mentioned approaches behave the same independently of whether exactly the breakpoint or any address on the same page has been read. Thus, the results should show the same trend as the previous workload. The purpose of this approach is mainly to mimic the behavior of Microsoft’s PatchGuard.
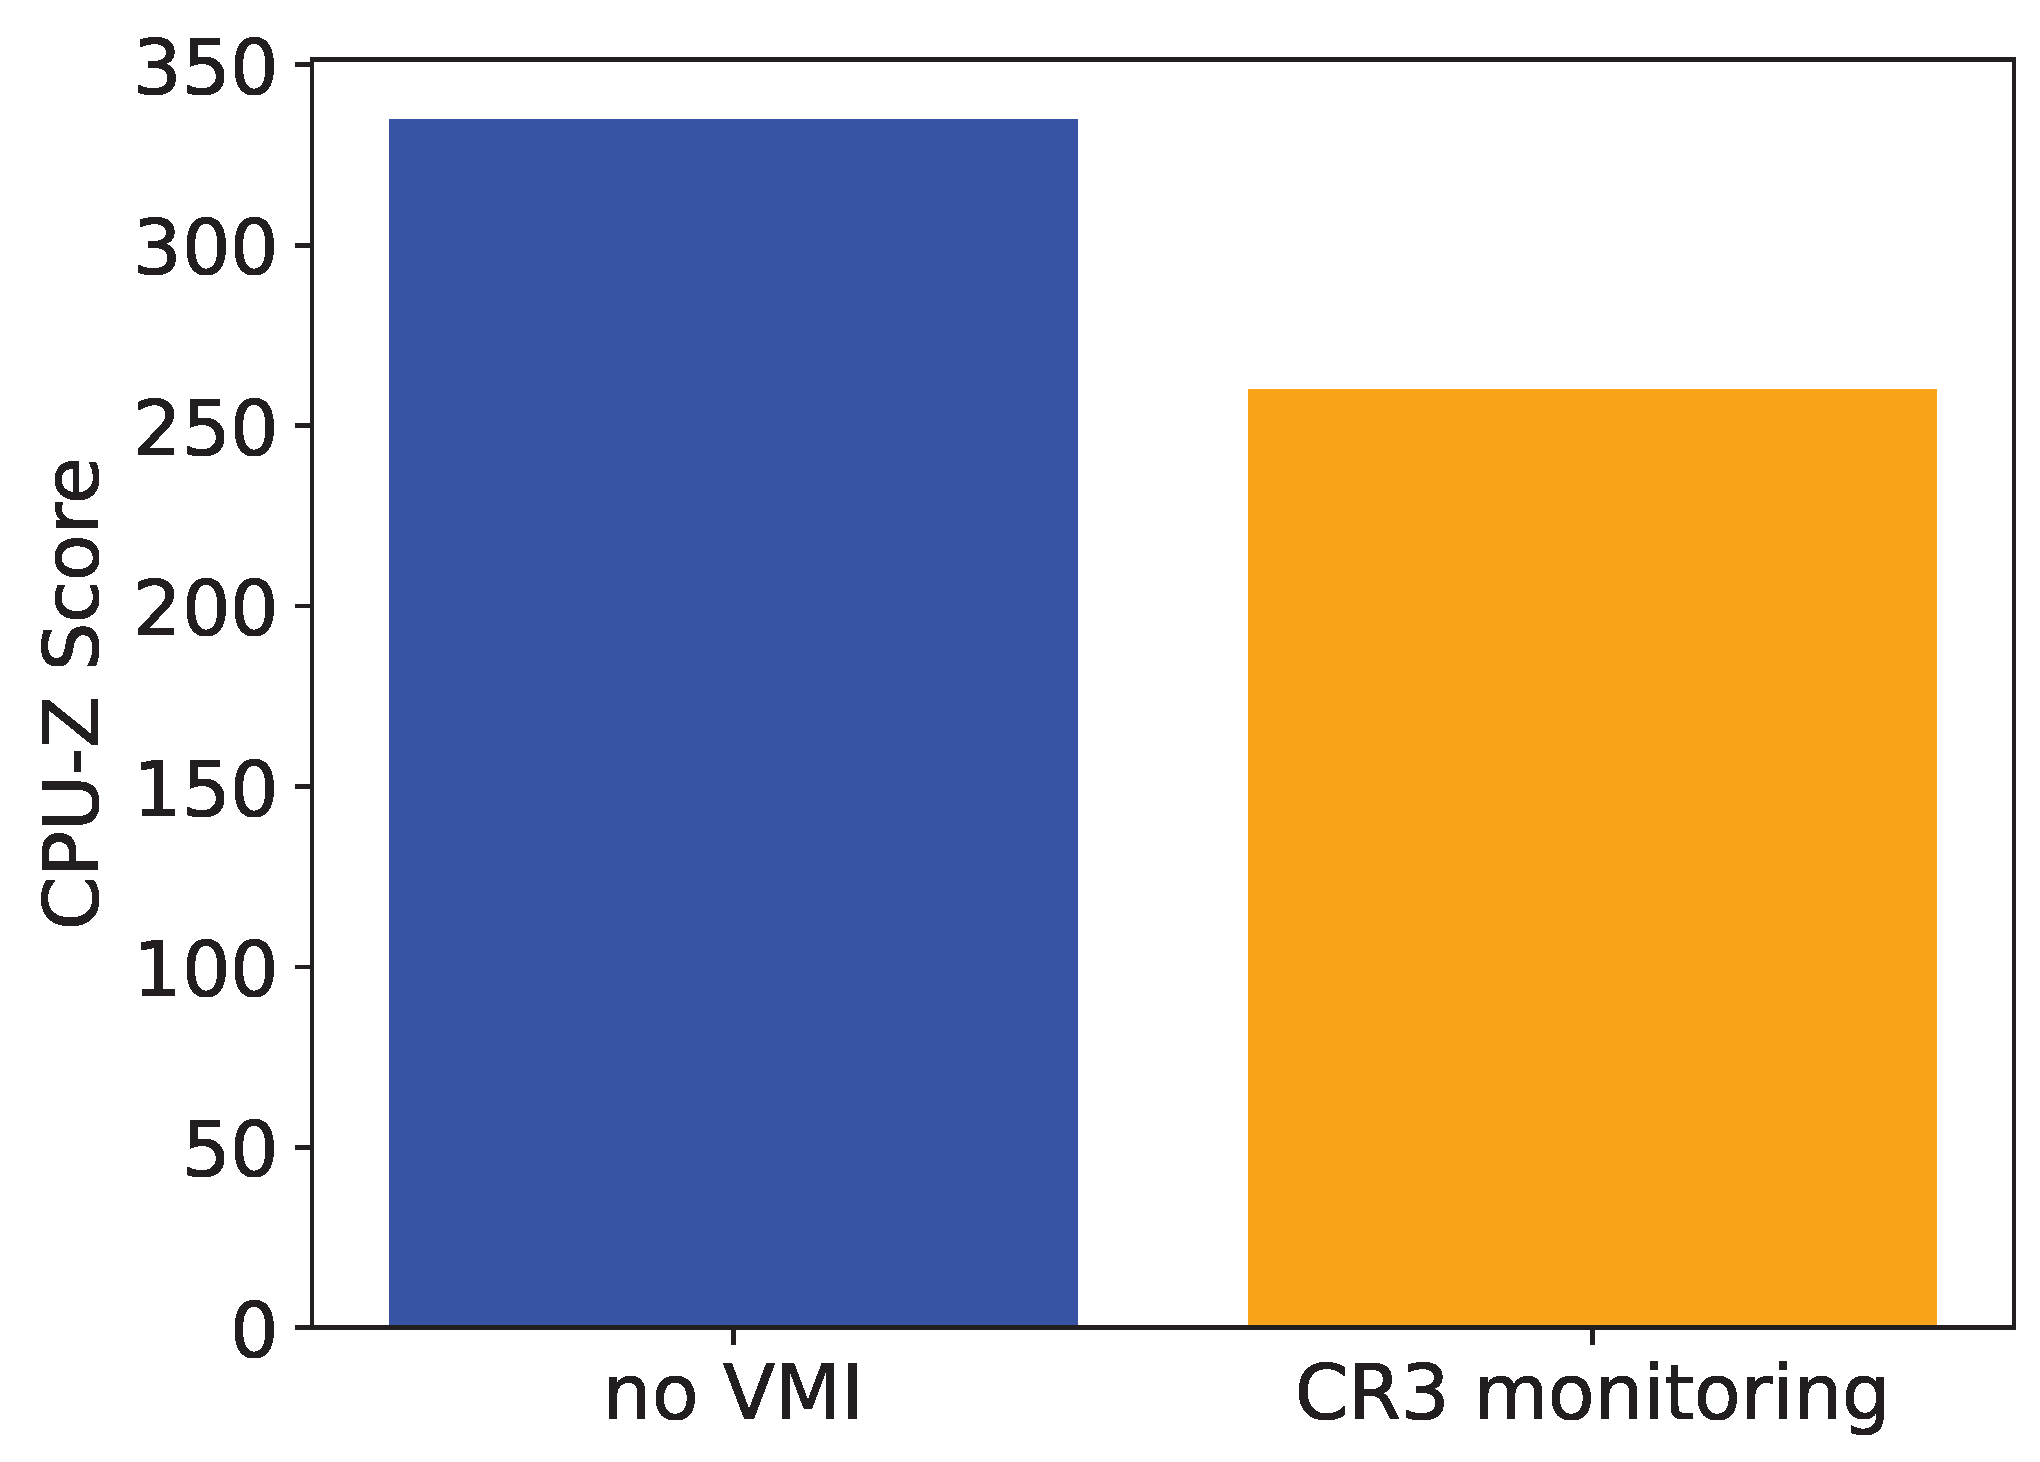
  • WL5: CPU workload with and without CR3 monitoring. The final workload is not concerned with breakpoints themselves. To implement process-specific breakpoints, context switches have to be detected and handled by intercepting at every CR3 register write. Given a CPU performance benchmark, it should be run with and without VMI monitoring CR3 writes. The difference in performance is the minimal cost of processing context switches with VMI. It is important to note that the chosen benchmark most likely has an impact on the measurable overhead. Performing only calculations will not cause any additional context switches, while repeatedly invoking system calls, e.g., to write to a file, inevitably triggers context switches.

3.2. Implementation Considerations

All workloads have in common that they want to measure the overhead of VMI activities. They also have in common that there can be vastly different implementations of the same tasks. Breakpoint handling might use single-stepping or instruction emulation. The hypervisor might be KVM or Xen. All of those details are transparent to the VMs that are being inspected. Thus, we chose to measure the VMI performance penalties from inside a VM, enabling comparisons of any VMI setup and breakpoint implementation. On the flip side, this makes it impossible to quantify overheads with a finer granularity (e.g., how long did a VM exit take, how long did an instruction emulation take).
While there are some smaller differences between realizing the benchmark in the kernel compared to a user process, there are also differing implementation details depending on the guest Operating System. Considering the use cases of malware analysis and intrusion detection, as well as the prevalence of malware targeting Windows systems, we choose to run the benchmark workloads as user-mode processes on Windows.
The five workloads are not well suited to be realized in the same benchmarking application, because the first four require the existence of a breakpoint to measure execution or read access of it, while WL5 does not require breakpoints but the presence of VMI CR3 write monitoring. Furthermore, the CR3-overheard workload only requires the measurement of system performance, which many already existing benchmarking applications already support. For now, we decided to use the CPU-Z (https://www.cpuid.com/softwares/cpu-z.html, accessed on 12 December 2024) benchmark as a reference for system performance. To measure the latency of breakpoint executions and read accesses, we present bpbench in the following subsection.

3.3. The Bpbench Benchmarking Application

The concept of bpbench is to have a designated memory location on which the VMI application under test places a breakpoint, which bpbench can then execute and read while measuring execution times.
It is not suitable to have this designated location in the code segment of the program. We have no control at which page offset the breakpoint has to be placed, which is problematic for WL2, where other instructions on the same page should be executed. Every change in the code, compiler, and compiler flags can impact the layout. To avoid such complications, we take full control of the page containing the breakpoint.
When bpbench starts up, it allocates one page of memory at a fixed address. While not strictly necessary, this makes it easier for the VMI application to know where to insert the breakpoint. We initialize the first 4095 bytes with the value 0x90, which represents the NOP instruction (“no operation”). The 4096th byte is assigned to 0xc3, the RET instruction (“return”). Once this page is set up, the application pauses and waits for user input, which should only be provided once the VMI application has inserted a breakpoint at the end of the page, on the RET instruction. Then, the benchmark workloads can be executed.
To measure the latency of a single breakpoint hit, bpbench initially takes a time stamp using Windows’ QueryPerformanceCounter function. Then, it performs a call to the end of the allocated page, directly to the breakpoint. The breakpoint is hit and processed, which causes the latency that we aspire to measure. Because the original instruction was the RET, after the breakpoint handling, the control leaves the allocated page, and continues in the timing function. A second time stamp is taken, and the total execution time can be calculated as the difference of the second and first time stamp. We refer to this workload as “exec bp”.
It is important to note that we measure not only the latency of the breakpoint hit, but additionally the execution time of a CALL instruction and potentially the time it takes to retrieve the time stamps. These are constant overheads that apply equally to all measurements, so while the real breakpoint latency is a bit lower than measured, comparing the latencies of different breakpoint implementations is not affected. Furthermore, the call instruction is cheap, especially compared to, e.g., the execution time of a VM exit. The time stamp taking might add considerable overhead. We revisit this topic in more detail at the end of the section.
Timing the execution of the breakpoint and of other, non-breakpoint instructions on the same page is performed by taking a time stamp, calling the starting of the page, executing 4095 NOPs, hitting the breakpoint, returning, taking another time stamp, and calculating the total time (bpbench workload name: “exec page”). For the read access workloads, bpbench performs the same time stamp taking but replaces calling to the page with reading from the page. WL3 is realized by reading only the last byte of the page, where the breakpoint is (“read bp”). WL4 is realized by reading the whole page, accessing 8 bytes with each access ( 4096 8 = 512 reads). We designate this workload as “read page”.
Finally, we come back to the overhead induced by acquiring the time stamps. Usually, this is a fast operation, requiring a fast read from the Time Stamp Counter (TSC) register that counts the cycles of the CPU since boot, followed by a few calculations. However, depending on the hypervisor, reading the TSC register will take considerably longer if this access is emulated. We determine this overhead by taking two time stamps in succession without any workload in between. Subtracting the result from the measurement results of the workloads, it is possible to estimate the pure latency of breakpoint executions and reads with high accuracy. We refer to this reference workload, which is not mentioned in Section 3.1 because it is bpbench-implementation-specific, as “timer”.
As a quick reference, an overview of all bpbench workloads, together with which workload from Section 3.1 they realize, is presented in Table 2.

4. Initial Measurement Results

As SmartVMI’s breakpoint implementation is the only one we currently have available, this section does not provide a full-fledged comparison of breakpoint handlers. After documenting the testbed setup in Section 4.1, Section 4.2 presents our execute and read benchmark results for SmartVMI’s breakpoints, and compares it to the baseline performance where no breakpoints are present. The overhead SmartVMI induces with monitoring CR3 write events is quantified using CPU-Z in Section 4.3.

4.1. VMI Setup

Figure 3 gives a detailed overview of the VMI setup that we used to benchmark with bpbench. The host system runs NixOS with a Linux kernel that has a patchset applied that adds VMI functionality to KVM. KVM works together with QEMU to host the Windows VM that runs bpbench. QEMU is also patched in order to provide an Inter-Process Communication (IPC) socket, which VMI applications can connect to. We use SmartVMI, which builds upon libVMI, which is a library providing an API for VMI operations. This way, the same VMI application can control the libVMI-supported hypervisors (Xen and KVM). SmartVMI contains OS-specific code, e.g., to determine the currently active processes by reading through a VM’s memory. It supports the loading of plugins, which, among other things, can register callbacks for process start and termination events, scan through memory, and register breakpoints. Currently, its breakpoint mechanism is not multicore-safe (https://github.com/GDATASoftwareAG/smartvmi/issues/140#issuecomment-2497314087, accessed on 22 December 2024), so the Windows VM was configured to use a single vCPU only.
The whole system is running on an Intel NUC 7. All the specifications are listed in Table 3.
The KVM version with VMI patch v7 can be found here (https://github.com/KVM-VMI/kvm/tree/kvmi-v7, accessed on 22 December 2024); the associated QEMU is available here (https://github.com/KVM-VMI/qemu/tree/kvmi-v7, accessed on 22 December 2024). The SmartVMI project can be found here (https://github.com/GDATASoftwareAG/smartvmi/, accessed on 22 December 2024). We had to make slight adaptations to the code and published the two versions used for the following measurement results. The first (https://github.com/lbeierlieb/smartvmi/tree/97b180438fde2a43bbedb0850aef7092156b19cc, accessed on 22 December 2024) was used for the execute and read workloads; the second (https://github.com/lbeierlieb/smartvmi/tree/670cf15ee6f073def77bb410f22663829b15c5cb, accessed on 22 December 2024) was used together with CPU-Z 2.13.0 (https://www.cpuid.com/downloads/cpu-z/cpu-z_2.13-en.zip, accessed on 22 December 2024) to measure CR3 monitoring overhead. The version of bpbench used in this paper is available here (https://github.com/lbeierlieb/bpbench/tree/98f6120adc1661301a4c3b3bd6bd9d6572494fdb, accessed on 22 December 2024). It contains a nix flake that can reproducibly generate an ISO file with the bpbench and CPU-Z executable for easy insertion into a VM.
The next subsections present the measurement results. All of the raw data, plotting scripts, and plots can be found here (https://github.com/lbeierlieb/bpbench_results/tree/758d6f1ed9548529038c681729d66378b5e84753, accessed on 22 December 2024).

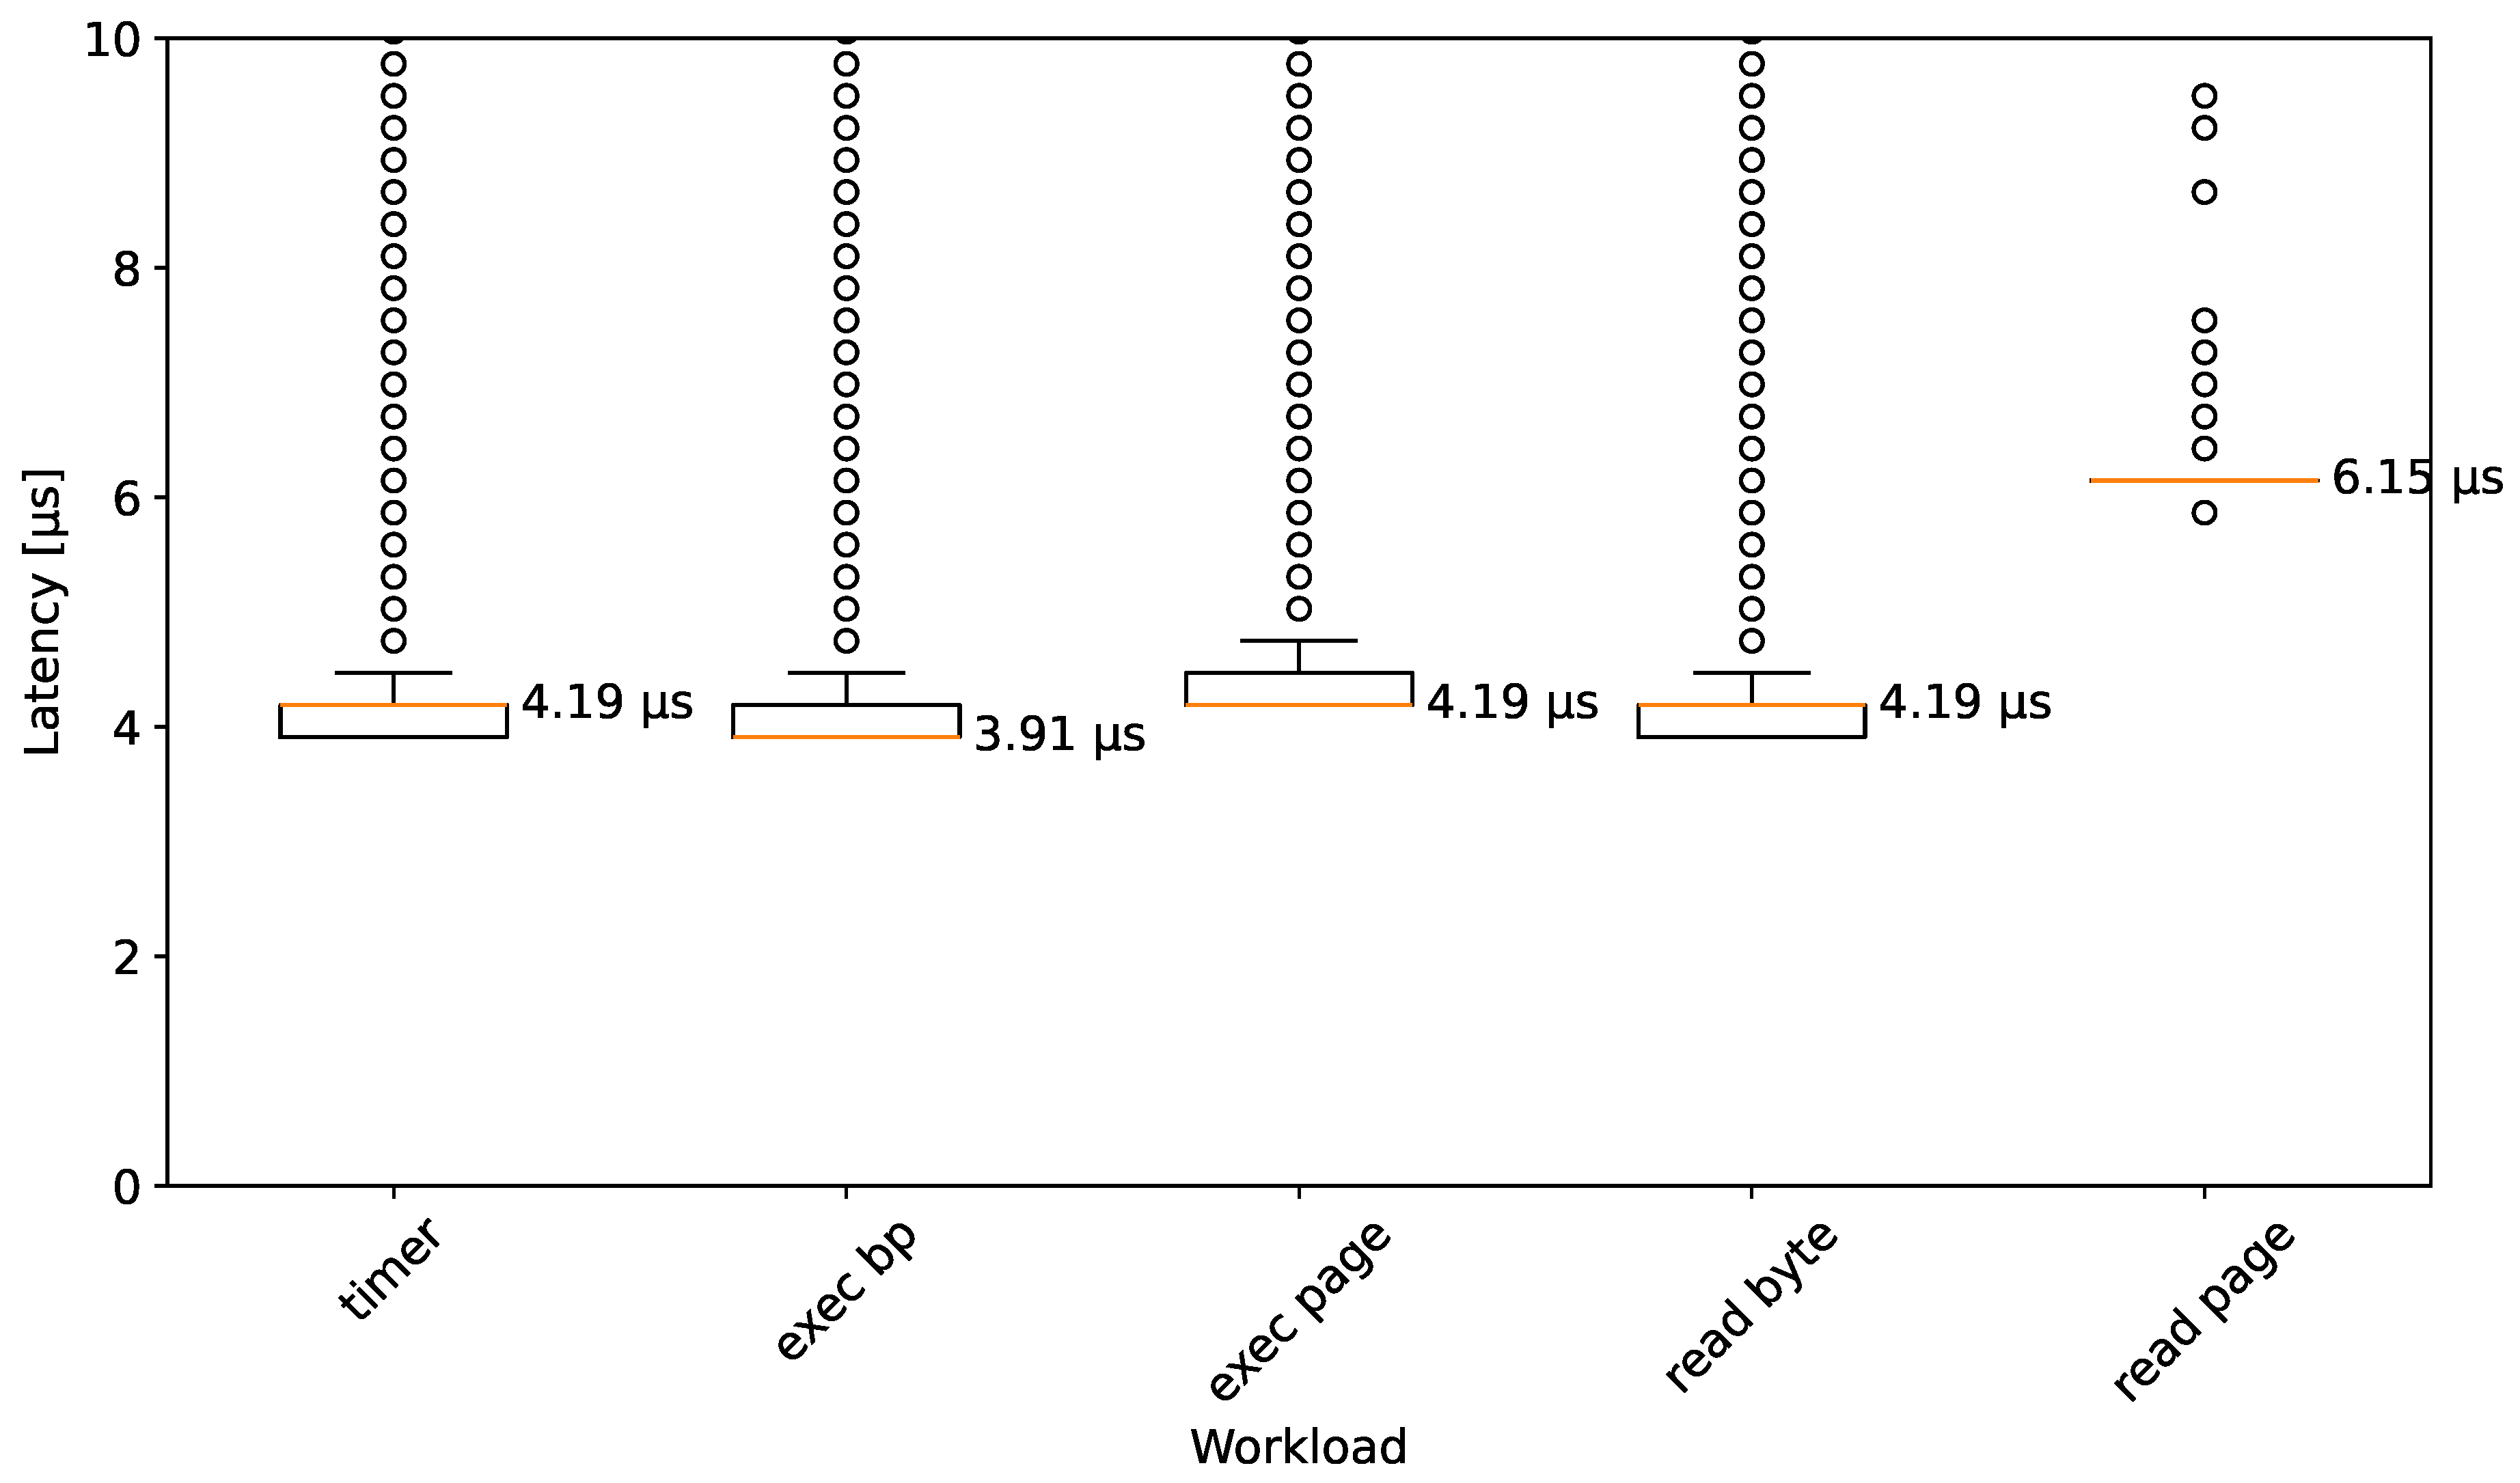
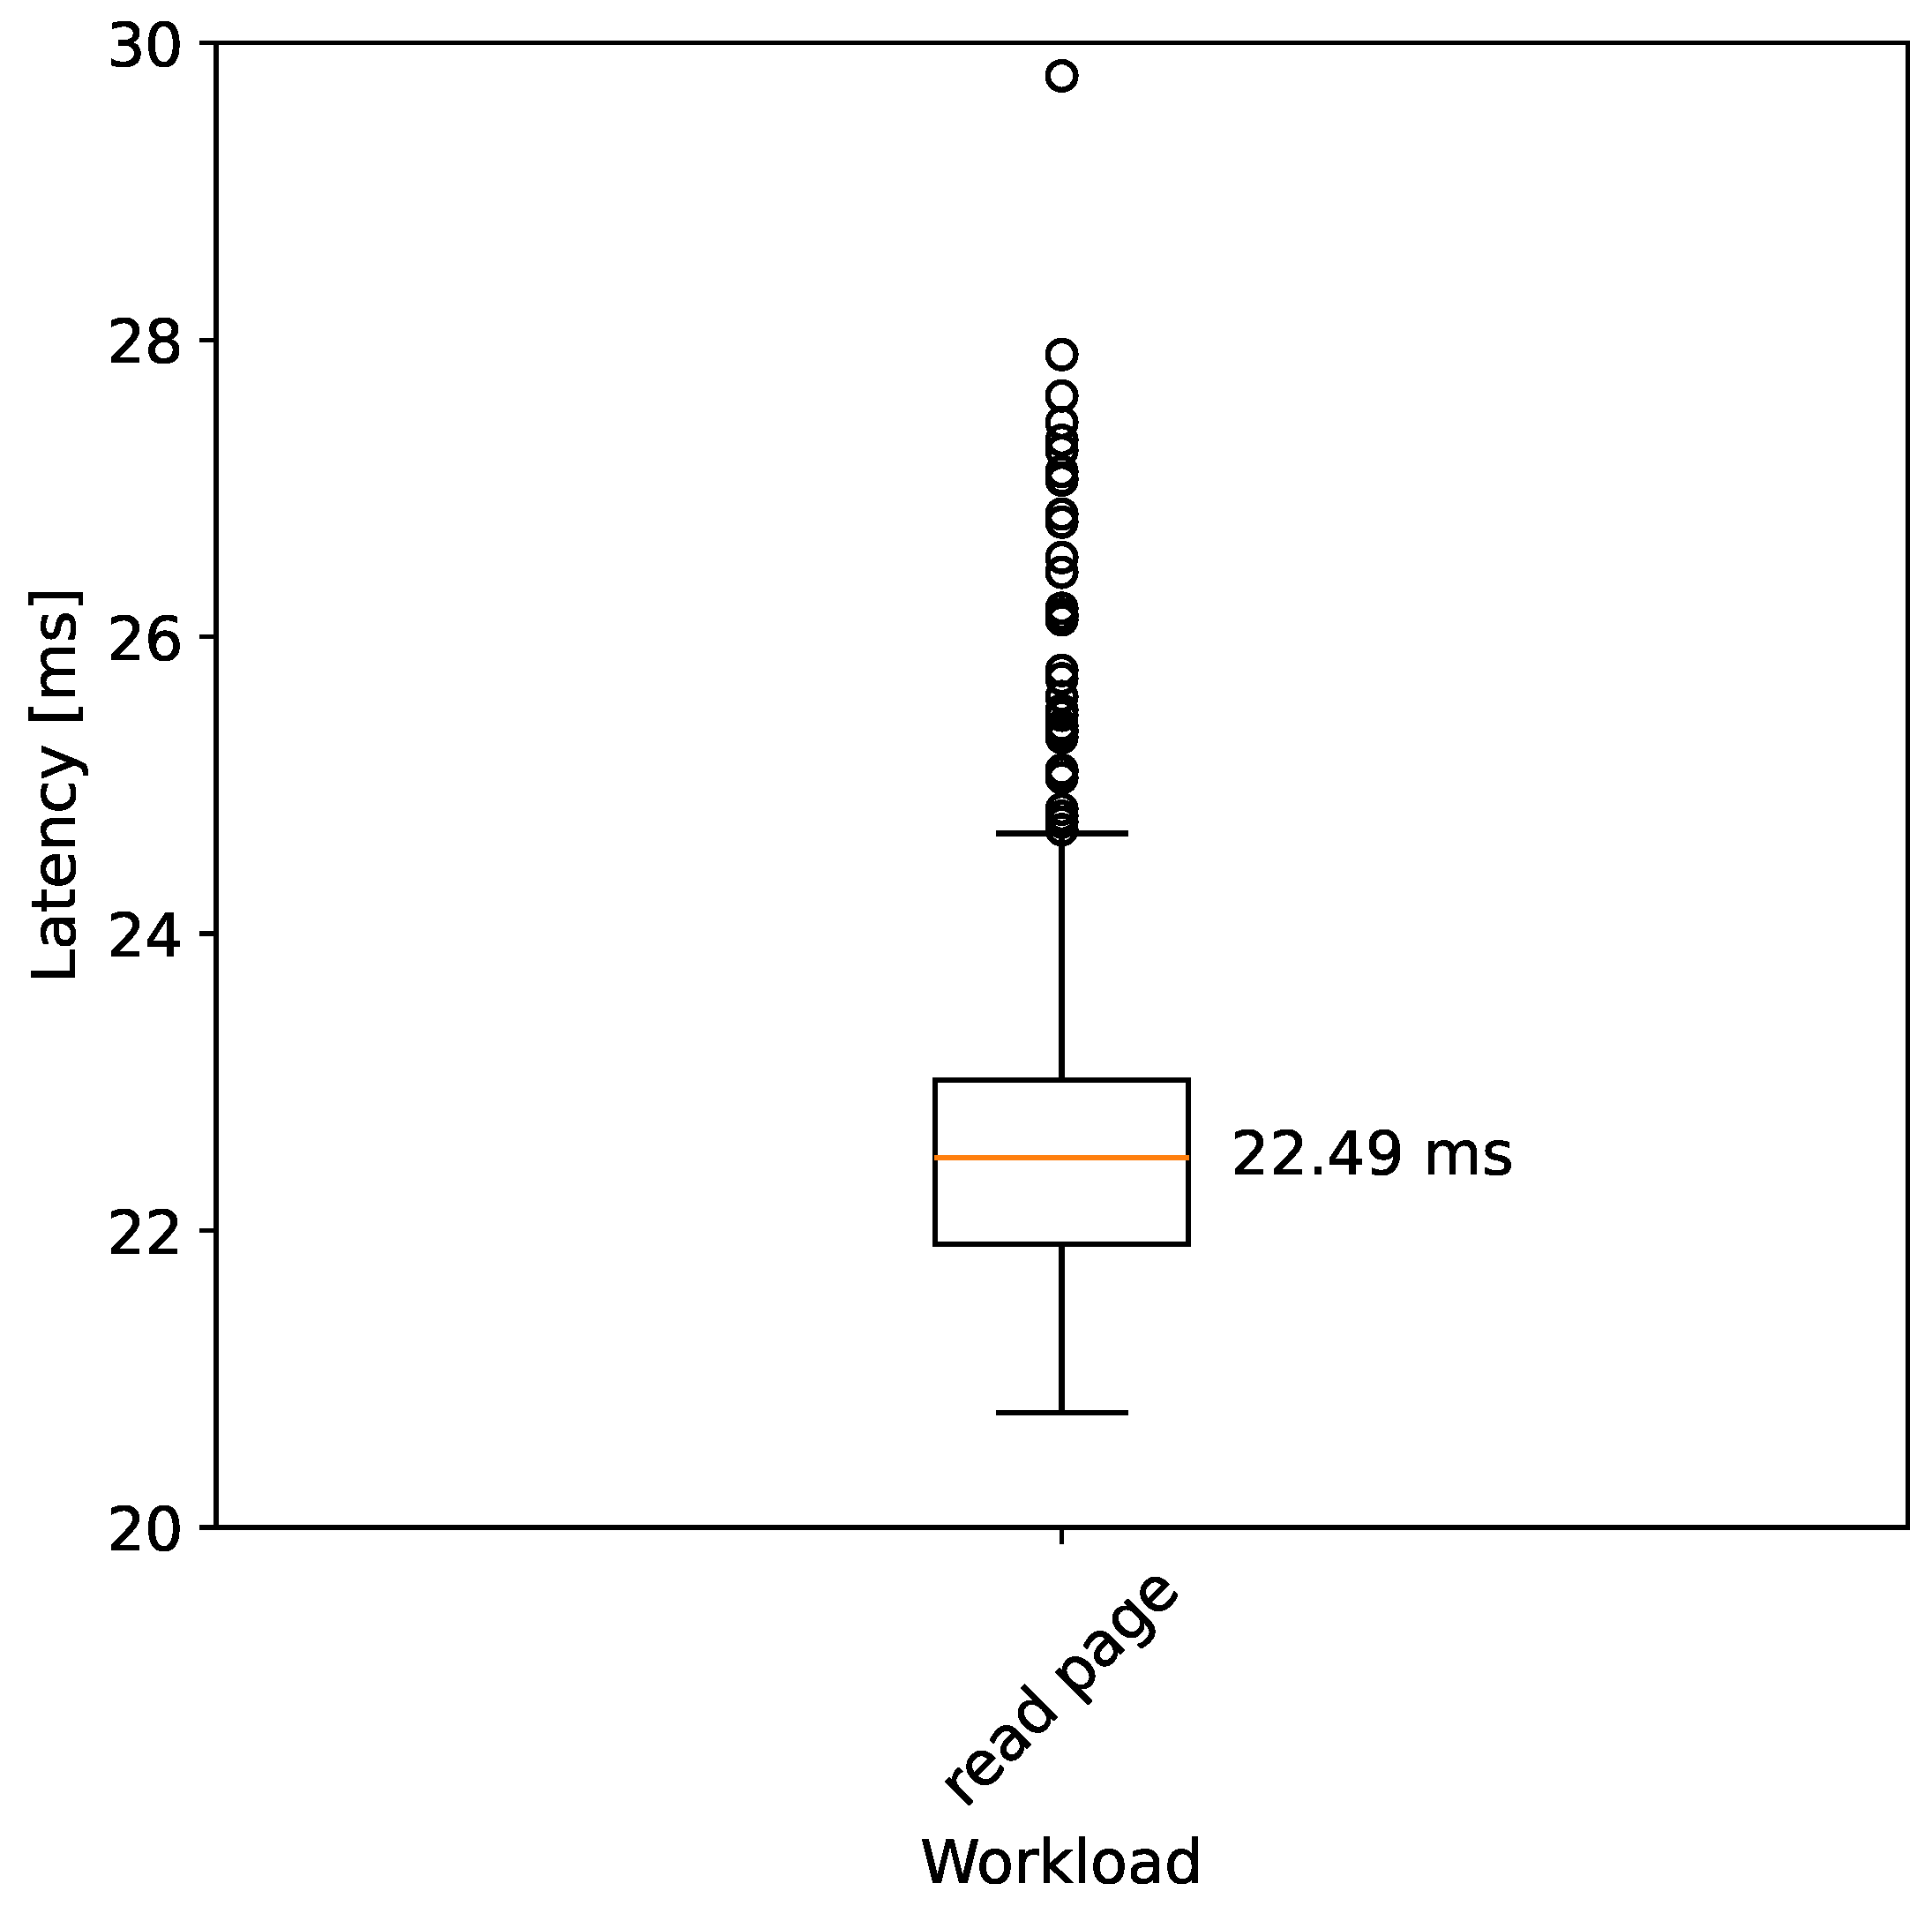
4.2. Breakpoint Execution and Reading

This subsection presents the measurements performed with bpbench, i.e., executing and reading the breakpoint. An overview of the five bpbench workloads and what they consist of is available in Table 2.
Before we look at any measurements, especially of very short durations, it is important to clarify the resolution of the utilized timer. bpbench queries the frequency of the timer used by QueryPerformanceCounter and provides it to the user. In the VM in our setup, the frequency is around 3.58 MHz (3,579,545 Hz), which results in a timer resolution of 279.37 ns. When measured durations are around the same order of magnitude as the timer resolution, the discrete steps become clearly visible. Figure 4 shows the results of running bpbench without an inserted breakpoint and the previously mentioned fact is clearly visible.
The figure shows a box-plot of the measured latencies. The bounds of the box show the InterQuartile Range (IQR), which encloses the middle 50% of the data. The orange line inside the box represents the median, whose value is also noted right of the line. The “whiskers” extend from the box to the smallest and largest values within 1.5 times the IQR. Any values outside of this range are considered outliers and plotted individually. In all the shown box-plots, there are more outliers that are not shown because they are many orders of magnitudes larger, and result from interrupts or context switches pausing bpbench’s execution. However, all measurements were used to calculate the IQR and median; the large outliers are just not rendered in the plot.
Looking at the actual measurements, it makes sense to start with the results for the timer. These represent the time passed between taking two time stamps as fast as possible. The majority of data points are either 3911 ns or 4190 ns, which represent 14 and 15 timer ticks, respectively. This is a fairly long time for accessing the timer and indicates that the access is emulated by the hypervisor. Also, this measurement establishes that around 4 µs is the overhead induced by accessing the time stamps, and it can be used as a correction offset to calculate the actual latencies of other workloads. Note that none of the plots have this correction applied and always show the actual measured durations.
The workload “exec bp” without breakpoint measures the execution time of one CALL and one RET instruction, which, assuming the necessary memory is cached, can be executed in a few CPU clock cycles, i.e., a few nanoseconds. Accordingly, the plot is nearly identical; the lower median value can again be explained by the resolution of the timer and the duration of the timer access, which induce randomness whether 14 or 15 clock ticks are measured between two timer accesses. “exec page” has 4095 additional NOPs to execute, which are slightly noticeable in the majority of times showing 15 or 16 clock ticks. “read byte” reads only a single byte between the timer accesses; thus, its plotted box looks identical to “timer” and “exec bp”. Finally, “read page” measures the time to read 8 bytes from the breakpoint page 512 times. The majority of times, this happens in 22 timer ticks (6146 ns). Subtracting the timer offset, this equates to around 2 µs for 512 reads or around 4 ns per read.
We established that around 4 µs can be assumed as timer overhead, the “read page” page workload takes around 2 µs on its own, and the other workloads are basically negligible, especially considering the timer resolution.
Figure 5 and Figure 6 present the bpbench measurements when SmartVMI has inserted a breakpoint at the designated memory address. The reference “timer” workload is unaffected by the breakpoint. Our main motivation to implement bpbench was to determine the execution times for the “exec bp” workload: to finally quantify how expensive SmartVMI’s breakpoints are. Now, the answer is available: subtracting timer overhead, a breakpoint hit takes around 81 µs on our Intel NUC test system. As expected, the results are not much different for “exec page”, as the breakpoint does not cause extra penalties on the NOP instructions. For reading the byte at the breakpoint, the measurements show that it is significantly cheaper than executing the breakpoint, clocking in at around 21 µs. This aligns with the fact that the breakpoint handling requires two VM exits and multiple communications between SmartVMI and KVM, whereas the read causes only a single VM exit and a read emulation. However, performing 512 accesses to read a whole page, with each access causing a VM exit and requiring an emulation, the whole workload takes a median duration of around 22.5 ms. Assuming single-byte reads take the same amount of time as 8-byte reads, we can estimate 512 * 21 μ s 10.8 ms. A plausible explanation for the gap between the theoretical duration and the measured median is that in the at least 10 ms execution time the workloads require, there is a considerable likelihood for interrupts and scheduling of other processes to take up CPU time and temporarily prevent progress in the page read.

4.3. CR3 Write Monitoring

We ran the CPU benchmark of CPU-Z once without VMI active to retrieve the reference score, which the single vCPU is able to achieve. The score amounted to 334.7 points. Then, SmartVMI was activated. It did not place any breakpoints, but enabled KVM to inform it on every CR3 write. The registered callback function was empty; no additional code was executed. Running the CPU-Z benchmark under these conditions, the achieved score reduced to 259.9 points. This amounts to a performance reduction of 22.4%. The results are also displayed in Figure 7.

5. Related Work

A “goto reference” for breakpoint performance is the paper “Efficient Data Breakpoints” by Robert Wahbe [19]. It explores methods for implementing data breakpoints, which trigger actions when specific data changes occur during program execution. While specialized hardware provides fast performance, it is costly and limited in scalability. Virtual memory-based methods, using write protection and fault handling, are portable but incur high overhead. Software approaches, particularly code patching, which embeds checks directly in program code, offer a balance of efficiency, portability, and flexibility, handling unlimited breakpoints. Simulation experiments showed code patching as the most practical solution, with acceptable performance and versatility, making it ideal for complex debugging tasks without requiring specialized hardware.
The authors expanded on their work in [20]. It addresses the inefficiency of traditional data breakpoints by proposing optimized methods for debugging. The authors introduce a segmented bitmap structure to track memory updates efficiently and data flow analysis to eliminate unnecessary checks, reducing overhead significantly. These techniques achieved a 42% average overhead, dropping to 25% for scientific workloads, making data breakpoints practical. Using dynamic code patching and loop optimizations, the system further improved performance, outperforming traditional and hardware-based methods. The approach enables efficient debugging and supports advanced applications like runtime type checking and anomaly detection.
Regarding breakpoint handling in the context of malware sandboxes, intrusion detection and the often necessary stealthiness, Vasudevan and Yerraballi present VAMPiRE [21], a stealth breakpoint framework designed for fine-grained malware analysis. Traditional debugging mechanisms, such as hardware and software breakpoints, face significant limitations when analyzing self-modifying and self-checking malware. VAMPiRE overcomes these challenges by employing stealth techniques, combining virtual memory manipulations, single-stepping, and Task State Segments. Its features include unlimited breakpoints, undetectability to the target code, portability, and ease of integration via a simple API. The framework achieves its stealth through clock patches, virtual trap-flag management, and polymorphic/metamorphic engine techniques, ensuring that malware cannot detect its presence. Performance benchmarks show that VAMPiRE’s latency is comparable to hardware breakpoints, making it suitable for interactive debugging. However, VAMPIRE has two shortcomings. It currently lacks support for legacy I/O breakpoints in kernel mode, which limits its scope for certain debugging scenarios. Also, while VAMPiRE itself is stealthy, integration into existing debuggers may expose the debugging activity to malware.
VAMPiRE operates at the level of commodity Operating Systems (e.g., Windows, Linux) and relies on features like virtual memory, single-stepping, and exception handlers within the OS’s context. Hypervisor-level debugging requires awareness and manipulation of virtualization-specific constructs like VMCS (Virtual Machine Control Structure) or hypervisor traps, which VAMPiRE does not address.
When focusing on hyper-breakpoints, like our work, CXPInspector by Willems et al. [5] is worth mentioning. It showcases hypervisor-based, hardware-assisted monitoring for advanced malware analysis in the form of their prototype CXPInspector. They use two-dimensional paging for memory isolation and monitor transitions between user and kernel modules. Through this, the authors are able to perform static, dynamic, and behavior analysis. However, they suffer significant performance overhead and still lack sophisticated analysis systems that support their method. Furthermore, they indicate that their kind of monitoring can still be detected by intelligent malware.
It is obvious that most of the relevant works are rather old. However, with the continuing trend of virtualizing everything, we make the case that it is necessary to continue in the direction of the research.

6. Conclusions

This section concludes this paper. In Section 6.1, we summarize the main takeaways from the paper, before we give an outlook into planned and potential future work in Section 6.2.

6.1. Summary and Discussion

In this work, we gave an overview and categorization of existing approaches of handling, hiding, and optimizing VMI breakpoints. Based on the findings, we proposed micro-benchmark workloads to quantify the execute and read performance of breakpoints, as well as the overhead induced by monitoring context switches. While we do not have working implementations of each approach available for testing, we provided the measurement results for the SmartVMI breakpoint implementation working together with KVM and QEMU. We measured that it takes 81 µs to process a breakpoint hit and 21 µs per read to a page where a breakpoint is hidden, and that intercepting CR3 write events costs the vCPU around 22% of performance.
In Section 3, we stated open questions, which bpbench is supposed to answer. We will revisit them now and check bpbench’s suitability to answer them.
Is it faster to use instruction emulation or perform EPT switches and single-stepping? We are not able to answer this question in this paper, because neither approach is currently implemented in SmartVMI, and bpbench was the first step towards starting their realizations, allowing us to keep track of performance during development. We do provide measurements for SmartVMI’s current breakpoint approach, demonstrating the possibility of also providing measurements for future implementations.
How expensive is it to handle reads with EPT violations and read emulations? SmartVMI uses exactly this approach to hide its breakpoints; thus, we can answer this for the utilized hardware: 21 µs per read.
What is the performance penalty for the whole system when a VM exit happens on every context switch to manage breakpoint statuses? Again, we can answer this for the tested hardware and workload (CPU-Z): system performance is reduced by around 22%.

6.2. Future Work

The work presented in this paper is a strong foundation that enables a lot of follow-up research. Most notably, our need for bpbench’s functionality came from the fact that we needed quantitative feedback to aid in the development of efficient VMI breakpoints. Thus, the next step is now to implement some or all breakpoint-handling approaches discussed in Section 2, and use bpbench to assess their performance.
Another interesting research topic is the impact of the hypervisor. Instead of using the same hypervisor and comparing different breakpoint approaches implemented in SmartVMI, the abstract of libvmi allows us to instead use the same SmartVMI configuration with different hypervisors (i.e., Xen and KVM) and measure if performance differences exist between them.
There are considerations in implementing another workload into bpbench, which is not concerned with performance, but is supposed to test the robustness of breakpoint-handling implementations. A big challenge is to keep breakpoints active even when the VM is performing memory management operations, e.g., when a page containing a breakpoint is evicted from RAM. Usually, because code packages are not writeable, their memory contents are not written to swap but reloaded from a disc when demand arises. Even if they were paged out, the breakpoints’ stealthiness would prevent their state from being preserved. Additionally, when reloaded, the page might be placed at a different GPA. If the breakpoint mechanism is not very thorough with checking this, breakpoints can disappear. It would be beneficial to have a workload test for exact cases and rate the robustness of the breakpoint implementation under test.
Finally, we want to improve the situation of VMI infrastructure deployment. Manually configuring a system with the right kernel, with KVM-VMI patches applied, and compiling the right versions of patched QEMU and SmartVMI tedious endeavors involving many steps and dependencies. We aim to provide nix packaging to provide reproducible and easy-to-deploy VMI infrastructure based on KVM.

Author Contributions

Conceptualization, L.B. and L.I.; methodology, A.S. and L.B.; software, A.S. and L.B.; validation, A.S., L.B. and R.S.; formal analysis, L.B.; investigation, L.B. and A.S.; resources, L.B.; data curation, L.B.; writing—original draft preparation, L.B., A.S. and R.S.; writing—review and editing, L.I. and C.D.; visualization, L.B.; supervision, L.I. and C.D.; project administration, L.B.; funding acquisition, L.B., C.D. and L.I. All authors have read and agreed to the published version of the manuscript.

Funding

This research was supported by the German Federal Ministry of Education and Research (BMBF) as part of the HypErSIS project (grant ID 16KIS1745K and 16KIS1746), and the CySIRK project (grant ID 13FH101KB1). Additionally, Lukas Beierlieb was supported by Cyberus Technology GmbH, and Raphael Springer by the nicos AG. MDPI has kindly waived the submission fees for this paper.

Data Availability Statement

The original data presented in the study are openly available in the repositories specified in Section 4.1.

Acknowledgments

We thank Philipp Schuster and Werner Haas from Cyberus Technology GmbH for their work on the HypErSIS project, which made this publication possible in the first place. We thank the anonymous reviewers. The AI-assisted proofreading tool Writefull has been used to audit and improve this manuscript. ChatGPT’s PDF summarization feature has been used to select appropriate related work.

Conflicts of Interest

Author Lukas Beierlieb was employed by the Cyberus Technology GmbH. The remaining authors declare that the research was conducted in the absence of any commercial or financial relationships that could be construed as a potential conflict of interest.

References

  1. Garfinkel, T.; Rosenblum, M. A virtual machine introspection based architecture for intrusion detection. In Proceedings of the Internet Society’s 2003 Symposium on Network and Distributed System Security, San Diega, CA, USA, 27–31 January 2003; Volume 3, pp. 191–206. [Google Scholar]
  2. wook Baek, H.; Srivastava, A.; Van der Merwe, J. CloudVMI: Virtual Machine Introspection as a Cloud Service. In Proceedings of the 2014 IEEE International Conference on Cloud Engineering, Boston, MA, USA, 11–14 March 2014; pp. 153–158. [Google Scholar] [CrossRef]
  3. Jiang, X.; Wang, X.; Xu, D. Stealthy malware detection through VMM-based ‘out-of-the-box’semantic view. In Proceedings of the 14th ACM Conference on Computer and Communications Security, Alexandria, VA, USA, 2 November–31 October 2007; Volume 10, pp. 128–138. [Google Scholar] [CrossRef]
  4. Dinaburg, A.; Royal, P.; Sharif, M.; Lee, W. Ether: Malware analysis via hardware virtualization extensions. In Proceedings of the 15th ACM Conference on Computer and Communications Security, Alexandria, VA, USA, 27–31 October 2008; pp. 51–62. [Google Scholar] [CrossRef]
  5. Willems, C.; Hund, R.; Holz, T. Cxpinspector: Hypervisor-Based, Hardware-Assisted System Monitoring; Technical Report; Ruhr-Universität Bochum: Bochum, Germany, 2013. [Google Scholar]
  6. Dolan-Gavitt, B.; Leek, T.; Zhivich, M.; Giffin, J.; Lee, W. Virtuoso: Narrowing the Semantic Gap in Virtual Machine Introspection. In Proceedings of the 2011 IEEE Symposium on Security and Privacy, Oakland, CA, USA, 22–25 May 2011; pp. 297–312. [Google Scholar] [CrossRef]
  7. Jain, B.; Baig, M.B.; Zhang, D.; Porter, D.E.; Sion, R. SoK: Introspections on Trust and the Semantic Gap. In Proceedings of the 2014 IEEE Symposium on Security and Privacy, Berkeley, CA, USA, 18–21 May 2014; pp. 605–620. [Google Scholar] [CrossRef]
  8. Dangl, T.; Taubmann, B.; Reiser, H.P. RapidVMI: Fast and multi-core aware active virtual machine introspection. In Proceedings of the Proceedings of the 16th International Conference on Availability, Reliability and Security, Vienna, Austria, 17–20 August 2021; ARES’21. pp. 1–10. [Google Scholar] [CrossRef]
  9. Lengyel, T.K.; Maresca, S.; Payne, B.D.; Webster, G.D.; Vogl, S.; Kiayias, A. Scalability, fidelity and stealth in the DRAKVUF dynamic malware analysis system. In Proceedings of the 30th Annual Computer Security Applications Conference, New Orleans, LA, USA, 8–12 December 2014; ACSAC ’14. pp. 386–395. [Google Scholar] [CrossRef]
  10. Tarral, M. LibVMI: Simplified Virtual Machine Introspection. 2007. Available online: https://github.com/libvmi/libvmi (accessed on 15 January 2025).
  11. Eikenberg, D. SmartVMI. 2021. Available online: https://github.com/GDATASoftwareAG/smartvmi (accessed on 15 January 2025).
  12. Reiser, H.P.; Eikenberg, D. SmartVMI—Virtual Machine Introspection (VMI) for Memory Forensics and Machine-Learning. 2021. Available online: http://www.smartvmi.org/ (accessed on 15 January 2025).
  13. Lengyel, T. DRAKVUF Black-Box Binary Analysis. 2014. Available online: https://github.com/tklengyel/drakvuf (accessed on 19 December 2024).
  14. Lengyel, T.K. Stealthy Monitoring with xen altp2m. 2016. Available online: https://xenproject.org/blog/stealthy-monitoring-with-xen-altp2m/ (accessed on 17 December 2024).
  15. Roccia, T. Evolution of Malware Sandbox Evasion Tactics—A Retrospective Study. 2019. Available online: https://www.mcafee.com/blogs/other-blogs/mcafee-labs/evolution-of-malware-sandbox-evasion-tactics-a-retrospective-study/ (accessed on 17 December 2024).
  16. Qiu, J.; Yadegari, B.; Johannesmeyer, B.; Debray, S.; Su, X. Identifying and Understanding Self-Checksumming Defenses in Software. In Proceedings of the 5th ACM Conference on Data and Application Security and Privacy, San Antonio, TX, USA, 2–4 March 2015; CODASPY ’15. pp. 207–218. [Google Scholar] [CrossRef]
  17. Sonawane, S.; Onofri, D. Malware Analysis: GuLoader Dissection Reveals New Anti-Analysis Techniques and Code Injection Redundancy. 2022. Available online: https://www.crowdstrike.com/en-us/blog/guloader-dissection-reveals-new-anti-analysis-techniques-and-code-injection-redundancy/ (accessed on 19 December 2024).
  18. Blum, D. PatchGuard and Windows security. In Network World Canada; Laurentian Technomedia Inc.: OTTAWA, ON, USA, 2007; Volume 23. [Google Scholar]
  19. Wahbe, R. Efficient data breakpoints. ACM Sigplan Not. 1992, 27, 200–212. [Google Scholar] [CrossRef]
  20. Wahbe, R.; Lucco, S.; Graham, S.L. Practical data breakpoints: Design and implementation. In Proceedings of the ACM SIGPLAN 1993 Conference on Programming Language Design and Implementation, Albuquerque, NM, USA, 21–25 June 1993; Volume 28, PLDI93. pp. 1–12. [Google Scholar] [CrossRef]
  21. Vasudevan, A.; Yerraballi, R. Stealth Breakpoints. In Proceedings of the 21st Annual Computer Security Applications Conference (ACSAC’05), Tucson, AZ, USA, 5–9 December 2005; pp. 381–392. [Google Scholar] [CrossRef]
Figure 1. Control flow sequence of a breakpoint handling with single-stepping.
Electronics 14 00534 g001
Figure 2. Control flow sequence of a breakpoint handling with instruction emulation.
Electronics 14 00534 g002
Figure 3. Architecture of a SmartVMI on a KVM/QEMU-based VMI setup.
Electronics 14 00534 g003
Figure 4. Box-plot of the breakpoint execute and read workloads with no breakpoint set.
Electronics 14 00534 g004
Figure 5. Box-plot of the breakpoint execute and read (read page excluded) workloads with a breakpoint set.
Electronics 14 00534 g005
Figure 6. Box-plot of the breakpoint read page workload with a breakpoint set.
Electronics 14 00534 g006
Figure 7. CPU-Z benchmark performance with and without CR3 monitoring.
Electronics 14 00534 g007
Table 1. An overview of breakpoint handling approaches.
ApproachBP TriggerHandling of the Original InstructionMP-SafeStealth
User-mode debugging (no VM)int3Replace + single-stepping (TF)NoNone
Single-Stepping (SmartVMI)int3Replace + single-stepping (MTF)NoTrap on read (EPT) + Emul.
Instruction Emulationint3Instruction emulationYesTrap on read (EPT) + Emul.
altp2mEPT violationEPT switch + single-stepping (MTF)YesInvisible by design
altp2m with int3 (DRAKVUF)int3EPT switch + single-stepping (MTF)YesTrap on read (EPT) + Emul.
Table 2. An overview of the bpbench workloads.
bpbench NameWorkloadMeasured Actions
timer-none
exec bpWL1CALL, breakpoint hit (on RET)
exec pageWL2CALL, 4095 NOPs, breakpoint hit (on RET)
read bpWL31-byte read at breakpoint address
read pageWL4512 8-byte reads from page with BP, instructions for looping
Table 3. Hardware specifications and software versions of the VMI setup.
CategoryHostVM
CPUIntel Core i5 7300U1 vCPU
RAM2x4 GB DDR44 GB
OSNixOS 24.05Windows 10 Pro 22H2,
Kernel version5.4.24 1Build 19045.2965
Other softwareQEMU 4.2.1 1bpbench
SmartVMICPU-Z 2.13.0
1 Patches applied to add VMI functionality.
Disclaimer/Publisher’s Note: The statements, opinions and data contained in all publications are solely those of the individual author(s) and contributor(s) and not of MDPI and/or the editor(s). MDPI and/or the editor(s) disclaim responsibility for any injury to people or property resulting from any ideas, methods, instructions or products referred to in the content.

