1. Introduction
Medical report generation (MRG) utilizes advanced algorithms to automatically extract key information from medical images and generate the corresponding reports. These advances not only help clinicians to efficiently review and diagnose medical conditions, but also contribute to the broader automation of the medical imaging workflow. Similarly to the image captioning task, the main approaches in MRG are typically based on the encoder–decoder architecture, using Convolutional Neural Networks (CNNs) to extract visual features and Recurrent Neural Networks (RNNs), or their variants, to generate reports [
1,
2,
3]. Although this method successfully captures the coarse-grained features and basic semantic structures of the images, the generated reports tend to be brief, with limited information coverage, often failing to describe subtle or complex abnormalities present in the images. In recent years, the Transformer model [
4], which has gained widespread use in Natural Language Processing (NLP), has been increasingly integrated into MRG models [
5,
6,
7,
8]. The Transformers’ ability to capture long-distance dependencies and model rich contextual relationships within data has led to significant improvements in the quality of generated reports. Reports produced by Transformer-based models are typically more detailed and comprehensive, enhancing the clinical value of the generated content. The integration of attention mechanisms, particularly self-attention and cross-attention [
3], allows the model to dynamically adjust its focus across different features, enabling a more effective extraction of key information from medical images and improving the accuracy of visual feature representation [
6,
7]. Furthermore, cross-modal alignment techniques such as cross-attention and gating mechanisms have been developed to promote the alignment of visual and textual modalities, enhancing the semantic consistency between the two. These techniques allow the model to better understand the relationships between the image content and the corresponding text, thereby improving the model’s ability to generate accurate, contextually relevant and coherent medical reports. As a result, with the advancement of these methods, substantial progress has been made in improving the accuracy, completeness, and readability of the reports generated in MRG. These contributions not only help clinicians in the efficient review and diagnosis of medical conditions but also aid in the general automation of the medical imaging workflow, streamlining the healthcare process, and reducing human error.
However, several challenges remain in this field. Due to the inherent nature of medical images and reports, cross-modal feature interaction and alignment in this visual-language task are particularly difficult. First, the intrinsic properties of medical images complicate the task of distinguishing visual features. Zhou et al. [
9] pointed out that medical images often have low contrast and blurry boundaries, while Wang et al. [
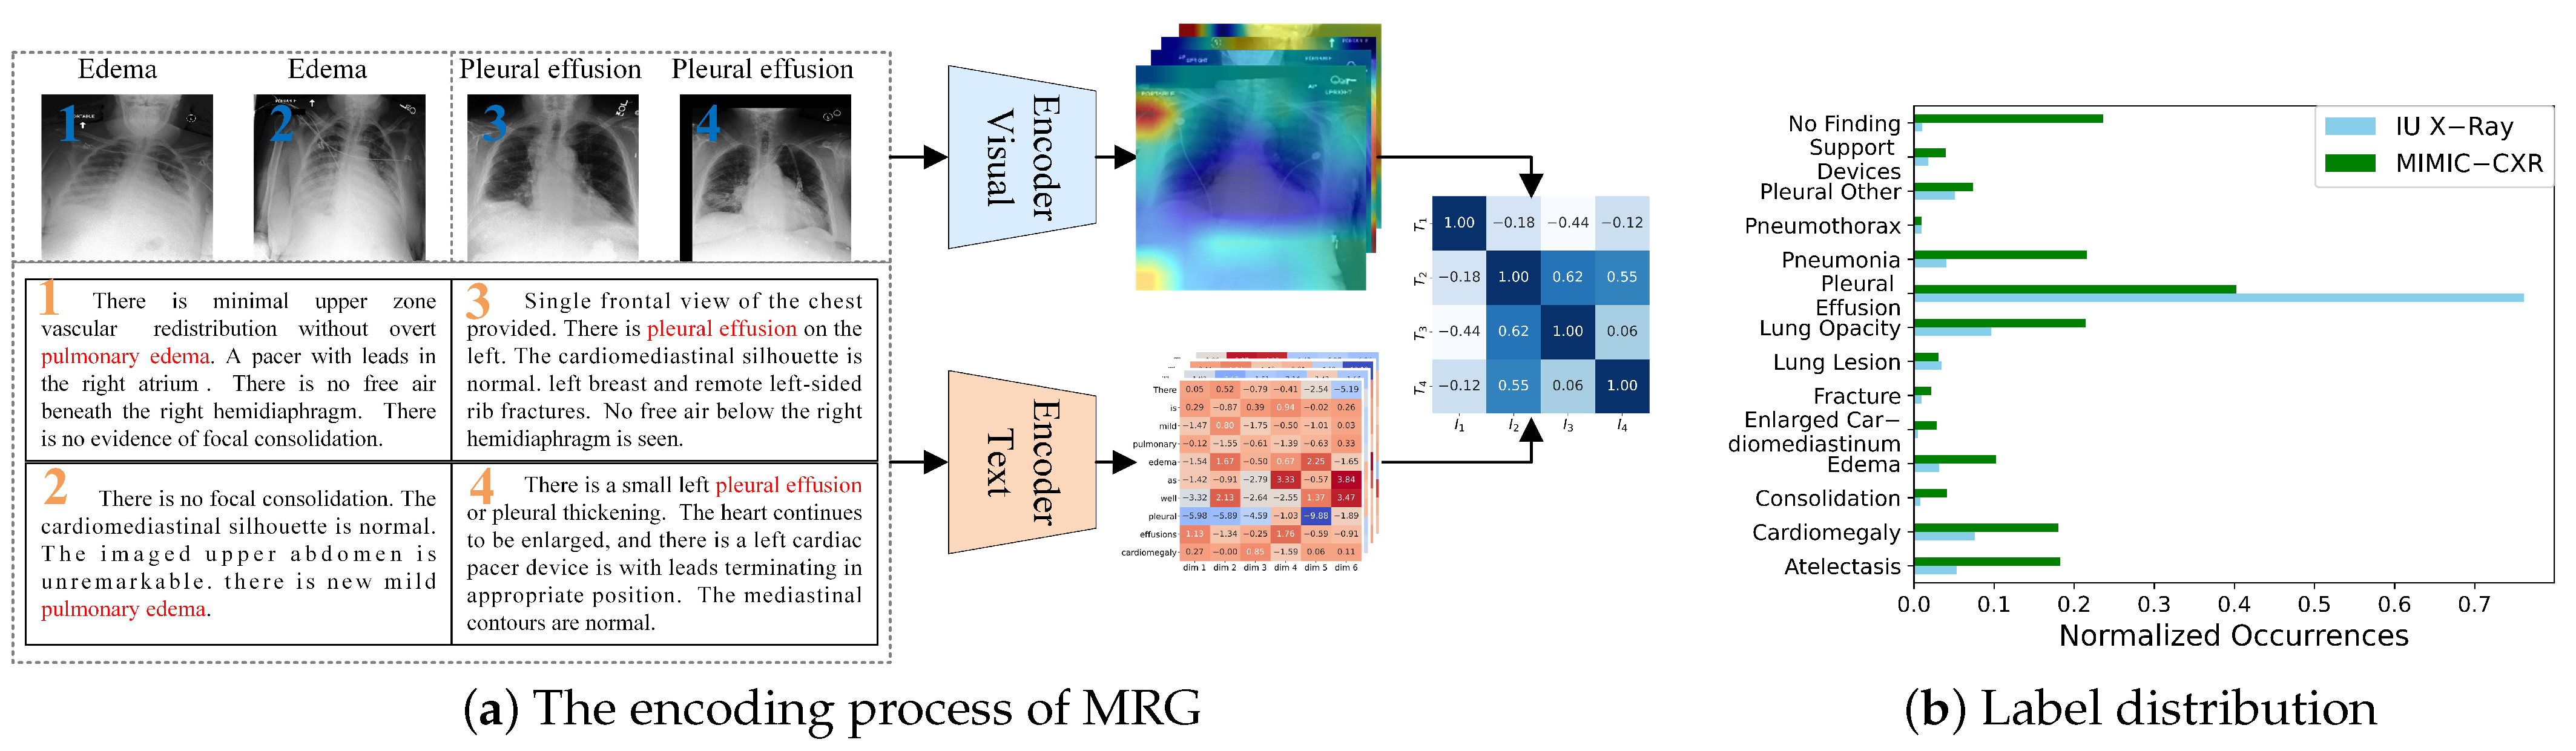
10] highlighted that radiographic images exhibit both intra-class variation, where the same lesion appears differently across individuals, and inter-class similarity, where different types of lesions appear visually similar. As shown in
Figure 1a, images of two diseases are displayed. It is evident that these two types of images share certain similarities, making them difficult to distinguish and visually vague. Second, the proportion of lesion areas in medical images and their corresponding textual descriptions is relatively small, making it challenging to extract and learn the features necessary for identifying abnormal lesions. Additionally, in commonly used datasets such as IU X-Ray [
11] and MIMIC-CXR [
12], the distribution of diseases is highly imbalanced, as illustrated in
Figure 1b. This imbalance can cause deep neural network models to prioritize descriptions of normal conditions and overemphasize certain diseases while neglecting others. In clinical practice, missing the diagnosis of diseases or abnormalities can have severe consequences.
Earlier research typically modeled cross-modal interaction using self-attention mechanisms applied to the visual and textual features extracted from the encoder–decoder architecture. However, this approach struggles to fully capture complex cross-modal patterns. Recent studies have shifted focus to contrastive learning strategies, which bring the representations of matching image–text pairs closer together while pushing non-matching pairs further apart. This enables the model to learn stronger cross-modal alignment in a unified feature space, thereby improving the accuracy and consistency of report generation. However, in medical imaging, a single instance may contain multiple types of lesions or abnormalities, making coarse-grained contrastive learning less effective at capturing subtle variations between samples within the same category. Traditional contrastive learning methods typically compare entire images or full text segments as instances, overlooking the importance of local features such as specific lesions or tissue regions. As shown in
Figure 1a, the feature heatmap is not clearly distinguishable, and the extracted image features fail to properly attend to different regions. Similarly, the text features exhibit the same issue, with words of little significance, such as prepositions, receiving disproportionate attention. This misalignment in feature representation leads to inaccuracies in graphic similarity. For example, while image 1 and image 3 may appear highly similar, they correspond to different diseases. Therefore, there is a need to develop fine-grained feature matching methods that leverage information from local lesion regions, enhancing the model’s ability to focus on relevant areas and improving the overall quality of report generation.
To address the challenges, we propose an Anomaly-Driven Cross-Modal Contrastive Network (ADCNet), designed to improve the quality and accuracy of medical report generation. This method incorporates abnormal lesion information and uses a cross-modal feature fusion and alignment mechanism to reduce semantic discrepancies between medical images and reports, thereby enhancing the semantic consistency between the two modalities. Additionally, contrastive learning is employed to refine the model’s image understanding. Overall, the proposed method increases the sensitivity of visual features to abnormal regions and applies fine-grained alignment across modal features to improve feature representation. First, we introduce the anomaly-aware cross-modal feature fusion (ACFF) module, which introduces a new anomaly embedding vector. This vector dynamically represents lesion information and is updated throughout training. Combined with visual features, it enhances the model’s ability to capture lesion abnormalities, thus improving the feature fusion process. Second, we propose the fine-grained regional feature alignment (FRFA) module. This module employs an adaptive filtering mechanism to dynamically select relevant visual and textual features, effectively eliminating irrelevant information and background noise. After filtering, the features undergo cross-modal similarity calculations to derive weighted values at both the image region and text token levels. Furthermore, through residual fusion and contrastive learning, the fine-grained feature alignment is strengthened. Experimental results demonstrate that ADCNet outperforms both baseline models and existing state-of-the-art (SOTA) methods on the IU X-Ray and MIMIC-CXR standard datasets, showcasing significant improvements in performance. In summary, the contributions of this paper are as follows:
We propose an anomaly embedding vector that acts as a bridge between the two modalities, effectively capturing and enhancing the complex semantic interactions between visual and textual features and thereby improving the representation of lesion areas in the visual features.
We design a feature-adaptive filtering method that aligns fine-grained local visual regions with more precise textual descriptions, enhancing the semantic consistency between the cross-modal features.
Through extensive experiments, we show that the proposed method outperforms existing approaches in terms of accuracy, completeness, and readability of medical reports.
3. Methods
In the MRG task, let represents the medical image, where I has a resolution of pixels and 3 color channels. The corresponding medical report is represented as , where each is the word index from the vocabulary , with a vocabulary size of . The goal of the MRG task is to generate a report based on the provided image, such that it is similar to the ground-truth report R. Here, and denote the lengths of the real report and the generated report, respectively.
CheXpert [
24] can generate diagnostic labels for chest X-ray radiology reports. We use this tool to annotate the diseases in the training set, obtaining 14 disease labels, represented as
, where
represents the number of disease labels.
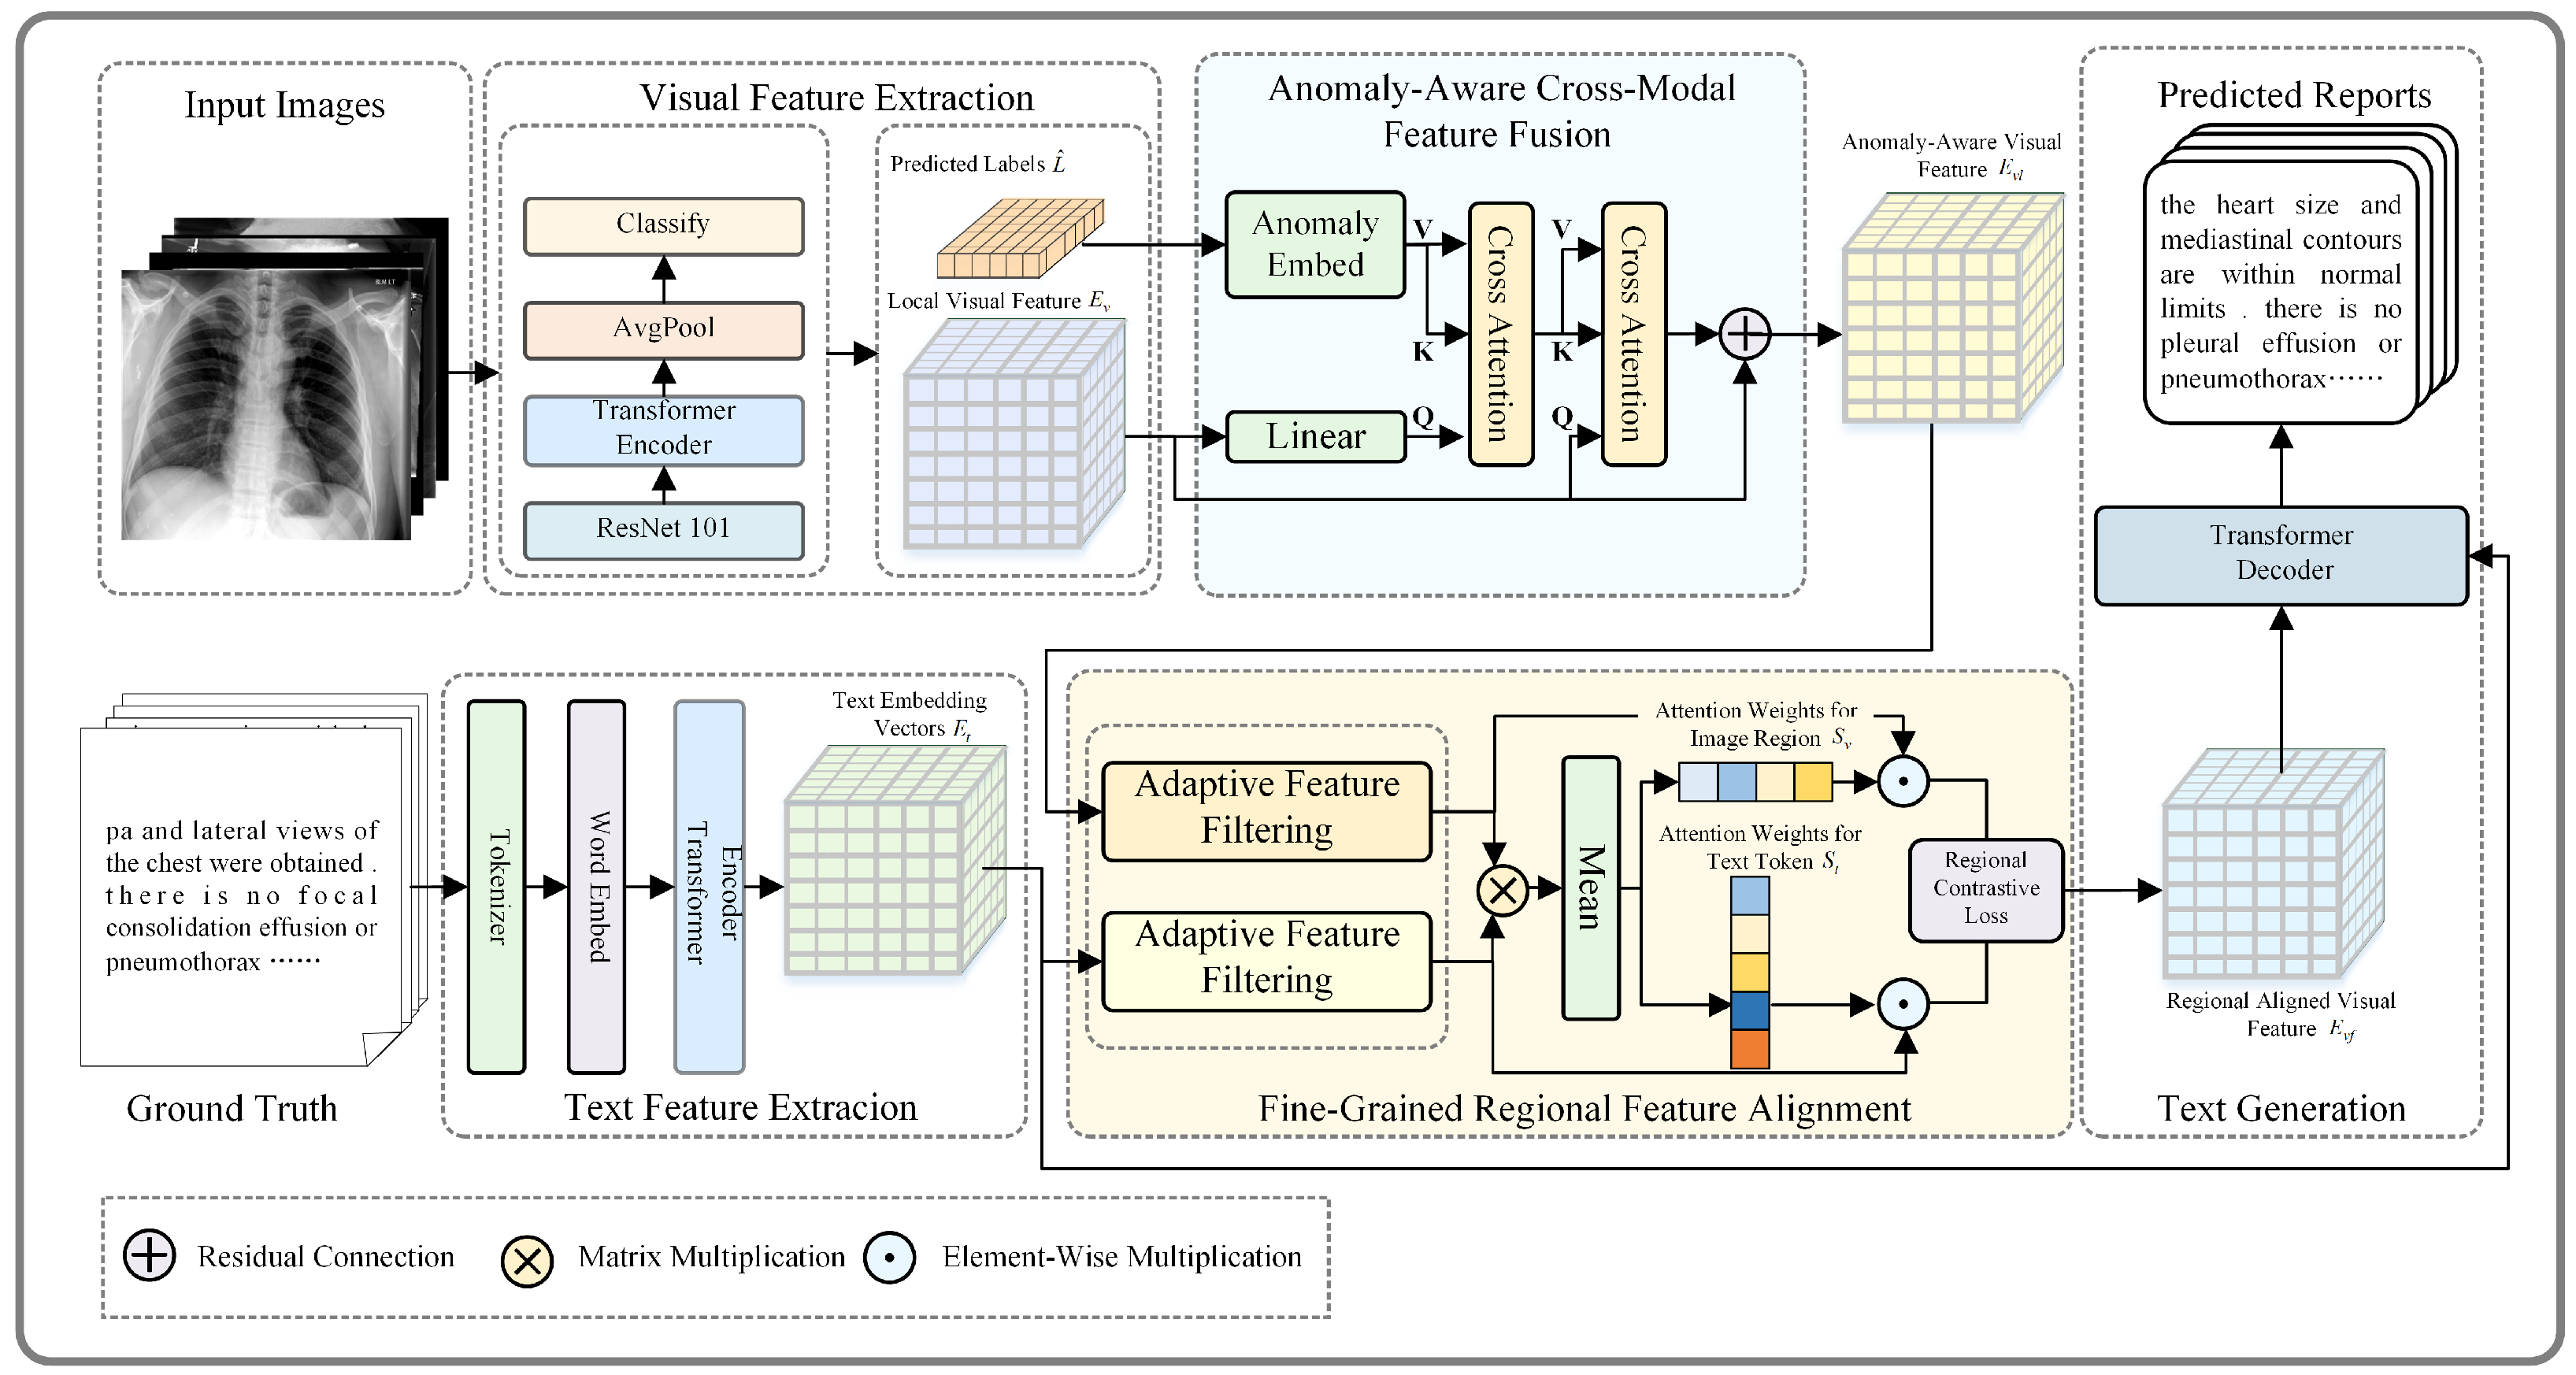
The overall structure of the model is based on a Transformer-based encoder–decoder architecture, as shown in
Figure 2. It mainly consists of four components: (a) feature extraction; (b) anomaly-aware cross-modal feature fusion; (c) fine-grained regional feature alignment; (d) text generation.
3.1. Feature Extraction
3.1.1. Visual Feature Extraction
The image I is passed through a pre-trained ResNet-101 model to extract patch-level features and obtain local visual feature , with representing the number of patches and representing the visual feature dimension.
3.1.2. Text Feature Extraction
For text sequences, the word embedding module in the Transformer maps discrete word indices into a
-dimensional continuous vector space, producing an embedding vector
T. To stabilize the training process,
T is scaled and normalized as follows:
where
, and
is the word embedding matrix, with
as the vocabulary size and
as the embedding dimension.
Next, positional encoding is added to incorporate word order into the embedding. The positional encoding is computed as follows:
where
is the position index of a word in the sequence, and
corresponds to the embedding dimension indices. The positional encoding matrix
P is added to the word embedding.
The final text feature
is computed as the element-wise sum of the normalized word embedding
T and the positional encoding
P:
This entire process can be summarized as follows:
3.1.3. Feature Enhancement
The standard Transformer encoder is used to encode the features of the visual modality to obtain enhanced local visual feature
. Similarly, a standard self-attention module is applied to encode the text embeddings, producing the text embedding features
:
where
,
, and Encoder denotes the standard Transformer encoder.
Next, average pooling is performed to obtain the global visual feature .
Finally, the global features are passed through a classification layer to obtain the disease label prediction probability
:
where
,
, and
represents the sigmoid activation function.
3.2. Anomaly-Aware Cross-Modal Feature Fusion
The anomaly-aware cross-modal feature fusion (ACFF) module is designed to address the challenge of capturing and aligning clinically significant abnormalities across different modalities. By utilizing predicted disease labels to enhance the fusion process, the ACFF module ensures that visual features are dynamically guided by anomaly-specific semantic information. This innovative approach enhances the model’s ability to focus on critical diagnostic regions, leading to more accurate and clinically relevant cross-modal feature alignment. The design details of the module are illustrated in
Figure 3.
3.2.1. Anomaly Information Generation
The generation of anomaly-specific information is a key component of the ACFF module. Predicted disease label probabilities are mapped into a specialized embedding space to produce an anomaly embedding vector . This vector encodes the semantic meaning and abnormal characteristics associated with the predicted diseases, providing a rich representation of clinically relevant information.
We begin by transforming the predicted disease label
into a corresponding anomaly embedding vector
within the text feature space. Before mapping,
is converted into a discrete multi-hot vector by applying a thresholding operation, which can be formulated as follows:
where
, and
is a predefined threshold parameter and its value is given in
Section 4.3. Through this operation, the resulting multi-hot vector
indicates the potential disease categories associated with the input image.
However, this vector represents a discrete classification result, and directly computing it with continuous feature vectors may lead to information loss. To address this, the classification results are mapped into a continuous feature space using a trainable embedding process, producing the anomaly embedding vector . This embedding introduces both semantic information from the text space and anomaly-specific guidance, improving alignment with clinically relevant features.
Next, we integrate the visual features
with the generated anomaly embeddings. To achieve this, we project the visual features
into the anomaly embedding space by applying a trainable transformation matrix
. This step produces a new visual-label vector
, which represents a cross-modal fusion of visual features and anomaly-aware information.
Here, , and the embedding function is the same as the embedding module, as shown in Equation (6), which generates a -dimensional vector for each disease label . serves as a guiding signal for the model, directing its attention towards regions of interest in the medical image that correspond to the abnormalities. Additionally, , and is the transformation matrix that projects the visual features into the anomaly embedding space.
By mapping discrete disease labels to , we incorporate semantic guidance that directs the model’s focus to clinically relevant regions associated with the diagnosed diseases. This process generates a representation of the image enriched with both visual content and anomaly-specific information, forming a solid foundation for feature fusion and alignment.
3.2.2. Anomaly Information Injection
To fuse visual and anomaly-aware features, we employ a cross-attention mechanism that aligns visual features with anomaly-specific information, focusing on diagnostically critical regions.
The first cross-attention operation aligns the visual-label vector
with the anomaly embedding vector
, generating the visual-anomaly vector
. This step ensures that the anomaly embedding vector provides semantic and anomaly-specific guidance, enabling the model to focus on regions in the visual modality that correspond to specific disease categories. Next, the second cross-attention layer integrates this anomaly-aware information into the visual feature map
, producing the fused anomaly-aware visual feature
. This step enhances the model’s focus on critical diagnostic areas and improves cross-modal feature alignment.
where
, and
,
, and
are the query, key, and value matrices for the attention mechanisms
and
.
The first attention interaction aligns the visual features with disease-related anomaly embeddings, while the second refines the original visual features with this information. Together, these steps enhance the model’s ability to mine diagnostically significant information and improve the accuracy and clinical relevance of the generated reports.
3.2.3. Visual-Anomaly Vector Loss Calculation
To optimize this fusion process, we calculate a loss function based on the cross-entropy between the abnormal embedding vector
and the mapped visual features
:
where
represents the sigmoid activation function, and the loss function encourages the model to focus on the correct abnormal regions.
By integrating visual and textual features with a focus on anomalies, this method not only enhances the accuracy of the reports but also ensures that critical diagnostic information, often embedded within abnormalities, is effectively captured and highlighted.
3.3. Fine-Grained Regional Feature Alignment
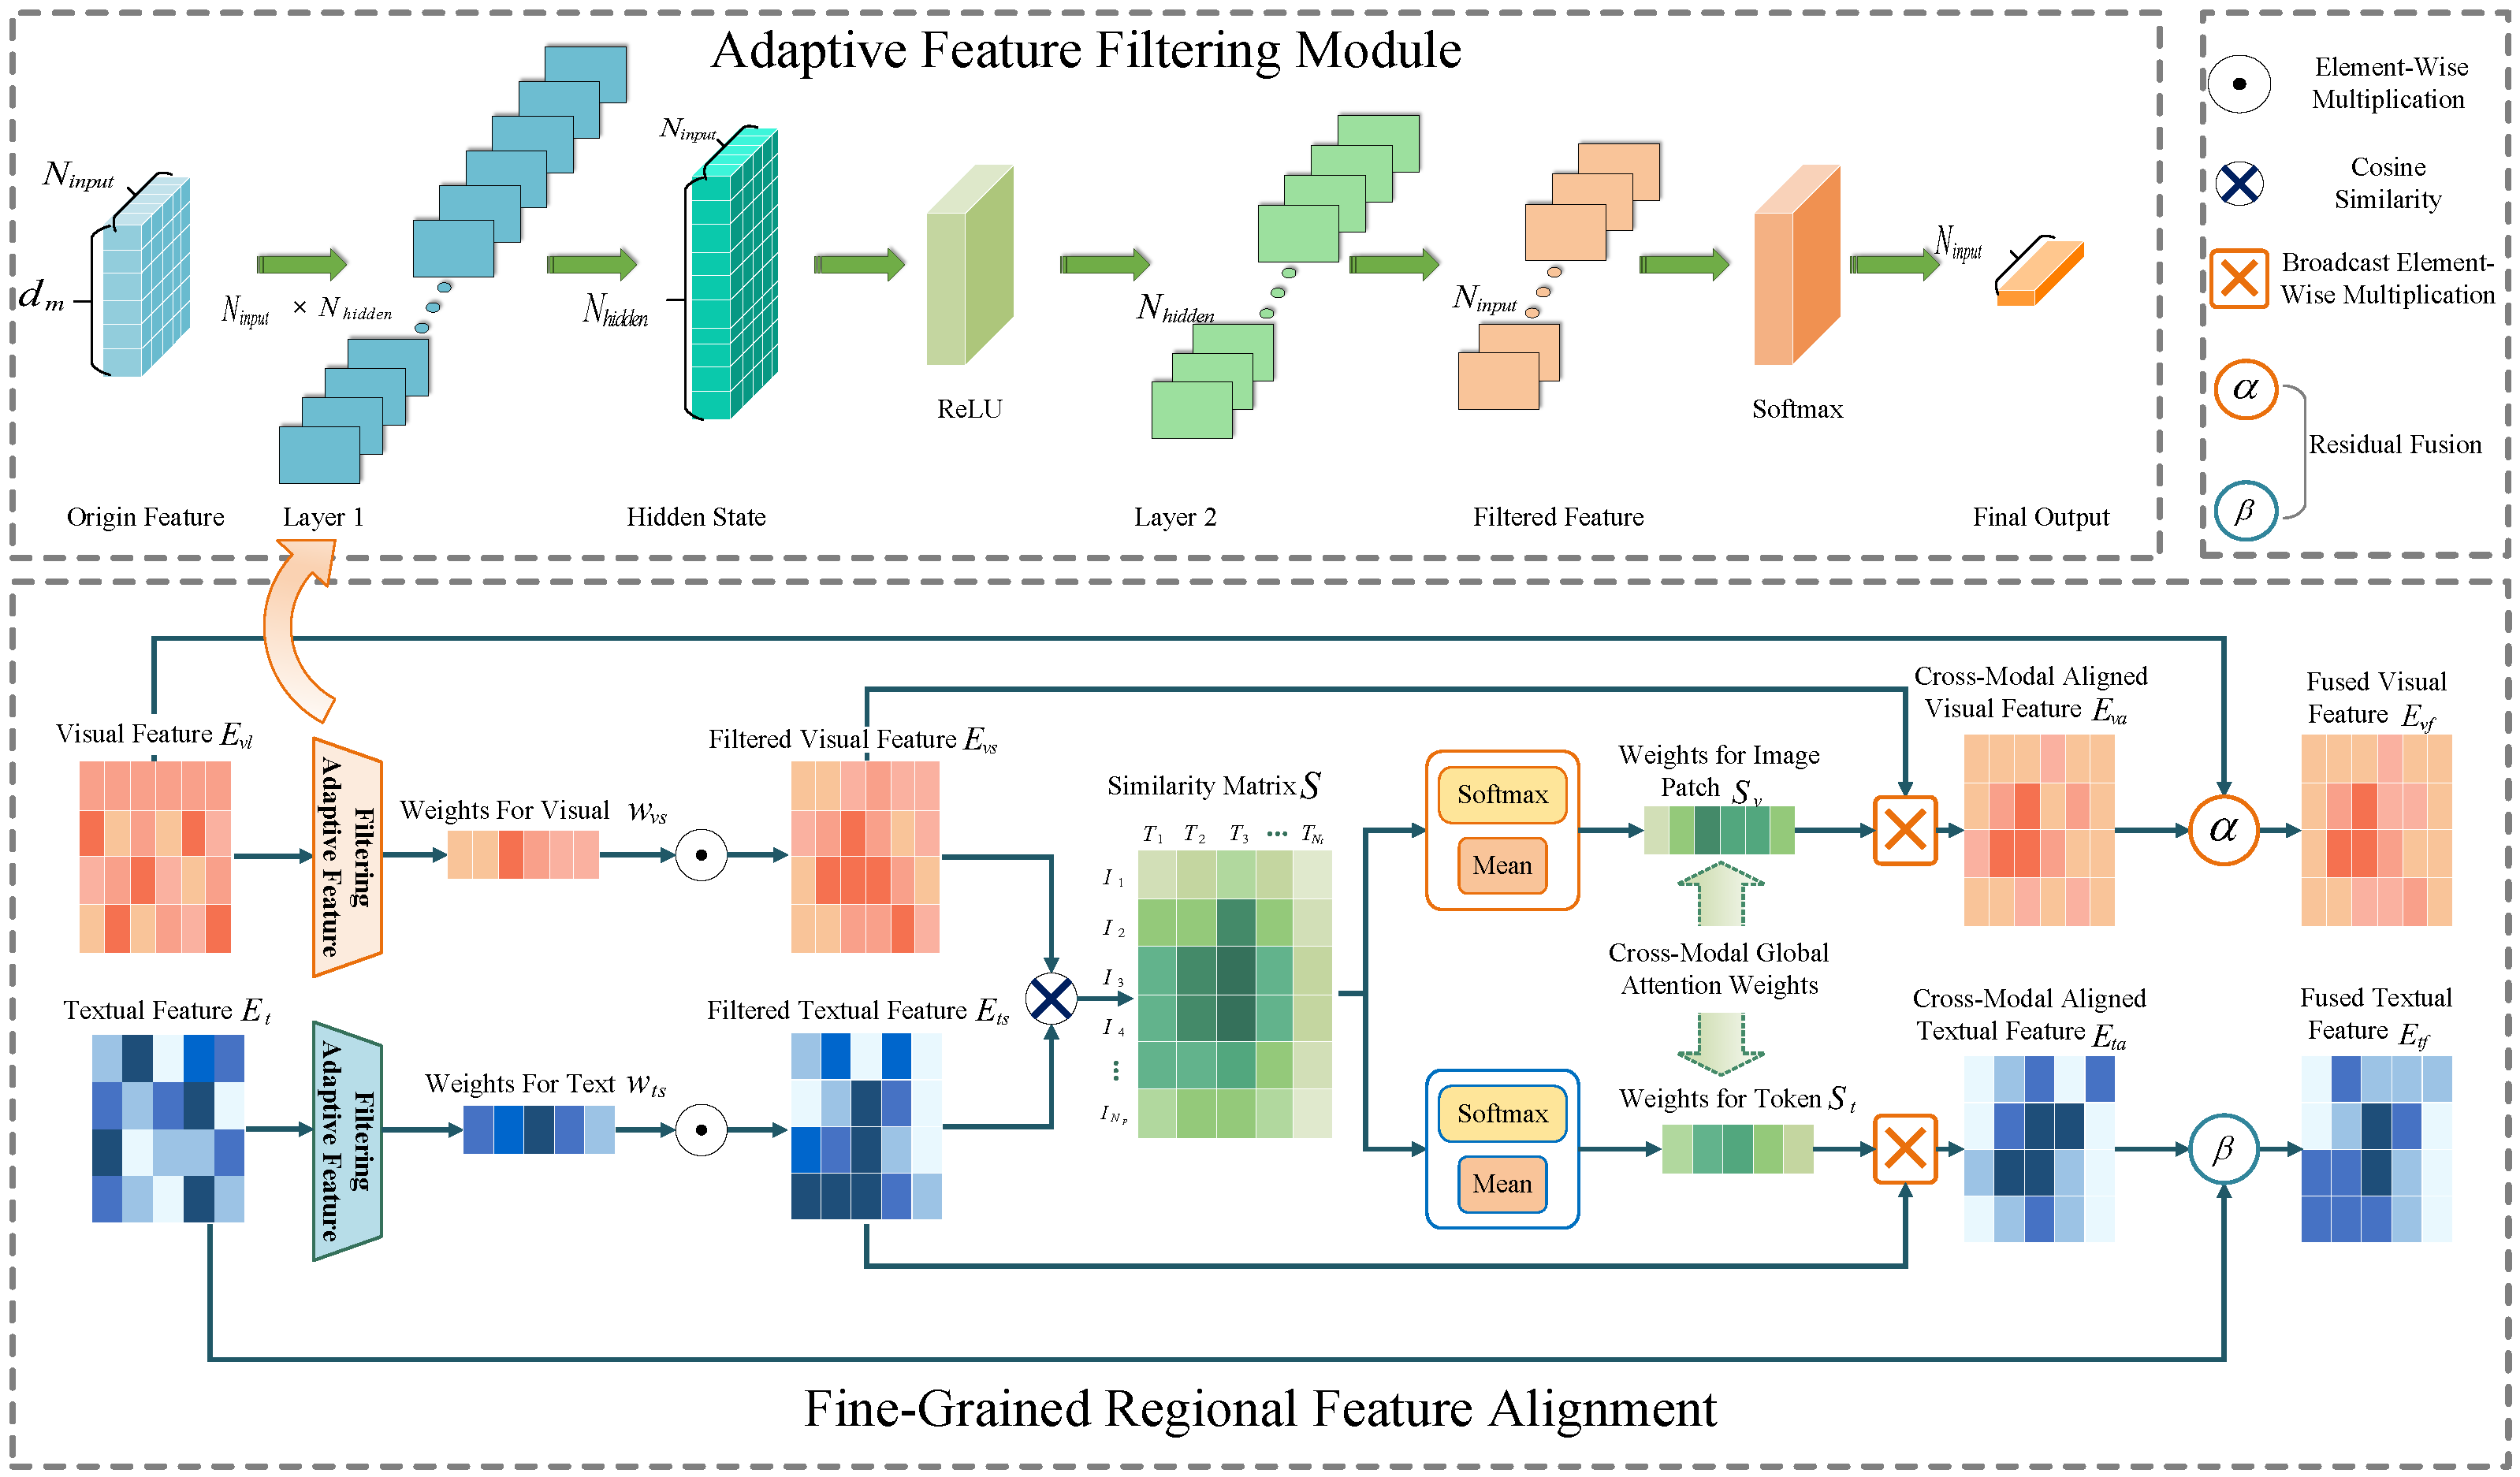
For paired medical image and report data, visual and textual features typically exhibit semantic consistency, but challenges arise due to data imbalance and the inherent complexity of medical images and reports. Images often suffer from high intra-class variability and low inter-class discriminability, while reports contain complex language structures. These issues hinder effective feature correlation. To address these challenges, we propose fine-grained regional feature alignment, as shown in
Figure 4, a novel method that uses dynamic feature weighting and contrastive loss to enhance the alignment of image and text features. This approach selectively emphasizes important visual regions and text tokens, ensuring more precise and discriminative cross-modal feature alignment.
3.3.1. Adaptive Feature Filtering
To emphasize key image regions and text tokens, we propose a feature filtering module that adaptively generates importance weights for visual and textual features using a multilayer perceptron (MLP):
Here, and represent the input visual and textual features. The MLP is a single-layer feedforward network applied independently to each feature vector (i.e., each row of or ). The first layer transforms the input feature vector of size to a hidden representation of size . This transformation is performed using and bias , followed by a ReLU activation. The second layer projects the hidden representation to a scalar with and bias . Finally, a Softmax activation is applied to the output, ensuring that the resulting weights and form a probability distribution (i.e., the weights sum to 1).
These weights dynamically adjust to the input context, highlighting relevant features while suppressing irrelevant ones.
In comparison, self-attention in Transformers considers global relationships across the entire sequence. It learns attention scores that determine how each token or region relates to all others. In contrast, our adaptive weighting is more focused. It generates weights specifically tailored to the importance of features within the context of their respective modality. This design allows for a more refined emphasis on key features, which is particularly beneficial when dealing with complex and imbalanced medical data, where the relevant information may be highly localized in both visual and textual domains.
Next, both visual and textual features are weighted according to the generated weights to obtain the filtered features
and
:
where ⊙ denotes element-wise multiplication, and
,
.
3.3.2. Fine-Grained Feature Alignment
Based on the filtered features, the cross-modal similarity between image regions and text tokens is calculated through matrix multiplication, resulting in the similarity matrix
S:
where
.
Next, fine-grained feature correlation is computed based on
S. It is normalized and averaged across both the text and visual dimensions to obtain the cross-modal global attention weights for each image region and each token, denoted as
and
, respectively:
where
represents the attention weight of the image region with respect to the text token, and
represents the attention weight of the text token with respect to the image region.
and
. The image and text features are then weighted element-wise to obtain
and
:
where
,
.
Finally, soft attention weights are used to perform dynamic residual fusion of the attended feature and aligned feature to obtain the regional aligned features
and
:
where
and
are hyperparameters that controls the fusion of the attended feature and the original feature.
This method reduces interference from redundant image regions and irrelevant text tokens by combining local region filtering, feature alignment, and a dynamic residual mechanism. Meanwhile, it enhances the alignment of image and text features through contrastive loss, improving the semantic consistency between cross-modal features.
3.3.3. Fine-Grained Cross-Modal Contrastive Loss Calculation
After obtaining the fine-grained features
and
, the final step is to compute the contrastive loss. The features are first L2-normalized:
Then, the similarity for both image-to-text and text-to-image is computed using the temperature coefficient
T:
here,
,
and the value of
T is given in
Section 4.3.
Finally, the contrastive loss is computed by summing both the image-to-text and text-to-image losses:
3.4. Text Generation
This paper uses the standard Transformer decoder as a text generator. In the training phase, medical images, real reports, and real labels are input, while in the validation and testing phases, only the model generates the predicted report text in an autoregressive manner based on the hidden vector. The decoding process is optimized using cross-entropy loss.
The decoder generates each token
conditioned on the previously generated tokens
, the fused visual features
, and text features
. The fusion of these features allows the decoder to incorporate both image and text information when generating the report. The model is trained to maximize the likelihood of generating the target sequence
given the input image
I, formulated as follows:
where
is the generated report sequence.
At each time step, the decoder generates the next token based on the context provided by the previously generated tokens and the cross-modal features from both the image and the text. This autoregressive process continues until the entire report is generated.
The decoding process is optimized using cross-entropy loss:
3.5. Loss Function
In order to effectively integrate the three loss functions and calculate the complete overall loss function, an automatically adjustable weight factor is introduced to help balance the contribution of various loss components to model training. The total loss is calculated as follows:
where the values of the weight parameters
,
, and
are given in
Section 4.3.
5. Experiment Results
5.1. Comparative Experimental Analysis
Table 1 presents a comparative analysis of the performance of ADCNet compared to existing SOTA models on two datasets. The results show that ADCNet outperforms other methods across many evaluation metrics, demonstrating its effectiveness in generating high-quality medical reports. On the IU X-Ray dataset, ADCNet performs better in BLEU-3 and BLEU-4. For the MIMIC-CXR dataset, ADCNet achieves a notable improvement, with an average increase of 3.94% in BLEU scores (from BLEU-1 to BLEU-4). However, the performance of the METEOR and ROUGE-L metrics is lower for both datasets, suggesting that the reports generated by ADCNet exhibit lower surface-level overlap with reference reports. This observation can be explained by the highly subjective nature of medical reports. Unlike more formal or structured domains, medical reports vary significantly in language style, terminology, and sentence structure due to the preferences of the individual physician and the clinical context and practice. Such variability presents a challenge for traditional NLG models, which often aim for high shallow overlap similarity to reference texts. In contrast, the ADCNet approach generates more structured and standardized output, which may not always align closely with the phrasing and sequence patterns seen in the reference reports. This leads to a decrease in the surface-level overlap as measured by ROUGE-L and METEOR. Additionally, while traditional NLG models may focus on achieving high lexical overlap with reference texts, a more robust approach for medical report generation should also consider semantic accuracy and clinical relevance.
Table 2 demonstrates that our method shows improvements in CE metrics for medical report generation. ADCNet achieves a recall of 0.369, outperforming other models. It also performs well in terms of
, with a score of 0.337, indicating a good balance between precision and recall. As mentioned above, in the context of medical image report generation, recall is particularly important, as the missed detection of lesions can result in significant diagnostic errors. A high recall rate helps to mitigate such risks, confirming the reliability of our method in detecting multiple lesions.
5.2. Ablation Experiment Analysis
As illustrated in
Table 3, in the ablation study, we systematically investigated the contributions of the ACFF and FRFA modules to the performance of MRG. In both the IU X-Ray and MIMIC-CXR datasets, the baseline model, devoid of these specialized modules, exhibited relatively lower performance across a range of evaluation metrics. The introduction of the ACFF module marked a significant improvement, particularly in terms of n-gram matching (BLEU scores) and fluency (METEOR score), indicating its effectiveness in enhancing the cross-modal feature fusion process and facilitating the generation of more coherent and accurate medical reports.
Furthermore, the subsequent addition of the FRFA module built upon the improvements achieved with the ACFF module, leading to further enhancements in performance across most metrics. Notably, on the MIMIC-CXR dataset, the FRFA module contributed to reversing the slight decline in ROUGE-L score observed with the ACFF module alone, suggesting its role in improving recall-oriented aspects of the generated reports. The FRFA module’s fine-grained alignment of regional features likely helps in capturing more nuanced differences between images and their corresponding reports, thereby enhancing the semantic consistency and completeness of the generated medical reports. Overall, the combined effect of the ACFF and FRFA modules results in a robust and effective framework for medical report generation that outperforms the baseline model and demonstrates the importance of specialized modules in addressing the unique challenges posed by this task.
5.3. Parameter Analysis
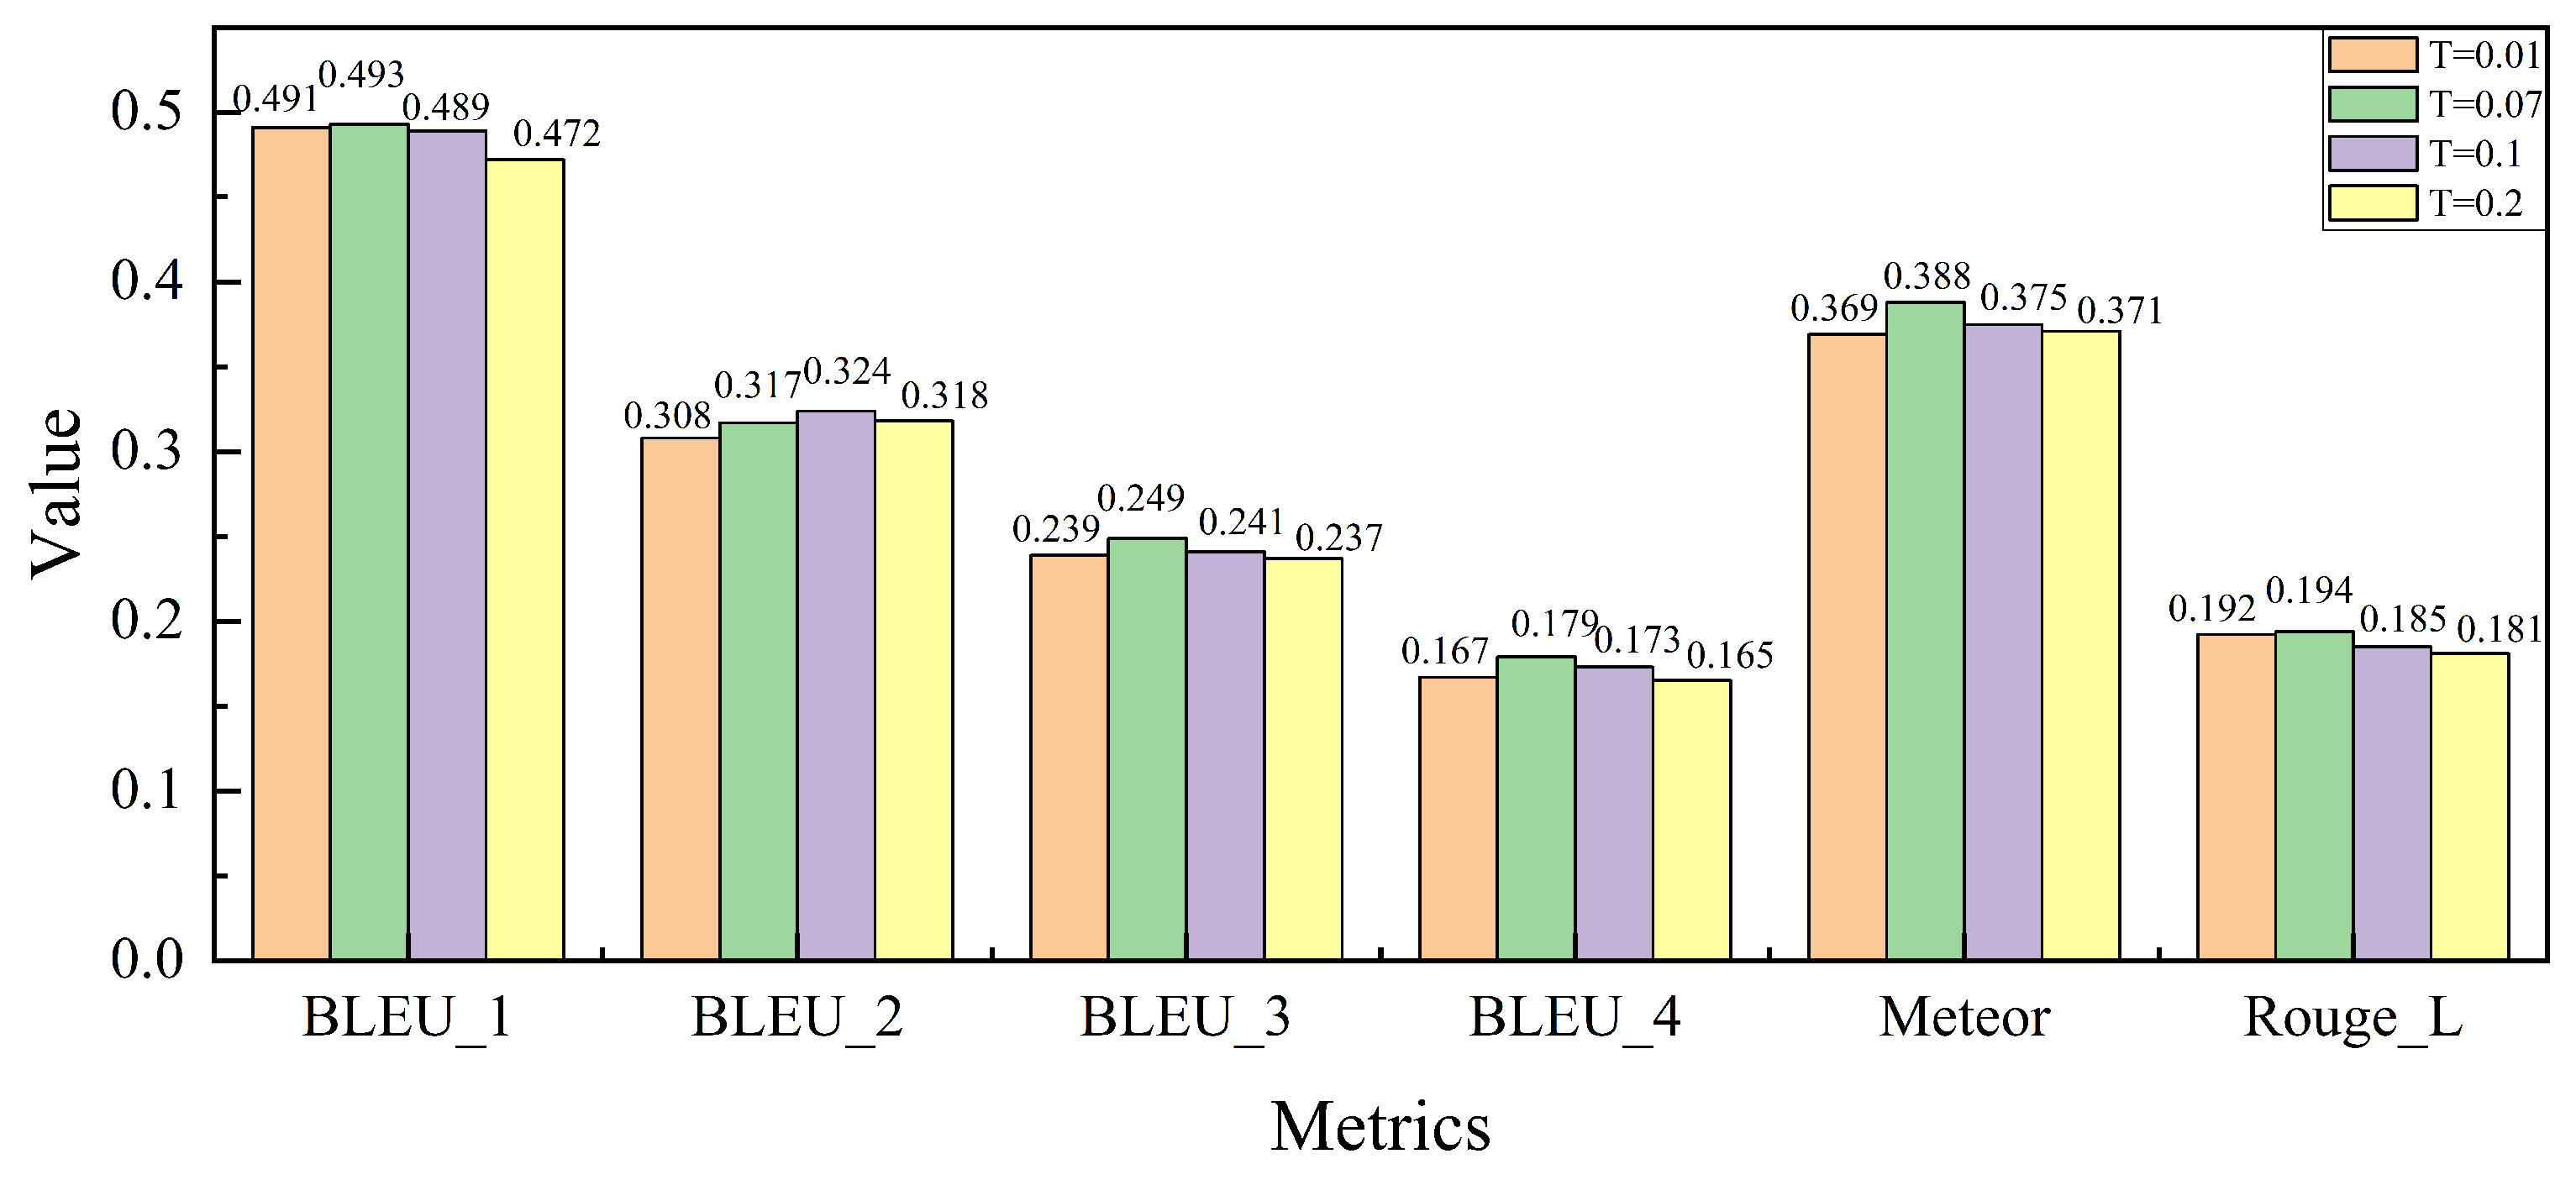
As shown in
Figure 7, we analyze the impact of the temperature coefficient
T, which influences the sharpness of the similarity distribution during the cross-modal contrastive loss calculation in the FRFA module. The temperature coefficient
T plays a critical role in balancing the image–text alignment during training. By varying
T across different values, we examine its effect on model performance.
As observed, the model’s performance improves across several evaluation metrics as T increases from 0.01 to 0.07. This trend aligns with the settings used in pre-trained CLIP models, where has been shown to provide a good balance between precision and recall. However, when T is further increased beyond 0.07, the performance begins to degrade. This decline can be attributed to the model’s tendency to over-relax the similarity criteria, resulting in less accurate alignment of fine-grained image–text features. Specifically, overly large values of T cause the model to match a broader set of image–text pairs, including irrelevant ones, which reduces the overall precision. Based on these results, we conclude that is the optimal value for maintaining effective cross-modal feature alignment while ensuring robust performance in the medical report generation task.
5.4. Qualitative Experiments
To qualitatively assess the effectiveness of our ACFF module, we visualized a representative example from the test set of the MIMIC-CXR dataset, as seen in
Figure 8. This figure illustrates the heatmap showing the alignment between the visual features encoded by the ACFF module and the words in the generated report. The first column presents the data pair, consisting of the image and the ground-truth report. The upper part of the second column contains the heatmap generated by the encoder of the BASE model, along with the report generated by the BASE model, while the lower part displays the heatmap of the feature map output by the ACFF module and the report generated by the ADCNet method. In the heatmap, the color range from blue to red represents the attention weights, with blue indicating low attention and red indicating high attention. This highlights the degree of correspondence between the visual regions in the image and the words in the report.
By comparing the two generated reports with the original report, we observe that the ADCNet method correctly identifies the presence of “atelectasis” in the image and accurately determines that “pneumothorax” is absent. In contrast, the BASE model misidentifies the lesion as “pleural effusion”. Moreover, the heatmap of the BASE model fails to align correctly with the key visual regions. For instance, the area corresponding to the word “lung” is noticeably misaligned, with most of the highlighted regions appearing at the lower part of the image, suggesting that the BASE model struggles to distinguish between relevant visual features. On the other hand, the heatmap generated by the ACFF module provides a more accurate alignment. For example, the locations corresponding to words like “right lung” and “pleural effusion” are correctly identified, demonstrating that the ACFF module improves visual-semantic alignment.
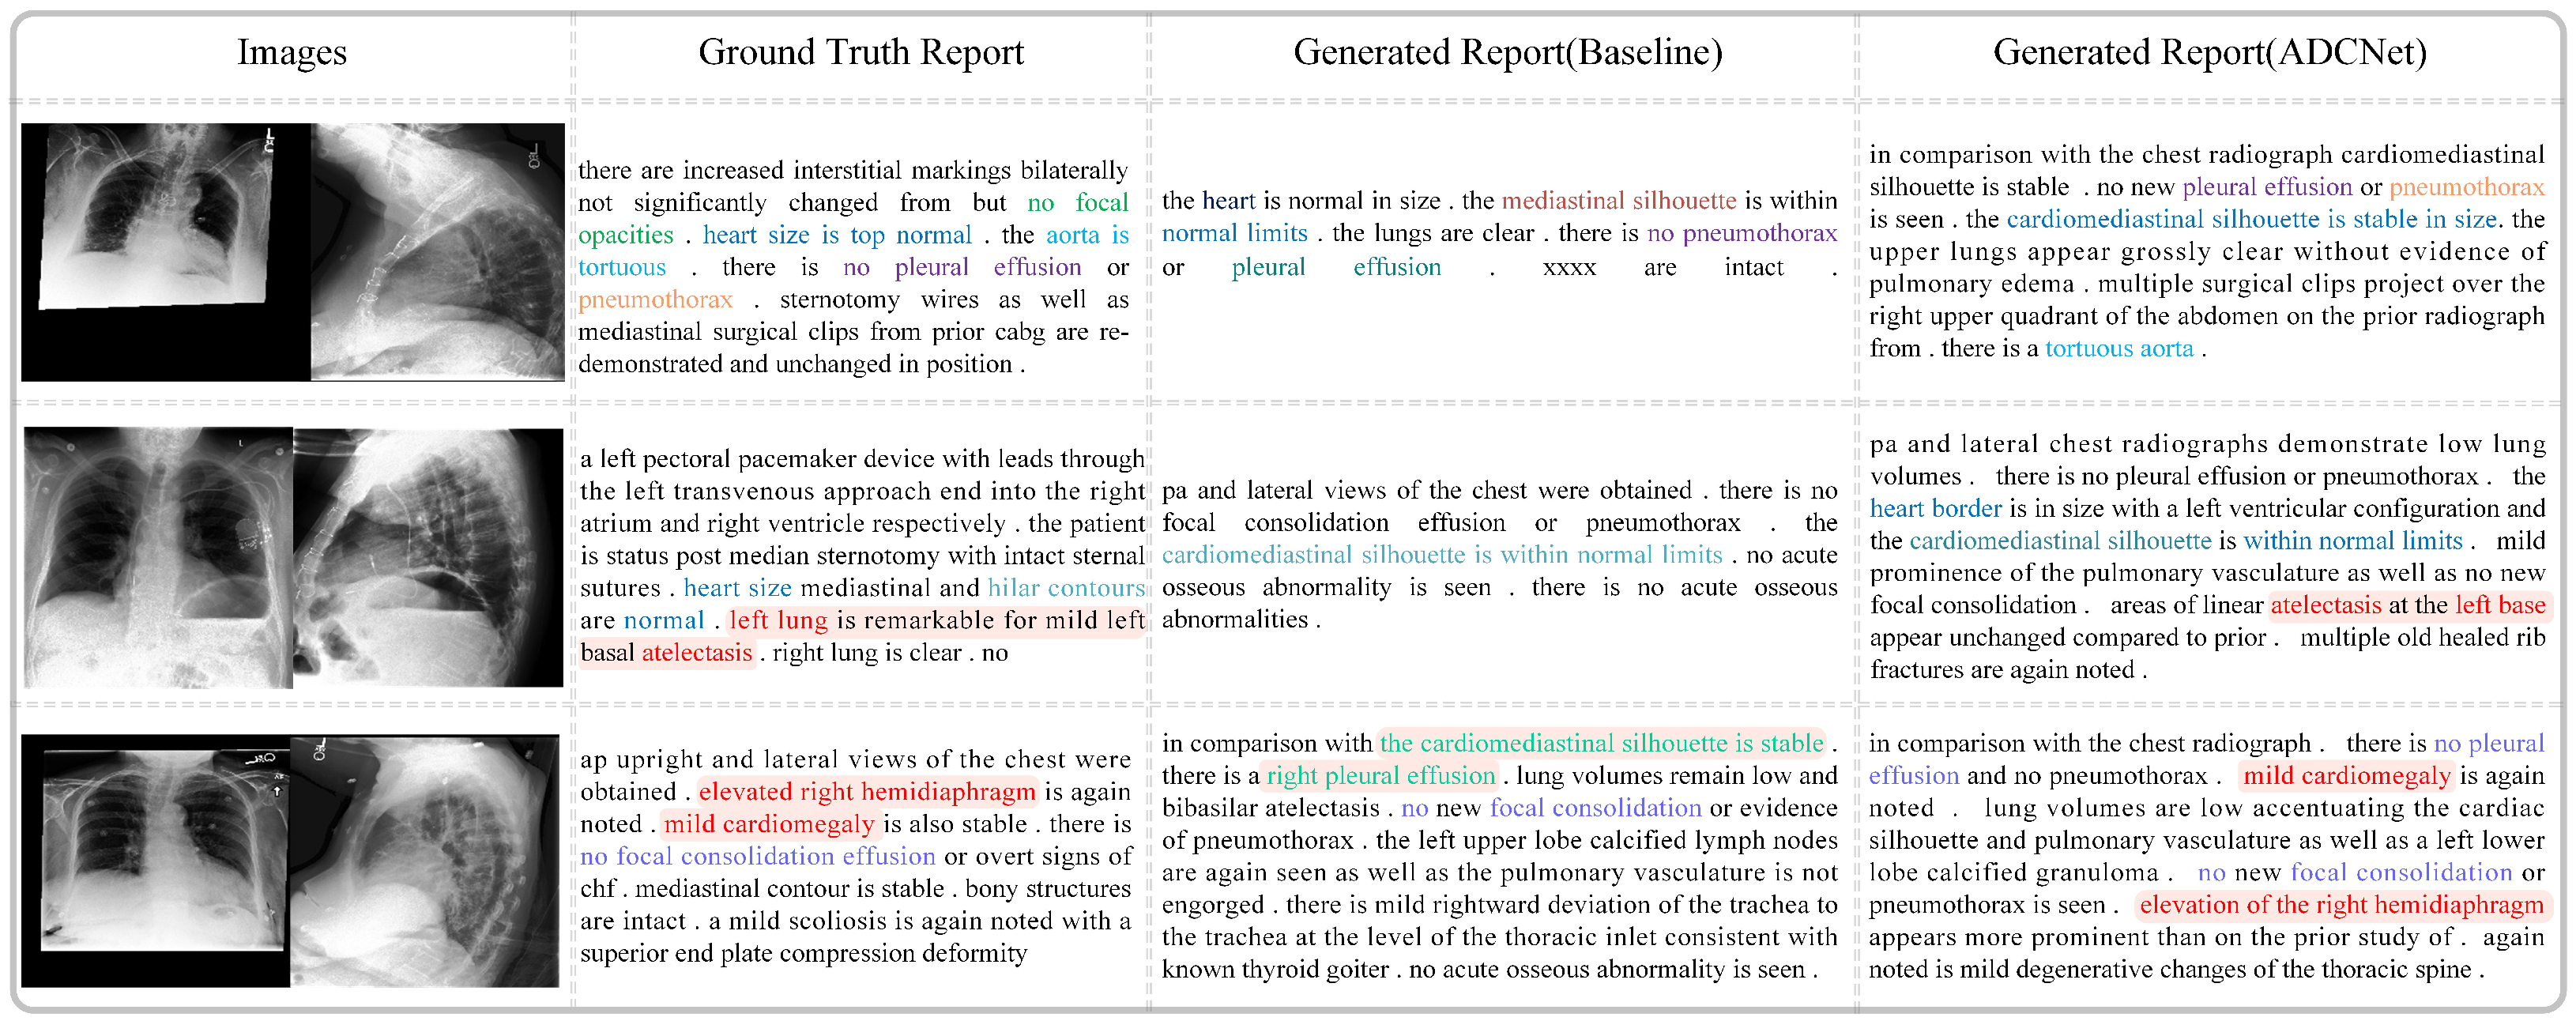
Figure 9 compares the real medical reports with those generated by the baseline model and our proposed method, ADCNet. As shown, the reports generated by ADCNet exhibit greater similarity to the real reports in terms of length, structure, and fluency. For example, in the first case, the sentences generated by the baseline model contain incomprehensible semantics, such as ’xxxx,’ which makes them difficult to understand. In contrast, ADCNet describes the image content in a more coherent and fluid manner. Moreover, ADCNet provides more comprehensive descriptions of lesions. For instance, in the second row, ADCNet accurately identifies “atelectasis”, which the baseline model fails to detect. Additionally, ADCNet demonstrates higher semantic consistency with the real reports. It not only detects the presence of diseases but also offers more precise and complete descriptions of normal conditions and anatomical structures. In the third row, the real report mentions “hemidiaphragm” and “cardiomegaly”. ADCNet successfully identifies both abnormalities and accurately describes their location and severity, correctly noting “right” and “mild”. In contrast, the baseline model fails to detect these conditions and incorrectly identifies “pleural effusion” on the right side. These results show that ADCNet significantly outperforms the baseline model in both accuracy and detail, improving the overall quality and reliability of the medical reports generated.


