Abstract
The impedance of renewable energy stations is crucial for determining system stability. Typically, the impedance is obtained using a measurement method. However, in actual operation, background harmonics at the point of common coupling (PCC) affect the accuracy of the impedance measurement results, which could cause unstable analysis results. Therefore, this paper first analyzes the impact of background harmonics at the PCC on impedance measurement. Then, a novel impedance measurement method, based on the adaptive adjustment coefficient, is proposed. In addition, the design process for the coefficient is presented. By adaptively adjusting the amplitude of the injected perturbation using this coefficient, the proposed measurement method mitigates the effect of background harmonics on the impedance measurement. Finally, simulation results are given to validate the effectiveness of the proposed method.
1. Introduction
With the development of renewable energy sources such as wind and solar power, a large number of power electronic converters are connected to the power grid. Unlike traditional synchronous generators, power electronic converters have complex control structures, nonlinearities, and strong coupling characteristics, which can lead to instability problems [1,2,3]. The impedance analysis method has become a critical tool for assessing the risk of such problems [4,5]. This method evaluates system stability by determining whether the impedance ratio of the renewable energy station to the grid satisfies the Nyquist criterion [6,7]. However, in practical engineering applications, it is often challenging to obtain all the parameters of the new energy converter [8,9]. As a result, the impedance is difficult to determine using the theoretical modeling method.
The measurement method is an alternative approach that does not require knowledge of the control structure and parameters. It can be categorized into non-invasive and invasive techniques [10,11,12,13,14,15]. Non-invasive methods directly calculate the system impedance using the background harmonics in the system. In contrast, invasive methods require the addition of an external disturbance source, which injects the necessary disturbance into the system under test. The system impedance is then calculated by extracting the voltage or current response at the disturbance frequency. In terms of the disturbance injection method, injection techniques can be further classified into series of disturbance injection and parallel disturbance injection. Among these, parallel injection methods are more applicable in engineering practice due to their ease of integration into the operating system. This paper adopts the parallel current injection method for impedance measurement.
Although a large amount of literature focuses on broadband signals to realize impedance measurements, it is often difficult to obtain high-precision results in certain frequency bands due to signal amplitude attenuation. Ref. [16] developed a butterfly disturbance circuit to inject a Chirp disturbance signal into the system for converter impedance measurement. Although the amplitude of the disturbance signal is consistent across frequency bands, injecting multiple frequency disturbances simultaneously increases the risk of system instability in weak grids. A controllable sinusoidal disturbance signal is injected into the system via a DC/AC converter [17]. While this approach mitigates the risk of instability to some extent, its application is limited to low-voltage, small-capacity systems due to its topology. The cascaded H-bridge has also been used to inject disturbances into the system [18]. It reveals the mechanism of DC-side voltage instability when the H-bridge output power is large. However, this method employs open-loop control to output the disturbance signal, which limits the ability to precisely control the disturbance.
Many scholars have currently researched the application of artificial intelligence in impedance measurement technologies. Ref. [19] utilizes the random pulse–width modulation (PWM) signals to generate the impedance data for training a recurrent neural network (RNN). With one injection of the perturbation into the system, the complete impedance of the system at wide frequencies can be predicted, reducing online testing time. Ref. [20] introduced an impedance model identification method for voltage-source inverters (VSI) at multiple operating points. This approach enables the identification of impedance at unmeasured operating points by using a small number of measurements at the selected operating points conducted using an artificial neural network (ANN). To reduce the number of training samples, Ref. [21] proposes a Support Vector Machines (SVM)-based impedance model (IM) prediction method, which can accurately predict the IM of inverters in the dq reference frame with only 18 operating points, in a small dataset for SVM training.
According to the above analysis, artificial-intelligence-driven methods for impedance measurement mainly focus on predicting the system’s impedance model with a small amount of measurement data. However, the impact of the background harmonics on the impedance measurement is not considered. Background harmonics can affect the impedance training data, which may introduce errors in the predicted impedance from AI.
Currently, there is little research that considers background harmonics when measuring impedance. When using impedance measurement devices to measure the impedance of wind farms, additional background harmonics are generated by grid-connected inverters, due to factors such as dead-time effects and modulation. The presence of background harmonics can introduce errors in the measurement results, leading to misjudgments in stability analysis. This paper addresses the errors introduced by the background harmonics in impedance measurement, while also considering the output power limitations of the actual disturbance injection device. The impedance measurement of the wind farm in the grid-connected system is conducted using the proposed method.
The main contributions in the paper are as follows: (1) the paper investigates the effect of background harmonics on the impedance measurement. The analysis results for the impact are also verified. (2) A novel impedance measurement method is proposed to mitigate the influence of background harmonics. By adjusting the disturbance current intensity, based on the amplitude of the background harmonics, the accuracy of the impedance measurement is improved. The correctness and effectiveness of the proposed method are validated through the simulation measurement results.
2. Impedance Measurement Device for Current Disturbance
2.1. Measurement Object and Disturbance Injection Unit
Figure 1 shows the basic structure of a direct-drive wind farm grid-connected system, which primarily consists of the direct-drive wind farm, line impedance, grid impedance, and ideal grid. Multiple direct-drive wind turbines are connected in parallel to form the direct-drive wind farm, which is connected to a 66 kV ideal grid through the grid impedance and line impedance.
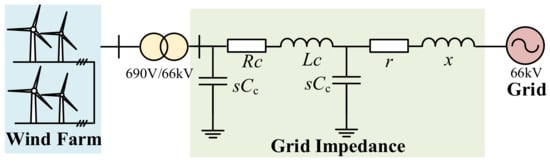
Figure 1.
The structure of the direct-drive wind farm grid-connected system.
Impedance measurement of the wind farm needs to be implemented using an impedance measurement system. The impedance measurement system consists of three main components: the current disturbance injection device, the signal analysis unit, and the industrial control computer. The core of the system is the current disturbance injection circuit. Figure 2 illustrates the overall structure of the impedance measurement device.
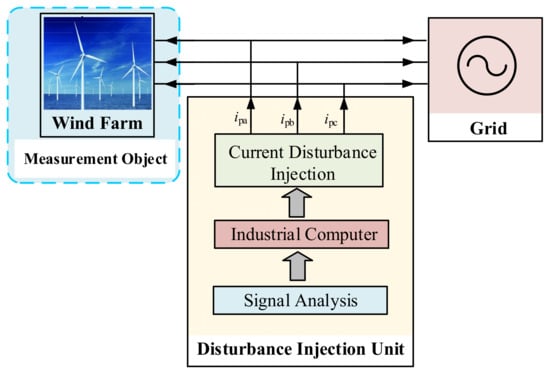
Figure 2.
The structure of the impedance measurement system.
Given the high voltage and the large capacity of the system under the impedance measurement in this paper, the disturbance injection circuit is implemented using a cascaded H-bridge configuration. Additionally, the H-bridge power module unit is chosen for its ease of installation and debugging, modular design, scalability, and support for redundant operations.
2.2. Control Strategy of the Disturbance Injection Unit
The control objectives of the disturbance injection device are two-fold: (1) it needs to allow the frequency of the output current of the disturbance injection unit to be adjustable within the range of 10 Hz to 1 kHz. (2) it needs to ensure that the amplitude of the output sine waveforms can be precisely controlled. The control strategy of the H-bridge cascade converter usually includes PI control, no beat control, a PR controller and a quasi-PR controller.
Figure 3 shows the circuit structure diagram of the cascaded H-bridge disturbance injection unit. Each phase bridge arm is composed of submodules (SM) in a series. Each SM contains a DC-side power support capacitor Cdc and four switching devices. SM can exchange energy with the grid, through the control strategy, to ensure the stability of the DC-side voltage, without an additional power supply to the DC-side. L and Cf represent the filter inductance and capacitance, respectively. The current, after the filtering, flows into the renewable energy system. ipa, ipb and ipc are the three-phase disturbance currents injected into the system by the disturbance circuit. The device is built in Matlab/Simulink (version R2022b), based on the topology shown in Figure 3.
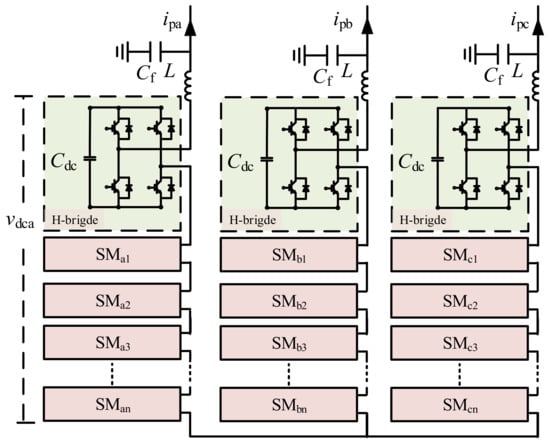
Figure 3.
The circuit diagram of the disturbance injection unit.
This paper adopts quasi-PR control to achieve the desired objective. Figure 4 presents the overall control block diagram of the disturbance injection circuit, which includes global voltage control, in-phase voltage balancing, and disturbance current control.
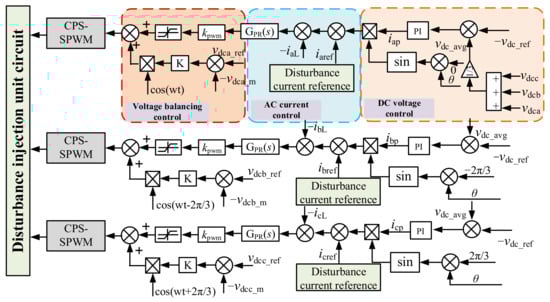
Figure 4.
The control strategy of the disturbance injection unit.
Figure 4 shows the two components of voltage control: DC voltage control and voltage balancing control, which can control the DC side voltage balance of the bridge arm from the global and inter-phase perspectives step by step. In the DC voltage control loop, vdca, vdcb and vdcc are the sum of the equivalent capacitor voltages of each phase of the three-phase bridge arm in the disturbance injection part model, that is, the single-phase DC-side capacitor voltage. vdc_ref is the sum of the single-phase DC-side capacitor voltage given value. After comparison, the current iap is obtained by PI control, and then multiplied by the corresponding sine. In the voltage balancing control, vdca_m represents the capacitor voltage in phase a, and vdca_ref represents the reference value of the capacitor voltage. In phase a, as an example, the voltage control amount in the phase is finally obtained by comparing the actual value with the reference value and adjusting the ratio K.
The AC current control is the core of the current disturbance output circuit. Quasi-PR control is adopted, which can achieve a high gain of the transfer function and reduce the influence of frequency offset on the output result. The specific transfer function is shown in (1). Taking ia as an example, the perturbation current reference value iaref is compared with the DC voltage control output value, and the GPR(s) is the output after comparing with the sampling current signal iaL.
Kp is the proportional coefficient of quasi-PR control, ω0 is the resonant frequency, Ki is the integral coefficient of PR control, ωc is the resonant bandwidth.
2.3. Process of Perturbation Injection
The basic principle of impedance measurement involves injecting a small disturbance current signal of a specific frequency into the grid. Then, it extracts the corresponding disturbance response signal at the measurement node. By applying Ohm’s law, the relationship between the voltage and the current is established, which allows for the calculation of the system’s impedance parameters at the disturbance frequency. Subsequently, the impedance characteristics across the measurement frequency range are obtained, and the impedance characteristic curve is then plotted.
In this paper, a cascaded H-bridge disturbance injection unit is parallelly connected to the wind farm connected-grid system at the PCC point. The disturbance injection unit is used to inject the required disturbance current into the system. In the AC current control loop, the amplitude instruction Ip and frequency instruction fper are provided. Figure 5. shows the output current of the disturbance injection unit. Figure 5a shows the output current of 50 A with ia perturbation frequency of 500 Hz, while Figure 5b shows the output current of 100 A with the same perturbation frequency. The current output results show that the designed disturbance injection unit is usable.
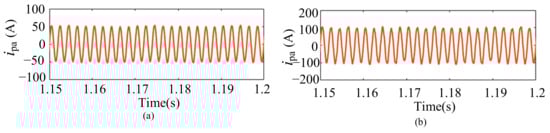
Figure 5.
The output current of the disturbance injection unit (a) 50 A (b) 100 A.
3. The Effect of Background Harmonic on Measurement and Its Simulation Analysis
3.1. Analysis of the Effect of Background Harmonic on Measurement
The direct-drive wind farm system often contains a large number of background harmonics at a high frequency. The effects of the background harmonics on the amplitude and the phase angle of measurement are analyzed. Moreover, to illustrate the analysis results, impedance measurements of the wind farm, without considering this influence, are presented and compared with the analytical model.
The direct-drive wind turbine consists primarily of a grid-side converter (GSC) and a machine-side converter (MSC). The MSC controls the active power output from the motor, adjusting the motor speed to achieve maximum power tracking. The GSC is responsible for controlling the power output to the grid while maintaining DC voltage stability. Due to the significantly larger timescale of speed control and DC voltage regulation, compared to the harmonic voltage dynamics, the focus of the subsequent research is on the impact of the grid-side converter on the harmonics of wind farms. The background harmonics in the grid-side inverter of the direct-drive wind turbine are primarily generated by the modulation process and the dead time in the upper and lower switching arms. Furthermore, to prevent short-circuit faults caused by simultaneous conduction of the upper and lower bridge arms, an additional dead time is introduced in the triggering signal. The presence of dead-time results is a deviation between the output voltage and the command voltage, which generates harmonic voltages.
When the disturbance current ip with the frequency of fper is injected at the PCC point, the response voltage of the same frequency at the PCC point is measure and, denoted as upcch, which includes the disturbance voltage response and the background harmonics. Figure 6. shows the equivalent circuit diagram of the grid-connected wind farm when the background harmonics are ignored.
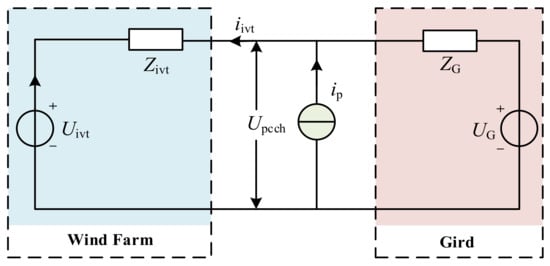
Figure 6.
The equivalent circuit for the impedance measurement of the wind farm.
In Figure 6, ip is the current injected during the impedance measurement and iinv is the current flowing into the wind farm. The impedance of the direct-drive wind farm at the frequency is:
However, the measurement method ignores the background harmonics existing in the grid-connected system. According to the analysis, there are background harmonics generated by the dead zone and the modulation. Therefore, the system equivalent of the grid-connected circuit changes, and is shown in Figure 7, when the background harmonics exist. Uch is the equivalent voltage source of the system with background harmonic. The existence of background harmonics cannot be ignored when measuring the impedance of the wind farm, as shown in Figure 7. The actual impedance of wind farms can be expressed as:
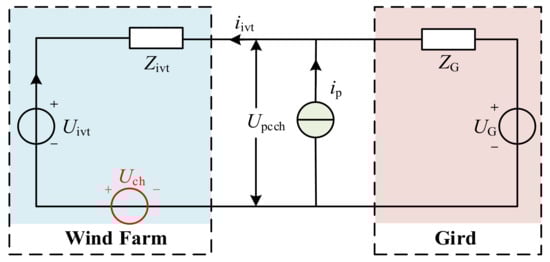
Figure 7.
Equivalent circuit diagram of impedance measurement considering background harmonics in wind farms.
3.2. Simulation Verification of the Effect of Background Harmonic on Measurement
The influence of the harmonic voltage on the impedance measurement is verified by the electromagnetic transient simulation platform built in MATLAB, including the wind farm and the disturbance injection unit.
Case 1: The number of wind turbines is set to 50, and the equivalent DC transmission power of a single wind turbine is 2 MW. At this time, the system short-circuit ratio (SCR) is 4.24. The specific parameters are shown in Table 1.

Table 1.
System Symbols and Values.
The background harmonic voltage amplitude at PCC point of the wind farm is measured. Figure 8 shows that the background harmonic amplitude is large, at 350 Hz, 550 Hz, 650 Hz, and 950 Hz.
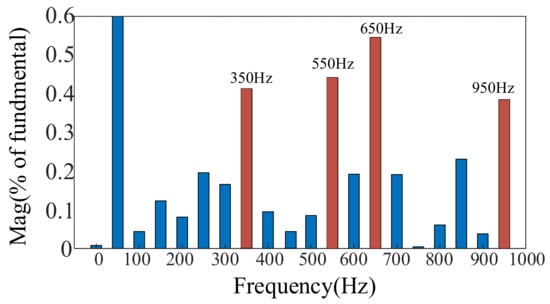
Figure 8.
Case1: FFT analysis results of direct-drive wind farm at SCR = 4.24.
The amplitude of the perturbation current, such as the 4% of the fundamental wave, is injected into the wind farm to measure its impedance characteristics. Figure 9 shows the measurement results and the theoretical model. The theoretical model, obtained through the modeling process, with known parameters, is used to evaluate the accuracy of the impedance measurement results.
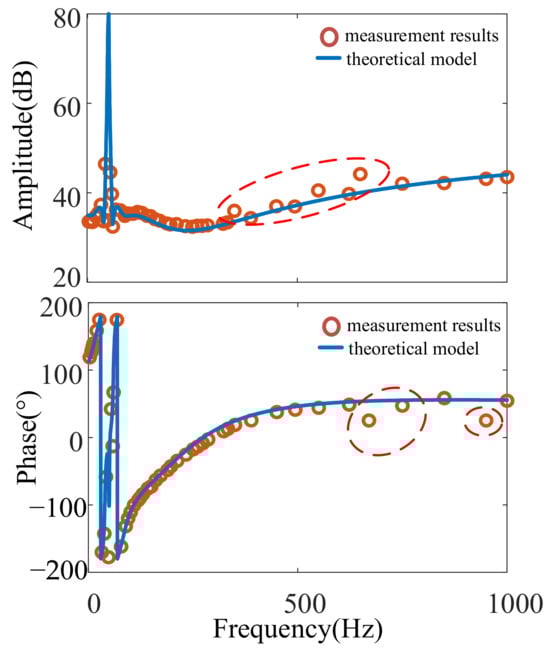
Figure 9.
Case1: direct-drive wind farm impedance measurement results at SCR = 4.24 before optimization.
Figure 9 shows that, when measuring 350 Hz, 550 Hz, and 650 Hz, the measured amplitude has a large deviation from the theoretical calculation value. At 650 Hz and 950 Hz, the measured phase angle also shows deviation, which illustrates the influence of background harmonics.
4. Adaptive Measurement Method
When injecting the disturbance, its’ amplitude current is generally 1% to 10% of the fundamental current; meanwhile, the same current amplitude is used for measurements throughout the frequency band. However, based on the previous section, it is noted that, when the same small amplitude of the disturbance current is used for an impedance measurement, if the background harmonic is too high, the accuracy of the impedance measurement of the wind farm, at some frequency point, will be affected.
In this article, the adaptive measurement method for measuring amplitude of impedance is proposed. The input is the background harmonic voltage amplitude of the measurement point, and the output is the reference value of the output current amplitude of the current disturbance injection unit. According to the amplitude of the background harmonic voltage at PCC, the magnitude of the injected disturbance current is adjusted.
The flow chart considering the disturbance injection strategy of the background harmonic voltage is shown in Figure 10. Firstly, the frequency required for the measurement is determined, and then the background harmonic voltage of the measurement point is read. In practical engineering, the background harmonic voltage can be monitored by the power quality detector. In this paper, the background harmonic voltage is divided into two sections, according to the K percentage of the background harmonic voltage to the fundamental wave. When K ≤ 0.2%, the perturbation injection current is still measured by a small amplitude IL, where the small amplitude IL is the fundamental current of 2%. At this time, the measurement results still have a high accuracy. When K > 0.2%, the small amplitude disturbance cannot meet the accuracy required for the measurement. It is necessary to adjust the disturbance injection amplitude to obtain accurate measurement results. The specific formula of the amplitude of the disturbance injection current is as follows:
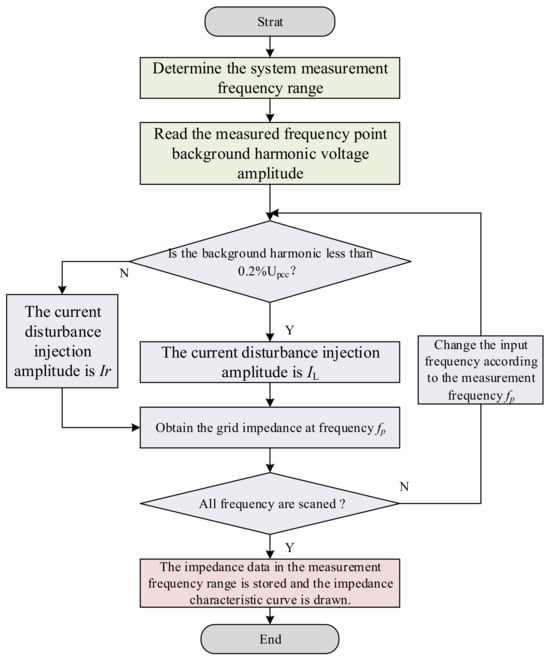
Figure 10.
Flow chart of impedance measurement under background harmonics.
In the formula, UPCC is the grid-connected voltage point of the system, and Uch is the corresponding background harmonic voltage.
When the K value, corresponding to the background harmonic voltage, is less than 0.2%, the adaptive measurement method does not work, and the disturbance amplitude is a small amplitude IL, unchanged. When the corresponding K of the background harmonic voltage is greater than 0.2%, it is necessary to superimpose a variable current Δi on a small amplitude, to correct the amplitude of the disturbance injection current, to obtain Ir, see Formulas (6) and (7).
Da is the adaptive adjustment coefficient. By adjusting the amplitude of the disturbance injection current, a small current IL is injected when the background harmonic is small, which can reduce the power consumption of the disturbance injection device. When the background harmonic is large, the adaptive method is used to adjust the injection amplitude to achieve an accurate measurement of the system impedance.
In order to make the amplitude adaptive strategy work, it is also necessary to select the adaptive adjustment coefficient Da reasonably. Firstly, (8) can be obtained from Formulas (6) and (7).
Ir is the amplitude of the disturbance current injected by the impedance measurement device. In a steady state, the impedance measuring device will generate the corresponding frequency disturbance voltage Upcch at the grid-connected point of the inverter after injecting the disturbance current with a frequency of fp. It can be seen from the previous analysis that when the impedance measurement is performed, it will be affected by background harmonics, and Upcch will affect the measurement accuracy because its value is too small. If the adaptive disturbance injection strategy works at this time, the voltage response generated by increasing the amplitude of the injected disturbance current is one order of magnitude greater than the background harmonic voltage, that is, the voltage amplitude should be 10 times the background harmonic voltage amplitude. It can be considered that the background harmonic voltage generated by the renewable energy system can be ignored. That is, the relationship between injected disturbance current Ir, voltage response Upcch and the measured impedance Zivt is:
To bring (9) into (8):
It can be seen from (11) that the value range of Da is determined by Upcch, Zivt and IL. Among them, Zivt is the inherent characteristic of the renewable energy system to be tested, which is an uncontrollable quantity in the adaptive strategy. The perturbation-current small amplitude IL is a known constant. The measurement frequency point fp, Zivt is a constant, and the value range of Da is only related to Upcch. Next, the range of values is discussed.
The Upcch needs to be satisfied so that the background harmonic voltage can be ignored and is generally less than 10% of the fundamental voltage amplitude:
Through Formulas (11) and (12), the Da value of the background harmonic voltage amplitude Uch at a certain frequency point can be obtained:
In order to ensure that the measurement accuracy of the impedance measurement process in the whole frequency band meets the requirements, it is necessary to extract the amplitude and frequency of the background harmonic voltage of the measurement point by FFT to obtain its amplitude range:
Through Formulas (13) and (14) it is possible to obtain:
In the formula, Zivt is still a variable. In the measurement stage, in order to ensure that the adaptive strategy plays its role in the whole process, it is necessary to ensure that Da still meets the requirements under any Zivt:
Among them, Zivt.max is the maximum impedance value that can be measured by the impedance measuring device. Combined with the accuracy Ai of the current sensor, it can be found that:
In the formula, Upcch.max is the upper limit of the response disturbance voltage. In order to ensure the validity of the guaranteed Formula (15), in the full frequency impedance measurement process, it is necessary to ensure the effectiveness of the method when the maximum impedance of the measurement system is measured.
It can be understood from (19) that when Zivt is the maximum value, P can obtain the value D. Therefore, it can be ensured that Da meets the requirements during the whole impedance measurement range, and the current disturbance adaptive strategy can play a role.
5. Verification
In order to verify this new impedance measurement method, the wind farm grid-connected system is simulated on MATLAB/Simulink platform. The detailed parameters of the wind farm are shown in Table 1.
By injecting the current disturbance obtained by the adaptive method and measuring the disturbance voltage, the measured values of the impedance amplitude and phase angle are obtained and compared with the theoretical values. Figure 11 shows measurement results and the theoretical model. It can be observed from Figure 11 that adopting the method can accurately get the amplitude and phase angle of impedance, which verifies the effectiveness of the adaptive measurement method.
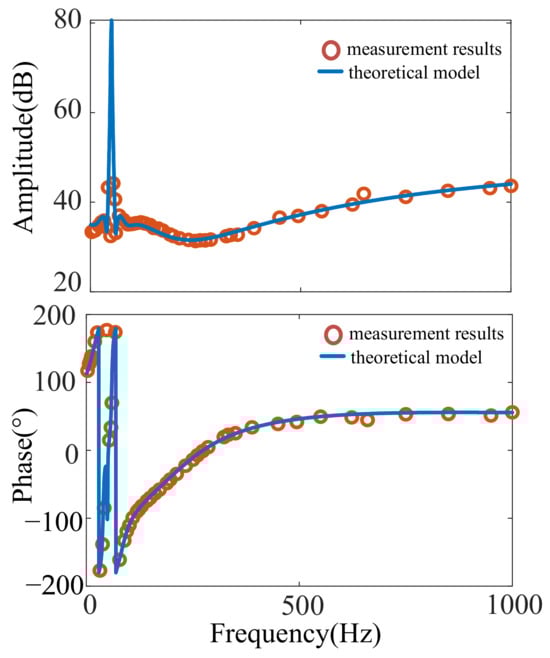
Figure 11.
Case1: direct-drive wind farm impedance measurement results at SCR = 4.24 after optimization.
In addition, when the operating conditions of the grid-connected system change, the background harmonics of the system will also change. In Case 2, the SCR of the system is 3.22, and the background harmonics of the PCC point are measured. Figure 12 shows the measurement results.
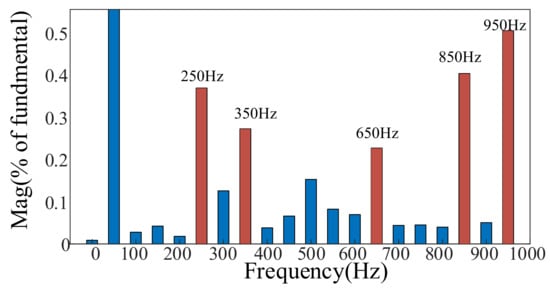
Figure 12.
Case2: FFT analysis results of direct-drive wind farm at SCR = 3.22.
It can be seen from the measurement results of the PCC background harmonics in Case 2 that the background harmonic amplitudes of 250 Hz, 350 Hz, 650 Hz, 850 Hz and 950 Hz are larger.
The impedance measurement in Case 2 is carried out, and the disturbance current signal amplitude is 4% of the fundamental wave. Figure 13 shows the measurement results and theoretical mode.
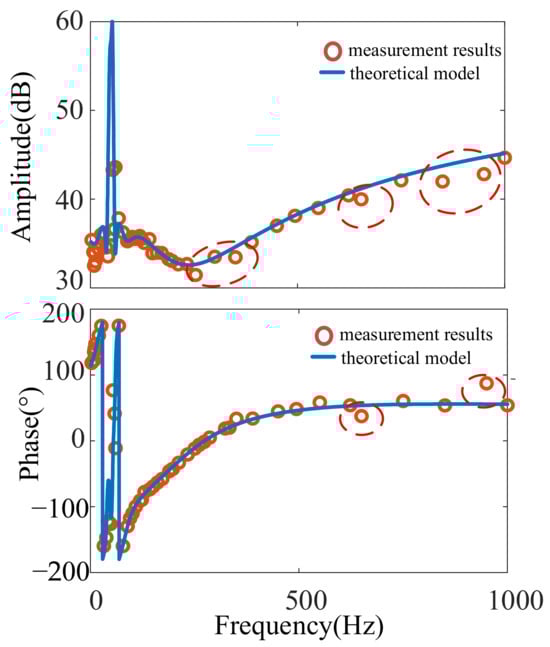
Figure 13.
Case2: direct-drive wind farm impedance measurement results at SCR = 3.22 before optimization.
From Figure 13, it can be seen that when measuring 250 Hz, 350 Hz, 650 Hz and 950 Hz, the measured amplitude deviates from the theoretical calculation value, and at the 650 Hz and 950 Hz frequency bands, the measured phase angle also shows a certain degree of deviation.
Figure 14 shows the measured values of the impedance amplitude and phase angle by adopting the proposed measurement method. Figure 14 illustrates that the method can accurately obtain the amplitude and the phase angle of impedance, and verify the applicability of the adaptive measurement method.
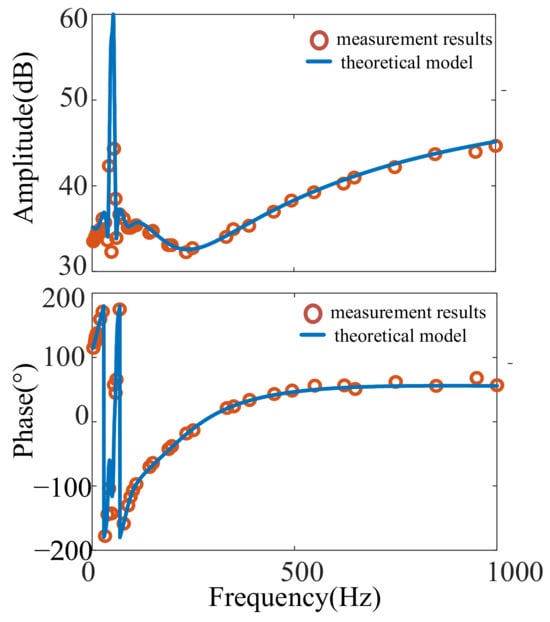
Figure 14.
Case2: direct-drive wind farm impedance measurement results at SCR = 3.22 after optimization.
6. Conclusions
Impedance is crucial for the stability analysis of wind farm grid-connected systems. Perturbation current injection is a commonly used method for the impedance measurement. However, the background harmonic system is often ignored. This article analyzes the impact of the background harmonic at the PCC on the impedance measurement. Then, a novel adaptive measurement method, based on the adaptive adjustment coefficient, is proposed, which can mitigate the impact of background harmonics on the impedance measurement. By using the proposed method, the accuracy of the impedance measurement is improved. Simulation results have demonstrated that the impedance measurement results of the direct-drive wind farm are improved in different working conditions, proving the effectiveness of the proposed method. However, in practical engineering, there are other factors affecting the impedance measurement results, such as the changes in grid impedance and the limiters in the inverter control loop. These factors may be interdependent, and this interaction was not considered in this paper. Future research can incorporate more influencing factors to provide a more comprehensive analysis.
Author Contributions
Conceptualization, Z.W.; Formal analysis, T.X.; Funding acquisition, X.D. and J.L.; Methodology, T.X. and J.L.; Resources, T.X., Z.W. and J.L.; Supervision, X.D.; Writing—original draft, T.X.; Writing—review and editing, T.X., Z.W., X.D. and J.L. All authors have read and agreed to the published version of the manuscript.
Funding
This work was jointly supported by the National Nature Science Foundation of China (No. 51937001 and No. 52307192) and Chongqing Natural Science Foundation (No. CSTB2024NSCQ-MSX0254).
Data Availability Statement
The data are available on request from the corresponding author upon reasonable request.
Conflicts of Interest
The authors declare no conflicts of interest.
References
- Sun, J. Impedance-based stability criterion for grid-connected inverters. IEEE Trans. Power Electron. 2011, 11, 3075–3078. [Google Scholar] [CrossRef]
- Liu, J.; Du, X.; Zhao, Y. A Novel Control Strategy for Enhancing System Stability in Weak Grids by Mitigating Additional Disturbance Components from PLL. IEEE Trans. Sustain. Energy 2024, 35, 02793. [Google Scholar] [CrossRef]
- Zhang, J.; Shen, H.; Du, X.; Chen, R. Condition Monitoring the Inhomogeneous Thermal Fatigue of Multichip IGBT Module Based on the Thermal Attenuation Coefficient. IEEE Trans. Power Electron. 2025, 11, 2114–2125. [Google Scholar] [CrossRef]
- Liu, J.; Du, X.; Shi, Y.; Tai, H.-M. A new impedance measurement method and its application to stability analysis of the inverter-grid system. IET Renew. Power Gener. 2021, 15, 73–85. [Google Scholar] [CrossRef]
- Zou, X.; Du, X.; Wang, G.; Tai, H.-M. Single stationary domain equivalent inverter admittance for three-phase grid-inverter system considering the interaction between grid and inverter. IET Power Electron. 2019, 12, 1593–1602. [Google Scholar] [CrossRef]
- Liu, J.; Du, X.; Shi, Y.; Tai, H.-M. Impedance measurement of three-Phase inverter in the stationary frame using frequency response analyzer. IEEE Trans. Power Electron. 2020, 35, 9390–9401. [Google Scholar] [CrossRef]
- Shi, Y.; Sun, Y.; Liu, J.; Du, X. Model and stability analysis of grid-connected PV system considering the variation of solar irradiance and cell temperature. Int. J. Electr. Power Energy Syst. 2021, 132, 107155. [Google Scholar] [CrossRef]
- Zou, X.; Du, X.; Tai, H.M. Two-variable admittance model for D-PMSG-based wind turbine and stability criterion based on magnitude and phase contour plot. IEEE Trans. Power Electron. 2020, 35, 1484–1498. [Google Scholar] [CrossRef]
- Mi, Y.; Cai, H.; Song, Y.; Li, Z. Study on reactive power sharing of island microgrid based on synchronous compensatio. Trans. China Electrotech. Soc. 2019, 34, 1934–1943. [Google Scholar]
- Gurumurthy, S.; Uhl, R.; Pitz, M.; Ponci, F.; Monti, A. Non-invasive wideband-frequency grid impedance measurement device. In Proceedings of the 2019 IEEE 10th International Workshop on Applied Measurements for Power Systems, Aachen, Germany, 25–27 September 2019; pp. 1–6. [Google Scholar]
- Perez-Estevez, D.; Dovalgandoy, J. Grid impedance identification using the VSC switching ripple. In Proceedings of the 2019 IEEE Energy Conversion Congress and Exposition, Baltimore, MD, USA, 29 September–3 October 2019; pp. 1506–1513. [Google Scholar]
- Fang, J.; Deng, H.; Goetzo, S. Grid impedance estimation through grid-forming power converters. IEEE Trans. Power Electron. 2021, 36, 2094–2104. [Google Scholar] [CrossRef]
- Nian, H.; Li, M.; Chen, L.; Xu, Y.; Hu, B. Measurement method for broadband frequency coupling characteristics of grid-con- nected inverter using multi-sine signal injection. Proc. CSEE 2020, 40, 7408–7420. [Google Scholar]
- Yue, X.; Zhuo, F.; Zhang, Z. Segmented binary tree method for power electronic system impedance measurement. Trans. China Electrotech. Soc. 2015, 30, 76–83. [Google Scholar]
- Liu, Z.; Cvetkovic, I.; Shen, Z.; Boroyevich, D.; Burgos, R.; Liu, J. Imbalance mechanism and balancing control of DC voltages in a transformerless series injector based on paralleled H-bridge converters for AC impedance measurement. IEEE Trans. Power Electron. 2019, 34, 8175–8189. [Google Scholar] [CrossRef]
- Hou, L.; Zhuo, F.; Shi, H.; Zhang, D. New Techniques for Measuring Impedance Characteristics of an Islanded Microgrid Based on Stability Analysis. Trans. China Electrotech. Soc. 2015, 30, 153–162. [Google Scholar]
- Yang, W.; Ma, J.; Sun, R.; Wang, S.; Zhao, J.; Liu, T. Adaptive current source intrusive sequence impedance measurement based on disturbance voltage orientation. Electr. Power Autom. Equip. 2022, 42, 122–128. [Google Scholar]
- Wu, W.; Pu, T.; Chen, Y.; Luo, A.; Zhou, L.; Zhou, X.; Yang, L.; He, Z. Design and control method of megawatt broadband impedance measuring device. Chin. J. Electr. Eng. 2018, 38, 4096–4106. [Google Scholar]
- Peng, X.; Ganesh, K.; Kumar, A.; Jing, H. Recurrent Neural Networks Based Impedance Measurement Technique for Power Electronic Systems. IEEE Trans. Power Electron. 2010, 25, 382–390. [Google Scholar]
- Meng, Z.; Xiao, W.; Dong, Y.; Mads, C. Artificial Neural Network Based Identification of Multi-Operating-Point Impedance Model. IEEE Trans. Power Electron. 2021, 36, 1231–1235. [Google Scholar]
- Nabil, M.; Wei, Z.; Behrooz, B.; David, H. Support Vector Machines for Predicting the Impedance Model of Inverter-Based Resources. IEEE Trans. Power Syst. 2024, 39, 7359–7375. [Google Scholar]
Disclaimer/Publisher’s Note: The statements, opinions and data contained in all publications are solely those of the individual author(s) and contributor(s) and not of MDPI and/or the editor(s). MDPI and/or the editor(s) disclaim responsibility for any injury to people or property resulting from any ideas, methods, instructions or products referred to in the content. |
© 2025 by the authors. Licensee MDPI, Basel, Switzerland. This article is an open access article distributed under the terms and conditions of the Creative Commons Attribution (CC BY) license (https://creativecommons.org/licenses/by/4.0/).