Abstract
The intelligent fault detection of power plant equipment in industrial settings often grapples with challenges such as insufficient real-time performance and interference from complex backgrounds. To address these issues, this paper proposes an image recognition and classification model based on the VMamba architecture. At the core of our feature extraction module, we have improved and optimized the two-dimensional state space (SS2D) algorithm to replace the traditional convolution operation. Rooted in State-Space Models (SSMs), the SS2D module possesses a global receptive field by design, enabling it to effectively capture long-range dependencies and establish comprehensive contextual relationships between local and global features. Crucially, unlike the self-attention mechanism in Vision Transformers (ViT) that suffers from quadratic computational complexity, VMamba achieves this global modeling with linear complexity, significantly enhancing computational efficiency. Furthermore, we employ an enhanced PAN-FPN multi-scale feature fusion strategy integrated with the Squeeze-and-Excitation (SE) attention mechanism. This combination optimizes the spatial distribution of feature representations through channel-wise attention weighting, facilitating the effective integration of cross-level spatial features and the suppression of background noise. This study thus presents a solution for industrial equipment fault diagnosis that achieves a superior balance between high accuracy and low latency.
1. Introduction
Power equipment constitutes a critical infrastructure underpinning a nation’s economic and social development. Most of this equipment is required to operate continuously, making it not only prone to failures but also susceptible to cascading effects, such as regional blackouts and substantial economic losses, once a fault occurs. As the core of modern energy systems, the reliability of power equipment is inextricably linked to the lifeline of the national economy and the stability of social security. Within this context, surge arresters play a vital role in ensuring grid reliability and operational safety [1]. As key protective devices, arresters suppress lightning and switching overvoltages to prevent insulation breakdown of critical equipment and related cascade failures. Failure to detect anomalies in their operational status in a timely manner can lead to a series of faults and potential hazards, potentially resulting in severe equipment damage and even regional grid paralysis.
Traditional methods for arrester fault diagnosis, including manual inspection, contact sensor monitoring (e.g., total current method, third harmonic method), and offline testing, are fraught with limitations. Manual inspections are inefficient and subjective [2]; contact sensors incur high deployment costs and are difficult to deploy for full-time, comprehensive monitoring due to fixed installation points and sampling frequency constraints; offline tests fail to capture the real-time dynamic characteristics of equipment [3].
With the advancement of non-contact detection technologies, deep learning-based fault diagnosis methods using infrared image analysis have garnered significant attention. By interpreting equipment status through thermal radiation characteristics, this approach offers non-invasiveness and remote operability, presenting a novel path for intelligent power equipment maintenance. However, inherent characteristics of infrared images—such as low contrast, thermal diffusion effects, and complex background interference—pose significant challenges to accurate recognition. In response, researchers have explored various deep learning models. For instance, Ullah I and colleagues proposed a defect recognition method for high-voltage equipment based on deep learning, achieving a mean Average Precision (mAP) of 0.92 but at the cost of high latency [4]. Liu C et al. adopted an MTI-YOLO network for target detection, yet the average accuracy remained at 89.7% [5]. Meanwhile, Liu Zhiwei et al. proposed an arrester early-warning model using LSTM and random forest algorithms, which can predict future status based on historical parameters to prevent faults from long-term degradation but is incapable of addressing real-time, sudden faults [6].
The limitations of existing models are primarily rooted in their architectural foundations. Traditional Convolutional Neural Networks (CNNs) are inherently limited by their local receptive fields, struggling to model global contextual relationships, which is crucial for distinguishing fault features from complex backgrounds. While Vision Transformers (ViTs) overcome this by leveraging self-attention for global modeling, this mechanism introduces quadratic computational complexity with respect to image size. This leads to exorbitant memory usage and compromised inference speed when processing high-resolution infrared images [7], hindering their application in real-time scenarios.
To overcome the aforementioned challenges, this study introduces the VMamba network architecture, which innovatively synergizes the computational efficiency of CNNs with the global perceptual capabilities of ViTs [8]. The core innovation of VMamba lies in its use of State-Space Models (SSMs) and a bidirectional scanning mechanism. SSMs are renowned for their proficiency in handling long-sequence dependencies with linear complexity. The SS2D module in VMamba extends this capability to 2D images by employing a cross-scanning strategy that traverses the feature map from four different directions. This process effectively flattens the 2D spatial data into sequences while preserving contextual information from multiple orientations, thereby establishing global feature dependencies without the computational burden of self-attention. This design effectively alleviates the conflict between the limited receptive field of CNNs and the high computational load of ViTs. Consequently, VMamba demonstrates superior capability in addressing specific challenges in power equipment infrared imaging. Experiments confirm that this architecture maintains the real-time processing advantages of CNNs while significantly enhancing the modeling of global correlations among fault features, offering a novel and efficient technical pathway for the intelligent fault diagnosis of power equipment.
2. The Overall Structure of the Network Model
The proposed model adopts a Mamba network as its backbone to extract fundamental features from input images. Figure 1 shows the complete structure of the model, including the entire process from input feature extraction, feature enhancement to task processing.
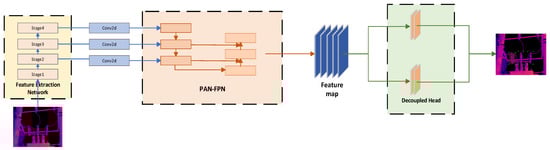
Figure 1.
The overall structure of the network model.
Compared to traditional convolutional neural networks (CNNs), the Mamba network demonstrates superior capability in modeling global image information. Moreover, it circumvents the exponential computational complexity growth typical of Transformer architectures when processing complex inputs. This design achieves a balance between comprehensive feature representation and computational efficiency, thereby meeting the requirements for real-time monitoring applications.
Following feature extraction, a dedicated feature enhancement module is incorporated to filter out interference and accentuate discriminative features, ultimately improving model accuracy. This module integrates a PAN-FPN multi-scale fusion strategy augmented with a Squeeze-and-Excitation (SE) attention mechanism. The PAN-FPN structure facilitates effective multi-scale feature aggregation, while the SE mechanism enhances spatial information integration through its unique adaptive feature recalibration capability. Finally, a decoupled head module is employed to separately perform object classification and bounding box regression tasks, further refining detection performance.
2.1. Feature Extraction Module
First, the input infrared image (with original resolutions of 640 × 480 or 1024 × 768, uniformly adjusted to 640 × 640 to balance detection accuracy and computational efficiency) is processed by the stem module. As shown in Figure 2, this module partitions the image into non-overlapping 4 × 4 patches and maps them to a 2D feature map with a spatial dimension of (where ), followed by an initial linear embedding layer to adjust the feature channel dimension to a preset value . This step reduces spatial redundancy while retaining core temperature distribution information, laying the foundation for subsequent multi-scale feature processing.
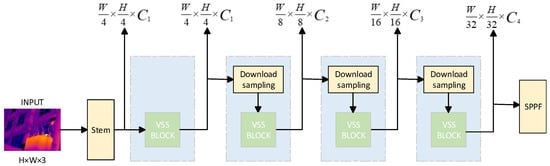
Figure 2.
Multi-scale feature extraction.
On the basis of the initial feature map, three consecutive VMamba network stages are employed to construct hierarchical feature representations with decreasing resolutions, directly supporting the Feature Pyramid Network (FPN) mechanism in the subsequent feature enhancement module. The first stage processes the initial feature map using two Visual State Space (VSS) blocks and one patch merging layer, outputting a feature map with a resolution of and a doubled channel dimension (2C)—this stage focuses on capturing shallow features such as the edge contours of arresters and surface temperature textures. The second stage continues processing the feature map with the same VSS + patch merging structure, generating a feature map (4C channels) that mainly extracts intermediate features like component-level temperature distribution patterns (e.g., temperature gradients between different sections of multi-section arresters). The third stage further downsamples the feature map to (8C channels) through VSS blocks and patch merging, constructing global feature representations that reflect the overall operational state of arresters (e.g., overall overheating trends or abnormal temperature concentration areas). This hierarchical design is tailored to the scale diversity of arrester fault features: shallow stages preserve fine details to identify minute hotspots (such as 10–20 pixel faults caused by loose connections), while deep stages model global context to detect large-area overheating (such as insulator aging covering hundreds of pixels).
To address the limitations of the original VMamba’s State-Space 2D (SS2D) module in adapting to industrial infrared image tasks—including insufficient sensitivity to localized temperature anomalies and lack of physical interpretability—this study enhances the SS2D mechanism by integrating multi-modal temperature features and equipment physical priors. Specifically, a gradient computation module based on the Sobel operator is introduced to extract temperature gradient fields in the X and Y directions of the infrared image, generating a gradient magnitude channel that characterizes abrupt temperature changes (e.g., clear boundaries between fault hotspots and normal areas) to supplement the SS2D module’s ability to capture local anomaly edges. Meanwhile, based on the “People’s Republic of China Electric Power Industry Standard: Application Specification for Infrared Diagnosis of Live Equipment” [9], two-level temperature thresholds are established (warning threshold °C), alarm threshold °C), and corresponding binary mask channels are generated (1 for pixels exceeding the threshold, 0 otherwise) to feed into the SS2D module as physical constraint signals. Additionally, the original SS2D’s fixed four-directional scanning is optimized to prioritize scanning along the “fault-sensitive direction” (determined by the maximum temperature gradient direction): for example, vertical scanning is prioritized for vertical temperature differences caused by insulator aging, while 45° diagonal scanning is used for local hotspots from loose connections—this reduces redundant background scanning and improves the efficiency of fault feature capture.
The enhanced SS2D module ultimately outputs a multi-channel feature tensor that integrates raw temperature data, gradient magnitude information, and temperature threshold masks. This design not only retains the original SS2D’s advantage of linear-complexity global feature modeling (with an overall computational complexity of , where is the batch size and is the feature dimension) but also enhances the physical interpretability and anomaly sensitivity of features, providing robust feature support for the subsequent feature enhancement module to further suppress background noise and integrate cross-scale information.
It should be particularly noted that the core function of the feature extraction module is to construct a hierarchical multi-scale feature representation by initially screening effective information related to faults (such as temperature gradients, edge contours, and global overheating trends), while suppressing irrelevant low-level noise. The multi-scale feature map it outputs will serve as the input basis for the subsequent feature enhancement module, which will further achieve cross-level feature fusion and targeted noise suppression.
2.2. Feature Enhancement Module
As a subsequent step of the feature extraction module, the feature enhancement module focuses on addressing the limitations of single-scale feature representation and the interference of residual background. Although the feature extraction module has completed the hierarchical feature construction from shallow to deep and the preliminary screening of fault information, there is still a lack of effective information interaction among features of different scales, and complex background noise still remains in the feature map. To this end, this module achieves the two core goals of “cross-scale feature integration” and “background noise suppression” by integrating pyramid feature fusion technology with the SE attention mechanism, and forms a complementary collaborative process of “feature construction—feature optimization” with the feature extraction module.
Pyramid feature fusion technology resolves the contradiction between feature location accuracy and semantic understanding depth through a two-way interaction path from top to bottom and bottom to top [10]. In infrared image analysis, this architecture organically combines the abstract semantic features learned by deep networks (such as fault mode category information) with the fine-grained spatial features captured by shallow networks (such as temperature gradients and device edges) through lateral connections and cross-scale information transmission: The bottom-up path retains the local temperature gradient and edge profile of the device, while the top-down path provides semantic guidance on the global device structure and failure modes. After integrating the SE attention mechanism, the module adaptively adjusts and optimizes the feature spatial distribution through channel weights, further suppressing complex background noise (such as other equipment in the substation and environmental interference), and enhancing the feature response in the fault area.
2.3. Comparison with the Same Type of SSM Visual Models
The core rationale for selecting VMamba over other SSM variants—such as Mamba-UNet, VMAMBA-YOLO, MambaVision, and S4Vision—lies in its architectural design being highly aligned with the core requirements of infrared fault detection for arresters.
From the perspective of architectural features, VMamba incorporates a four-directional cross-scanning SS2D module embedded throughout all network stages. This design enables more comprehensive modeling of correlations between global and local features in infrared images, which is a critical advantage over comparative models.
Compared to Mamba-UNet and MambaVision, VMamba’s four-directional scanning is uniquely sensitive to temperature gradients in infrared images. Arrester fault features typically exhibit distinct gradient variations across multiple directions. The multi-directional scanning of VMamba captures these critical gradient features completely, whereas the unidirectional scanning of Mamba-UNet and MambaVision often misses gradient information in non-scanning directions—leading to incomplete extraction of fault features. Compared to S4Vision, which focuses on the theoretical generalization of SSMs in visual tasks, VMamba further optimizes the SS2D module for the specific characteristics of infrared data. S4Vision employs a generic spatial modeling strategy that lacks targeted adaptation to infrared image properties; in contrast, this study enhances VMamba’s SS2D module by integrating temperature gradient features and physical threshold constraints, making it more compatible with the data characteristics of arrester infrared fault detection. Additionally, S4Vision exhibits higher computational complexity in multi-scale feature processing, which fails to meet the real-time requirements of industrial monitoring.Compared to VMAMBA-YOLO, which prioritizes lightweight design and speed, VMamba not only retains comparable efficiency but also compensates for VMAMBA-YOLO’s insufficient detection capability for minor faults. By integrating the FPN-PAN multi-scale feature fusion and SE attention mechanism, VMamba can accurately distinguish between normal and faulty arresters even in complex substation backgrounds.
Furthermore, VMamba does not rely on additional encoder–decoder structures or anchor box adaptation mechanisms. It directly balances detection accuracy and computational efficiency through native multi-scale feature extraction and global feature modeling. In contrast, Mamba-UNet suffers from poor real-time performance due to its unidirectional scanning and encoder–decoder overhead; VMAMBA-YOLO has limited multi-scale expression; MambaVision incompletely captures fault features due to unidirectional scanning; S4Vision exhibits poor adaptability to infrared image characteristics.
All these limitations make the aforementioned models less suitable for arrester infrared fault detection than VMamba.
As indicated in Table 1, while Mamba-UNet’s encoder–decoder structure can model global features, its unidirectional scanning limits multi-scale capture ability, and its real-time performance fails to meet industrial monitoring needs. Although VMamba-YOLO is lightweight (8.9G FLOPs), its simplified feature interaction leads to low detection rates for minor faults (e.g., 10–20-pixel hotspots). MambaVision and S4Vision suffer from incomplete fault feature capture and poor infrared scenario adaptability, respectively. In contrast, VMamba—through four-directional cross-scanning, multi-stage feature extraction, and SE attention enhancement—not only addresses the real-time limitations of Mamba-UNet and the accuracy deficiencies of VMamba-YOLO but also overcomes the shortcomings of MambaVision and S4Vision in feature capture and scenario adaptation. Its architectural design is highly matched to the core requirements of arrester infrared fault detection, making it the optimal choice.

Table 1.
Horizontal Comparison of Mainstream SSM Visual Models.
3. Experiment
The computer configuration used for training in this study is: Intel i7-12700K processor, produced in Jiangsu, China, and MSI NVIDIA GeForce RTX 3090 graphics card. The operating system used is Ubuntu 18.04, built on the deep learning framework PyTorch 2.1.1 and accelerated by NVIDIA CUDA 12.1.
3.1. Dataset
The dataset used in this study includes 200 images of surge arresters. Since multiple surge arresters are often present in one image and both normal and faulty ones tend to coexist, it is roughly estimated that the samples in normal operation account for 60% of the dataset, while the faulty samples account for 40%. The original resolutions are 640 × 480 (104 frames, accounting for 52%) and 1024 × 768 (96 frames, accounting for 48%), respectively. Although the sizes of the input images are not uniform, we will resize the images once before they enter the model, changing them to 640 × 640 that is compatible with the model. The dataset was collected from an indoor laboratory (80 pieces, accounting for 40%) and an outdoor substation (120 pieces, accounting for 60%) under different lighting conditions (normal light: 144 pieces, accounting for 72%; weak light: 32 pieces, accounting for 16%; Strong light: 24 images, accounting for 12%. However, it should be noted that since the images used are infrared images, they are not affected by environmental lighting conditions. Through the size adjustment function of the model, all images are uniformly adjusted to 640 × 640, enabling the model to adapt to various input sizes in practical applications. However, if the size is too small, it may reduce the detection accuracy. All images were labeled with object bounding boxes using labelImg. The images were then labeled and divided into a training set (120 images), a validation set (20 images), and a test set (60 images) in a ratio of 6:1:3.
The two major features of this dataset directly determine the model input design and are highly aligned with the input specifications of the feature extraction module (Section 2.1): Firstly, resolution diversity—due to the different models of infrared cameras, the collected images mainly include two resolutions: 640 × 480 and 1024 × 768, which match the flexibility requirements of the feature extraction module for the input resolution. Secondly, the difference in fault scale—the fault features cover the range from “10–20-pixel micro-hotspots to 100–200-pixel large-area overheating zone insulator aging”, which is completely in line with the “multi-scale feature capture” goal of the VMAMBA-based extraction module.
According to the “People’s Republic of China Electric Power Industry Standard: Application Specification for Infrared Diagnosis of Live Equipment,” the normal thermal characteristics of a surge arrester include slight overall heating. Typically, the warmer area is closer to the upper part and may be unevenly distributed. In multi-section arresters, the temperature should gradually decrease from the top to the bottom sections. Overall or localized overheating is considered abnormal [9]. As shown in Figure 3, the left half of the picture shows the high-temperature area in the middle caused by a fault. Compared with other parts, the temperature difference in this area is significant. The right half of the picture shows a normally working surge protector, with a relatively uniform surface temperature distribution.
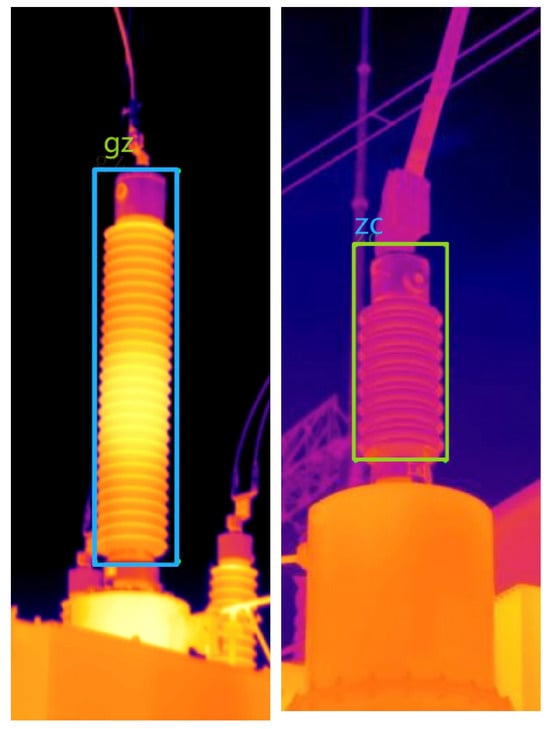
Figure 3.
Normally operating and overheated lightning arresters.
3.2. Evaluation Index
To evaluate the effectiveness of the model, this study adopts mean Average Precision (mAP) and Recall (R) as the evaluation criteria. Here, Average Precision refers to the proportion of correctly predicted positive samples among all samples predicted as positive by the model, indicating the fraction of true positive instances in the predicted positive set. This metric is calculated for each individual category, and its formula is as follows:
where represents the precision value, denotes the number of true positives, and indicates the number of false positives. The mean Average Precision (mAP) is defined as the average of precision values across multiple categories, serving as a comprehensive metric to evaluate the overall performance of the model:
Recall refers to the proportion of correctly identified positive samples among all actual positive samples:
where represents the recall rate, denotes the number of true positives, and indicates the number of false negatives [11].
3.3. Experimental Setup and Result Analysis
The training of the proposed model comprises two distinct phases: the frozen stage and the unfrozen stage. During the frozen stage, the parameters of the feature extraction module remain fixed while only fine-tuning the remaining parts of the network. This approach significantly reduces the number of parameters requiring optimization, thereby accelerating the training process. In the subsequent unfrozen stage, all network parameters become trainable, which substantially increases computational load and reduces training speed. However, since most parameters except those in the feature extraction module have been pre-trained during the frozen phase, the primary parameter adjustments are concentrated in the feature extraction module, effectively mitigating the computational burden to some degree.
To enhance the model’s generalization capability, mosaic data augmentation is implemented. This technique randomly combines multiple images through scaling, cropping, and rearranging operations to form composite images, which improves the model’s detection performance for small objects and enables more efficient data utilization.
All images in the target detection dataset undergo standardized preprocessing with resolution adjusted to 640 × 640 pixels. The training strategy is configured with 100 total epochs, where the first 50 epochs employ a frozen backbone network with a batch size of 16. During the unfrozen training phase, the batch size is reduced to 8. To optimize training efficiency, the number of data loading workers is set to 10, while the initial learning rate is established at 0.01 using an SGD optimizer with a momentum of 0.937. Furthermore, an adaptive cosine annealing learning rate scheduling strategy is incorporated to dynamically adjust the learning rate throughout the training process.
Although the total number of training epochs was set to 100 in the experimental configuration, as shown in Figure 4, the loss values stabilized significantly around epoch 50, indicating that the model had effectively converged and the training process was essentially complete.
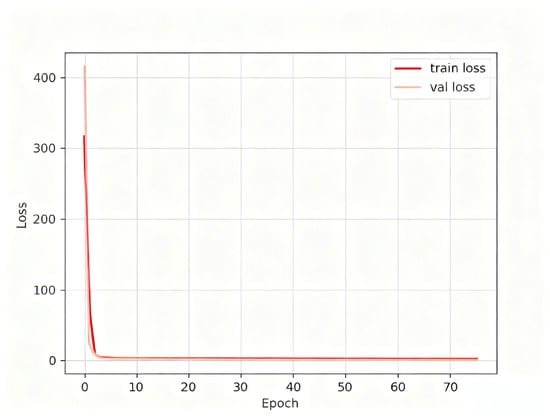
Figure 4.
Model training loss value.
Regarding model precision, the evaluation employs the accuracy rate and recall rate as previously defined. The score_threshold serves as a critical parameter: only when the confidence level of a predicted target exceeds this threshold is it classified as a true positive. Consequently, increasing the threshold enhances precision but simultaneously reduces recall, necessitating the selection of an appropriate threshold value to balance these two metrics.
For the two classification categories, as illustrated in Figure 5, the overall mean accuracy reached 95.41%. Specifically, the model achieved 96% accuracy for normally functioning targets and 94% accuracy for faulty targets. Figure 6 shows the fault identification results of the model for some images in the test set. The 0/1 beside the identification box represents the sequence of type labels, which correspond precisely to the faulty and normally operating lightning arresters.
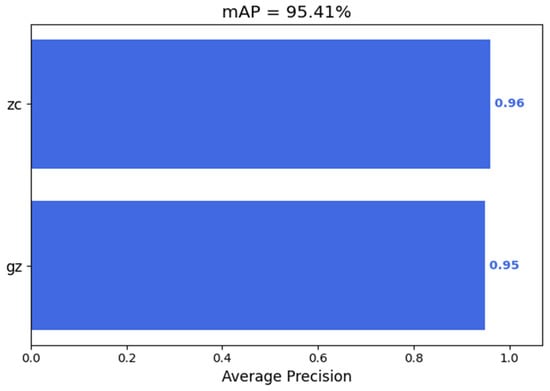
Figure 5.
Average accuracy rate of the model.
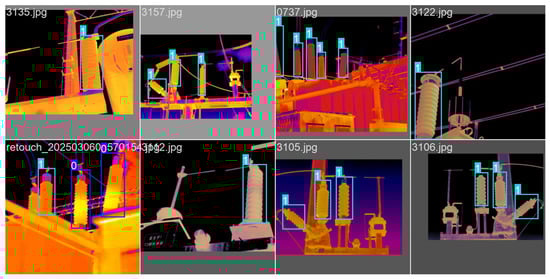
Figure 6.
Part of the recognition result graphics.
To validate the model’s performance, a comparative experiment was conducted using the same dataset tested on comparable models including YOLOv8 and YOLOv11. As summarized in Table 1, the proposed model achieved a mean Average Precision (mAP) of 95.41%, It outperforms the yolo series models in terms of recognition accuracy, but is lower than the network based on the transformer prototype. Although the Swin-Transformer achieved an accuracy rate of 98.1, there are significant computational cost and real-time performance defects behind its high precision. The core self-attention mechanism leads to a quadratic increase in computational complexity with the resolution of the input image, causing the floating-point operation volume (FLOPs) of the model to reach 8.8 G when processing 640 × 640 resolution images (as shown in Table 2). In industrial real-time monitoring scenarios, this high computational overhead directly leads to the inference being unable to meet the real-time response requirements of online monitoring of substation equipment (typically requiring ≥20 FPS). In addition, the high memory usage of the Swin-Transformer also increases the difficulty of edge deployment and makes it hard to adapt to the lightweight hardware environment of the substation site [12,13,14,15].
Table 2.
Comparison Results of Different Models.
In contrast, the model based on VMamba in this paper achieved a high mAP of 95.41% with a lightweight parameter count of 11.64 M and a FLOPs of 5.7 G, achieving a better balance between accuracy and efficiency. VMamba, through a linear complexity state space model (SSM) and a four-way cross-scanning mechanism, not only retains the global feature modeling capability but also avoids the secondary complexity of self-attention, making it more suitable for the real-time deployment requirements of industrial scenarios.
Furthermore, an ablation study was conducted to evaluate the contribution of individual components within the proposed model. The study involved systematically removing two key modules: the SPPF block and the SE attention mechanism. Experimental results demonstrate that removing the SPPF module led to a 0.98% decrease in accuracy, while eliminating the SE attention mechanism resulted in a more pronounced reduction of 1.07% in model performance. Professional technical education special skills training cases and training methods. Figure 7 shows the classification effect of the model under different parameters to select the optimal parameters.
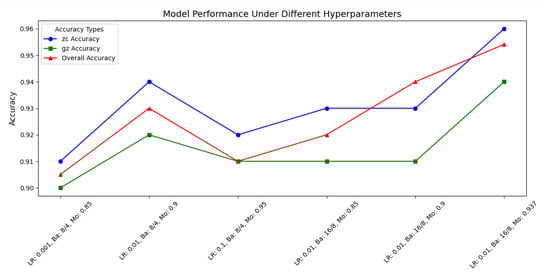
Figure 7.
Model performance under different hyperparameters.
To investigate the impact of hyperparameter variations on model performance and identify a set of optimized hyperparameters, this study designed a comparative experiment evaluating the accuracy of models trained with different hyperparameter configurations. The results, presented in Figure 7, demonstrate that as the learning rate, batch size, and momentum were adjusted, the model’s overall performance exhibited an initial increase followed by stable improvement.
When the learning rate was set at 0.001, batch size at 8/4, and momentum at 0.85, the overall accuracy reached only 0.905. As the learning rate increased to 0.01 and momentum was adjusted to 0.9, accuracy significantly improved to 0.93. However, when momentum further increased to 0.95, model performance slightly declined to 0.91. After increasing the batch size to 16/8, accuracy recovered and reached its peak of 0.9541 at a momentum of 0.937, with normal operation accuracy at 0.96 and fault detection accuracy at 0.94.
Table 3 shows the FLOPs of different models under the same size of image input. It can be clearly seen that the model in this paper has an advantage over other models such as transformer in terms of computational complexity.
Table 3.
Comparative experimental results of different algorithms [16,17,18].
Regarding the issue of computing speed, similar models were also used for comparison in the research. In this paper, FLOPs was selected as one of the measurement standards because FLOPs is a parameter that is not affected by the hardware environment and directly reflects the amount of computation required for model inference. By comparing FLOPs, the computational efficiency of each model can be objectively evaluated to a certain extent. In addition, our model can achieve a real-time detection requirement of 30 FPS by using an image size input of 320 × 320 on the detection device (The computer used for the test is equipped with an Intel Core i7-9750H processor, 8 GB RAM and an NVIDIA GeForce RTX 1650 graphics card produced by Gigabyte in Dongguan, China).
4. Conclusions
To address the need for rapid and accurate identification of surge arresters in substation environments using infrared images, this paper proposes a lightweight and efficient recognition method based on the VMamba architecture. Experimental results show that the proposed method achieves a detection accuracy of 95.41% on a self-built infrared dataset of surge arresters, while its computational FLOPs are significantly lower than those of comparable models. This ensures high precision while markedly improving detection efficiency, meeting the real-time monitoring requirements for substation equipment. Future work will focus on extending the approach to simultaneously identify and classify other substation equipment and their potential faults.
In addition, this study has some limitations. Firstly, it is difficult to collect the dataset. The number of pictures of normal operation is very sufficient, but the dataset of equipment failure operation is very scarce. Therefore, although the accuracy rate of the test is very high, in actual use, diverse and complex failure scenarios will greatly reduce the accuracy rate. Secondly, the infrared recognition model can only be used to issue an alarm when the equipment experiences severe overheating after a fault is detected. It is insufficient in providing early warnings for the initial stage of a fault. Finally, although vmamba has outperformed the transformer model in terms of computational complexity, it still requires a considerable amount of computation and has shortcomings when dealing with edge devices and the like. At the same time, this study only focused on balancing computational complexity and building a global perspective, and indeed did not consider the limitations of SSM in other aspects. In addition, although the accuracy rate of the model has reached a relatively high value, when we examine the cases of failed recognition, we find that such samples mostly come from certain situations where the overall surge arrester is slightly heated. At this time, the temperature of the surge arrester is close to the threshold edge and there is no obvious temperature difference. However, this often indicates that the surge arrester is about to malfunction, which is the optimal time for fault identification. It is hoped that these problems can be solved in future research.
In view of the limitations of the model in this paper, specific research will be carried out in the following three aspects in the future:
To address the scarcity of fault samples, a fault sample generation technology based on diffusion models is adopted, and real fault samples are constructed in combination with the physical characteristics of substation equipment. Introduce semi-supervised learning frameworks to enhance the model’s generalization ability for complex fault scenarios by leveraging a large number of unlabeled normal samples. Meanwhile, under the same hardware environment, the parameter and frame rate data of mainstream models such as YOLOv8, YOLOv11, Swin-Transformer, and MambaVision need to be supplemented in the future. Through a three-dimensional comparison of “precision—parameter—speed”, the industrial deployment value of this model has been verified.
Early fault warning and time series modeling: By integrating historical temperature monitoring data of equipment, a VMamba-TimeSeries hybrid model is constructed. Through time series feature modeling, the gradual temperature trend in the early stage of faults is captured, achieving an upgrade from “fault detection” to “early warning”. Introduce the weighted temporal features of the attention mechanism to enhance the timeliness of early warning.
Lightweight deployment optimization: In response to the deployment requirements of edge devices, model quantization and pruning techniques are adopted to compress the parameter quantity to less than 5 M and reduce FLOPs to less than 3 G. Combined with the TensorRT inference acceleration engine, real-time inference (≥30 FPS) on edge devices is achieved.
Author Contributions
Conceptualization, J.L. and Y.L. (Yueyue Liu); methodology, J.L.; software, L.L.; validation, L.L., J.L. and J.W.; formal analysis, J.L.; investigation, Y.L. (Yong Luo); resources, L.L.; data curation, J.W.; writing—original draft preparation, J.L.; writing—review and editing, L.L., Y.L. (Yueyue Liu) and J.L.; visualization, Y.L. (Yong Luo); supervision, J.L.; project administration, J.L.; funding acquisition, Y.L. (Yueyue Liu). All authors have read and agreed to the published version of the manuscript.
Funding
This research was funded by Science and Technology Project of State Grid Jiangsu Electric Power Co., Ltd. grant number J2024068.
Data Availability Statement
The original contributions presented in this study are included in the article material. Further inquiries can be directed to the corresponding author.
Conflicts of Interest
Authors Lin Lin, Jianan Wang and Yong Luo were employed by the company Nantong Power Supply Branch of State Grid Jiangsu Electric Power Co., Ltd. The remaining authors declare that the research was conducted in the absence of any commercial or financial relationships that could be construed as a potential conflict of interest.
References
- Beyane, B.M.; Dlamini, G.A.Z.; Bokoro, P.N. A Deep Learning Approach for the Detection of Surge Events in Metal Oxide Surge Arresters. In Proceedings of the 2025 33rd Southern African Universities Power Engineering Conference (SAUPEC), Pretoria, South Africa, 29–30 January 2025; pp. 1–5. [Google Scholar] [CrossRef]
- Murat, A.A.; Kiran, M.S. A comprehensive review on YOLO versions for object detection. Eng. Sci. Technol. Int. J. 2025, 70, 102161. [Google Scholar] [CrossRef]
- Dai, L.; Xu, T. Fault Diagnosis Analysis and Treatment of a 330 kV Zinc Oxide Arrester. Mech. Electr. Eng. Technol. 2023, 52, 172–176. [Google Scholar]
- Ullah, I.; Khan, R.U.; Yang, F. Deep Learning Image-Based Defect Detection in High Voltage Electrical Equipment. Energies 2020, 13, 392. [Google Scholar] [CrossRef]
- Liu, C.; Wu, Y.; Liu, J.; Han, J. MTI-YOLO: A Light-Weight and Real-Time Deep Neural Network for Insulator Detection in Complex Aerial Images. Energies 2021, 14, 1426. [Google Scholar] [CrossRef]
- Liu, Z.; Ning, K.; Liu, X. Arrester Fault Early Warning Algorithm Based on LSTM and Random Forest. Electron. Des. Eng. 2024, 32, 137–141. [Google Scholar]
- Wang, Y.; Lin, X.; Xiang, Z.; Su, W.-H. VM-YOLO: YOLO with VMamba for Strawberry Flowers Detection. Plants 2025, 14, 468. [Google Scholar] [CrossRef] [PubMed]
- Liu, Y.; Tian, Y.; Zhao, Y.; Yu, H.; Xie, L.; Wang, Y.; Ye, Q.; Liu, Y. VMamba: Visual state space model. arXiv 2024, arXiv:2401.10166. [Google Scholar]
- DL/T 664-2008; Application Specification for Infrared Diagnosis of Live Equipment. Industry Standard—Electric Power. Wuhan High Voltage Research Institute, State Grid: Wuhan, China; East China Grid Company Limited: Wuhan, China; East China Electric Power Test & Research Institute Co., Ltd.: Wuhan, China, 2008; p. 38.
- Liu, S.; Qi, L.; Qin, H.; Shi, J.; Jia, J. Path aggregation network for instance segmentation. In Proceedings of the IEEE Conference on Computer Vision and Pattern Recognition, Salt Lake City, UT, USA, 18–22 June 2018; pp. 8759–8768. [Google Scholar]
- Babichenko, Y.; Dean, O.; Tennenholtz, M. Incentive-Compatible Classification. Proc. AAAI Conf. Artif. Intell. 2020, 34, 7055–7062. [Google Scholar] [CrossRef]
- Qin, Y.; Yin, L.; Gao, X. Hot-Spot Fault Detection in Photovoltaic Module Infrared Images Based on HCF-YOLO. Acta Energiae Solaris Sin. 2024, 46, 285–294. [Google Scholar]
- Palazzetti, L.; Giannetti, D.; Verolino, A.; Grasso, D.A.; Pinotti, C.M.; Sorbelli, F.B. AntPi: A Raspberry Pi based edge–cloud system for real-time ant species detection using YOLO. Ecol. Inform. 2025, 91, 103383. [Google Scholar] [CrossRef]
- Madadum, H.; E Nasir, F.; Haruehansapong, K. Optimizing watermelon leaf disease detection using Sam-based augmentation with YOLO for practical agricultural solutions. Smart Agric. Technol. 2025, 12, 101326. [Google Scholar] [CrossRef]
- Gan, X.; Huang, L.; Yuan, Y.; Deng, Y. FAN-YOLO: Real-time driver behavior detection based on full-layer aggregation network of YOLO. J. Real-Time Image Process. 2025, 22, 139. [Google Scholar] [CrossRef]
- Su, C.; Luo, X.; Li, S.; Chen, L.; Wang, J. VMKLA-UNet: Vision Mamba with KAN linear attention U-Net. Sci. Rep. 2025, 15, 13258. [Google Scholar] [CrossRef] [PubMed]
- Yu, X.; Zhu, D.; Guo, H.; Zhou, C.; Elhassan, M.A.M.; Wang, M. DASNet: A Convolutional Neural Network with SE Attention Mechanism for ccRCC Tumor Grading. Interdiscip. Sci. Comput. Life Sci. 2025. [Google Scholar] [CrossRef] [PubMed]
- Lei, X.; Wu, S.; Wu, W.; Jiang, Z. MambaNeXt-YOLO: A Hybrid State Space Model for Real-time Object Detection. arXiv 2025, arXiv:2506.03654. [Google Scholar]
Disclaimer/Publisher’s Note: The statements, opinions and data contained in all publications are solely those of the individual author(s) and contributor(s) and not of MDPI and/or the editor(s). MDPI and/or the editor(s) disclaim responsibility for any injury to people or property resulting from any ideas, methods, instructions or products referred to in the content. |
© 2025 by the authors. Licensee MDPI, Basel, Switzerland. This article is an open access article distributed under the terms and conditions of the Creative Commons Attribution (CC BY) license (https://creativecommons.org/licenses/by/4.0/).