Article

Study on the Transient Temperature Evolution Characteristics of Three-Phase Co-Box Type GIS and Inversion Method for Busbar Temperature

1
State Grid Zhejiang Electric Power Co., Ltd. Research Institute, Hangzhou 310014, China
2
State Grid Zhejiang Electric Power Co., Ltd. Ningbo Power Supply Company, Ningbo 315000, China
3
Department of Electrical Engineering, Shanghai Jiao Tong University, Shanghai 200240, China
*
Author to whom correspondence should be addressed.
Electronics 2025, 14(23), 4606; https://doi.org/10.3390/electronics14234606
Submission received: 14 October 2025 / Revised: 15 November 2025 / Accepted: 20 November 2025 / Published: 24 November 2025

Abstract

The online diagnosis technology used to determine the internal thermal status and defects of GIS equipment is important. In the existing GIS bus thermal defect fault diagnosis methods, sensors are usually installed on the highest and lowest temperature areas of the enclosure surface, and then an artificial neural network is established to obtain the highest temperature inside the GIS. These methods only consider the temperature under steady-state conditions, and the temperature signals collected by sensors are different, which leads to low accuracy and weak generality. This paper investigated the transient temperature evolution characteristics defined as a sequence of temperature values over time, and adopted them as new features. The steady and transient enclosure and environment temperature data were used to train the Generalized Regression Neural Network (GRNN) for the inside busbar temperature inversion. Experimental tests proved that the proposed method has a higher accuracy compared to traditional characteristic parameters, especially for the less significant temperature rise. This article provides a technical means for determining the internal temperature rise status of GIS equipment through external temperature monitoring in practical applications.

1. Introduction

Gas-insulated switchgear (GIS) plays a crucial role in power grid systems, bearing the responsibilities of load regulation and safe operation [1,2,3]. The construction of multi-physical field couplings delineates the physical properties of the GIS, with the temperature field as a vital component. Investigating its distribution characteristics can better guide the structural design, insulation performance, and fault monitoring of GIS [4,5,6,7].
Research on the temperature distribution of GIS is generally based on simulations and experiments, typically using experimental results to validate the accuracy of simulation models and then applying simulations to calculate temperature distributions under conditions that are difficult to achieve in experiments. Reference [8] used a three-dimensional simulation model to analyze the steady-state temperature distribution of GIS under different contact resistance values, load currents, ambient temperatures, wind speeds, SF6 pressures, and solar radiation levels. Reference [9] utilized the finite element method, employing indirect coupling to calculate the steady-state temperature distribution of GIS under various conditions (ambient temperature, current load, and contact resistance), and developed an empirical formula for predicting the highest contact temperature based on simulation data. Reference [10] also used the finite element method to conduct multi-physics field simulations on a 220 kV GIS, analyzing the steady-state temperature field distribution characteristics from the perspectives of the materials, external ambient temperature, wind speed, and solar radiation. Reference [11] analyzed the impact of solar radiation, load current sizes, and ambient temperatures on GIS temperature distributions using a multi-physics simulation model. However, the studies mainly focused on the simulation modeling and corresponding analyses, lacking experimental results to validate the accuracy of the simulation models.
Another option is to obtain the temperature rise values for GIS busbar conductors, SF6 gas, and the enclosure through temperature rise tests. Then, a temperature fitting relationship between the enclosure and internal hotspots of the GIS can be constructed [8,12,13]. Reference [14] recorded temperatures at the hotspot and the top of an enclosure under various load currents, contact resistances, and ambient temperatures, noting that data sampling intervals were lengthy and inconsistent, with the ambient temperature held constant. Reference [15] investigated the temperature rise in GIS isolator switch contacts and enclosures under different currents and contact resistances, using a sampling interval of 25 min, and derived a linear fitting formula for the temperature rise in the contacts and the top enclosure in a thermally stable state. However, in actual operation, the external ambient temperature of the GIS is constantly changing, and the load current also fluctuates. Previous studies have primarily focused on the temperature distribution under steady conditions and have not accounted for the impact of transient ambient temperature changes on the enclosure and conductor temperature rise, failing to truly reflect the transient temperature evolution characteristics of GIS equipment.
With the development of machine learning, different learning networks are used to invert the hotpot in GIS [13,16,17]. Since the current online monitoring and inversion method for thermal defects in GIS equipment is generally based on simulation model data, sensors are usually installed in areas such as the highest and lowest points on the surface of the enclosure, where thermal defects are prone to occur. The measured steady-state temperature values are input into the trained neural network using the simulation data, and the corresponding internal temperature of the thermal defect is obtained. From a field application point of view, at present, the input temperature values of this kind of monitoring method are in steady states, which leads to the inversion accuracy and universality being relatively low.
With the dynamic changes in the external environment, the evolution of the enclosure temperature is simultaneously affected by the internal conductor temperature and the external ambient temperature. Therefore, this paper focused on the transient temperature evolution characteristics of GIS equipment, which is defined as a sequence of temperature values over time, and the corresponding inversion method based on the experimental data. It is noteworthy that, considering the GIS stations are mainly indoor, this study did not consider the effects of outdoor light radiation, humidity, and wind speed. Firstly, a three-phase co-box GIS temperature rise test platform was established. The transient temperature evolution was recorded by the thermocouples arranged on the surfaces of the conductor and enclosure. The environment’s temperature was also taken into consideration. Then, the transient temperature evolution characteristics were investigated based on the collected data. Corresponding enclosure and environment temperature data were used to train the neural network, and the output of the neural network was the temperature of the GIS busbar. Finally, the effectiveness and accuracy were verified by the experimental test data, and the influence of different temperature monitoring points was also investigated.

2. GIS Busbar Temperature Rise Test

2.1. Test Prototype and Equipment

The equipment used in this experiment is a three-phase co-box GIS co-designed and developed with Jiangsu Rugao High-Voltage Electric Co., Ltd. (Rugao, China), with a rated voltage of 72.5 kV and a rated current of 4200 A, as shown in Figure 1. A flange on the side of the GIS allows for the connection of incoming and outgoing lines through a custom temperature rise cover plate, enabling internal temperature monitoring during the temperature rise test. The high-current generator can produce up to 4500 A of three-phase AC, with an output voltage of 0–10 V and a current measurement accuracy of 0.5% FS ± 3 digits, and the temperature data acquisition card is the Keysight Technologies (Colorado Springs, CO, USA) 34,972 A.
A 1 cm × 1 cm copper foil was used to adhere the thermocouple to the arrangement during the test. To ensure the accuracy of the test data, additional high-temperature-resistant cable ties were used to fix the thermocouples to ensure that they were tightly attached to the measurement points, see ① and ④ in Figure 1a.

2.2. Thermocouple Layout Scheme

The distribution of the thermocouple locations on the GIS is shown in Figure 2. This experiment uses T-type thermocouples (copper–constantan), with a temperature measurement range of 0–200 °C and Class I accuracy (error of 0.1 K). Thermocouples are primarily placed on the surface of the enclosure and the busbar conductor. The thermocouples are affixed to the designated spots using 1 cm × 1 cm copper foil and secured with high-temperature-resistant cable ties to ensure close contact with the measurement points, thus guaranteeing the accuracy of the experimental data, as shown in positions ② and ④ in Figure 1.
Inside the GIS enclosure, four thermocouples are placed at 90° intervals in a clockwise direction on both the conductor surface and the contact holder surface. The first group, which includes thermocouple TCe11, is positioned directly above the conductor surface under the actual operating conditions of the GIS busbar. Phase A has four groups, while Phases B and C have two groups each. The final group is located on the cross-section corresponding to the first (fourth group) spring contact finger on the contact holder surface, with the remaining three groups distributed on the conductor surface (1.2 m between the first and second groups; 0.6 m between the second and third groups), as seen in Figure 2. On the enclosure surface, four thermocouples are arranged at 90° intervals in a clockwise direction, with the first group including thermocouple TCe11 positioned directly above the enclosure. A total of three groups is placed, with the third group located on the same cross-section as the fifth group on the conductor surface, the second group 0.7 m from the third group, and the first group 1 m from the second group, as shown in Figure 2.

2.3. Temperature Rise Test

As shown in Figure 1, three beakers, each containing 0.5 L of kerosene, are uniformly arranged 1 m away from the GIS busbar at the average height of the current-carrying components. The thermocouples placed in the beaker of kerosene are according to IEC 62271-1:2017 7.5.4.1, to eliminate external interference (such as local light winds), enabling more stable and accurate measurement of the ambient temperature. Thermocouples labeled TCa1, TCa2, and TCa3 are placed in these beakers to monitor the ambient temperature and are completely immersed in the kerosene. During the test, the high-current generator feeds three phases through five high-current test cables (with connections longer than or equal to 2 m to ensure that the cables do not significantly transfer heat into or out of the GIS busbar) connected to the aluminum bus at the GIS busbar sleeve end, while the other ends are short-circuited with copper busbars inside the GIS enclosure. The test site is in a spacious indoor area with no equipment within 5 m, and the indoor air flow speed is less than or equal to 0.5 m/s.
The test commenced at 11:10 under a load current of 2000 A, with the actual currents being 2010 A in Phase A, 2010 A in Phase B, and 2023 A in Phase C; the GIS enclosure interior maintained an atmospheric pressure of 1 atm. Another test at the same time under a load current of 3000 A, with the actual currents being 3012 A in Phase A, 3011 A in Phase B, and 3006 A in Phase C.

3. Transient Temperature Evolution Analysis

3.1. Evolution of Ambient Temperature

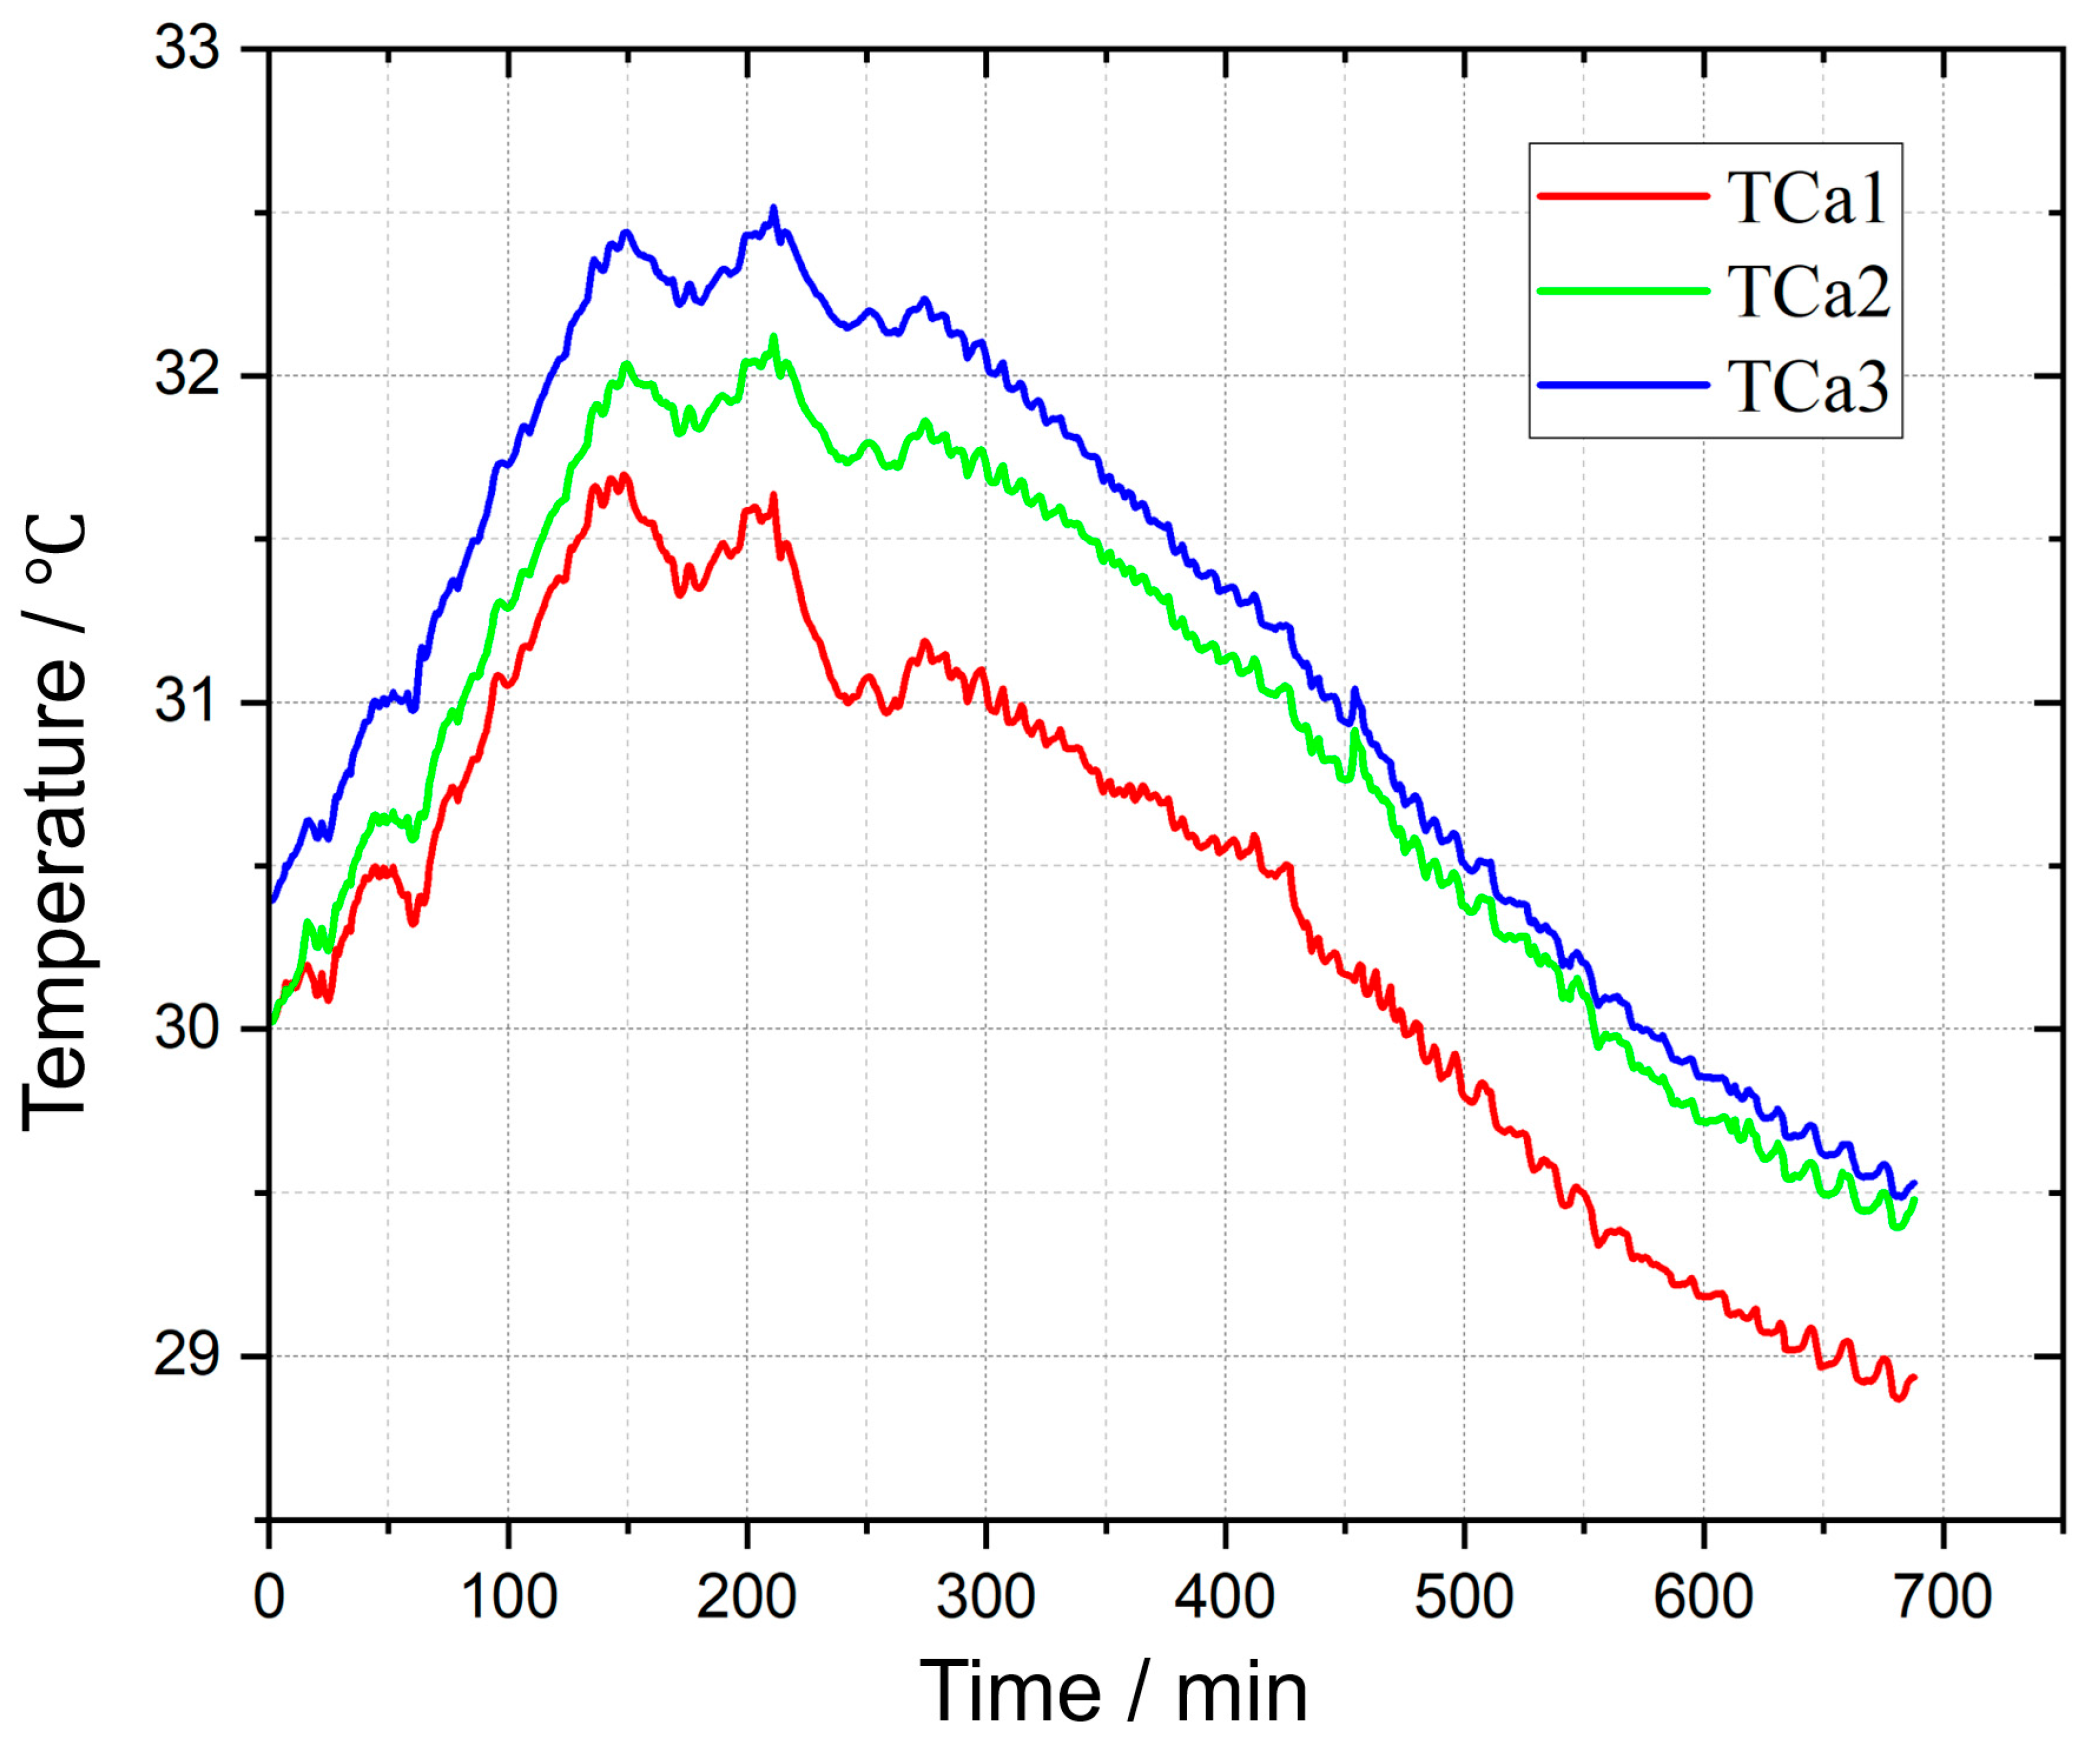
At the start of the temperature rise test, the external ambient temperature around the GIS busbar was concurrently recorded, as illustrated in Figure 3.
As depicted in Figure 3, the external ambient temperature over the course of a day generally follows a pattern of increasing then decreasing, aligning with the diurnal cycle of the temperature rise. However, there are short-term temperature fluctuations during the transient changes, such as temporary temperature drops during the 150–175 min and 200–240 min intervals, which are also reflected to some extent in the evolution of the enclosure temperature. There are slight variations in the external ambient temperatures at different locations on the test platform, due to thermocouples TCa2 and TCa3 being closer to the aluminum busbar at the GIS output end. The connection between the aluminum busbar and the cables has contact resistance, which generates heat during the temperature rise test and affects the surrounding ambient temperatures.

3.2. Evolution of Enclosure Temperature

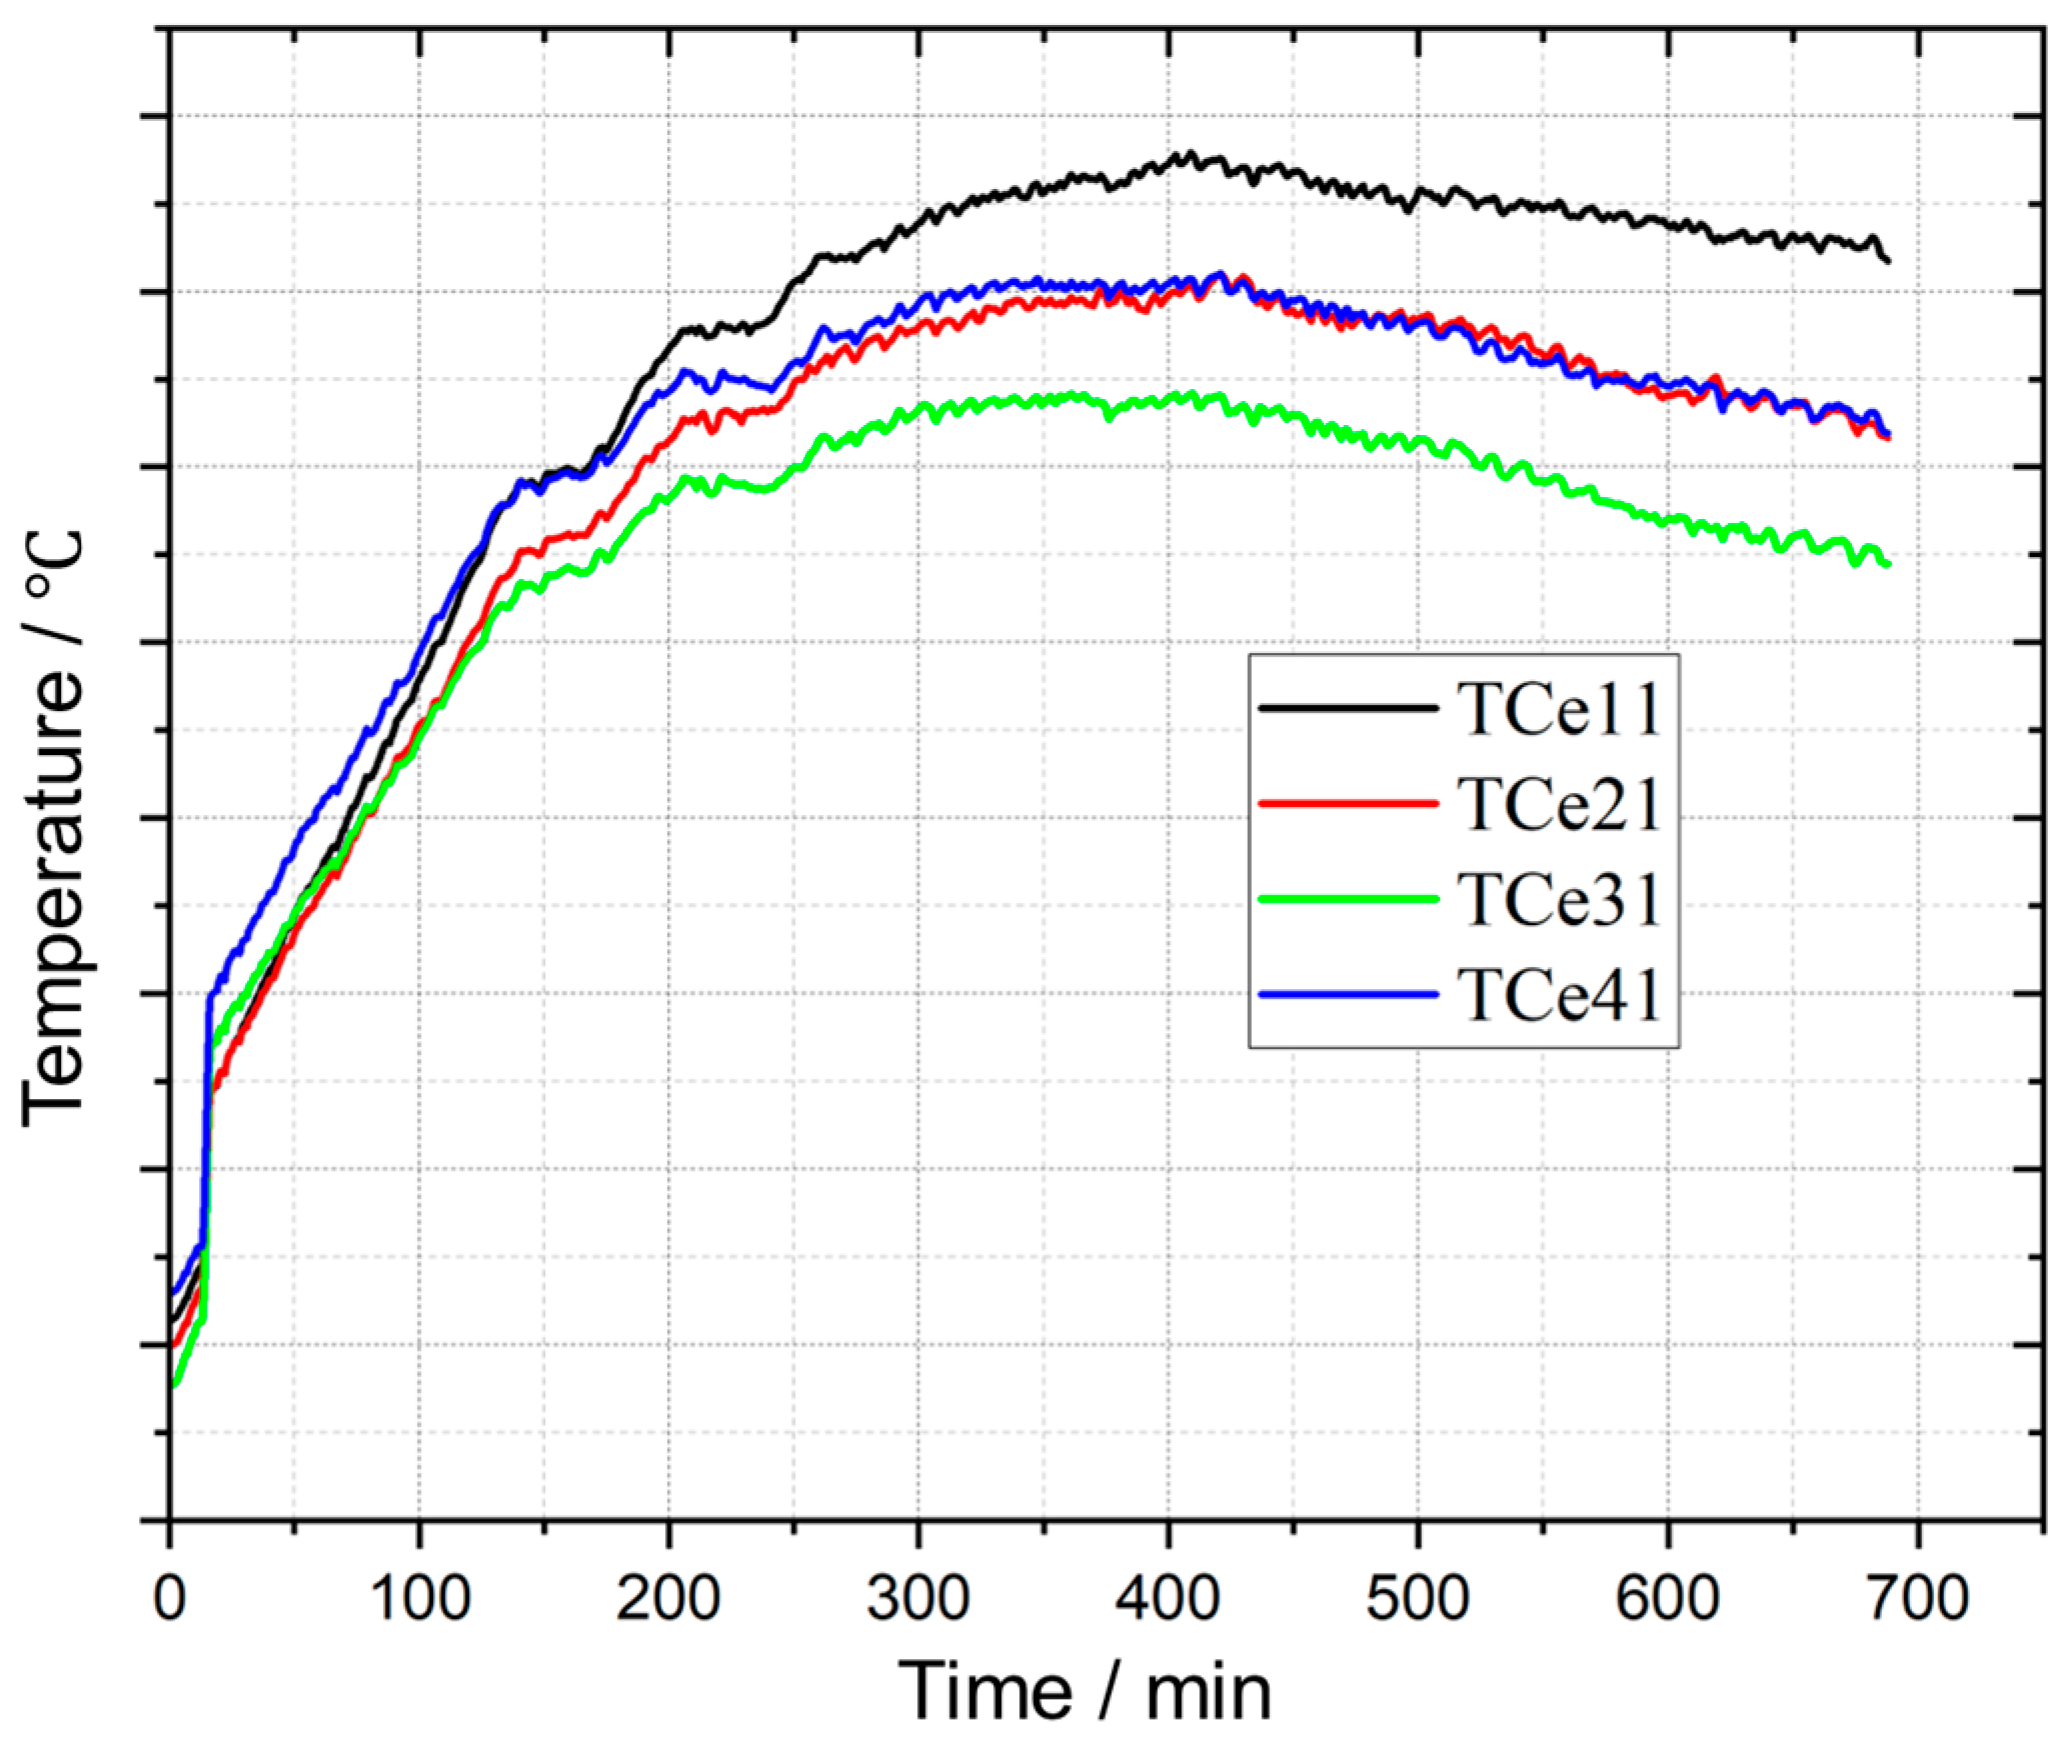
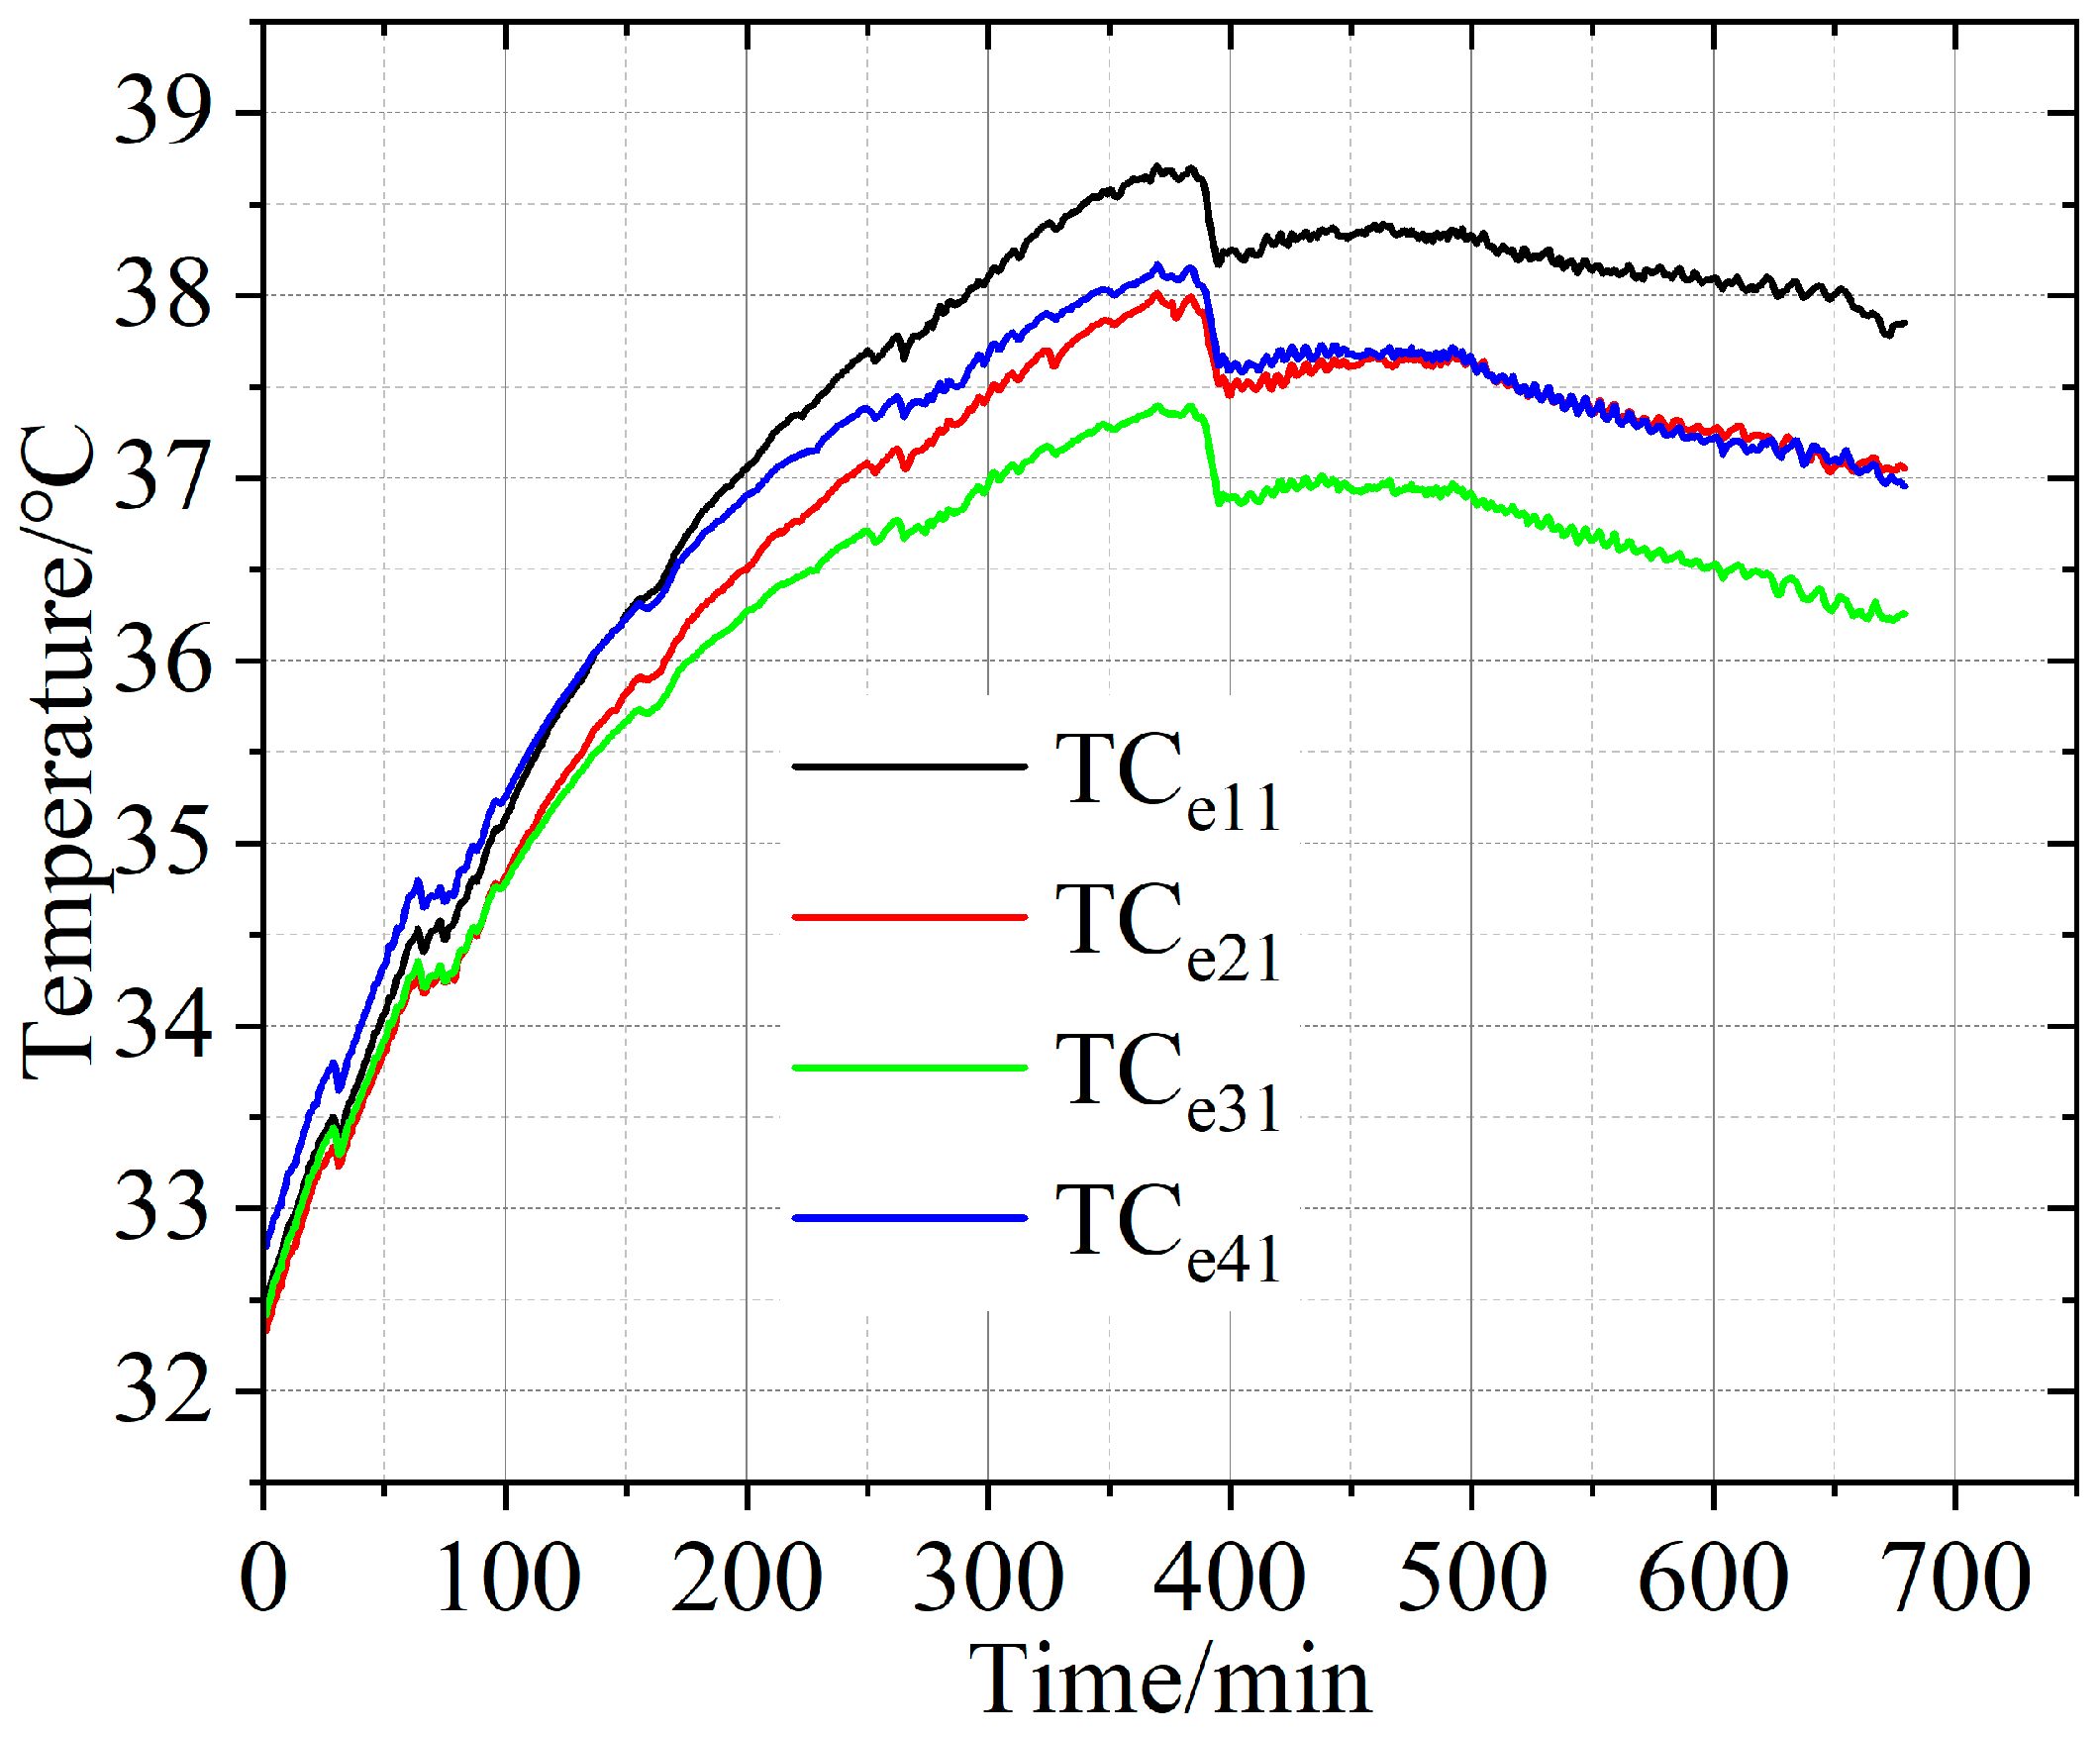
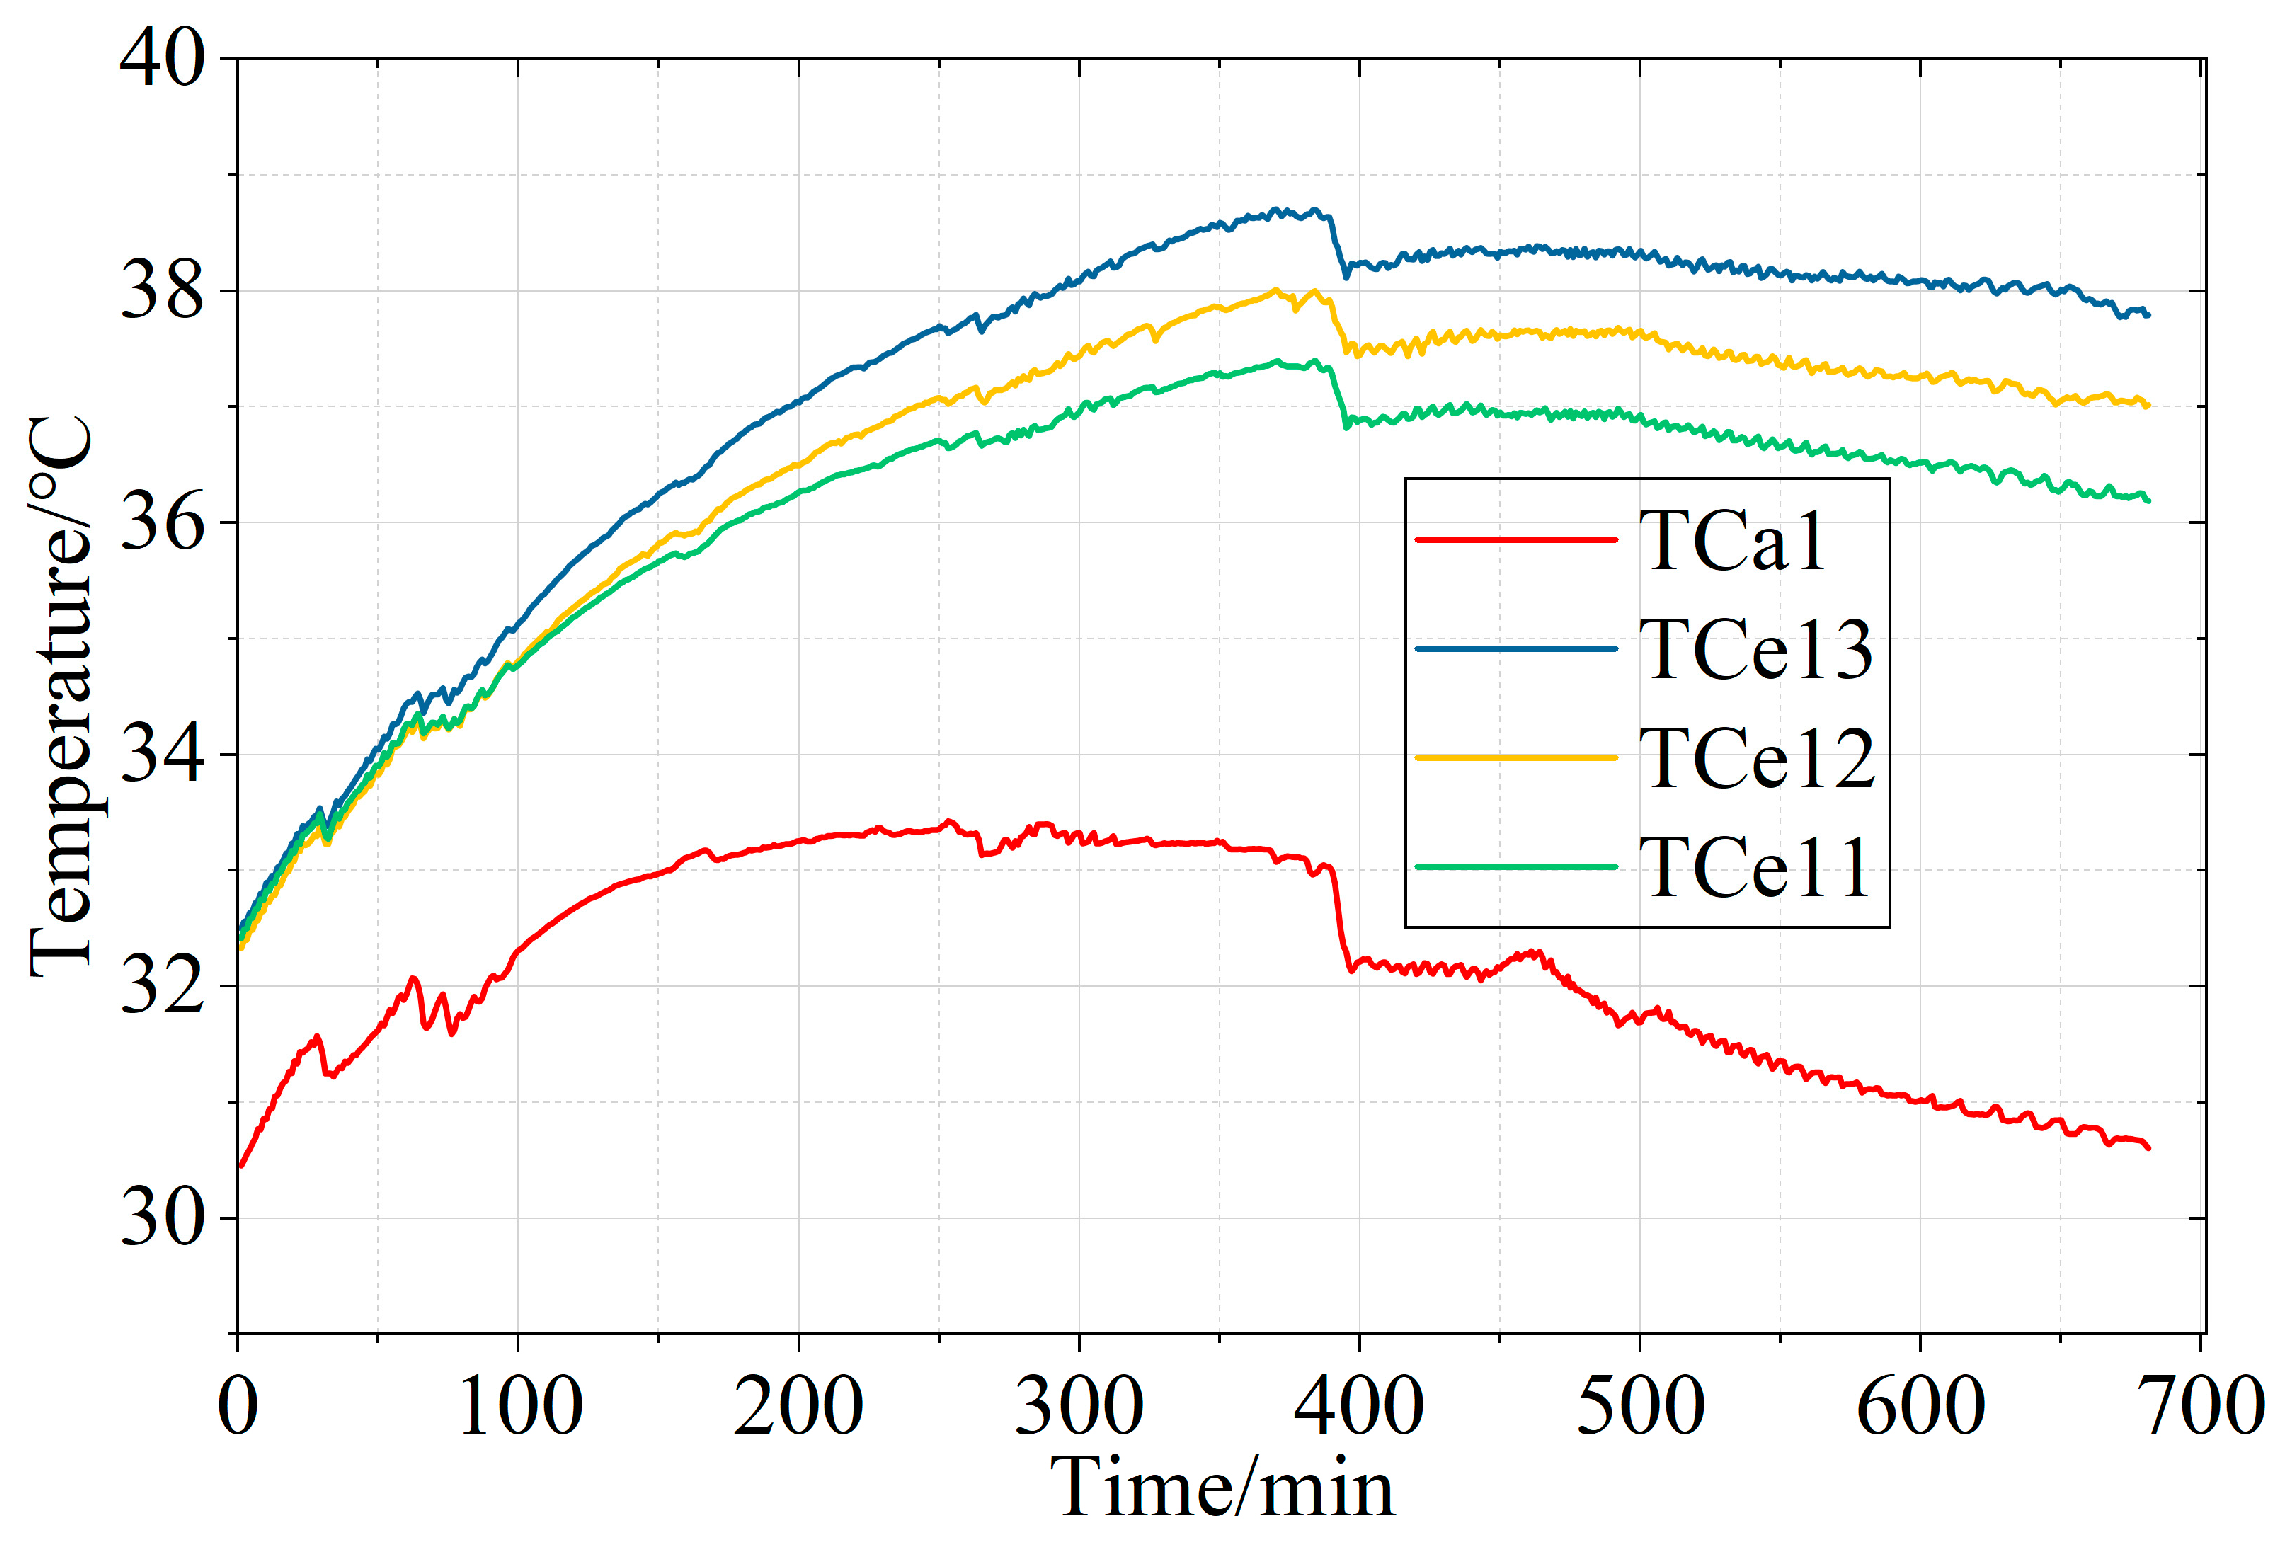
Under the transient evolution of the external environment, the evolution of the enclosure temperature over time is illustrated in Figure 4 (load current 2000 A) and Figure 5 (load current 2000 A).
As shown in Figure 4, thermocouple TCe11, located directly above the enclosure, experiences the largest temperature rise, while thermocouple TCe31, positioned directly below the enclosure, has the smallest temperature rise. The thermocouples on the sides, TCe21 and TCe41, have temperature rises between those of TCe11 and TCe31. In the early part of the temperature rise test, when the conductor’s temperature increase rate is higher, the temperature rises in the four thermocouples on the enclosure cross-section are similar. This may be due to the heat transferring from the conductor to the enclosure; initially, the heat needs to pass to the gas inside the GIS enclosure before transferring to the enclosure, indicating that convection is the main mode of heat transfer within the GIS enclosure. From Figure 5, we can observe the same trend of change.
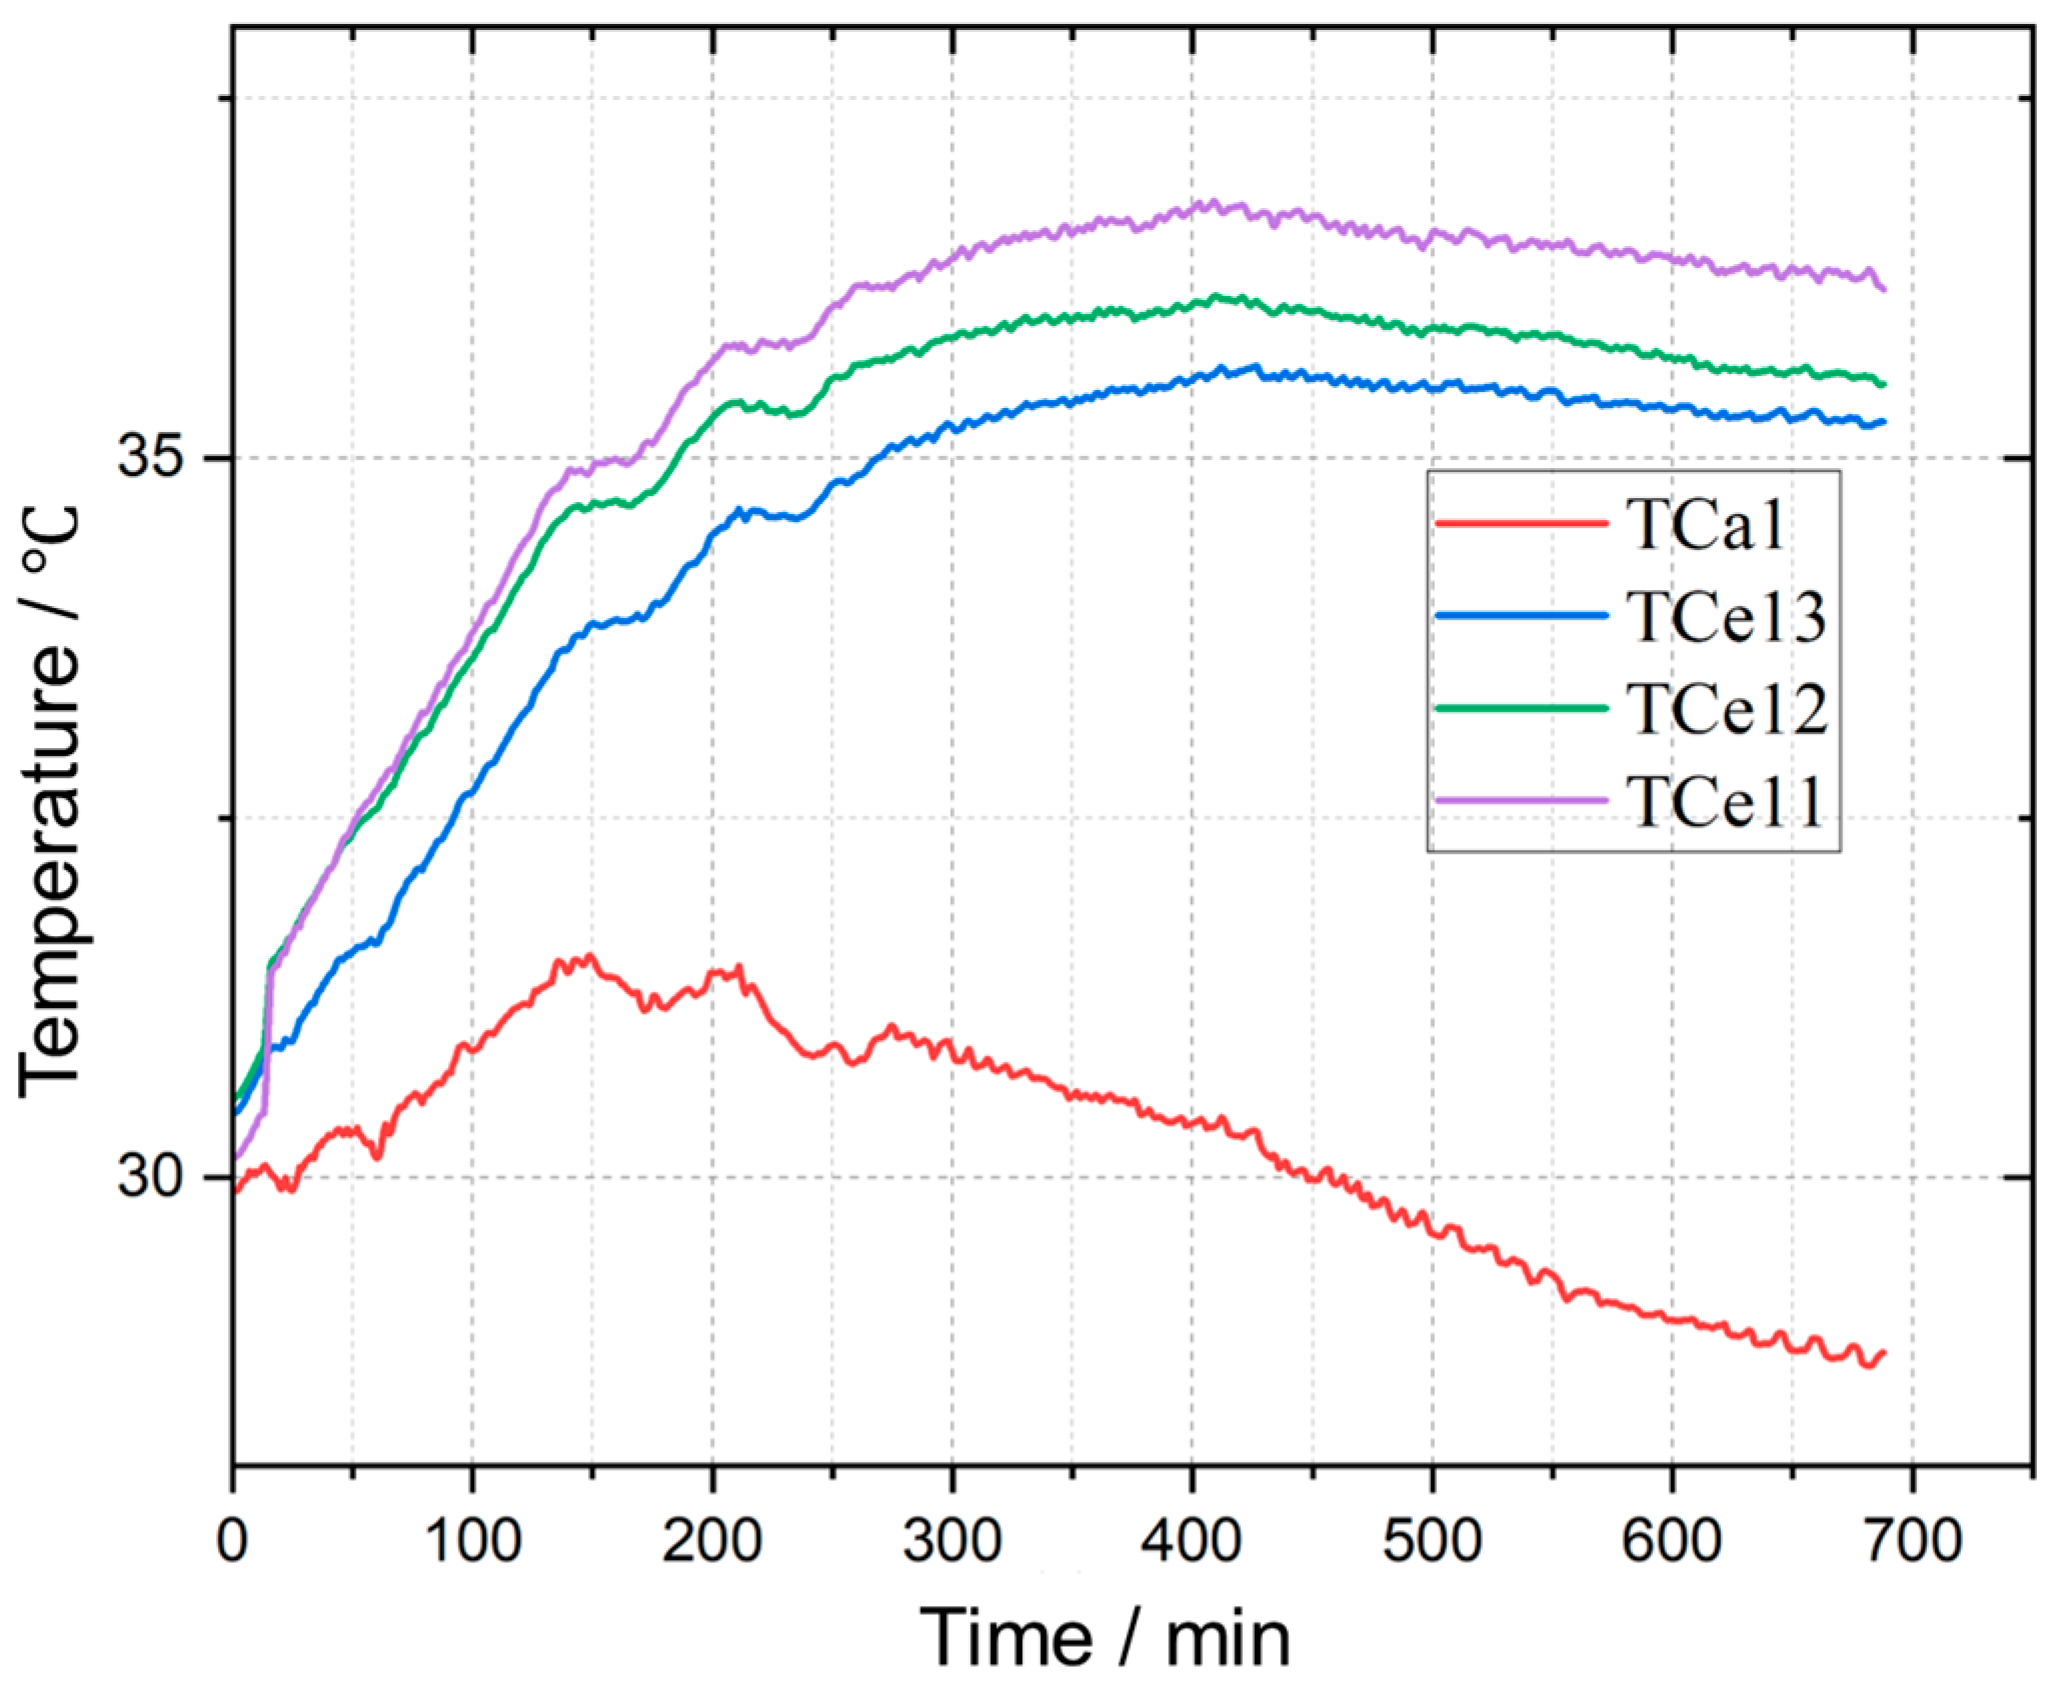
To better demonstrate how the evolution of the enclosure temperature and the ambient temperature, Figure 6 and Figure 7 show these two kinds of curves together.
As depicted in Figure 6 and Figure 7, the surface temperature of the enclosure is influenced by changes in the external ambient temperature. During periods of external temperature decreases, corresponding fluctuations are also observed in the enclosure temperature rise, indicating that the enclosure temperature rise is influenced by both the internal conditions of the GIS enclosure and the external environment. The closer a coaxial thermocouple located directly above the enclosure is to the output end, the higher its temperature rise, which is consistent with the factors discussed in Section 3.1 that affect the ambient temperature.

3.3. Evolution of Conductor Temperature

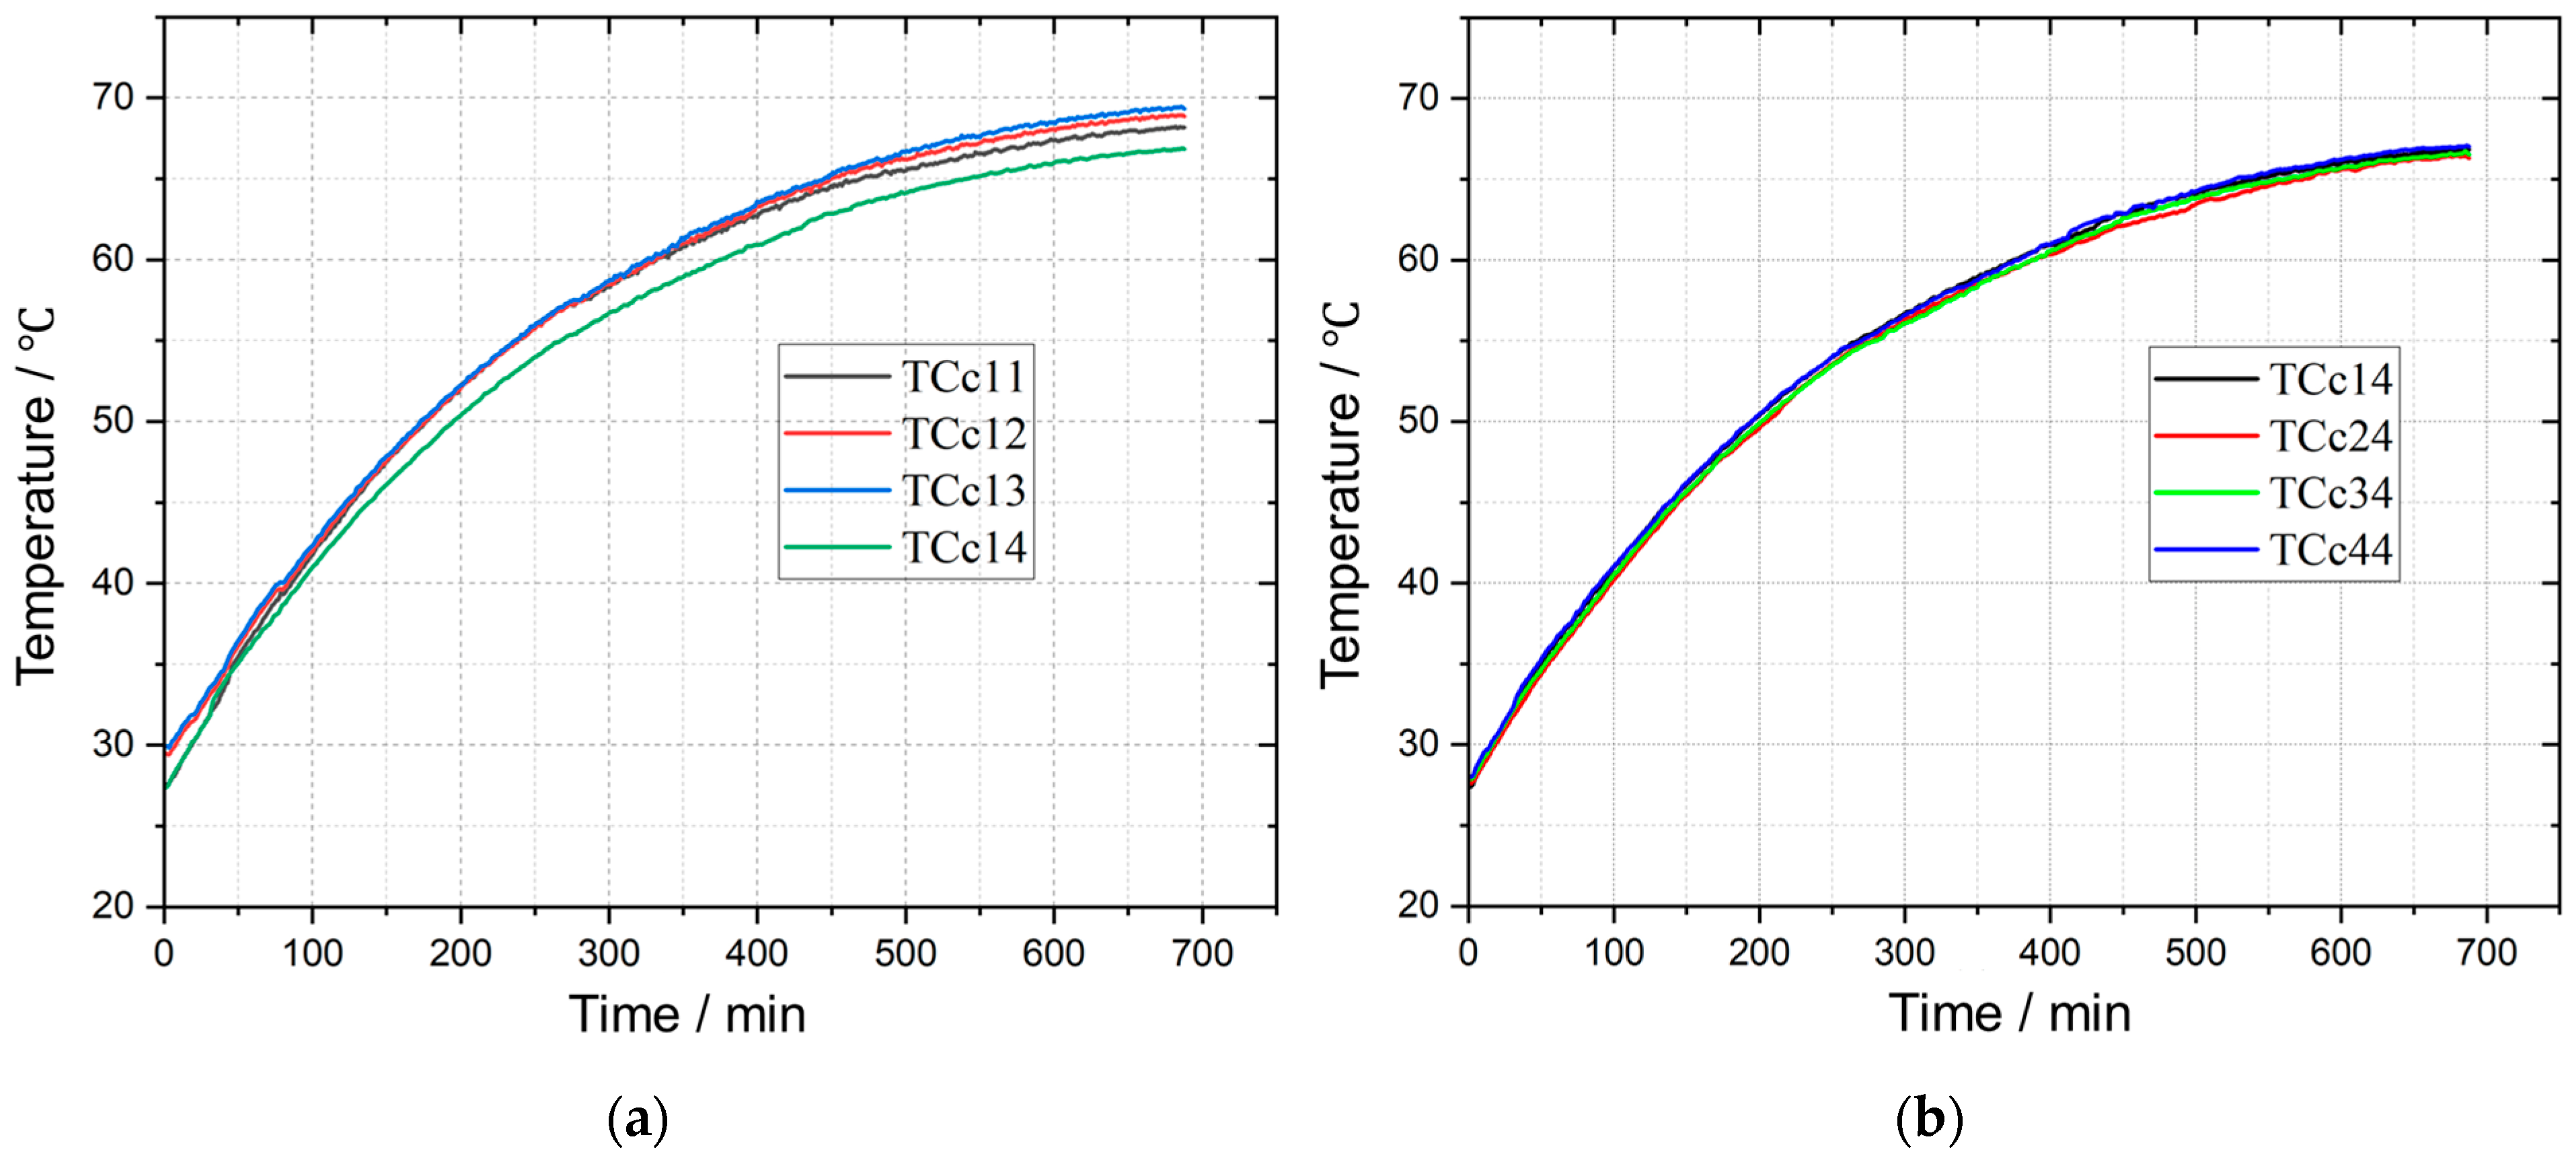
After the start of the temperature rise test, thermocouples positioned internally continuously monitor the surface temperature of the internal conductors, as shown in Figure 8. The thermocouple in (a) is located along the same axis at the top of Phase A, while the thermocouple in (b) is positioned at the fourth group on the contact holder.
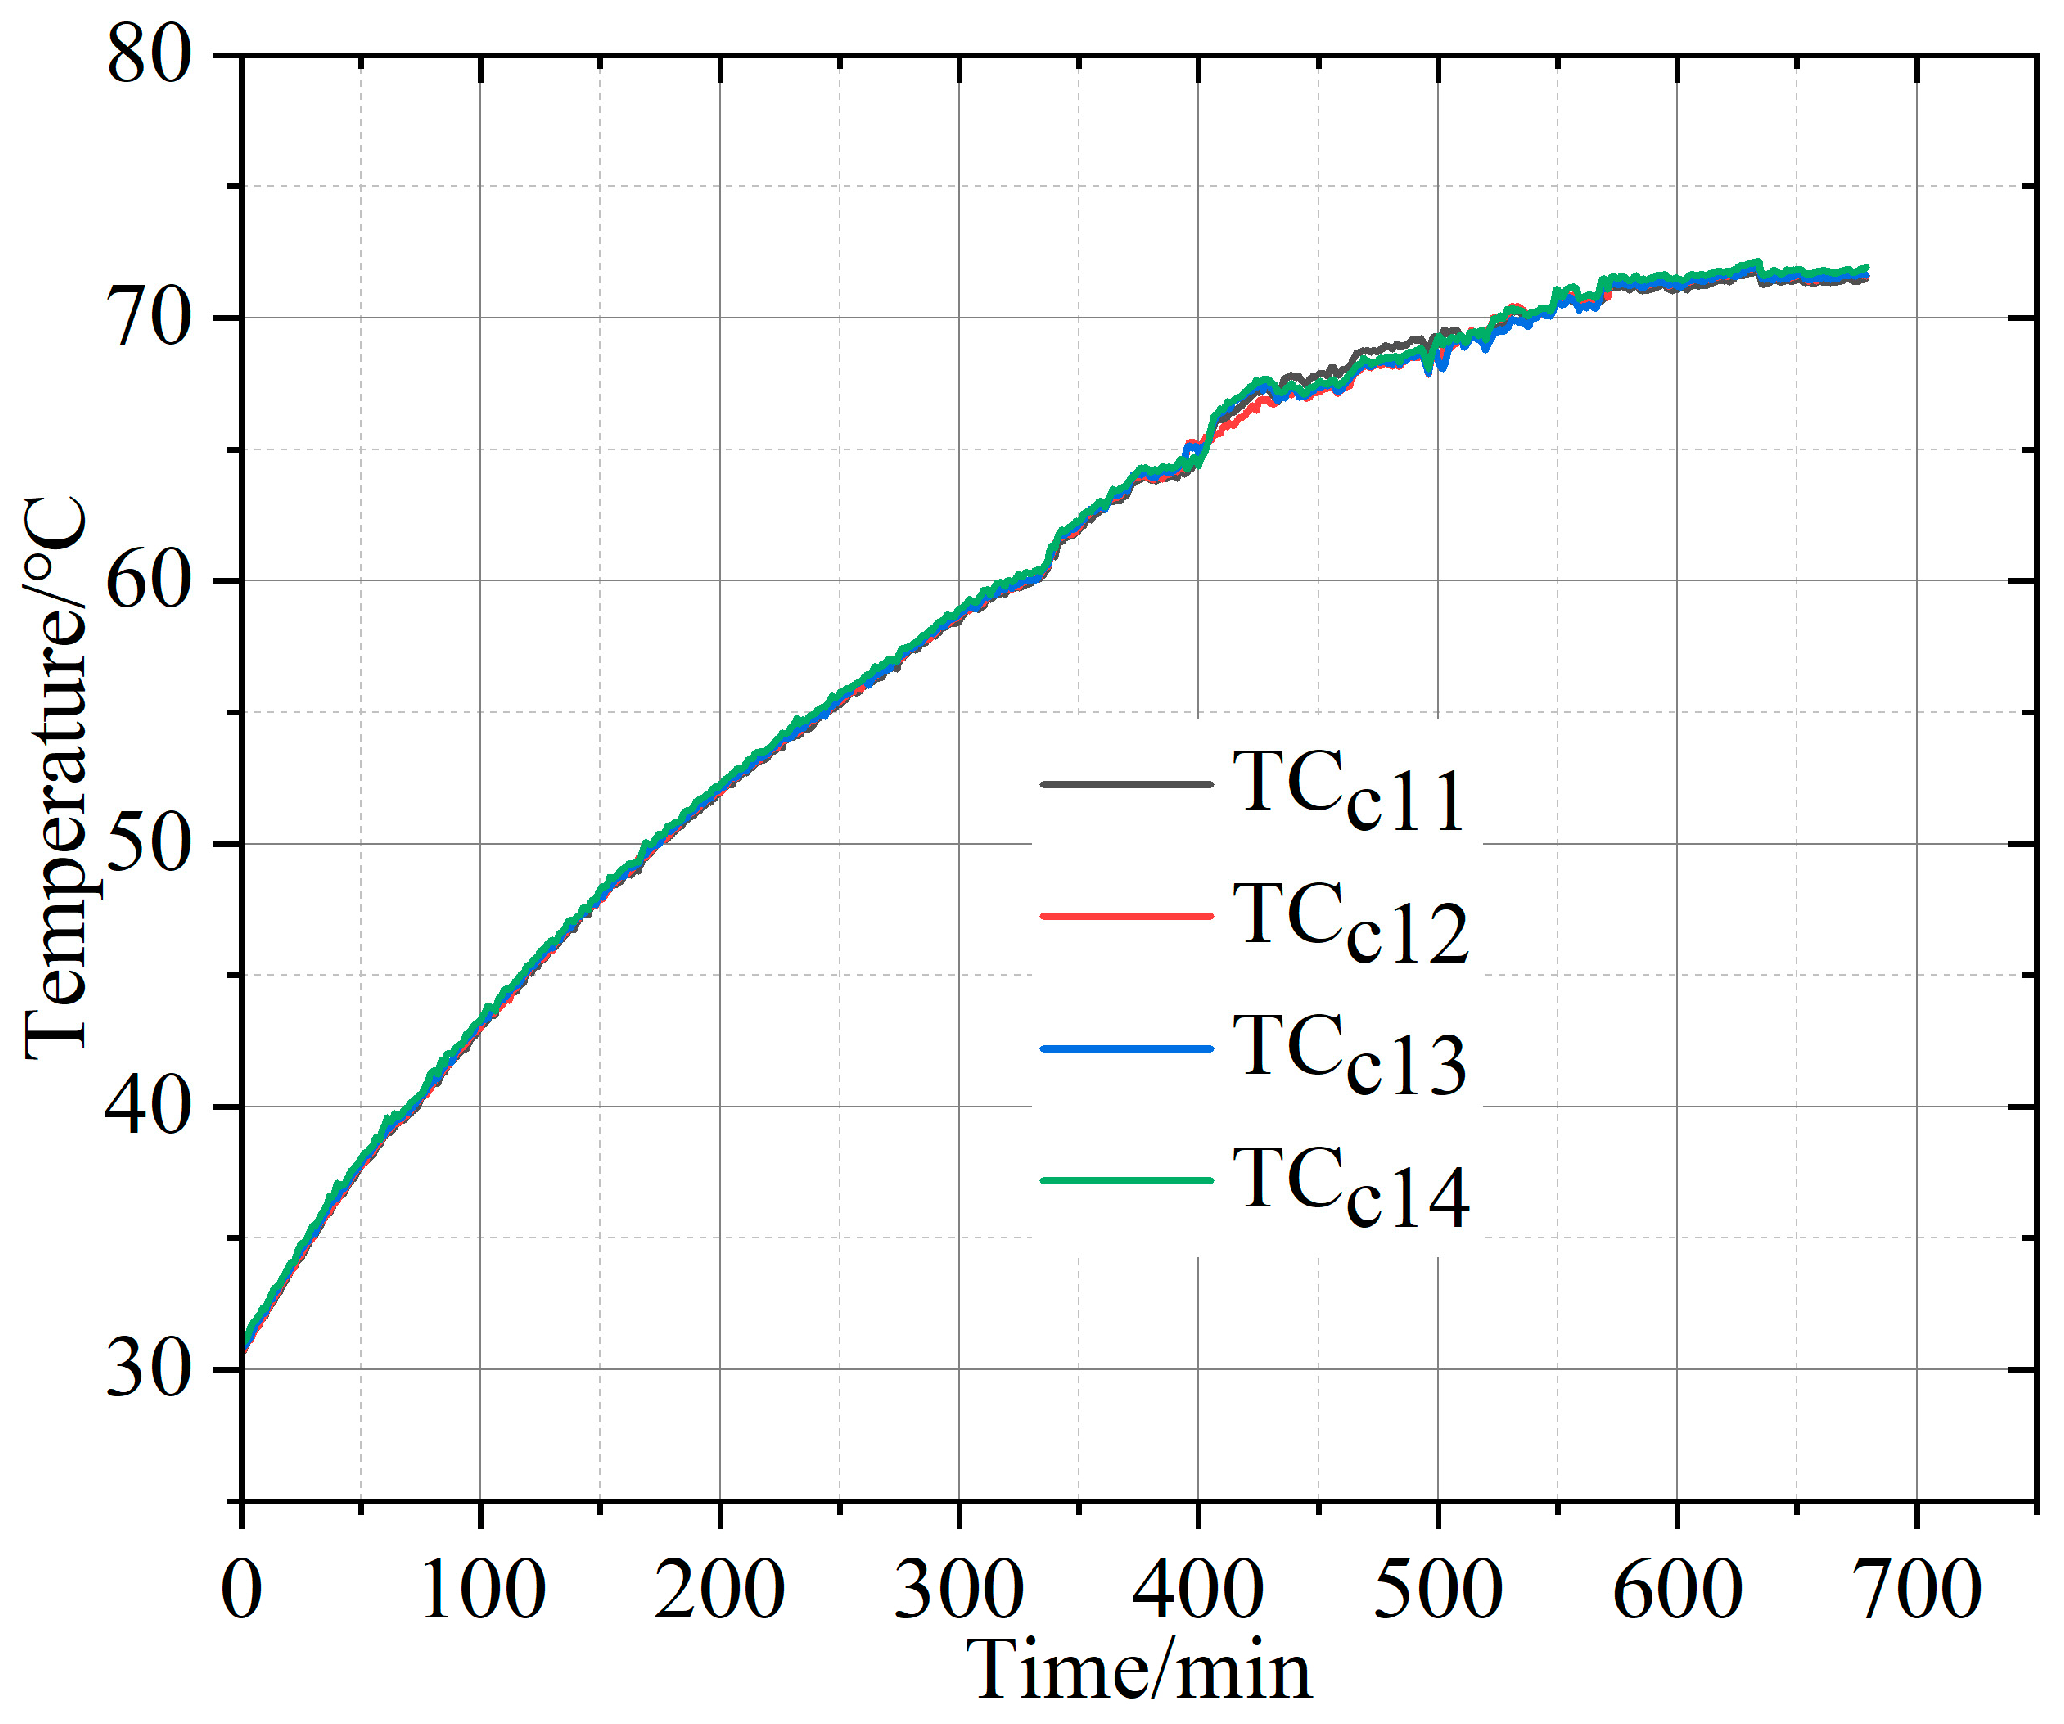
As depicted in Figure 8a, the temperature rises in the conductors along the same axis are essentially consistent, with thermocouple TCc14 showing a lower starting temperature, hence maintaining a lower position throughout the temperature evolution. Figure 8b indicates that the temperature rises in conductors on the same cross-section are almost entirely consistent, with a temperature difference between the upper and lower positions not exceeding 1 K. This suggests that inside the GIS enclosure, the temperature rise in the conductors is primarily governed by heat conduction, and the overall resistance of the conductors remains uniform during the current flow, leading to consistent heat-induced temperature rises. The test lasted 11 h, but the internal conductors’ temperature rise did not reach a steady state by the end of the test, partly due to changes in the external environment and because the load current was continuously fluctuating within a small range. From Figure 9, we can observe the same trend of change. Therefore, the temperature evolution characteristics are consistent under multiple current conditions.
Measurement data from thermocouples at different positions on the surfaces of the three-phase conductors inside the GIS are presented in Table 1.
As indicated in Table 1, due to the varying calibrations of different thermocouples, there are discrepancies in the measured starting temperatures. The temperature rises in thermocouples TCc13 and TCc14, located at the contact holder and the conductor, are essentially the same, suggesting that well-functioning spring contact fingers do not affect the temperature rise. In theoretical calculations, the contact holder can be modeled as a concentric conductor, and the internal conductor surface can be approximated as an isothermal surface. The temperature rise in the Phase B conductors is lower due to their position being lower compared to Phases A and C, which is influenced by gravity.

3.4. Characteristics Extraction Considering Transient Temperature Evolution

Studies on the transient temperature distribution characteristics of a 72.5 kV GIS note that enclosure temperature changes are influenced by both environmental and conductor temperatures, and the relationship between the conductor, enclosure, and environment temperature can be described by the temperature rise rate. Thus, this paper proposed a feature vector for GIS heating defect recognition that considers the transient temperature evolution. The feature vector is defined as
T = { T s 1 , T s 2 , T s 16 , T v 1 , i , T v 2 , i , , T v 16 , i , T a 1 , i , T a 2 , i , T a 3 , i }
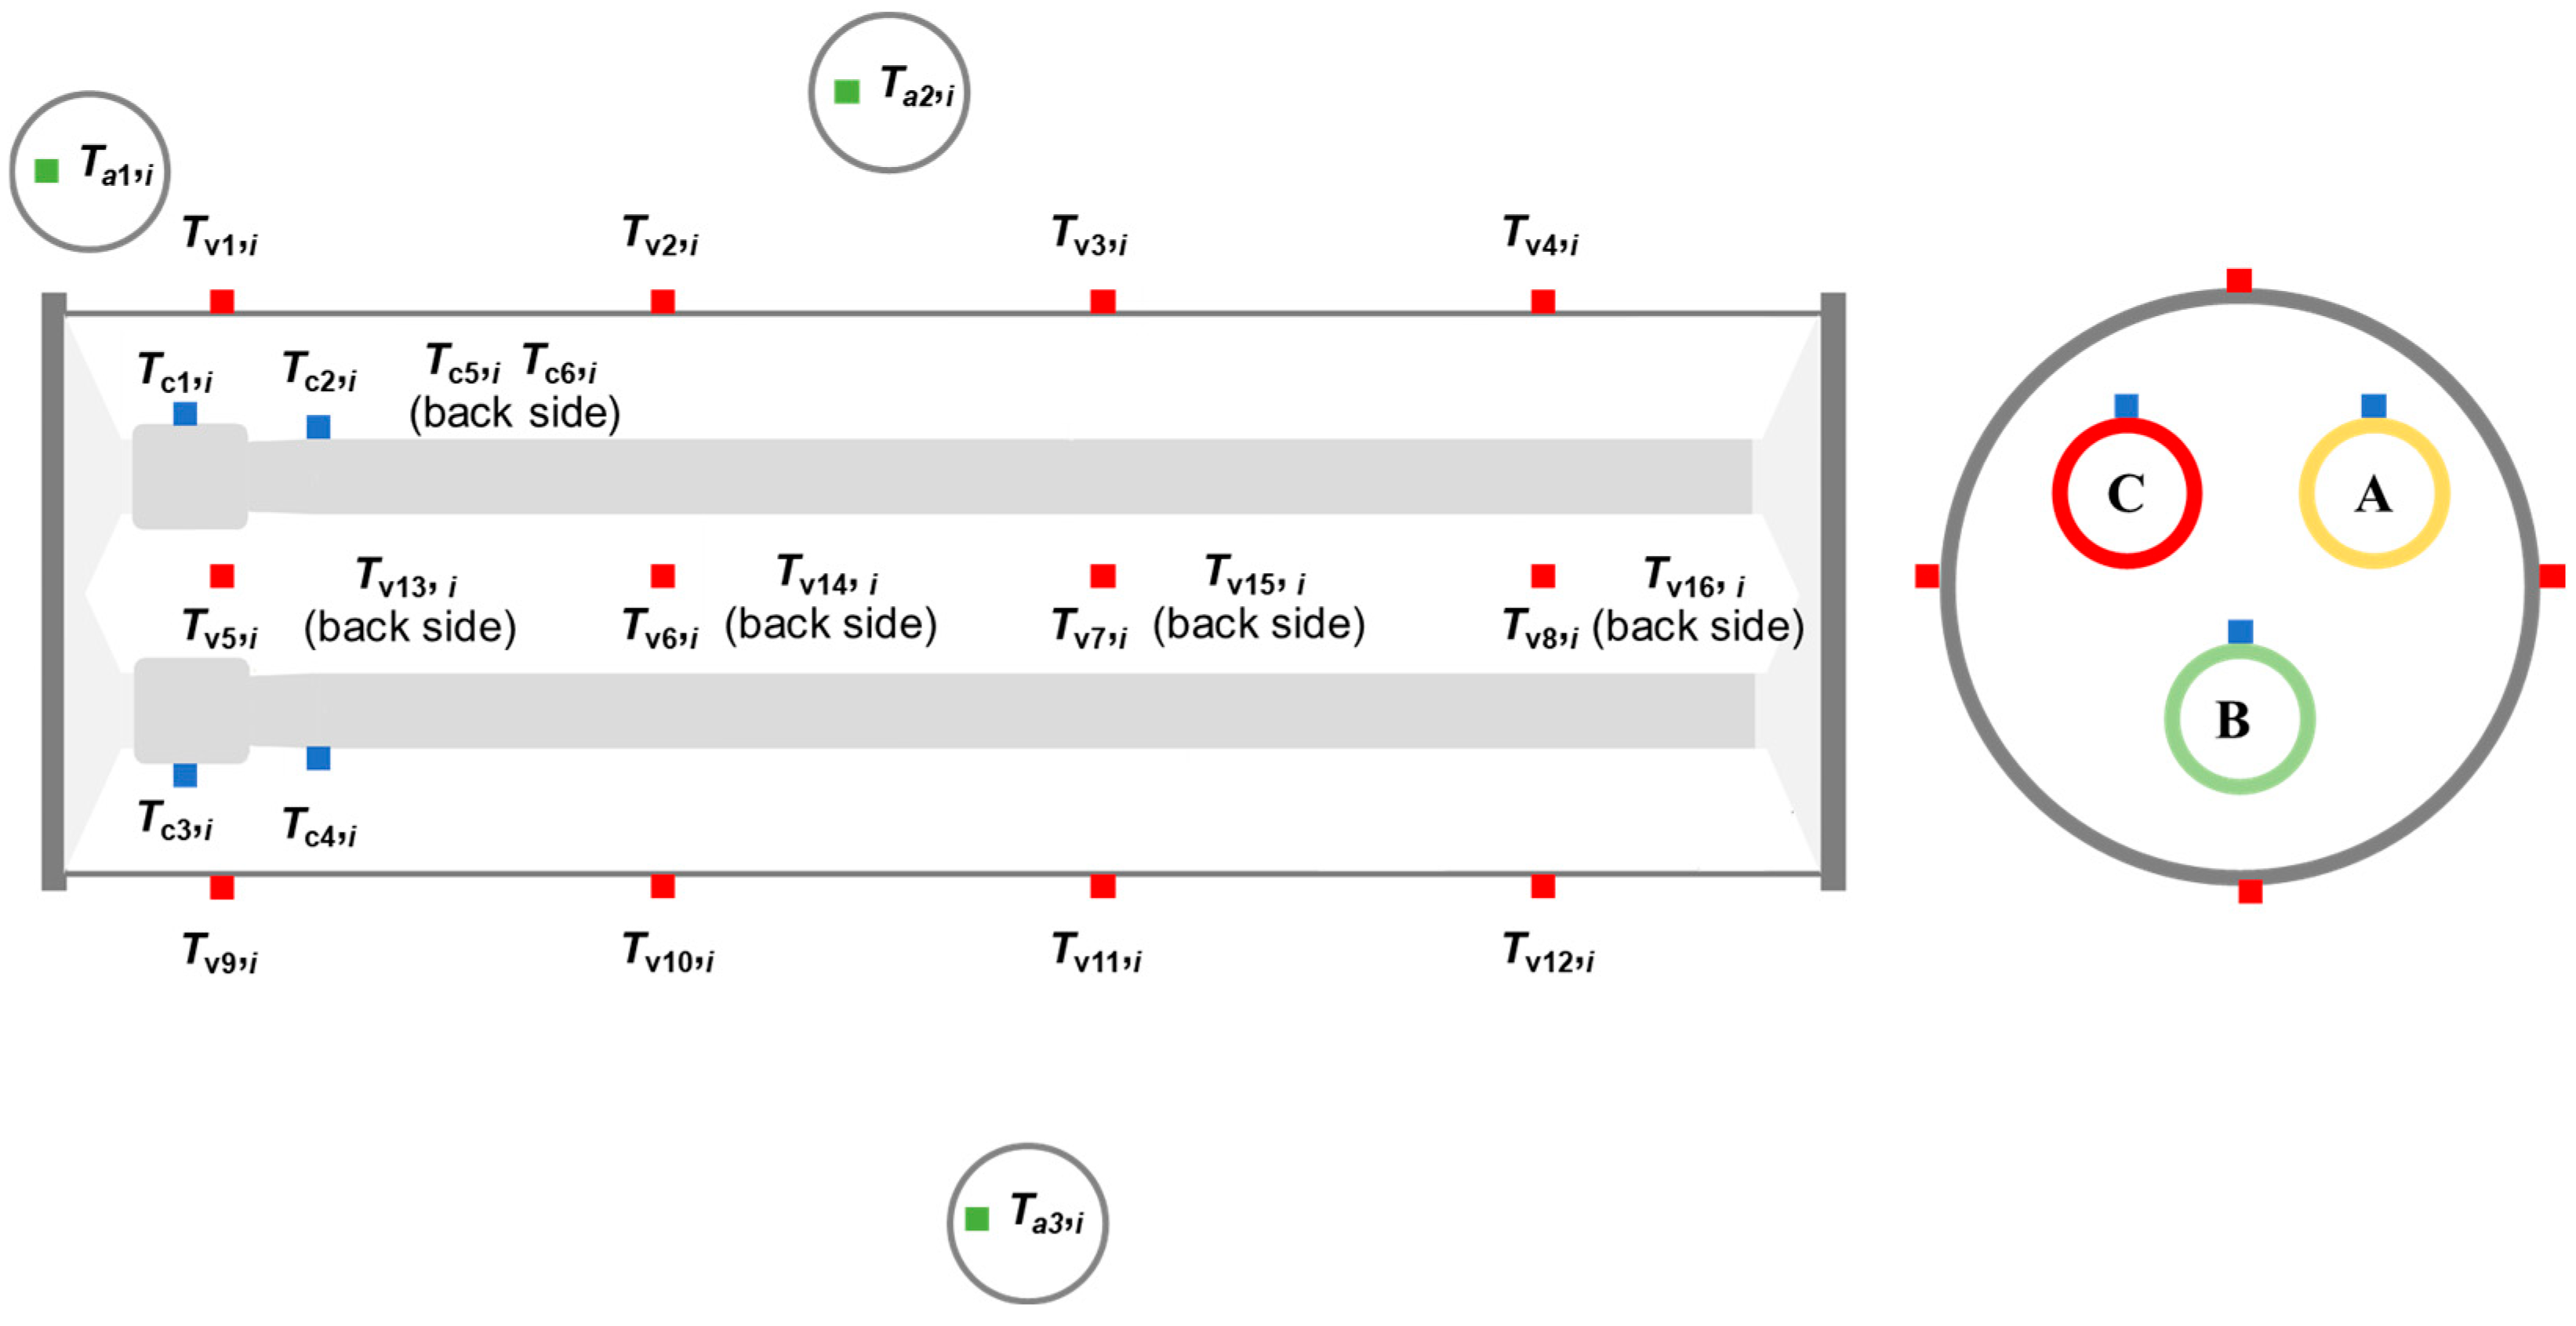
where Ts is the steady temperature of the enclosure, while Tvi is the enclosure temperature rise values of time interval i, that all measured by 16 thermocouples on the enclosure as presented in Figure 10. Tai is the ambient temperature rise values of time interval i measured by three thermocouples that are placed near the GIS, as presented in Figure 10.
The time interval i is 100 min, starting from 100 min to 700 min of the temperature rise test, namely, for Tv1,i, there are seven values. Thus, for the feature vector T, there are a total of 16 steady temperature values, 112 (7 × 16) enclosure temperature rise values, and 21 (7 × 3) ambient temperature rise values, i.e., 149 factors.

4. Inversion Method for Busbar Temperature Considering Transient Evolution Characteristics

4.1. Inversion Method and Experimental Validation

This paper applied a nonlinear regression analysis method, Generalized Regression Neural Networks (GRNNs) [18,19], for the busbar temperature inversion. Assuming that gx,y is the joint probability density function of the random variable x, y, when the observation value of x is known and denoted as X, then the conditional probability of y relative to X could be written as
Y ^ X = E y | X = y g X , y d y g X , y d y
Y ^ X is the forecast output when the input is X. Assuming Xi and Yi are the sample estimated values of random variables x and y, respectively. Then, the probability estimator gX,Y could be calculated as
g X , Y = 1 n 2 π m + 1 2 σ m + 1 · i = 1 n exp [ X X i 2 2 + Y Y i 2 2 2 σ 2 ]
where n is the number of sample observations, and m is the dimension of the vector variable x. Samples Xi and Yi have the same normal distribution standard deviation σ. By substituting Equation (3) into Equation (2), the conditional mean value is obtained:
Y ^ X = i = 1 n e X X i 2 2 2 σ 2 y e Y Y i 2 2 2 σ 2 d y i = 1 n e X X i 2 2 2 σ 2 e Y Y i 2 2 2 σ 2 d y
Since x e x 2 d x = 0 , Equation (3) can be simplified further:
Y ^ X = i = 1 n Y i e X X i 2 2 / 2 σ 2 i = 1 n e X X i 2 2 / 2 σ 2
From Equation (5), we can see that Y ^ X is the weighted average of all sample observations Yi. And the contribution of each sample to Y ^ X is determined by the Euclidean distance between Xi and X, namely X X i 2 2 .
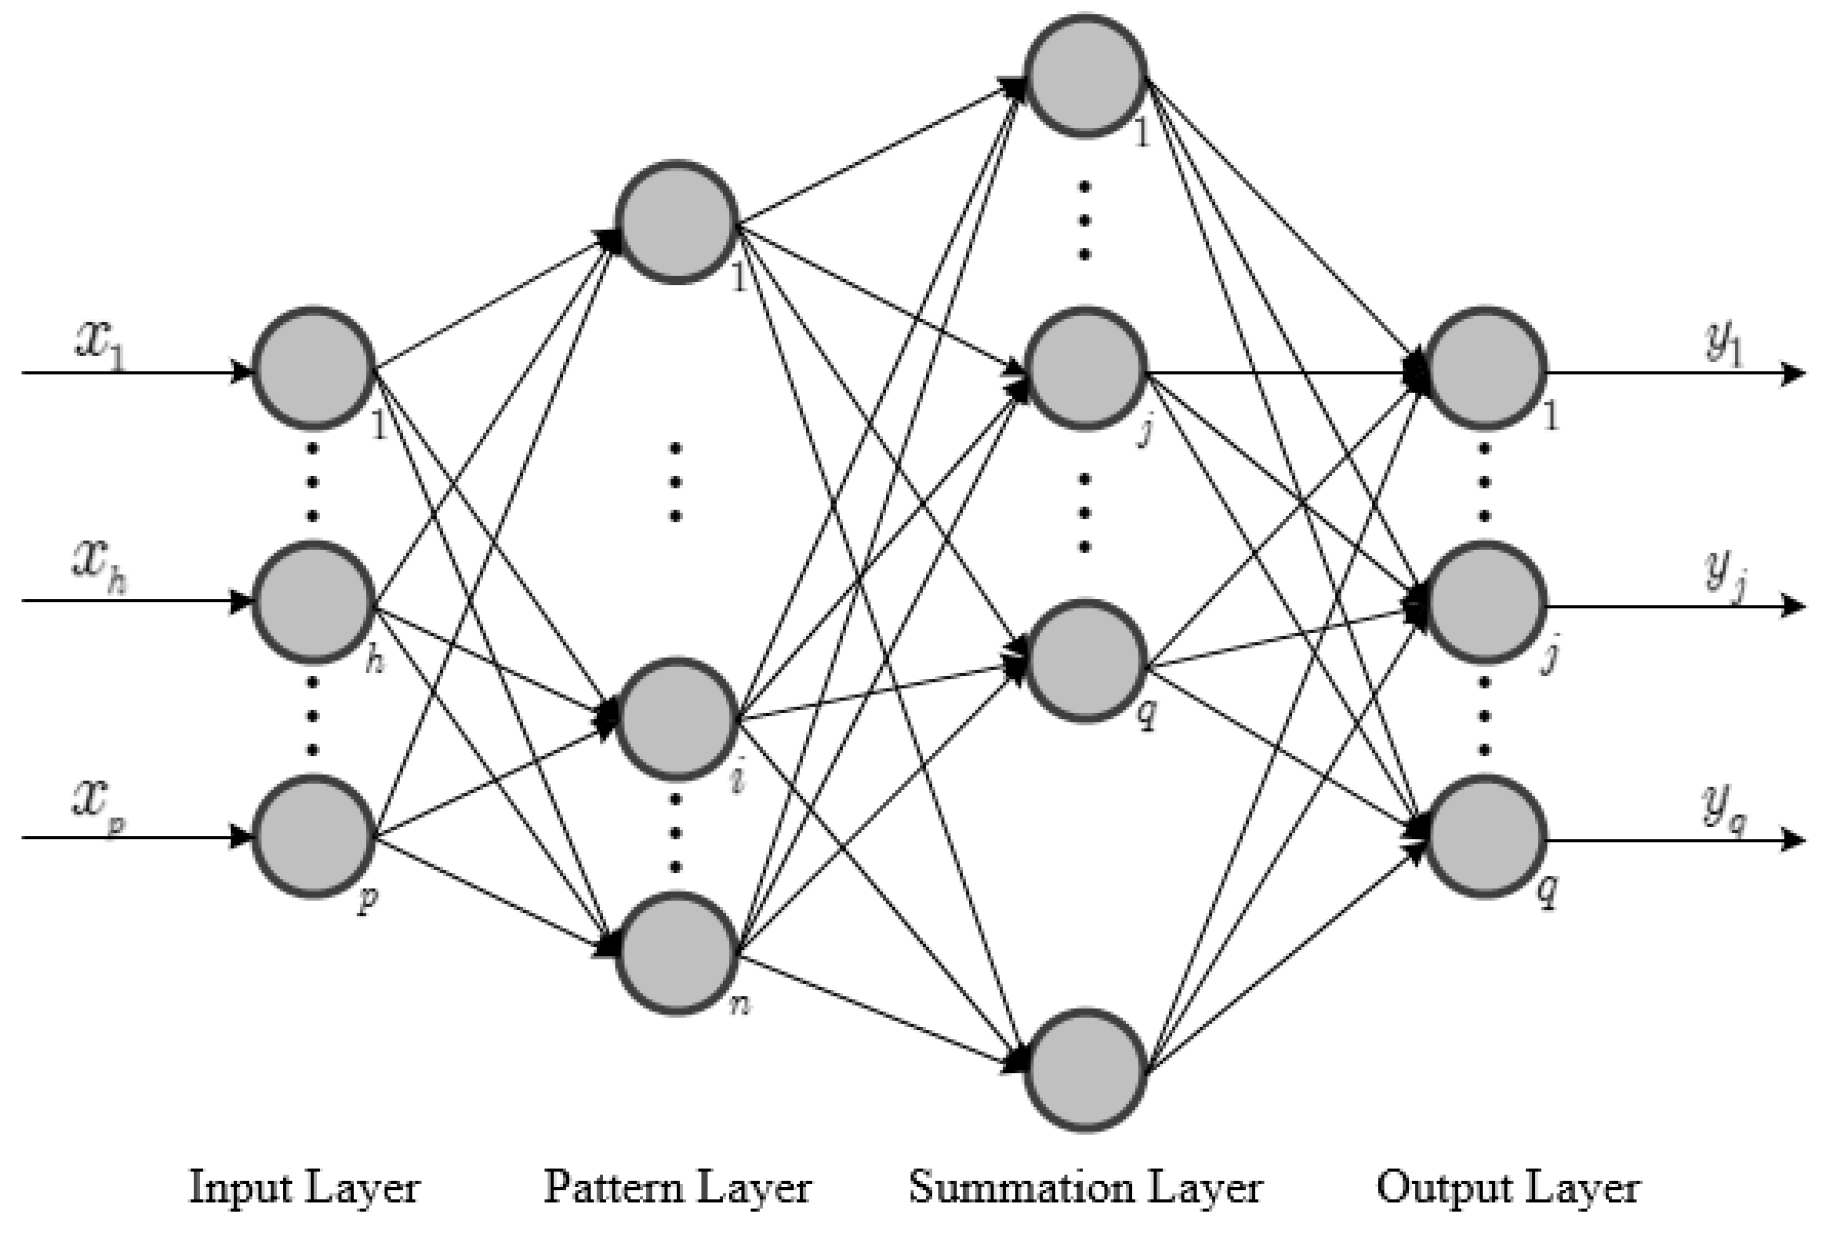
The structure of the GRNN includes the input layer, pattern layer, summation layer, and output layer, as shown in Figure 11. The input vector X is p-dimensional; in this paper, we use Ti defined by Equation (2) as the input, thus p is 149. The output vector Y is q-dimensional, and the specific output includes the steady temperature of the conductor near the contact as the blue points shown in Figure 10; thus, q is equal to 6. The number of neurons in each layer is decided by the number of inputs, outputs, and training data samples, respectively. The training and testing are performed using Python 3.7.
The training results are measured by three metrics: the macro-recall rate (Rmacro), macro-precision rate (Pmacro), and average precision rate (Aave).
R m a c r o = 1 n k = 1 n R k
P m a c r o = 1 n k = 1 n P k
A a v e = 1 n k = 1 n A C C k
To verify the effectiveness of the proposed method, experiments were performed, with the steady-state and transient temperature data corresponding to normal operation, and different degrees of poor contact defects were collected. A total of 150 sets of temperature signals were collected for each thermal defect state in a clean indoor environment—namely, 100 feature vectors, as denoted in (1), are generated. Among them, 120 sets serve as the training set, and the remaining 30 sets serve as the testing set. The test results are reported in Table 2. We note that when considering both steady and transient temperature values, the inversion results demonstrated a high accuracy compared to the steady temperature. For the less significant temperature rises caused by mildly poor contacts, the proposed method could compute the busbar temperature with an approximate 88% accuracy. And we can see that the ambient temperature has a certain influence on the inversion accuracy—namely, the higher the ambient temperature, the lower the accuracy.

4.2. Influence of Different Time Intervals for Feature Selection

As presented in Section 3.4, to characterize the transient temperature characteristics, the critical value is the time interval i. Theoretically, the time interval should be as short as possible, as a shorter interval brings the value closer to the transient state. However, the temperature changes are not a fast process as shown in Figure 3, Figure 4, Figure 5 and Figure 6, and the sensor accuracy, measurement errors are unavoidable. On the other hand, the fact that a smaller time interval results in more feature vectors and consequently more duplicate (or invalid) data, which affects the accuracy of machine learning. Therefore, the time interval i should not be set too small.
In comparison, we also chose 10 min, 25 min, and 50 min as time intervals to generate new feature vectors. According to Section 3.4 and Section 4.1, the input vector dimension p is 1346, 548, and 282, respectively. The same with the 100 min, with 120 sets used to train the network, and 30 sets used to test. The results are reported in Table 3. From Table 3, we can see that the inversion accuracy using the 10 min interval is decreased significantly. The possible reason is that the dimension of the input vector is too large, which causes data redundancy and affects the accuracy of network training. For the 25 min interval, the inversion accuracy increases in a mild poor contact scenario, while the same as the other two scenarios. For the 50 min interval, a slight increase in the inversion accuracy could be observed.
However, limited to the small number of samples (150 samples), the algorithm stability and comparison cannot be guaranteed yet. More samples of temperature test are needed to generate feature vector and train the inversion network, and this is listed as one of future works.

4.3. Influence of Temperature Monitoring Points

From a practical application point of view, the placement of the temperature sensors is restricted by factors such as the form, the installation method of the on-site GIS equipment, and the power supply location. However, different input vectors will affect the inversion accuracy. Therefore, it is necessary to investigate the influence of temperature monitoring points on the final inversion accuracy.
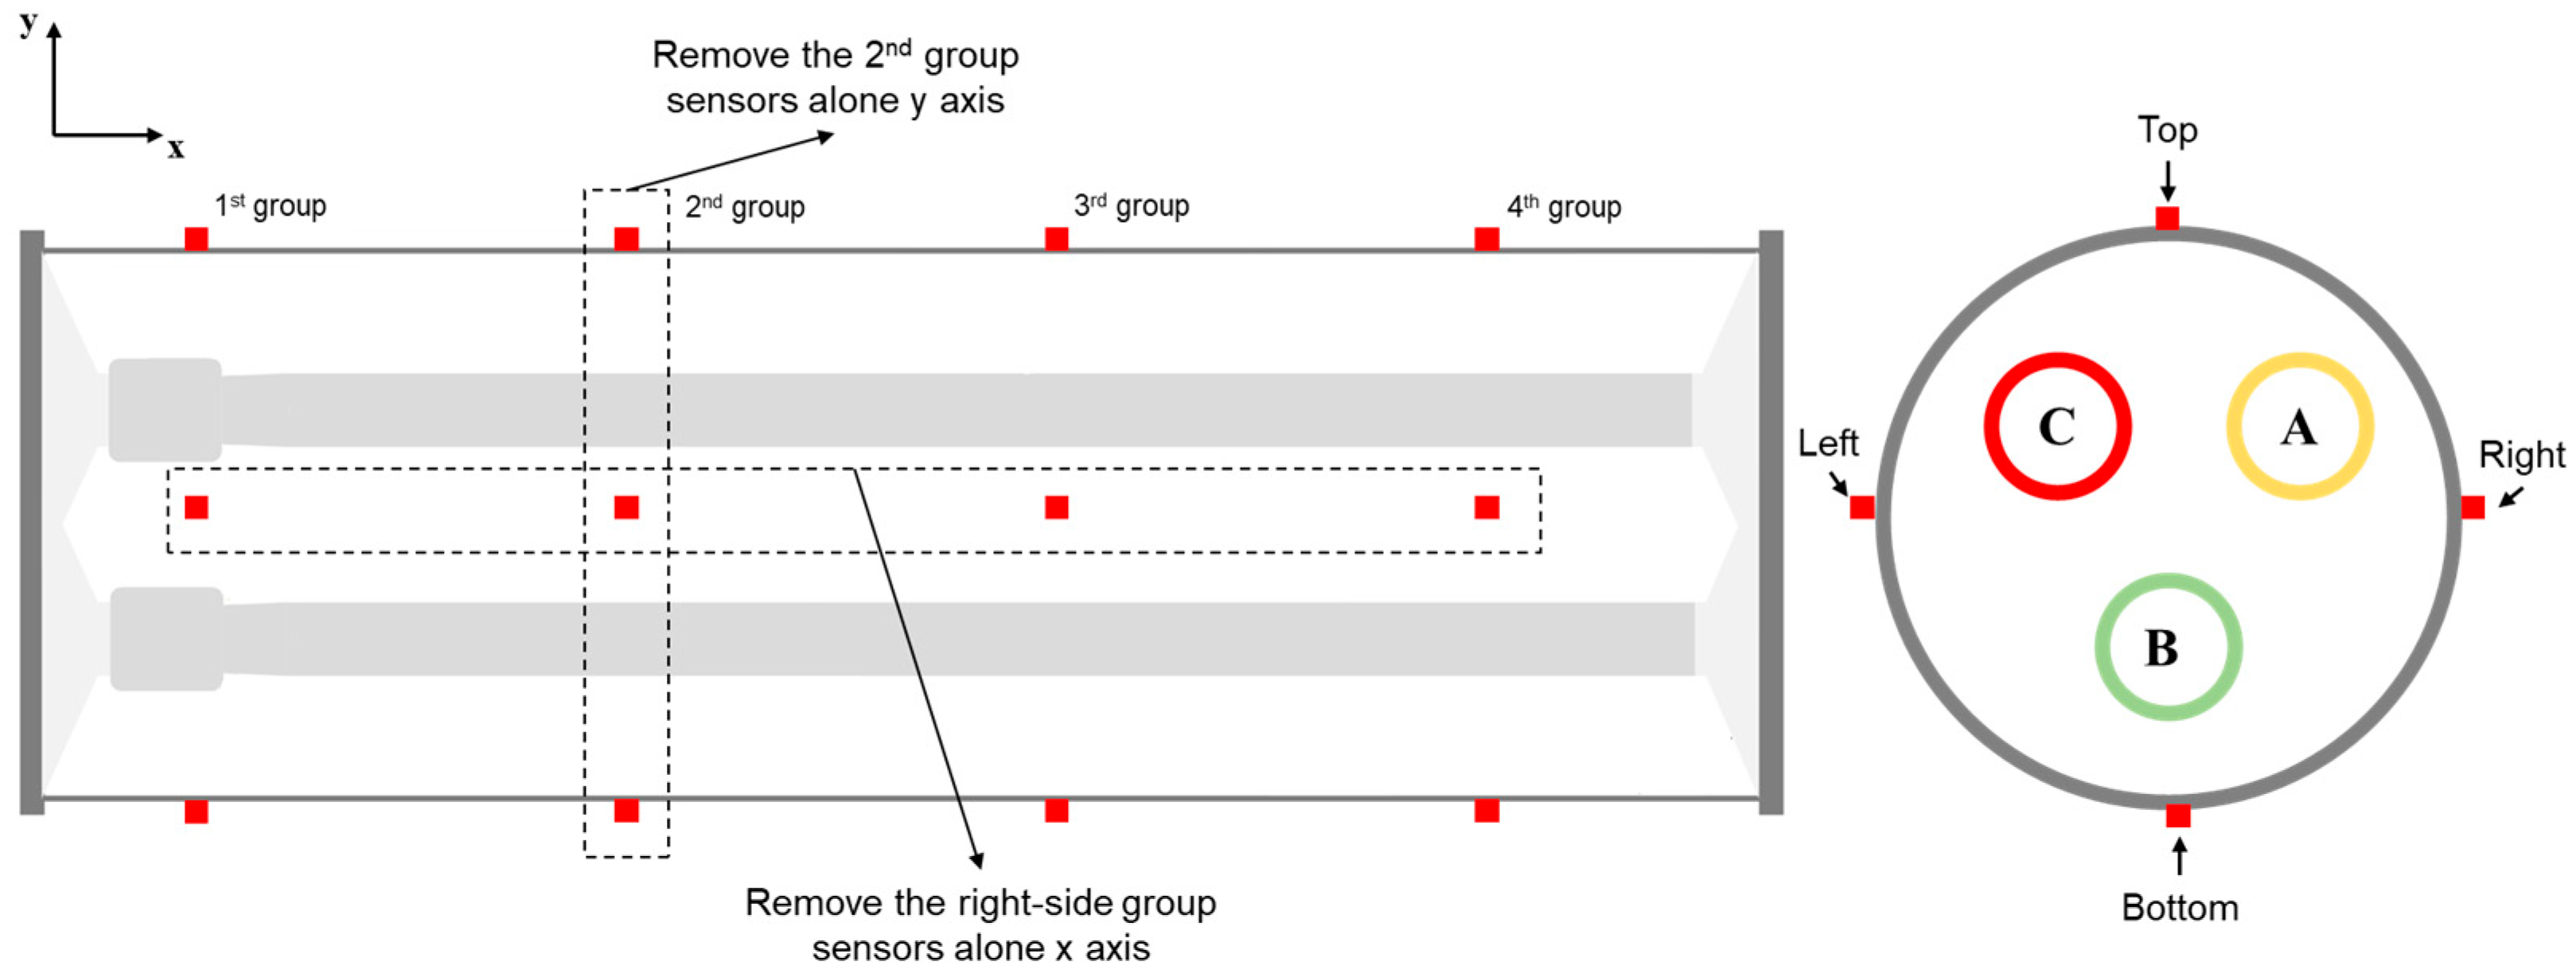
As shown in Figure 12, the general strategy for temperature monitoring points involves an even distribution across the GIS enclosure, which is denoted as the x and y axes. To investigate the influence of different monitoring points, we removed the points along the x or y axis, respectively, then used the remaining points as the input for the inversion network to obtain the output busbar temperature. Ten sets of temperature data were obtained for each removal strategy, and then the average accuracy rate was calculated and is reported in Table 4.
From Table 4 we can observe the following: (1) removing four temperature monitoring points along the y axis, as shown in Figure 12, has no significant effect on the accuracy of the internal busbar temperature inversion and (2) removing four temperature monitoring points along the x axis has a significant impact on the inversion accuracy, and the top-side temperature monitoring points have the greatest impact, i.e., the temperature inversion accuracy decreased to 53.68%. Therefore, removing any points along the y axis has almost the same impact on the inversion accuracy rate; this is because in actual operation, the conductor current is mainly distributed along the axial direction (in Figure 12 the y axis), and the thermal field distribution is approximately the same. While for the points along the x axis, the difference in inversion accuracy is mainly due to the asymmetry of the GIS bus placed horizontally in the process of thermal convection and radiation. The heat exchange in the area above the bus is more significant, and the temperature rise rate is faster, resulting in more obvious temperature gradient changes in this area.

5. Conclusions

This study examined the transient temperature evolution characteristics of GIS based on the real equipment test platform. A busbar temperature inversion method was also proposed by considering both the steady and transient temperatures of the enclosure and environment. The conclusions obtained are as follows:
(1)
From the field application point of view, the temperature monitoring sensors could only be deployed on the surface of the GIS enclosure; thus, the test proved that the GIS enclosure temperature rise is influenced by both the internal conditions and the external environment, and the location of the GIS output has a more significant influence. This conclusion is important for target feature extraction for temperature inversion.
(2)
As presented in this paper, evenly distributed temperature measurement points within the enclosure can obtain richer information and help to assess the temperature distribution inside the GIS.
(3)
The proposed inversion method for the GIS busbar temperature considering transient evolution characteristics has a higher accuracy than traditional characteristic parameters, especially for the recognition of temperature increases due to mild poor contact.
(4)
The monitoring points along the x axis, especially at the top side of the enclosure, have a significant influence on the busbar inversion accuracy. We recommend prioritizing retaining monitoring points near hotspots, especially at the top side of the enclosure, for better performance in practical applications.
However, the study also noted that the transient temperature is defined as a sequence of temperature values over time; thus, the time interval selection is critical for the feature vector and inversion accuracy. Thus, the time interval selection strategy needs to be investigated and optimized further. On the other hand, the limitation of the real temperature rise test makes the training dataset still small for a stable machine learning network. Therefore, in future work, more samples of temperature tests are needed to generate a feature vector and train the inversion network. Finally, for practical application, the impact of different combinations of temperature measurement points on enclosures should be investigated further.

Author Contributions

Conceptualization, L.L. and X.C.; methodology, X.C.; software, F.L. and X.J.; validation, S.W. and J.J.; formal analysis, F.L.; investigation, X.C.; resources, J.J.; data curation, S.W.; writing—original draft preparation, X.C.; writing—review and editing, F.L.; visualization, X.J.; project administration, X.C.; funding acquisition, L.L. All authors have read and agreed to the published version of the manuscript.

Funding

This research was funded by the Science and Technology Project of the State Grid Zhejiang Electric Power Limited Company, grant number 5211DS24000L, project name: Research and Application of Real-Time Digital Mapping Technology for GIS Internal Temperature Status.

Data Availability Statement

Data are contained within the article.

Conflicts of Interest

Authors Xiaoxin Chen, Feiran Li, Xiongwei Jiang, Shaoan Wang and Jiongting Jiang were employed by the State Grid Zhejiang Electric Power Co., Ltd. The remaining authors declare that the research was conducted in the absence of any commercial or financial relationships that could be construed as a potential conflict of interest.

References

  1. Istad, M.; Runde, M. Thirty-six years of service experience with a national population of gas-insulated substations. IEEE Trans. Power Deliv. 2010, 25, 2448–2454. [Google Scholar] [CrossRef]
  2. Runde, M. Failure frequencies for high-voltage circuit breakers, disconnectors, earthing switches, instrument transformers, and gas-insulated switchgear. IEEE Trans. Power Deliv. 2013, 28, 529–530. [Google Scholar] [CrossRef]
  3. Zhou, N.; Luo, L.; Sheng, G.; Jiang, X. Scheduling the imperfect maintenance and replacement of power substation equipment: A risk-based optimization model. IEEE Trans. Power Deliv. 2025, 40, 2154–2166. [Google Scholar] [CrossRef]
  4. Wu, X.W.; Shu, N.Q.; Li, L.; Li, H.T.; Peng, H. Finite element analysis of thermal problems in gas-insulated power apparatus with multiple species transport technique. IEEE Trans. Magn. 2014, 50, 321–324. [Google Scholar] [CrossRef]
  5. Guan, X.; Shu, N.; Peng, H. LBM simulation of heat transfer processes inside GIS capsule filled with different insulation gas mixtures. Math. Comput. Simul. 2021, 188, 212–225. [Google Scholar] [CrossRef]
  6. Dhotre, M.T.; Korbel, J.; Ye, X.; Ostrowski, J.; Kotilainen, S.; Kriegel, M. CFD simulation of temperature rise in high voltage circuit breakers. IEEE Trans. Power Deliv. 2017, 32, 2530–2536. [Google Scholar] [CrossRef]
  7. Pawar, S.; Joshi, K.; Andrews, L.; Kale, S. Application of computational fluid dynamics to reduce the new product development cycle time of the SF6 gas circuit breaker. IEEE Trans. Power Del. 2012, 27, 156–163. [Google Scholar] [CrossRef]
  8. Zhao, L.; Wang, Z.; Zhu, H.; Hong, G.; Ren, J.; Long, W.; Huang, X. Study on temperature rise characteristics of GIS disconnector under different operating conditions. IEEE Trans. Power Deliv. 2021, 36, 3601–3610. [Google Scholar] [CrossRef]
  9. Doukas, D.I.; Papadopoulos, T.A.; Chrysochos, A.I.; Labridis, D.P.; Papagiannis, G.K. Multiphysics modeling for transient analysis of gas-insulated lines. IEEE Trans. Power Deliv. 2018, 33, 2786–2793. [Google Scholar] [CrossRef]
  10. Koller, L.; Novák, B. Transient heating of gas insulated switchgears. In Proceedings of the 2010 IEEE/PES Transmission & Distribution Conference & Exposition (T&D), New Orleans, LA, USA, 19–22 April 2010; pp. 1–7. [Google Scholar]
  11. Li, H.; Shu, N.; Wu, X.; Peng, H.; Li, Z. Scale modeling on the overheat failure of bus contacts in gas-insulated switchgears. IEEE Trans. Magn. 2014, 50, 305–308. [Google Scholar] [CrossRef]
  12. Minaguchi, D.; Ginno, M.; Itaka, K.; Furukawa, H.; Ninomiya, K.; Hayashi, T. Heat transfer characteristics of gas-insulated transmission lines. IEEE Trans. Power Deliv. 1986, 1, 1–9. [Google Scholar] [CrossRef]
  13. Han, S.; Yang, F.; Jiang, H.; Yang, G.; Zhang, N.; Wang, D. A smart thermography camera and application in the diagnosis of electrical equipment. IEEE Trans. Instrum. Meas. 2021, 70, 5012108. [Google Scholar] [CrossRef]
  14. Fjeld, E.; Rondeel, W.G.J.; Attar, E.; Singh, S. Estimate the temperature rise of medium voltage metal enclosed switchgear by simplified heat transfer calculations. IEEE Trans. Power Deliv. 2021, 36, 853–860. [Google Scholar] [CrossRef]
  15. Kim, S.W.; Kim, H.; Hahn, S.; Lee, B.; Park, K.; Shin, Y.; Song, W.; Kim, J.; Shin, I. Coupled finite-element-analytic technique for prediction of temperature rise in power apparatus. IEEE Trans. Magn. 2002, 38, 921–924. [Google Scholar] [CrossRef]
  16. Zhang, L.; Li, R.; Lu, Y.; Rao, X. Inversion method for contact temperature of GIS disconnect switch. IEEE Access 2024, 12, 44553–44563. [Google Scholar] [CrossRef]
  17. Kumar, U.; Tiwari, N.; Rao, M.M. Transient thermal analysis of gas insulated switchgear modules using thermal network approach. Int. J. Emerg. Electr. Power Syst. 2024, 25, 163–173. [Google Scholar]
  18. Parzen, E. On estimation of a probability density function and mode. Ann. Math. Stat. 1962, 33, 1065–1076. [Google Scholar] [CrossRef]
  19. Specht, D.F. A general regression neural network. IEEE Trans. Neural Netw. 1991, 2, 568–576. [Google Scholar] [CrossRef] [PubMed]
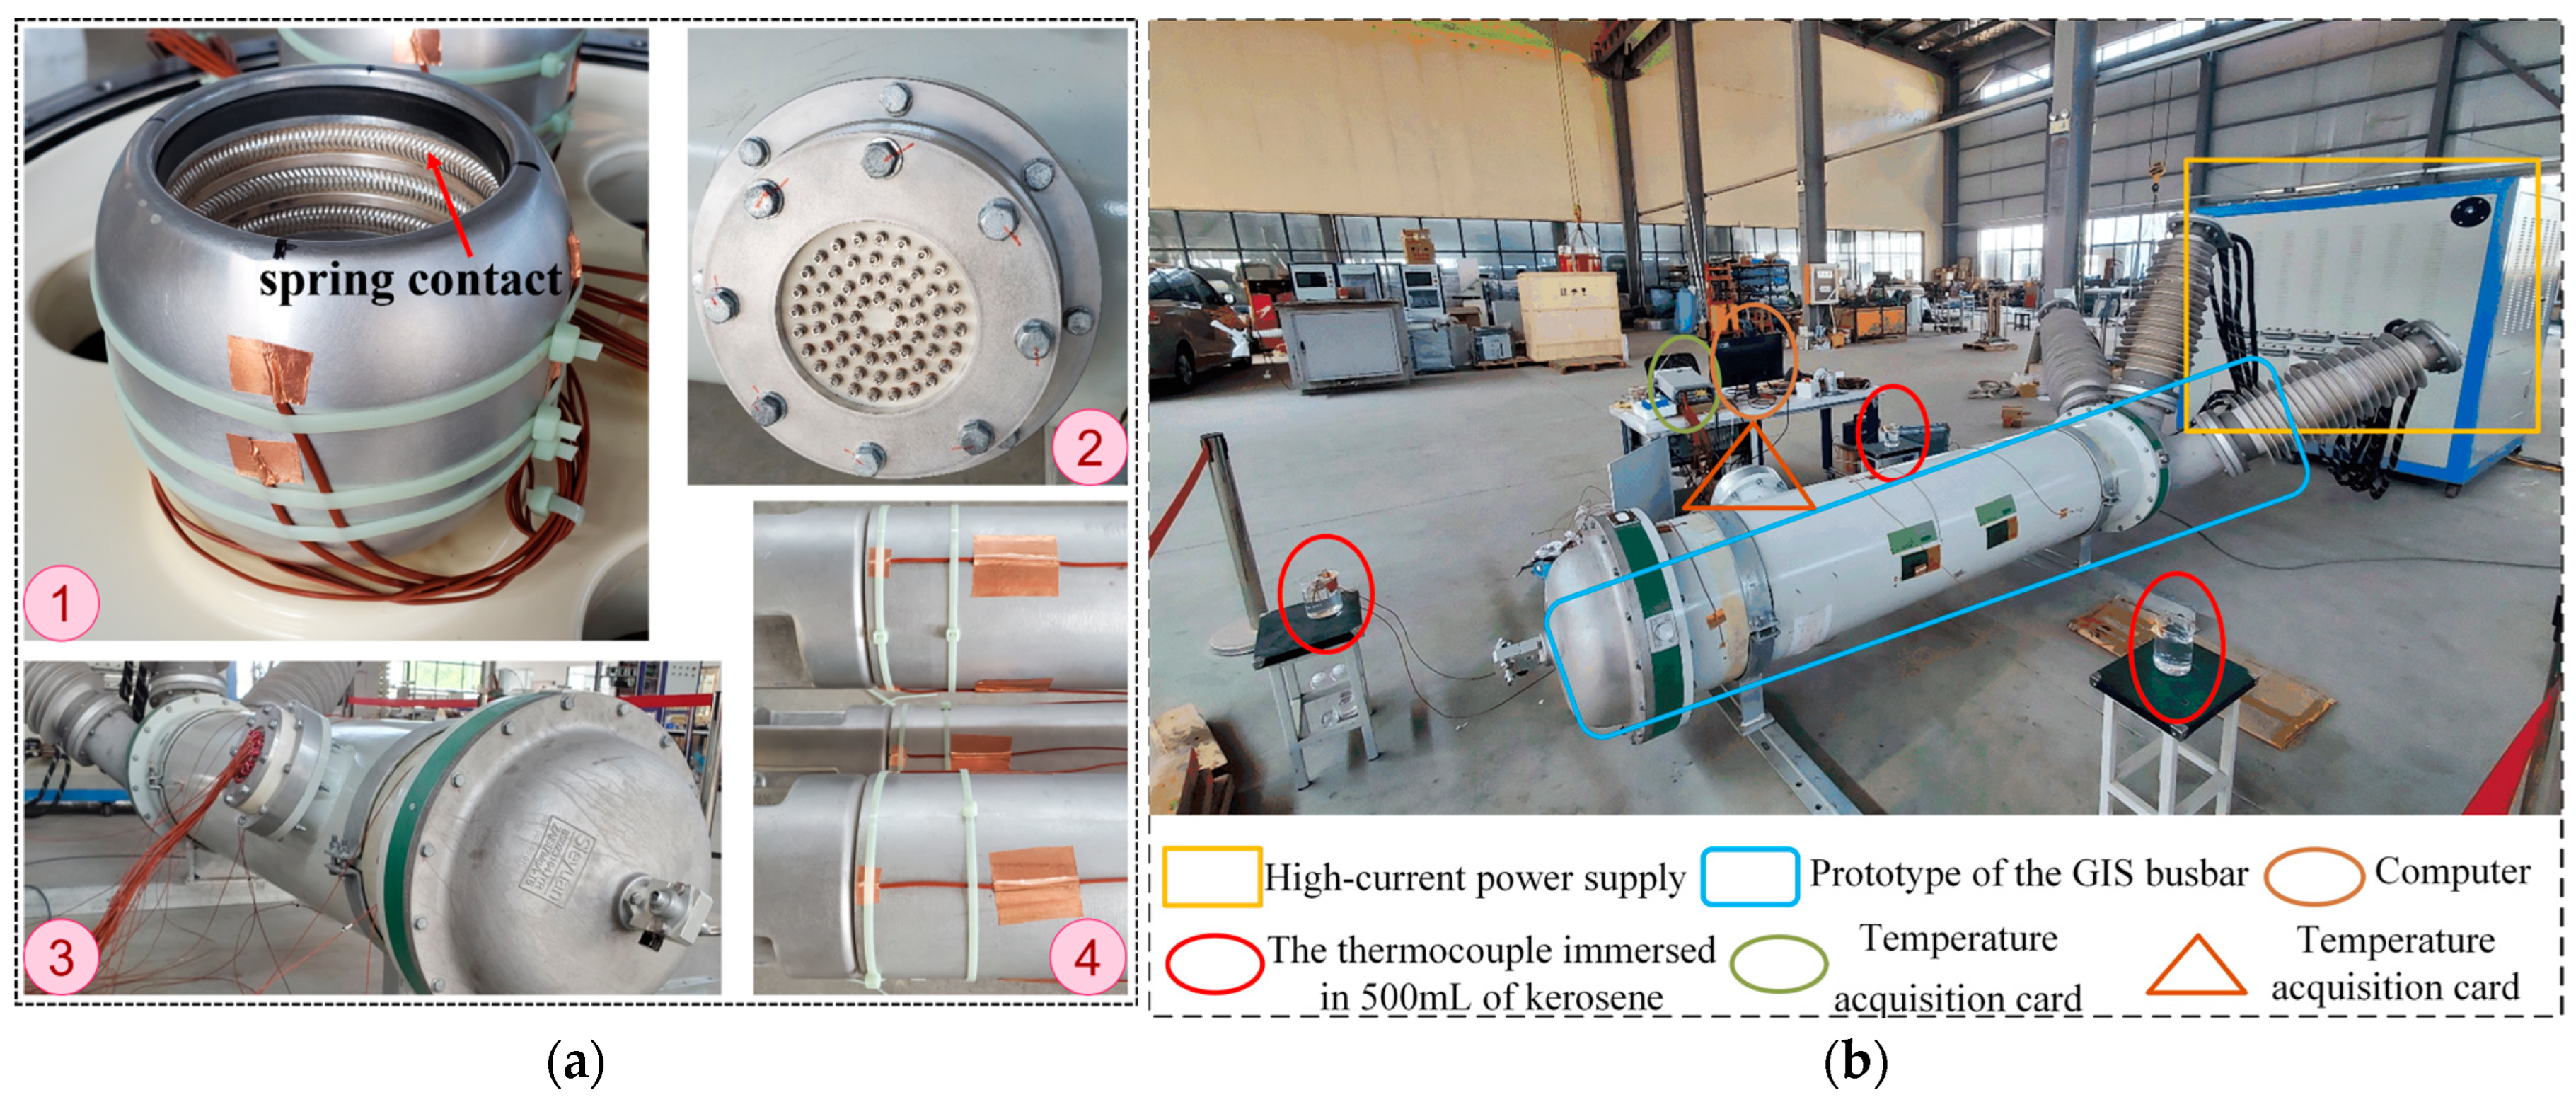
Figure 1. GIS busbar prototype and test platform. (a) The placement of thermocouples (where ① denotes sensors on contact, ② and ③ denote the cable outlet holes on the cover plate, ④ denotes the sensors on conductor); (b) the layout of experimental equipment for the GIS temperature test.
Electronics 14 04606 g001
Figure 2. GIS busbar prototype and test platform.
Electronics 14 04606 g002
Figure 3. Evolution of external ambient temperature.
Electronics 14 04606 g003
Figure 4. Evolution of enclosure temperature under load current of 2000 A.
Electronics 14 04606 g004
Figure 5. Evolution of enclosure temperature under load current of 3000 A.
Electronics 14 04606 g005
Figure 6. Evolution of enclosure temperature under 2000 A compared with ambient temperature.
Electronics 14 04606 g006
Figure 7. Evolution of enclosure temperature under 3000 A compared with ambient temperature.
Electronics 14 04606 g007
Figure 8. Evolution of conductor temperature under load current of 2000 A. (a) the sensors at the top of Phase A; (b) the sensors on the contact holder.
Electronics 14 04606 g008
Figure 9. Evolution of conductor temperature under load current of 3000 A.
Electronics 14 04606 g009
Figure 10. Schematic diagram of temperature feature selection.
Electronics 14 04606 g010
Figure 11. Architecture of GRNN.
Electronics 14 04606 g011
Figure 12. Different temperature monitoring points for busbar temperature inversion.
Electronics 14 04606 g012
Table 1. Conductor temperature rise at different locations.
PhaseThermocouple NumberStarting Temperature/°CEnding Temperature (680 min)/°CTemperature Rise/K
ATCc1128.568.239.7
TCc1229.568.939.4
TCc1329.969.439.5
TCc1427.466.839.4
BTCc1229.367.936.6
TCc1429.165.636.5
CTCc1228.167.539.4
TCc1429.268.639.4
Table 2. Different inversion results considering the use or disuse of the transient temperature.
TypeAmbient Temperature/°CProposed Method
R m a c r o / P m a c r o (%)
Steady Temperature Only
R m a c r o / P m a c r o (%)
Normal State
(20 μΩ)
1096.2/89.680.1/75.6
2095.7/88.178.9/83.4
3094.3/88.677.3/76.1
Mild Poor
Contact
(200 μΩ)
1089.7/92.373.9/70.1
2087.6/90.870.6/73.9
3086.2/89.068.4/66.8
Severe Poor Contact
(300 μΩ)
1099.1/97.599.7/96.9
2098.8/96.997.1/93.6
3098.4/96.395.7/91.9
A a v e (%)1096.485.9
2093.879.8
3091.577.2
Table 3. Different inversion results considering different time interval.
TypeAmbient Temperature/°C10 min Interval
R m a c r o / P m a c r o (%)
25 min Interval
R m a c r o / P m a c r o (%)
50 min Interval
R m a c r o / P m a c r o (%)
Normal State
(20 μΩ)
1089.4/80.296.9/89.797.3/90.2
2088.7/81.596.1/88.396.4/89.5
3087.7/80.195.2/89.195.1/89.7
Mild Poor
Contact
(200 μΩ)
1077.3/83.590.2/91.591.4/93.7
2077.2/80.989.5/90.189.0/91.8
3076.5/79.888.3/88.988.8/90.4
Severe Poor Contact
(300 μΩ)
1090.4/88.798.7/96.399.3/97.8
2090.0/88.998.1/95.499.2/96.8
3089.5/87.697.8/95.198.5/97.1
A a v e (%)1084.695.897.2
2085.195.195.9
3083.791.392.3
Table 4. Inversion results for different temperature monitoring points.
DirectionRemoved GroupAccuracy Rate (%)
Along x axisTop-side group53.68
Right-side group88.75
Bottom-side group89.01
Left-side group83.57
Along y axis1st group93.92
2nd group93.34
3rd group94.17
4th group93.68
Disclaimer/Publisher’s Note: The statements, opinions and data contained in all publications are solely those of the individual author(s) and contributor(s) and not of MDPI and/or the editor(s). MDPI and/or the editor(s) disclaim responsibility for any injury to people or property resulting from any ideas, methods, instructions or products referred to in the content.