Article

Evaluation of Power Requirement for a Self-Propelled Garlic Collector Based on Load Experiments and Variable Impact Analysis Under Various Operating Conditions

1
Department of Bio-Industrial Machinery Engineering, Kyungpook National University, Daegu 41566, Republic of Korea
2
Department of Agricultural Engineering, National Institute of Agricultural Science, RDA, Jeonju 55365, Republic of Korea
3
Bulls Co., Ltd., Seongju 40053, Republic of Korea
4
Department of Smart Bio-Industrial Mechanical Engineering, Kyungpook National University, Daegu 41566, Republic of Korea
5
Upland Field Machinery Research Center, Kyungpook National University, Daegu 41566, Republic of Korea
*
Author to whom correspondence should be addressed.
Electronics 2025, 14(23), 4559; https://doi.org/10.3390/electronics14234559
Submission received: 15 September 2025 / Revised: 13 November 2025 / Accepted: 19 November 2025 / Published: 21 November 2025
(This article belongs to the Special Issue Power System Driven Power Electronics)

Abstract

Garlic is a labor-intensive underground crop in Republic of Korea, where harvesting and collection require substantial manual work. Although self-propelled garlic collectors have been introduced, most were developed empirically, and quantitative evaluations of their load characteristics and power requirements under field conditions remain limited. This study quantifies the power requirements of the driving, collection, and transport parts of a self-propelled garlic collector and examines the effects of driving speed, collecting speed, transporting speed, and working depth. A field measurement system was developed to record torque, rotational speed, flow rate, and pressure, and these data were used to calculate the power requirement of each major component and the overall machine. Results showed that driving speed was the dominant factor affecting total power use, as the driving part displayed a clear increase with higher speeds. In contrast, the collection and transport parts exhibited only minor changes, and the influence of working depth was negligible. The maximum total power requirement was 12.28 kW, about 30% of the rated engine power of 40.2 kW, indicating that engine capacity exceeded actual requirement. These findings provide quantitative insights into self-propelled garlic collectors and essential data for future studies on engine downsizing and power transmission design.

1. Introduction

In recent years, agriculture in Republic of Korea has faced a severe labor shortage caused by the rapid feminization and aging of the rural workforce. The proportion of young people engaged in farming has sharply declined, while the share of elderly farmers over 65 continues to rise [1,2]. These demographic changes have led to an absolute reduction in the agricultural workforce, making it increasingly difficult to secure stable labor in rural areas [3]. The shortage is not limited to the overall decline in worker numbers but also includes difficulties in mobilizing sufficient labor during peak periods such as sowing and harvesting. This structural constraint heightens the risk of reduced crop productivity and quality, reinforcing the urgent need for agricultural mechanization [4].
The mechanization rate for rice and other grain crops in Republic of Korea has already exceeded 90%, establishing a relatively stable production system [5]. In contrast, underground crops face diverse cultivation environments and complex processes, resulting in much lower mechanization rates [6]. Garlic, in particular, is a labor-intensive crop with a large cultivation area, yet its mechanization rate remains only 43.8%, concentrated mainly in harvesting and collection [7]. Consequently, rural farms experience simultaneous labor shortages and rising labor costs during the garlic season, imposing significant economic burdens [8]. Improving the mechanization of garlic harvesting and collection has therefore become one of the most urgent priorities, with direct implications for farm sustainability and national food self-sufficiency [9].
Garlic production involves a series of processes, including planting, stem cutting, harvesting, collection, and post-harvest management. Among these, harvesting and collection demand the greatest labor input [10]. Harvesting involves excavating garlic bulbs from ridges and lifting them to the surface, while collection includes gathering, transporting, sorting, and storing the bulbs. Collection work is particularly repetitive and labor-intensive, often delaying the entire workflow [11]. As a result, harvesting and collection are recognized as the most inefficient and unstable stages of production. Mechanizing these stages can shorten working time and enhance the stability of the production system, thereby contributing to a sustainable farming base [11].
In response, self-propelled garlic collectors have recently been developed and introduced. These machines integrate driving, collection, and transport parts into a single system, enabling continuous field operations and greater efficiency compared with tractor-mounted harvesters. However, most self-propelled collectors to date have been designed empirically, without adequately considering the diverse load conditions encountered in practice [11]. This limitation highlights the need for improvements in reliability, durability, and energy efficiency, underscoring the importance of research grounded in scientific and quantitative analysis [12,13].
Each part of a self-propelled collector operates under different load conditions that directly influence overall machine performance. The collection part is strongly affected by soil properties and digging depth, while both the collection and transport parts vary in power requirements depending on rotational speed [14]. The driving part is influenced by soil conditions and driving speed. These factors interact in complex ways to determine the system’s total power requirement. Analyses limited to individual parts cannot sufficiently explain overall performance, making integrated load analysis under actual field conditions essential [15,16,17,18]. Such analysis not only improves machine design efficiency but also provides valuable guidance for establishing optimal operating parameters and achieving long-term energy savings [19,20,21].
Studies on underground crop collectors have focused on the design and performance evaluation of various machines, with some also addressing load characteristics under field conditions. These studies demonstrate the necessity of underground crop mechanization but remain limited in scope and target. Zhang et al. (2023), for instance, experimentally analyzed the effects of soil conditions, digging depth, and conveying speed on harvesting performance and fuel consumption using a handheld garlic harvester; however, their work was restricted to small-scale equipment and did not address the power requirements of self-propelled garlic collectors under field conditions [22]. Swe et al. (2025) theoretically investigated the load characteristics of a radish collector and presented power requirement estimates for different soil conditions and design parameters, but their analysis relied primarily on theoretical approaches rather than experimental validation [23]. Oduma et al. (2023) modeled the combined effects of working width, operational speed, and cutting depth on draft force and power requirements of tillage implements under realistic conditions, yet their study did not extend to the integrated load characteristics of collector mechanisms [24]. Sun et al. (2018) designed and developed a self-propelled single-row garlic harvester and conducted both simulation and field tests, evaluating overall harvesting performance—including digging, conveying, stem cutting, and gathering—but did not isolate the integrated load and power characteristics of the collector part [25]. Hou et al. (2020) [26] designed and tested a 4S-6 self-propelled garlic combine harvester capable of digging, clamping, and bulb transportation through theoretical optimization and field validation. However, their study primarily focused on performance parameters such as loss and damage rates rather than conducting a quantitative analysis of load characteristics within each subsystem [26]. Similarly, Zhu et al. (2022) [27] and Zhang et al. (2023) [22] analyzed the design and performance of self-propelled garlic harvesters in China under field conditions, investigating how operational parameters of key components affected harvesting efficiency and damage rates. Nevertheless, their work focused on performance evaluation rather than the quantitative assessment of power requirements for each component of a self-propelled garlic collector under actual field conditions [22,27]. Lee et al. (2023) employed a strain gauge to quantitatively measure the stress on a threshing bar under varying rotational speeds, emphasizing the need for component-level quantitative analysis of power requirements [28]. Nevertheless, these studies collectively focused on performance evaluation rather than the quantitative assessment of power requirements for each component of a self-propelled garlic collector under actual field conditions. Overall, although considerable research has examined the power requirements of tractor-mounted implements in field conditions, investigations of self-propelled garlic collectors operating in real working environments remain limited.
Therefore, this study aims to quantitatively analyze the power requirements of a self-propelled garlic collector under actual field conditions through load experiments that reflect diverse operating parameters. Considering the findings of previous studies, the driving speed is expected to exert the most significant influence on total power variation within the typical operating range of 0.05–0.25 m/s, serving as a key explanatory variable in the regression analysis [29]. Unlike earlier studies restricted to theoretical or small-scale testing, the present research introduces a synchronized multi-sensor field measurement system that integrates torque, pressure, and flow data in real time to evaluate each major component under actual operating conditions. This approach offers a novel methodological framework for analyzing the power requirements of self-propelled agricultural machinery. This study is expected to provide valuable data and insights to support the optimal design and performance improvement of self-propelled garlic collectors. The specific objectives are as follows: (1) development of a field measurement system to evaluate power requirement, (2) selection of key variables and analysis of their effects through field experiments, and (3) evaluation of the overall power requirement based on the identified variables.
This study provides the first comprehensive field-based analysis of the power requirements of self-propelled garlic collectors. By integrating experimental data across key operating parameters, it offers practical insights for machine design, energy efficiency, and engine optimization, supporting both technological development and broader adoption in agricultural practice.

2. Materials and Methods

2.1. Self-Propelled Garlic Collector

A self-propelled garlic collector with a 40.2 kW engine was used to measure the power requirements of each main component. The engine is a four-stroke, water-cooled, inline four-cylinder turbocharged diesel unit that improves both power and fuel efficiency. It delivers a maximum torque of 182.6 N·m at 1700 rpm and reaches its rated power at 2600 rpm. The collector comprises three primary parts: the collection part, which excavates and gathers garlic from the soil using a gear-chain mechanism; the transport part, which conveys the garlic while separating foreign material; and the driving part, which propels the machine on crawler tracks. The machine’s overall dimensions are 5580 mm (L) × 2205 mm (W) × 2100 mm (H), and its mass is 3170 kg. The operator’s seat is located on the left side when viewed from the front, allowing the operator to control the rotational speeds of the main parts and monitor their status simultaneously. The driving part is controlled by a lever-based system that provides two operating modes (high and low speed) rather than a multi-stage gearbox. The overall structure and arrangement of the main parts are illustrated in Figure 1, and the detailed engine and machine specifications are summarized in Table 1.

2.2. Power Transmission System of the Garlic Collector

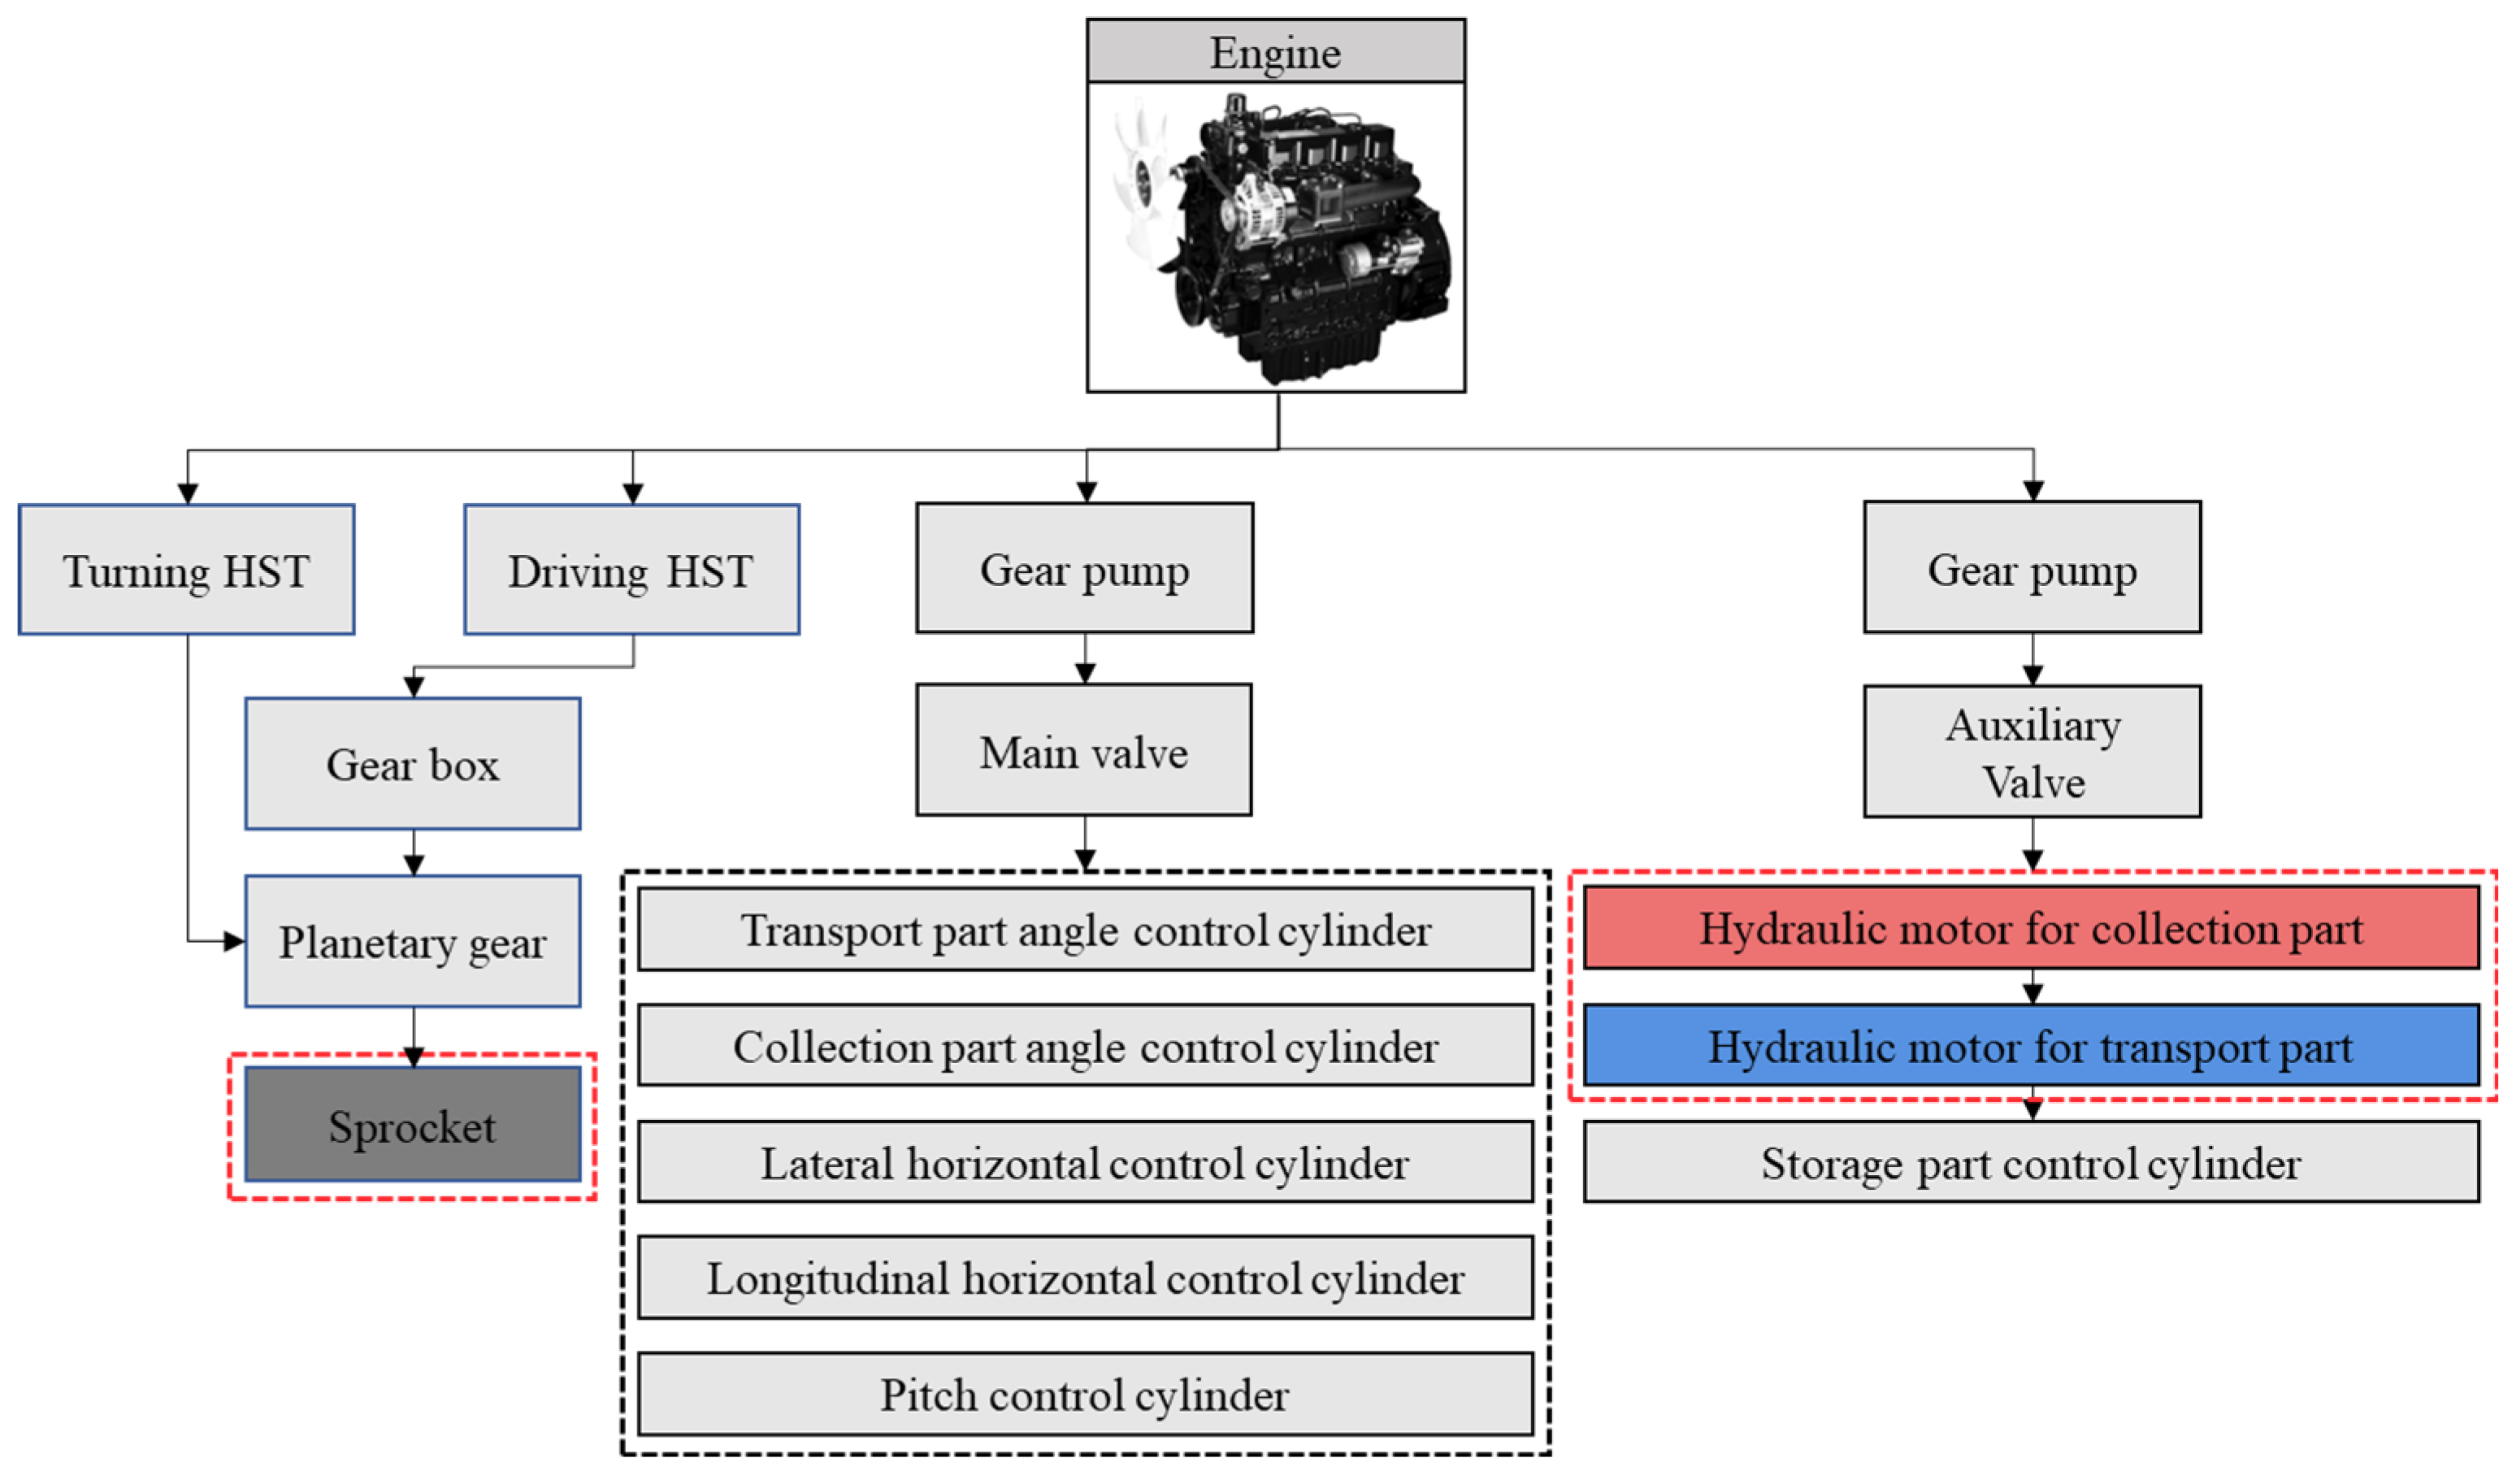
The power transmission system of the self-propelled garlic collector consists of two hydrostatic transmissions (HSTs), gear pumps, and both main and auxiliary hydraulic valves, as illustrated in Figure 2. The main hydraulic valve operates the control cylinders, while the auxiliary hydraulic valve supplies power to the collection and transport parts. The two HSTs are divided into a driving HST and a turning HST. The driving HST transfers engine power to the transmission through a hydraulic motor to enable straight-line driving. The turning HST regulates the planetary gear ring gears on both sides in response to control signals, creating a speed difference between the crawler tracks and enabling turning. Together, these mechanisms deliver power to the drive sprocket, which propels the driving part. A gear pump connected to the engine PTO supplies hydraulic oil to the main hydraulic valve. Solenoid valves linked to the main valve control five cylinders, which adjust the angles of the collection and transport parts, maintain lateral and longitudinal leveling, and regulate pitch. The auxiliary hydraulic valve receives oil from another gear pump connected to the transmission PTO, ensuring stable and continuous operation. Among the three solenoid valves connected to the auxiliary valve, one directs flow to the collection part motor, while the transport part motor is powered by the remaining flow discharged from the collection motor.
In this study, the primary power consumers were the drive sprocket of the driving part, powered through the driving and turning HSTs, and the hydraulic motors of the collection and transport parts, supplied through the auxiliary hydraulic valve, as indicated by the dotted box in Figure 2. In contrast, the storage cylinder linked to the auxiliary valve and the control cylinders powered by the main valve were excluded from analysis because they operate intermittently and require relatively low power.

2.3. Power Requirement Measurement System of the Garlic Collector

To evaluate the loads of the main components identified as the primary power consumers of the garlic collector, a dedicated measurement system was developed, as illustrated in Figure 3. For the driving part, sprocket torque was measured by attaching strain gauges directly to the sprocket, converting it into a torque sensor, and transmitting signals via a telemetry system (Telemetry, MANNER Sensortelemetrie GmbH, Spaichingen, Germany). The sprocket’s rotational speed was measured using an encoder (E50S8, Autonics, Busan, Republic of Korea) mounted on a custom jig, enabling the simultaneous acquisition of torque and rotational speed data. For the collection and transport parts, both flow rate and pressure were recorded using sensors installed on the inlet lines of their respective hydraulic motors. Flow rate was measured with a flow sensor (Hysense QG100, Hydrotechnik, Limburg an der Lahn, Germany), and pressure was monitored with a pressure sensor (Hysense PR130, Hydrotechnik, Limburg an der Lahn, Germany). This configuration allowed for direct measurement of the hydraulic motor operating conditions and quantitative evaluation of loads in the collection and transport systems. The driving speed of the collector was measured in real time using a GPS device (MRP-2000, MBC RTK, Seoul, Republic of Korea) mounted on the chassis, providing field-based verification of both travel speed and load characteristics under actual operating conditions.
Although different sensor types were employed for the driving, collection, and transport systems due to their distinct mechanical and hydraulic characteristics, all measurement signals were synchronized at 300 Hz using the data acquisition system (QuantumX MX840B, HBM, Darmstadt, Germany) to ensure temporal consistency. The torque sensor was calibrated through an indoor torque verification experiment using an experimentally derived calibration coefficient, while the hydraulic sensors were verified under steady-state pressure and flow conditions to ensure stable signal output. The overall uncertainty of each sensor was maintained within ±1% FS. The specifications and calibration parameters of all sensors are summarized in Table 2, and variations in sensor parameters did not affect the measurement results.

2.4. Field Experiments

The effects of key variables were evaluated under three experimental conditions. First, the influence of collection and transport rotational speed was assessed with the engine at idle to isolate hydraulic power requirement. The collection part speed was tested at two levels (35 and 45 rpm), and the transport part at three levels (30, 40, and 50 rpm). Under these conditions, only the hydraulic power of the collection and transport parts was measured; the driving part was excluded.
Second, working depth was examined under in-situ soil conditions in a field at Yongseok-ri, Changnyeong-eup, Changnyeong-gun, Gyeongsangnam-do (35°30′34.8″ N, 128°28′37.8″ E). Working depths were set at 8.5, 10, and 13 cm, representing the typical range used in practical operations.
Third, driving speed was evaluated on actual ridges. Based on the target work efficiency of 0.9 h per 10 a and the 1.2 m collection width, the theoretical operating speed was calculated as approximately 0.26 m/s; however, practical garlic harvesting requires lower and more controlled speeds to maintain acceptable collection rate and crop protection. Therefore, discrete experimental speeds of 0.05, 0.15, and 0.25 m/s were selected to minimize dynamic disturbances and to isolate subsystem load characteristics. Subsequently, field trials in Hak-ri, Deokgok-myeon, Hapcheon-gun, Gyeongsangnam-do (35°37′19.5″ N, 128°21′26.3″ E) varied driving speed continuously from 0 to 0.50 m/s to capture operational response. For each driving speed, load data from the main parts were recorded and analyzed.
Figure 4 illustrates the entire garlic cultivation and harvesting sequence: soil preparation, ridge formation and mulching, planting, stem cutting and harvesting, and collection. The present analysis concentrates on the post-lifting collection stage, specifically, the gathering of dried garlic bulbs and residues remaining on the soil surface after harvest, an operational condition distinct from the harvesting processes examined in previous studies.
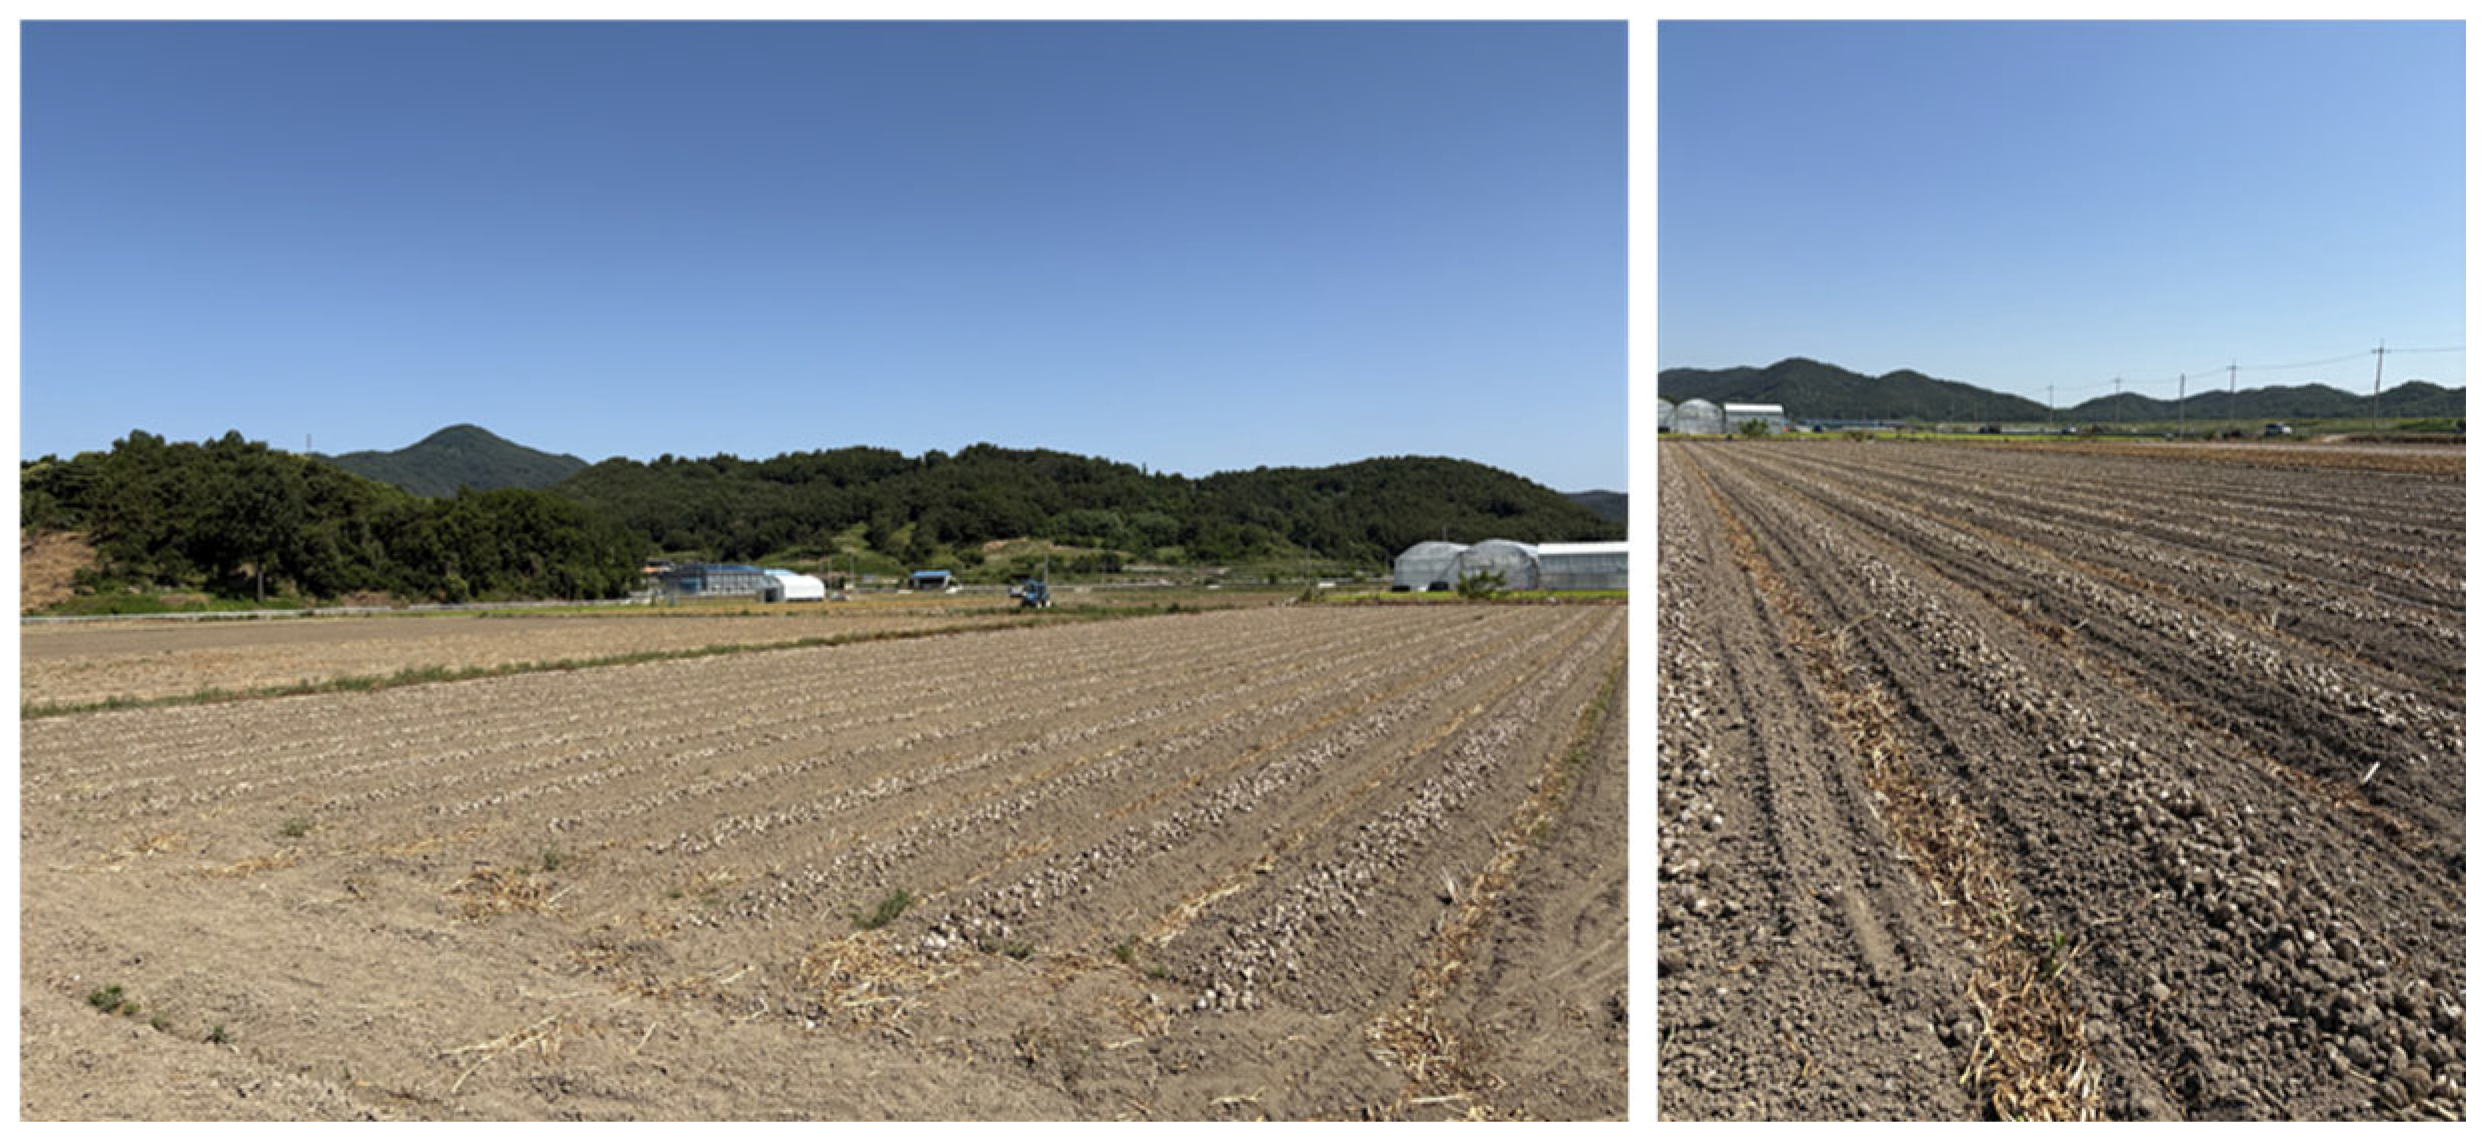
Figure 5 shows the experimental field after harvest and excavation, with dried garlic aggregated on the soil surface and the field surface leveled. All field experiments were conducted on a flat, post-harvest field to evaluate collector performance during dried-garlic collection, where the soil surface was fully dried and compacted. Under these conditions, soil hardness was not treated as a relevant variable because collection occurred on a uniform surface without excavation resistance [30]. Similarly, crop lodging was not considered, since stems had already been cut and bulbs lay on the soil surface at the collection stage. The post-harvest field exhibited a uniform residue density of approximately 180 plants m−2, minimizing the influence of crop density on measured power requirements. Nevertheless, this post-harvest condition may produce load distributions and power characteristics for the driving and collection systems that differ from those encountered during the harvesting phase.
The soil properties of the primary garlic-producing region are critical parameters that directly influence the driving resistance, power requirements, and operational efficiency of agricultural machinery such as self-propelled collectors. Therefore, quantifying soil parameters, including moisture content, texture, and cone index (CI), under actual field conditions is essential for analyzing the load characteristics and operating performance of the collector [31,32].
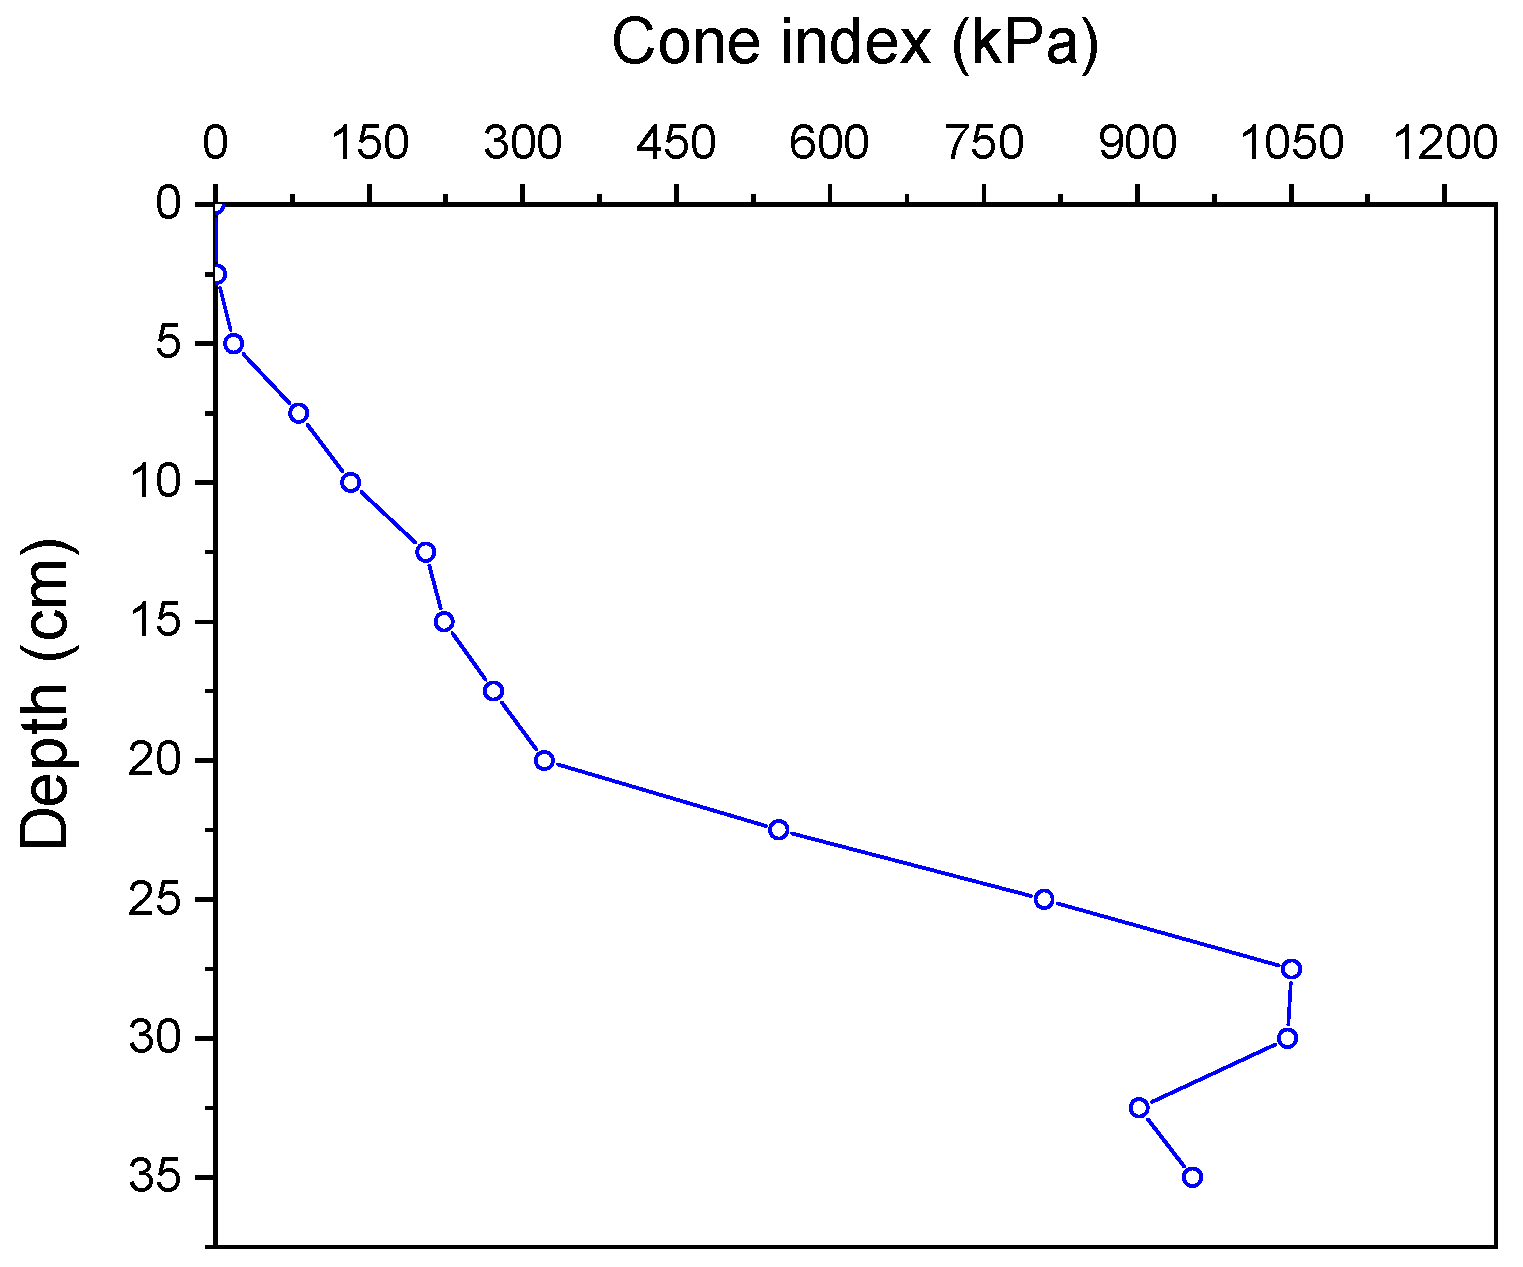
Soil samples were collected from the garlic field for texture analysis. The results indicated that the soil consisted of 26% sand, 50% silt, and 24% clay, classifying it as Silt Loam according to the USDA soil classification system. Soil moisture content was measured 60 times across the field using a TDR 350 (Spectrum Technologies, Aurora, IL, USA), yielding an average value of 29.4%. This reflects typical field conditions that directly affect the load response and track–soil interaction characteristics of the collector during operation. The CI was measured ten times along the ridges before the collection operation using an SC900 (Spectrum Technologies, Aurora, IL, USA), with penetration depths up to 35 cm. As shown in Figure 6, the CI values gradually increased with depth, reaching a maximum of 1050.5 kPa at 27.5 cm. The average CI value in the surface layer (0–10 cm) was 132.2 kPa, which increased sharply beyond 20 cm, ranging between 950 and 1150 kPa at depths of 30–35 cm. These results clearly demonstrate an increase in soil strength with depth. Although the operating depth of the collector is confined to the near-surface layer, the higher soil strength in deeper layers can indirectly affect traction stability and rolling resistance of the tracked driving system during field operation.
This study was conducted under uniform field conditions, where key operational parameters of the collector, including driving speed, collecting speed, transporting speed, and working depth, were varied to quantitatively analyze load characteristics. This experimental design establishes a fundamental basis for understanding the relationship between operating conditions and load behavior in self-propelled garlic collectors.

2.5. Data Analysis Methods

Power requirements were evaluated using a combination of mechanical calculations and statistical analyses.
First, the driving-part power was computed from the measured sprocket torque and rotational speed using Equation (1). Hydraulic power for the collection and transport parts was calculated from measured pressure and flow using Equation (2). A hydraulic efficiency of 0.9 was applied, consistent with values reported in previous studies on off-road hydraulic motor systems [33,34]. The total machine power was obtained by summing the component powers (Equation (3)).
P D = 2 π T N 60,000 ,
P h = η ν × P × Q 600 ,
P t o t a l = P D + P C + P T ,
where P D is the driving-part power (kW), T is the sprocket torque, N is the sprocket rotational speed, P h is the hydraulic power requirement of the collection and transport parts (kW), η ν is hydraulic efficiency, P is the pressure of collection and transport systems (bar), Q is the flow rate of the collection and transport systems (L/min), and P C and P T represent the power requirements of the collection and transport parts, respectively.
Second, descriptive statistics (including box plots) were used to characterize variability in load and power across experimental conditions.
Third, measured hydraulic loads for the collection and transport parts were compared with hydraulic pump performance curves—not to assess pump stability, but to examine how operating loads varied under actual field conditions for each experimental case. Total power requirements were also compared with the engine performance curve, and the ratio of required power to rated engine power was used to assess engine-capacity utilization.
Fourth, regression analysis quantified relationships between independent and dependent variables. Independent variables were collection-part speed (35 and 45 rpm), transport-part speed (30, 40, and 50 rpm), working depth (8.5, 10, and 13 cm), and driving speed (0.05, 0.15, and 0.25 m/s). Dependent variables were the loads and power requirements of each main part and the total power requirement. A linear regression model was applied to estimate the effect size of each independent variable. The experimental design was not fully crossed but was instead sequentially structured to evaluate the independent effects of each factor under controlled field conditions. Consequently, regression and ANOVA analyses were conducted to examine only the main effects on power requirements, excluding interaction terms.
Finally, to test statistical significance, one-way analysis of variance (ANOVA) was performed using IBM SPSS Statistics (version 25). Although load data were recorded at a sampling frequency of 300 Hz, consecutive measurements within each trial were temporally correlated and therefore not statistically independent. To ensure valid statistical inference, only the steady-state portion of each trial was extracted and analyzed. Within this segment, all high-frequency samples were averaged to obtain a representative mean power value for each operation. These mean values were then used as independent observations in the statistical analysis. Accordingly, a one-way ANOVA with LSD post hoc tests was applied to compare mean power values among operating conditions, thereby preventing inflated sample sizes and maintaining independence among observations.

3. Results

3.1. Analysis of Power Requirements Under Different Operating Conditions

3.1.1. Power Requirements According to Collecting and Transporting Speeds

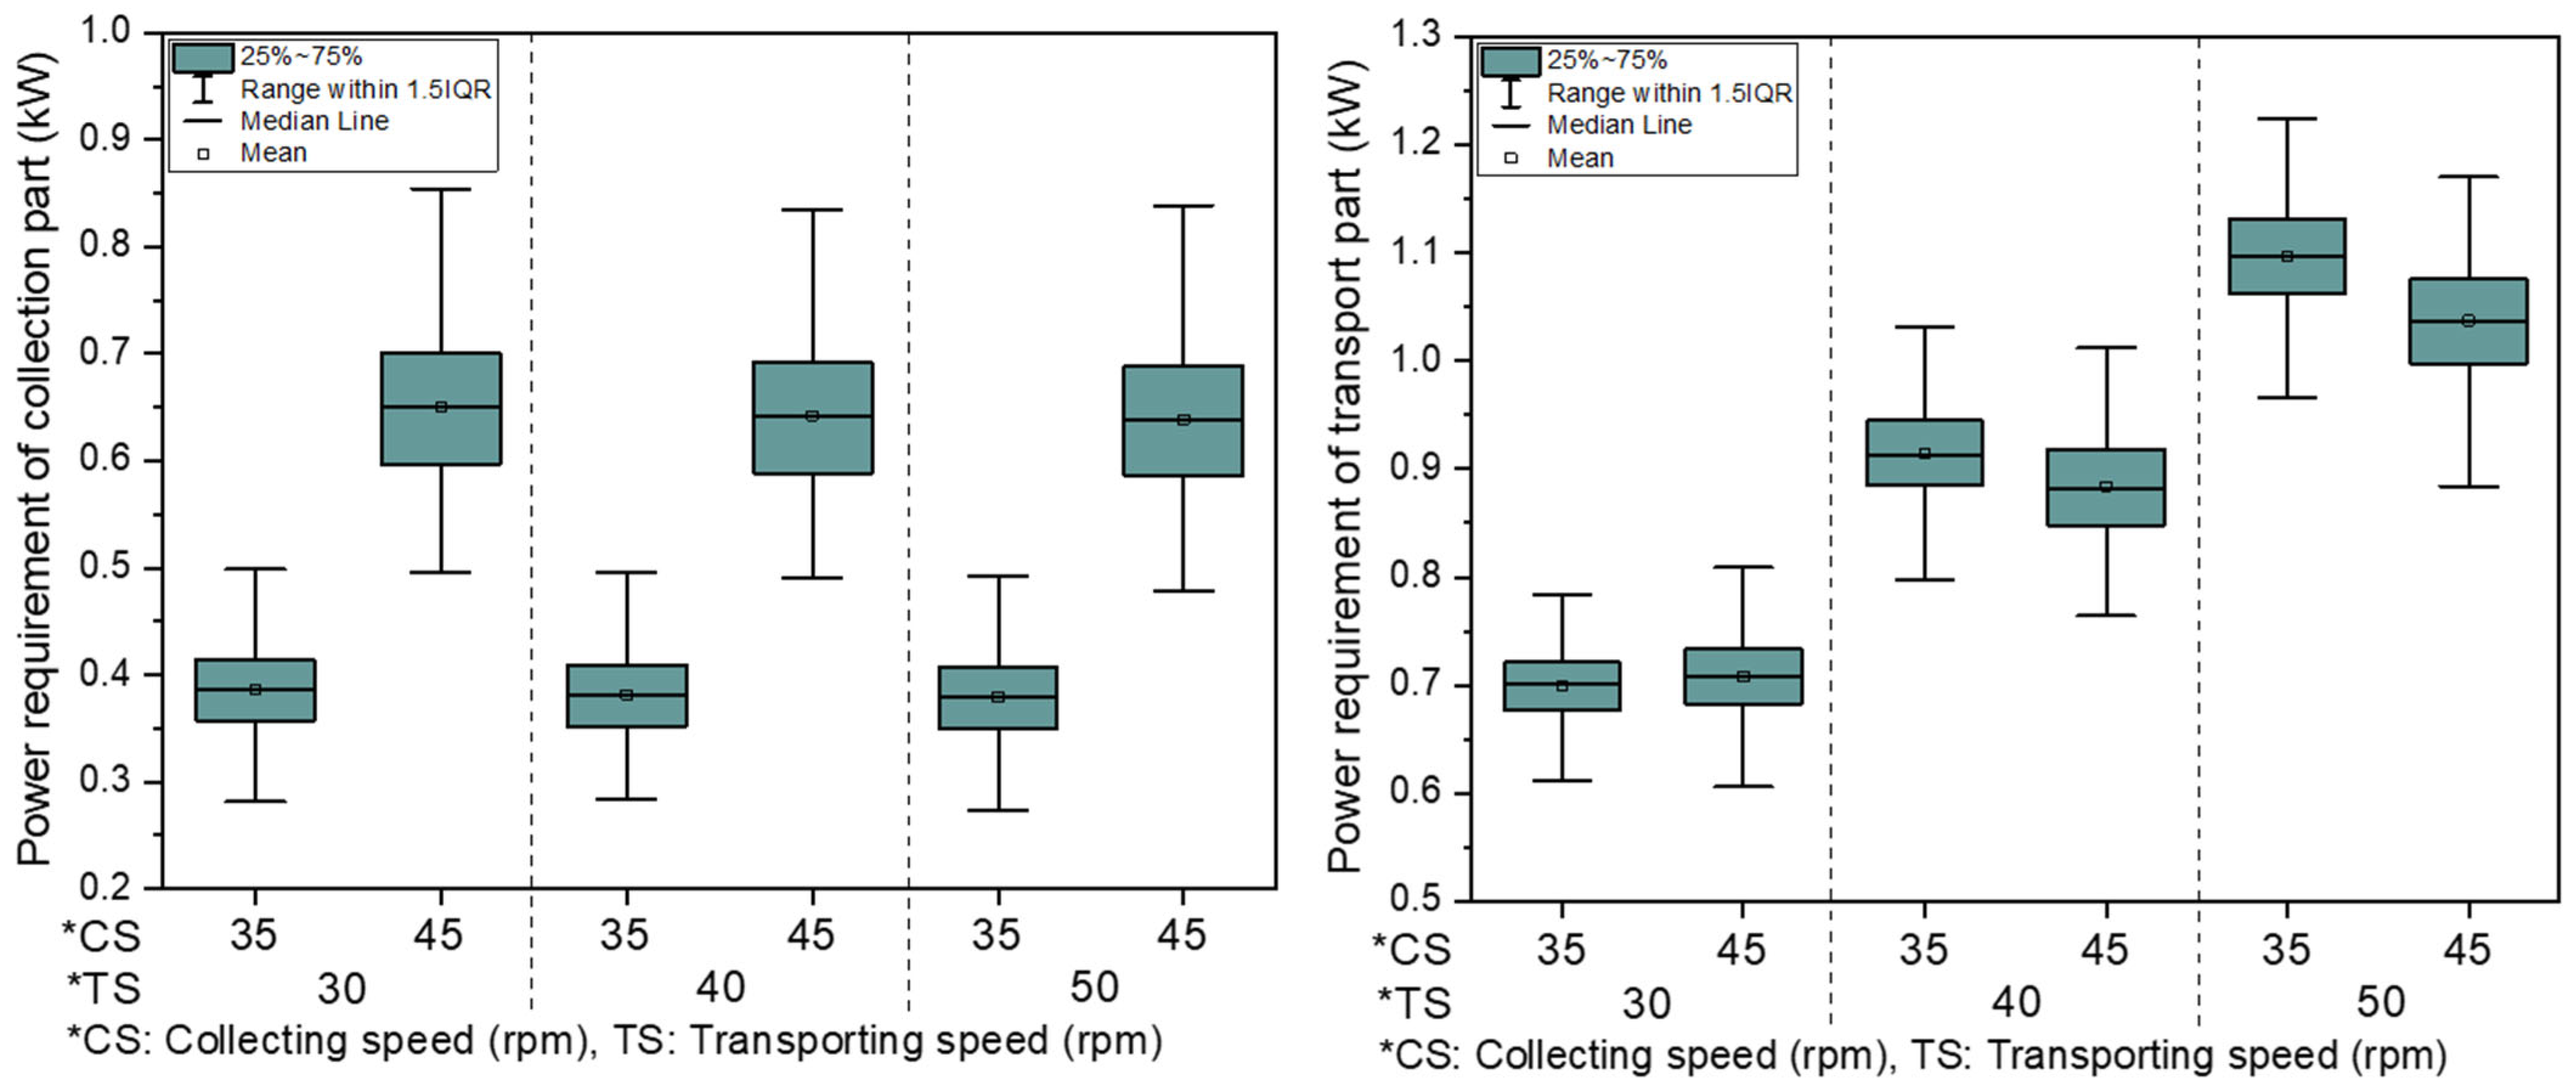
Figure 7 presents the power requirements of the collection and transport parts according to rotational speeds. The power requirement of the collection part was approximately 0.38–0.39 kW at 35 rpm and increased to 0.64–0.65 kW at 45 rpm, indicating a clear rise with increasing rotational speed. This demonstrates that the collection part is highly sensitive to changes in its own speed. By contrast, variations in transporting speed (30, 40, and 50 rpm) had little effect on the collection part, as its power requirement remained relatively stable across these conditions. The transporting part showed negligible differences between collecting speed levels but exhibited a distinct increase with its own speed. At 30 rpm, the transporting part required approximately 0.70–0.71 kW, which rose to 0.88–0.90 kW at 40 rpm and 1.04–1.10 kW at 50 rpm. This stepwise increase confirms that the transporting part is primarily influenced by its own rotational speed. These findings reflect the structural characteristic that both parts are driven by independent hydraulic motors, and their power requirements are therefore determined largely by their respective operating speeds.
As summarized in Table 3, the power requirements of both parts were distributed within narrow ranges, with standard deviations of only 0.03–0.07 kW, indicating stable performance. In the transporting part, some conditions were classified into different groups depending on collecting speed, but the mean differences (0.03–0.06 kW) were likely due to measurement error or data dispersion rather than actual load variations. For the collection part, mean power increased from approximately 0.39 kW at 35 rpm to 0.65 kW at 45 rpm, representing an increase of approximately 67%, consistent with the measured load change. For the transporting part, the increase was approximately 49%, from 0.70 kW at 30 rpm to 1.04 kW at 50 rpm, confirming its strong dependence on speed.

3.1.2. Power Requirements According to Working Depth

As shown in Figure 8, increasing the working depth from 8.5 to 13 cm caused a slight rise in total power requirement, from 4.69 to 4.81 kW, an increment of only 0.12 kW. This indicates that working depth had a limited influence on total power requirement. The driving part exhibited a modest increase in power with greater depth, while the collecting and transporting parts showed minimal variation and remained largely consistent across conditions. Overall, although a statistical trend of increasing power with depth was observed, its practical impact on load distribution among the main parts was negligible. Specifically, the total power requirement increased by approximately 2.6% from 8.5 to 13 cm, confirming the limited effect of working depth.
Table 4 presents the detailed power requirements for each main part at different depths. The driving part power increased from 1.81 kW at 8.5 cm to 2.16 kW at 13 cm, reflecting the slightly higher soil resistance associated with deeper operation. However, the increment of 0.35 kW was relatively small. The collection part maintained nearly constant power (1.10–1.12 kW) across all depths, indicating its requirement depends more on other factors, such as rotational speed. The transport part showed a slight decrease, from 1.78 kW at 8.5 cm to 1.53 kW at 13 cm, likely due to more stable crop and soil flow at greater depths, which reduced the load on the transport mechanism.
The total power requirement increased marginally from 4.69 kW at 8.5 cm to 4.81 kW at 13 cm (approximately 2.6%), confirming that while the individual parts responded differently, the overall effect of working depth was limited.

3.1.3. Power Requirements According to Driving Speed

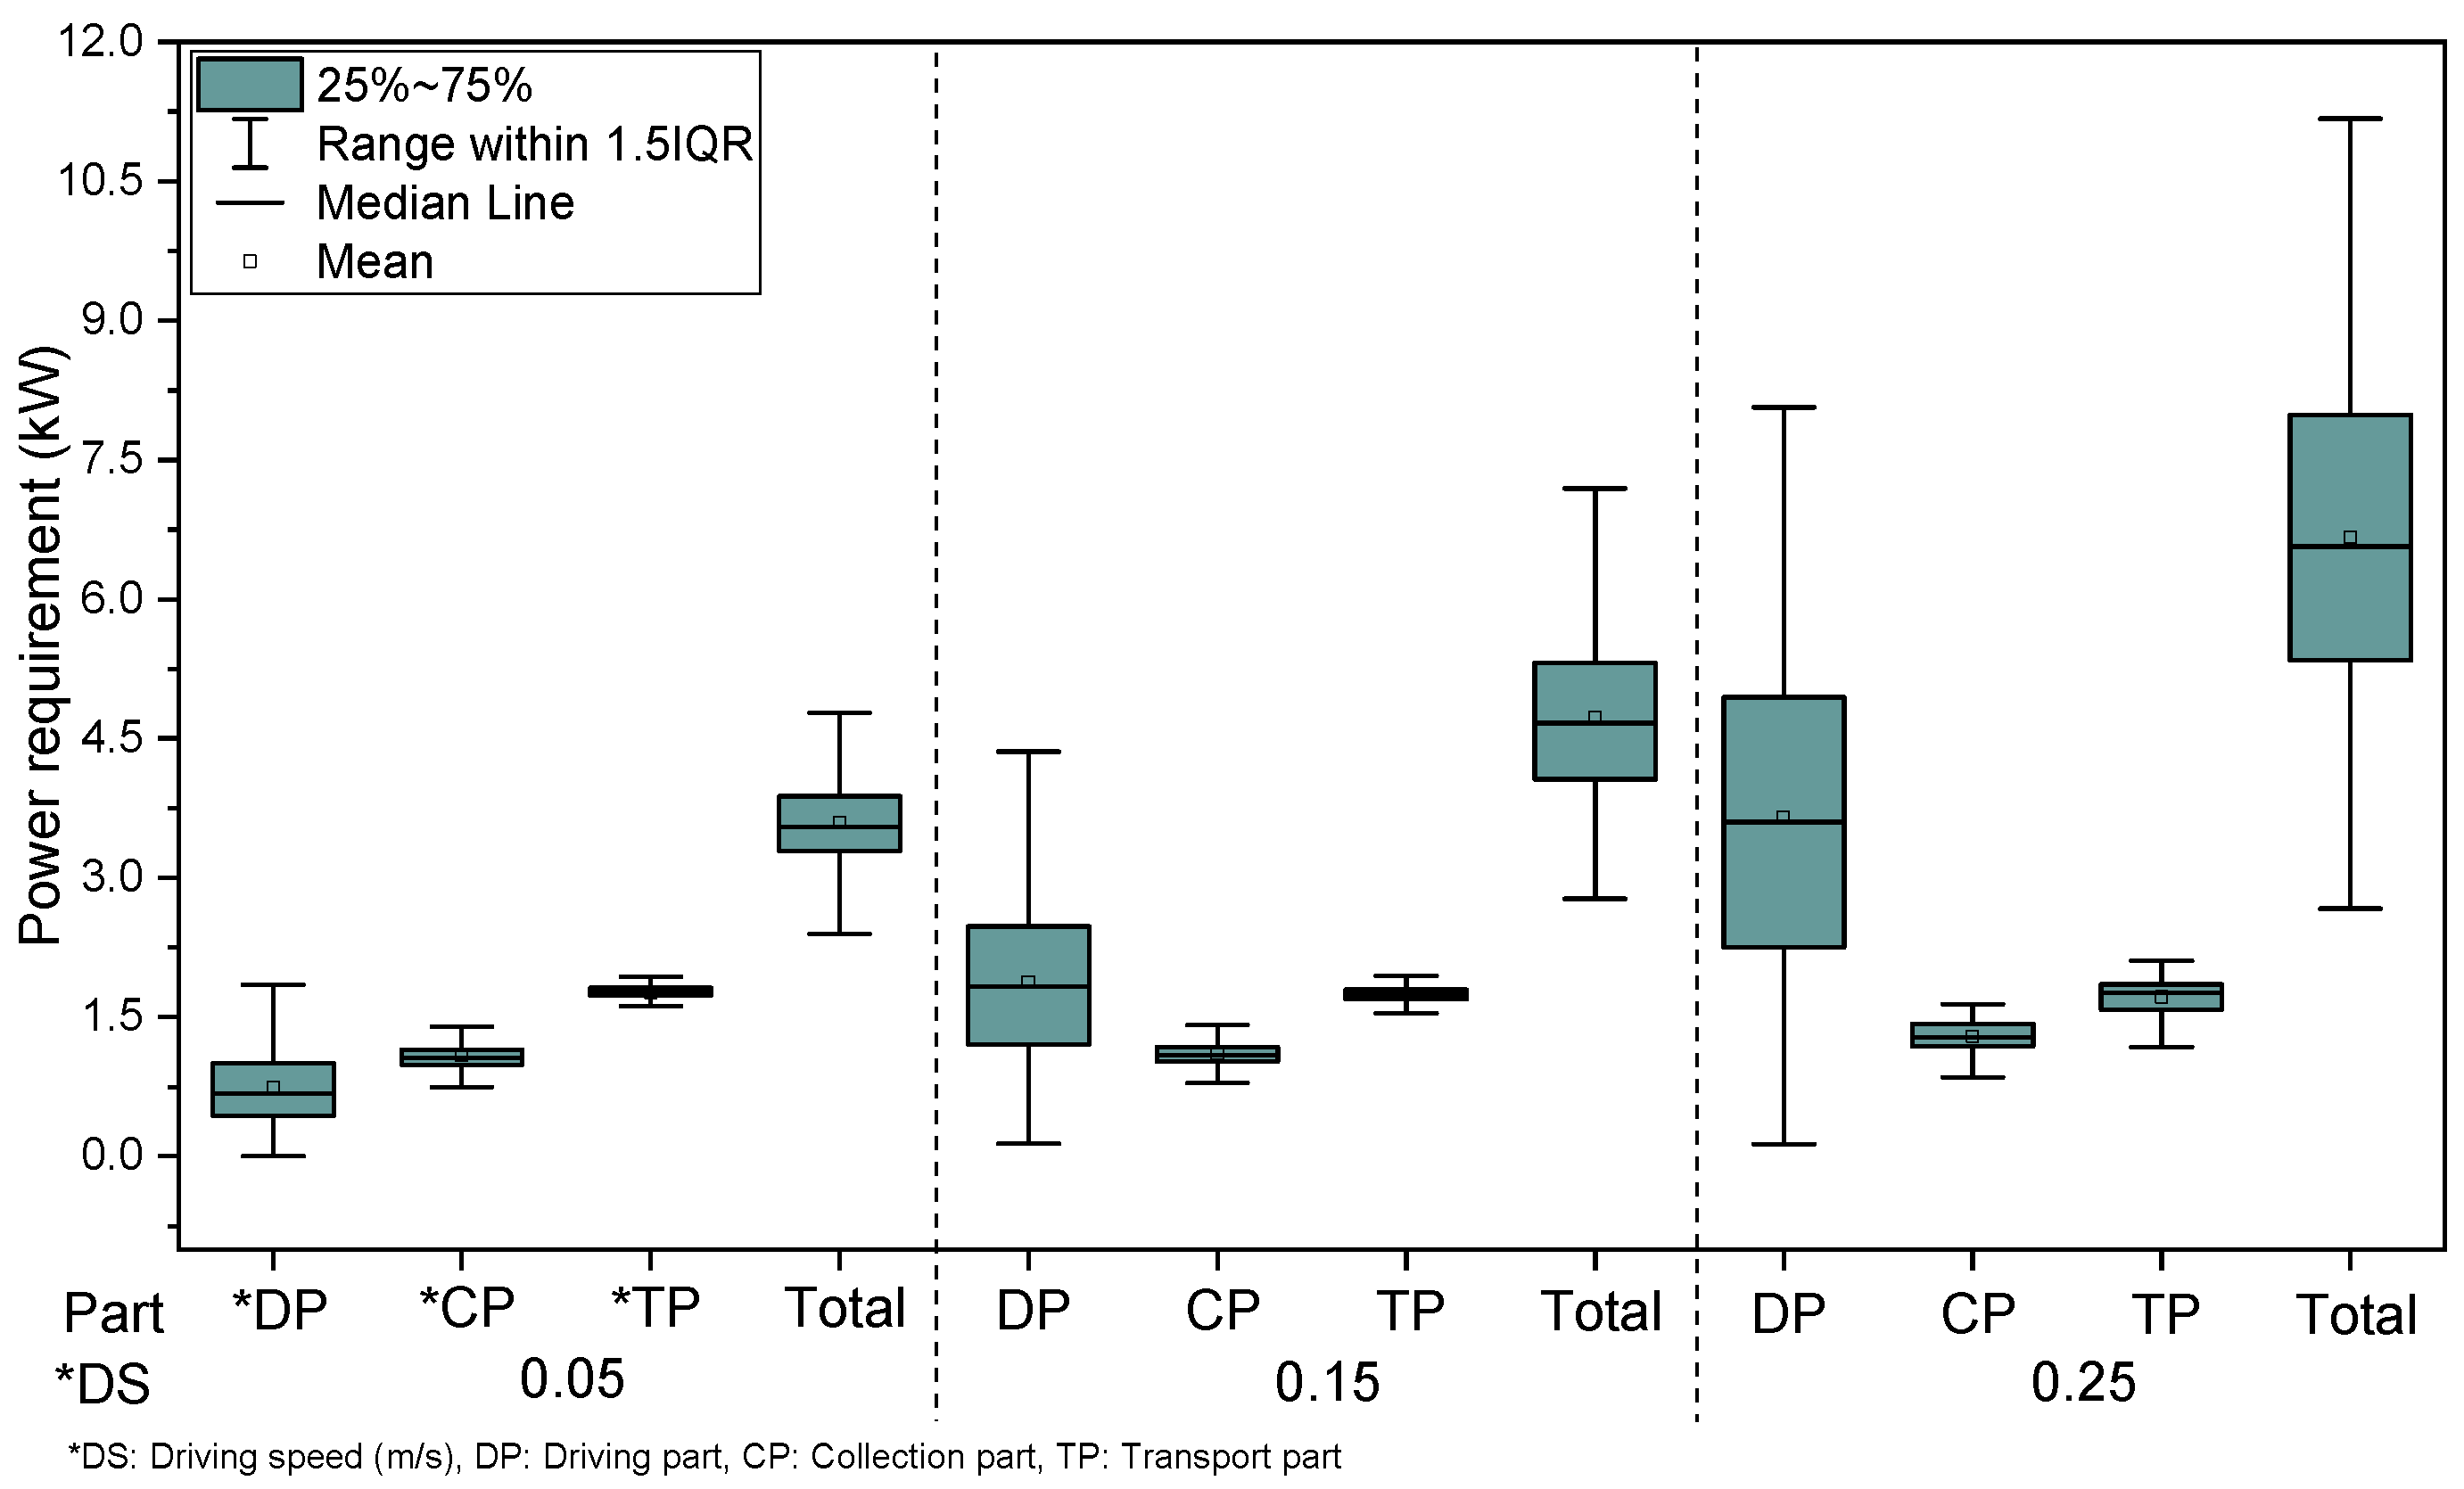
Figure 9 presents the power requirements of the main parts at different driving speeds. As driving speed increased, both total power and the driving-part power showed a clear upward trend, with the driving part reaching a maximum of 3.65 kW at 0.25 m/s. The collection part exhibited a slight increase, from 1.09 kW at 0.05 m/s to 1.29 kW at 0.25 m/s. The transport part, maintained at a fixed rotational speed, showed 1.77 kW at 0.05 m/s, decreasing slightly to 1.72 kW at 0.25 m/s. The relatively higher load at 0.05 m/s is attributed to the load distribution characteristics at low speeds.
Overall, driving speed was the dominant factor influencing total power variation. The driving part accounted for most of the increase, the collection part contributed a moderate rise, and the transport part exhibited minor variations, particularly under low-speed conditions.
Table 5 summarizes the power requirements at driving speeds of 0.05, 0.15, and 0.25 m/s. The total power increased from 3.60 kW at 0.05 m/s to 6.66 kW at 0.25 m/s, representing an increase of approximately 85%, highlighting the critical impact of driving speed. The driving part power increased from 1.82 kW at 0.05 m/s to 3.65 kW at 0.25 m/s, i.e., more than double, primarily due to increased soil resistance and driving load. The collection part increased by approximately 18% between 0.05 and 0.25 m/s, indicating a moderate speed effect, whereas the transport part decreased slightly by approximately 3% from 0.05 to 0.25 m/s, suggesting reduced average load under higher speed conditions.
Overall, the total power requirement was substantially influenced by the driving part, with the collection part showing a minor increase and the transport part a slight decrease, illustrating distinct load behaviors across the main components.

3.2. Variable Impact Assessment

3.2.1. Impact of Transporting and Collecting Speed

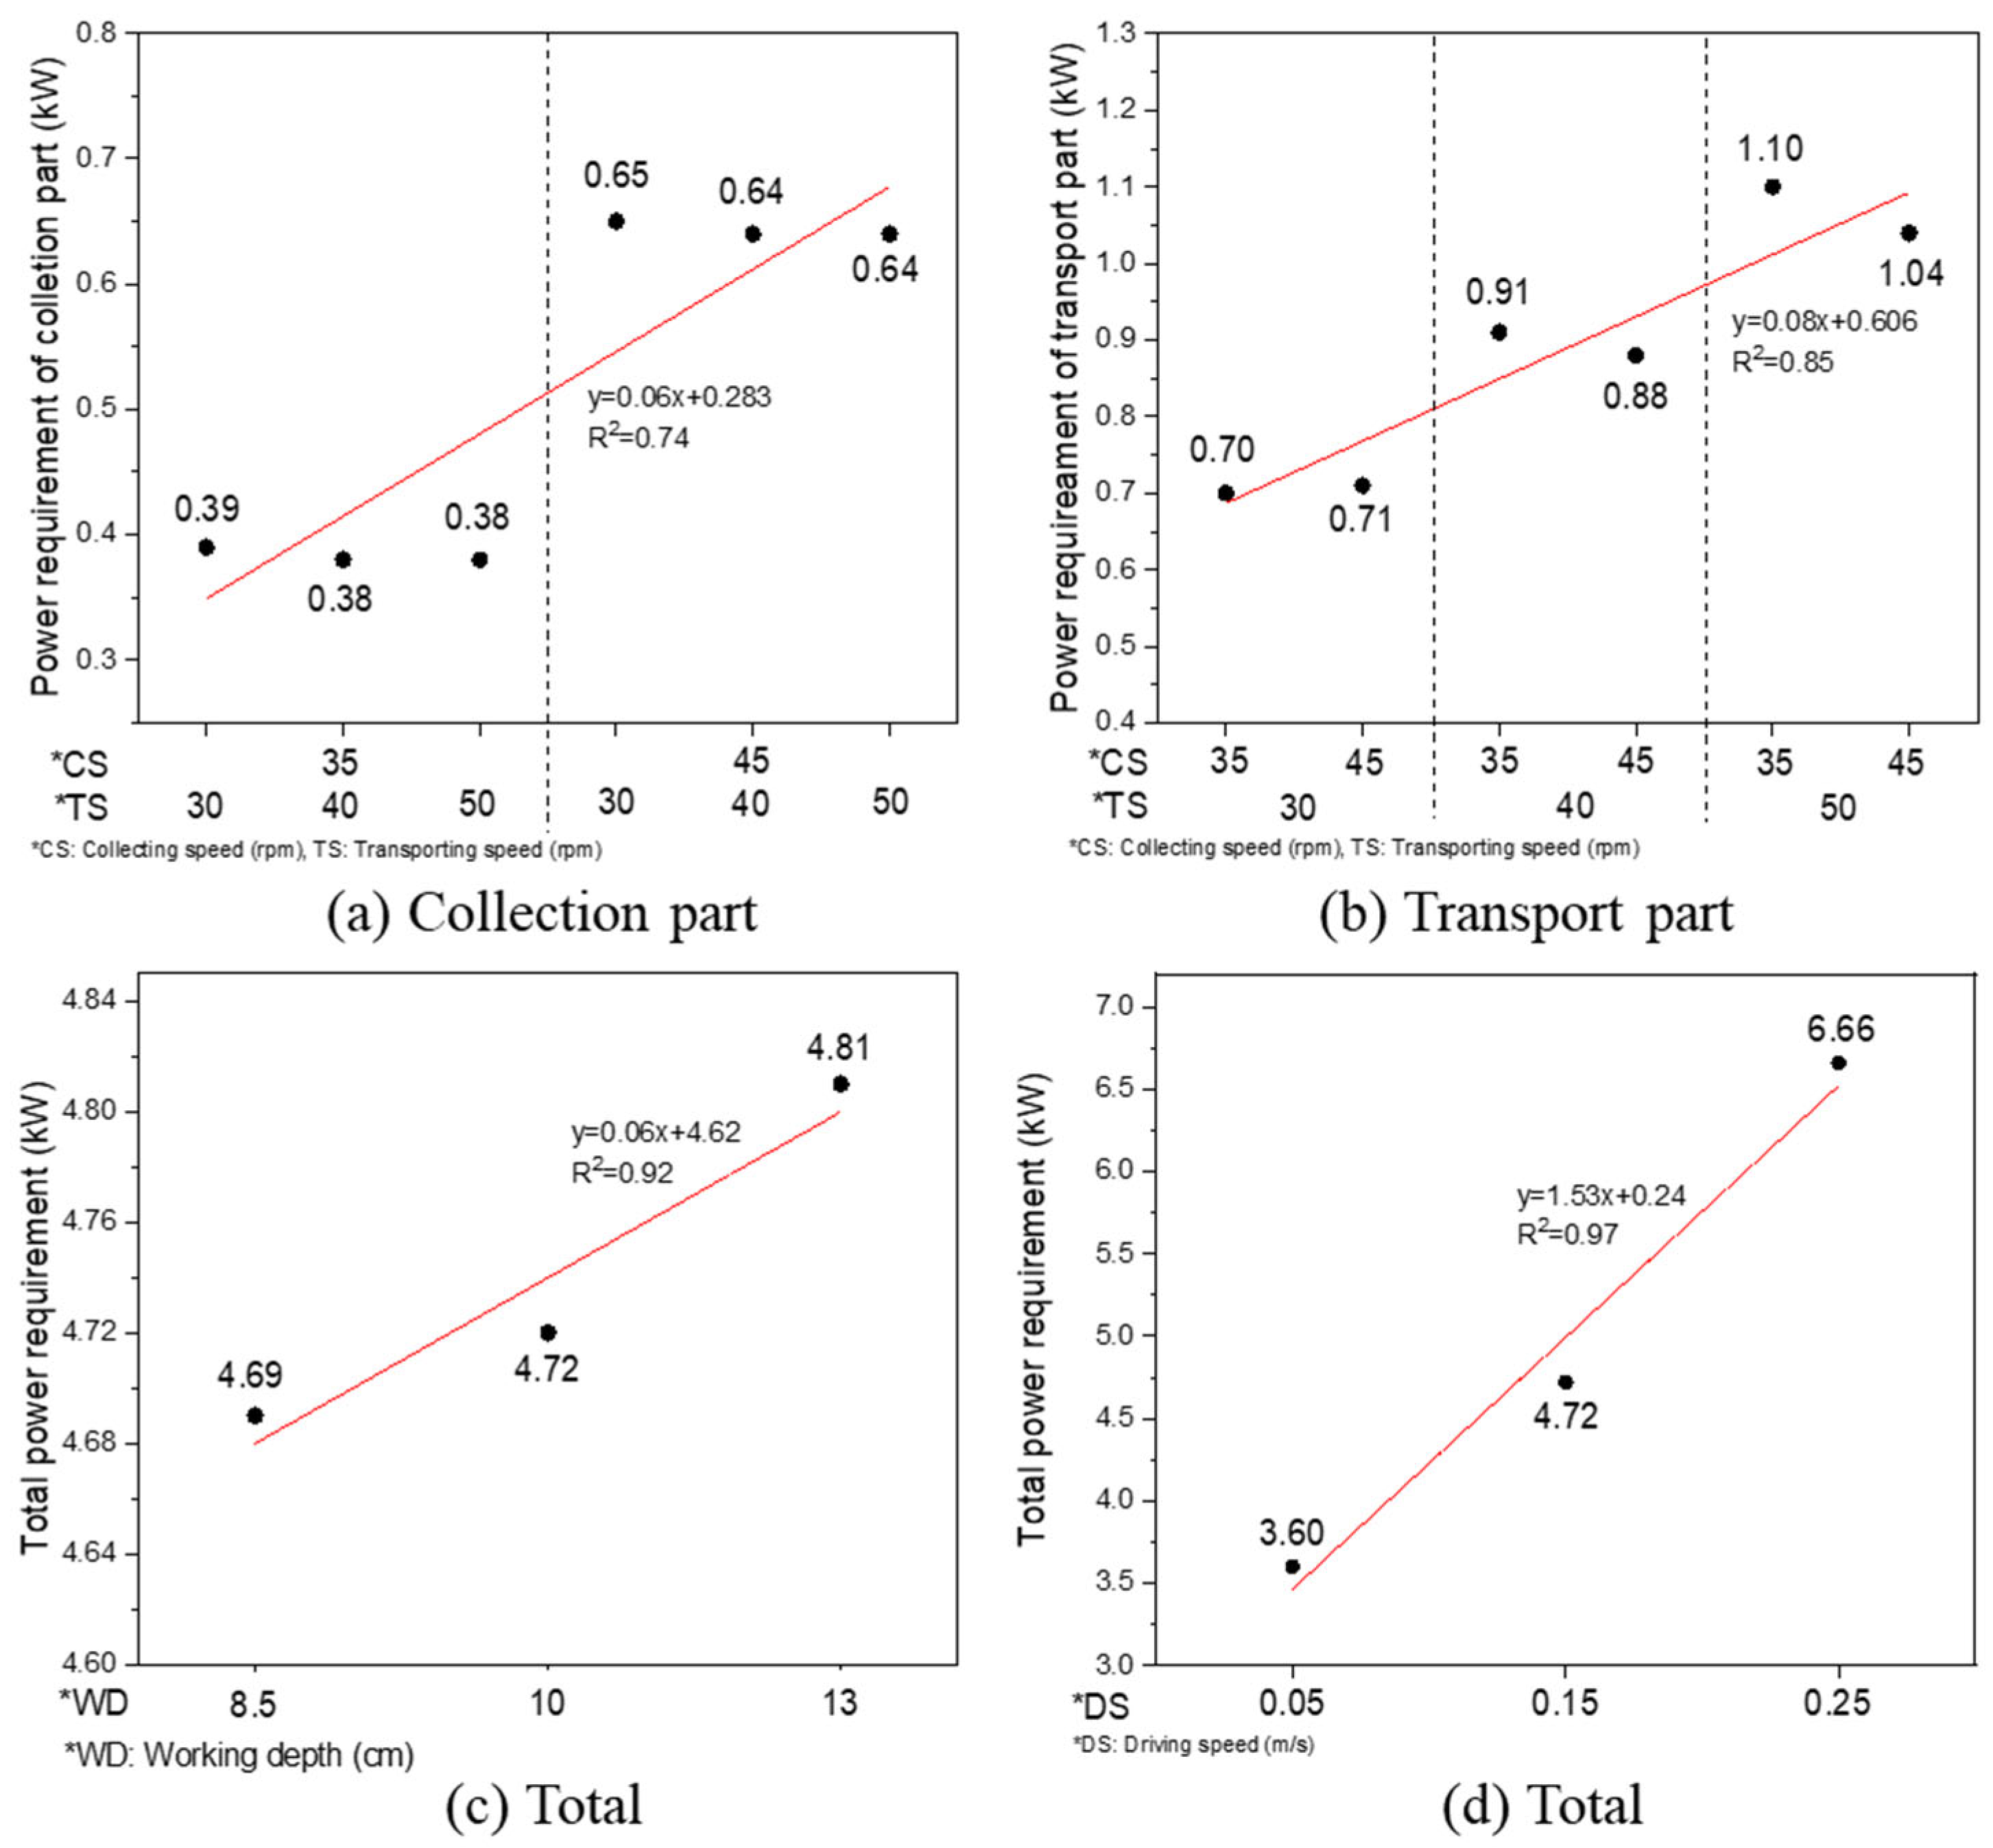
As shown in Figure 10 and Table 6, the power requirement of the collection part increased from 0.39 kW at 35 rpm to 0.65 kW at 45 rpm, representing a rise of approximately 66.7%, although the absolute increment was only 0.26 kW. For the transporting part, power increased by 28.17% when speed rose from 30 to 40 rpm and by 20.88% from 40 to 50 rpm, with the overall range between 0.71 and 1.10 kW. While these two variables clearly affect component-level power, their influence on the total system power is limited. Table 6 provides a quantitative summary of the sensitivity analysis results, where the relative change rates (%) in power requirements corresponding to variable increments were interpreted as numerical indicators of explained variance. These results confirm that the effects of collecting and transporting speeds on the total power requirement were minimal compared with the dominant influence of driving speed.

3.2.2. Impact of Working Depth

According to Figure 10 and Table 6, the power requirement increased by 0.64% when the working depth increased from 8.5 to 10 cm and by 1.91% when it increased from 10 to 13 cm. The overall change was minimal, with a maximum difference of only about 0.12 kW. These minor variations in power requirements indicate that working depth exhibited low sensitivity and accounted for only a small portion of the total variation in power. These results indicate that, although working depth has a measurable effect on power requirement, its influence is not sufficient to dominate the overall power characteristics of the system. Variations in depth primarily reflect minor local changes in soil resistance, and the impact on the total system power requirement is limited. Therefore, working depth can be regarded as a supplementary factor rather than a major determinant of the collector’s power requirement.

3.2.3. Impact of Driving Speed

According to Figure 10 and Table 6, driving speed was the most influential factor affecting power requirement among the four variables analyzed. Increasing the driving speed from 0.05 to 0.15 m/s raised the total power requirement by 31.11%, and a further increase from 0.15 to 0.25 m/s resulted in an additional 41.10% rise, representing the largest variation observed. Notably, the power requirement of the driving part increased from 1.82 kW at 0.05 m/s to 3.65 kW at 0.25 m/s, more than doubling, confirming that driving speed is the primary determinant of the overall power requirement. This substantial increase demonstrates the highest sensitivity among all operating variables, indicating that driving speed contributed the most to the overall variation in total power. Therefore, based on this variable impact evaluation, driving speed should be regarded as the most critical parameter for informing engine downsizing, design improvements, and the establishment of appropriate operating conditions.

3.3. Analysis of Power Requirements for Main Parts Under Actual Operating Conditions

3.3.1. Load Analysis for Main Parts

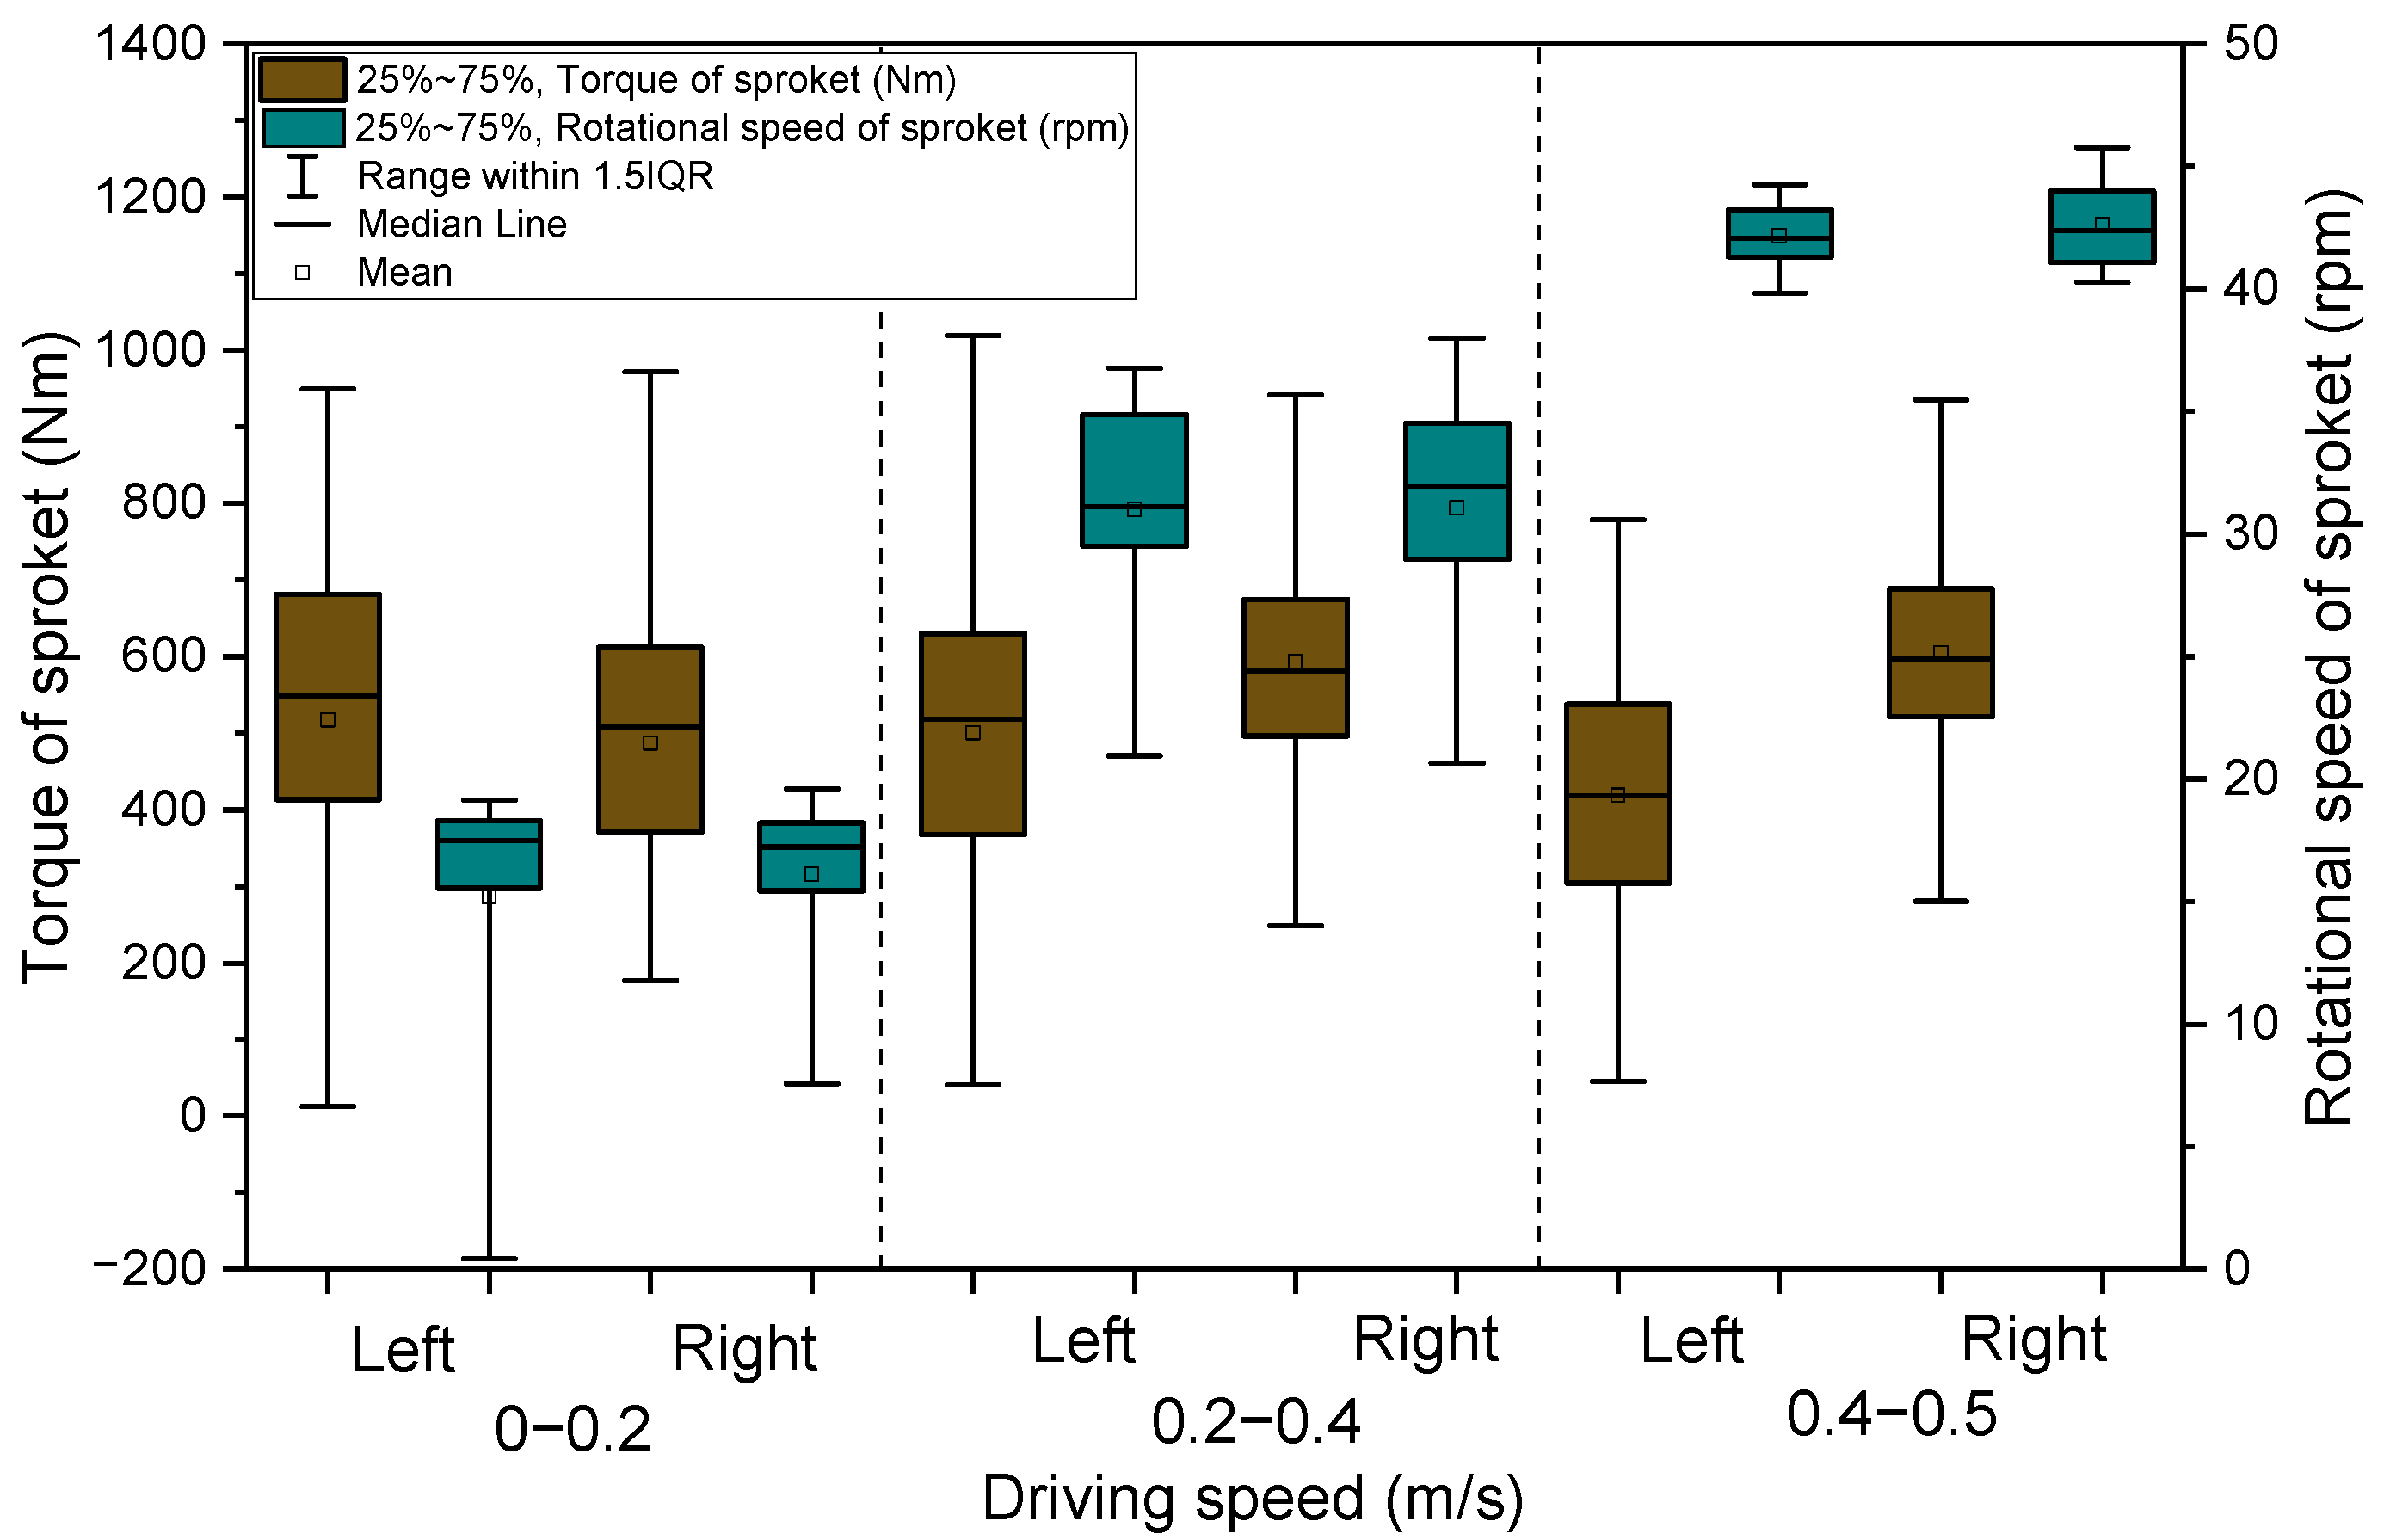
Figure 11 shows that the rotational speeds of the left and right sprockets increased consistently with higher driving speeds, indicating that sprocket speed directly reflected changes in driving speed. Regarding torque, the left sprocket exhibited higher average values at 0–0.2 m/s, whereas the right sprocket had higher average torque at 0.2–0.4 m/s and 0.4–0.5 m/s. This pattern likely reflects the machine’s structural characteristics, as the operator’s seat is on the left-hand side, shifting weight distribution in that direction. It also suggests that under actual operating conditions, including crop load, the right sprocket may experience stronger torque variations. Although absolute differences between the sprockets were small, these results indicate that weight distribution, crop load, and power transmission characteristics can influence the driving part’s power requirements during real collecting operations.
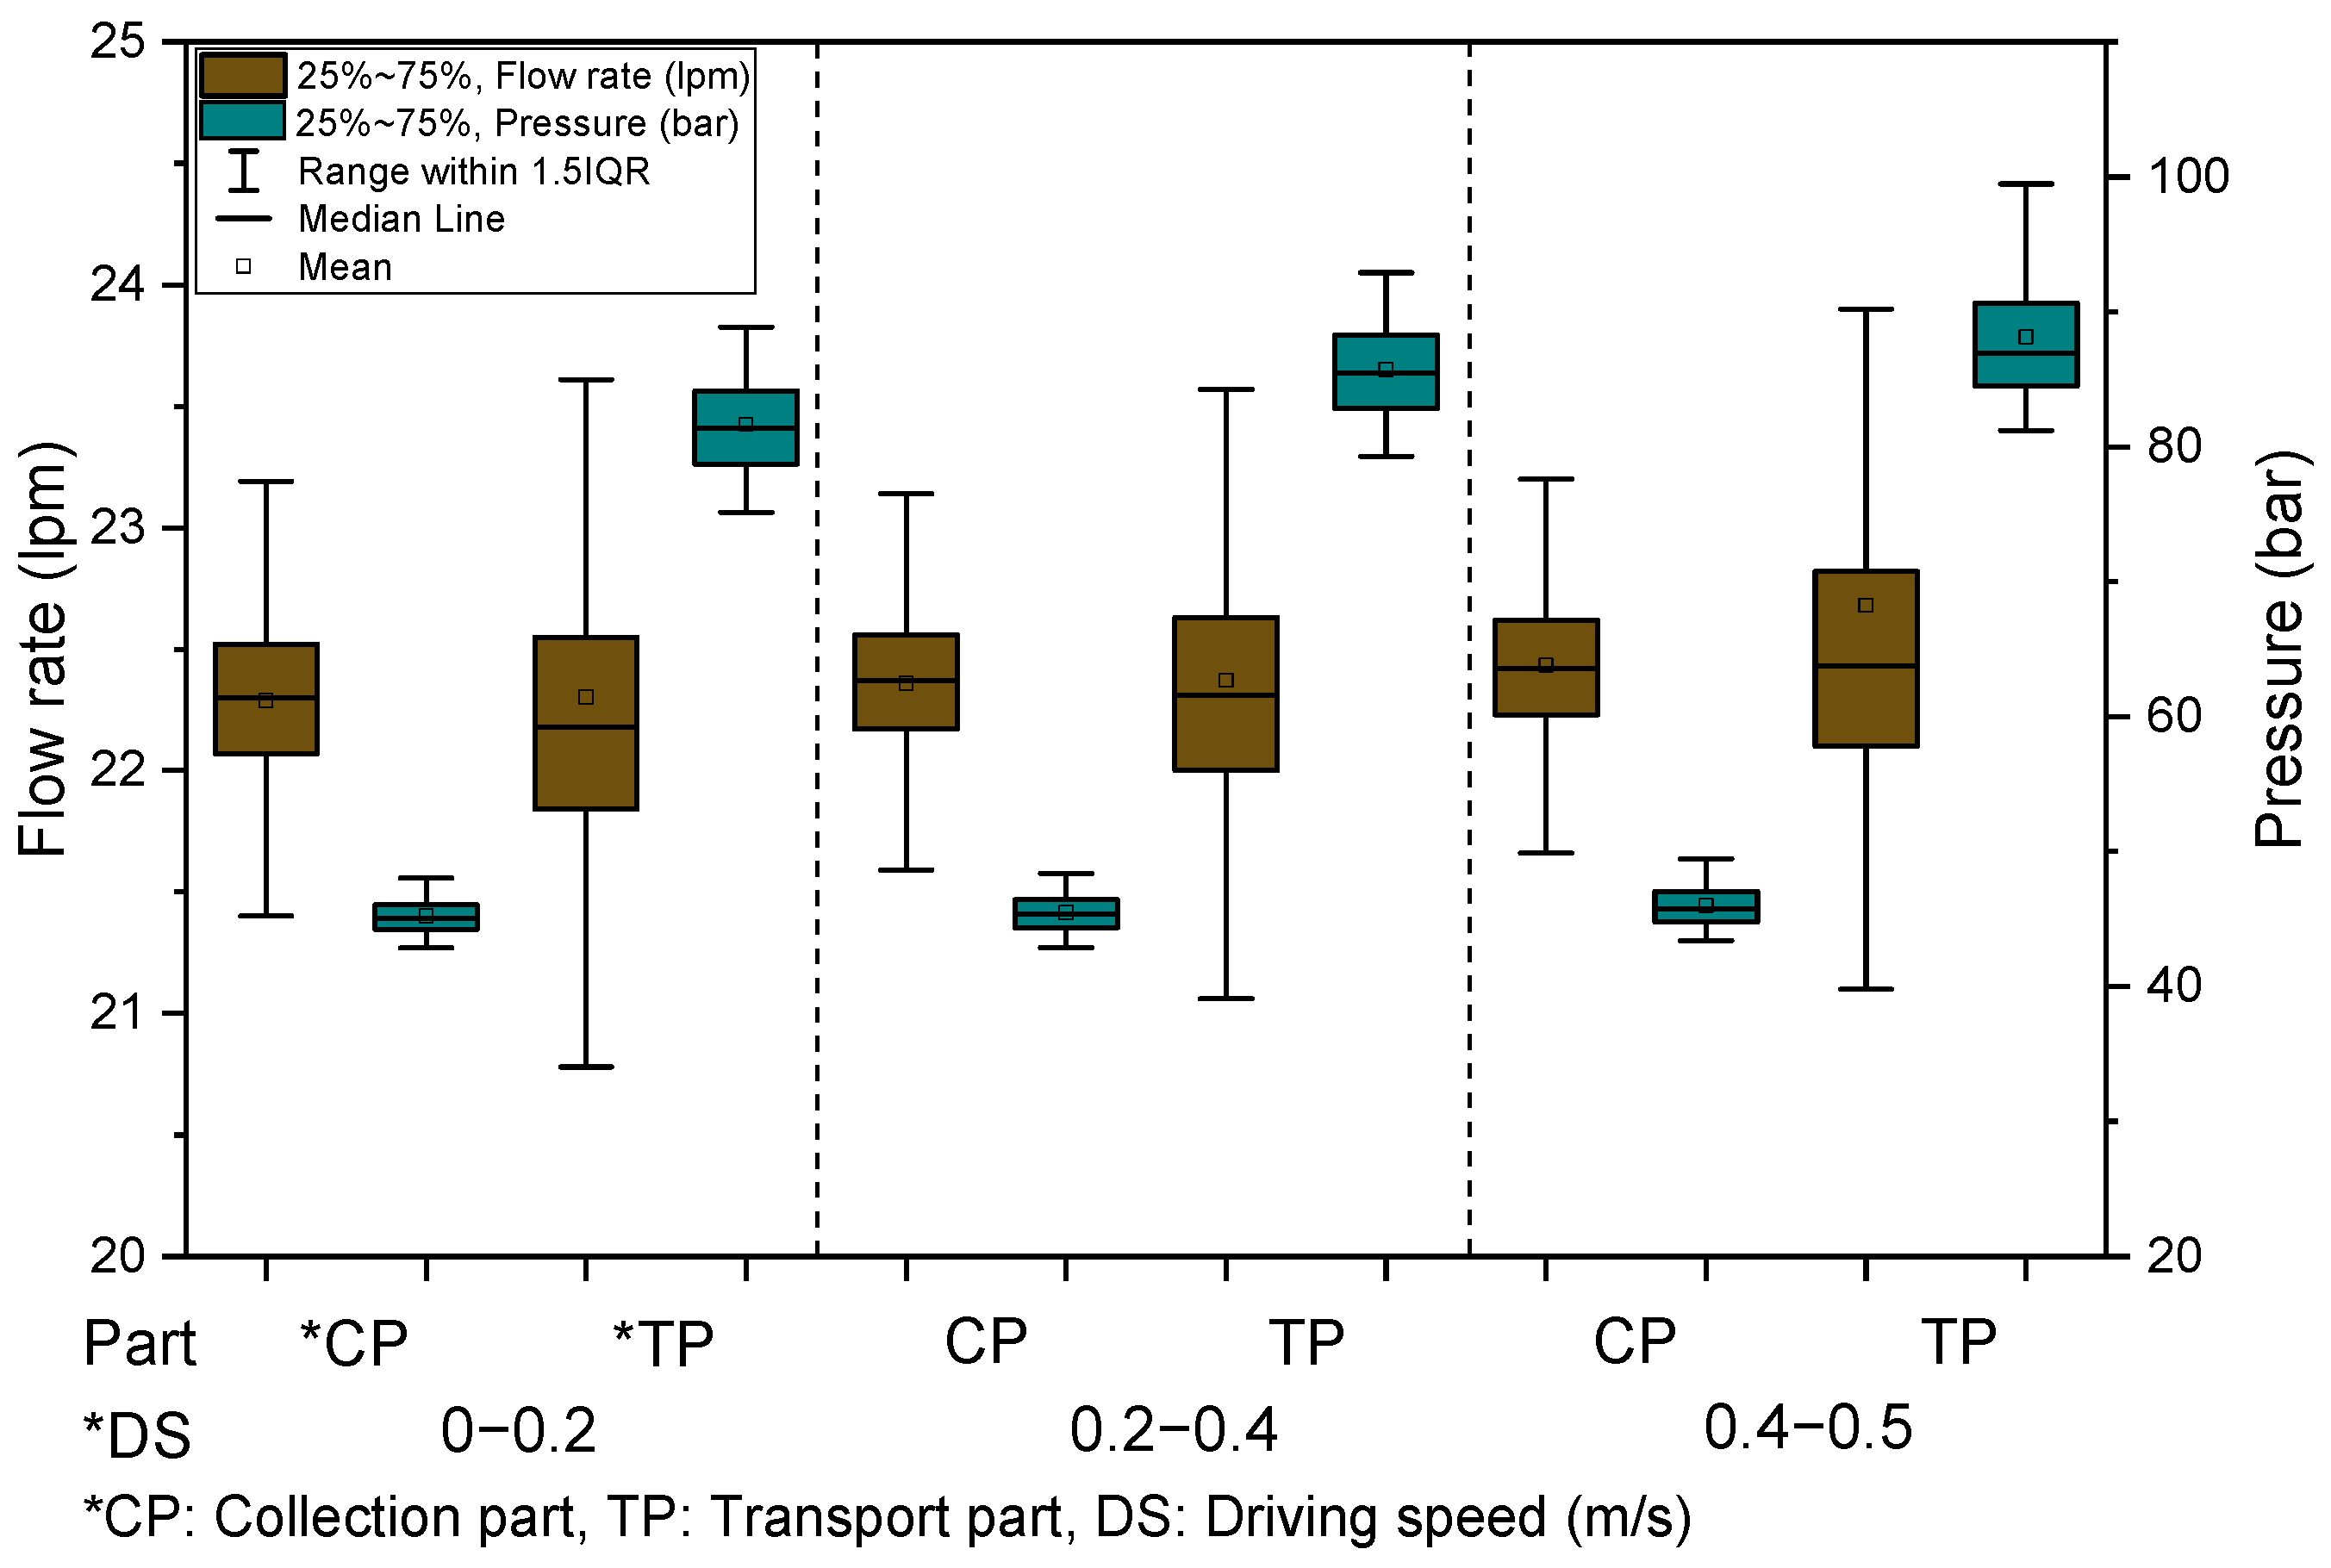
Figure 12 shows that the flow rates of the collection part (CP) and transport part (TP) remained relatively stable at 21–23 L/min across all driving speeds, indicating that hydraulic motors maintained steady flow under actual field conditions. In contrast, measured pressures revealed clear differences in load characteristics. The transport part consistently recorded higher average pressures than the collection part, and its pressure gradually increased with driving speed. Specifically, the collection part averaged 45.20 bar at 0–0.2 m/s, 45.47 bar at 0.2–0.4 m/s, and 46.01 bar at 0.4–0.5 m/s, showing minimal variation. The transport part, however, increased from 81.64 bar to 85.71 bar, and then to 88.15 bar over the same speed intervals, confirming a progressive rise with speed. These findings indicate that the collection part is relatively unaffected by driving speed, whereas the transport part experiences higher hydraulic resistance, likely due to greater crop inflow at higher speeds.
Table 7 and Table 8 summarize the statistical results of load characteristics under different driving speeds. The torque of the left drive sprocket decreased from 517 to 419 Nm, representing an 18.9% reduction, whereas the right sprocket torque increased from 487 to 604 Nm, representing a 24.0% increase. Regarding hydraulic loads, the average pressure of the collection part remained nearly constant, changing slightly from 45.20 to 46.01 bar (1.8% increase), while the transport part increased from 81.64 to 88.15 bar (8.0% increase), indicating a noticeable upward trend. However, the absolute increases were relatively small and do not constitute a substantial rise in power requirements. Overall, the loads of the main parts across driving speeds showed statistically significant differences (p < 0.05).
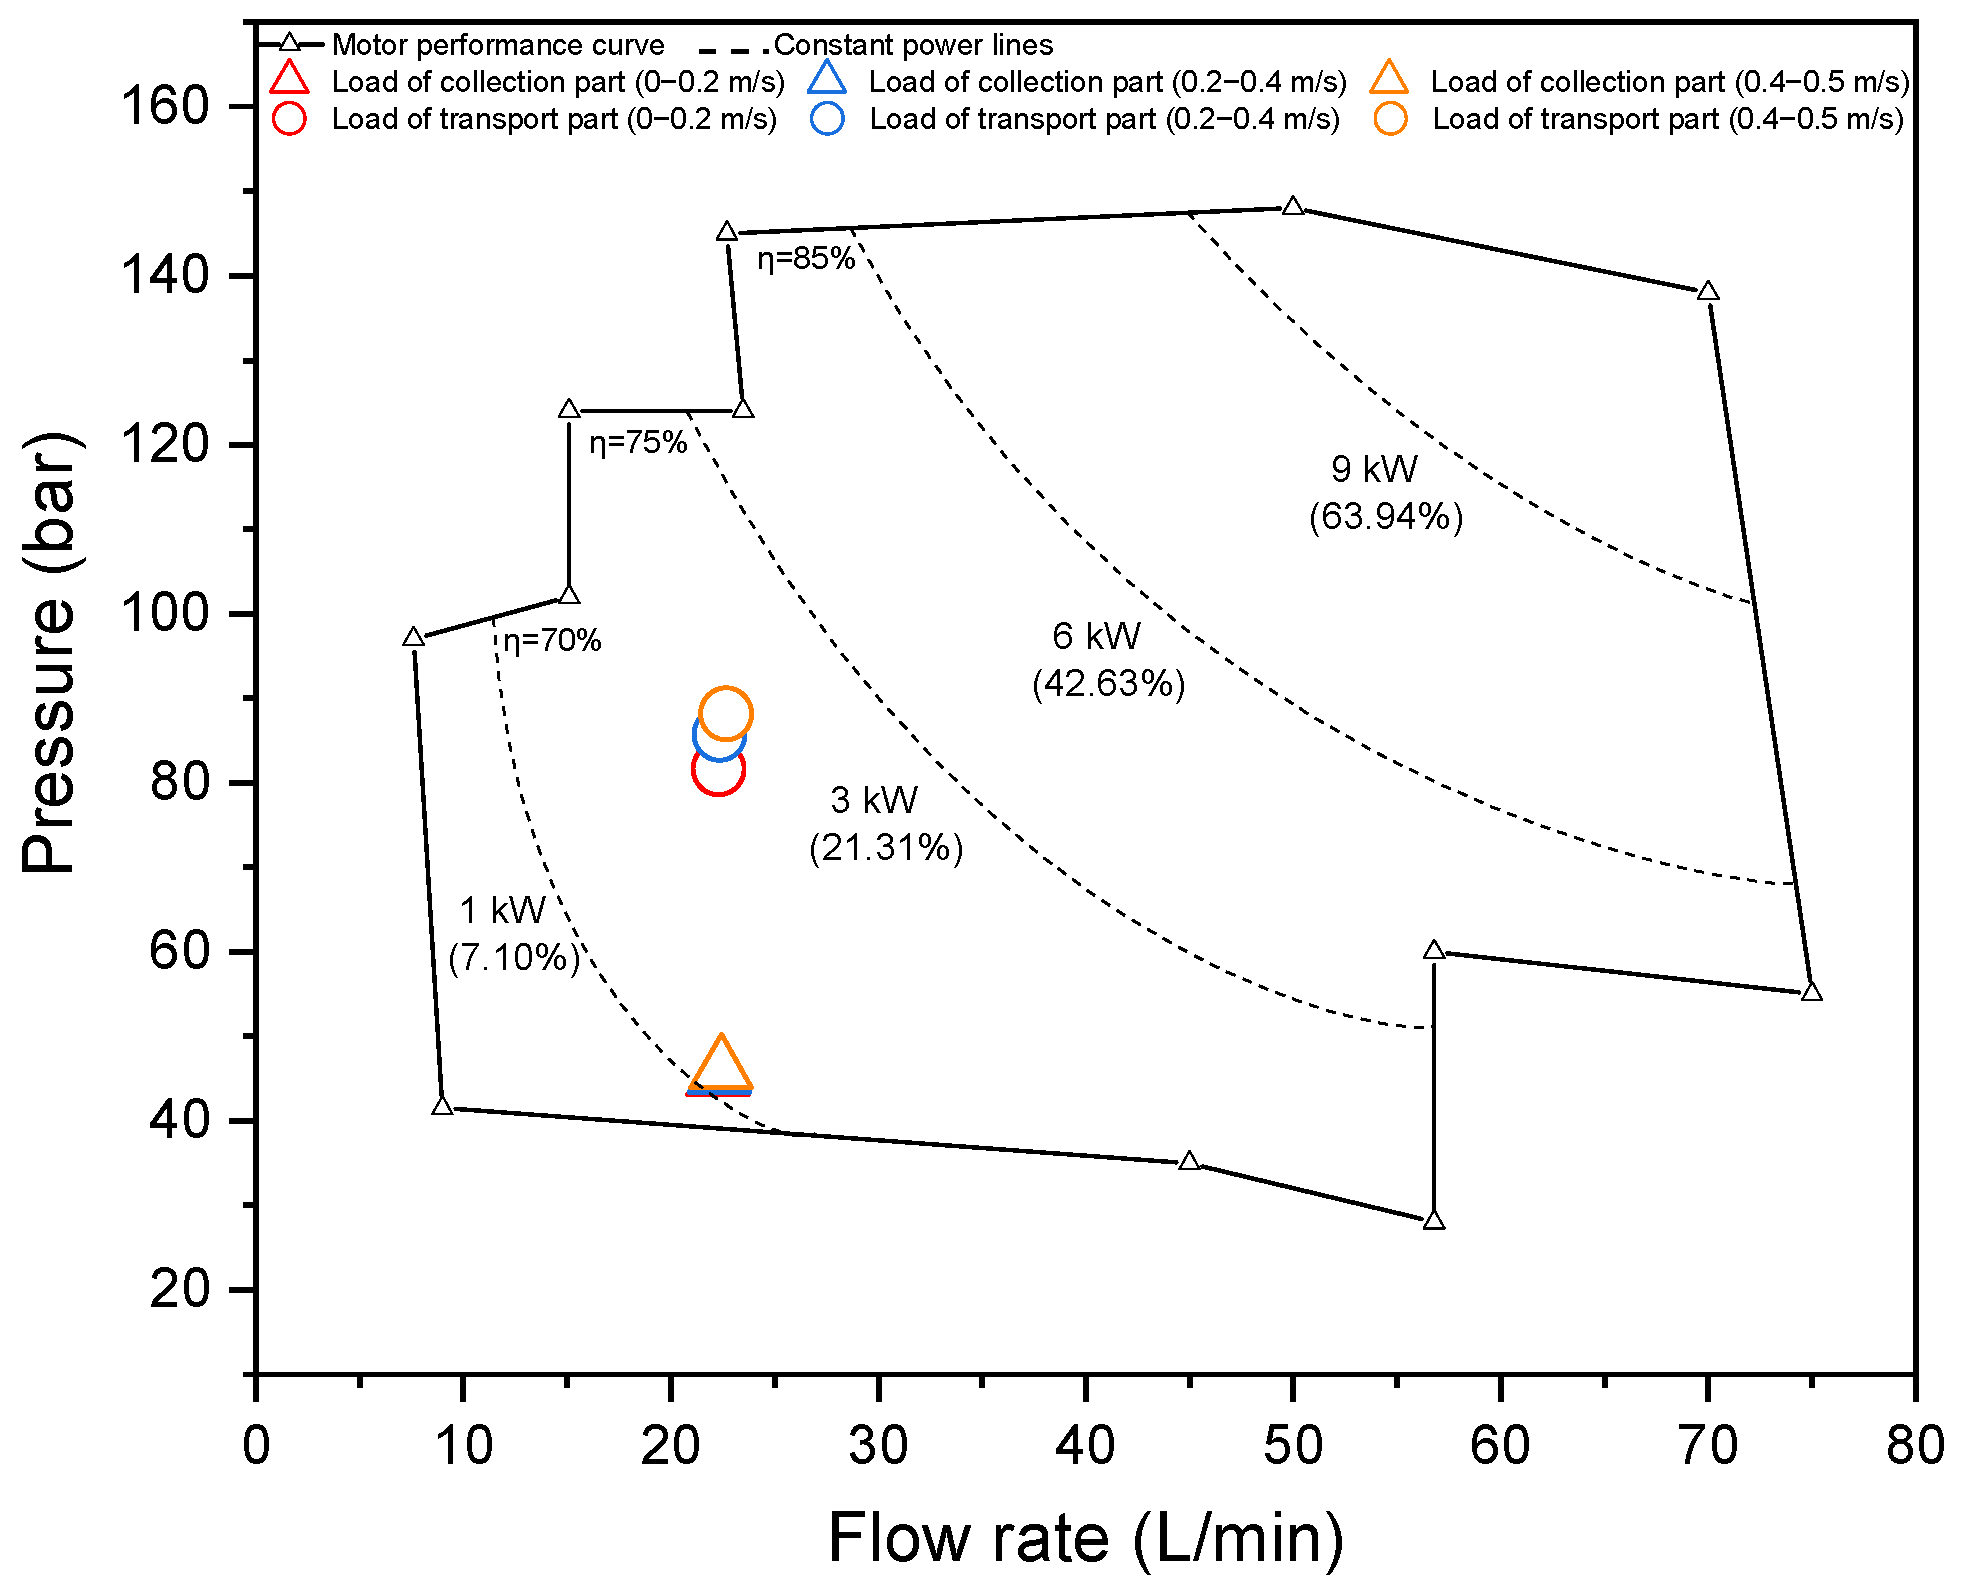
Figure 13 presents the performance curves of the hydraulic motors driving the collecting and transport parts, overlaid with measured average flow–pressure loads under field conditions. Gray dashed lines indicate iso-power curves. All measured load points were located in the lower region of the motor performance range. Both the collecting and transport parts operated within 1–3 kW, which is low relative to the maximum motor power of 14.08 kW, confirming that the hydraulic motors functioned well within capacity. These results provide a quantitative basis for comparing load differences across operating conditions.

3.3.2. Analysis of Power Requirements for Main Parts According to Driving Speed

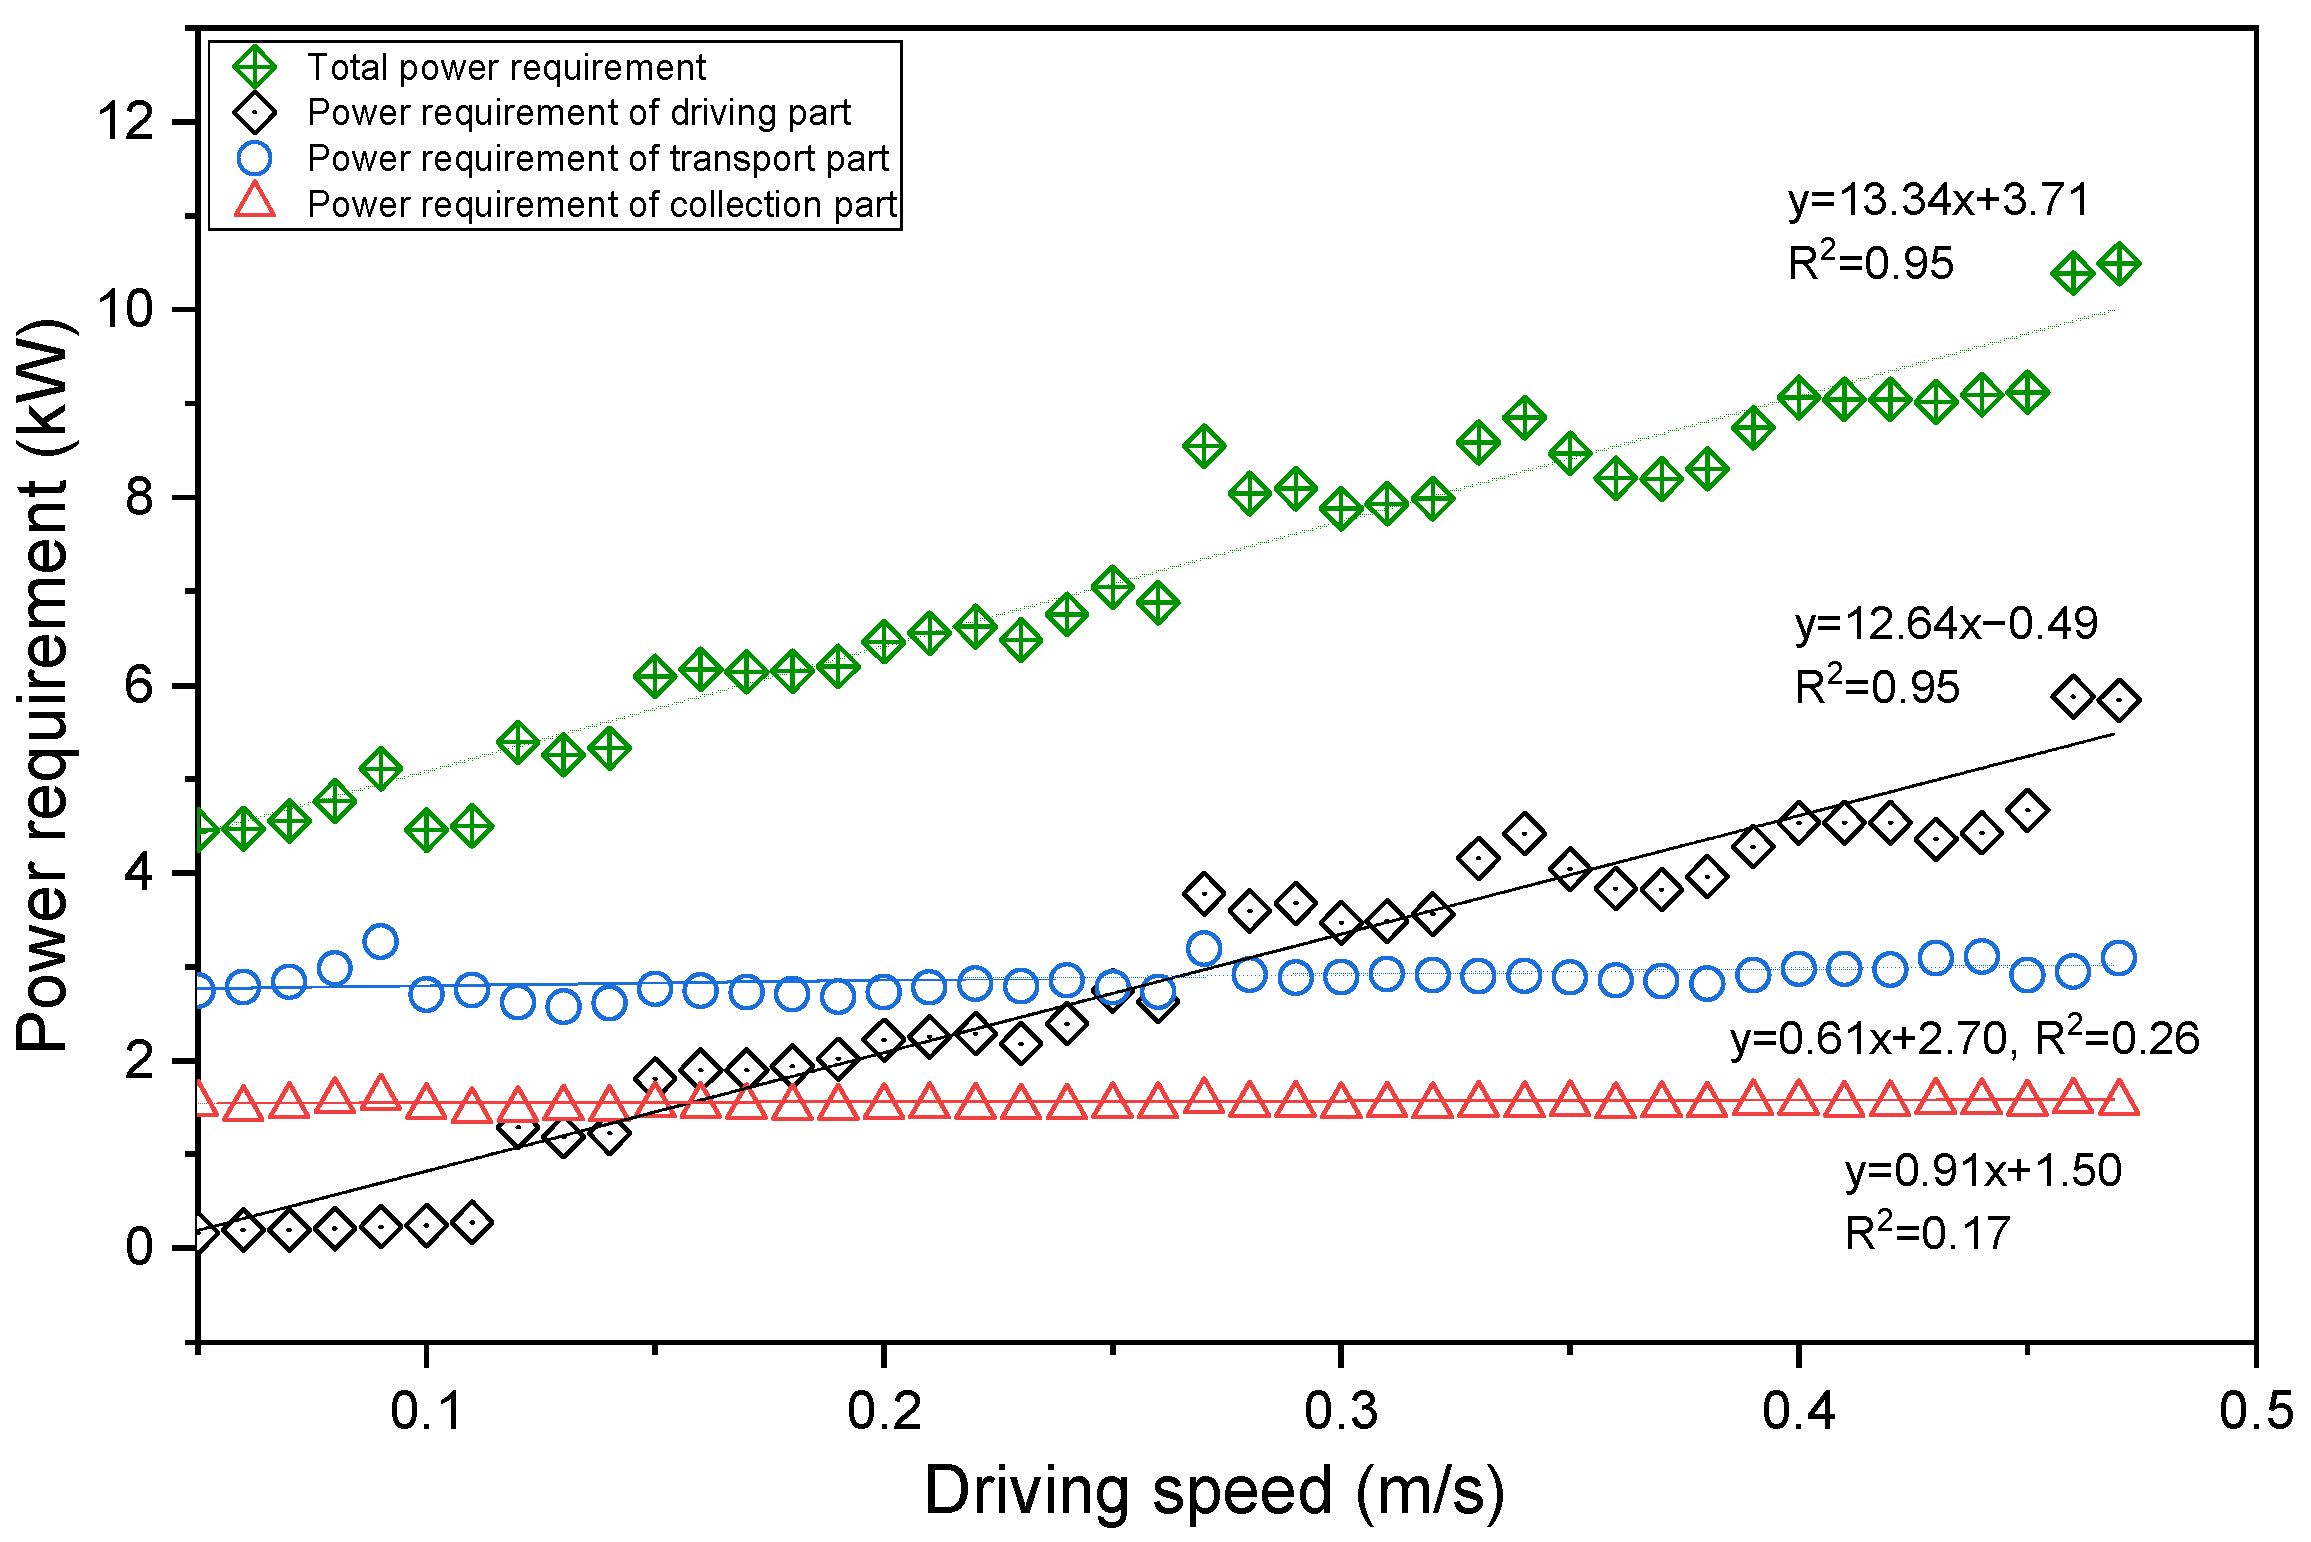
Figure 14 illustrates the variation in power requirements of the driving part, collection part, transport part, and total power of the garlic collector according to driving speed under actual operating conditions. The driving part exhibited a clear increasing trend with rising driving speed (R2 = 0.95), which was consistently reflected in the total power requirement, confirming that driving speed is the dominant factor determining the overall system power requirement. In contrast, the power requirements of the collection part and transport part showed limited variation (R2 = 0.17 and 0.26, respectively), contributing minimally to the total power. These results indicate that the driving part exerts a predominant influence on overall power requirement, whereas the effects of the collection and transport parts remain relatively minor.
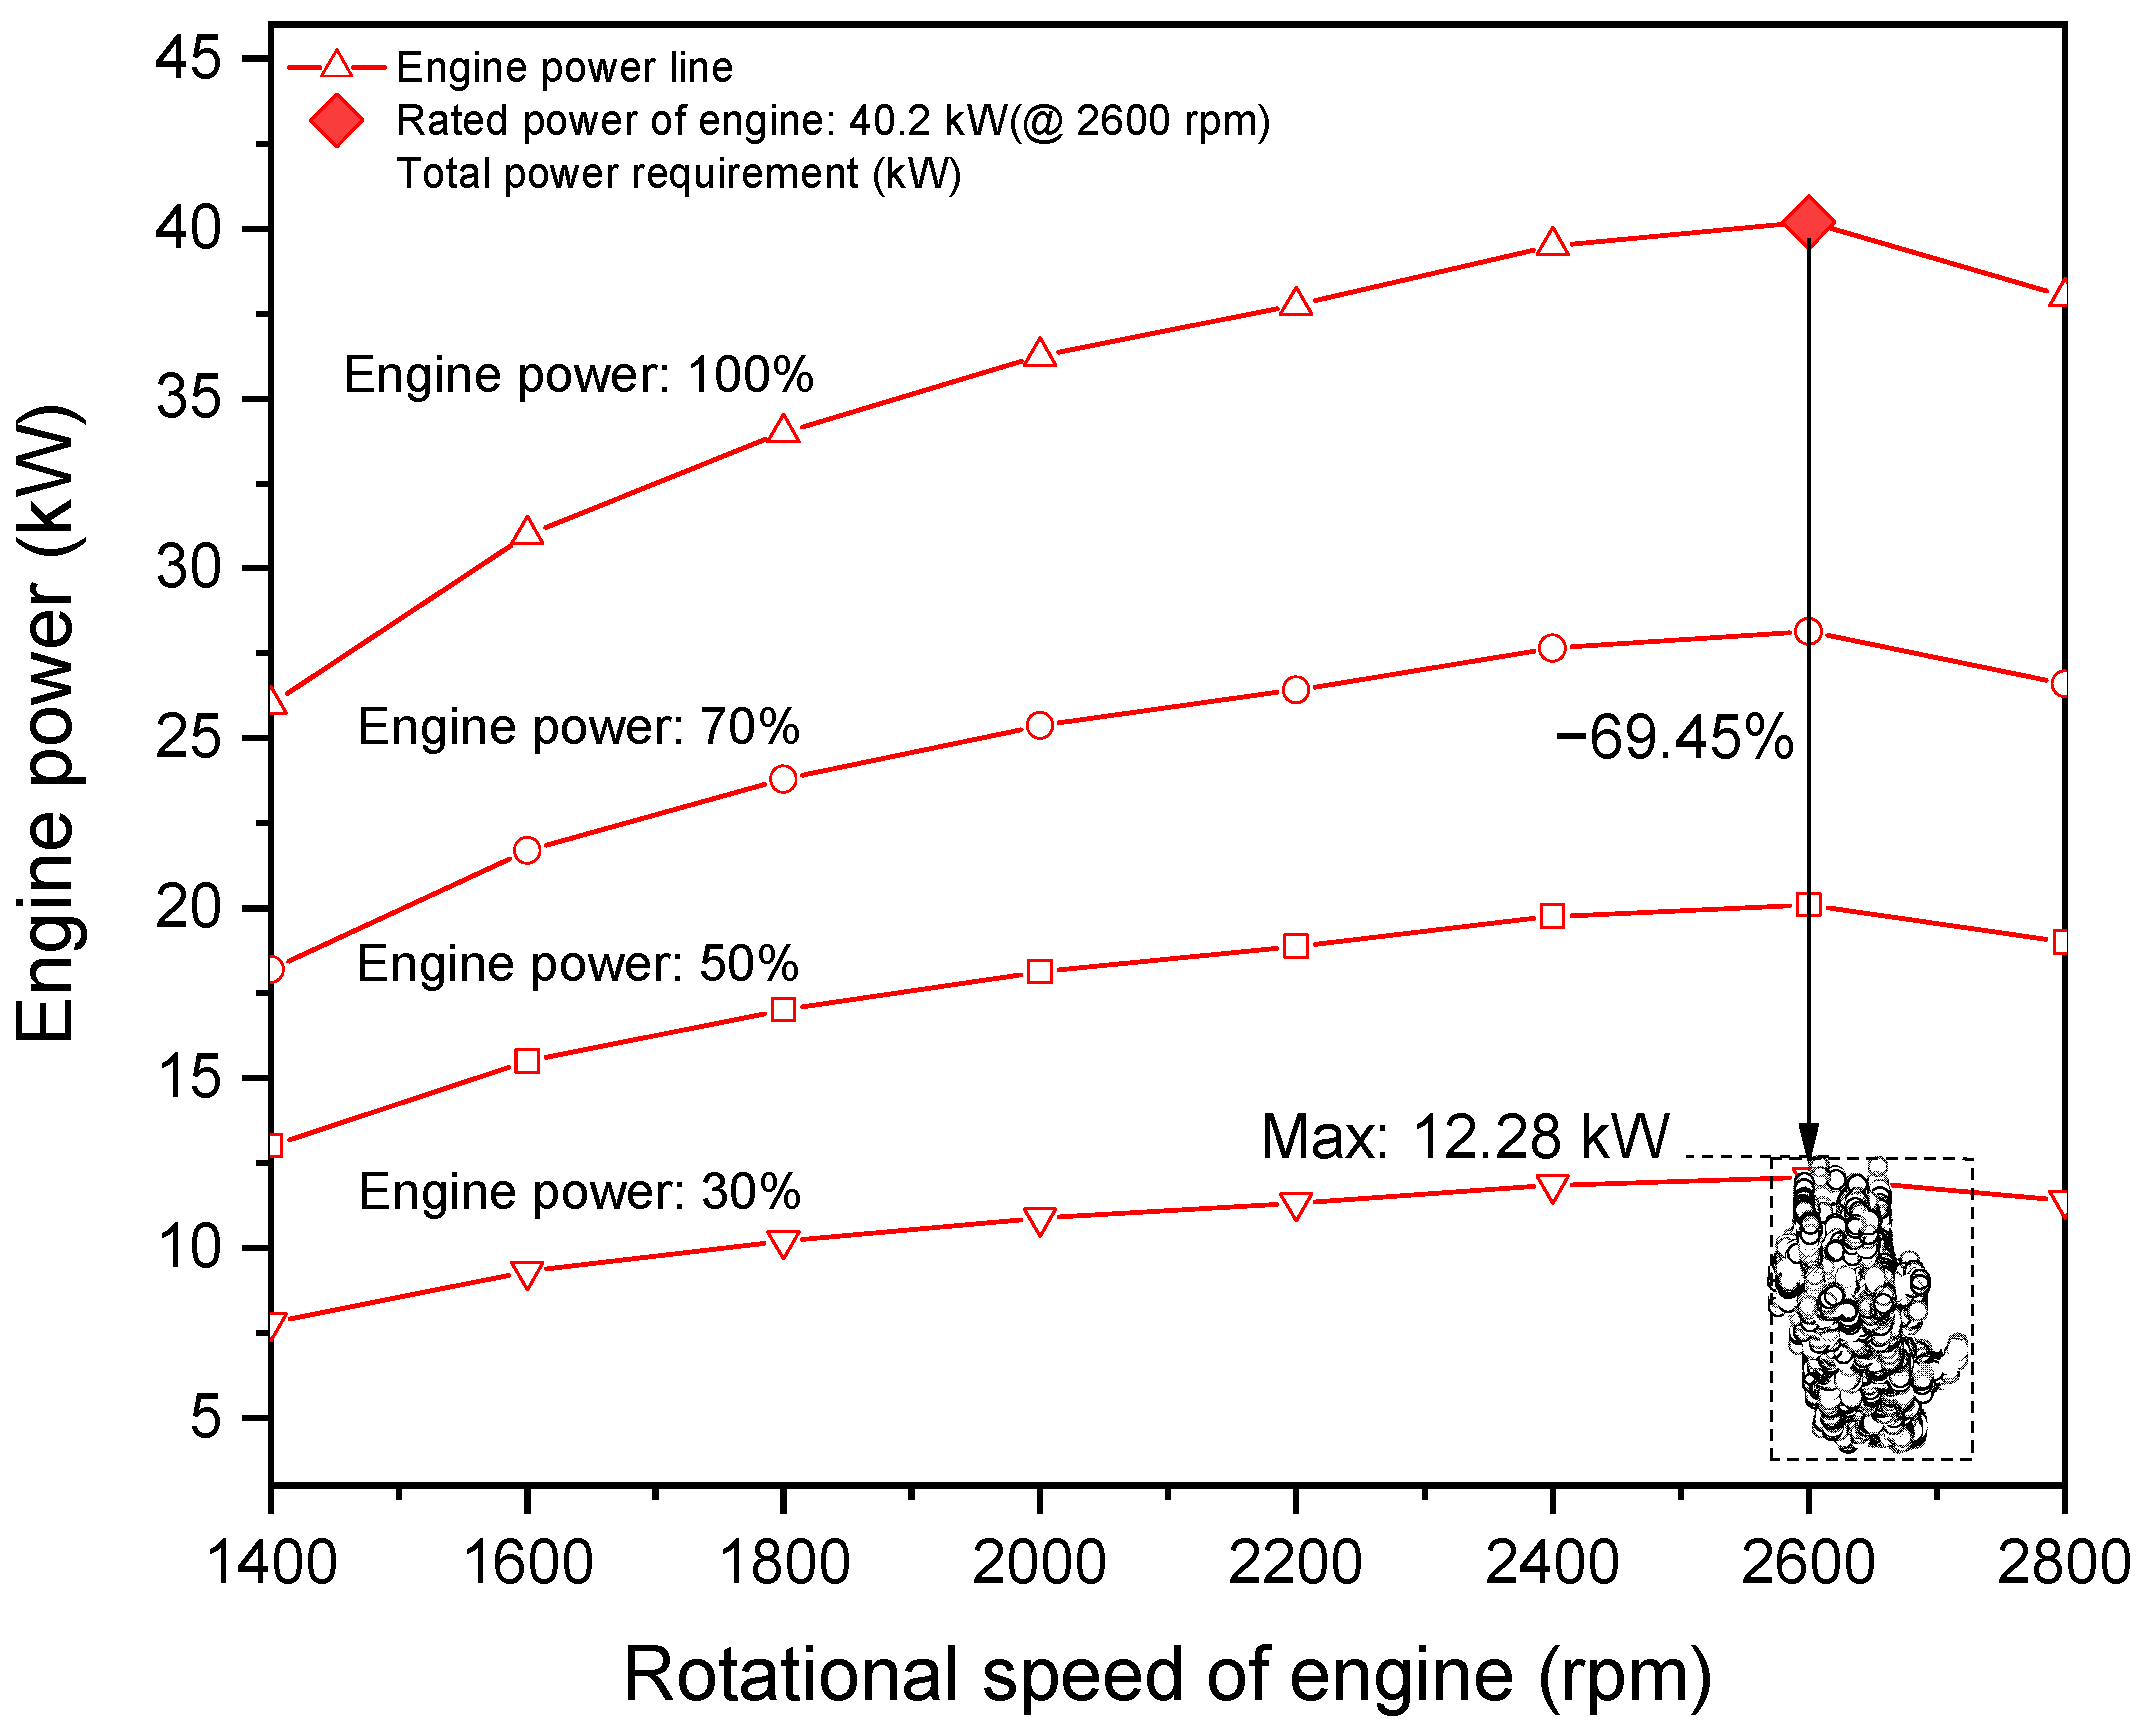
Figure 15 shows the mapping of the measured total power requirements onto the engine performance curve. The engine’s rated power is 40.2 kW at 2600 rpm, while the maximum measured total power requirement was 12.28 kW, corresponding to only ~30.5% of the rated power. Most measurements fell approximately 69.45% below rated power, indicating that a large portion of the engine capacity was unused under field conditions. These findings suggest that the current engine is oversized relative to the collector’s actual requirement, implying potential for engine downsizing or performance optimization to better match operational requirements.
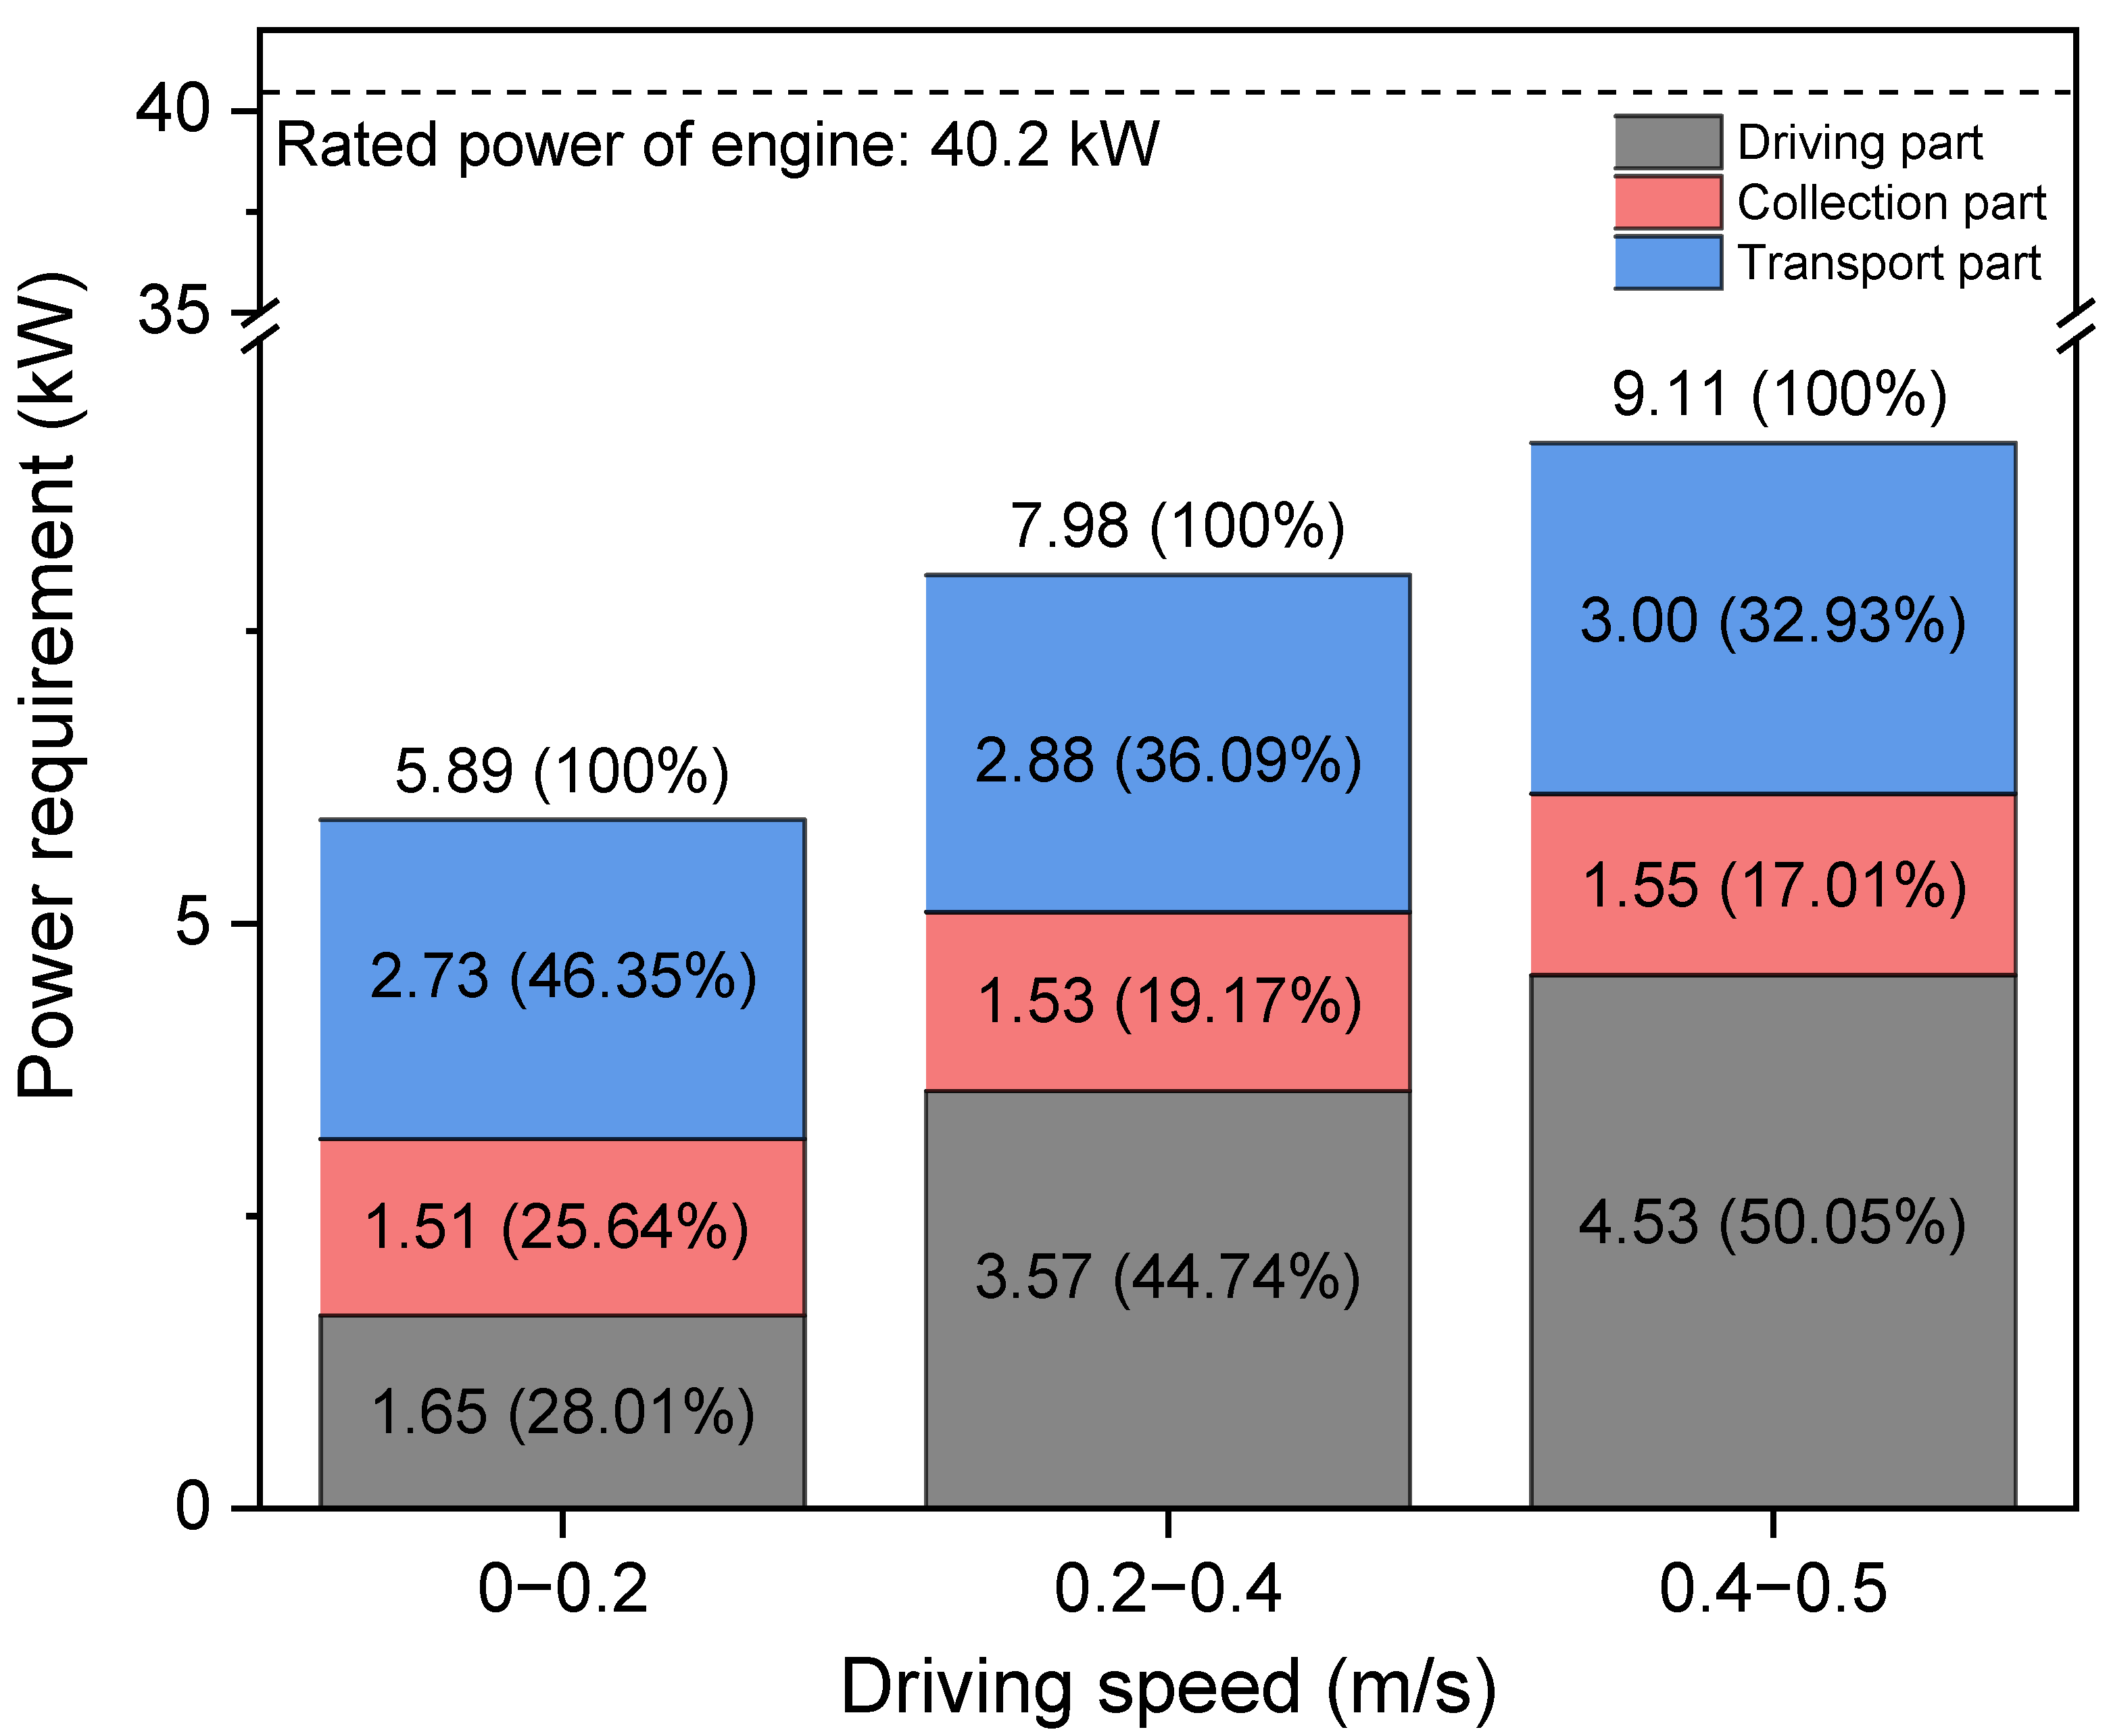
Figure 16 presents the proportion of power requirements for the driving part, collection part, and transport part in the total power of the garlic collector under actual operating conditions. At a low driving speed of 0.0–0.2 m/s, the transport part accounted for approximately 46% of total power, exceeding the 28% contribution of the driving part. As driving speed increased, the driving part’s power requirement rose sharply, surpassing 50% of total power at 0.4–0.5 m/s. In contrast, the collection and transport parts showed only modest increases, and their proportions in total power remained relatively stable. These results indicate that the driving part increasingly dominates total power requirement as speed rises, while the collection and transport parts maintain a consistent share of the overall requirement.
Table 9 presents descriptive statistics for the power requirements of the driving, collection, and transport parts, as well as total power, across different driving speed ranges. As speed increased from 0.0–0.2 m/s to 0.4–0.5 m/s, total power rose from an average of 5.89 kW to 9.11 kW, a ~55% increase. Among the main parts, the driving part exhibited the most pronounced change, rising from 1.65 kW to 4.56 kW, an increase of ~176%, indicating its high sensitivity to speed variation. In comparison, the transport part increased slightly from 2.73 kW to 3.00 kW, and the collection part from 1.51 kW to 1.55 kW, showing relatively stable power levels. These findings confirm that increases in total power are predominantly driven by the driving part, while the collection and transport parts remain comparatively constant. Statistical analysis further confirmed that the power requirements of each part and the total power differed significantly among driving speed groups (p < 0.05).

4. Discussion

The load characteristics observed in this study indicate that variations in total power requirements primarily originated from the driving part. As driving speed increased, the driving system exhibited a pronounced rise in power demand, whereas the collection and transport parts maintained relatively stable load characteristics across different operating conditions. These findings suggest that changes in total power were largely attributable to the driving part, while the other parts contributed consistently to the overall load distribution. This interpretation aligns with the sequential experimental design employed in this study, which was intended to isolate the independent effects of each operating variable under controlled field conditions. The present experiment served as a preliminary quantitative investigation to identify the fundamental load characteristics of a self-propelled garlic collector under a single field condition. Although the analysis focused on the independent effects of individual variables, incorporating interaction terms in future research will be necessary to enhance analytical precision and achieve a more comprehensive understanding of power requirement characteristics. The collection and transport parts exhibited stable hydraulic behavior, with only minor variations in power requirements across different driving and rotational speeds. In particular, the collection unit maintained a consistent load pattern, reflecting its continuous operation during residue gathering and its key role in stabilizing the overall load balance of the self-propelled garlic collector. The minimal influence of working depth on total power requirements was primarily due to the post-harvest field conditions under which the experiments were conducted. Because the garlic bulbs had already been excavated and the soil surface was loosened and partially dried, soil resistance acting on the collection mechanism was substantially reduced. Consequently, variations in working depth resulted in only small differences in total power demand. These results demonstrate that the collection system contributes a stabilizing effect within the integrated power system. Its steady hydraulic performance ensures smooth overall operation even when driving speed fluctuates, consistent with its functional behavior observed during field operations. The maximum measured total power requirement was 12.28 kW, corresponding to approximately 30% of the rated engine power of 40.2 kW. Moreover, all data points were located in the lower range of the engine’s performance curve, suggesting that the available engine power was not fully utilized under field conditions. This indicates that the engine installed in the collector has a higher capacity than necessary for the observed operational requirements.
To further contextualize these findings, comparisons were made with previous studies on self-propelled harvesters. Siddique et al. (2025) reported that the total power consumption of a self-propelled potato harvester was 6.38 kW, with 4.98 kW attributed to the harvesting unit and 1.40 kW to the driving unit, indicating that the harvesting mechanism accounted for the majority of energy use [35]. This pattern corresponds with the present results, where concentrated loads in specific working parts played a dominant role in overall power characteristics [35]. Similarly, Park et al. (2024) [36] analyzed a 140 kW self-propelled integrated bale production machine and found that the harvesting stage required the highest average power, while the wrapping process consumed less than 10% of the total. This supports the stable and relatively low power demands observed in the collection and transport systems of the garlic collector [36]. Hou et al. (2020) [26] developed a 4S-6 self-propelled garlic combine harvester equipped with a 15 kW engine for underground crop collection. Although their research primarily focused on bulb separation and crop loss, the selected engine capacity was comparable to the operational power range measured in the present field experiments [26]. Li et al. (2025) [37] designed a self-propelled mugwort harvester equipped with a 74.5 kW diesel engine and a hydraulic continuously variable transmission system to ensure stable driving and operational performance. In comparison, the garlic collector analyzed in this study employed a similar hydraulically driven configuration, reflecting a common design approach aimed at achieving efficient power transmission in self-propelled harvesting machinery [37].
Overall, these findings highlight that the driving part predominantly determines the total power requirement, whereas the collection and transport parts maintain relatively constant power levels. Additionally, the discrepancy between the rated engine power and the measured requirement provides valuable insight for evaluating the suitability of engine capacity relative to actual operational needs and for potential engine optimization or downsizing. Considering additional hydraulic losses and the power demand of the main control valve during collection, the total operating load can be estimated at approximately 20–22 kW. This finding suggests that the current 40.2 kW engine may be oversized relative to the actual operational demand, and that the required engine capacity could reasonably be reduced to around 25.5–30 kW while maintaining stable performance. From this perspective, appropriate engine downsizing could enhance power utilization efficiency and overall energy performance. Furthermore, a comparative assessment indicated that adopting a smaller 25.5 kW engine could reduce fuel consumption by approximately 35% and engine cost by about 23%, thereby improving both energy efficiency and economic feasibility in the design of the self-propelled garlic collector [38].
Despite these findings, the study has several limitations. Experiments were conducted under specific soil conditions in a single test field, limiting generalization to other soil types and field environments. The analysis was restricted to a single model of garlic collector, and crop conditions were limited to a particular season and site, which may not fully represent broader cultivation scenarios.
To address these limitations, future research should expand measurements to diverse soils, terrains, operating speeds and cultivation conditions. As summarized in Table 10, several soil, crop, terrain, and operating factors should be considered in designing these future experiments. Combining experimental measurements with simulation-based analyses will enable a more precise reproduction of actual working conditions and facilitate the development of predictive models that incorporate machine–soil interactions. Additional verification under diverse field conditions is also required to clarify how soil-related factors, such as texture, organic matter content, moisture level, and cone index, as well as crop density (low, medium, and high) and terrain slope influence the power requirements of each component of the collector. External validation under varying field environments should be conducted to assess the variability and relative influence of each factor on the collector’s load characteristics.

5. Conclusions

This study measured the power requirements of the main components of a self-propelled garlic collector—the driving, collection, and transport parts—under actual operating conditions and systematically analyzed the effects of driving speed, collecting speed, transporting speed, and working depth. The results confirmed that driving speed was the dominant factor influencing total power requirement, as increases in the driving part’s power directly governed the overall rise in total power. In contrast, the collection and transport parts showed only minor variations, maintaining relatively stable contributions to total power. The collection part played a stabilizing role in the overall power distribution, maintaining consistent hydraulic load characteristics regardless of driving speed. This indicates that balanced coordination between the driving and collection parts is essential for achieving stable and efficient field performance of self-propelled garlic collectors. The maximum measured total power requirement was 12.28 kW, corresponding to approximately 30% of the rated engine power of 40.2 kW.
This study evaluated the power requirements of the driving, collection, and transport parts of a self-propelled garlic collector under various operating conditions using field-based load measurements. The results demonstrated clear differences in hydraulic load behavior among components and provided quantitative evidence for improving operational efficiency and system configuration. Further studies should also explore engine capacity adjustment and downsizing, aiming to optimize power transmission systems for improved energy efficiency and alignment with actual operating requirements.

Author Contributions

Conceptualization, Y.-W.D. and W.-S.K.; methodology, W.-S.K.; software, Y.-W.D. and Y.-S.M.; validation, Y.-W.D. and Y.-S.M.; formal analysis, Y.-W.D. and W.-S.K.; investigation, Y.-W.D. and Y.-S.M.; data curation, Y.-W.D., S.-P.M., Y.-J.N., S.-G.K. and Y.-S.M.; writing—original draft preparation, Y.-W.D. and W.-S.K.; writing—review and editing, Y.-W.D. and W.-S.K.; supervision, W.-S.K.; project administration, W.-S.K.; funding acquisition, W.-S.K. All authors have read and agreed to the published version of the manuscript.

Funding

This work was supported by Korea Institute of Planning and Evaluation for Technology in Food, Agriculture and Forestry (IPET) through Machinery Mechanization Technology Development Program for Field Farming, funded by Ministry of Agriculture, Food and Rural Affairs (MAFRA) (RS-2023-00232391).

Data Availability Statement

The raw data supporting the conclusions of this article will be made available by the authors on request.

Conflicts of Interest

Author Young-Jo Nam and Seung-Gwi Kwon were employed by the company Bulls Co., Ltd. The remaining authors declare that the research was conducted in the absence of any commercial or financial relationships that could be construed as a potential conflict of interest.

References

  1. Lee, J.; Oh, Y.-G.; Yoo, S.-H.; Suh, K. Vulnerability assessment of rural aging community for abandoned farmlands in South Korea. Land Use Policy 2021, 108, 105544. [Google Scholar] [CrossRef]
  2. Happy, K.; Gang, R.; Ban, Y.; Yang, S.; Rahmat, E.; Okello, D.; Komakech, R.; Cyrus, O.; David, K.O.; Kang, Y. Agricultural sustainability through smart farming systems: A comparative analysis between the Republic of Korea and Republic of Uganda. J. Plant Biotechnol. 2024, 51, 167–201. [Google Scholar] [CrossRef]
  3. Tong, T.; Ye, F.; Zhang, Q.; Liao, W.; Ding, Y.; Liu, Y.; Li, G. The impact of labor force aging on agricultural total factor productivity of farmers in China: Implications for food sustainability. Front. Sustain. Food Syst. 2024, 8, 1434604. [Google Scholar] [CrossRef]
  4. Emami, M.; Almassi, M.; Bakhoda, H.; Kalantari, I. Agricultural mechanization, a key to food security in developing countries: Strategy formulating for Iran. Agric. Food Secur. 2018, 7, 24. [Google Scholar] [CrossRef]
  5. Cho, S.; Yoon, H. Evaluating the economic and environmental benefits of rice–soybean diversification in South Korea. Agric. Syst. 2025, 224, 104258. [Google Scholar] [CrossRef]
  6. Im, D.; Kim, J.H.; Moon, D.J.; Moon, T.I.; Yu, S.H.; Park, Y.J. Optimization of Bucket Size of Garlic Metering Device Using Multibody Dynamics Simulation. J. Biosyst. Eng. 2022, 47, 480–488. [Google Scholar] [CrossRef]
  7. Lee, C.K.; Choi, D.K. Development of a self-propelled riding garlic clove planter for film mulching: Static falling down angle, center of gravity, seed metering performance. Precis. Agric. Sci. Technol. 2025, 7, 81–94. [Google Scholar] [CrossRef]
  8. Choi, I.S.; Kang, N.R.; Choi, K.S.; Woo, J.K.; Kim, Y.H.; Yu, S.H.; Choi, Y.; Kim, Y.K. Design·Manufacture and Performance Evaluation of Gathering Type Garlic Harvesting Machine. J. Drive Control 2023, 20, 64–70. [Google Scholar]
  9. Yu, Z.; Yang, M.; Hu, Z.; Gu, F.; Peng, B.; Zhang, Y.; Yang, K. Kinematic analysis and process optimization of root-cutting systems in field harvesting of garlic based on computer simulation technology. Front. Plant Sci. 2023, 14, 1168900. [Google Scholar] [CrossRef]
  10. Park, H.G.; Kang, S.H.; Kim, Y.G.; Son, J.H.; Kim, Y.S.; Woo, S.M.; Ha, Y.S. An Investigation of Garlic’s Physical Properties Prior to Collection for the Development of a Garlic Collector. Appl. Sci. 2024, 14, 1644. [Google Scholar] [CrossRef]
  11. Lee, Y.S.; Kang, N.R.; Kim, Y.H.; Yu, S.H.; Nam, Y.O.; Kwon, S.G.; Hwang, U.S.; Park, H.G. Performance Evaluation of Riding Type Self-Propelled Garlic Collector. J. Korea Acad. Ind. Coop. Soc. 2022, 23, 733–740. [Google Scholar] [CrossRef]
  12. Jat, D.; Imran, S.; Singh, K.P. Development and Evaluation of Garlic Harvester for Raised Beds. J. Sci. Ind. Res. 2023, 82, 493–503. [Google Scholar] [CrossRef]
  13. Han, G.; Kim, K.-D.; Ahn, D.-V.; Park, Y.J. Comparative Analysis of Tractor Ride Vibration According to Suspension System Configuration. J. Biosyst. Eng. 2023, 48, 69–78. [Google Scholar] [CrossRef]
  14. Rahman, M.S.; Fahim, N.S.; Khan, B.; Jubayer, M.F.; Islam, T.; Hossain, M.A. The impact of soil physical properties on combine harvester efficiency: A composite model from correlation trends. Discov. Civil Eng. 2025, 2, 111. [Google Scholar] [CrossRef]
  15. Do, Y.W.; Moon, S.P.; Nam, Y.J.; Kwon, S.G.; Kim, W.S. Analysis of power requirements for self-propelled garlic collector by travel speed under actual operation condition. J. Drive Control 2024, 21, 135–144. [Google Scholar]
  16. Pitla, S.K.; Luck, J.D.; Werner, J.; Lin, N.; Shearer, S.A. In-field fuel use and load states of agricultural field machinery. Comput. Electron. Agric. 2016, 121, 290–300. [Google Scholar] [CrossRef]
  17. Ali, M.; Lee, Y.S.; Chowdhury, M.; Khan, N.A.; Swe, K.M.; Rasool, K.; Kabir, M.S.N.; Lee, D.H.; Chung, S.O. Analysis of driving stability and vibration of a 20-kW self-propelled 1-row Chinese cabbage harvester. J. Biosyst. Eng. 2021, 46, 48–59. [Google Scholar] [CrossRef]
  18. Kumari, A.; Raheman, H. Development of a Novel Draft Sensing Device with Lower Hitch Attachments for Tractor-Drawn Implements. J. Biosyst. Eng. 2024, 49, 20–28. [Google Scholar] [CrossRef]
  19. Rodias, E.; Berruto, R.; Busato, P.; Bochtis, D.; Sørensen, C.G.; Zhou, K. Energy Savings from Optimised In-Field Route Planning for Agricultural Machinery. Sustainability 2017, 9, 1956. [Google Scholar] [CrossRef]
  20. Kwon, D.; Ahn, D.V.; Kim, J.G.; Park, Y.J. Effect Analysis of Motor Power Characteristics on the Energy Consumption of Dual Motor Driven Powertrain for Electric Tractor. J. Biosyst. Eng. 2024, 49, 465–475. [Google Scholar] [CrossRef]
  21. Kumari, A.; Raheman, H. Tillage Operation with a Tractor Drawn Rotavator Using an Embedded Advisory System for Minimizing Fuel Consumption. J. Biosyst. Eng. 2023, 48, 487–502. [Google Scholar] [CrossRef]
  22. Zhang, X.; Qiu, L.; Sun, Q.; Jing, Y.; Zhao, Y.; Yao, P. Design and Test of a Single-Row Harvesting and Cutting Integrated Handheld Garlic Harvester. Appl. Sci. 2023, 13, 7077. [Google Scholar] [CrossRef]
  23. Swe, K.M.; Ali, M.; Chowdhury, M.; Reza, M.N.; Gulandaz, M.A.; Lee, S.H.; Chung, S.O.; Hong, S.J. Theoretical analysis of power requirement of a four-row tractor-mounted radish collector. Korean J. Agric. Sci. 2025, 52, 33–44. [Google Scholar] [CrossRef]
  24. Oduma, O.; Ugwu, E.C.; Ehiomogue, P.; Igwe, J.E.; Ntunde, D.I.; Agu, C.S. Modelling of the effects of working width, tillage depth and operational speed on draft and power requirements of disc plough in sandy-clay soil in South-East Nigeria. Sci. Afr. 2023, 21, e01815. [Google Scholar] [CrossRef]
  25. Sun, Q.; Sui, Y.; Zhao, L.; Hou, J.; Wang, C.; Ying, C.; Shangguan, J. Design and Development of Self-Propelled Garlic Harvester. Agric. Res. 2018, 7, 495–505. [Google Scholar] [CrossRef]
  26. Hou, J.; Chen, Y.; Li, T.; Wang, L.; Zhou, J. Development and Test of 4S-6 Garlic Combine Harvester. J. Eng. Sci. Technol. Rev. 2020, 13, 106–114. [Google Scholar] [CrossRef]
  27. Zhu, Z.; Li, W.; Wen, F.; Chen, L.; Xu, Y. Towards Optimizing Garlic Combine Harvester Design with Logistic Regression. Appl. Sci. 2022, 12, 6015. [Google Scholar] [CrossRef]
  28. Lee, G.-H.; Moon, B.-E.; Basak, J.K.; Kim, N.-E.; Paudel, B.; Jeon, S.-W.; Kook, J.; Kang, M.-Y.; Ko, H.J.; Kim, H.T. Assessment of Load on Threshing Bar During Soybean Pod Threshing. J. Biosyst. Eng. 2023, 48, 478–486. [Google Scholar] [CrossRef]
  29. Kumar, M.; Sahoo, P.K.; Kushwaha, D.K.; Mani, I.; Pradhan, N.C.; Patel, A.; Tariq, A.; Ullah, S.; Soufan, W. Force and power requirement for development of cumin harvester: A dynamic approach. Sci. Rep. 2024, 14, 15366. [Google Scholar] [CrossRef] [PubMed]
  30. Tekeste, M.Z.; Raper, R.L.; Schwab, E.B. Soil Drying Effects on Soil Strength and Depth of Hardpan Layers as Determined from Cone Index Data. Agric. Eng. Int. CIGR J. 2008, X, 1–17. [Google Scholar]
  31. Li, J.; Sun, S.; Sun, C.; Liu, C.; Tang, W.; Wang, H. Analysis of Effect of Grouser Height on Tractive Performance of Tracked Vehicle under Different Moisture Contents in Paddy Soil. Agriculture 2022, 12, 1581. [Google Scholar] [CrossRef]
  32. Shin, S.; Woo, S.I. Three-Dimensional Upper Bound Solution to Estimate Soil Thrust of a Track System on Saturated Clay Slopes under Undrained Conditions. Appl. Sci. 2024, 14, 4335. [Google Scholar] [CrossRef]
  33. Kim, W.S.; Kim, Y.S.; Kim, T.J.; Park, S.E.; Choi, I.S.; Kim, Y.K.; Kim, Y.J.; Kim, Y.J. Analysis of Power Requirement of 78 kW Class Agricultural Tractor According to the Major Field Operation. Trans. Korean Soc. Mech. Eng. A 2019, 43, 911–922. [Google Scholar] [CrossRef]
  34. Li, Z.; Wang, C.; Quan, L.; Hao, Y.; Ge, L.; Xia, L. Study on energy efficiency characteristics of the heavy-duty manipulator driven by electro-hydraulic hybrid active-passive system. Autom. Constr. 2021, 125, 103646. [Google Scholar] [CrossRef]
  35. Siddique, M.A.A.; Jeon, H.H.; Park, J.D.; Lee, S.H.; Kim, Y.J. Power Requirement Analysis and Performance Evaluation Using a Self-Propelled Harvester Simulation Model for Potato Harvesting. J. Drive Control 2025, 22, 1–7. [Google Scholar]
  36. Park, M.J.; Yang, C.W.; Jeon, H.H.; Baek, S.Y.; Baek, S.M.; Lee, J.H.; Kim, Y.J. Power Analysis for Silage Formation of 140 kW Self-Propelled Integrated Bale Production Machine. Precis. Agric. Sci. Technol. 2024, 3, 45–56. [Google Scholar]
  37. Li, Y.; He, Y.; Zhang, K.; Wang, S.; Hu, X.; Chen, J. Design and Performance Evaluation of a Self-Propelled Mugwort Harvester for Hilly and Mountainous Regions. Agriculture 2025, 15, 111. [Google Scholar] [CrossRef]
  38. Vukovic, M.; Leifeld, R.; Murrenhoff, H. Reducing Fuel Consumption in Hydraulic Excavators—A Comprehensive Analysis. Energies 2017, 10, 687. [Google Scholar] [CrossRef]
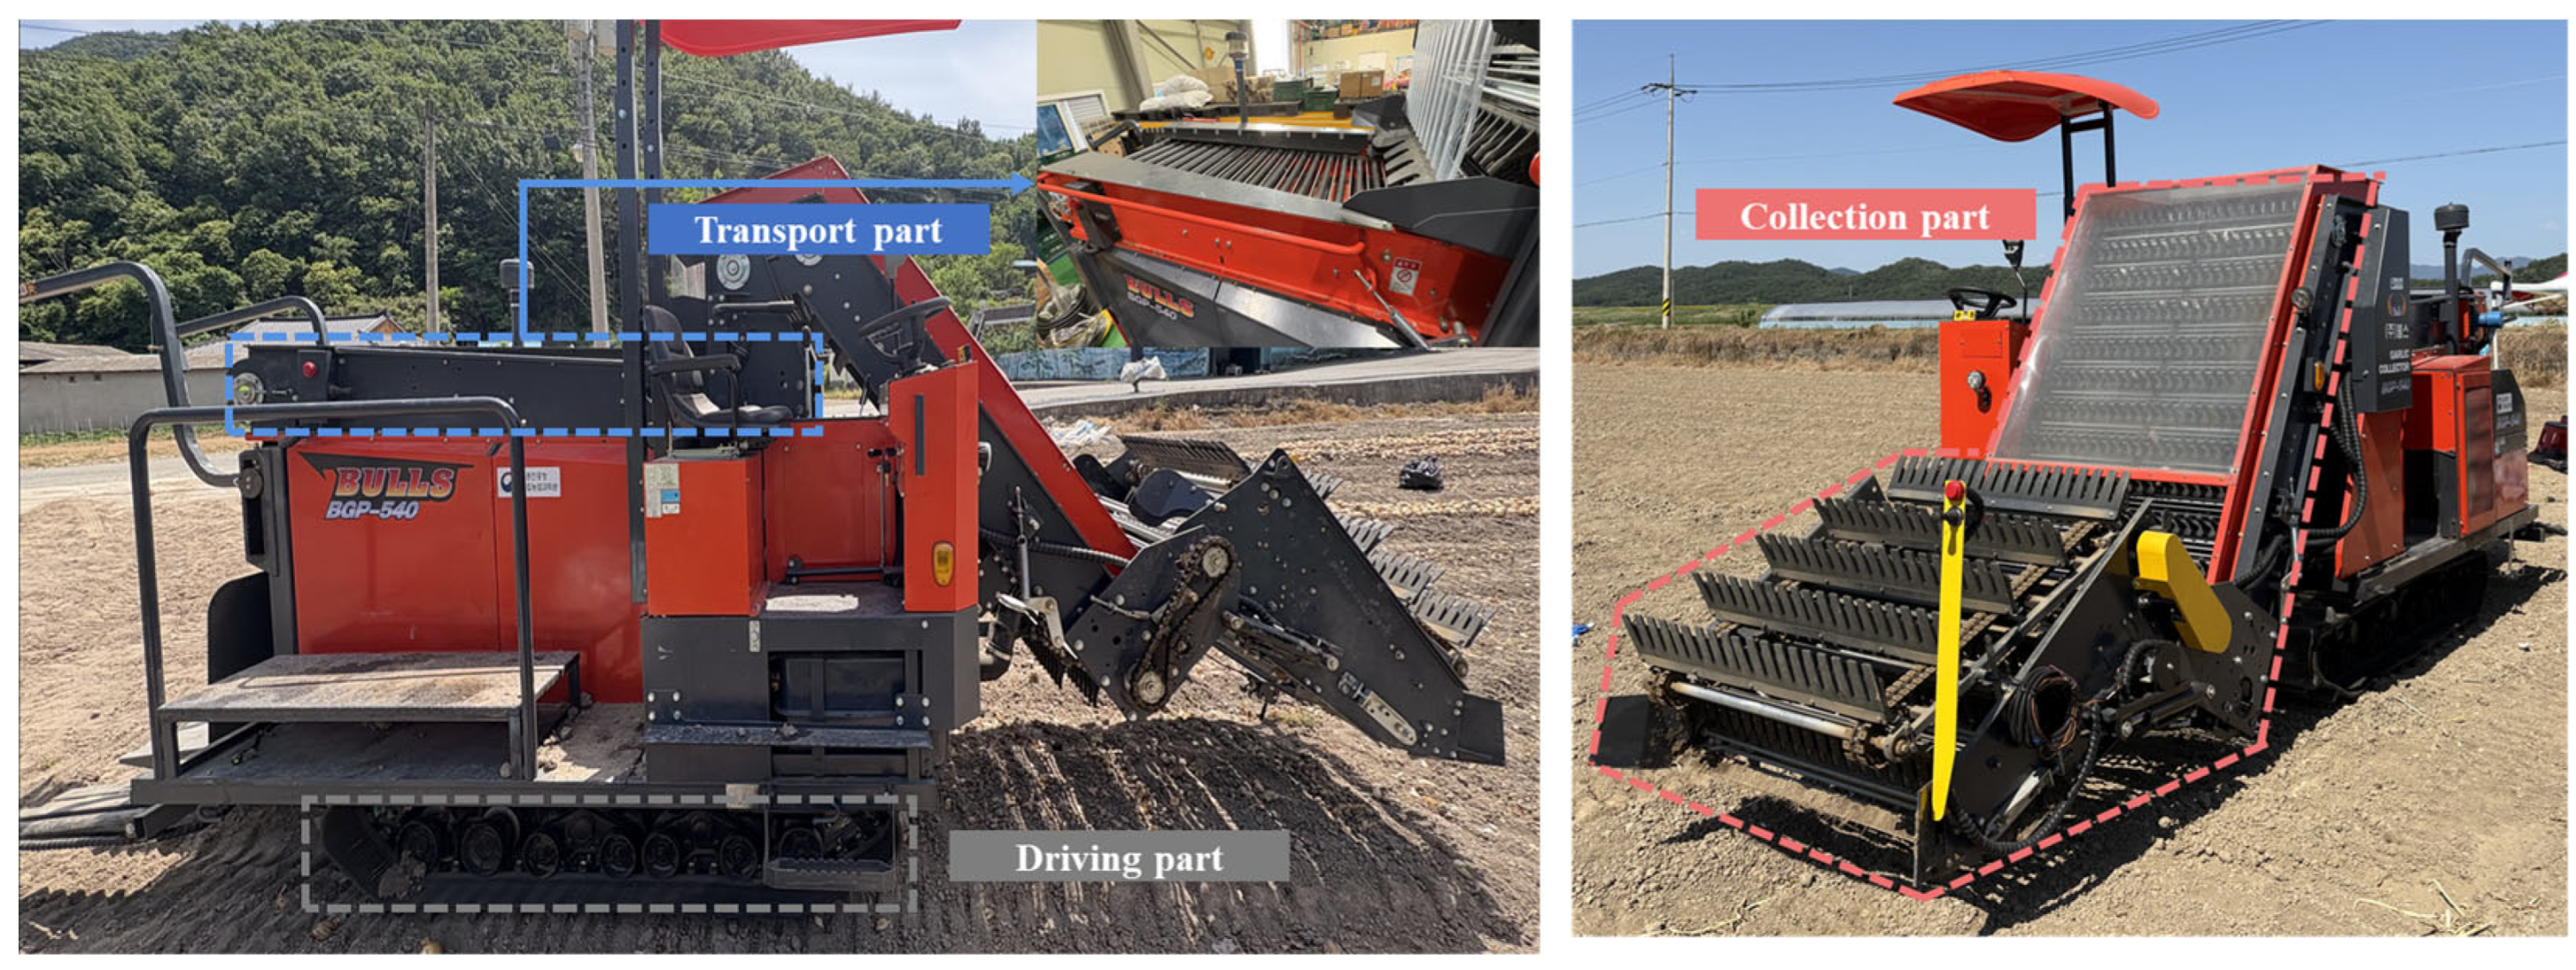
Figure 1. Structure of the main parts of the self-propelled garlic collector.
Electronics 14 04559 g001
Figure 2. Power transmission flow diagram of the main parts of the self-propelled garlic collector.
Electronics 14 04559 g002
Figure 3. Flow diagram of the load measurement system for the main parts of the self-propelled garlic collector.
Electronics 14 04559 g003
Figure 4. Overall garlic cultivation and harvesting sequence from soil preparation through collection.
Electronics 14 04559 g004
Figure 5. Garlic field used for field experiments with the self-propelled garlic collector.
Electronics 14 04559 g005
Figure 6. Results of cone index analysis as a function of soil depth in the field experiments.
Electronics 14 04559 g006
Figure 7. Results of power requirement analysis for the collection and transport parts according to rotational speeds.
Electronics 14 04559 g007
Figure 8. Results of power requirement analysis for the main parts according to working depth.
Electronics 14 04559 g008
Figure 9. Results of power requirement analysis for the main parts according to driving speed.
Electronics 14 04559 g009
Figure 10. Effects of major variables on power requirements.
Electronics 14 04559 g010
Figure 11. Torque and rotational speed of the driving part according to driving speed.
Electronics 14 04559 g011
Figure 12. Flow rate and pressure of the collection and transport parts according to driving speed.
Electronics 14 04559 g012
Figure 13. Mapping of measured hydraulic loads into the performance curves of the hydraulic motors for the collection and transport parts according to driving speed.
Electronics 14 04559 g013
Figure 14. Power requirements of the driving part, collection part, transport part, and total power of the garlic collector at different driving speeds.
Electronics 14 04559 g014
Figure 15. Total power requirement of the garlic collector under actual operating conditions mapped onto the engine performance curve at different driving speeds.
Electronics 14 04559 g015
Figure 16. Proportion of the driving, collection, and transport parts in the total power requirement of the garlic collector across different driving speeds.
Electronics 14 04559 g016
Table 1. Specification of the engine and machine used in this study.
ItemSpecification
EngineType4-Cycle, In-line, Diesel, Water-cooled
Cylinders4
Length × Width × Height (mm3)772 × 531 × 696
AspirationTurbocharged
Rated power (kW)40.2 @ 2600 rpm
Max. torque (Nm)182.6 @ 1700 rpm
Length × Width × Height (mm3)5580 × 2205 × 2100
Weight (kg)3170
Table 2. Specifications of sensors and data acquisition components used in the field experiment.
SensorModelMeasurement RangeAccuracy (Class)ResolutionTemperature DriftSampling Rate/Applied FilterExpanded Uncertainty (k = 2)
Flow
sensor
HySense QG100 (Hydrotechnik, Germany)0.7–70 L/min±0.4% of reading0.01 L/min±0.03%/°C2 kHz/Low-pass (2nd order)±0.6%
Pressure sensorHySense PR130 (Hydrotechnik, Germany)0–250 bar±0.5% FS @ +22 °C0.1 bar±0.03%/°C≤1 kHz/Low-pass (2nd order)±0.7%
GNSS
receiver
MRP-2000 (MBC RTK, Republic of Korea)Horizontal ± (10 + 1 × 10⁻⁶ D) mm±1.0% (RTK mode)1 mm±0.01%/°C10 Hz/Kalman filter±15 mm
Torque
telemetry
Telemetry System (MANNER, Germany)0–2000 Nm±0.1% FS0.5 Nm±0.002%/°C (zero drift)4 kHz/Bandwidth 1 kHz±0.2%
EncoderAutonics E50S8 (Republic of Korea)1024 pulse/rev-13-bit (8000 PPR max)-≤300 kHz/Moving average±1 pulse
Data acquisition (DAQ)HBM QuantumX MX840B (Germany)±10 V±0.03% FS24 bit±0.01%/°C40 kHz/ch/Digital Butterworth filter±0.05%
Table 3. Descriptive statistics of power requirements for the collection and transport parts at different rotational speeds.
Transporting
Speed
(rpm)
Collecting
Speed
(rpm)
Transport PartCollection Part
Min.Max.Avg. ± Std.Min.Max.Avg. ± Std.
30350.580.780.70 ± 0.03 f0.280.510.39 ± 0.04 d
450.570.810.71 ± 0.04 e0.500.880.65 ± 0.07 a
40350.791.030.91 ± 0.04 c0.280.520.38 ± 0.04 e
450.761.010.88 ± 0.05 d0.490.880.64 ± 0.07 b
50350.961.221.10 ± 0.05 a0.270.530.38 ± 0.04 e
450.881.171.04 ± 0.05 b0.480.890.64 ± 0.07 c
Mean values within the same column followed by different superscripts differ significantly (p < 0.05), as determined by the LSD test.
Table 4. Descriptive statistics of power requirements for the main parts according to working depth.
Working Depth (cm)ItemPower Requirement (kW)
Driving PartCollection PartTransport PartTotal
LeftRightTotal
8.5Min.0.000.000.170.801.442.96
Max.2.594.106.551.472.049.43
Avg. ± Std.0.71 ± 0.38 b1.10 ± 0.61 c1.81 ± 0.78 c1.10 ± 0.13 c1.78 ± 0.07 a4.69 ± 0.79 c
10Min.0.010.000.140.791.232.78
Max.2.484.695.071.562.028.12
Avg. ± Std.0.70 ± 0.42 c1.17 ± 0.65 b1.88 ± 0.84 b1.11 ± 0.13 b1.74 ± 0.08 b4.72 ± 0.84 b
13Min.0.100.000.270.811.222.85
Max.2.793.705.871.461.778.47
Avg. ± Std.0.95 ± 0.51 a1.21 ± 0.71 a2.16 ± 1.02 a1.12 ± 0.13 a1.53 ± 0.09 c4.81 ± 1.04 a
Mean values within the same column followed by different superscripts are significantly different (p < 0.05), as determined by the LSD test.
Table 5. Descriptive statistics of power requirements for the main parts according to driving speed.
Driving Speed (m/s)ItemPower Requirement (kW)
Driving PartCollection PartTransport PartTotal
LeftRightTotal
0.05Min.0.000.000.000.740.230.97
Max.1.382.452.741.602.066.40
Avg. ± Std.0.31 ± 0.21 c0.44 ± 0.32 c0.75 ± 0.42 c1.09 ± 0.14 c1.77 ± 0.14 b3.60 ± 0.71 c
0.15Min.0.010.000.140.791.232.16
Max.2.484.695.071.562.028.64
Avg. ± Std.0.70 ± 0.42 b1.17 ± 0.65 b1.88 ± 0.84 b1.11 ± 0.13 b1.74 ± 0.08 a4.72 ± 1.05 b
0.25Min.0.000.000.130.851.152.13
Max.4.226.768.071.642.1111.81
Avg. ± Std.1.41 ± 0.78 a2.25 ± 1.24 a3.65 ± 1.65 a1.29 ± 0.16 a1.72 ± 0.18 c6.66 ± 1.99 a
Mean values within the same column followed by different superscripts are significantly different (p < 0.05), as determined by the LSD test.
Table 6. Comparison of power requirement increase rates according to variable changes.
VariableVariablePower RequirementVariable Increase Rate
( b a ) / a × 100
Power Requirement
Increase Rate
( d c ) / c × 100
Value
(a)
Value
(b)
Value
(a)
Value
(b)
Transporting speed
(rpm)
30400.710.9133.33%28.17%
40500.911.125.00%20.88%
Collecting speed
(rpm)
35450.390.6528.57%66.67%
Working depth
(cm)
8.5104.694.7217.65%0.64%
10134.724.8130.00%1.91%
Driving speed
(m/s)
0.050.153.64.72200.00%31.11%
0.150.254.726.6666.67%41.10%
Table 7. Descriptive statistical analysis of driving part load according to driving speed under actual operating conditions.
Driving Speed
(m/s)
ItemDriving Part
* TL* RL* TR* RR
0–0.2Min.701776
Max.94922106520
Avg. ± Std.517 ± 203 a15 ± 6 c487 ± 167 c16 ± 3 c
0.2–0.4Min.401724820
Max.102044109240
Avg. ± Std.500 ± 192 b31 ± 5 b593 ± 148 b31 ± 5 b
0.4–0.5Min.453828140
Max.7784698947
Avg. ± Std.419 ± 153 c42 ± 1 a604 ± 125 a43 ± 2 a
* TL: Torque of left sprocket, RL: Rotational speed of left sprocket, TR: Torque of right sprocket, RR: Rotational speed of right sprocket. Mean values within the same column showing different superscripts are significantly different (p < 0.05); LSD test was used for comparisons.
Table 8. Descriptive statistical analysis of collection and transport part loads according to driving speed under actual operating conditions.
Driving Speed
(m/s)
ItemCollection PartTransport Part
Flow Rate
(L/min)
Pressure
(bar)
Flow Rate
(L/min)
Pressure
(bar)
0–0.2Min.20.8140.0920.3969.43
Max.23.4452.2927.14108.21
Avg. ± Std.22.29 ± 0.34 c45.20 ± 1.56 c22.30 ± 0.83 c81.64 ± 4.31 c
0.2–0.4Min.21.1339.0820.6369.90
Max.23.5652.4726.71106.66
Avg. ± Std.22.36 ± 0.30 b45.47 ± 1.65 b22.37 ± 0.65 b85.71 ± 4.35 b
0.4–0.5Min.21.4640.6920.9376.14
Max.23.5652.4526.60109.12
Avg. ± Std.22.43 ± 0.29 a46.01 ± 1.82 a22.68 ± 1.00 a88.15 ± 5.51 a
Mean values within the same column showing different superscripts are significantly different (p < 0.05); LSD test was used for comparisons.
Table 9. Descriptive statistical analysis of the power requirements of the main parts according to driving speed.
Driving Speed
(m/s)
ItemPower Requirement (kW)
Driving PartCollection PartTransport PartTotal
LeftRightTotal
0–0.2Min.0.010.120.141.292.244.08
Max.2.342.233.781.824.078.50
Avg. ± Std.0.78 ± 0.470.86 ± 0.391.65 ± 0.70 c1.51 ± 0.07 c2.73 ± 0.22 c5.89 ± 0.69 c
0.2–0.4Min.0.080.601.381.282.305.22
Max.4.023.777.351.804.1812.28
Avg. ± Std.1.64 ± 0.711.94 ± 0.593.57 ± 0.97 b1.53 ± 0.06 b2.88 ± 0.19 b7.98 ± 1.04 b
0.4–0.5Min.0.181.192.721.332.477.28
Max.3.904.847.291.824.2411.79
Avg. ± Std.1.85 ± 0.672.71 ± 0.644.56 ± 0.85 a1.55 ± 0.07 a3.00 ± 0.30 a9.11 ± 0.85 a
Mean values within the same column showing different superscripts are significantly different (p < 0.05); LSD test was used for comparisons.
Table 10. Planned factors, levels, and hypothesized effects for future research on the self-propelled garlic collector.
CategoryVariableLevels
(Expected Range)
Hypothesized Effect and Objective
Soil conditionsSoil moisture contentDry (20%)–Moderate (30%)–Wet (40%)Higher moisture increases crawler driving torque.
Soil texture (regional fields)Sandy loam–Loam–Clay loamTexture variation affects load stability.
Cone index1000–2500 kPaHigher CI increases driving torque fluctuation.
Crop conditionsCrop densityLow–Medium–HighHigher density increases collection resistance.
Terrain conditionsSlope0–5–10°Slope affects left–right torque balance.
Operating conditions
(interaction)
Driving speed × Working depth(0.05–0.25 m/s) × (8–13 cm)Cross-effects alter total power behavior.
Machine configurationEngine capacity30–50 kWEvaluate optimal capacity and downsizing.
Disclaimer/Publisher’s Note: The statements, opinions and data contained in all publications are solely those of the individual author(s) and contributor(s) and not of MDPI and/or the editor(s). MDPI and/or the editor(s) disclaim responsibility for any injury to people or property resulting from any ideas, methods, instructions or products referred to in the content.