Article

PLD-DETR: A Method for Defect Inspection of Power Transmission Lines

1
Key Lab of Electromagnetic Field and Electrical Apparatus Reliability of Hebei Province, School of Electrical Engineering, Hebei University of Technology, Tianjin 300401, China
2
Hebei Key Laboratory of Equipment and Technology Demonstration of Flexible DC Transmission, Tianjin 300401, China
3
School of Artificial Intelligence, Hebei University of Technology, Tianjin 300130, China
*
Author to whom correspondence should be addressed.
Electronics 2025, 14(20), 4107; https://doi.org/10.3390/electronics14204107
Submission received: 10 September 2025 / Revised: 13 October 2025 / Accepted: 15 October 2025 / Published: 20 October 2025
(This article belongs to the Special Issue AI Applications for Smart Grid)

Abstract

Unmanned Aerial Vehicle (UAV)-based computer vision has emerged as a crucial approach for transmission line defect detection. However, transmission lines contain multi-scale components in complex environments, thereby complicating the accurate extraction of multi-scale features and necessitating a careful balance between model complexity with detection accuracy. This paper proposes a Transformer-based framework called Power Line Defect Detection Transformer (PLD-DETR). To simultaneously capture shallow texture and deep semantic information while avoiding single-path limitations, a dual-domain selection mechanism block is designed as the backbone network, enabling collaborative feature extraction at different levels. Subsequently, an adaptive sparse self-attention mechanism is introduced to dynamically adjust attention weights for improved processing of critical feature regions, aiming to enhance attention to semantically rich regions and reduce background interference. Finally, we construct a multi-branch auxiliary bidirectional feature pyramid network to address information loss in traditional feature fusion. It fuses multi-scale features from four backbone layers through top-down and bottom-up bidirectional information flow, significantly improving feature representation capability. While maintaining model lightness, experimental results demonstrate that PLD-DETR achieves 2.7%, 7.01%, and 5.58% improvements in AP50, AP75, and AP50–95, respectively, compared to the baseline model. Compared with other transmission line defect detection methods, PLD-DETR demonstrates superior performance in both accuracy and efficiency

1. Introduction

Transmission lines constitute the core infrastructure of the power system, with their operational reliability directly determining power grid safety and stability. Establishing efficient fault detection systems is therefore essential for ensuring power supply continuity. Overhead transmission lines are widely used in global power systems due to their relatively low construction cost, mature technology, and other advantages. However, overhead transmission lines operate under prolonged exposure to complex and variable environmental conditions. These systems inevitably encounter multiple deterioration factors, which can be categorized into two primary types: intrinsic equipment defects and external disturbances. Intrinsic defects include insulator material aging and vibration damper loosening. External disturbances encompass foreign object intrusions, such as bird nesting activities. Both categories of factors can potentially trigger transmission line failures. Therefore, systematic regular inspections enable the timely identification and mitigation of potential transmission line hazards. This proactive approach effectively reduces the probability of failure and minimizes the adverse impacts of equipment failure on the power system [1].
Traditional transmission line defect detection primarily relies on manual inspection. However, some transmission lines often span extensive geographical areas. Many lines traverse challenging terrains, including mountain ranges, forests, river valleys, and so on. These harsh conditions create substantial operational challenges, resulting in reduced efficiency and elevated safety risks for manual inspection. With the rapid advancement and widespread deployment of Unmanned Aerial Vehicle (UAV) technology, UAV-based computer vision detection has gained prominence. This technology utilizes UAVs to acquire high-resolution imagery of transmission infrastructures [2]. The collected image data is subsequently interpreted and analyzed by trained technicians. Compared with traditional methods, UAV detection significantly improves operational efficiency and reduces safety risks [3]. However, this method still relies on manual image interpretation and defect identification. Manual analysis presents inherent limitations when processing large-scale image datasets. These limitations include reduced processing efficiency, inconsistent detection accuracy, and substantial inter-operator variability. Recent breakthroughs in artificial intelligence have significantly advanced computer vision capabilities. Deep learning algorithms demonstrate exceptional performance in object detection and image classification tasks. Consequently, automated defect detection based on deep learning shows substantial potential for transmission line detection applications [4]. Given the importance and specificity of transmission grid infrastructure, these applications require image recognition algorithms that balance detection accuracy with model efficiency. However, UAV-based transmission line inspection introduces unique challenges stemming from the dynamic nature of aerial image acquisition. Unlike stationary ground-based cameras, UAVs operate under continuously varying conditions that significantly impact image quality and detection difficulty. UAV altitude and flight trajectory fluctuations cause dramatic scale variations—defects may appear as large as 200 × 200 pixels in close-range shots but shrink to merely 10 × 10 pixels in wide-area surveillance images, creating extreme multi-scale detection requirements. Moreover, the camera perspective shifts with UAV attitude, causing the same defect to exhibit diverse appearances—a bird nest viewed from directly below appears as a circular blob, whereas oblique angles reveal its three-dimensional structure. These dynamic acquisition factors collectively result in high intra-class variance and low inter-class separability in transmission line defect datasets. Consequently, detection algorithms must possess robust multi-scale representation capability, motion-blur resilience, and viewpoint-invariant feature learning—requirements that exceed the design assumptions of conventional detection frameworks.
The current mainstream deep learning-based object detection algorithms can be categorized into two primary architectures: convolutional neural networks (CNNs) and Transformer-based detection algorithms, and their variants dominate defect detection applications, typically including you-only-look-once (YOLO) series [5] and the Detection Transformer (DETR) [6]. The YOLO-series algorithms exemplify CNN-based approaches, with the advantages of rapid inference speed and straightforward deployment. However, these algorithms exhibit inherent limitations in small objects detection and dense scene processing. Although the current traditional CNN-based algorithms can address certain detection requirements in power transmission systems, there are still deficiencies when applied to transmission line defect detection. The limited receptive field of convolutional operations makes it difficult to capture global structural information of long linear targets like transmission lines, resulting in poor detection performance for defect types that require global context, such as insulator damage defects.
DETR eliminates components such as non-maximum suppression (NMS) and significantly simplifies the object detection process. This design achieves end-to-end target detection without post-processing requirements. Recently, numerous research teams have developed specialized transmission line defect detection algorithms based on the DETR framework [7]. Although the Transformer’s global attention mechanism can capture long-range dependencies, it exhibits insufficient sensitivity for local feature extraction. DETR still faces significant challenges in terms of computational resource consumption and small object detection.
In order to address the challenges in UAV aerial photography in transmission line detection, to conduct more in-depth research on the exploration of deeper features, and to develop more efficient and superior performance detection methods, this paper innovatively developed a lightweight network detection framework for UAV aerial photography detection: Power Line Defect Detection Transformer (PLD-DETR). The main contributions of this paper are as follows:
(1)
To enhance datasets for transmission line defect detection, this study developed two comprehensive datasets: Common Defects of Transmission Lines Datasets (CDTLDs) and Real Scene Transmission Lines Datasets (RSTLDs). CDTLD extends the existing Chinese Power Line Insulator Datasets (CPLIDs) by incorporating five additional defect categories—dropped insulator strings, damaged insulators, flashover insulators, bird nests, and damaged vibration dampers—comprising seven categories with 18,072 annotated instances while addressing class imbalance issues; RSTLD contains 2180 high-resolution UAV images with 8930 annotations that capture complex background interference and multi-scale target characteristics in 110 kV transmission line environments, providing a reliable benchmark for practical algorithm evaluation.
(2)
To ensure the full extraction of image features, in the backbone stage of PLD-DETR, a dual-domain selection mechanism (DSM) block module is designed to identify degraded regions by the spatial selection module (SSM), and strengthen important high-frequency features by the frequency selection module (FSM). This dual-domain approach enables efficient extraction of multi-scale image features.
(3)
To address challenges in deep feature extraction, the adaptive sparse self-attention former (ASSAformer) module is designed to adaptively fuse sparse and dense attention using a two-branch architecture, thereby promoting effective deep feature analysis through the adaptive weight fusion mechanism.
(4)
A multi-branch auxiliary bidirectional feature pyramid network (MABIFPN) is designed to establish cross-scale information pathways. This architecture enables adaptive fusion of adjacent-scale features through learnable combination weights. The collaborative integration of multi-scale representations enhances feature complementarity and mitigates information loss during fusion processes.

2. Related Works

2.1. CNN-Based Object Detection Method

The object detection methods based on CNN are mainly divided into two-stage and one-stage categories: two-stage detection, represented by the Region-CNN (R-CNN) series, first generates high recall candidate boxes through candidate region generation networks, and then uses Region of Interest Pooling for feature alignment, classification, and bounding box regression. Typical works include Faster R-CNN [8] and Cascade R-CNN [9], which perform outstandingly in accuracy and scalability; one-stage detection directly completes end-to-end prediction on dense feature maps, represented by YOLO and the Single Shot MultiBox Detector (SSD) [10], emphasizing speed and deployment friendliness. In recent years, anchor-free methods (such as Fully Convolutional One-Stage Object Detection, FCOS) [11] and dynamic sample allocation strategies have further improved robustness and convergence, gradually approaching or even surpassing two-stage methods in accuracy.
Researchers have integrated visual recognition technology to develop automatic detection methods. These approaches identify damaged insulators, foreign objects, and bolt defects on transmission lines. Huang [12] proposed a damper corrosion recognition method using image processing techniques, including grayscale processing and edge mapping. The approach achieved damper segmentation and corrosion classification through threshold segmentation and morphological processing. Wu [13] developed a bird’s nest detection model using stripe-based features with histogram descriptors and support vector machine (SVM) classification. Murthy [14] proposed an insulator defect detection method using wavelet transform feature extraction and SVM classification. Zhang [15] proposed a cascaded R-CNN-based insulator detection algorithm. The method combines feature pyramid network (FPN) modules and ResNeXt-101 networks with a Microsoft Common Objects in Context pre-training strategy to improve recognition accuracy. Zhai [16] proposed a Hybrid Knowledge R-CNN based on Faster R-CNN for detecting multiple parts in transmission line aerial images. The method integrates spatial location and connectivity relationships to form an integrated knowledge module that enhances visual features. This approach significantly improves detection performance for insufficient samples and tiny fittings. Next year, this team [17] proposed a geometric characteristic learning model and integrated it into Faster R-CNN for shockproof hammer detection. The training set was expanded with artificial samples to improve detection accuracy when defective samples were limited. Liang [18] fused multiple DCNN models for faulty insulator detection using Faster R-CNN for localization, Fully Convolutional Networks for segmentation, and GoogleNet for fault detection. Hao [19] proposed an insulator defect detection model ID-YOLO based on YOLOv4, which adopts a multiscale bidirectional FPN and a simple attention module combined approach to improve the recognition accuracy of small-scale insulators. He [5] proposed an insulator fault detection model MFI-YOLO based on the improved YOLOv8 insulator fault detection model, replacing the C2f network to achieve target extraction in complex backgrounds, and a ResPANet was constructed as a feature fusion network. In summary, although the contemporary algorithms based on traditional CNNs can address some measurement or detection needs in the power transmission system, there are still shortcomings in accuracy when applied to defect detection in transmission lines.

2.2. Transformer-Based Object Detection Methods

DETR utilizes self-attention mechanisms to capture global contextual information and inter-object relationships, thereby streamlining the detection pipeline and improving performance in complex environments. However, the original DETR architecture exhibits several limitations that restrict its practical deployment. These include poor small target detection performance, slow convergence speed, and high computational costs. These factors hinder real-time applications in complex detection scenarios. To address these limitations, Baidu researchers [20] proposed Real Time Detection Transformer (RT-DETR) in 2023. RT-DETR replaces the original DETR encoder with an efficient hybrid encoder. The Attention-Based Intra-Scale Feature Interaction (AIFI) and cross-scale fusion module (CCFM) are used to process multi-scale features effectively.
DETR has shown strong performance across multiple public datasets. Its global information modeling approach outperforms traditional CNN-based methods. These improvements in both accuracy and efficiency have led researchers to explore DETR-based algorithms for transmission line fault detection. Cheng [21] introduced DETR into insulator defect detection and applied transfer learning techniques to address DETR’s large dataset requirements, while incorporating an improved loss function to enhance small object detection performance. This approach enables direct defect detection from UAV images without prior insulator localization, achieving competitive performance with reduced training data collection costs. Cheng [22] proposed an Adapter-Enhanced Insulator Detection Transformer, AdIn-DETR. This method combined Gaussian saliency guidance for convolutional feature modulation with looking-forward ability to refract the learned relational modeling of the decoder layers, making it more competitive on small-scale datasets. Zhang [23] designed a detection method for bolts on transmission lines with PA-DETR, which achieves higher accuracy by combining positional knowledge and attribute knowledge. Wang [24] proposed a TLI-DETR detection method for insulators, vibration hammers, and arcs. The model introduces edge semantic information through momentum comparison, which improves the model’s ability to extract features from small targets. Li [25] proposed a DETR-based multi-scale defective insulator detection method, which proposes a multi-scale backbone network that effectively captures features of small objects and introduces a self-attentive up-sampling module. Li [26] proposed LMFC-DETR, a lightweight Detection Transformer architecture for real-time foreign object detection on power lines, incorporating multi-scale feature fusion modules and attention mechanisms to reduce computational burden while enhancing detection capabilities. In summary, compared to traditional CNN detection algorithms, DETR-based detection algorithms can further enhance detection accuracy. However, achieving a balance between accuracy and computational overhead remains a significant challenge for UAV-based transmission line detection.

3. Methods

3.1. Overview of RTDETR-R18 Model

In order to ensure the lightness of the Transformer-based object detection algorithm, the lightest of the RT-DETR models with the R18 framework, as shown in Figure 1, was adopted to develop PLD-DETR. RT-DETR mainly consists of three parts, namely the backbone, encoder, and decoder. The backbone part of RTDETR-R18 uses ResNet-18, where the convolution–normalization–activation layer (CNL) is the basic feature extraction module. Block is a residual block of ResNet-18 to achieve deep feature learning. The encoder part builds a class of feature pyramids by reparameterization convolution (RepC3), AIFI attention fusion, and CCFM cross-scale channel mixing. FPN’s feature pyramid enhances fine-grained feature representation; the decoder part uses learnable queries to interact with encoder features to generate detection results.

3.2. The Overall Architecture of PLD-DETR

Since RTDETR-R18 uses ResNet-18 as a backbone, which has low computational complexity, it is not able to effectively capture complex and detailed image features. When dealing with high-complexity scenes or small object detection, the performance is inferior, especially in the ability of fine-grained feature representation, which limits its application in high-precision requirement tasks. Therefore, we propose the PLD-DETR, which redesigns the model structure of the backbone and the Transformer Encoder while maintaining model lightweighting, as shown in Figure 2.

3.2.1. DSM Block

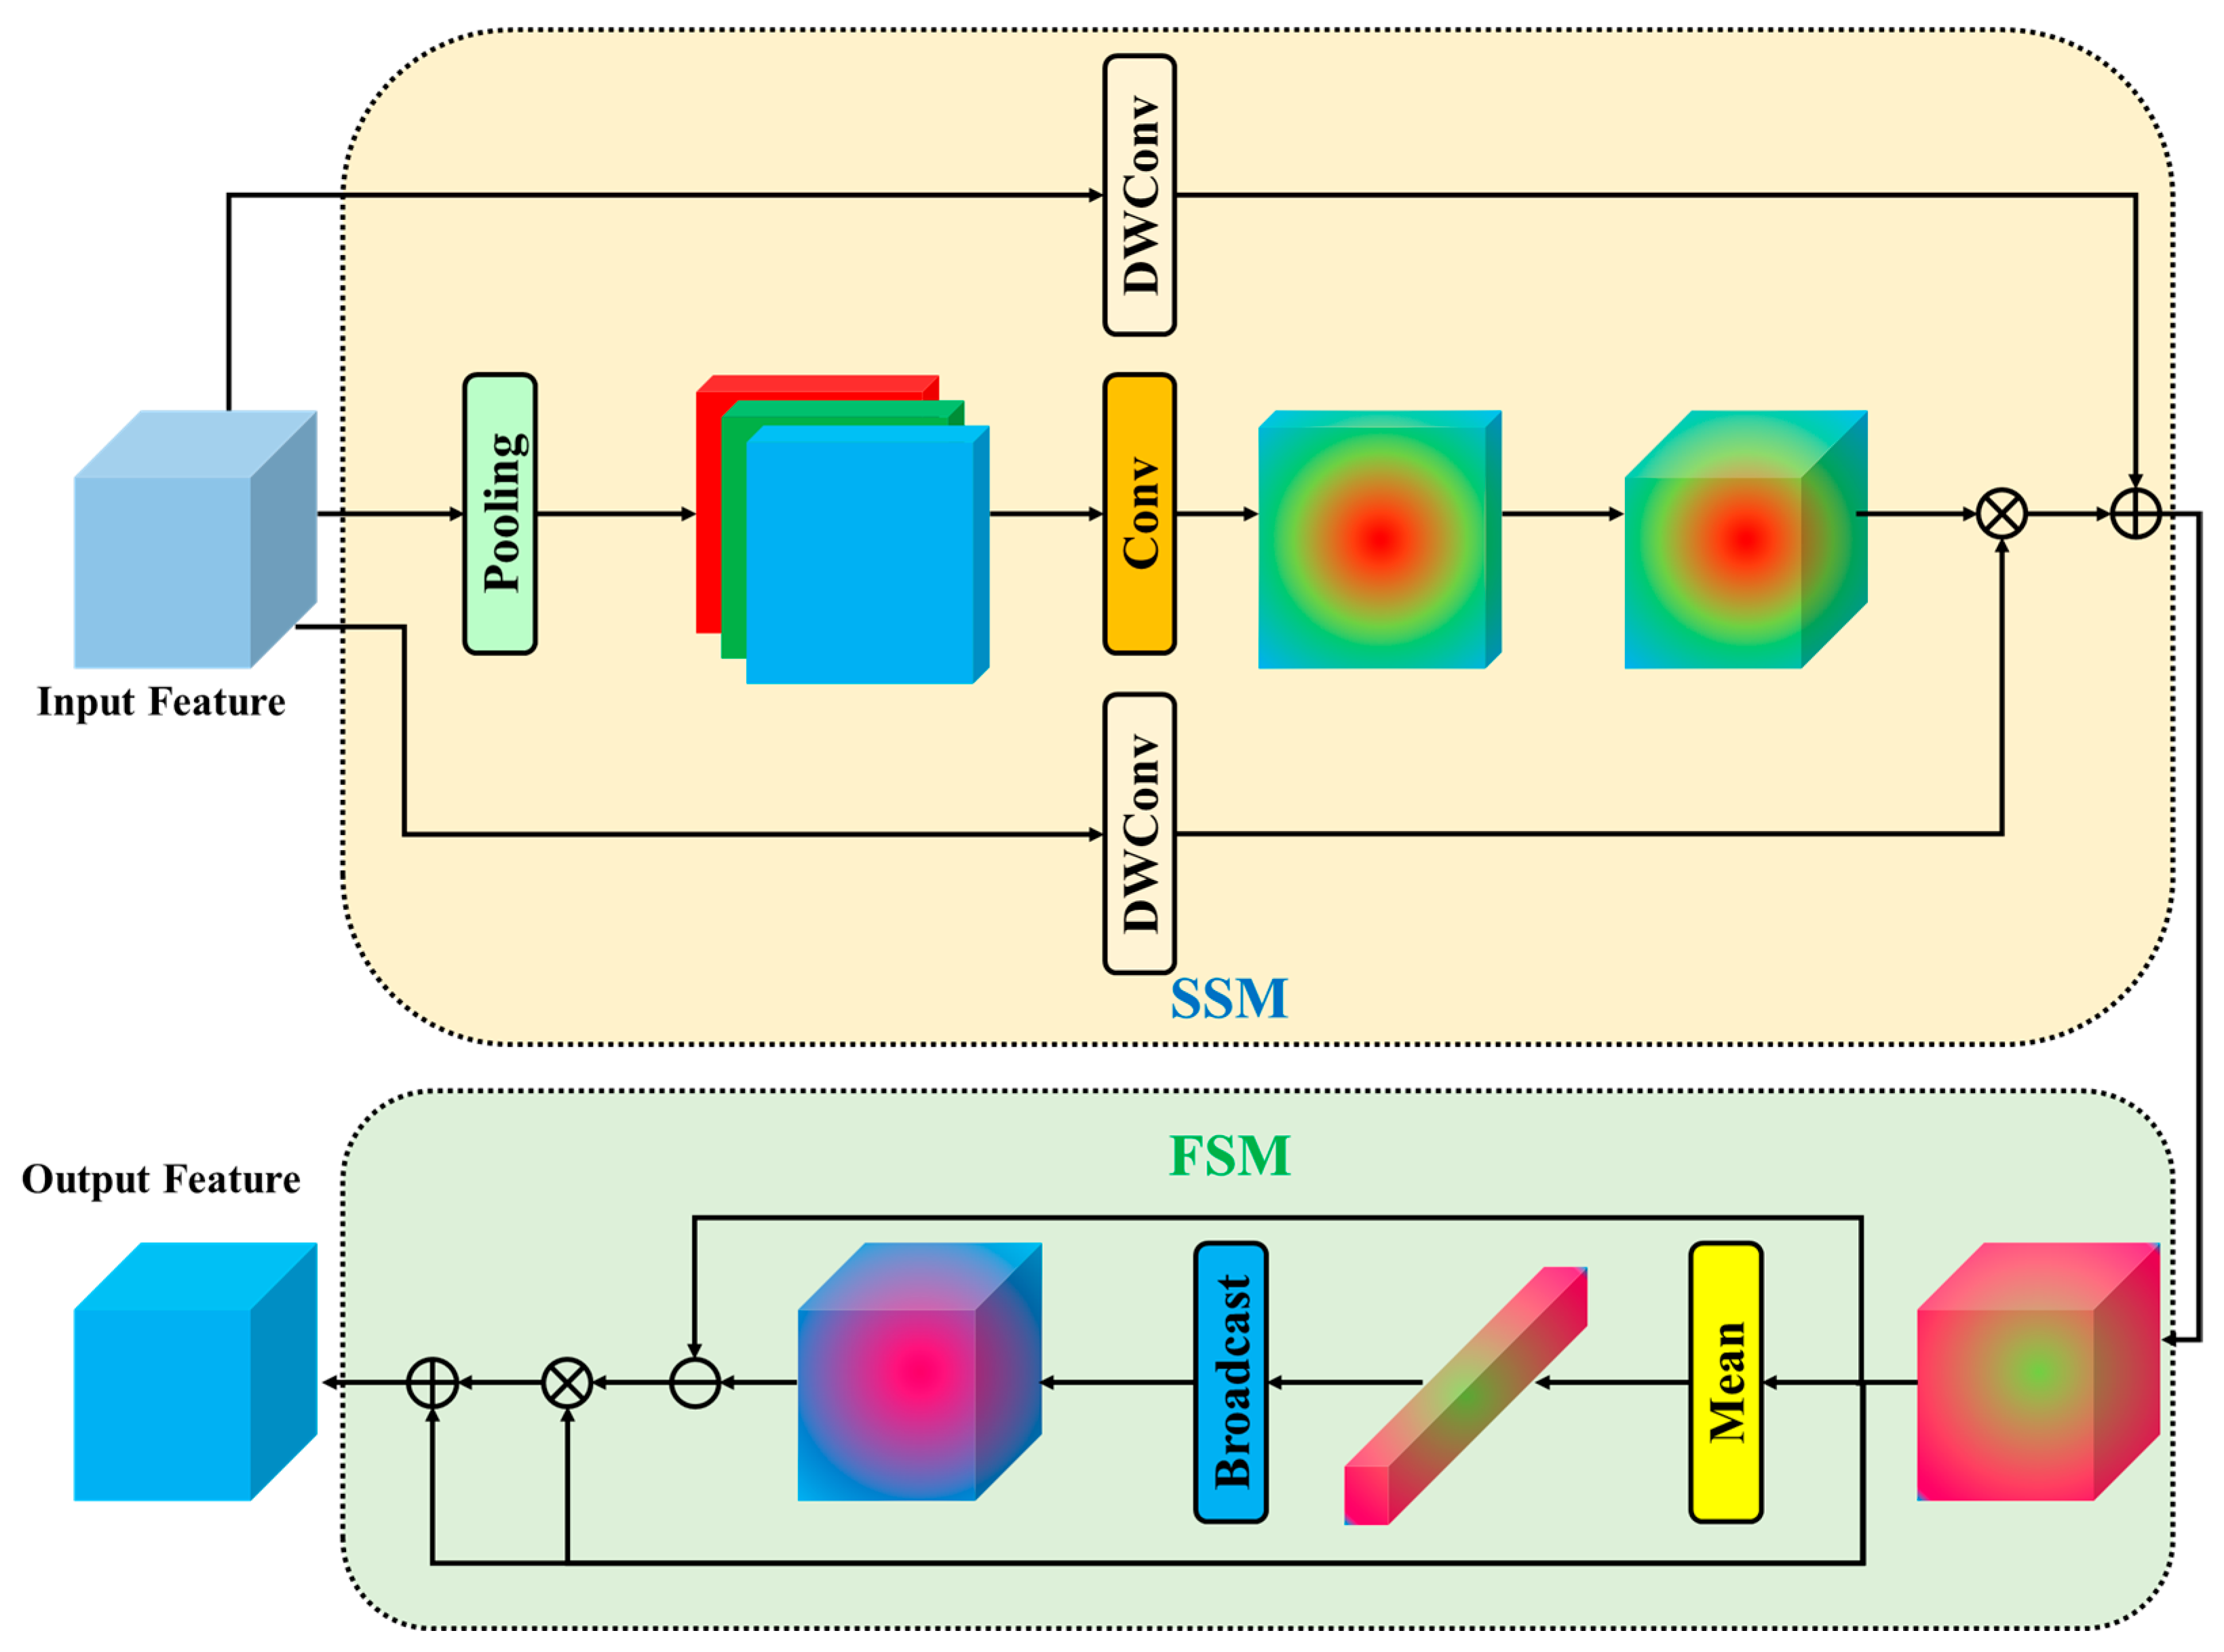
Backbone is the core part of the target detection network. Its main function is to extract the feature information of the target from images. Herein, the DSM block module was the most important feature extraction module. Inspired by reference [27], the DSM block module introduces the dual domain selection mechanism, as shown in Figure 3, which is designed to allow the network to focus on the important regions in the image instead of blindly processing the whole image. Algorithm 1 presents the pseudocode of the DSM.
Algorithm 1. Pseudocode flow of the DSM
Input: x ∈ ℝ^(B,C,H,W) # Input tensor with batch size B, channels C, height H, width W
Output: out ∈ ℝ^(B,C,H,W) # Output tensor after processing
1: Initialize:
   (a) Spatial Gate: Low-frequency extraction
   (b) Local Attention: High-frequency refinement
   (c) Parameters a, b for output fusion
2: Low-Frequency Extraction using Equation (2)
   (a)Pooling to reduce resolution (low-pass filter)
   (b)Convolution to capture low-frequency features
3: High-Frequency Extraction using Equation (3)
   (a)Depthwise convolution for high-frequency features
   (b)Additional depthwise convolution for refinement
4: Apply local attention to enhance high-frequency details
5: Fuse attention-enhanced features with original input
6: Return the fused output
7: end
The DSM consists of an SSM and an FSM. The input feature is reshaped to F H × W × C , where H, W, and C denote the height, width, and number ofchannels, respectively. The successive adoption of SSM and FSM can be expressed as
F ^ = FSM ( SSM ( F ) )
where SSM compresses the channel dimensions through average pooling and maximum pooling operations, performs channel separation transformations using deep convolution, generates channel-specific representations, and identifies severely degraded spatial locations in the image. Given an intermediate feature map F , we first squeeze F along the channel dimension by two types of pooling techniques, i.e., maximal pooling and average pooling, and then generate a generic feature map through a convolutional layer, which can be represented as
F = C o n v 3 ( [ AvgPool ( F ) , MaxPool ( F ) ] )
where C o n v 3 represents the convolution operation with a kernel size of 3.
Since each channel has a different degradation pattern, a channel representation is further generated by performing a channel-separation transform on the input feature F through deep convolution, and then modulating the resulting feature with F . The process is represented as follows:
F s = D W C o n v s 5 , 7 ( F ) T i l e ( F ) + D W C o n v 3 ( F )
where D W C o n v s 5 , 7 represent the cascaded depth-wise convolution operations with kernel sizes of 5 and 7, indicates an element-wise multiplication.
The degraded/clear images generally have similar low-frequency components while differing in high frequencies; thus, the real differences region between the input/clear image pairs are emphasized by removing the lowest frequencies through the FSM and emphasizing the high-frequency information (details such as edges, textures, etc.). Thus, a mean filter is first applied to F S to generate low-frequency features, and then, complementary high-frequency features are obtained by subtracting the resulting low-frequency signal from the input, which is represented as
F s = F s B r o a d c a s t ( M e a n ( F s ) )
The mean filter is implemented by channel global mean pooling. The final output of the FSM and SSM is generated using element-by-element multiplication between F S and F S residual concatenation, which is denoted as
F ^ = F s F s + F s
The main function of this mechanism is to simultaneously select and optimize features in both spatial and channel domains, identifying important regions in the image through the spatial attention mechanism, and selecting the most discriminative feature channels through the channel attention mechanism. This dual-domain synergy is able to more accurately locate the target and enhance the expression of the relevant features. At the same time, the background noise and extraneous information are suppressed, so that the computational efficiency is maintained. This significantly improves feature quality and target detection performance, especially in multi-target detection tasks in complex scenes.
Unlike the traditional RTDETR-R18 network, which feeds the last three layers of features to the encoder layer, our backbone design inputs all the features extracted from all the block layers with different depths to the encoder layer, which is mainly to achieve the full fusion and utilization of multi-scale features. Compared with the traditional RT-DETR, this design is able to capture both shallow detailed texture information and deep semantic features, and adaptively fuse different levels of feature representations through the attention mechanism of the Transformer Encoder, avoiding the loss of information in the middle layer, and providing richer multiscale feature representations. The method can obtain a better performance in the areas of small target detection, large target recognition, and complex scene understanding, while improving the gradient flow and the overall detection accuracy.

3.2.2. ASSAformer

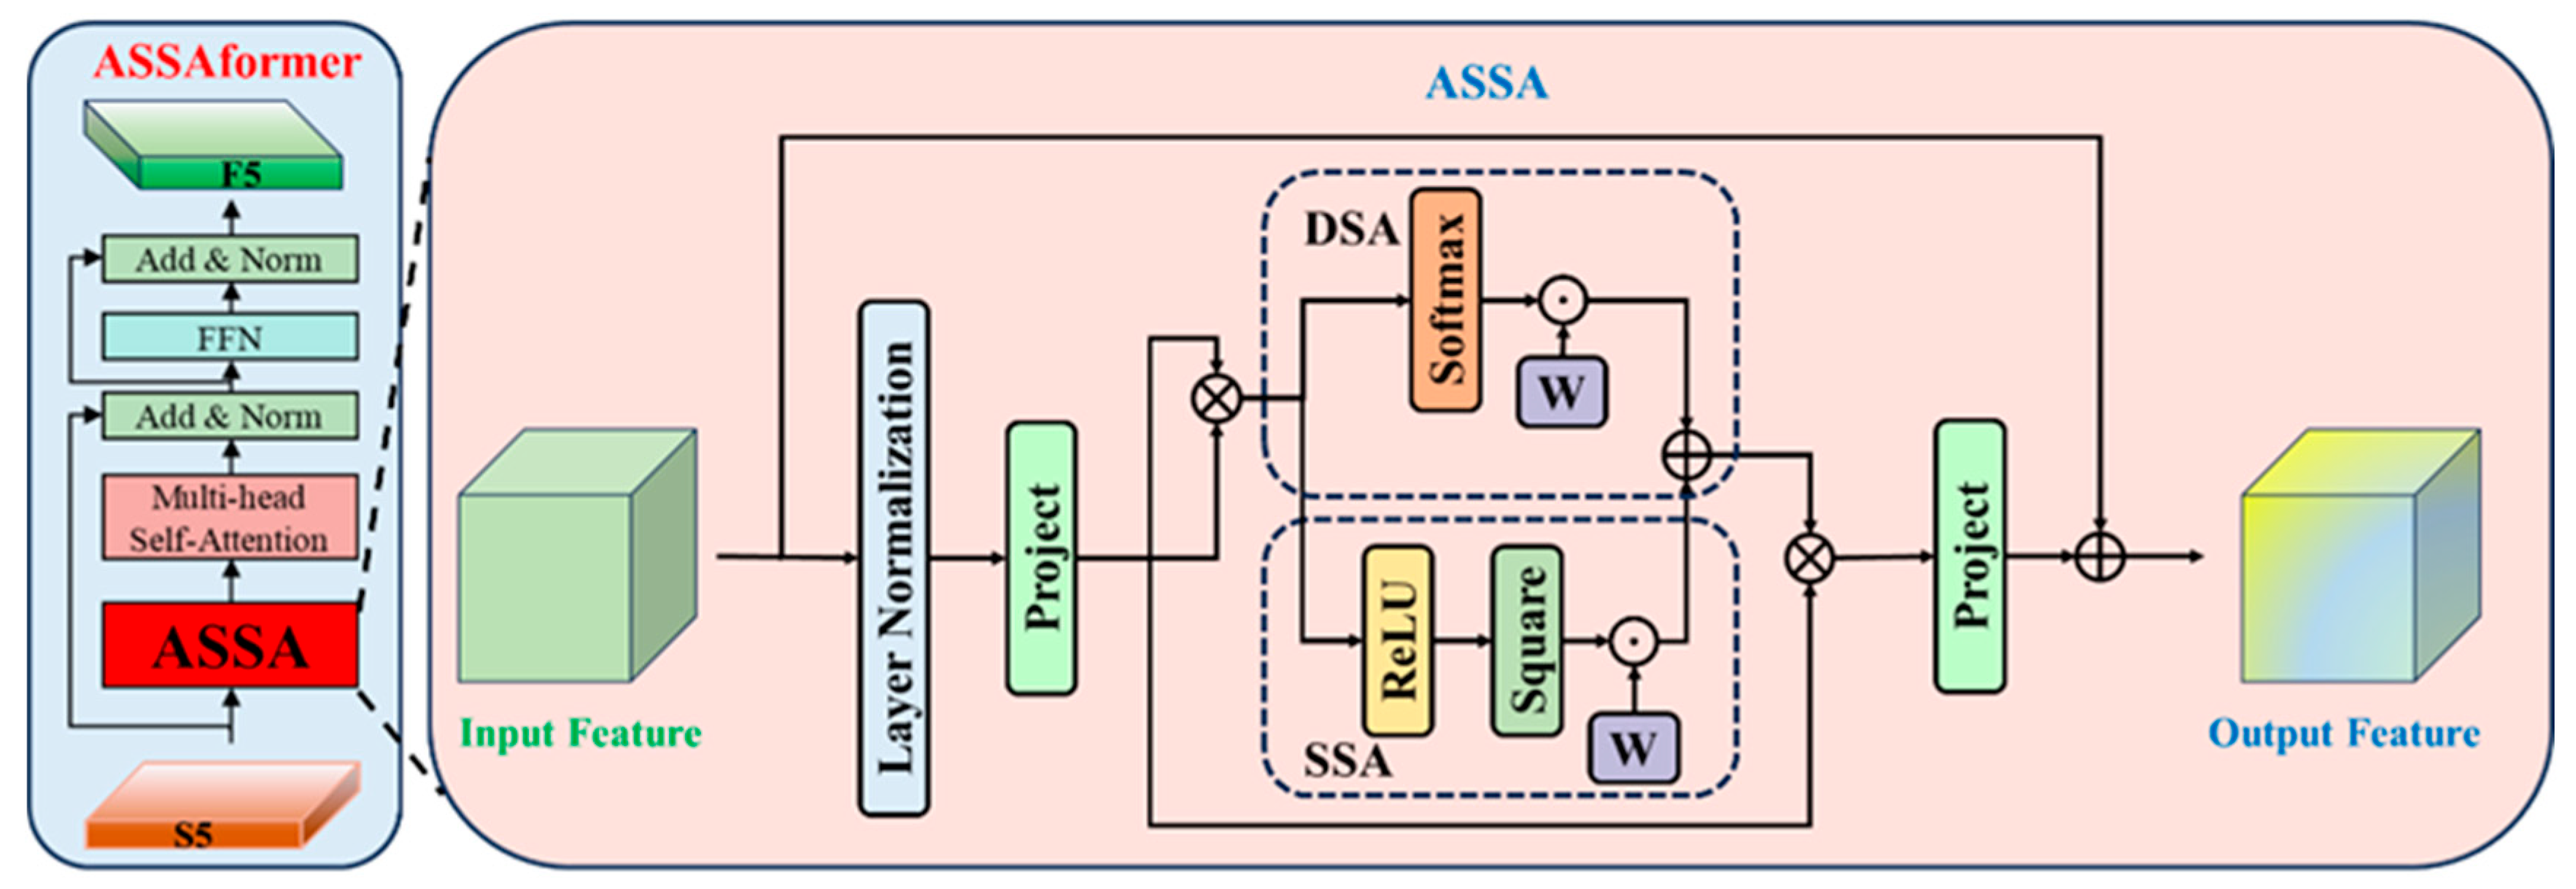
The Transformer Encoder of PLD-DETR is the core module of image feature processing, which mainly includes the ASSAformer module and the MABIFPN feature fusion network. AIFI is the attention mechanism module of the traditional RT-DETR, but there are certain shortcomings in information processing and adaptive ability, which cannot fully analyze the deep feature information of the images. To solve this problem, inspired by reference [28], the ASSAformer module was designed herein, which introduces the ASSA to further enhance its capability in adaptive feature selection to improve the accuracy, as shown in Figure 4. Algorithm 2 presents the pseudocode of the ASSA.
Algorithm 2. Pseudocode flow of the ASSA
Input: x ∈ ℝ^(B, H, W, C) # Input tensor with batch size B, height H, width W, channels C
mask (optional): Mask tensor
Output: out ∈ ℝ^(B, H×W, C) # Output tensor after adaptive sparse attention
1: Initialize:
   (a) Normalize: Layer Normalize
   (b) Attention layers: WindowAttention_sparse (for sparse) and Window Attention (for dense)
2: Flatten the input and apply normalization
3: Attention Masks (optional):
4: if mask is provided:
5: Generate attention masks using the input mask
6: else:
7: attn_mask = None
8: Compute attention using sparse and dense branches
9: if sparseAtt == True:
10: Compute sparse attention using Equation (8)
11: else:
12: sparse = None
13: Compute dense attention using Equation (9)
14: Compute attention weights using softmax to ensure α1 + α2 = 1
15: Combine sparse and dense attention matrices using Equation (10)
16: Apply the final layer of normalization and return output using Equation (12)
17: end
Given the input feature map X H × W × C , it is first split into M × M windows, and the query matrix Q , key matrix K , and value matrix V are generated as follows:
Q = X W Q , K = X W K , V = X W V
where W Q , W K , W V C × d are learnable parameters. The attention matrix A is computed as the dot product of the query and key, scaled by d , and offset by a bias term B :
A = f ( Q K T / d + B ) V
where f represents a nonlinear activation function.
The dense self-attention (DSA) is computed using the standard softmax activation function to normalize the attention matrix.
D S A = S o f t m a x ( Q K T / d + B )
Sparse self-attention (SSA) uses a squared ReLU activation layer to emphasize important high-frequency information and suppress negative scores.
S S A = R e L U 2 ( Q K T / d + B )
SSA helps to remove irrelevant features during feature aggregation. ASSA combines sparse and dense self-attention using adaptive weighting. The weighted combination is computed as
A = ( α 1 S S A + α 2 D S A ) V
where α 1 and α 2 are learnable weight coefficients.
Layer normalization is applied to both the sparse branch and the dense branch.
The weight coefficients are normalized using softmax to ensure they sum to 1:
ω n = e a n i = 1 N e a i , n = { 1 , 2 }
where a n represents the activation values associated with the weights.
Finally, the output feature map is obtained by projecting the weighted features using the project layer, with a residual connection to ensure gradient flow:
X = P r o j e c t ( A ) + X
Through these steps, the ASSA mechanism effectively combines the advantages of sparse and dense attention, enhancing feature representation, especially in image reconstruction or other feature learning tasks. The extracted features are designed with two-path residual connection after the ASSA module, which realizes spatial semantic alignment and attention guidance through ASSA preprocessing, reorganizes the original features into a representation suitable for attention computation, and then goes through the multi-head attention mechanism for refinement, captures the relationship between the features and establishes the long-distance dependency from multiple perspectives, and finally carries out residual connection and layer normalization to ensure stable propagation of gradient by Add&Norm. Connection and layer normalization through Add&Norm ensure stable gradient propagation; then, the information through ASSA directly connects to the Add&Norm layer as a bypass connection design, which directly transmits the basic semantic information processed by ASSA, thereby avoiding over-modification in multi-head attention and providing additional gradient propagation paths to achieve a balance between original semantic protection and computational efficiency. This dual fusion strategy synergistically fuses the information of two paths in the Add operation: path one provides high-quality features processed by refined attention, and path two provides coarse-grained features that preserve the original semantics. The two paths are complementarily enhanced to realize the multi-level feature representation combining coarseness and fineness, and the network is able to adaptively learn how to balance the contribution weights of the two paths in different situations, so as to maintain the powerful modeling capability of the Transformer while ensuring the training stability through double residual connectivity, and enhancing the feature richness and model robustness.
The feed-forward neural network layer converts the linear attention mechanism to complex feature modeling through a nonlinear activation function, performs position-by-position feature enhancement, and learns deep nonlinear combinatorial relationships. The second Add&Norm ensures effective gradient back propagation and training stability based on the double residual mechanism, and the layer normalization ensures the stability of feature distribution and accelerates the convergence. The architecture realizes a complete feature processing chain from linear global modeling to nonlinear local enhancement, maximizing the feature expression ability of the Transformer.

3.2.3. MABIFPN

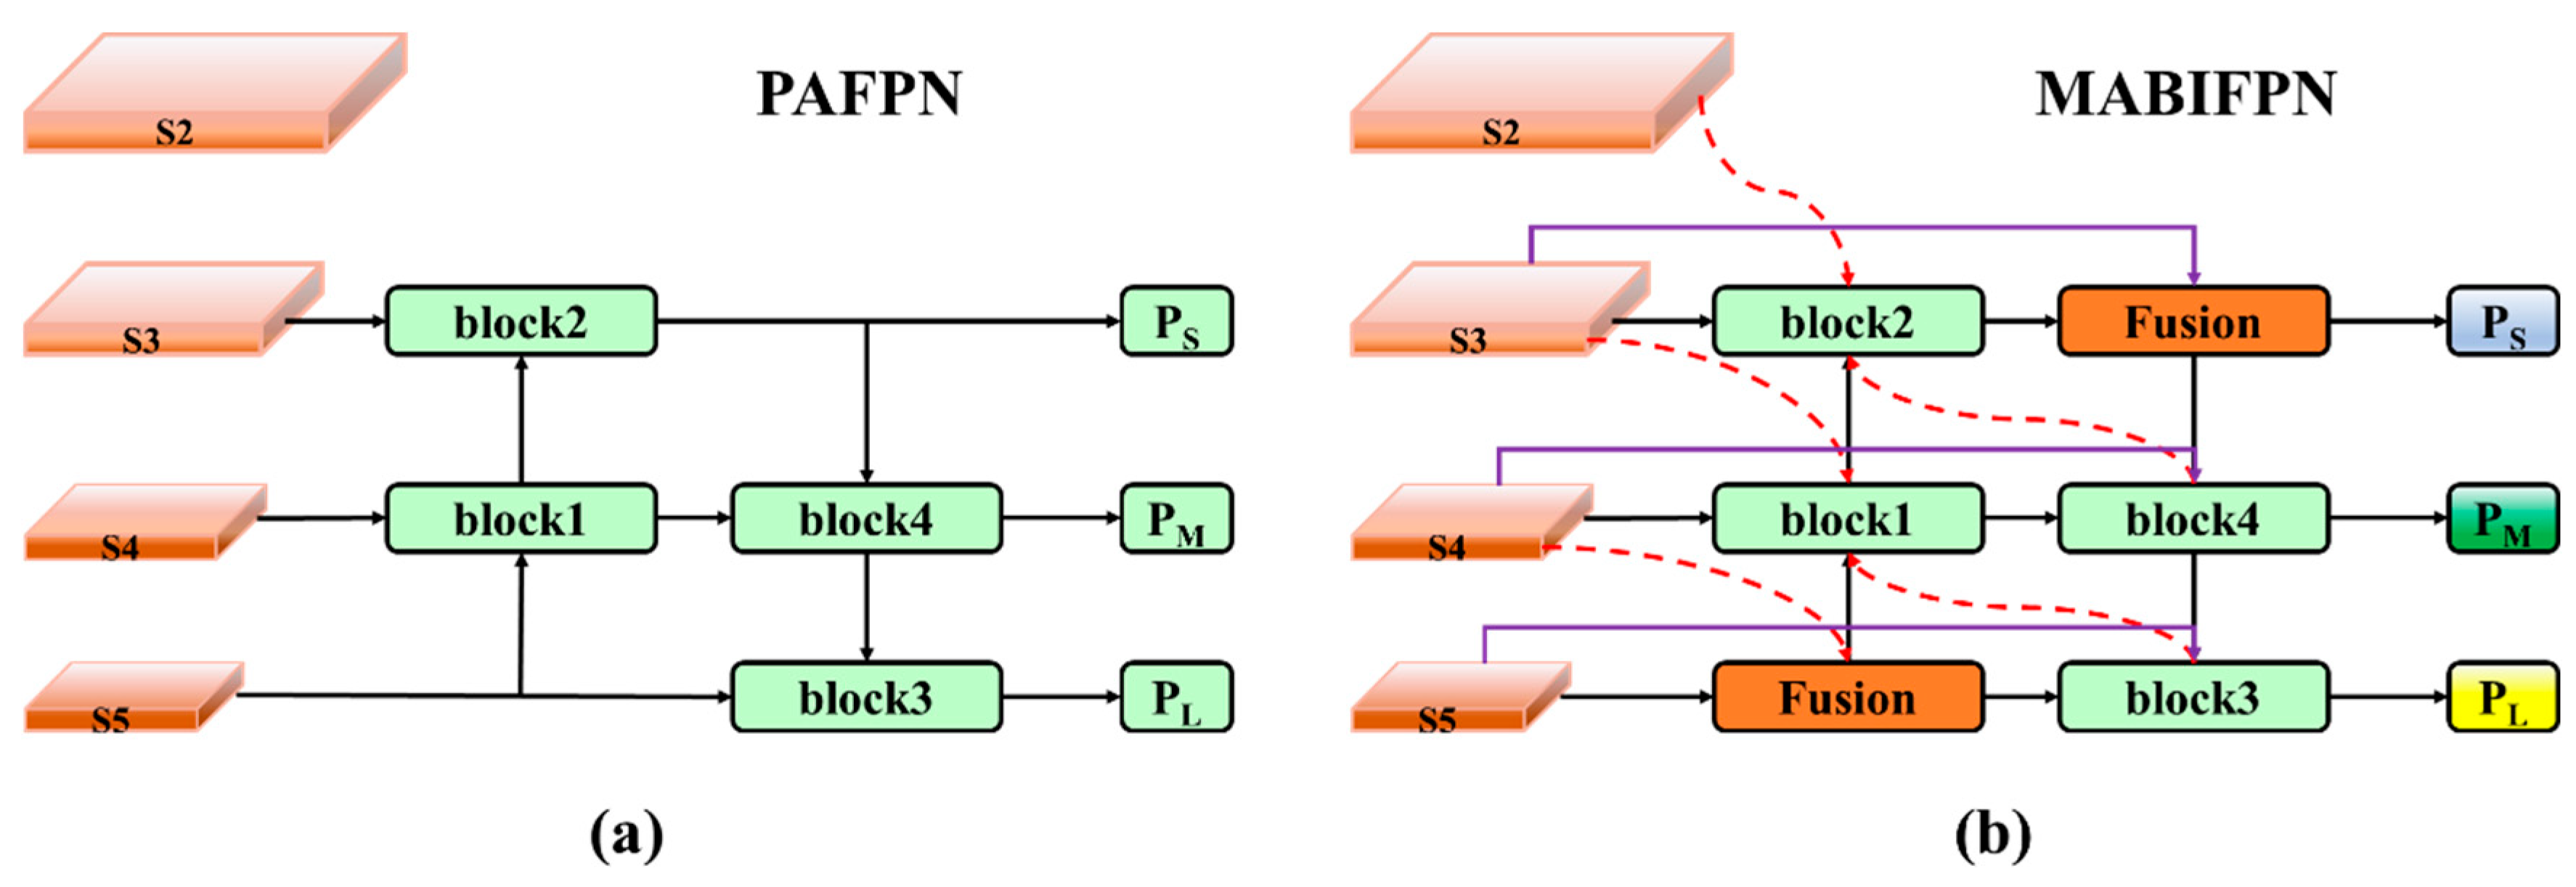
Inspired by reference [29], the design logic of the MABIFPN feature fusion network proposed in this study is rooted in the mechanistic optimization of the traditional FPN. As a classic architecture for processing multi-scale features in computer vision, the traditional FPN, as shown in Figure 5a, achieves the enhancement of the feature characterization ability at different levels by constructing bottom-up feature transfer modules (block1 and block2) and top-down feature enhancement modules (block3 and block4) of the path aggregation net, thus optimizing the comprehensive representation of multi-scale information in images. From the perspective of feature hierarchy, the multi-scale hierarchical architecture of FPN can systematically handle feature maps with different resolutions: low-level features usually contain fine-grained spatial details such as edges and textures, while high-level features are enriched with abstract semantic features such as target categories and global context, and the organic combination of the two provides multi-dimensional information support for subsequent visual tasks. However, the feature propagation path of traditional FPN is characterized by unidirectionality, and there is a lack of bi-directional interaction mechanism between cross-scale features, which leads to the failure of fully exploiting the complementary nature of features at different levels, and significantly restricts the feature expression ability in complex scenarios (e.g., drastic changes in the target scale and severe background interference), in which the outputs of the block1 in FPN are as follows:
b l o c k 1 = S 4 + U P ( S 5 )
In contrast, MABIFPN introduces a finer scale alignment mechanism in the feature fusion process. The up-sampling and down-sampling operations identified by the red dashed line in Figure 5b are essential to achieve up-sampling by interpolation to improve the spatial resolution of the feature map or down-sampling by pooling to reduce the dimensionality, so as to ensure that the features of different hierarchical levels are consistent in terms of the spatial dimension. Specifically, the network scales the feature maps of S2, S3, and S4 levels and the output features of block3 and block4, and then implements multidimensional fusion with the feature information of block1 and block2, which not only guarantees the spatial consistency of the cross-scale features, but also realizes the deep integration of the fine-grained details of the image and the abstract semantic information through the hierarchical progression of information transfer. The output of feature fusion in Block1 is as follows:
b l o c k 1 = f u s i o n ( D o w n ( S 3 ) , S 4 , U p ( f u s i o n ( S 4 , S 5 ) ) , U p ( b l o c k 3 ) )
Specifically, the fusion function performs fusion through weighted summation. More precisely, it employs a trainable weight vector (fusion_weight) to weight features at different scales. The fusion process is illustrated in pseudocode as shown in Algorithm 3:
Algorithm 3. Pseudocode flow of the fusion
Input: x = [x1, x2, …, xk] # List of input feature maps, where k is the number of input feature maps
Output: out # The fused feature map
1: Initialize: fusion_weight: learnable weights for each input feature map, initialized to ones
2: Apply ReLU activation to fusion weights:
3: Normalize fusion weights:
4: Normalize weights so that their sum equals 1
5: for i in range(len(x)):
6: Multiply each input feature map by its corresponding weight
7: Sum the weighted feature maps to obtain the fused output using Equation (16)
8: end
  • Weight Learning
The model learns the weights for each feature map through training. Let these weights be denoted as w 1 , w 2 , w 3 , , w n , which are passed through a ReLU activation function and subsequently normalized. The normalized weights w 1 , w 2 , w 3 , , w n satisfy
w i = ReLU ( w i ) i = 1 N ReLU ( w i )
where w 1 represents the normalized weight, ensuring that the sum of all weights equals 1.
2.
Weight Fusion
Subsequently, the feature maps w 1 , w 2 , w 3 , , w n are fused through weighted summation, specifically when
x f u s i o n = i = 1 N w i x i
where x f u s i o n denotes the fused output feature map, representing the result of weighted summation across features at different scales.
Through the bidirectional feature fusion mechanism characterized by the purple line in Figure 5b, MABIFPN constructs two paths to form a closed-loop feature interaction link, including a semantic guidance path from the high level to the low level and a detail enhancement path from the low level to the high level, which effectively overcomes the problem of feature information attenuation and loss caused by unidirectional propagation in the traditional FPN. MABIFPN adopts lightweight depth-separable convolution as the feature conversion unit, together with the adaptive weighted fusion strategy that dynamically assigns weights based on feature importance, which significantly improves the network’s ability to capture key features and overall expression performance while controlling the computational complexity and parameter scale.
Ultimately, through the weighted fusion of features at different levels, MABIFPN is able to generate comprehensive feature representations with both fine-grained spatial details and high-level semantic information, which provides richer feature support for downstream tasks such as target detection and thus effectively improves the accuracy of target recognition and the robustness of the model in complex environments.

3.3. Decoder

The PLD-DETR decoder prediction header is based on the RT-DETR architecture and aims to generate the final prediction results for object detection by interacting the query vectors with the contextual features output by the encoder. In this model, the decoder employs a multi-layer self-attention mechanism with a cross-attention mechanism to step-by-step process the input feature representations, capture the global contextual information, and combine it with progressively updated query vectors to refine the target detection. At each layer of the decoding process, each query vector interacts with the encoder’s features to enhance the contextual dependency of the features through the self-attention mechanism. The decoder outputs include the probability distribution of the target category corresponding to each query vector and the positional regression results of the target bounding box. The decoder design enables the model to adapt to different image contents by flexibly and dynamically adjusting the query vectors, and achieves efficient target detection during the end-to-end training process.

4. Experiment

4.1. Datasets

CPLID represents the primary public dataset for research on transmission line inspection. However, CPLID exhibits several limitations for practical applications. Most images have undergone data augmentation through flipping, cropping, and other preprocessing techniques. Additionally, the dataset contains only one insulator class as the detection object, which significantly differs from real-world aerial inspection scenarios. To address these limitations, this paper enhances the data of CPLID by incorporating additional categories of defects on its basis to produce the CDTLD. The UAV aerial images of 110 kV overhead transmission lines in a province of China were collected to produce the RSTLD. Data collection was conducted using a DJI Matrice 350 RTK UAV equipped with a DJI Zenmuse H20 camera payload (Shenzhen Dajiang Innovation Technology Co., Ltd., Shenzhen, China). The Matrice 350 RTK platform provides compatibility with various third-party imaging systems for aerial data acquisition.

4.1.1. CDTLD

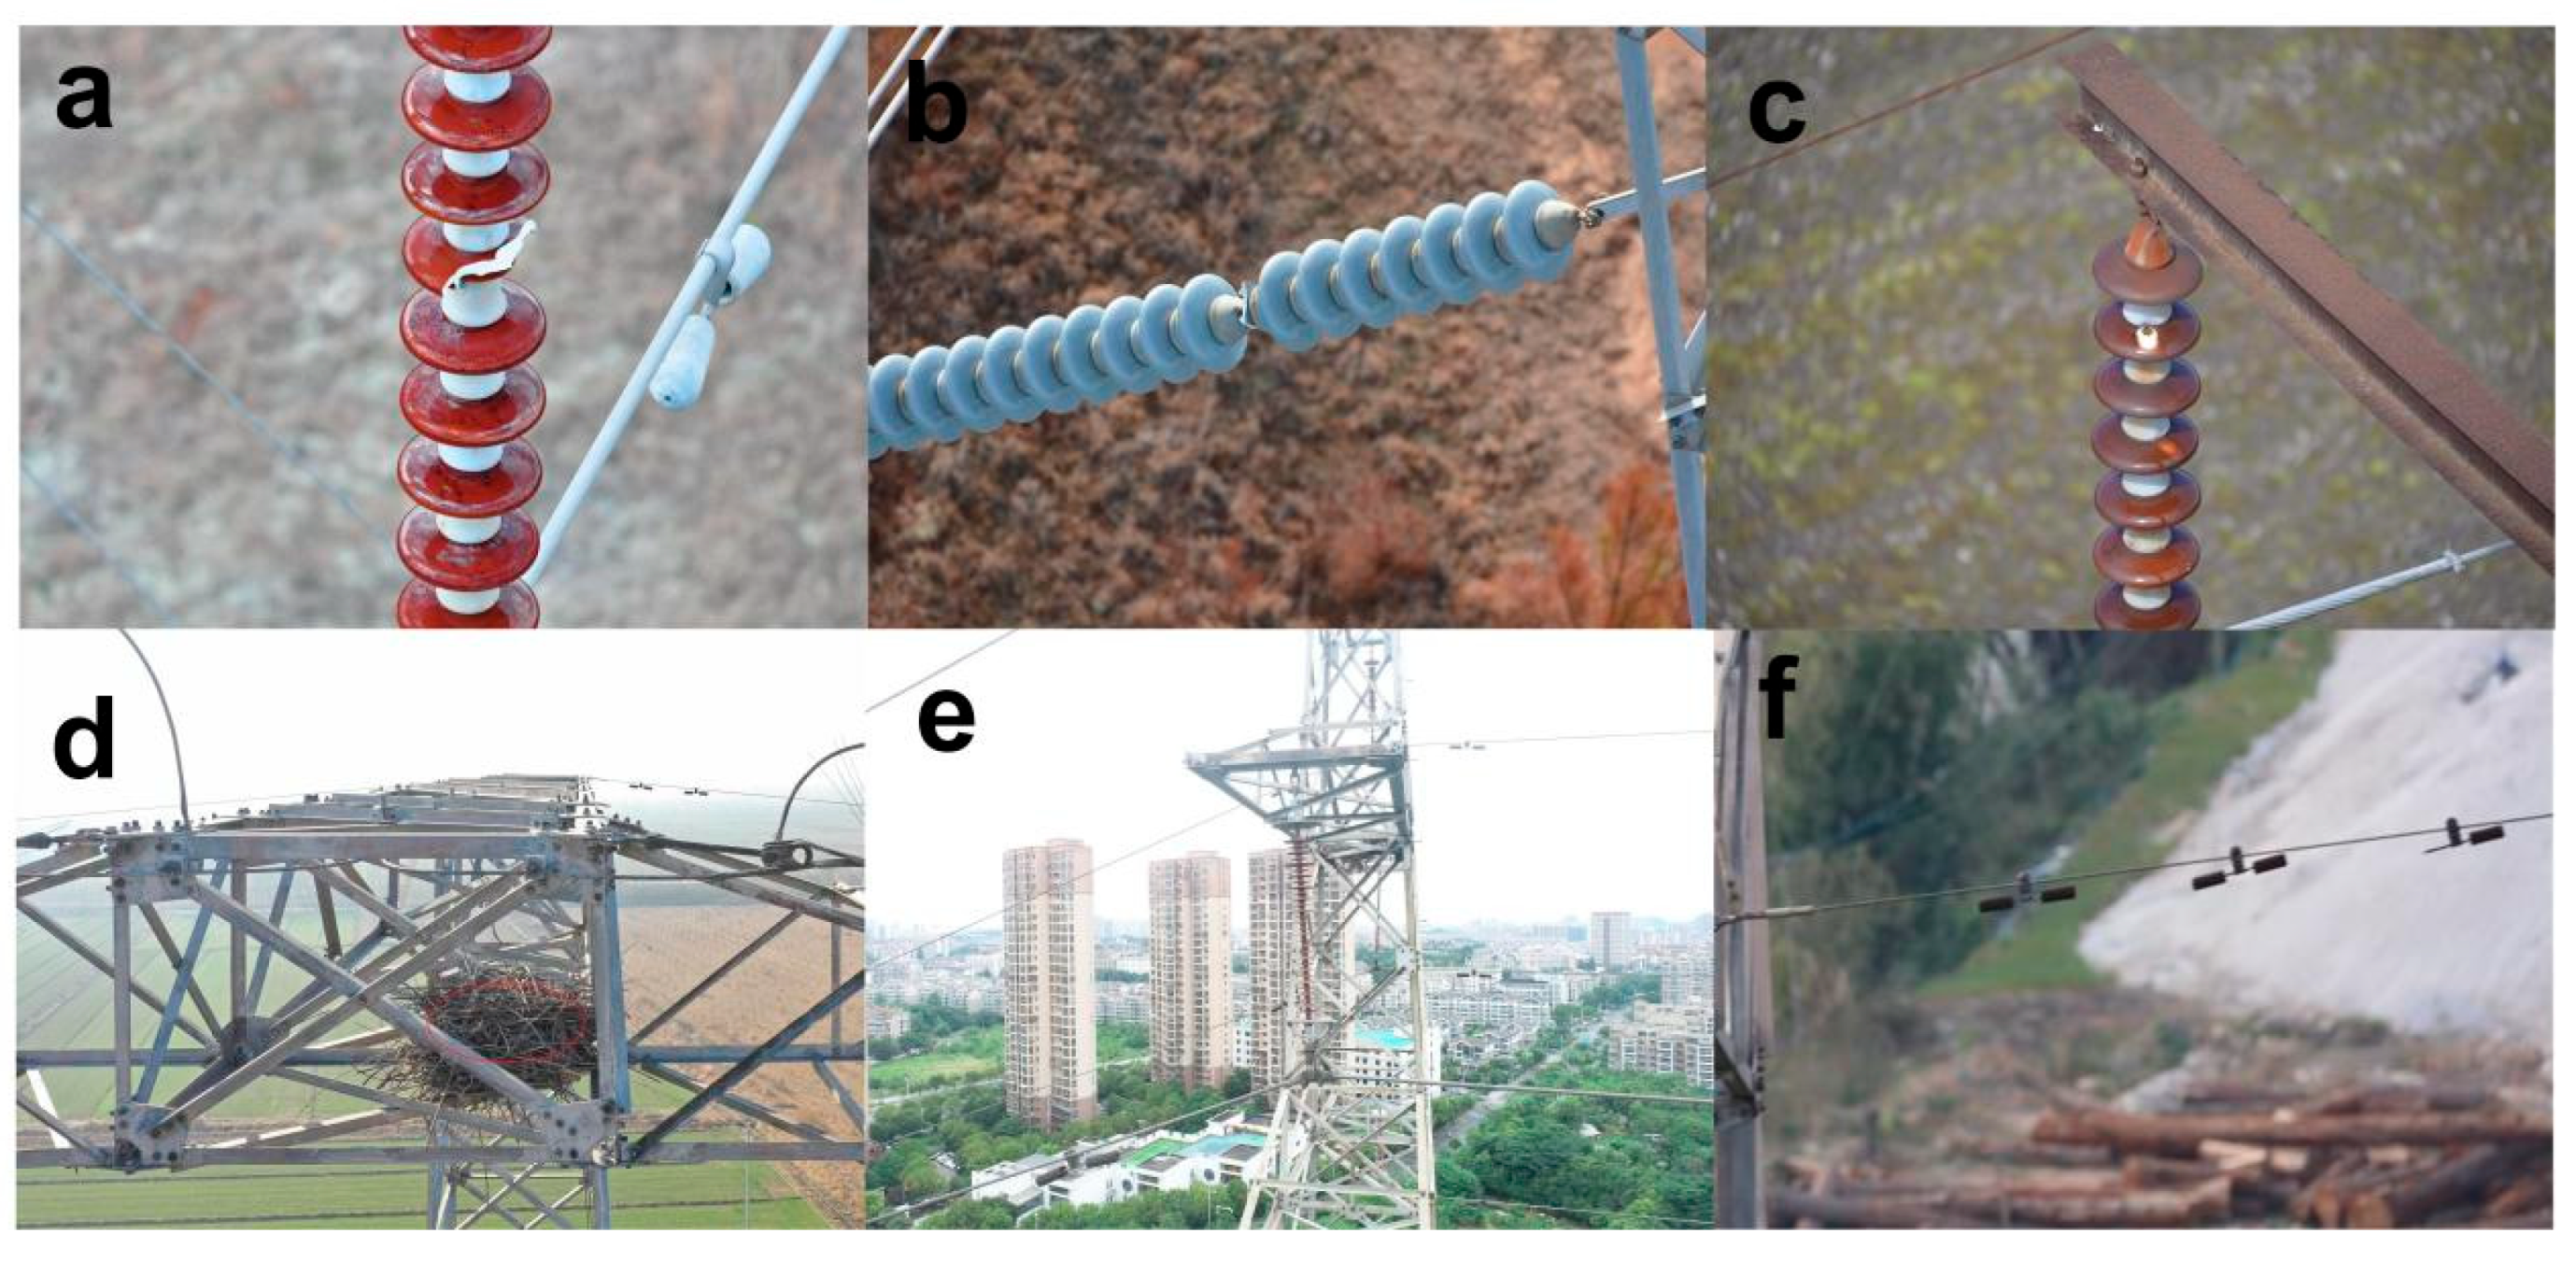
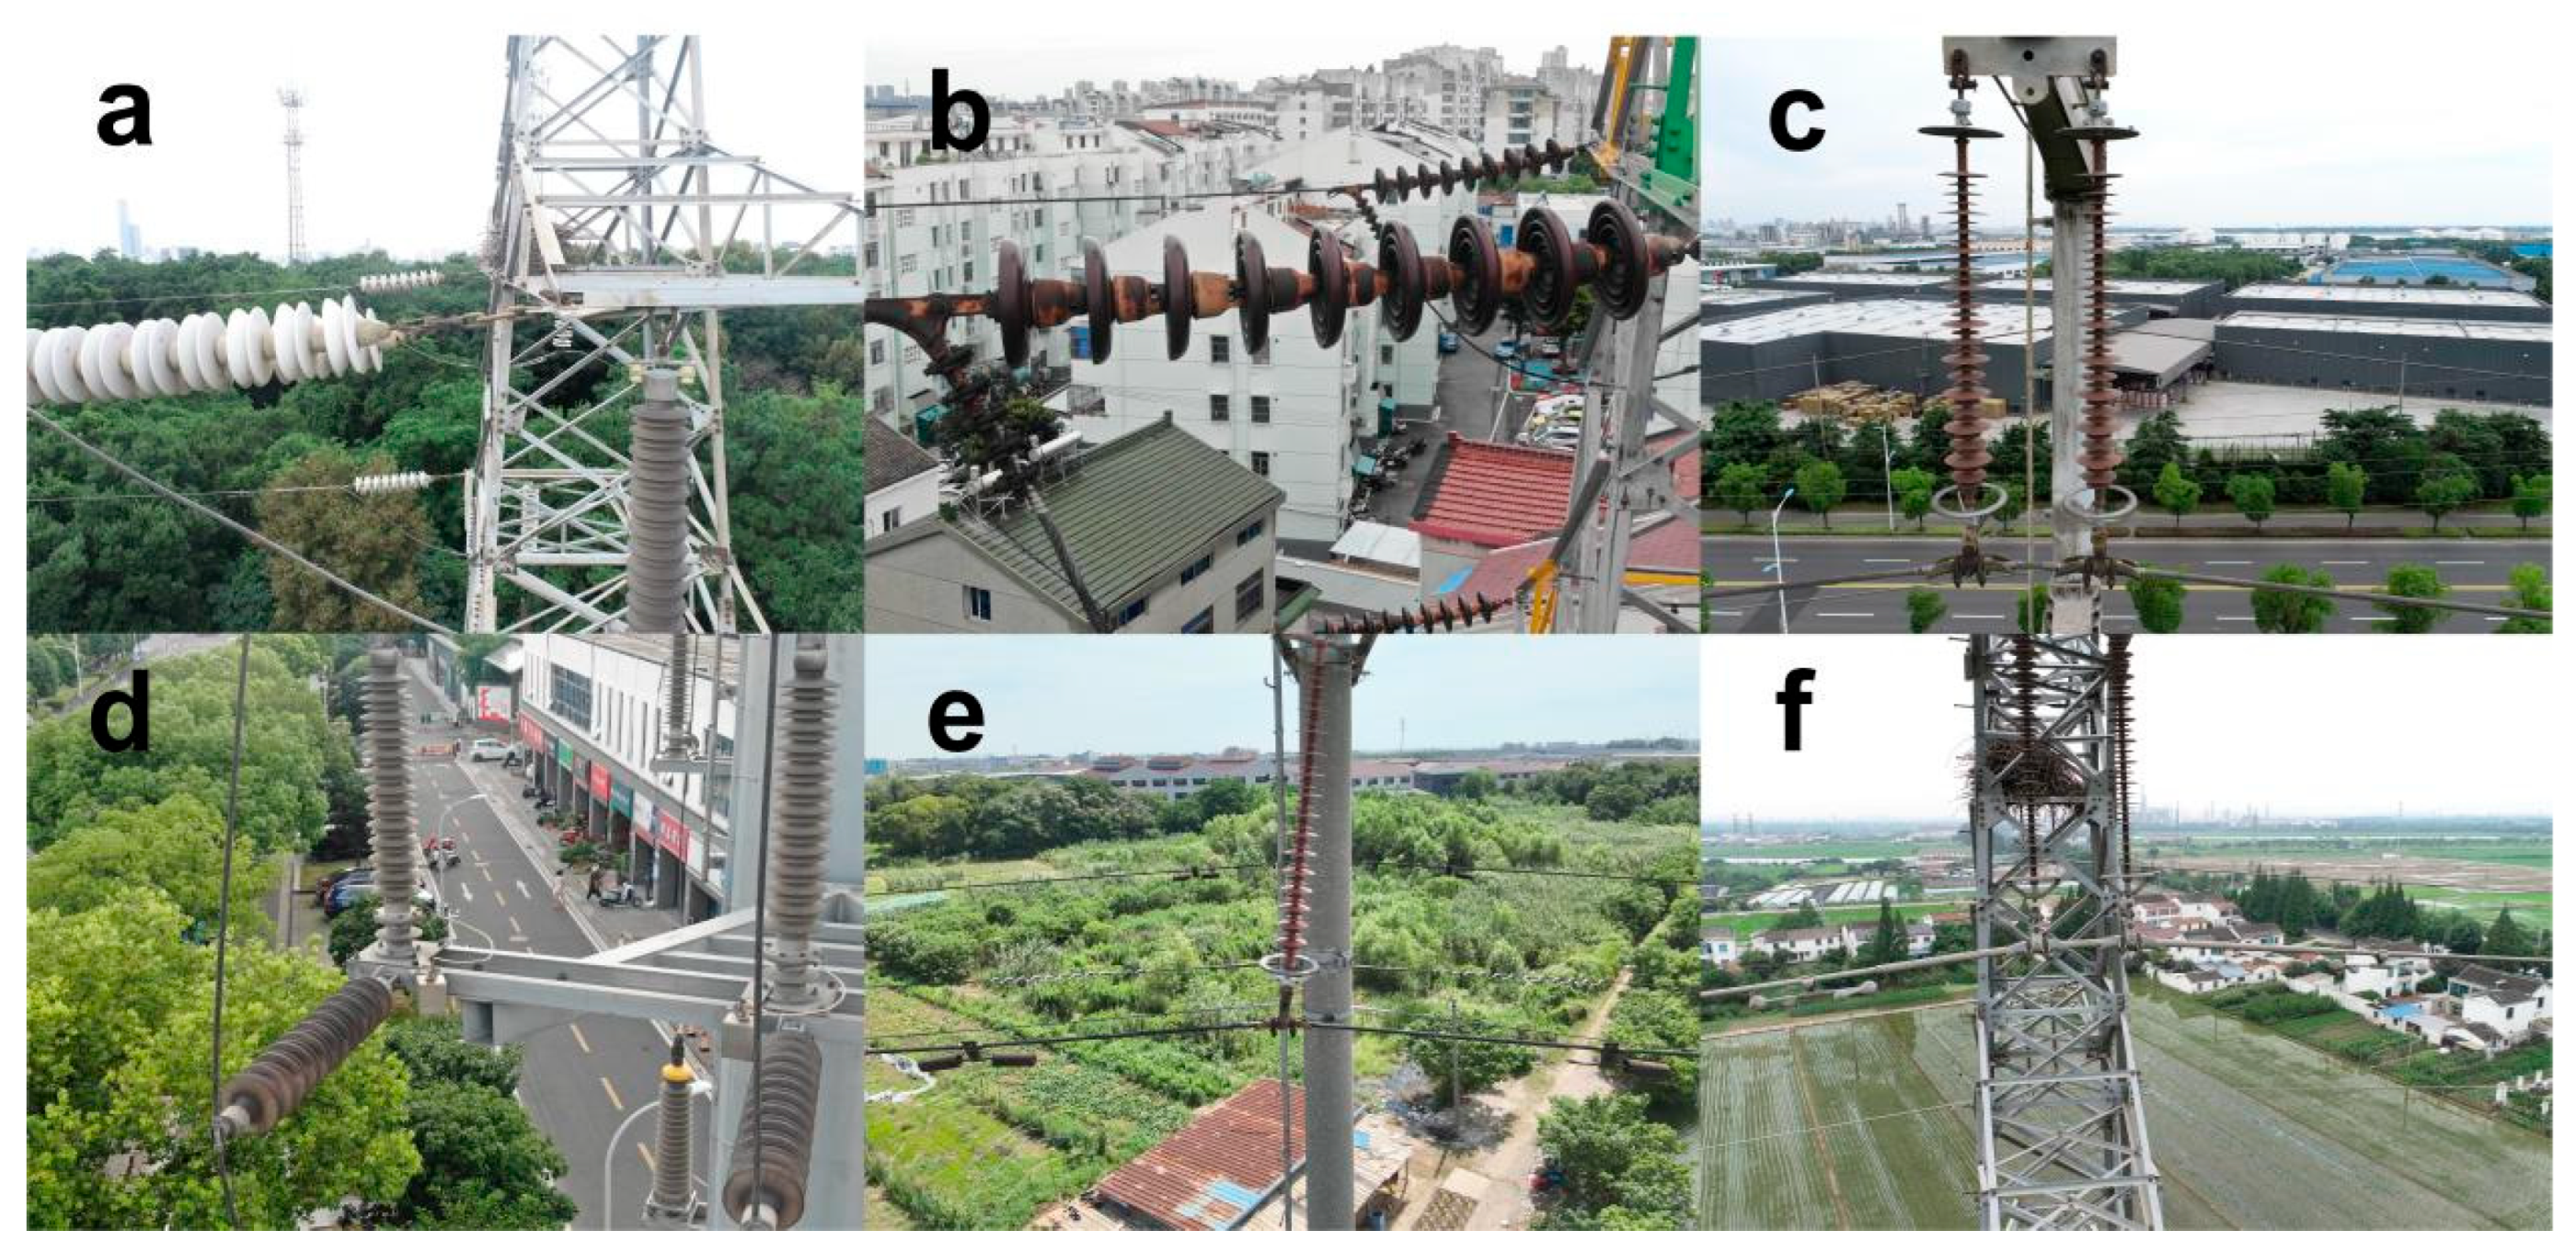
The CDTLD extends the original CPLID by incorporating additional common transmission line defects, including dropped insulator string, insulator breakage, insulator flashover, bird nests, and vibration damper defects. The enhanced dataset comprises seven categories of objects: normal insulators (9365 cases), flashover defect insulators (2391 cases), damaged insulators (1045 cases), dropped string insulators (893 cases), normal dampers (2469 cases), damaged dampers (2431 cases), and bird nests (478 cases). The dataset is split into a training set and a test set at a ratio of 8:2. Data augmentation techniques contain a sufficient number of defective samples and address class imbalance and long-tail distribution issues while ensuring sufficient defective samples for robust training. Figure 6 illustrates the CDTLD composition and distribution.

4.1.2. RSTLD

The dataset comprises 2180 high-resolution images (4864 × 3648 pixels) acquired through UAV aerial photography of 110 kV overhead transmission lines in China. The dataset comprises seven categories of objects: normal insulators (3968 cases), normal composite insulators (2500 cases) [30], flashover defect insulators (42 cases), powdering composite insulators (61 cases), dampers (2049 cases), damaged dampers (18 cases), and bird nests (292 cases). This composition effectively simulates the complex background interference and multi-scale target coexistence characteristics encountered in real-world scenarios. The training set, validation set, and test set are divided according to a ratio of 7:2:1. As real-world UAV inspection imagery is used, this dataset provides a reliable benchmark for evaluating algorithm performance in practical applications. Figure 7 illustrates the RSTLD composition and distribution.

4.2. Experimental Setup

A linear warm-up strategy was used to optimize the learning rate, which ended up with 0.0002. In addition, the loss function was optimized using the AdamW optimizer with a weight decay of 0.0001 over 200 epochs. All the experiments were implemented in PyTorch and carried out on an RTX4090 GPU (NVIDIA, Taiwan). Table 1 illustrates the experimental setting.

4.3. Evaluation Indicators

To evaluate the performance of the model in terms of accuracy and efficiency, this paper employs accuracy performance indicators and computational effectiveness indicators. The accuracy indicators include precision (P), recall (R), and average precision (AP). The computational efficacy indicators include Floating Point Operations (FLOPs) and model parameters. The formulas for these indicators are as follows:
P = T P T P + F P
R = T P T P + F N
AP = 0 1 P ( R ) d R
m A P = i = 0 i = n A P n
where TP, FP, and FN represent true positives, false positives, and false negatives, respectively. P represents the proportion of true positives among predicted positive cases. R represents the proportion of correctly predicted positive cases among all actual positive cases. AP is calculated as the area under the precision-recall curve, while mAP is the mean of AP values across all classes. AP50 represents the mAP at an Intersection over Union (IoU) threshold of 0.50, AP75 represents the mAP at an IoU threshold of 0.75, and AP50–95 is the average precision across IoU thresholds ranging from 0.50 to 0.95 in increments of 0.05. FLOPs refer to the number of Floating Point Operations required per forward pass, indicating the model complexity. Parameter refers to the total number of parameters of the network.

4.4. Result

The experiments are conducted on collected CPLIDs and RSTLDs. To validate the effectiveness of the PLD-DETR in the common defects detection of transmission lines, we compared the performance of PLD-DETR with representative two-stage models, one-stage models, and Transformer-based models, including Faster RCNN, Cascade RCNN, Libra RCNN, FCOS, YOLOv8-v11, Conditional-DETR, Dab-DETR, and RT-DETR. Due to the different architectures of different target detection algorithms, some algorithms may not achieve optimal results when using a uniform set of hyperparameters. Therefore, the default parameters preset in the MMDetection framework, which represent well-tuned, community-optimized configurations for each specific architecture, were used to train various networks until all networks converged completely, which meant that the detection accuracy could not improve further, as shown in Table 2. The hyperparameter settings (e.g., optimizer and learning rate) for the different object detection algorithms are described in detail in Table 2, where SGD denotes stochastic gradient descent and AdamW denotes adaptive moment estimation weight decay regulation. This architecture-specific training strategy ensures that each baseline method achieves its optimal performance, providing a fair and rigorous evaluation of the proposed PLD-DETR.
Table 3 and Table 4 present the performance of each detection algorithm on the two datasets, respectively. Due to varying model sizes across different object detection algorithms, larger models typically contain more parameters, which may perform better in terms of accuracy, while incurring higher computational costs as well. To ensure that the performance of each model can be fairly evaluated, similar versions of target detection algorithms with similar parameter counts were selected for comparison. The experiments demonstrate that PLD-DETR achieves the highest in terms of AP50, AP75, and AP50–95 values, while maintaining competitive computational efficiency with the second-lowest parameter count (only 2.1 M parameters higher than YOLOv10b) and second-lowest FLOPs (only 2.4 higher than RT-DETR). Additionally, we conducted two separate independent experiments, during which the AP value error typically fluctuated within the normal range of the 10−3 order of magnitude. This did not affect the overall performance results. These results indicate that the proposed algorithm effectively balances accuracy and computational complexity.
The proposed PLD-DETR demonstrates superior accuracy compared to the YOLO-series models. Although the DETR series models achieve higher values in AP50, they obtain lower values in AP50–95. This result indicates that these DETR-based models detect more defects but with reduced localization precision. Specifically, detected defects are considered to be successfully predicted at an IoU threshold of 50, but fail at a higher IoU threshold. The superior performance of the YOLO-series models in AP50–95 suggests a better balance between defect detection and localization accuracy. Compared to RT-DETR, PLD-DETR requires only 1.3 M additional parameters and 2.4 GFLOPs more computational cost, while achieving improvements of 2.4%, 5.0%, and 3.5% in AP50, AP75, and AP50–95, respectively.
Experimental results based on both CDTLDs and RSTLDs demonstrate that the proposed PLD-DETR algorithm achieves a superior object detection performance breakthrough in target detection accuracy. On the CDTLD dataset, the algorithm achieves optimal performance in all evaluation indicators: AP50 reaches 0.910, AP75 reaches 0.763, and AP50–95 reaches 0.662, which, respectively, improve 3.6% and 2.7% in AP75 and AP50–95 compared to the suboptimal algorithm Dab-DETR. On the RSTLD dataset, the advantage of PLD-DETR is even more significant. AP50, AP75, and AP50–95 reached 0.651, 0.422, and 0.401, respectively, and substantial gains of 10.2%, 17.2%, and 16.6% compared to YOLOv11, representing significant performance improvements of 4.5%, 3.9% and 3.6% compared to the suboptimal algorithm (RT-DETR), and substantial performance improvement of 10.2% 17.2% and 16.6% compared to the optimal YOLO-series algorithm (YOLOv11). These results demonstrate the effectiveness of the proposed multi-branch fusion mechanism and adaptive spatial semantic aggregation attention module for complex detection scenarios.
From the perspective of computational efficiency and model complexity, the PLD-DETR algorithm demonstrates superior parameter utilization efficiency and practical balance. This algorithm achieves optimal detection performance with only 21.123 M parameters and 59.4 GFLOPs. On the CDTLD dataset, PLD-DETR achieves parameter reductions of 49.3% compared to the best-performing RCNN-series model Libra RCNN (41.637 M), 16.5% compared to the best-performing YOLO-series model YOLOv11 (25.285 M), and 51.6% compared to the best-performing DETR-series model Dab-DETR (43.703 M). Additionally, the computational complexity is significantly lower than that of most of the high-precision detection algorithms, reflecting the efficiency of the proposed object detection model. Furthermore, the algorithm achieves consistent optimal performance on two datasets with distinct characteristics, indicating that the multi-scale feature fusion strategy of MABIFPN and the attention mechanism of the ASSA module have strong generalization ability and robustness. This provides an effective solution for UAV-based object detection tasks requiring high accuracy, high efficiency, and strong adaptability.
To substantiate the computational efficiency of our proposed method, we conducted comprehensive runtime evaluations across both high-performance and resource-constrained platforms. The experimental results are summarized as follows.
High-Performance Platform: On an NVIDIA RTX 4090 GPU, our model achieves an inference speed of 190 frames per second (FPS) at an input resolution of 640 × 640 pixels with a batch size of 1, demonstrating exceptional computational efficiency on desktop-class hardware.
Embedded Platform: To validate the practical deployability of our lightweight architecture, we further deployed the model on the NVIDIA Jetson Orin Nano Super Developer Kit, a resource-constrained embedded platform representative of edge computing scenarios. The model achieves an inference latency of 42.5 ms (corresponding to 23.5 FPS) at a resolution of 384 × 384 pixels with a batch size of 1. This real-time performance on edge devices confirms the viability of our design for practical deployment in resource-limited environments.

4.5. Visualization Result

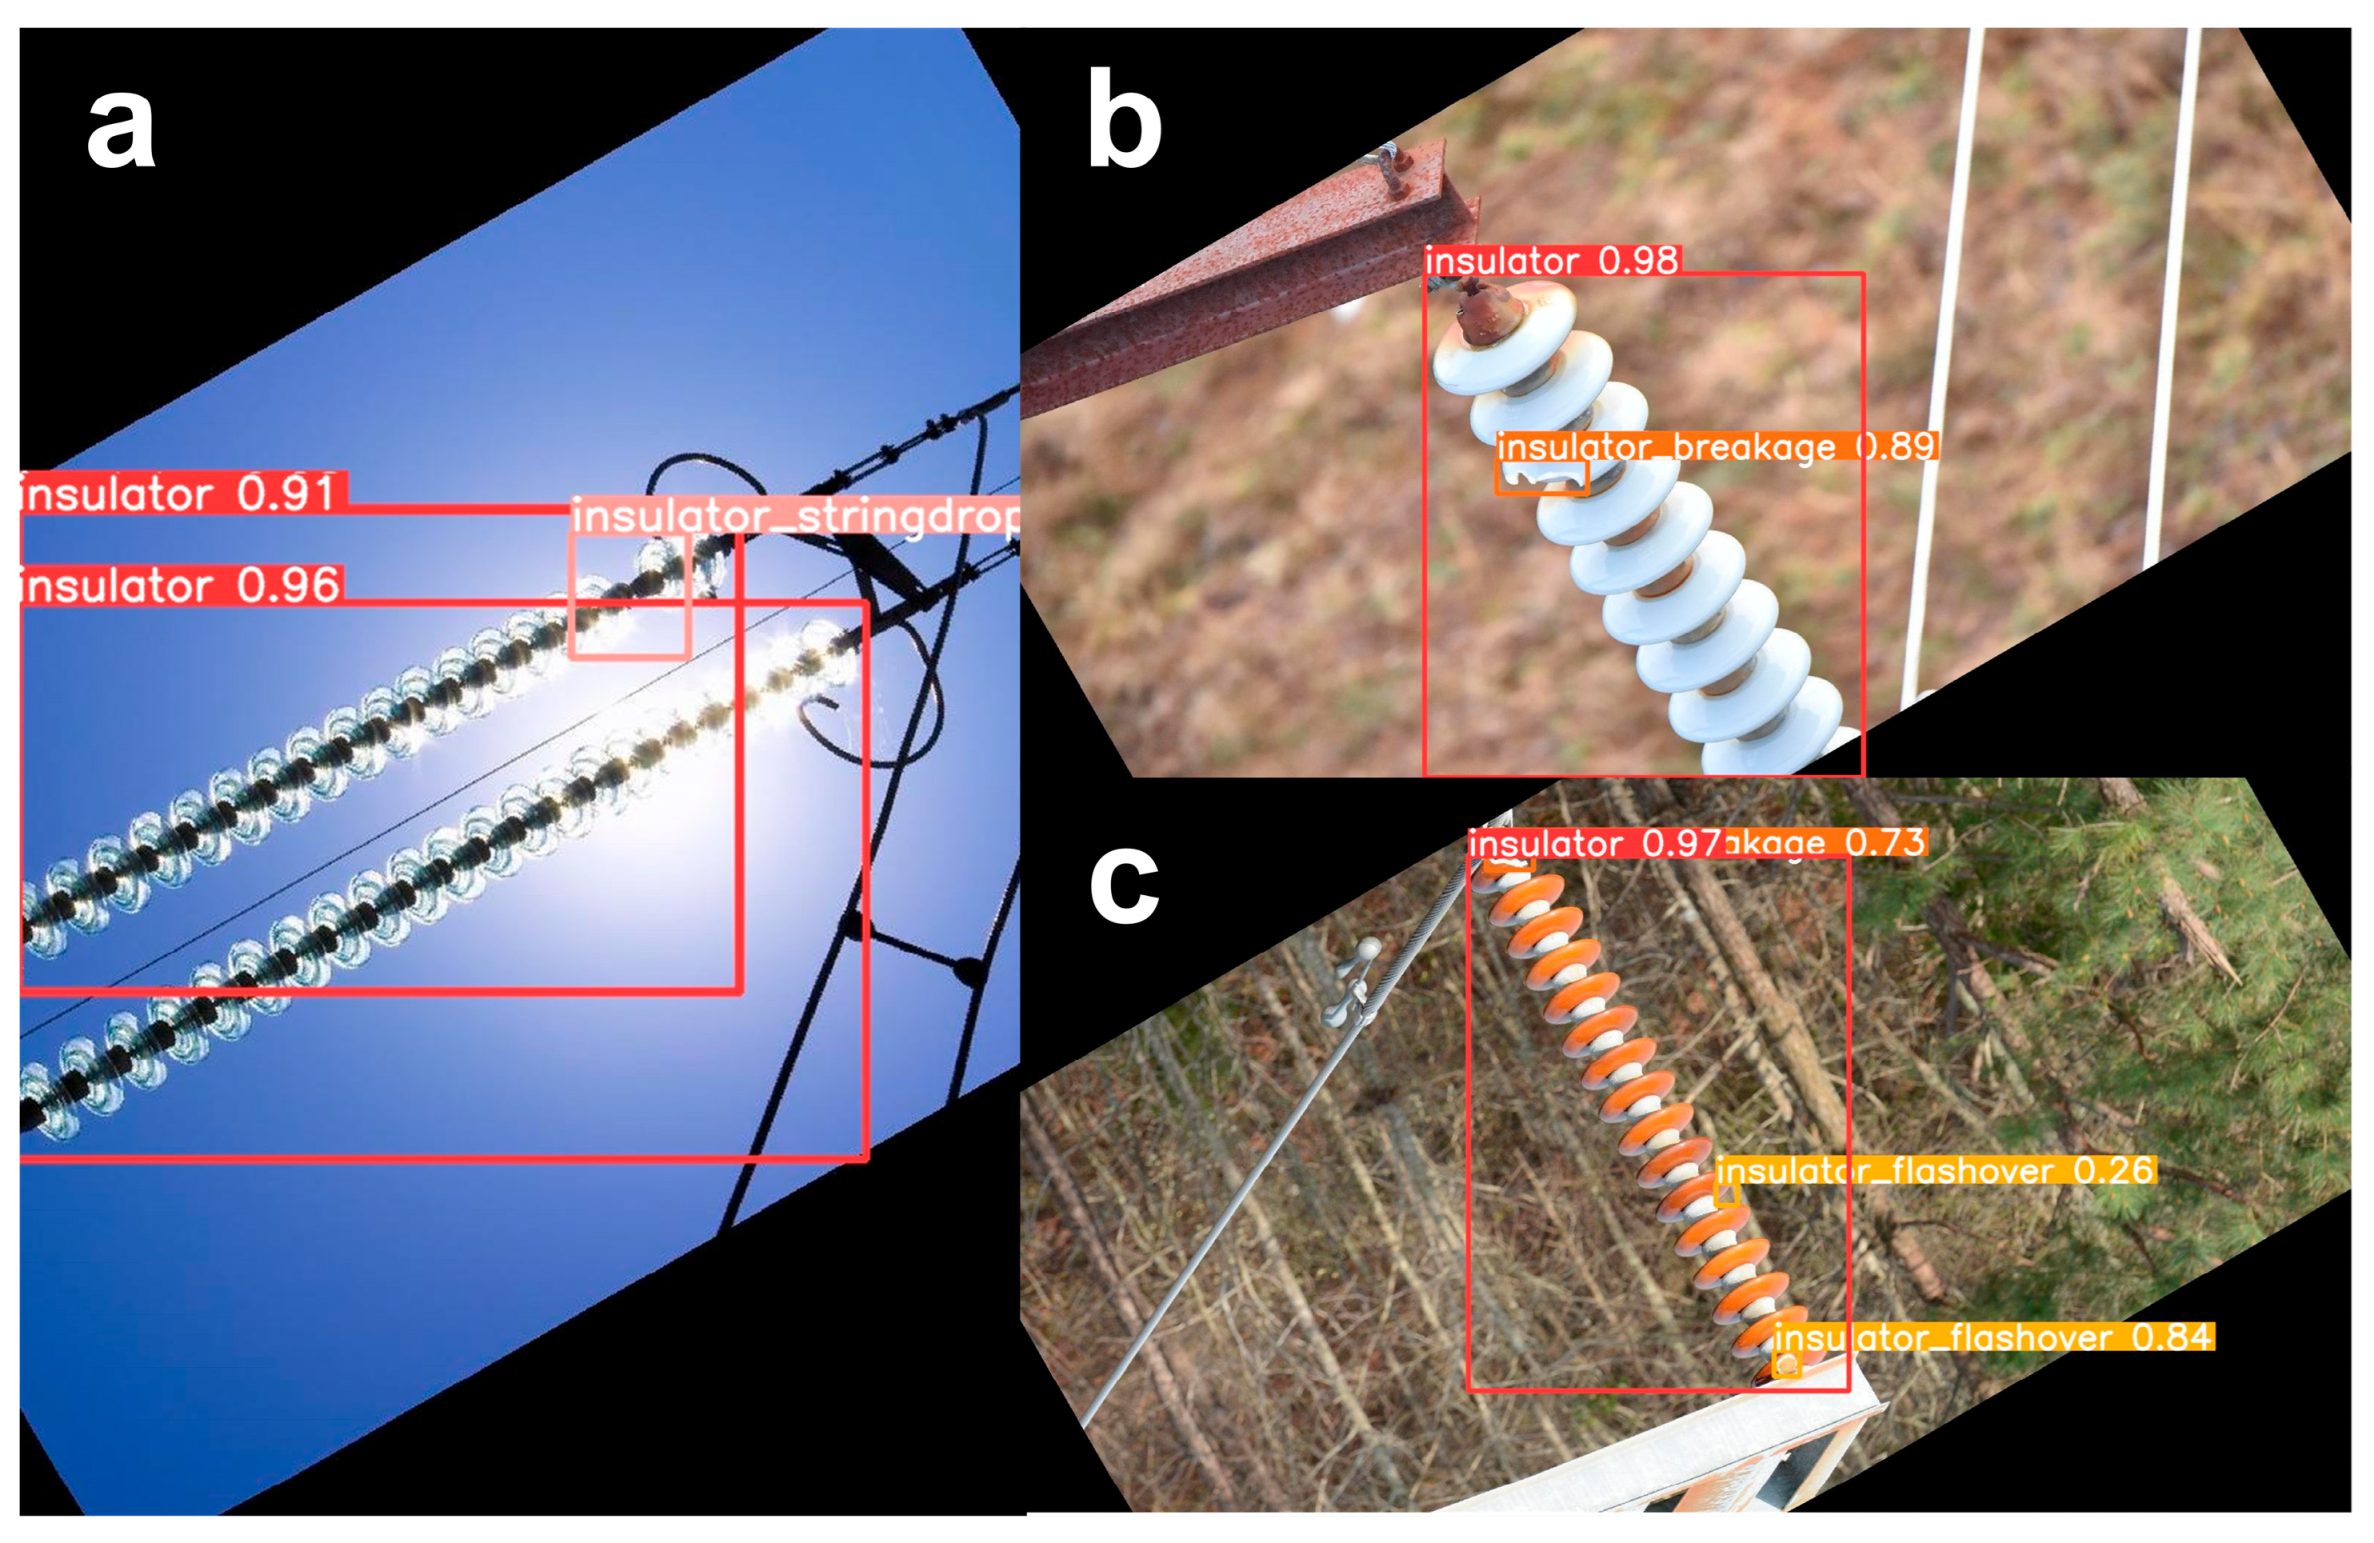
PLD-DETR has been able to avoid many errors and performs well in detecting small targets. Figure 8a,b show the effect of PLD-DETR in insulator defect detection, which shows that the network architecture can accurately detect insulator defects in the background of complex environments, such as bright light, electric field, etc., and, in particular, Figure 8c can accurately identify the traces of flashing that are difficult to notice by the naked eye.
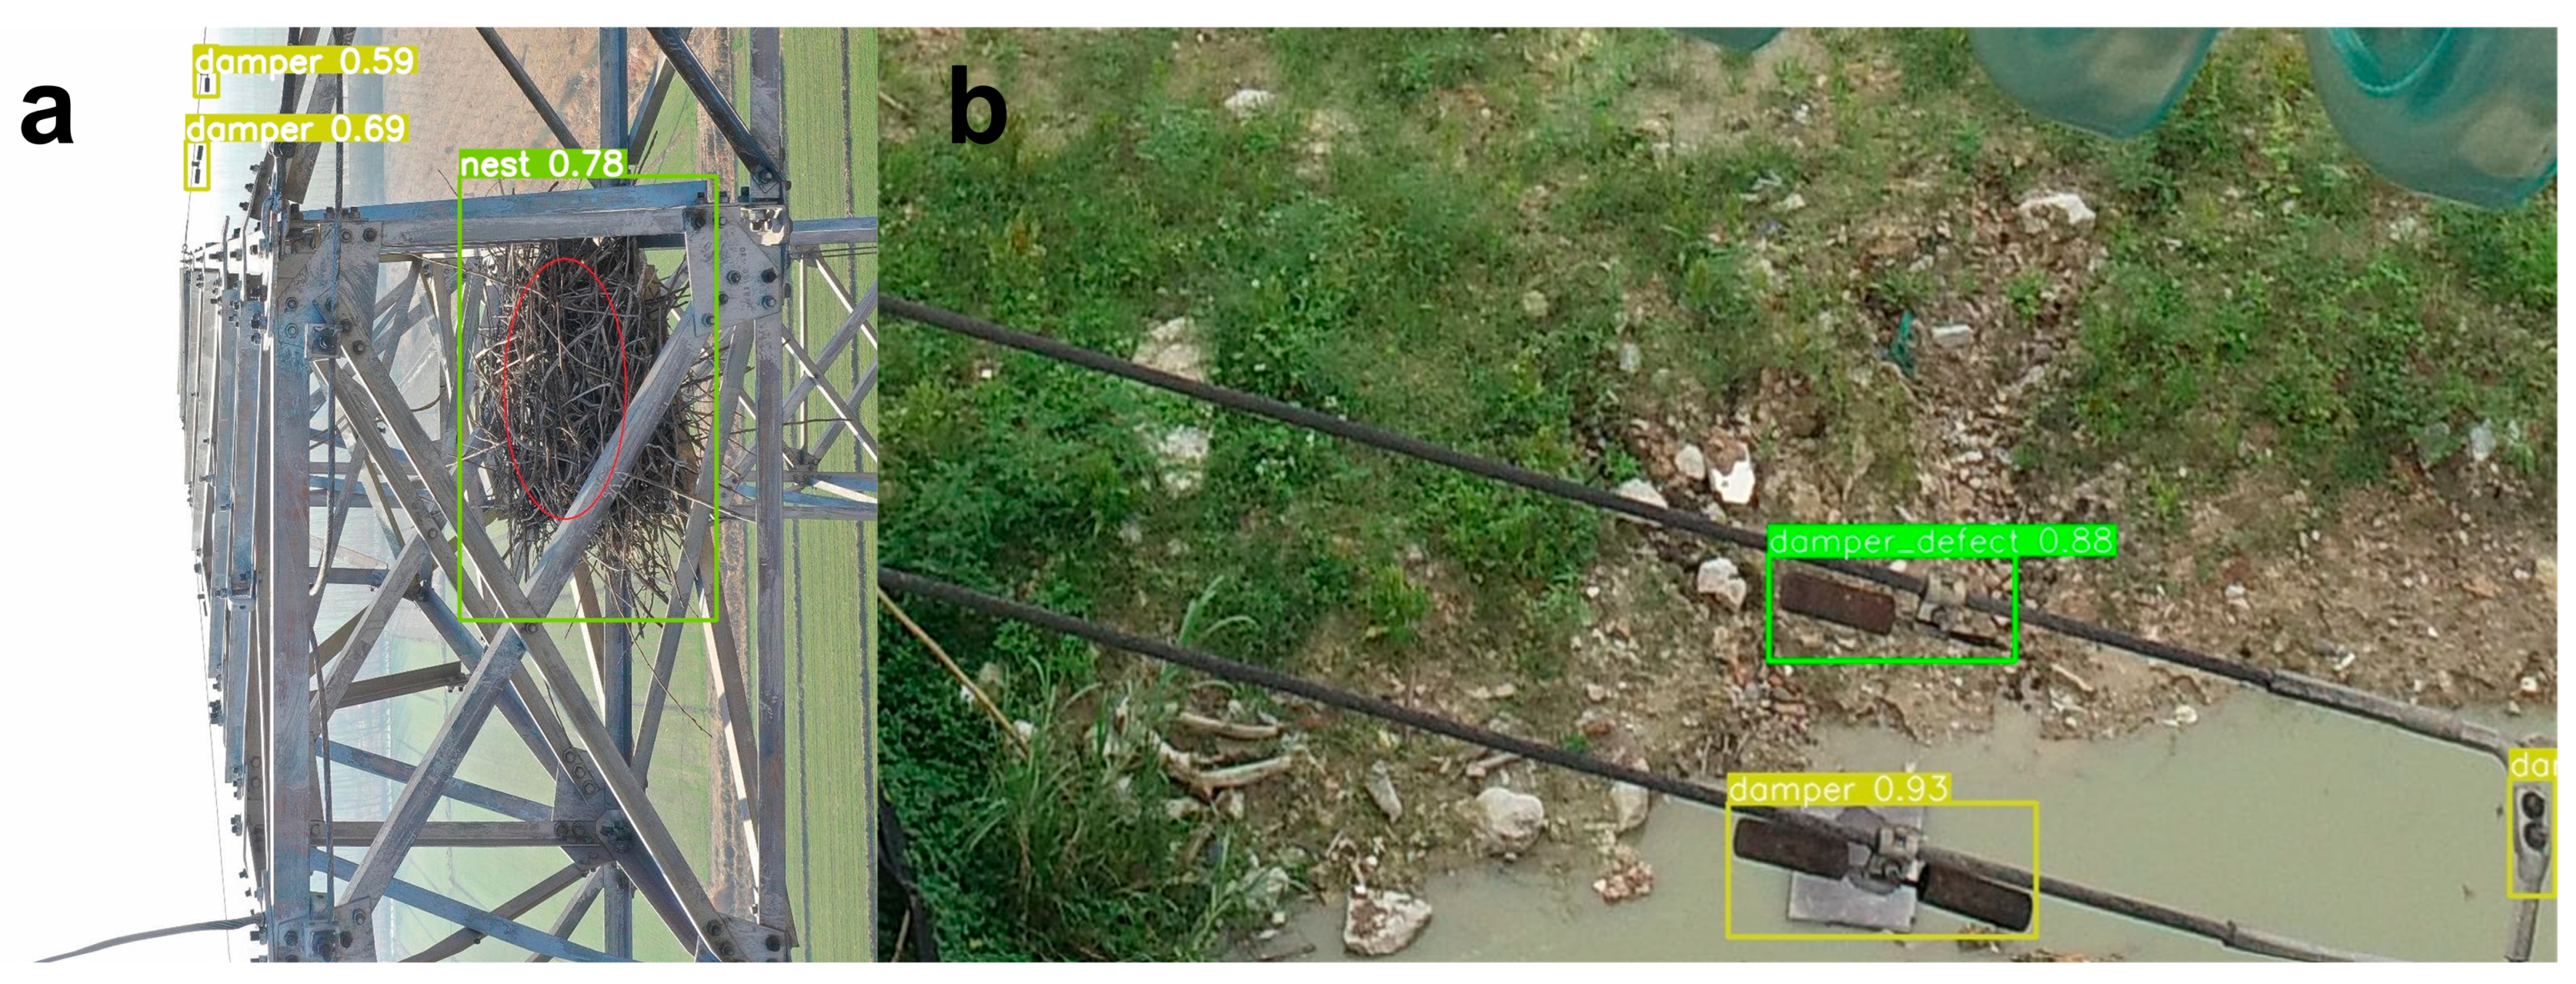
In terms of bird nest recognition and damper recognition, Figure 9 demonstrates the detection performance of the network. Figure 9a shows that the network can accurately identify not only the bird’s nest with a large size, but also the damper away from the bird’s nest, which demonstrates the accurate identification ability of features with different depths. Figure 9b shows the network architecture that accurately identifies the defects of the damper.
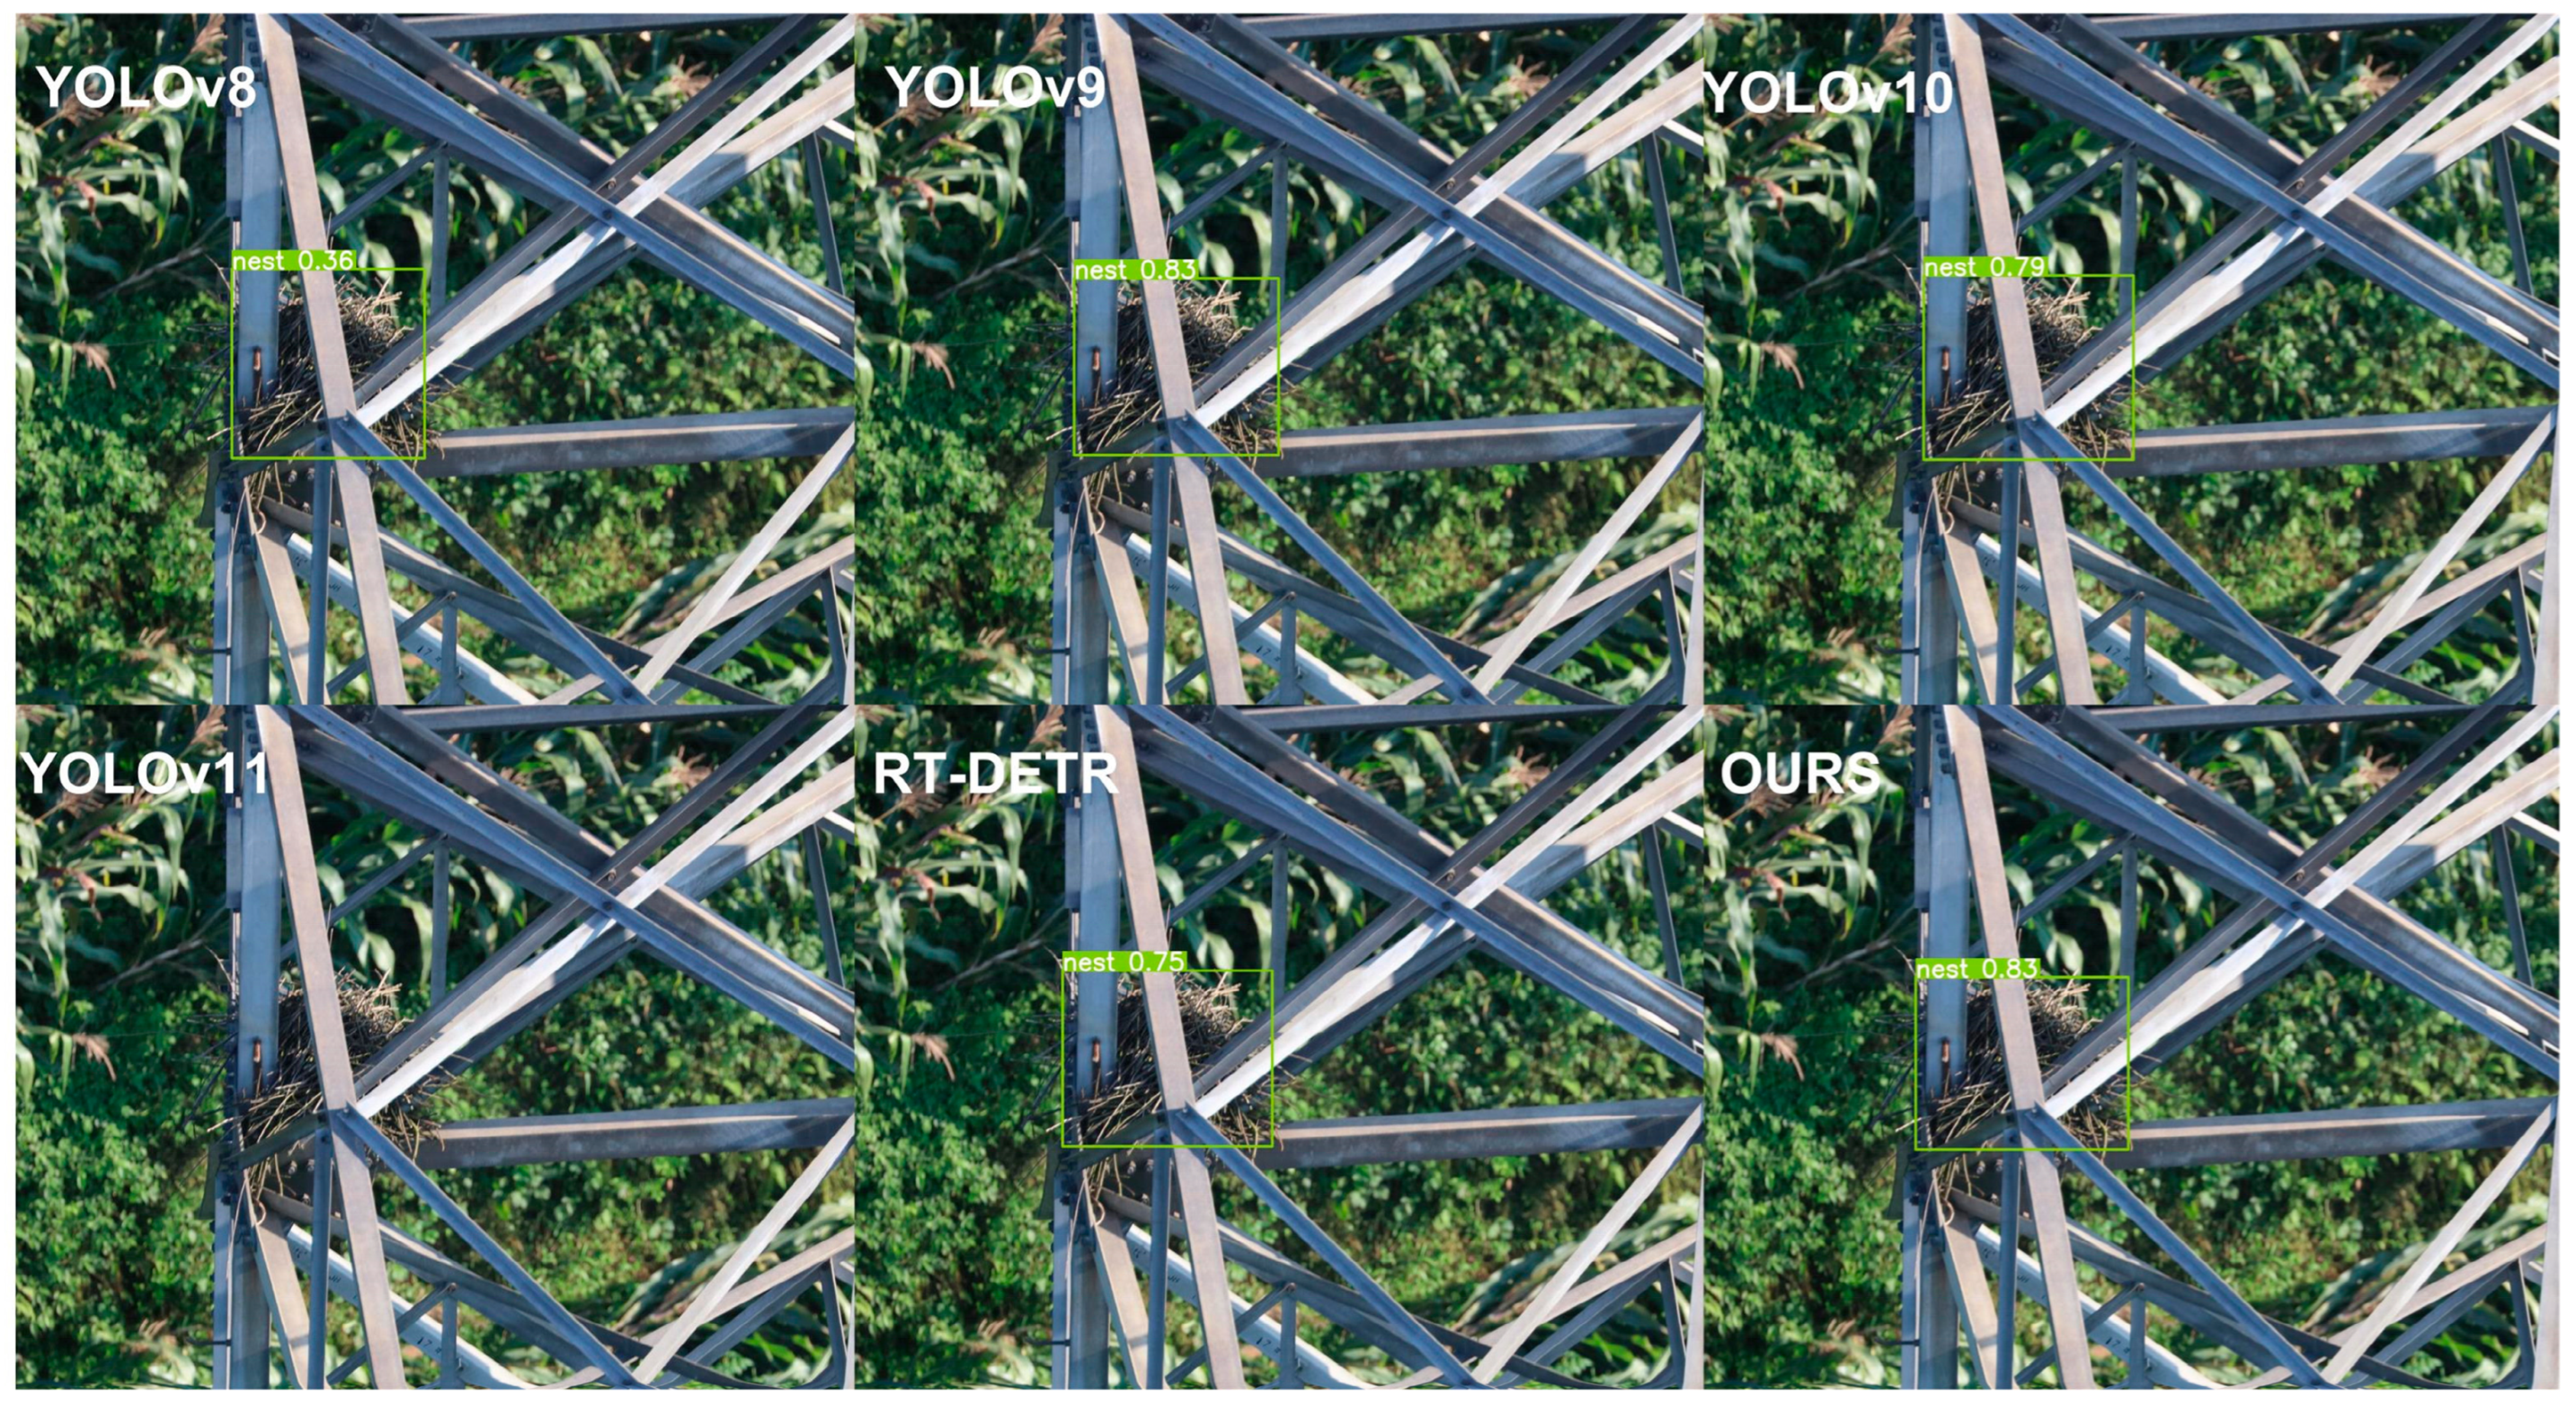
To provide an intuitive comparison of the algorithm performance, the YOLO-series algorithms with superior accuracy and RT-DETR were selected for visualization comparison with the proposed algorithm, PLD-DETR. As shown in Figure 10 and Figure 11, the proposed algorithm demonstrates a significant advantage over the YOLO-series algorithms and RT-DETR algorithm in detecting insulators and bird nests with reduced miss detection and false positives. Figure 10 presents a challenging scenario with low-light late-afternoon conditions and bird interference, where the insulators overlapping with the utility pole are difficult to detect. In this case, while YOLO-series algorithms can effectively detect the insulators parallel to the transmission lines and some utility pole-background cases, they fail to identify all insulator targets. RT-DETR exhibits high false positive rates in this complex background environment, which incorrectly identifies some non-target areas, such as birds and connectors, as insulator targets. At the same time, there are omissions in the detection of real insulator targets overlapping with utility pole, and the detection frame localization accuracy is insufficient. In contrast, the proposed PLD-DETR successfully detects all insulators without false detection, effectively suppresses the background interference, significantly reduces the false-positive detection rate, improves the target recall rate, and achieves more accurate bounding box localization.
Figure 11 presents that YOLO-series algorithms unstable detection performance: the YOLOv8 algorithm achieves low confidence (0.36), and the YOLOv11 algorithm fails to detect the bird’s nest entirely. Comparatively speaking, the proposed PLD-DETR algorithm attains the highest confidence of 0.83, representing an 8% improvement over RT-DETR. Although the confidence level is the same as that of YOLOv9, the proposed algorithm demonstrates superior bounding box localization accuracy in the complex background environment. Quantitative analysis of the experimental results confirms that the proposed algorithm in this paper maintains higher detection accuracy while exhibiting enhanced robustness and generalization capability across varying camera angles and lighting conditions.

4.6. Ablation Experiments

To demonstrate the effectiveness of each module used in this paper, a series of ablation experiments was conducted on the CDTLD, as shown in Table 5. The ablation experiments validate the effectiveness of the three proposed modules and their synergistic interactions. Based on the baseline model (AP50 = 0.886, AP75 = 0.713, and AP50–95 = 0.627), each module demonstrates distinct performance contributions. The MABIFPN module achieves the most significant performance enhancement when applied individually, improving AP50 by 1.9% to 0.905, AP75 by 4.1% to 0.754, and AP50–95 by 2.6% to 0.653, validating its feature representation enhancement. The DSM block module excels in high-precision detection tasks, achieving a 2.9% improvement in AP75 when used independently, demonstrating its feature representation enhancement capabilities. The ASSA module, although relatively limited in effect independently, produces significant synergies when combined with the other modules. When the three modules are fully integrated, the proposed algorithm reaches the optimal performance (AP50 = 0.91, AP75 = 0.763, and AP50–95 = 0.662), which improves by 2.4%, 5.0%, and 3.5%, respectively, compared with the baseline model. This result demonstrates the effectiveness of the multi-module synergistic design.
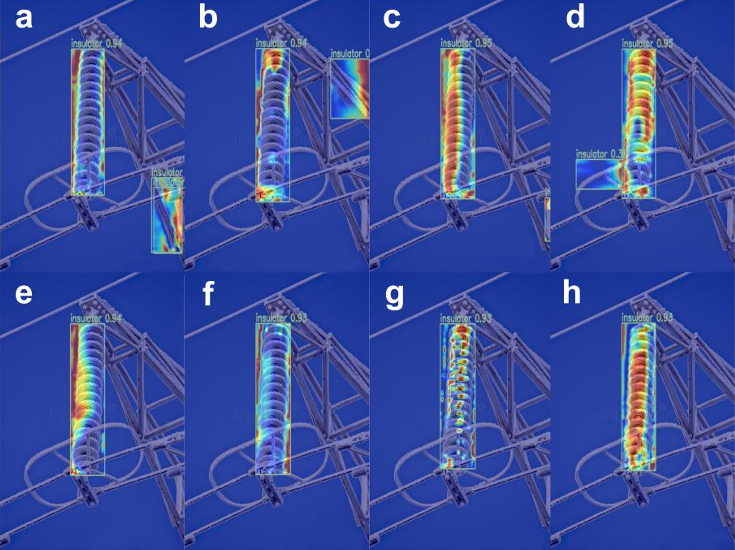
As shown in Figure 12, the heat map analysis of the insulator reveals that the original RT-DETR model exhibits dispersed attention with extensive coverage and significant false detections. Progressive integration of ASSAformer, MABIFPN, and DSM block modules demonstrates gradually concentrated attention on insulator targets, with MABIFPN and DSM block providing major improvements, consistent with the quantitative results in Table 5. Single-module configurations still exhibit false positives. However, single-module configurations still exhibit false positives. Dual-module combinations successfully eliminated the previous false detections. Complete integration of all three modules achieves the most focused attention on insulator strings with minimal background interference.
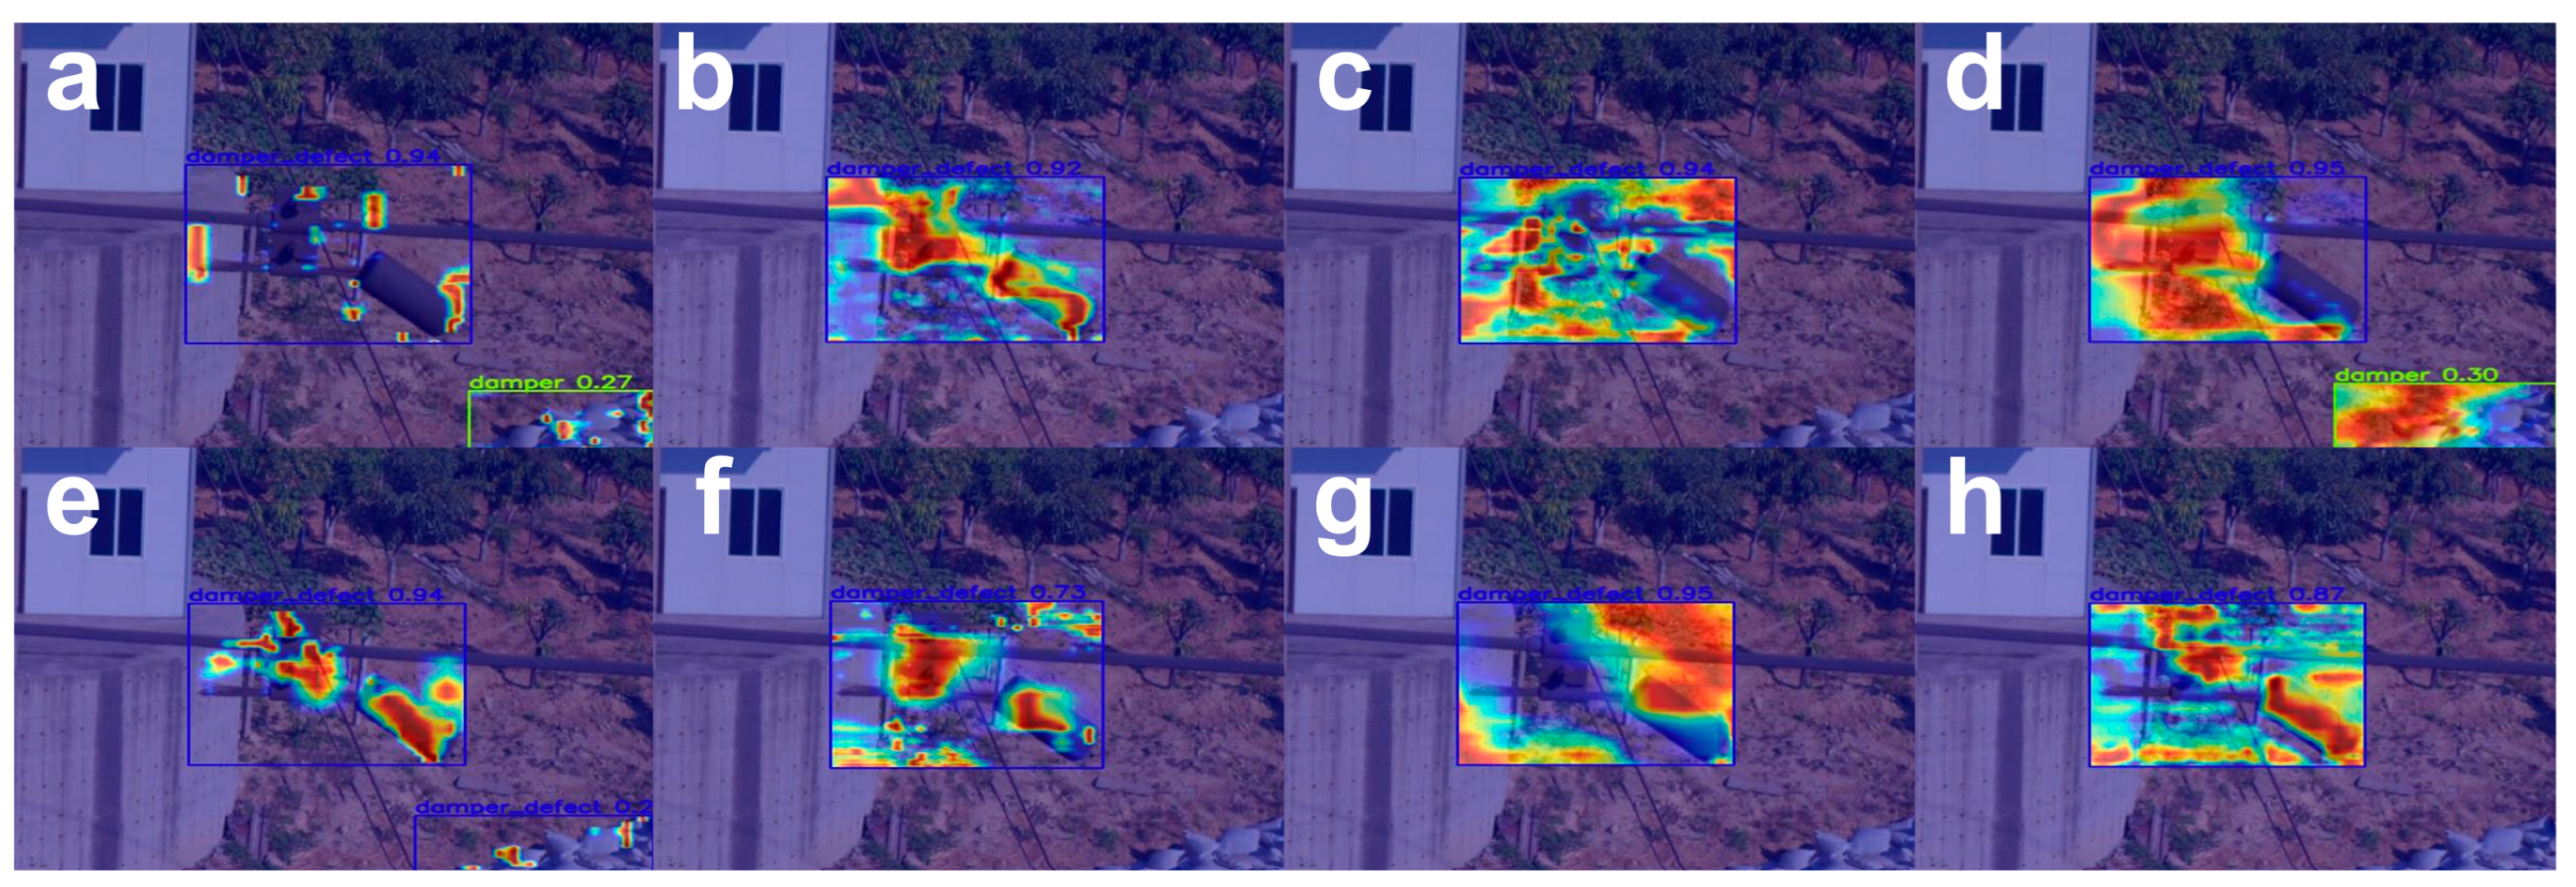
As shown in Figure 13, the heat map analysis of the damper reveals similar patterns to insulator detection. The original RT-DETR model exhibits incomplete coverage of the damper body and false detections in the complex background environment. Integration of the single module demonstrates progressively concentrated attention on the damper target. Complete integration of all three modules achieves the most focused attention while attaining the highest confidence level of 0.96.
As shown in Figure 14, the heat map for bird nest detection illustrates that all models misidentified the background metal plate in the lower right corner as a bird’s nest. We attribute this misdetection to inherent perceptual ambiguity stemming from the visual congruence between metal plates and bird nests in both geometric structure and surface texture. The original RT-DETR model did not cover the bird nest and had a misdetection confidence level of 0.52. However, when the AIFI module is improved to ASSAformer, the network enhances the adaptive feature extraction capability as well as the recognition capability, and successfully reduces the confidence level of the metal plate misidentified as a bird’s nest in the lower right corner to 0.21. At the same time, the DSM block module enhances the depth of the feature extraction, and the MABIFPN module enhances the feature processing capability. However, both modules resulted in increased confidence levels for false positives in the lower right corner, alongside the emergence of additional misclassifications. This demonstrates that while improvements to individual modules can enhance detection accuracy to some extent, the heat map reveals that false positives may still occur for features at different scales, indicating instability.
Changing the ablation experiments of the two modules, the confidence of both ASSAformer and MABIFPN-based networks in the lower right corner misdetection reached the lowest 0.21, which further proves the feature recognition ability of the ASSA and the significant improvement of the synergy with other modules. Finally, in the PLD-DETR with all three modules improved, the lower confidence in misdetection and the highest confidence in bird nest detection are achieved. Moreover, the distribution of the heat map is also more concentrated on the features in comparison with other experiments, proving the ability of the network and the effect of synergy of the three modules.

5. Discussion

Our experimental results indicate that the PLD-DETR model significantly improves the accuracy of power transmission line defect detection while ensuring model lightweighting. The ablation experiment confirmed the effectiveness of components such as the DSM block, ASSAformer module, and MABIFPN architecture. When these three modules (DSM block, ASSAformer, and MABIFPN) are fully integrated, the PLD-DETR model exhibits excellent detection performance. Compared with the single module configuration, the dual module combination effectively eliminates the previous false detection, and the integration of all three modules achieves the most focused attention distribution on the target (such as insulator, damper, bird’s nest, etc.), with the minimum background interference. Through the collaborative action of various modules, PLD-DETR not only improves the detection accuracy of targets but also effectively reduces false positives, achieving efficient target detection in complex backgrounds.
In future research, we intend to pursue further optimization of our model in several key directions. First, although PLD-DETR improves the accuracy and robustness of target detection through its innovative design, the model is still susceptible to interference in some extreme cases. Specifically, when targets exhibit low contrast against backgrounds or experience significant obstruction by other objects, the model may produce false predictions or suffer from missed detections. Moreover, environmental and operational variabilities—such as varying lighting conditions, adverse weather (fog, rain), and temperature-induced image quality degradation—may further influence detection reliability in real-world power line inspection scenarios. These challenges are analogous to the baseline compensation and environmental adaptation problems systematically reviewed in other monitoring domains [31], where operational conditions introduce systematic variations affecting system performance. Therefore, we propose to specifically collect and annotate challenging cases with low contrast and high obstruction for future training. This approach will be combined with multimodal feature fusion incorporating RGB, depth, and infrared information to address this issue [32].
In addition, the DETR series has some shortcomings in hardware compatibility compared to the YOLO series. Although the number of parameters and computational complexity of some DETR models may be lower than those of the YOLO series, their operating efficiency on certain hardware devices is not ideal. Therefore, in order to improve its adaptability and real-time inference performance in different hardware environments, technical means such as model pruning and knowledge distillation can be used to further optimize the model structure and computational efficiency [33], thereby improving its detection performance and real-time performance in practical applications.

6. Conclusions

In this paper, we propose a lightweight Transformer-based detection model, PLD-DETR, for common defects in transmission lines. The double selection mechanism of the DSM block in the model makes the network more focused on processing important regions in the image, which can better eliminate the influence of the background complexity in the real inspection image; ASSAformer can effectively extract the deeper features that are rich in semantic information, and the MABIFPN feature fusion network can effectively solve the problem of feature loss. While maintaining low model complexity, PLD-DETR can achieve excellent detection performance in the common defect detection task of transmission lines in two datasets. Future research should focus on lightweight deployment of the model to improve the processing speed and efficiency of the model to detect transmission line faults faster and ensure the safe operation of the power grid.

Author Contributions

Conceptualization, J.C., D.F. and X.Z.; methodology, J.C.; software, J.C.; validation, J.C., D.F. and X.Z.; form analysis, J.C.; investigation, J.C.; resources, D.F.; data curation, J.C.; writing—original draft preparation, J.C., D.F. and X.Z.; writing—review and editing, J.C., D.F., X.Z., J.L. and L.Z.; visualization, J.C.; supervision, D.F.; project administration, D.F.; funding acquisition, D.F.; All authors have read and agreed to the published version of the manuscript.

Funding

This research was funded by the S&T Program of Hebei (21567605H).

Data Availability Statement

The data that support the findings of this study are openly available in [IEEE Dataport] at https://dx.doi.org/10.21227/vkdw-x769. The RSTLD dataset is not publicly available due to the confidentiality of the research projects.

Conflicts of Interest

The authors declare no conflicts of interest.

Abbreviations

The following abbreviations are used in this manuscript:
AIFIAttention-Based Intra-scale Feature Interaction
APAverage Precision
ASSAformerAdaptive Sparse Self-Attention Former
CCFMCross-Scale Fusion Module
CDTLDsCommon Defects of Transmission Lines Datasets
CNNsConvolutional Neural Networks
CPLIDsChinese Power Line Insulator Datasets
DETRDetection Transformer
DSADense Self-Attention
DSMDual-Domain Selection Mechanism
FCOSFully Convolutional One-Stage
FLOPsFloating Point Operations
FPNFeature Pyramid Network
FPSsFrames Per Second
FSMFrequency Selection Module
MABIFPNMulti-branch Auxiliary Bidirectional Feature Pyramid Network
NMSNon-Maximum Suppression
PPrecision
PAFPNPath Aggregation FPN
PLD-DETRPower Line Defect Detection Transformer
RRecall
R-CNNRegion-CNN
RSTLDsReal Scene Transmission Lines Datasets
RT-DETRReal Time Detection Transformer
SSASparse Self-Attention
SSDSingle Shot MultiBox Detector
SSMSpatial Selection Module
UAVUnmanned Aerial Vehicle

References

  1. Mishra, D.P.; Ray, P. Fault detection, location and classification of a transmission line. Neural Comput. Appl. 2018, 30, 1377–1424. [Google Scholar] [CrossRef]
  2. Wong, S.Y.; Choe, C.W.C.; Goh, H.H.; Low, Y.W.; Cheah, D.Y.S.; Pang, C. Power transmission line fault detection and diagnosis based on artificial intelligence approach and its development in uav: A review. Arab. J. Sci. Eng. 2021, 46, 9305–9331. [Google Scholar] [CrossRef]
  3. Xu, B.; Zhao, Y.; Wang, T.; Chen, Q. Development of power transmission line detection technology based on unmanned aerial vehicle image vision. SN Appl. Sci. 2023, 5, 72. [Google Scholar] [CrossRef]
  4. Jenssen, R.; Roverso, D. Automatic autonomous vision-based power line inspection: A review of current status and the potential role of deep learning. Int. J. Electr. Power Energy Syst. 2018, 99, 107–120. [Google Scholar] [CrossRef]
  5. He, M.; Qin, L.; Deng, X.; Liu, K. MFI-YOLO: Multi-fault insulator detection based on an improved YOLOv8. IEEE Trans. Power Deliv. 2023, 39, 168–179. [Google Scholar] [CrossRef]
  6. Carion, N.; Massa, F.; Synnaeve, G.; Usunier, N.; Kirillov, A.; Zagoruyko, S. End-to-end object detection with transformers. In Proceedings of the European Conference on Computer Vision, Glasgow, UK, 23–28 August 2020; pp. 213–229. [Google Scholar] [CrossRef]
  7. Xie, Z.; Dong, C.; Zhang, K.; Wang, J.; Xiao, Y.; Guo, X.; Zhao, Z.; Shi, C.; Zhao, W. Power-DETR: End-to-end power line defect components detection based on contrastive denoising and hybrid label assignment. IET Gener. Transm. Distrib. 2024, 18, 3264–3277. [Google Scholar] [CrossRef]
  8. Ren, Z.; Wang, Y. Research on the rapid check and identification of insulator faults in transmission lines based on a modified faster RCNN network. In Proceedings of the 2022 International Conference on Image Processing and Computer Vision (IPCV), Okinawa, Japan, 12–14 May 2023; pp. 17–21. [Google Scholar] [CrossRef]
  9. Cai, Z.; Vasconcelos, N. Cascade r-cnn: Delving into high quality object detection. In Proceedings of the IEEE Conference on Computer Vision and Pattern Recognition, Salt Lake City, UT, USA, 18–22 June 2018; pp. 6154–6162. [Google Scholar] [CrossRef]
  10. Miao, X.; Liu, X.; Chen, J.; Zhuang, S.; Fan, J.; Jiang, H. Insulator detection in aerial images for transmission line inspection using single shot multibox detector. IEEE Access 2019, 7, 9945–9956. [Google Scholar] [CrossRef]
  11. Tian, Z.; Shen, C.; Chen, H.; FCOS, T.H. Fully convolutional one-stage object detection. In Proceedings of the 2019 IEEE/CVF International Conference on Computer Vision (ICCV), Seoul, Republic of Korea, 27 October–2 November 2019; pp. 9626–9635. [Google Scholar] [CrossRef]
  12. Huang, X.; Zhang, X.; Zhang, Y.; Zhao, L. A method of identifying rust status of dampers based on image processing. IEEE Trans. Instrum. Meas. 2020, 69, 5407–5417. [Google Scholar] [CrossRef]
  13. Wu, X.; Yuan, P.; Peng, Q.; Ngo, C.-W.; He, J.-Y. Detection of bird nests in overhead catenary system images for high-speed rail. Pattern Recognit. 2016, 51, 242–254. [Google Scholar] [CrossRef]
  14. Murthy, V.S.; Tarakanath, K.; Mohanta, D.; Gupta, S. Insulator condition analysis for overhead distribution lines using combined wavelet support vector machine (SVM). IEEE Trans. Dielectr. Electr. Insul. 2010, 17, 89–99. [Google Scholar] [CrossRef]
  15. Zhang, J.; Xiao, T.; Li, M.; Zhou, Y. Deep-learning-based detection of transmission line insulators. Energies 2023, 16, 5560. [Google Scholar] [CrossRef]
  16. Zhai, Y.; Yang, X.; Wang, Q.; Zhao, Z.; Zhao, W. Hybrid knowledge R-CNN for transmission line multifitting detection. IEEE Trans. Instrum. Meas. 2021, 70, 5013312. [Google Scholar] [CrossRef]
  17. Zhai, Y.; Yang, K.; Zhao, Z.; Wang, Q.; Bai, K. Geometric characteristic learning R-CNN for shockproof hammer defect detection. Eng. Appl. Artif. Intell. 2022, 116, 105429. [Google Scholar] [CrossRef]
  18. Liang, H.; Zuo, C.; Wei, W. Detection and evaluation method of transmission line defects based on deep learning. IEEE Access 2020, 8, 38448–38458. [Google Scholar] [CrossRef]
  19. Hao, K.; Chen, G.; Zhao, L.; Li, Z.; Liu, Y.; Wang, C. An insulator defect detection model in aerial images based on multiscale feature pyramid network. IEEE Trans. Instrum. Meas. 2022, 71, 3522412. [Google Scholar] [CrossRef]
  20. Zhao, Y.; Lv, W.; Xu, S.; Wei, J.; Wang, G.; Dang, Q.; Liu, Y.; Chen, J. Detrs beat yolos on real-time object detection. In Proceedings of the IEEE/CVF Conference on Computer Vision and Pattern Recognition, Seattle, WA, USA, 16–22 June 2024; pp. 16965–16974. [Google Scholar] [CrossRef]
  21. Cheng, Y.; Liu, D. An Image-Based Deep Learning Approach with Improved DETR for Power Line Insulator Defect Detection. J. Sens. 2022, 2022, 6703864. [Google Scholar] [CrossRef]
  22. Cheng, Y.; Liu, D. AdIn-DETR: Adapting detection transformer for end-to-end real-time power line insulator defect detection. IEEE Trans. Instrum. Meas. 2024, 73, 3528511. [Google Scholar] [CrossRef]
  23. Zhang, K.; Lou, W.; Wang, J.; Zhou, R.; Guo, X.; Xiao, Y.; Shi, C.; Zhao, Z. PA-DETR: End-to-end visually indistinguishable bolt defects detection method based on transmission line knowledge reasoning. IEEE Trans. Instrum. Meas. 2023, 72, 5016914. [Google Scholar] [CrossRef]
  24. Wang, J.; Jin, L.; Li, Y.; Cao, P. Application of end-to-end perception framework based on boosted DETR in UAV inspection of overhead transmission lines. Drones 2024, 8, 545. [Google Scholar] [CrossRef]
  25. Li, D.; Yang, P.; Zou, Y. Optimizing insulator defect detection with improved DETR models. Mathematics 2024, 12, 1507. [Google Scholar] [CrossRef]
  26. Li, T.; Zhu, C.; Wang, Y.; Li, J.; Cao, H.; Yuan, P.; Gao, Z.; Wang, S. LMFC-DETR: A Lightweight Model for Real-Time Detection of Suspended Foreign Objects on Power Lines. IEEE Trans. Instrum. Meas. 2025, 74, 2539319. [Google Scholar] [CrossRef]
  27. Cui, Y.; Ren, W.; Cao, X.; Knoll, A. Focal network for image restoration. In Proceedings of the IEEE/CVF International Conference on Computer Vision, Paris, France, 1–6 October 2023; pp. 13001–13011. [Google Scholar] [CrossRef]
  28. Zhou, S.; Chen, D.; Pan, J.; Shi, J.; Yang, J. Adapt or perish: Adaptive sparse transformer with attentive feature refinement for image restoration. In Proceedings of the IEEE/CVF Conference on Computer Vision and Pattern Recognition, Seattle, WA, USA, 16–22 June 2024; pp. 2952–2963. [Google Scholar] [CrossRef]
  29. Yang, Z.; Guan, Q.; Zhao, K.; Yang, J.; Xu, X.; Long, H.; Tang, Y. Multi-branch auxiliary fusion yolo with re-parameterization heterogeneous convolutional for accurate object detection. In Proceedings of the Chinese Conference on Pattern Recognition and Computer Vision (PRCV), Urumqi, China, 18–20 October 2024; pp. 492–505. [Google Scholar] [CrossRef]
  30. Pang, G.; Zhang, Z.; Hu, J.; Hu, Q.; Zheng, H.; Jiang, X. Analysis of Failures and Protective Measures for Core Rods in Composite Long-Rod Insulators of Transmission Lines. Energies 2025, 18, 3138. [Google Scholar] [CrossRef]
  31. Rezazadeh, N.; De Luca, A.; Perfetto, D.; Salami, M.R.; Lamanna, G. Systematic critical review of structural health monitoring under environmental and operational variability: Approaches for baseline compensation, adaptation, and reference-free techniques. Smart Mater. Struct. 2025, 34, 073001. [Google Scholar] [CrossRef]
  32. Liu, Y.; Guo, Y.; Fan, Y.; Zhou, J.; Li, Z.; Xiao, S.; Zhang, X.; Wu, G. Optical imaging technology application in transmission line insulator monitoring: A review. IEEE Trans. Dielectr. Electr. Insul. 2024, 31, 3120–3132. [Google Scholar] [CrossRef]
  33. Surantha, N.; Sutisna, N. Key Considerations for Real-Time Object Recognition on Edge Computing Devices. Appl. Sci. 2025, 15, 7533. [Google Scholar] [CrossRef]
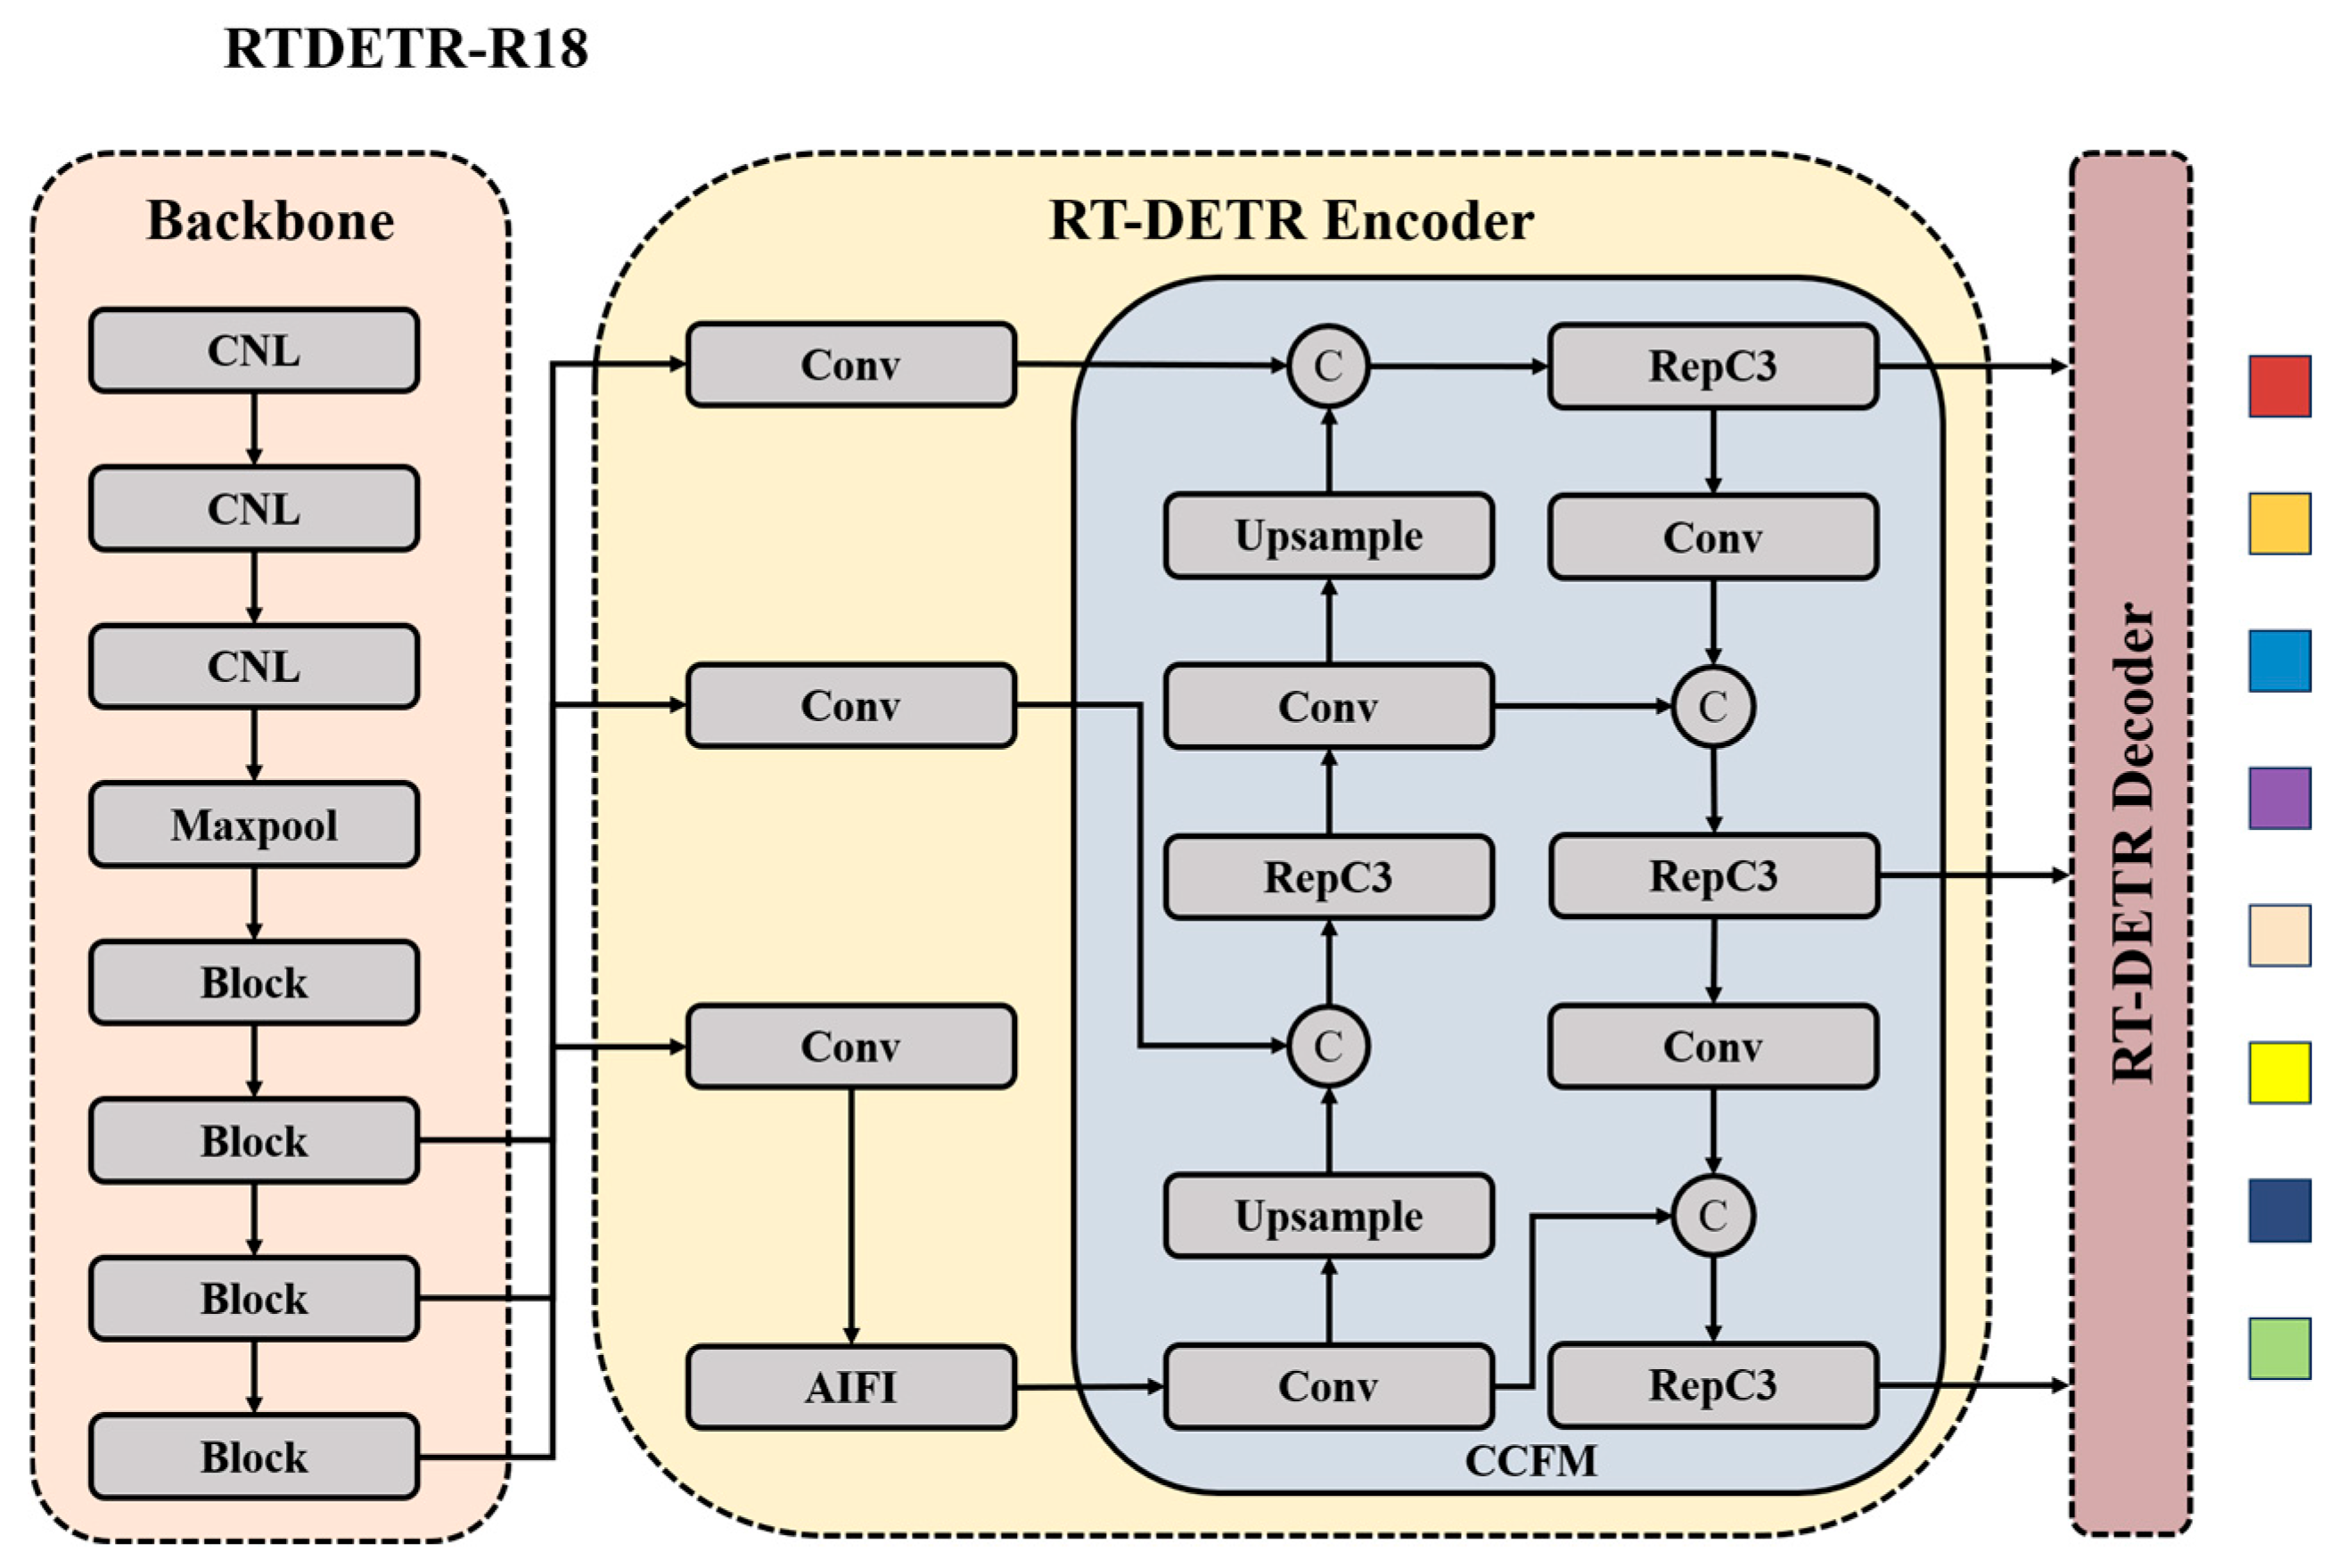
Figure 1. RTDETR-R18 structural framework.
Electronics 14 04107 g001
Figure 2. Overall design framework of PLD-DETR.
Electronics 14 04107 g002
Figure 3. DSM structure.
Electronics 14 04107 g003
Figure 4. ASSAformer structure.
Electronics 14 04107 g004
Figure 5. (a) Path aggregation of FPN (PAFPN) and (b) MABIFPN structures. PS, PM, and PL represent the detection layers for small, medium, and large targets, respectively.
Electronics 14 04107 g005
Figure 6. CDTLD dataset, (a) damaged insulator, (b) insulator dropped string, (c) flashover defect insulators, (d) bird nests, (e) complex background environment, (f) damaged damper.
Electronics 14 04107 g006
Figure 7. RSTLD dataset, (a) normal insulator, (b) flashover defect insulators, (c) normal composite insulators, (d) normal composite insulators, (e) normal dampers and damaged dampers, (f) bird nests.
Electronics 14 04107 g007
Figure 8. (a) Insulator dropped string, (b) insulator damaged, (c) insulator flashover.
Electronics 14 04107 g008
Figure 9. (a) Bird nest identification, (b) damper defect identification.
Electronics 14 04107 g009
Figure 10. Insulator inspection visualization results (YOLOv8, YOLOv9, YOLOv10, YOLOv11, RT-DETR, ours).
Electronics 14 04107 g010
Figure 11. Bird nest inspection visualization results (YOLOv8, YOLOv9, YOLOv10, YOLOv11, RT-DETR, PLD-DETR).
Electronics 14 04107 g011
Figure 12. Heat map of insulator string detection: (a) RT-DETR, (b) ASSAformer, (c) MABIFPN, (d) DSM block, (e) ASSAformer + DSM block, (f) ASSAformer + MABIFPN, (g) MABIFPN + DSM block, (h) PLD-DETR.
Electronics 14 04107 g012
Figure 13. Heat map of damper detection: (a) RT-DETR, (b) ASSAformer, (c) MABIFPN, (d) DSM block, (e) ASSAformer + DSM block, (f) ASSAformer + MABIFPN, (g) MABIFPN + DSM block, (h) PLD-DETR.
Electronics 14 04107 g013
Figure 14. Heat map of bird nest detection: (a) RT-DETR, (b) ASSAformer, (c) MABIFPN, (d) DSM block, (e) ASSAformer + DSM block, (f) ASSAformer + MABIFPN, (g) MABIFPN + DSM block, (h) PLD-DETR.
Electronics 14 04107 g014
Table 1. Experimental Setting.
Experimental EnvironmentConfiguration Information
GPUNVIDIA RTX 4090
Running SystemUbuntu 22.04.3
Experiment languagePython 3.9
CUDA11.8
PyTorch1.12.0
Table 2. Hyperparameter settings for different object detection algorithms.
MethodOptimizerLearning RateMomentumWeight_Decay
Two-Stage
Detector
Faster RCNNSGD0.020.90.0001
Cascade RCNNSGD0.020.90.0001
Libra RCNNSGD0.020.90.0001
Single-Stage
Detector
FCOSSGD0.020.90.0001
YOLOv8mSGD0.010.90.0005
YOLOv9mSGD0.010.90.0005
YOLOv10bSGD0.010.90.0005
YOLOv11lSGD0.010.90.0005
Transformer
Detector
RT-DETRAdamW0.00010.90.0001
Conditional-DETRAdamW0.00010.90.0001
Dab-DETRAdamW0.00010.90.0001
Detector Proposed
in This Paper
PLD-DETRSGD0.010.90.0005
Table 3. Performance on the CDTLD dataset.
Detection AlgorithmsAP50 (↑)AP75 (↑)AP50–95 (↑)Parameters (↓)FLOPs (↓)
Faster RCNN0.8600.6910.61041.745 M90.9 G
Cascade RCNN0.8530.7100.61569.395 M119.0 G
Libra RCNN0.8610.7110.61241.637 M92.7 G
FCOS0.8610.6790.59132.127 M78.6 G
YOLOv8m0.8330.6550.58625.844 M78.7 G
YOLOv9m0.8430.6830.59620.018 M76.5 G
YOLOv10b0.8190.6280.57719.010 M91.6 G
YOLOv11l0.8500.6630.59325.285 M86.6 G
Conditional-DETR0.7510.4260.42343.450 M95.9 G
Dab-DETR0.9100.7270.63543.703 M86.9 G
RT-DETR0.8860.7130.62719.881 M57.0 G
PLD-DETR0.9100.7630.66221.123 M59.4 G
The arrow indicates that this parameter ideally reaches a larger or smaller value. The bold numbers indicate that this model achieved the best results in all the comparison experiments under this parameter.
Table 4. Performance on the RSTLD dataset.
Detection AlgorithmsAP50 (↑)AP75 (↑)AP50–95 (↑)Parameters (↓)FLOPs (↓)
Faster RCNN0.5000.2860.28241.745 M90.9 G
Cascade RCNN0.5070.3110.29369.395 M119 G
Libra RCNN0.5180.3130.29441.637 M92.7 G
FCOS0.5350.2840.25532.127 M78.6 G
YOLOv8m0.5560.3410.33225.844 M78.7 G
YOLOv9m0.5860.3800.35420.018 M76.5 G
YOLOv10b0.5130.3190.31019.010 M91.6 G
YOLOv11l0.5910.3600.34425.285 M86.6 G
Conditional-DETR0.5490.3040.28543.450 M95.9 G
Dab-DETR0.5690.3170.31443.703 M86.9 G
RT-DETR0.6230.4060.38719.881 M57.0 G
PLD-DETR0.6510.4220.40121.123 M59.4 G
The arrow indicates that this parameter ideally reaches a larger or smaller value. The bold numbers indicate that this model achieved the best results in all the comparison experiments under this parameter.
Table 5. Results of ablation experiment.
ASSADSM BlockMABIFPNAP50AP75AP50–95ParametersGFLOPs
0.8860.7130.62719.881 M57.0
0.8890.7170.63320.718 M57.8
0.8880.7420.64920.054 M58.0
0.9050.7540.65320.113 M57.5
0.8880.7290.63320.891 M58.9
0.9010.7670.65820.951 M58.4
0.9030.7640.65820.286 M58.5
0.9100.7630.66221.123 M59.4
Disclaimer/Publisher’s Note: The statements, opinions and data contained in all publications are solely those of the individual author(s) and contributor(s) and not of MDPI and/or the editor(s). MDPI and/or the editor(s) disclaim responsibility for any injury to people or property resulting from any ideas, methods, instructions or products referred to in the content.