Article

Blind Separation and Feature-Guided Modulation Recognition for Single-Channel Mixed Signals

1
Naval University of Engineering, Wuhan 430033, China
2
Power Investment (Qingdao) Investment Development Co., Ltd., Qingdao 266034, China
*
Author to whom correspondence should be addressed.
Electronics 2025, 14(20), 4103; https://doi.org/10.3390/electronics14204103
Submission received: 21 August 2025 / Revised: 7 October 2025 / Accepted: 14 October 2025 / Published: 20 October 2025

Abstract

With increasingly scarce spectrum resources, frequency-domain signal overlap interference has become a critical issue, making multi-user modulation classification (MUMC) a significant challenge in wireless communications. Unlike single-user modulation classification (SUMC), MUMC suffers from feature degradation caused by signal aliasing, feature redundancy, and low inter-class discriminability. To address these challenges, this paper proposes a collaborative “separation–recognition” framework. The framework begins by separating overlapping signals via a band partitioning and FastICA module to alleviate feature degradation. For the recognition phase, we design a dual-branch network: one branch extracts prior knowledge features, including amplitude, phase, and frequency, from the I/Q sequence and models their temporal dependencies using a bidirectional LSTM; the other branch learns deep hierarchical representations directly from the raw signal through multi-scale convolutional layers. The features from both branches are then adaptively fused using a gated fusion module. Experimental results show that the proposed method achieves superior performance over several baseline models across various signal conditions, validating the efficacy of the dual-branch architecture and the overall framework.

1. Introduction

Automatic Modulation Classification (AMC), as a key technology in modern communication systems [1,2], holds significant application value in fields such as radar detection [3,4] and spectrum monitoring [5]. The large-scale deployment of current communication equipment has led to increasingly complex electromagnetic environments [6], with signal aliasing in the time-frequency domain becoming markedly more severe, significantly constraining demodulation performance at the receiver. Therefore, advancing research on AMC technology is imperative.
The scarcity of spectrum resources further drives this research. In scenarios such as cognitive radio Underlay mode [7] and paired carrier multiple access [8], multiple signals often share the same narrow frequency band. Effectively identifying the modulation schemes of individual components within mixed signals is a critical prerequisite for subsequent demodulation, separation, and interference suppression, creating an urgent demand for Multiuser Modulation Classification (MUMC) [9].
Existing techniques for mixed modulation signal recognition (MUMC) primarily fall into two categories: direct recognition and separation-then-recognition. Direct recognition identifies modulation types by extracting features from mixed signals [10]. Representative approaches include: CNN-based single-channel multi-signal recognition [11], Multiuser Signal Processing Using CNN-BiLSTM [12], models employing large-kernel convolutions with refined attention mechanisms [13], and multi-label learning frameworks (e.g., MLAMC) [14]. However, frequency band overlap disrupts the independence of signal features, resulting in an excessively complex joint feature space. Consequently, direct recognition techniques exhibit insufficient robustness and limited generalization capability in complex scenarios characterized by scarce mixed samples, significantly distinct modulation schemes, and inconsistent bandwidths.
The separation-then-recognition approach adopts a cascaded architecture that first recovers independent source signals via blind source separation (BSS) to enhance signal representations, followed by mature single-signal recognition algorithms for modulation identification. This methodology demonstrates integrated advantages in theoretical completeness, processing flexibility, and potential performance ceilings. Recent advances in separation techniques comprise five innovative paradigms: an end-to-end deep separation network (CNSE) [15]; virtual channel construction integrated with FastICA decomposition [16]; a hybrid framework combining PCA denoising, FastICA separation, and HOC-SVM classification [17]; sequence labeling via sliding-window discrete Fourier transform (SWDF) and bidirectional GRUs [18]; and blind channel estimation (FastICA/NICA) coupled with MLMC classifiers [19].
This paper proposes a collaborative “separation-recognition” framework to address the core challenges confronting direct recognition schemes in practical electromagnetic environments—specifically, poor generalization resulting from limited training data and feature degradation due to spectral overlap. The main contributions are threefold:
(1)
We introduce an adaptive spectrum partitioning strategy based on energy detection. It dynamically divides the mixed signal band into multiple sub-bands to construct multi-dimensional virtual observations. FastICA is then applied to separate these signals effectively, thereby alleviating issues of data scarcity and feature masking;
(2)
A novel recognition method that synergistically combines prior knowledge with deep learning feature extraction is proposed. The framework includes a dedicated module for extracting and fusing diverse forms of prior knowledge, while the deep learning component operates directly on the original I/Q data. The final step involves the integration of these knowledge-driven and data-driven features;
(3)
A phased feature processing framework is designed to tackle the challenges posed by the heterogeneous nature of different prior knowledge features and the temporal dependencies within signals. Initially, various prior knowledge features are extracted independently through parallel branches to preserve information purity. Subsequently, these features are combined to exploit their correlations across the temporal dimension.
The remainder of the paper is organized as follows: Section 2 reviews related work. Section 3 details the multi-scale convolutional attention network. Section 4 presents the experimental setup and results. Section 5 concludes by summarizing the contributions of this work.

2. Materials and Methods

2.1. Received Signal Model

In multi-signal communication scenarios with time-frequency aliasing, the linear mixed single-channel received signal captured by a single antenna from N independent sources transmitting signals with adjacent carrier frequencies and distinct modulation types can be expressed as:
x ( t ) = i = 1 N a i s i ( t ) + n ( t ) = a T S ( t ) + n ( t )
where the mixing coefficient a = [ a 1 , a 2 , , a N ] T represents the amplitude and phase superposition of each source signal at the receiver, n ( t ) denotes Additive White Gaussian Noise (AWGN), x ( t ) is the single-channel observed signal, and S ( t ) = [ s 1 ( t ) , s 2 ( t ) , , s N ( t ) ] T represents N unknown source signals. According to Equation (1), the objective of MUMC is to estimate the mixing coefficient a and source signals S ( t ) to facilitate the ultimate goal of modulation type identification for each source signal.

2.2. Fast Independent Component Analysis

Independent Component Analysis (ICA), a classical approach for blind source separation (BSS) [20], relies on the fundamental assumption of statistical independence among source signals. The separation is achieved by maximizing the non-Gaussianity of output components, which corresponds to maximizing the neg-entropy J ( y ) :
M a x J ( y )
However, the practical implementation via FastICA encounters challenges in real electromagnetic environments, where the assumptions of statistical independence and non-gaussianity are often not fully satisfied. Nevertheless, FastICA has shown empirical robustness in various practical applications [21,22], especially when combined with suitable pre-processing strategies.
FastICA, operating within the ICA framework, achieves an efficient solution through neg-entropy approximation and fixed-point iteration. The neg-entropy approximation is adopted as the objective function:
J ( y ) [ E { G ( y ) } E { G ( v ) } ] 2
where y = w T x represents the projection of the whitened signal z, v denotes a standard Gaussian random variable, and G ( · ) is a non-quadratic contrast function. The algorithm employs a fixed-point iteration strategy to optimize the objective function. This process aims to find the optimal projection vector w that maximizes the non-Gaussianity of the projected signal y = w T x . The matrix composed of all such optimal vectors forms the required demixing matrix. The fixed-point iteration formula for the column vectors w in the separation matrix W is given by:
w = E { z g ( w T z ) } E { g ( w T z ) } w w = w / w
where g ( · ) = d G ( u ) / d ( u ) , g ( · ) = d g ( u ) / d ( u ) .

2.3. Relevant Parameters

In this study, we adopt the Mixed Signal-to-Noise Ratio (M-SNR) to characterize the signal-noise relationship, defined as the ratio of the sum power of all source signals to the noise power within the signal bandwidth:
M - SNR = 10 lg ( P [ s k ( t ) ] σ 2 )
where P [ s k ( t ) ] represents the sum power of distinct source signals s k ( t ) , and σ 2 denotes the variance of Gaussian white noise n ( t ) .
In single-channel time-frequency environments where signals are fully overlapped in the time domain and partially overlapped in the frequency domain, the frequency band aliasing ratio of source signal is defined as γ :
γ = B o v e r l a p B s o u r c e
In blind source separation (BSS), the correlation coefficient serves as a core metric for evaluating waveform similarity between separated signals and source signals, defined as:
ρ = i = 1 N ( X i X ¯ ) ( Y i Y ¯ ) i = 1 N ( X i X ¯ ) 2 i = 1 N ( Y i Y ¯ ) 2
where ρ 1 . The closer its value is to 1, the higher the waveform similarity between the separated signal and the source signal, signifying superior separation performance of the algorithm.

3. System Model

In scenarios where multiple digital modulation signals are aliased, signal aliasing leads to severe degradation of the signal’s characteristics. To address this issue, this paper proposes a separation method that integrates virtual multi-channels and FastICA, and a modulation recognition method that combines prior knowledge and deep learning feature extraction, jointly constructing a system framework for the collaborative optimization of “separation–recognition”. The overall structure of the system is shown in Figure 1.

3.1. Signal Separation

3.1.1. Spectrum Partitioning

To address the blind separation problem for time-frequency aliased signals, this paper proposes a virtual multi-channel construction method based on adaptive power spectrum partitioning. The core concept involves converting the single-channel received signal x(t) into multi-channel observation signals satisfying the positive-definite condition through Welch power spectral density (PSD) estimation and noise statistical analysis.
The received signal x(t) from the single-channel communication system in Equation (1) undergoes Welch PSD estimation S W e l c h ( f ) followed by smoothing processing. Based on noise statistics estimated from out-of-band regions, the 3σ criterion adaptively determines the spectrum partitioning threshold ( τ ). For frequency band overlap regions, if a local minimum falls below τ , the corresponding minimum frequency is selected as the sub-band boundary, as illustrated in Figure 2a. Here, τ is defined as:
τ = P n o i s e _ a v g + 3 σ n o i s e
where the mean P n o i s e _ a v g and standard deviation σ n o i s e are estimated from the out-of-band regions of the signal. The frequency band B of the received signal x ( t ) is partitioned into M mutually non-overlapping sub-bands:
B = B 1 B 2 B M
where B 1 , B 2 , , B M represent the bandwidth ranges of distinct sub-bands. Each sub-band undergoes band-pass filtering (BPF), yielding sub-band signals x k ( t ) . Consequently, the received signal x ( t ) can be expressed as:
x k ( t ) = BPF B k { x ( t ) } ( k = 1 , 2 , , M )
x ( t ) = [ x 1 ( t ) , x 2 ( t ) , , x M ( t ) ] T
The proposed adaptive frequency band partitioning method transforms a single-channel signal into multiple virtual observations via sub-band filtering in the frequency domain. Within each resulting sub-band, the signal energy is predominantly contributed by a single source, thereby physically mitigating the effects of spectral overlap. These sub-band signals preserve the non-Gaussian nature of the original sources while exhibiting significantly reduced cross-correlation (all measured cross-correlation values < 0.2, as shown in Figure 2b), thus satisfying the approximate independence requirement of FastICA. Experimental results confirm that, even under 50% frequency-domain overlap, this approach maintains a similarity coefficient greater than 0.80 (see Figure 3b), demonstrating its practical feasibility.

3.1.2. Estimation of the Number of Signal Sources

To address the challenge of an unknown number of source signals in single-channel blind source separation, this paper presents a source number estimation method based on time-frequency sparsity and the cluster analysis of single-source points. The core of this methodology employs an established technical pipeline of “sparse transform—single-source point detection—feature extraction—cluster analysis” [23] to achieve accurate estimation of the source count.
Firstly, in the simplified analysis, noise is ignored, and the single-channel observed signal can be represented as x ( t ) = A S ( t ) . The one-dimensional observation signal is constructed into a two-dimensional virtual observation signal X ( t ) = [ x 1 ( t ) , x 2 ( t ) ] T through the adaptive frequency band division algorithm proposed in this paper. The corresponding time-frequency domain observation equation is X ( t , f ) = A ¯ S ( t , f ) , where A ¯ is the virtual hybrid matrix.
To enhance sparsity, a short-time Fourier transform is performed on the observed signal. The key to this method lies in identifying a single source point. At the single source point ( t 0 , f 0 ) (dominated by only one source signal), the observed signal satisfies X ( t 0 , f 0 ) = a i s i ( t 0 , f 0 ) , and the direct inference is that the real and imaginary parts of the observed signal are highly consistent in direction. Based on this, this paper detects single source points through the following criteria:
R { X ( t , f ) } T I { X ( t , f ) } R { X ( t , f ) } I { X ( t , f ) } > cos ( Δ θ )
Among them, Δ θ represents a small Angle tolerance threshold. After that, the normalized direction features of the time-frequency points that have passed the detection are extracted. These feature points correspond to the column vector directions of the mixture matrix in practice. Ultimately, the clustering of these directional features is analyzed through the clustering algorithm (K-Means), and the number of clustering centers is the number of source signals N. This method provides key prior information on the number of sources for the subsequent separation algorithm.

3.1.3. Waveform Separation

The virtual multi-channel observation signal x ( t ) = [ x 1 ( t ) , x 2 ( t ) , , x M ( t ) ] T , constructed based on spectral partitioning, is subjected to signal waveform separation using the FastICA algorithm introduced in Section 2.2. Preprocessing involving centering and whitening is first performed. The constructed observation signal x ( t ) is centered, and the covariance matrix R x of the centered signal ( x ˜ ( t ) ) is computed, followed by its eigenvalue decomposition:
x ˜ ( t ) = x ( t ) E [ x ( t ) ] R x = E [ x ˜ x ˜ H ] = U Λ U H
where U is the orthogonal matrix of eigenvectors, and Λ is the diagonal matrix composed of eigenvalues. Subsequently, the whitening matrix Z is generated:
Z = U Λ 1 / 2 U H x ˜
Finally, initialize the demixing matrix W with randomly generated unit-norm column vectors. Sequentially update each column vector w i of W using Equations (3) and (4) to obtain the demixing matrix W = [ w 1 , w 2 , , w N ] . The source signals are then estimated via the demixing matrix W and whitened signal Z:
S ^ ( t ) = W Z

3.2. Prior-Guided Multiscale Network

To address the challenge of modulation recognition under low signal-to-noise ratio (SNR) and frequency band overlap, this paper proposes a prior knowledge-guided multi-scale deep network. The model features a dual-branch architecture for extracting and fusing physical features—namely amplitude, phase, and frequency. The primary branch leverages a multi-scale convolutional structure with parallel kernels of different sizes to extract deep signal features, enhanced by a dual-attention mechanism (channel and spatial) to refine key representations. The other branch employs a dedicated network to parse the aforementioned prior knowledge from I/Q signals. A custom feature fusion module then adaptively weights and integrates the physical and deep features.

3.2.1. Physical Feature Extraction

In the field of signal modulation, information is encoded onto carrier waves using various techniques, among which amplitude, phase, and frequency modulation are three fundamental types. To comprehensively characterize the modulation properties of radio signals, this paper focuses on extracting three categories of physical prior features: amplitude, phase, and frequency. The specific calculations and processing methods are as follows:
For a received complex-valued signal s ( t ) , its discrete form is s ( j ) = I ( j ) + i Q ( j ) , where I ( j ) represents the in-phase component and Q ( j ) denotes the quadrature component.
(1) Instantaneous Amplitude:
Amplitude is a direct measure of the instantaneous energy of a signal, obtained by calculating the modulus of the complex signal.
a ( j ) = Q ( j ) 2 + I ( j ) 2
To mitigate the impact of energy disparities on feature analysis, the amplitude sequence is normalized using the L 2 , yielding the normalized instantaneous amplitude A ( j ) :
A ( j ) = a ( j ) a ( j ) 2
(2) Instantaneous Phase:
The instantaneous phase p ( j ) reflects the angular position of the signal. To obtain the correct phase value covering all quadrants (−π, π], the four-quadrant inverse tangent function is employed for calculation:
p ( j ) = arctan ( Q ( j ) / I ( j ) ) I ( j ) > 0 arctan ( Q ( j ) / I ( j ) ) + π I ( j ) < 0 , Q ( j ) 0 arctan ( Q ( j ) / I ( j ) ) π I ( j ) < 0 , Q ( j ) < 0 π / 2 I ( j ) = 0 , Q ( j ) > 0 π / 2 I ( j ) = 0 , Q ( j ) < 0 0 I ( j ) = 0 , Q ( j ) = 0
This function automatically handles issues such as a zero denominator and quadrant determination, ensuring the completeness and numerical stability of the phase calculation. Subsequently, the phase values are normalized to the range [−1, 1] to obtain the normalized instantaneous phase P ( j ) :
P ( j ) = p ( j ) π
(3) Instantaneous Frequency
Frequency describes the change in signal phase over time and affects the rate of the carrier signal. In a timing signal, the frequency can be derived from the phase F ( j ) :
F ( j ) = 0 , j = 0 p ( j ) p ( j 1 ) , 0 < j < L
Through the above procedures, a set of feature vectors s ( j ) with clear physical meaning, unified scales, and enhanced noise robustness can be extracted from a complex signal { A ( j ) , P ( j ) , F ( j ) } , laying a foundation for subsequent modulation recognition tasks.
Addressing the concurrent characteristics of independence and temporal correlation among the prior features, this paper proposes a dynamic two-stage feature extraction architecture. Initially, amplitude, phase, and frequency features are independently extracted using multiple branches.
Subsequently, a Bidirectional LSTM is introduced to capture long-range temporal dependencies, leveraging its ability to model both forward and backward time relationships. Finally, a fully connected layer generates the discriminative feature F p r i o r .
This scheme maintains feature independence while exploring inter-feature correlations through dynamic fusion and sequence modeling, resulting in a feature representation that is highly noise-resistant and adaptable, thereby providing effective feature support for modulation recognition in complex environments.

3.2.2. Multi-Scale Feature Extraction

This paper designs a parallel convolutional architecture to capture feature variations across multiple temporal scales in modulated signals. The network comprises three parallel branches employing real convolutional kernels of 3, 7, and 15 scales, respectively, extracting time-domain features under distinct receptive fields:
F i = GELU ( BN ( Conv 1 D k i ( X ) ) ) , k i { 3 , 7 , 15 }
Each branch has 16 base channels, with inputs being dual-channel IQ signals X R B × 2 × 1024 . The outputs of each branch undergo batch normalization and GELU activation, with a dropout rate of 0.1 applied to prevent overfitting.
Through learnable scale weight parameters w = [ w 1 , w 2 , w 3 ] , adaptive weighting is applied to each branch feature:
F m u l t i = Concat ( F 3 w 1 , F 7 w 2 , F 15 w 3 )
The fused 48-channel features are expanded to 64 channels via a 3 × 3 convolution, then maintained at 48 channels through a 1 × 1 convolution. Finally, adaptive average pooling compresses the temporal dimension to 16, providing a standardized 48 × 16 feature representation for subsequent processing.
To further enhance key features, we introduce an optimized dual attention mechanism. Channel attention generates channel weights through global average pooling and convolutional layers, while spatial attention calculates spatial importance on channel-weighted features.
F attended = F multi W channel W spatial + α F multi
This module effectively extracts and highlights discriminative time-domain patterns in I/Q signals through the synergistic application of multi-scale convolutions and attention mechanisms.

3.2.3. Adaptive Feature Fusion Mechanism

To synergistically utilize deep features and prior knowledge features, the 64-dimensional prior features F prior are temporally extended to align with the 48-dimensional multi-scale features F attended .
A lightweight convolutional weight prediction network dynamically learns the fusion ratio w :
w = Softmax ( Conv 1 D ( Concat ( F attended , F prior ) ) ) R B × 2 × 16
The weighted features are concatenated and processed to generate the final fused representation:
F fused = Conv 1 D ( Concat ( F attended w 1 , F prior w 2 ) )

3.2.4. Classification Output Layer

The classification layer is responsible for mapping the fused high-level features to the final modulated class probabilities. First, feature maps are compressed into global feature vectors through global adaptive average pooling:
F global = AdaptiveAvgPool 1 D ( F fused ) R B × 128
Subsequently, the features undergo transformation through a classifier comprising two fully connected layers, employing the GELU activation function and Dropout for regularization, ultimately outputting logits corresponding to N classes modulation categories. The entire network is end-to-end optimized using the cross-entropy loss function to minimize the discrepancy between predictions and true labels.
L = 1 B i = 1 B j = 1 N classes y i j log ( softmax ( logits i j ) )
y i j represents the one-hot encoding of the actual label, enabling accurate modulation recognition classification.

3.2.5. Implementation Details

The network architecture of the recognition algorithm proposed in this paper is shown in Table 1. It is optimized for signal sequences, ensuring computational efficiency while maintaining high performance.

4. Experiments and Results Analysis

In this section, the classification performance will be evaluated by assessing the proposed method’s performance under different SNRs (signal-to-noise ratio within the noise bandwidth).

4.1. Simulation Experiments

4.1.1. Separation Performance for Band-Overlapping Signals

To quantitatively evaluate the separation performance of the proposed algorithm for mixed communication signals, we constructed a controlled mixing environment to test its effectiveness under varying noise levels and mixing complexities. The correlation coefficient ( ρ ) served as the primary performance metric.
The algorithm was tasked with separating pairwise mixtures of BPSK, QPSK, 8PSK, 16QAM, and 32QAM signals—15 combinations in total—with emphasis on both equal and asymmetric bandwidth cases. All signals used root raised cosine (RRC) pulse shaping with a roll-off factor of 0.5 and were sampled at 20 MHz. A Ricean fading channel with a K-factor of 4 and delays of [0, 5, 10, 15] μs was simulated. Two bandwidth overlap scenarios were considered (see Table 2):
Equal bandwidth scenario: Source signal bandwidths were uniformly set to 0.3 MHz, achieving four overlap levels (0%, 16.7%, 33.3%, 50%) by adjusting the carrier frequency spacing.
Asymmetric bandwidth scenarios: Source signal bandwidths are 0.3 MHz and 0.6 MHz, with overlap levels distributed asymmetrically (0%, 8.3–16.7%, 16.7–33.3%, 25–50%).
To ensure statistical reliability, 200 mixed-signal samples were generated for each signal-to-noise ratio (SNR) condition. To mitigate evaluation bias arising from carrier frequency and bandwidth disparities, the source signal’s carrier frequency and bandwidth settings were swapped every 100 samples, and the arithmetic mean of their correlation coefficients was subsequently calculated.
The composition of the dataset is as follows. It was constructed by blending five types of low-order modulation signals, with each mixed-modulation type containing 3200 samples. After the separation process, the sample size for each individual low-order modulation signal reached 19,200, ensuring a well-balanced dataset for both pre- and post-separation evaluation scenarios.
As shown in Figure 3, under different bandwidth conditions, the average correlation coefficient of the modulation combinations increases with rising M-SNR and stabilizes when M-SNR ≥ 14 dB ( ρ 0.91 ). When frequency overlap increases from 0% to 50%, the average ρ value in equal-bandwidth scenarios decreases from 0.915 to 0.800 over the M-SNR range [0 dB, 30 dB]. In asymmetric-bandwidth scenarios, separation performance under asymmetric overlap surpasses that under equal-bandwidth conditions (see Table 2), with the average ρ declining from 0.922 to 0.806—yet still marginally outperforming the equal-bandwidth case. The proposed separation algorithm maintains ρ ≥ 0.598 across all test scenarios at M - SNR 0 dB and demonstrates stronger robustness under asymmetric bandwidth overlap.

4.1.2. Recognition After Signal Separation

Based on the separated signals from Experiment 1, the proposed recognition network was applied to perform modulation classification. The dataset remained consistent with Experiment 1, split into training, validation, and test sets in a 5:3:2 ratio, with the goal of distinguishing five fundamental modulation types.
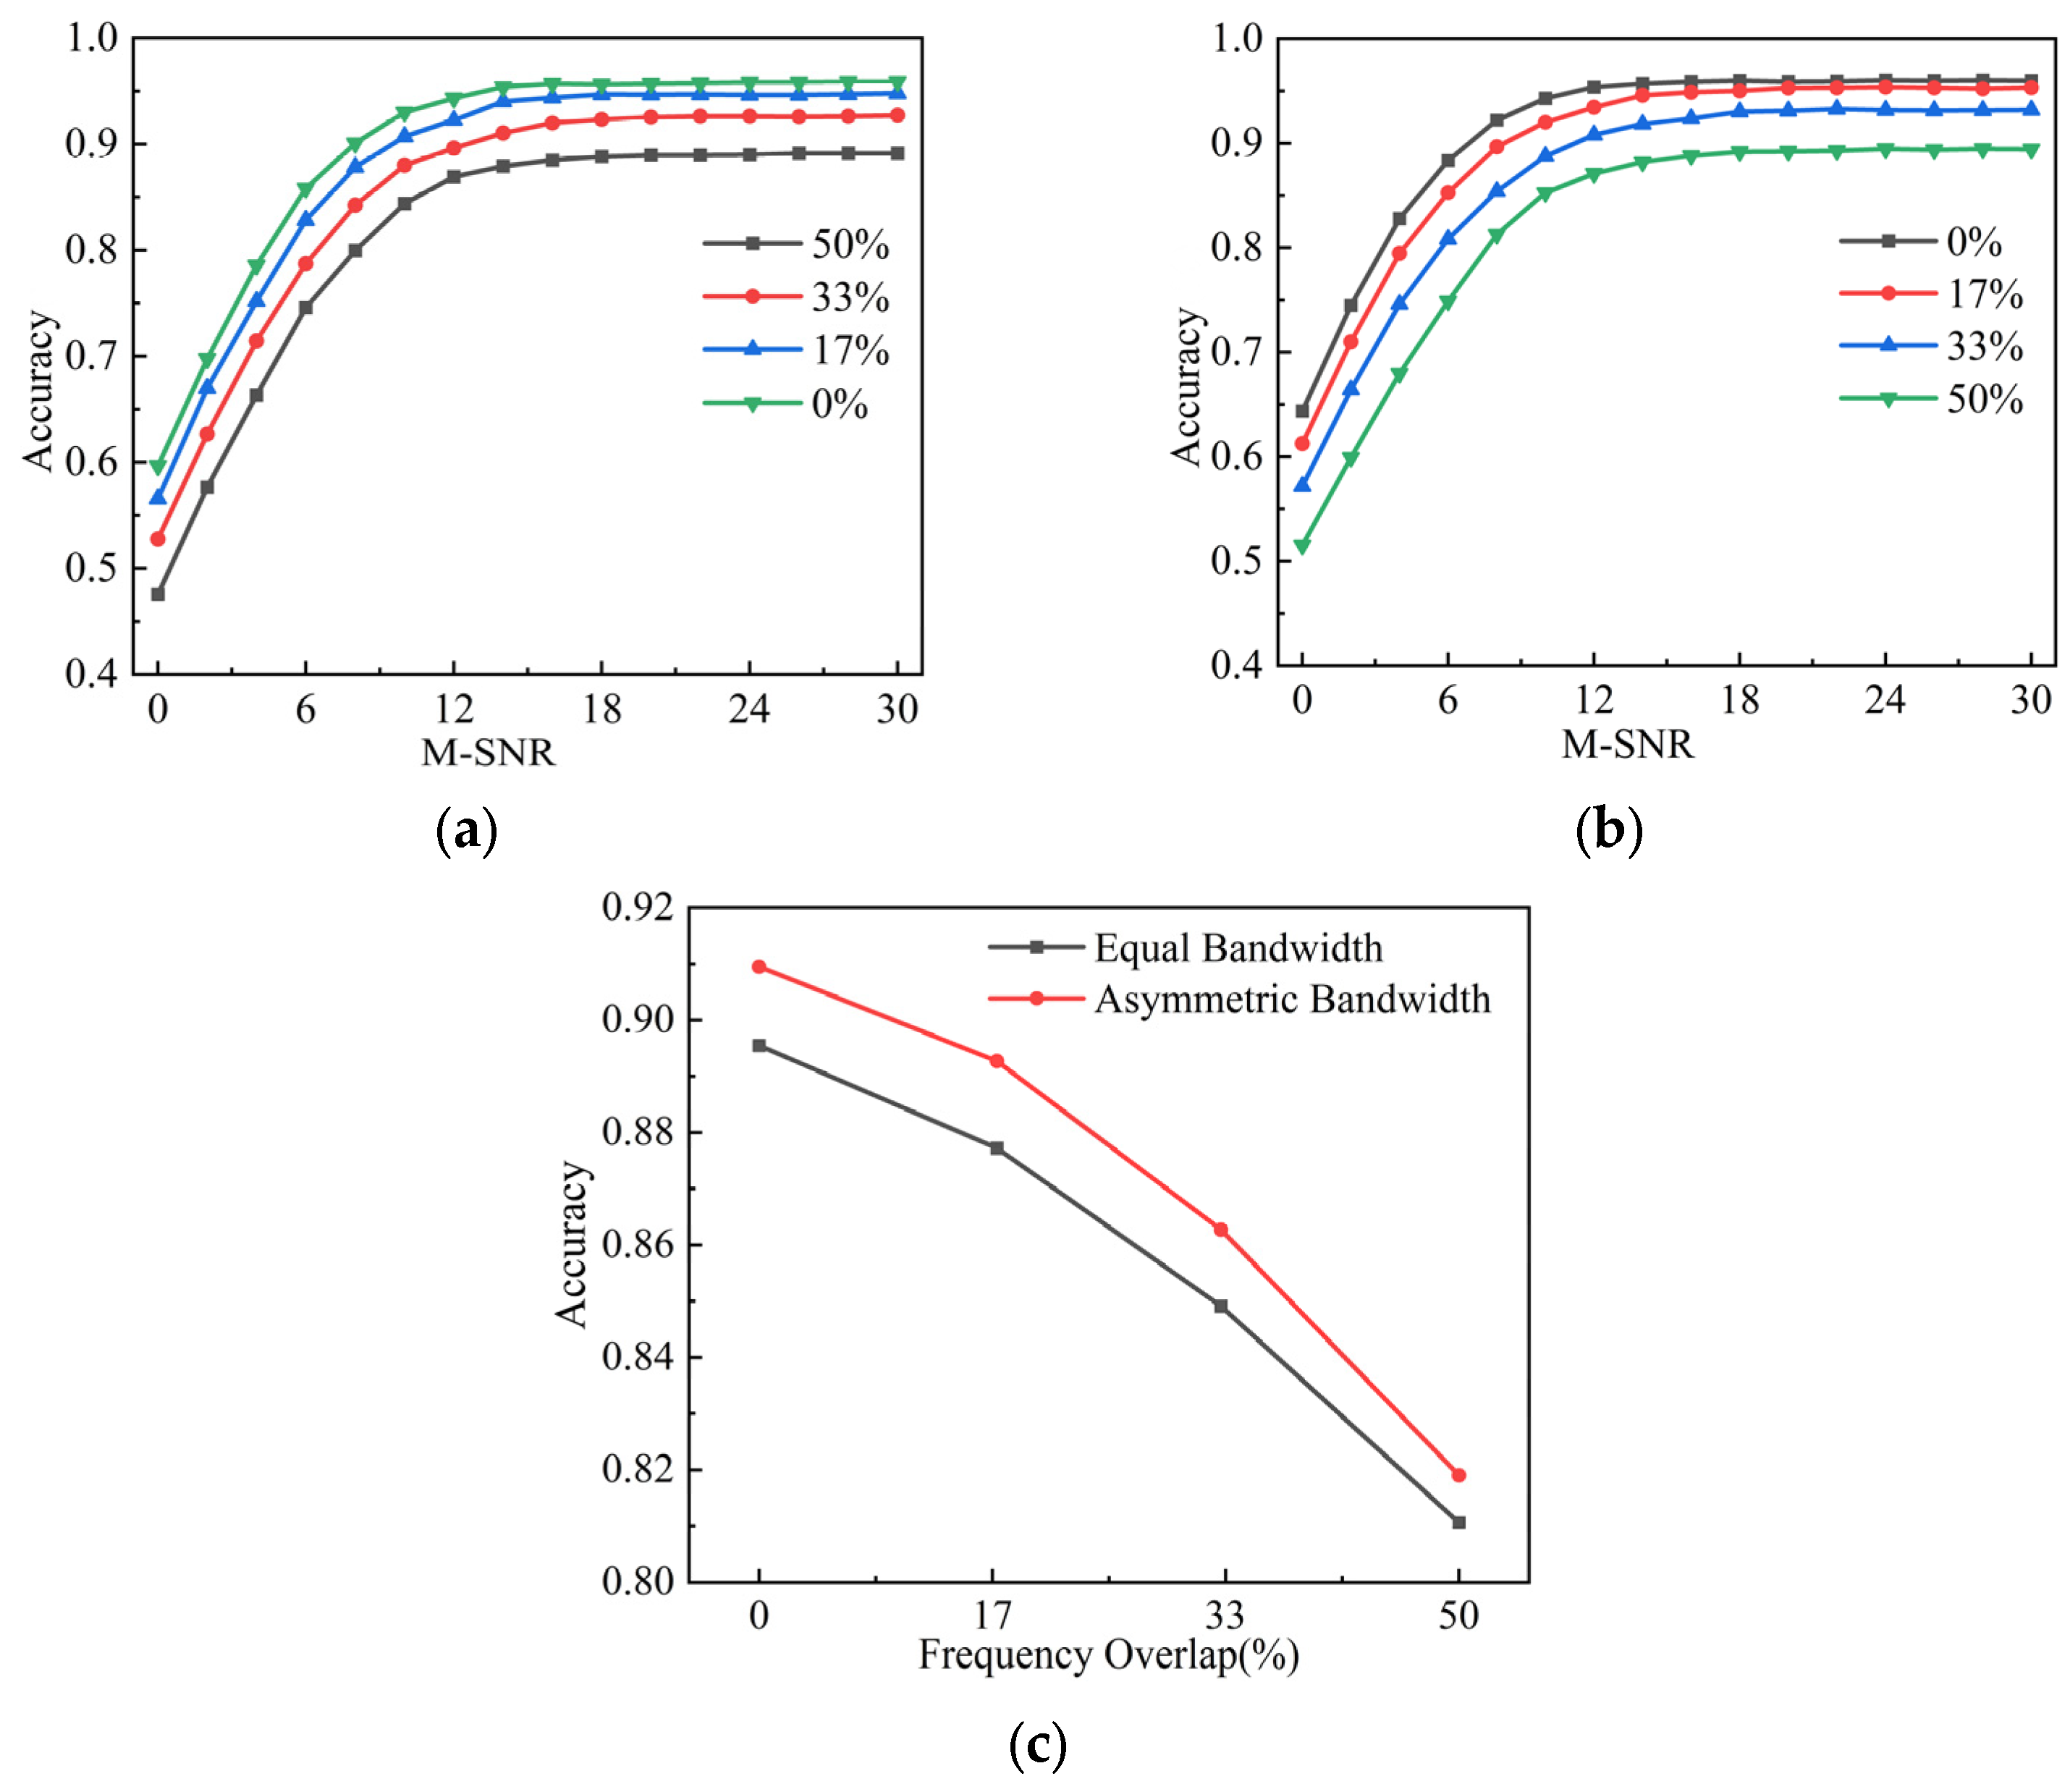
As shown in Figure 4a,b, recognition accuracy improves significantly with increasing M-SNR. Under equal-bandwidth conditions, accuracy stabilizes above 88.49% when M-SNR ≥ 14 dB. Across the M-SNR range [0 dB, 30 dB], higher frequency overlap (γ) leads to reduced accuracy, with the average recognition rate at 50% overlap being about 8.49% lower than that at 0% overlap.
Notably, under asymmetric-bandwidth conditions (Figure 4c), recognition accuracy is approximately 1.3% higher than under equal-bandwidth scenarios. This aligns with the improved separation performance observed in Figure 3b, confirming that better signal separation positively impacts recognition. These results collectively validate the effectiveness of the proposed “separation–recognition” framework in co-channel environments, particularly under challenging conditions with low SNR and significant band overlap.

4.1.3. Comparative Analysis

To evaluate the performance of the proposed method, comparative experiments were conducted for both the separation and recognition stages, using the dataset from Simulation Experiment 1.
(1) Separation Stage Comparison
To evaluate the effectiveness of the proposed separation method, we compared the adaptive spectrum partitioning + FastICA approach with two conventional blind source separation algorithms—EEMD + FastICA and wavelet decomposition + FastICA—under identical experimental conditions. The correlation coefficient was adopted as the performance metric. As shown in Figure 5a, the proposed method significantly outperforms both traditional approaches across the M-SNR range of [0 dB, 30 dB].
In both bandwidth overlap scenarios, the proposed method achieved an average correlation coefficient of 0.8759, exceeding EEMD + FastICA (0.6291) by 0.2468 and wavelet decomposition + FastICA (0.7461) by 0.1298, demonstrating more consistent separation performance. In high-SNR conditions (M-SNR ≥ 10 dB), the correlation coefficient of the proposed method further stabilized above 0.8772, while EEMD + FastICA and wavelet decomposition + FastICA attained only 0.5717 and 0.7445, respectively. This indicates that the proposed approach achieves higher separation accuracy under favorable signal conditions.
Even under strong noise interference in the low M-SNR range [0 dB, 10 dB], the proposed method maintained an average correlation coefficient of 0.7762, outperforming wavelet decomposition + FastICA by 0.1538 and highlighting its superior noise robustness. These results confirm that the proposed adaptive spectrum partitioning + FastICA method is highly feasible for blind separation of communication signals, maintains performance advantages across varying noise levels, and offers a more reliable solution for signal separation in complex channels.
(2) Comparison of Recognition Stages
The “Separation-then-Recognition” (StR) scheme was compared with End-to-end Recognition (EtR) approaches employing IC-AMCNet, CLDNN2, and MCLDNN as baseline models. Both schemes were evaluated using the same mixed-signal dataset from Simulation Experiment 1, randomly split into training, validation, and test sets at a 5:2:3 ratio. As shown in Figure 5b, the StR scheme achieves an 11.32 percentage-point improvement in recognition rate over the optimal EtR baseline within the low M-SNR range [0 dB, 10 dB], maintaining a 4.6 percentage-point advantage when M-SNR exceeds 10 dB. This performance gain primarily stems from the separation stage’s effective recovery of source signals, which substantially reduces recognition difficulty. In contrast, the EtR scheme suffers from severe degradation in its joint feature space when directly processing mixed signals under low-SNR conditions. These results demonstrate the viability and robustness of the separation-then-recognition methodology in challenging signal environments.
(3) Network Performance Comparison
Based on the separated signals from Experiment 1 (corresponding to BPSK, QPSK, 8PSK, 16QAM, and 32QAM modulation types), the recognition performance of our proposed method was compared with IC-AMCNet, CLDNN2, and MCLDNN on an identical test set. As summarized in Table 3 and illustrated in Figure 5c, the proposed algorithm achieves an average recognition rate of 84.91% across the M-SNR range [0 dB, 30 dB], exceeding the best baseline (MCLDNN, 82.72%) by 2.19 percentage points. This performance advantage is more pronounced in low-SNR conditions ([0 dB, 10 dB]), where the proposed method outperforms MCLDNN by 5.43 percentage points. These results demonstrate the synergistic effectiveness of the prior knowledge guidance mechanism, multi-scale convolutional structure, and dynamic attention module in enhancing feature representation and overall recognition performance.

4.1.4. Ablation Study

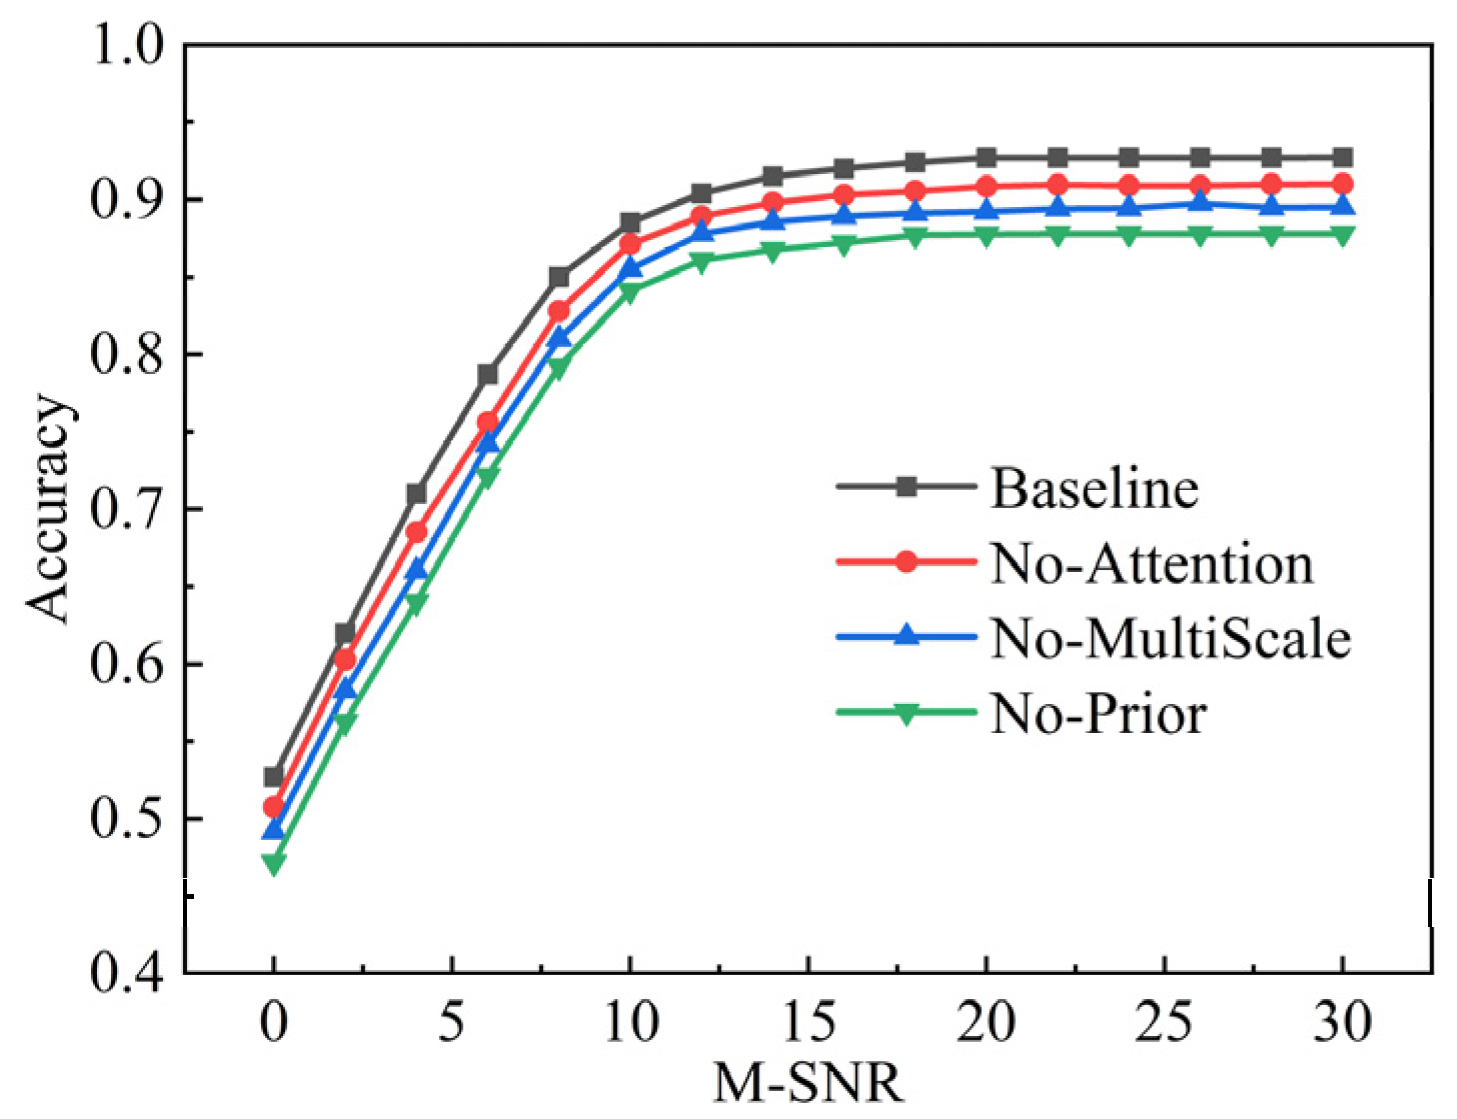
To quantitatively evaluate the individual contributions of the three core components—multi-scale feature extraction, attention mechanisms, and prior knowledge fusion—we designed three ablation variants based on the baseline model. All models used identical datasets (from Simulation Experiment 2) and hyperparameters.
The ablation variants include:
  • No-MultiScale: Replaces the multi-scale convolution with a single-scale (7 × 1) kernel to validate the importance of multi-scale temporal feature capture.
  • No-Attention: Removes the channel and spatial attention modules, using direct feature propagation instead, to evaluate the role of attention in key feature selection.
  • No-Prior: Discards the prior knowledge branch, using only deep learning features, to assess the contribution of physical priors to model generalization.
As shown in Figure 6, the results quantitatively demonstrate each component’s contribution:
Multi-scale feature extraction proved critical for capturing temporal patterns. Its removal (No-MultiScale) reduced the average recognition accuracy by 3.3 percentage points over the entire [0 dB, 30 dB] SNR range, with a more substantial drop of 4 percentage points in the low-SNR region [0 dB, 10 dB].
The attention mechanism significantly improved feature selection. Ablating this module (No-Attention) led to an average accuracy decrease of 1.8 percentage points, as the model lost the ability to adaptively focus on critical transient signal regions.
Prior knowledge integration provided essential guidance, particularly in noisy environments. Removing the prior knowledge branch (No-Prior) caused the most significant performance drop in the low-SNR range [0 dB, 10 dB], at 5.8 percentage points, highlighting the value of physical semantics in boosting robustness.
The ablation studies quantitatively demonstrate the complementary contributions of the three core components. Prior knowledge integration proves most critical for robustness in low-SNR conditions, with its removal causing the most substantial performance degradation (5.8 percentage points). Multi-scale feature extraction provides significant performance gains across the entire SNR range, particularly enhancing temporal pattern capture in adverse channel conditions. The attention mechanism, while offering more modest improvements, consistently contributes to feature selection throughout the SNR spectrum. These findings validate the synergistic design combining physical guidance with deep learning techniques for resilient signal recognition.

4.2. USRP-Based Real-World Experimental Validation

To validate the proposed separation–recognition framework under complex outdoor conditions, we conducted field experiments on a 50 × 100 m sports ground. The test environment emulated single-channel reception of mixed signals under real-world impairments including noise, multipath interference, and environmental obstructions. Two transmitters were deployed to generate modulated signals (BPSK, QPSK, 8PSK, 16QAM, 32QAM) with configurable carrier frequencies, covering both equal-bandwidth (0.2 MHz) and asymmetric-bandwidth (0.2/0.4 MHz) scenarios.
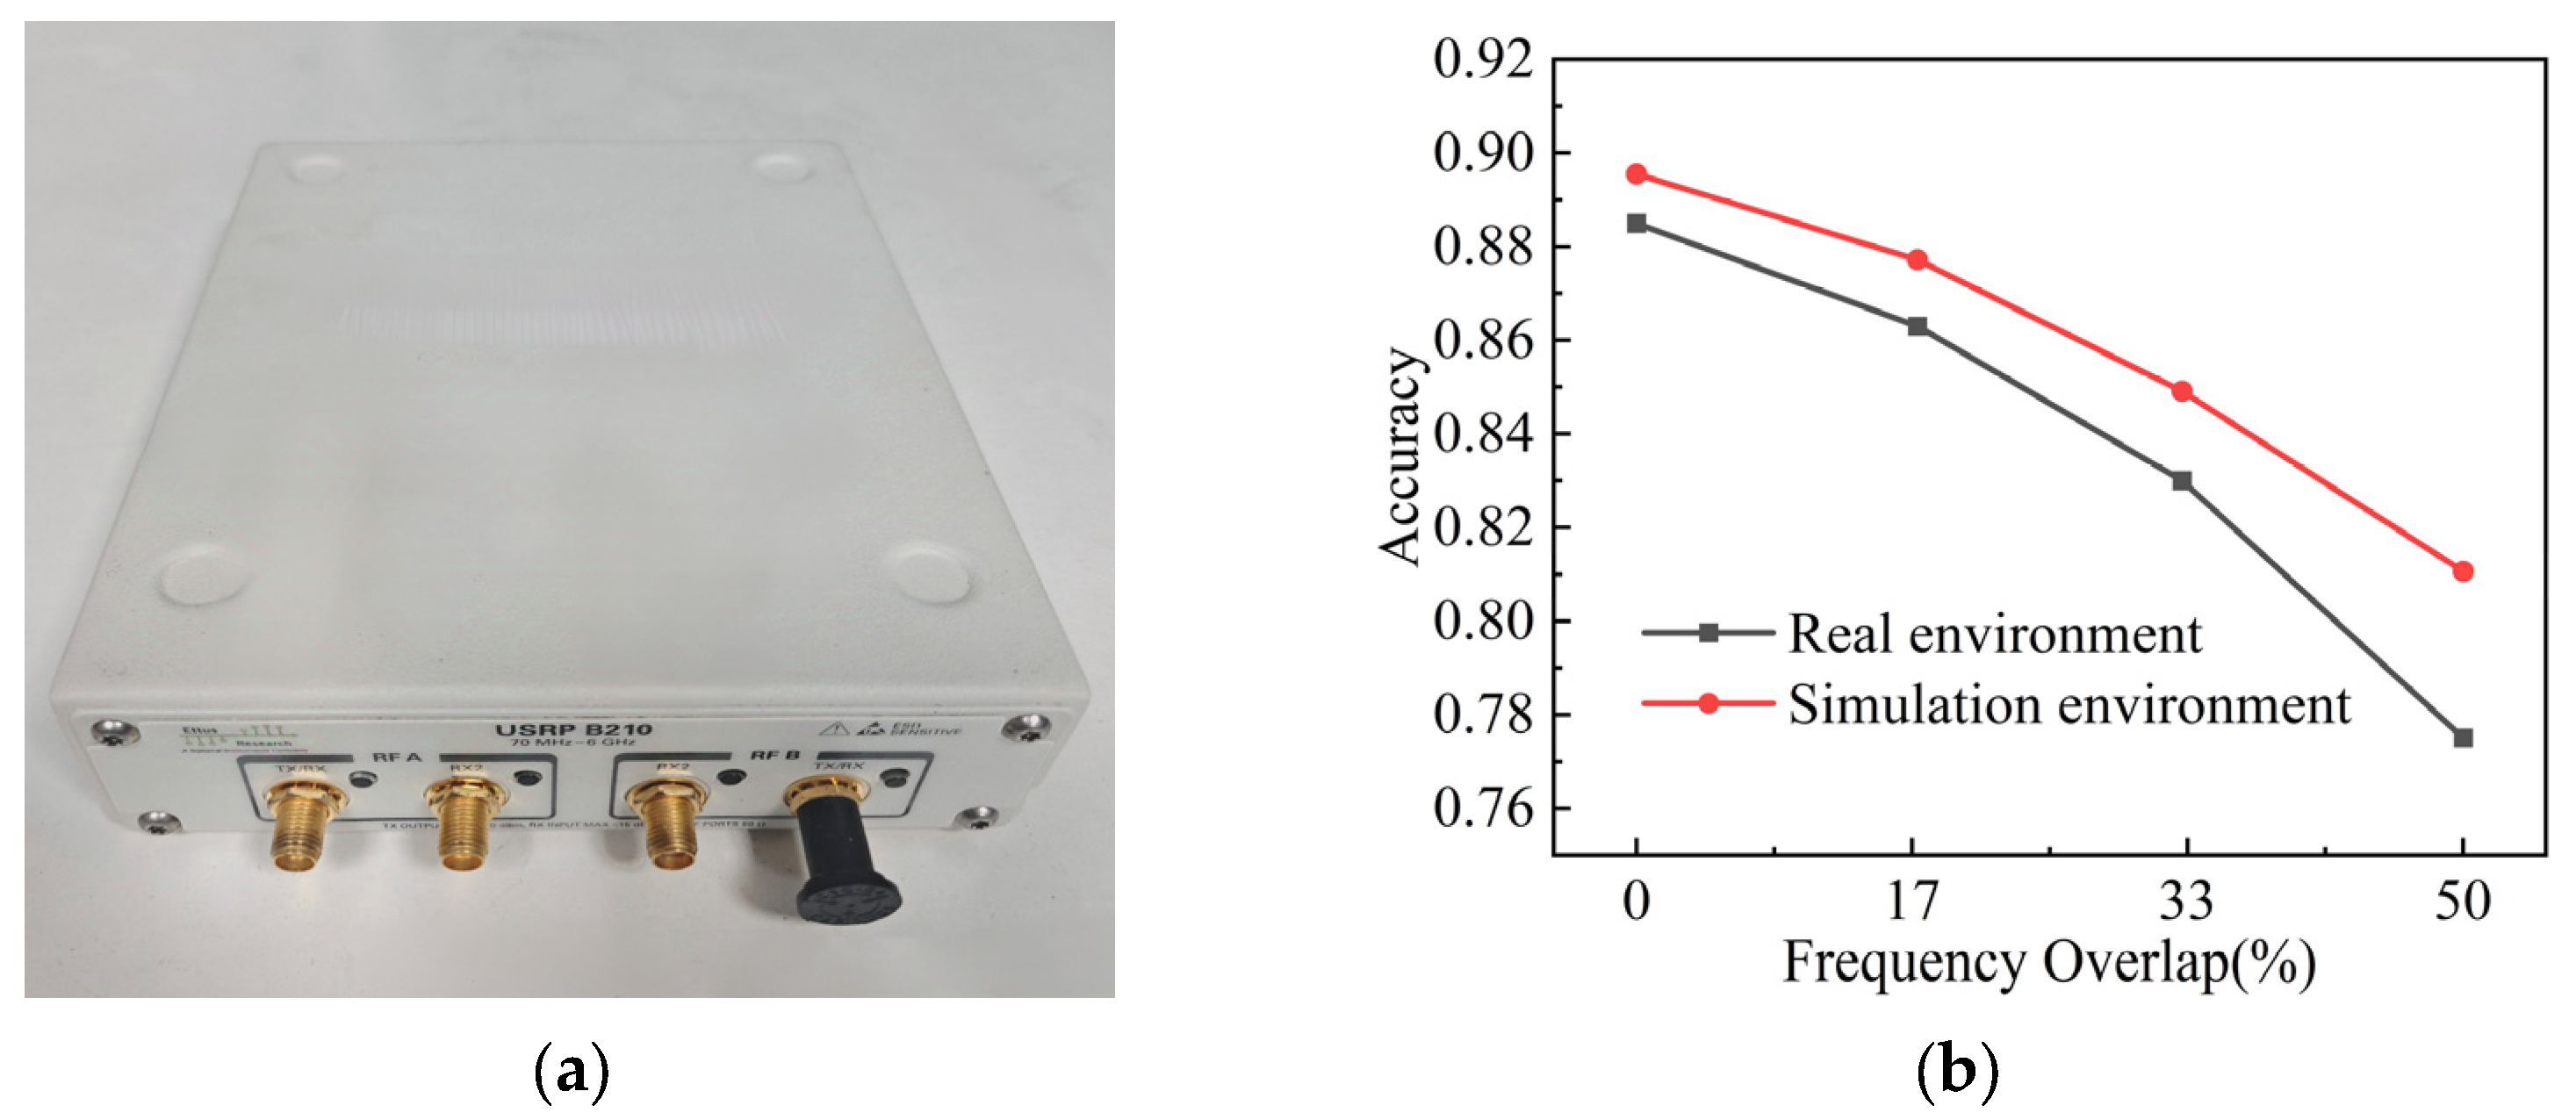
The experimental setup is depicted in Figure 7a. This experiment investigated the coupled effect of bandwidth differences and spectral overlap on recognition performance in an open outdoor environment. As spectral overlap increased, the recognition rate declined from 88.5% to 77.5%. Due to environmental interference and signal attenuation in the outdoor setting, the overall recognition rate was 2.36 percentage points lower than that in Simulation Experiment 2 (Figure 4b). Despite this decrease, the observed performance trends were consistent with the simulation results, demonstrating the framework’s applicability and robustness in realistic complex scenarios.

5. Conclusions

This paper introduced a collaborative “separation–recognition” framework to tackle the challenge of single-channel mixed-signal recognition under spectral overlap and limited data. The core of our approach lies in three innovations: an adaptive spectrum partitioning strategy based on energy detection for effective signal separation, a novel recognition method that synergistically combines prior knowledge with deep learning feature extraction, and a phased feature processing framework for handling heterogeneous prior knowledge features and temporal dependencies.
Comprehensive experiments validated the framework’s superiority. The separation module outperformed traditional methods, achieving an average correlation coefficient of 0.876. The recognition network attained an average accuracy of 88.54%, exceeding the best baseline by 2.93 percentage points, with ablation studies confirming the individual contributions of each component. Real-world USRP tests further demonstrated the framework’s practicality and robustness in complex electromagnetic environments.
Future work will extend the framework to handle more overlapping signals and explore its real-time implementation on embedded platforms.

Author Contributions

Conceptualization, Z.T. and T.F.; methodology, Z.T., T.F. and X.W.; validation, Z.T.; writing—original draft preparation, Z.T., X.W. and Y.Z.; writing—review and editing, Z.T., T.F. and Y.Z. All authors have read and agreed to the published version of the manuscript.

Funding

This work was supported by the National Natural Science Foundation of China, The fund number is 42174051, and the person in charge is LI Wenkui.

Data Availability Statement

The original contributions presented in this study are included in the article. Further inquiries can be directed to the corresponding author and the first author.

Acknowledgments

We thank the editor and the anonymous reviewers for their constructive comments that helped to improve our work.

Conflicts of Interest

Author Xi Wu was employed by the company Power Investment (Qingdao) Investment Development Co. The remaining authors declare that the research was conducted in the absence of any commercial or financial relationships that could be construed as a potential conflict of interest.

Abbreviations

The following abbreviations are used in this manuscript:
AMCAutomatic Modulation Classification
FastICAFast Independent Component Analysis
M-SNRMixed Signal-to-Noise Ratio

References

  1. Xu, S.; Zhang, D.; Lu, Y.; Xing, Z.; Ma, W. MCCSAN: Automatic Modulation Classification via Multiscale Complex Convolution and Spatiotemporal Attention Network. Electronics 2025, 14, 3192. [Google Scholar] [CrossRef]
  2. Suman, P.; Qu, Y. A Lightweight Deep Learning Model for Automatic Modulation Classification Using Dual-Path Deep Residual Shrinkage Network. AI 2025, 6, 195. [Google Scholar] [CrossRef]
  3. Cai, J.; Guo, Y.; Cao, X. Automatic Radar Intra-Pulse Signal Modulation Classification Using the Supervised Contrastive Learning. Remote Sens. 2024, 16, 3542. [Google Scholar] [CrossRef]
  4. Ren, B.; Teh, K.C.; An, H.; Gunawan, E. Automatic Modulation Recognition of Dual-Component Radar Signals Using ResSwinT-SwinT Network. IEEE Trans. Aerosp. Electron. Syst. 2023, 59, 6405–6418. [Google Scholar] [CrossRef]
  5. Zhou, Q.; Zhang, R.; Zhang, F.; Jing, X. An Automatic Modulation Classification Network for IoT Terminal Spectrum Monitoring under Zero-Sample Situations. EURASIP J. Wirel. Commun. Netw. 2022, 2022, 35. [Google Scholar] [CrossRef]
  6. Gharib, A.; Ejaz, W.; Ibnkahla, M. Distributed Spectrum Sensing for IoT Networks: Architecture, Challenges, and Learning. IEEE Internet Things Mag. 2021, 4, 66–73. [Google Scholar] [CrossRef]
  7. Kumar, A.; Kumar, K. Multiple Access Schemes for Cognitive Radio Networks: A Survey. Phys. Commun. 2019, 38, 100953. [Google Scholar] [CrossRef]
  8. Liu, Y.; Yang, L.-L.; Hanzo, L. Joint User-Activity and Data Detection for Grant-Free Spatial-Modulated Multi-Carrier Non-Orthogonal Multiple Access. IEEE Trans. Veh. Technol. 2020, 69, 11673–11684. [Google Scholar] [CrossRef]
  9. Zaerin, M.; Seyfe, B. Multiuser modulation classification based on cumulants in additive white Gaussian noise channel. IET Signal Process. 2012, 6, 815–823. [Google Scholar] [CrossRef]
  10. Deng, W.; Wang, X.; Huang, Z. Co-Channel Multiuser Modulation Classification Using Data-Driven Blind Signal Separation. IEEE Internet Things J. 2024, 11, 14829–14843. [Google Scholar] [CrossRef]
  11. Yin, Z.; Zhang, R.; Wu, Z.; Zhang, X. Co-Channel Multi-Signal Modulation Classification Based on Convolution Neural Network. In Proceedings of the 2019 IEEE 89th Vehicular Technology Conference (VTC2019-Spring), Kuala Lumpur, Malaysia, 28 April–1 May 2019. [Google Scholar]
  12. Luo, W.; Yang, R.; Jin, H.; Li, X.; Li, H.; Liang, K. Single channel blind source separation of complex signals based on spatial-temporal fusion deep learning. IET Radar Sonar Navig. 2023, 17, 200–211. [Google Scholar] [CrossRef]
  13. Ma, H.; Zheng, X.; Yu, L.; Zhou, X.; Chen, Y. A Novel End-to-End Deep Separation Network Based on Attention Mechanism for Single Channel Blind Separation in Wireless Communication. IET Signal Process. 2023, 17, e12173. [Google Scholar] [CrossRef]
  14. Zhu, M.; Li, Y.; Pan, Z.; Yang, J. Automatic Modulation Recognition of Compound Signals Using a Deep Multi-Label Classifier: A Case Study with Radar Jamming Signals. Signal Process. 2020, 169, 107393. [Google Scholar] [CrossRef]
  15. Hou, X.; Gao, Y. Single-Channel Blind Separation of Co-Frequency Signals Based on Convolutional Network. Digit. Signal Process. 2022, 129, 103654. [Google Scholar] [CrossRef]
  16. Cai, X.; Wang, X.; Huang, Z.; Wang, F. Single-Channel Blind Source Separation of Communication Signals Using Pseudo-MIMO Observations. IEEE Commun. Lett. 2018, 22, 1616–1619. [Google Scholar] [CrossRef]
  17. Zhang, K.; Xu, E.L.; Feng, Z. PFS: A Novel Modulation Classification Scheme for Mixed Signals. In Proceedings of the 2017 IEEE 28th Annual International Symposium on Personal, Indoor, and Mobile Radio Communications (PIMRC), Montreal, QC, Canada, 8–13 October 2017. [Google Scholar]
  18. Cai, X.; Deng, W.; Yang, J.; Huang, Z. Recurrent Neural Network Based Single-Input/Multi-Output Demodulator for Cochannel Signals. IEEE Commun. Lett. 2023, 27, 2378–2382. [Google Scholar] [CrossRef]
  19. Huang, S.; Yao, Y.; Wei, Z.; Feng, Z.; Zhang, P. Automatic Modulation Classification of Overlapped Sources Using Multiple Cumulants. IEEE Trans. Veh. Technol. 2017, 66, 6089–6101. [Google Scholar] [CrossRef]
  20. Hyvärinen, A.; Oja, E. Independent Component Analysis: Algorithms and Applications. Neural Netw. 2000, 13, 411–430. [Google Scholar] [CrossRef]
  21. Yan, M.; Chen, L.; Hu, W.; Sun, Z.; Zhou, X. Secure and Intelligent Single-Channel Blind Source Separation via Adaptive Variational Mode Decomposition with Optimized Parameters. Sensors 2025, 25, 1107. [Google Scholar] [CrossRef]
  22. Sun, X.; Li, C.; Li, J.; Su, Q. Kernel-FastICA-Based Nonlinear Blind Source Separation for Anti-Jamming Satellite Communications. Sensors 2025, 25, 3743. [Google Scholar] [CrossRef]
  23. Zhu, Z.; Chen, X.; Lv, Z. Underdetermined Blind Source Separation Method Based on a Two-Stage Single-Source Point Screening. Electronics 2023, 12, 2185. [Google Scholar] [CrossRef]
  24. Xu, J.; Luo, C.; Parr, G.; Luo, Y. A spatiotemporal multi-channel learning framework for automatic modulation recognition. IEEE Wirel. Commun. Lett. 2020, 9, 1629–1632. [Google Scholar] [CrossRef]
  25. Liu, X.; Yang, D.; El Gamal, A. Deep neural network architectures for modulation classification. In Proceedings of the 2017 51st Asilomar Conference on Signals, Systems, and Computers, Pacific Grove, CA, USA, 29 October–1 November 2017; pp. 915–919. [Google Scholar]
  26. West, N.E.; O’shea, T. Deep architectures for modulation recognition. In Proceedings of the 2017 IEEE International Symposium on Dynamic Spectrum Access Networks (DySPAN), Baltimore, MD, USA, 6–9 March 2017; pp. 1–6. [Google Scholar]
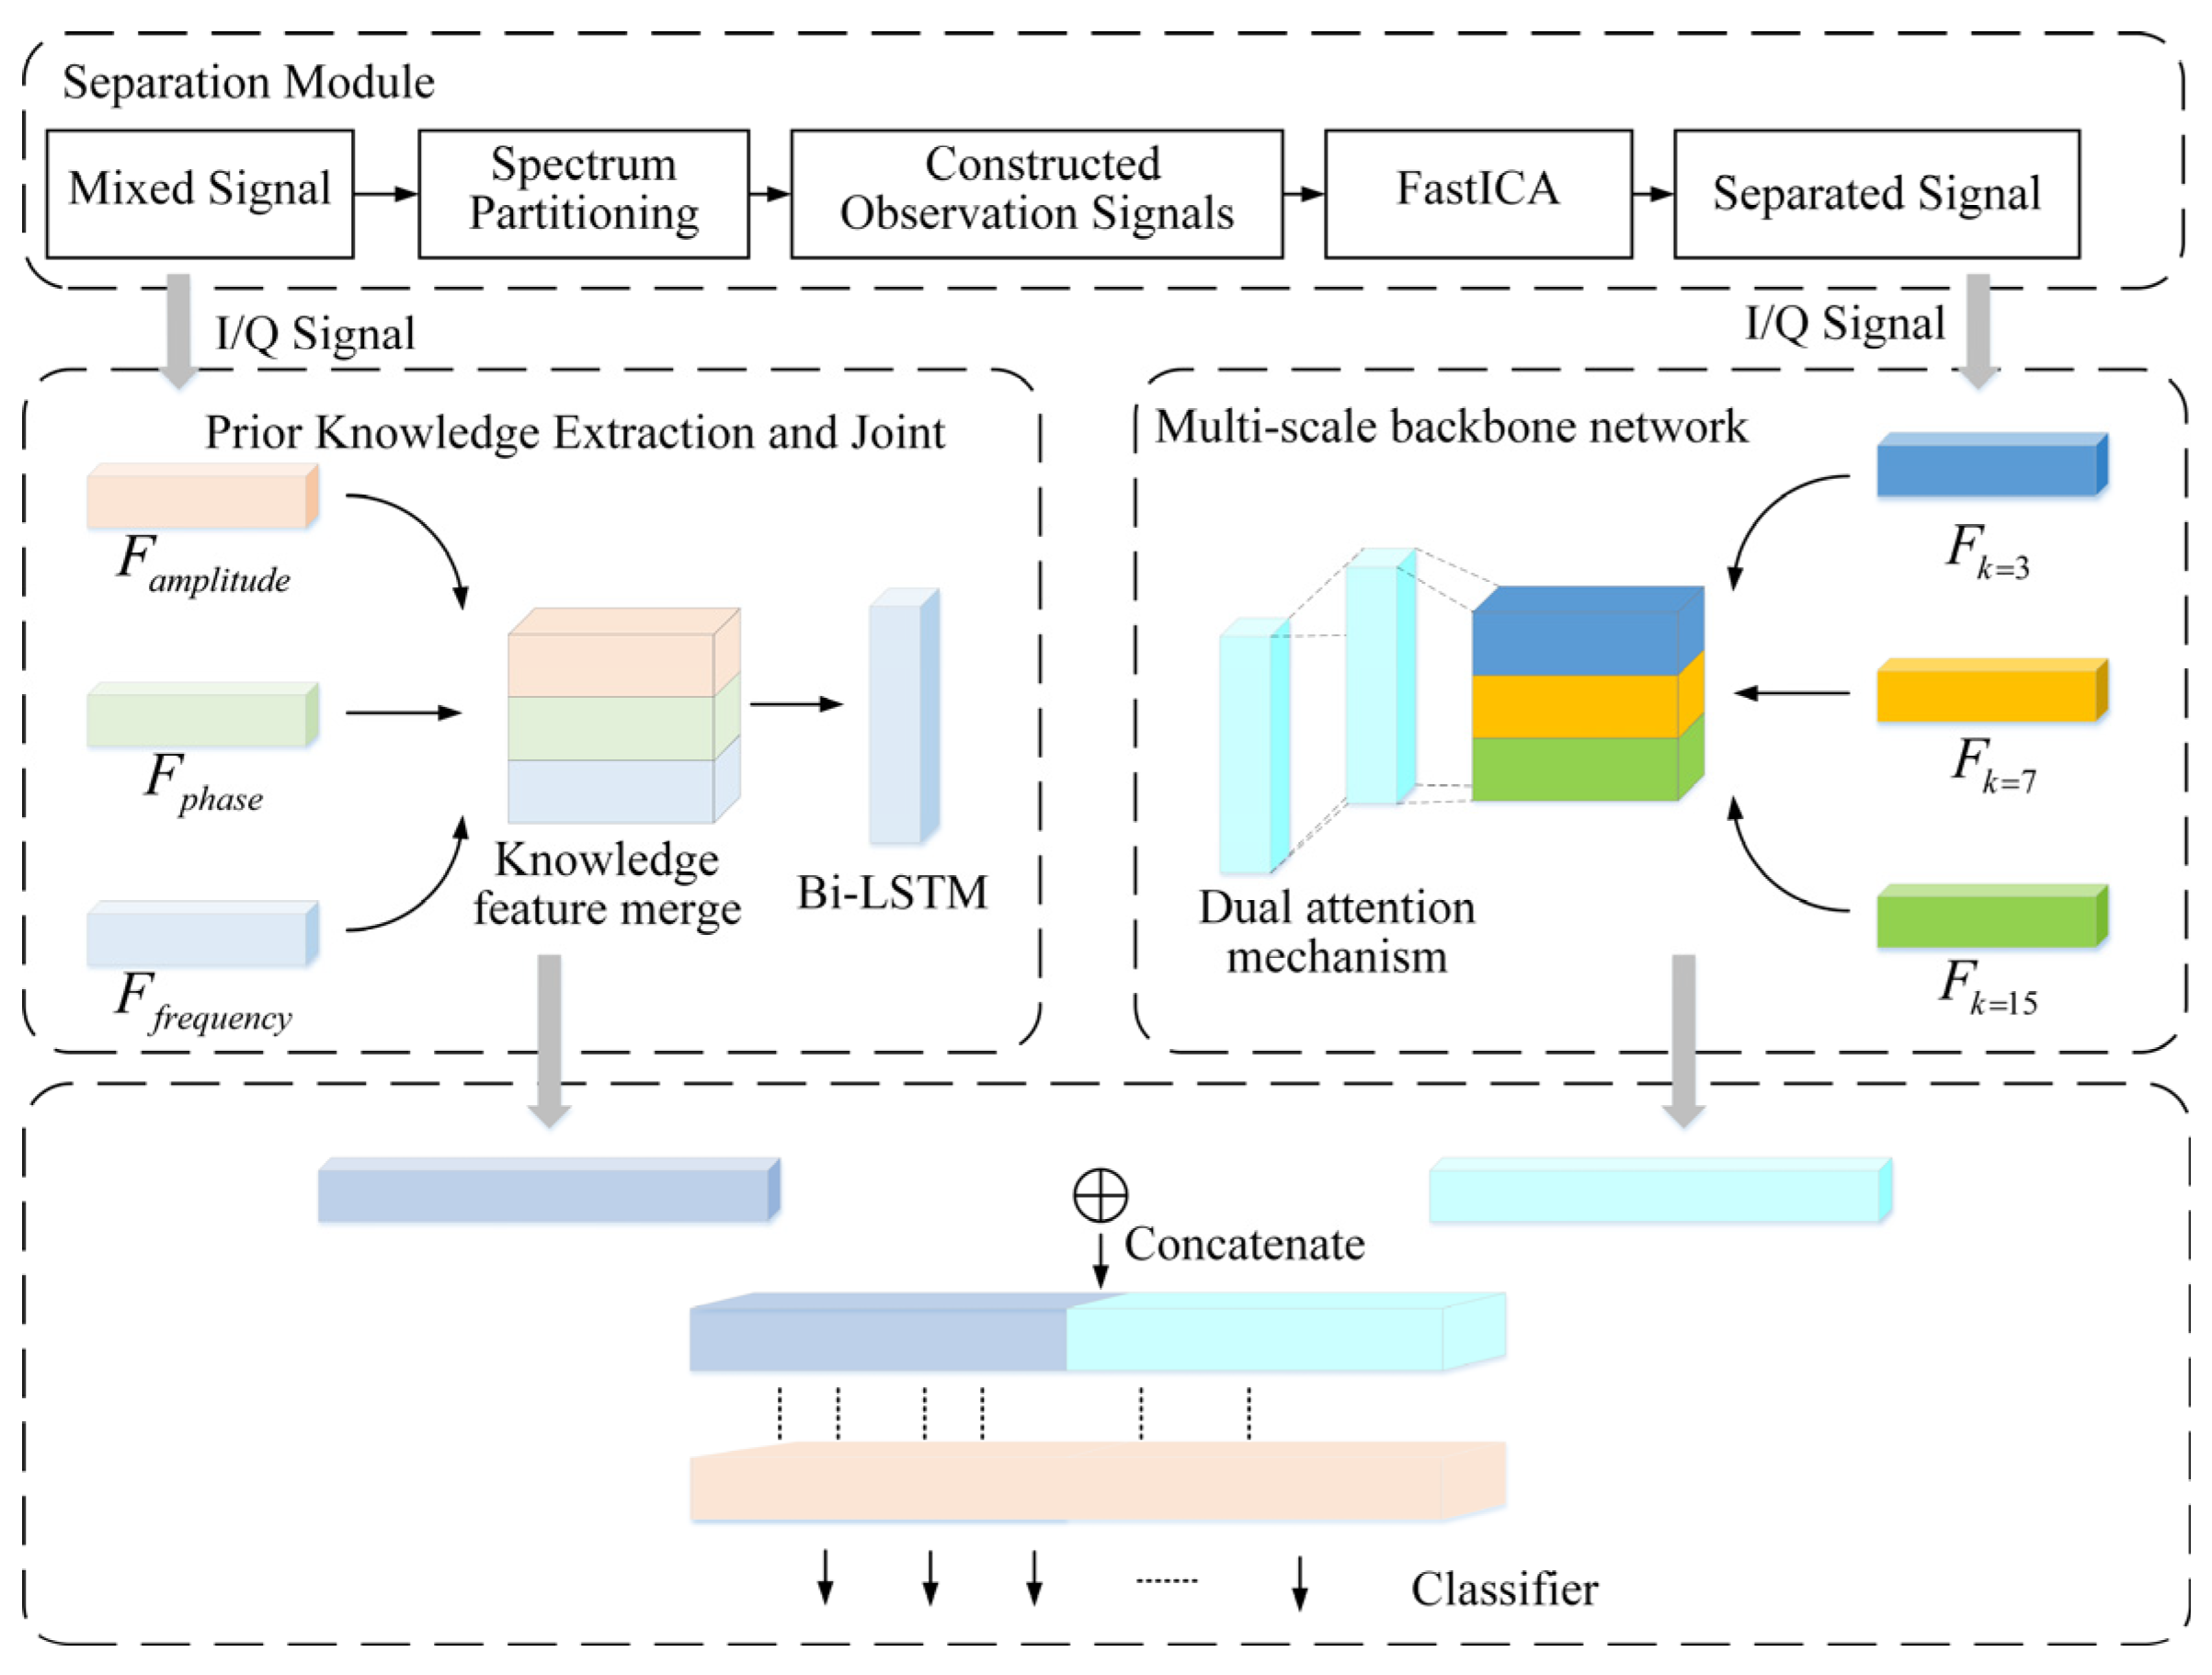
Figure 1. System Model Framework.
Electronics 14 04103 g001
Figure 2. Schematic of the spectrum partitioning framework. (a) The underlying principle of the partitioning method. (b) Interrelationships among sub-bands under different signal overlapping scenarios.
Electronics 14 04103 g002
Figure 3. Waveform separation quality under different conditions: (a) Separation correlation coefficient at different bandwidths; (b) Separation correlation coefficient under different spectral overlap degrees.
Electronics 14 04103 g003
Figure 4. Modulation type recognition accuracy under different conditions: (a) Recognition accuracy of different spectral overlap degrees under the equal bandwidth (0.2 MHz) and mixed signal-to-noise ratio; (b) Recognition accuracy under asymmetric bandwidth (0.2 MHz/0.4 MHz) and different overlap ratios; (c) Recognition accuracy varying with spectral overlap under different bandwidth configurations.
Electronics 14 04103 g004
Figure 5. Performance comparison under different experimental conditions: (a) Separation performance of different methods; (b) Recognition accuracy of different schemes; (c) Recognition accuracy of different schemes after signal separation.
Electronics 14 04103 g005
Figure 6. Ablation Experiment.
Electronics 14 04103 g006
Figure 7. Experimental verification of the actual environment in a complex electromagnetic environment based on USRP: (a) USRP B210 hardware platform for mixed-signal acquisition; (b) Recognition accuracy under bandwidth configuration under different spectrum overlap conditions.
Electronics 14 04103 g007
Table 1. The network architecture.
ModuleLayerOutput
Output LayerPrior KnowledgeAmplitude
Phase
Frequency
(None, 1024, 1)
(None, 1024, 1)
(None, 1024, 1)
Contrast FeatureFeature(None, 64)
Prior Knowledge Extraction and JointFeature ExtractionConv1D (each feature) + ReLU
MaxPool1D
Reshape
(None, 1024, 32) × 3
(None, 512, 32) × 3
(None, 1, 512, 32) × 3
Prior Knowledge JointConcatenate
Conv1D + ReLU
Reshape
BiLSTM (return sequences)
BiLSTM (return last)
Fully Connected
(None, 1, 512, 96)
(None, 1, 508, 96)
(None, 508, 96)
(None, 508, 128)
(None, 128)
(None, 64)
Multi-scale Feature ExtractionParallel BranchesConv1D (kernel = 3) + BN + GELU
Conv1D (kernel = 7) + BN + GELU
Conv1D (kernel = 15) + BN + GELU
Weighted concatenation
Conv1D expansion (3 × 3)
Conv1D reduction (1 × 1)
Adaptive average pooling
Dual attention mechanism
(None, 1024, 16)
(None, 1024, 16)
(None, 1024, 16)
(None, 1024, 48)
(None, 1024, 64)
(None, 1024, 48)
(None, 16, 48)
(None, 16, 48)
Feature FusionFeature ConcatenatePrior feature expansion
Concatenate with multi-scale features
(None, 16, 64)
(None, 16, 112)
FusionConv1D (1 × 1) + BN + GELU(None, 16, 128)
ClassifierGlobal adaptive average pooling
Dense(96) + BN + SeLU + Dropout(0.3)
Dense(64) + GELU + Dropout(0.2)
Dense(N_classes)
(None, 128)
(None, 96)
(None, 64)
(None, N_classes)
Total parameter 294,992
Table 2. Frequency Band Overlap Scenario Parameter Configuration.
ScenarioBandwidth (MHz)Center Carrier Frequency fc2 (Overlap Ratioγ), fc1 = 5 MHz
Equal
Bandwidth
BW1 = BW2 = 0.3fc2(MHz)5.305.255.205.25
γ0%16.7%33.3%50%
Asymmetric Bandwidth fc2(MHz)5.455.405.355.30
BW1 = 0.3γ0%16.7%33.3%50%
BW2 = 0.6γ0%8.3%16.7%25%
Table 3. Classification performance of different classification methods.
MethodAvg. Acc.Max. AccF1-ScoreFLOPsParam
IC-AMCNet [24]0.80370.88520.8050118,746,8881,260,171
CLDNN2 [25]0.81550.89170.8120235,270,852513,803
MCLDNN [26]0.82720.90640.8250143,094,448402,230
Proposed0.84910.92710.846071,124,800294,992
Disclaimer/Publisher’s Note: The statements, opinions and data contained in all publications are solely those of the individual author(s) and contributor(s) and not of MDPI and/or the editor(s). MDPI and/or the editor(s) disclaim responsibility for any injury to people or property resulting from any ideas, methods, instructions or products referred to in the content.