Article

A Crop Growth Information Collection System Based on a Solar Insecticidal Lamp

1
College of Artificial Intelligence, Nanjing Agricultural University, Nanjing 210095, China
2
School of Engineering, University of Lincoln, Lincoln LN6 7TS, UK
3
Institute of Agricultural Information Technology, Henan Academy of Agricultural Sciences, Zhengzhou 450002, China
4
College of Mechanical Engineering, Anhui Science and Technology University, Chuzhou 233100, China
*
Authors to whom correspondence should be addressed.
Electronics 2025, 14(2), 370; https://doi.org/10.3390/electronics14020370
Submission received: 21 November 2024 / Revised: 10 January 2025 / Accepted: 14 January 2025 / Published: 18 January 2025

Abstract

:
To overcome the challenges during the crop growth process, e.g., pest infestation, inadequate environmental monitoring, and poor intelligence, this study proposes a crop growth information collection system based on a solar insecticidal lamp. The system comprises two primary modules: (1) an environmental information collection module, and (2) a multi-view image collection module. The environmental information collection module acquires crucial parameters, e.g., temperature, relative humidity, light intensity, soil conductivity, nitrogen, phosphorus, potassium content, and pH, by means of various sensors. Simultaneously, the multi-view image collection module employs three industrial cameras to capture images of the crop from the top, left, and right perspectives. The system is developed on the ESP32-S3 platform. WiFi-Mesh wireless communication technology is adopted to achieve high-frequency, real-time data transmission. Additionally, visualization software has been developed for real-time data display, data storage, and dynamic curve plotting. Field verification indicates that the proposed system effectively meets the requirements of pest control and crop growth information collection, which provides substantial support for the advancement of smart agriculture.

1. Introduction

During the growth and production phases of crops, fluctuations in environmental factors, e.g., temperature, relative humidity, light intensity, and soil conditions, significantly disrupt their development. In most cases, it is challenging for growers to detect these fluctuations in a timely manner. Various crops have long life cycles and rely on warm, humid climates, which create favorable conditions for the proliferation of pests and diseases. These threats pose a direct risk to crop quality and yield. Therefore, timely pest and disease management is essential for the protection of crops. Among these, the prevention of pests and diseases is more critical than their treatment. In this context, solar insecticidal lamps (SILs) have emerged as an environmentally friendly and efficient tool for pest control. Real-time monitoring of environmental parameters during crop growth contributes to (1) accurately predicting and controlling pests and diseases, and (2) enhancing crop quality and yield. This paper presents a system based on an SIL platform that integrates the crop growth environment information collection and image collection functions, which is conducive to achieving the integration of crop growth environment monitoring and pest control.
The earliest insecticidal lamps primarily utilized black-light lamps, which emitted long-wave ultraviolet rays (UV-A) and a small amount of visible light. Consequently, they were also known as UV-A lamps, which were widely used in pest control from the 1960s to the 1980s. In the early 1990s, frequency-vibration insecticidal lamps significantly expanded the range and number of pests that could be trapped, surpassing the effectiveness of UV-A lamps. This advancement marked the beginning of the “Frequency-Vibration Insecticidal Lamp Era”. During this period, frequency-vibration LED insecticidal lamps were gradually introduced, effectively attracting and eliminating specific pests through multispectral technology. However, the energy output of traditional insecticidal lamps is constrained by the capacity of their batteries. Around the year 2000, the emergence of SILs overcame this limitation. Since then, SILs have driven the development of insecticidal lamps and become the mainstream direction of current research and application [1]. Figure 1 shows the development history of insecticidal lamps.
Since the 21st century, an increasing number of researchers have focused on the intelligence of SILs, promoting novel directions for SILs. For instance, Qiu et al. [3] designed a “star network” consisting of multiple types of insecticidal lamps and deployed it around fish ponds. This system utilized radar positioning technology to accurately locate flying insects and specific lights to trap them, significantly improving the efficiency and accuracy of pest control. Tu et al. [4] designed an LED-based multispectral SIL, which used different wavelengths of light to trap and kill specific insect species. Compared with the traditional single-wavelength-based SILs, this system could effectively control pests, e.g., rice leaf rollers and rice planthoppers, reducing the pesticide usage and enhancing the economic benefits of agricultural production. Ma et al. [5] proposed a remote-controlled SIL system combined with a wireless sensor network, which provided efficient insect control, monitored the surrounding environment, and uploaded real-time data for pest management. Although this system optimized the traditional SIL scheme, its optimization scheme was not elaborated in detail. Cao [6] designed a wind-suction intelligent SIL system, which integrated composite light lure, composite color lure, and composite sex lure technology to attract pests. This system could adjust its working mode based on environmental conditions. Zhu [7] proposed an IoT-enabled SIL solution to address maintenance and repair challenges during installation and application. This system enabled real-time monitoring and remote control of SILs, significantly improving maintenance efficiency, reducing labor costs, and enhancing reliability. Yang [8] applied NB-IoT technology and SILs to realize remote control and status monitoring of the SILs, which greatly reduced manual labor and enhanced operational efficiency. Wang [9] designed an improved SIL with an expanded spectrum to attract more pests. This scheme achieved an effective killing rate exceeding 85% while minimizing harm to beneficial insects. Han et al. [10] studied the application of fan-suction-based SILs in cornfields and found that the Asian corn borer could be controlled within a 60 m radius, although further studies are required to assess their impact on other pests. Additionally, Zhang et al. [11] combined IoT technology with camera image capture to adjust the working time of the insecticidal lamps in real time, improving pest control efficiency. Wang et al. [12] designed an IoT-based plant protection insecticidal lamp system, which could automatically control the color of the plant protection lamps to achieve accurate and efficient trapping of different categories of insects. Users could monitor the lamps and surrounding environment in real time via an app, increasing the operational efficiency. However, the study did not elaborate on its experimental methodology. Table 1 lists the current application status of cameras in solar insecticidal lamp systems.
In addition to researchers, some companies have also targeted the application prospects of SILs in “smart agriculture” and “unmanned farms”. They actively upgraded existing products to expand their functions. Several technically mature SIL products have been launched, and Table 2 outlines the key technical features of these products.
As shown in Table 2, current research and products related to SILs primarily focus on improving insect trapping efficiency, diminishing energy consumption, and optimizing overall performance. However, scholarly inquiries and industry developments have exhibited a paucity of exploration of amalgamating environmental information acquisition with crop growth surveillance. Therefore, there exists a compelling need to integrate environmental information collection with crop growth monitoring. By combining SILs with crop growth monitoring systems, it becomes possible to achieve comprehensive data collection and real-time transmission of growth information. Such integration allows for effective pest control and precise regulation of the crop growth environment.

1.1. Analysis of Agri-Environmental Information Collection Studies

Modern environmental information collection technologies primarily include sensor, remote sensing, geographic information system (GIS), and big data analytics technologies. These advanced techniques have significantly improved the accuracy, precision, efficiency, and reliability of environmental data collection. These platforms utilize a variety of sensors and remote sensing techniques to monitor environmental conditions and contribute to analyzing crop growth in real time. These platforms provide scientific decision support for agricultural production, thereby attracting considerable interest among researchers. For instance, Liang [13] designed an environmental monitoring and early warning system based on the STC89C52RC microcontroller (STCmicro Technology Co., Ltd., Beijing, China.). This system is capable of real-time surveillance of environmental parameters during vegetable cultivation. If the monitored data exceed the set threshold, the system will issue an early warning and automatically adjust the environmental conditions to ensure optimal crop quality. In 2018, López-Martínez et al. [14] designed a web-based system for real-time monitoring of greenhouse parameters, e.g., temperature, humidity, carbon dioxide concentration, and light intensity. This system uploads the information to a database for analysis using multi-node data fusion. Similarly, Foughali et al. [15] developed an IoT-based crop disease prediction system that gathers climate data to predict pest growth environments and formulate preventive measures. In addition, Wang et al. [16] used drones to collect agricultural information to build a visual agricultural detection system. In 2019, Kochhar et al. [17] summarized the application of sensors in environmental monitoring, addressing topics such as crop layout, wireless communication technology, and sensor node deployment, which provided practical guidance for predictive models and agricultural decision-making. In 2020, Wang [18] designed a low-power agricultural environment wireless collection system that monitored key crop growth factors in real time. Data management and analysis of this system were facilitated through an Android platform, which contributes to conveniently monitoring crop conditions via smartphones. Table 3 shows the current research status of agricultural environmental information collection systems and analyzes whether these systems include image collection functions and growth information collection functions.

1.2. Analysis of Crop Growth Information Collection Studies

Research on crop growth information collection has been gradually increasing. In contrast to environmental data collection that focuses on the physiology and growth status of the crop and its interaction with the environment, crop growth information collection concentrates on extracting the growth characteristics and phenotypic data of the crop itself. Such information includes, but is not limited to, the leaf area, stem height, chlorophyll content, and plant health of crops. Compared with the macro-monitoring of environmental information (e.g., temperature and humidity, light intensity, and soil conditions), crop growth information is more microscopic and individualized, involving the integration and analysis of diverse data types. For example, image processing technology is used to track changes in crop appearance, while spectral instruments can assess the crops’ nutritional status. Near-infrared (NIR) techniques can be used to detect the internal health of plants. This domain is rapidly advancing toward automation and intelligence, leveraging artificial intelligence (AI), IoT, and big data technologies to achieve comprehensive monitoring and precise management of crop growth. By collecting and analyzing growth parameters, researchers can accurately understand crop development dynamics, optimize crop management strategies, and ultimately enhance both yield and quality. Consequently, the collection of crop growth information provides critical data support for ensuring healthy crop development. It also lays the foundation for the evolution of smart agriculture and unmanned farms, promoting agricultural production that is smarter, more efficient, and sustainable. For example, Luo [19] developed the CGMD302 crop growth monitor using modern agricultural environmental data collection technology, which collects key growth parameters, e.g., leaf area, leaf dry weight, and nitrogen content, in real time while constructing a spectral monitoring model to analyze crop growth and health accurately. Xu [20] utilized CMOS image sensors and RFID to collect and monitor corn growth images. The CMOS image sensor captures image data during corn growth in real time and records in detail the changes in the appearance of corn at different growth stages. RFID is used to monitor key growth parameters, achieving accurate tracking of corn growth information. Finally, a growth information collection module is realized to integrate the corn weight and image. Zhou [21] used the WOFOST crop model to simulate winter wheat growth by combining UAV image with predictive modeling techniques. The LAI inversion model was used to compare against actual production volume assimilation results, which improved the accuracy of the winter wheat production estimates. Zhou [22] conducted comprehensive phenotypic research on wheat with hyperspectral imaging to segment the types of wheat seeds and a Raspberry Pi equipped with a water content sensor to detect the water content of the leaves of wheat. Pictures of the wheat canopy were taken simultaneously with a drone and a cell phone to collect phenotypic information about the whole process of wheat growth. Wang [23] used hyperspectral imaging to collect phenotypic information about rice rhizomes and established a quantitative relationship model for the root morphological parameters, e.g., root length, surface area, total volume, and number of root tips and branches. Pan [24] used a harvesting robot equipped with an HT SUA502-T camera (Shenzhen Huateng Vision Technology Co., Ltd., Shenzhen, China.) to capture images of wheat growth. Then, MATLAB 2020b was used to process these images to achieve refined plant counting and wheat rust identification. Li et al. [25] used a HUAWEI P30 mobile phone (Huawei Technologies Co., Ltd., Shenzhen, China.) to take 360-degree photographs of maize seedlings. Then, the plant height and leaf circumference were manually measured. Finally, three-dimensional reconstruction of the captured images was performed to extract phenotypic data concerning the maize seedlings. In 2021, Wang et al. [26] introduced the application of the FluorSpec system on UAVs. The system identified the near-canopy of potato and sugar beet plants during the growing season and tracked the diurnal chlorophyll fluorescence changes. In 2023, Nipuna et al. [27] developed an edge-computing-enabled camera-based crop monitoring system, which integrated Raspberry Pi and Arduino for image processing, and LoRa for communication, to realize canopy segmentation, crop classification, growth stage recognition, plant counting, weed counting and plant type recognition. In the same year, Kindie et al. [28] investigated the Crop Regional Agricultural Forecasting Toolbox (CRAFT), which uses spatially variable soil, weather, maize hybrid, and crop management data for crop yield prediction and integrates seasonal climate prediction with crop yield prediction. In 2024, Song et al. [29] designed an IoT-based based intelligent greenhouse control system that monitors the environmental conditions via sensors and uploads data to a cloud platform, which contributes to optimizing the crop growth process. Table 4 shows the characteristics of the current research on crop growth information collection systems.
As shown in Table 4, existing research on crop growth information collection primarily focuses on three types of data: environmental parameters, plant physiological data, and image data. However, none of these studies simultaneously collect both environmental data and image data, leading to fragmented information acquisition. More importantly, although previous studies have employed image sensors, UAVs, and hyperspectral instruments for crop growth monitoring, none have integrated an active pest control mechanism. These studies primarily serve monitoring purposes without providing real-time pest management solutions. Additionally, UAVs and hyperspectral instruments are costly, making them impractical for large-scale, long-term deployment and continuous monitoring in real-world agricultural settings. Given these limitations, a system that integrates pest control, environmental data collection, and crop growth imaging collection is necessary to help the development of smart agricultural solutions.

1.3. Analysis of Soil Information Collection Studies

In the domain of crop growth information collection, early research on soil environments primarily focused on measuring and analyzing the soil moisture content. In recent years, researchers have combined information science and technology with soil environment monitoring to enhance soil quality, which contributes to providing new approaches and technical support for soil environmental studies. Traditional soil parameter detection often relied on radar technology. For instance, a remote soil moisture monitoring and forecasting system utilized an embedded ARM processor to collect soil moisture and temperature data, enabling real-time monitoring and remote forecasting via a GPRS network [30]. In 2013, Qin et al. [31] used ground-penetrating radar (GPR) to monitor the distribution of near-surface soil moisture in the Gurbantunggut Desert. By using high-frequency GPR equipment, this scheme scanned the study area several times to obtain electromagnetic wave reflection data and analyze the spatial distribution characteristics of the soil moisture content based on these reflectance data. In the same year, Tan [32] designed a wireless transmission monitoring system for soil moisture, which can collect ambient temperature and soil moisture information and realize real-time GPS-based positioning. The system transmits information via Bluetooth and displays the data information on a lower-level computer. In 2014, Xue [33] developed an automated system for collecting soil attributes and conditions to provide farmers with accurate and comprehensive soil quality information, which helps them make informed decisions of crop management and soil conservation. Gao et al. [34] developed a soil monitoring system for the cultivation of traditional Chinese medicinal plants using ZigBee technology. The system collects and analyzes the soil pH and moisture via ZigBee wireless communication, improving the yield and quality of Chinese medicinal plants while reducing the cost and labor intensity of manual soil monitoring methods. Xiao et al. [35] introduced an IoT-based soil moisture detection system capable of continuous long-term monitoring and offering a user-friendly interface for data visualization and control. However, the system still needs further optimization in terms of the sensor performance and data processing capabilities. Qin et al. [36] proposed a multi-channel power consumption acquisition system based on an agricultural soil moisture station. The system adopts a distributed architecture and uses IoT technology for real-time monitoring, energy consumption analysis, and light intensity measurement of agricultural equipment. Cao et al. [37] designed a multi-purpose soil moisture collection device, which can measure various parameters, e.g., soil moisture content, soil temperature, and ambient temperature. The device adopts a slidable detection rod to collect soil samples at different depths and a curved support to protect the collector. Zhu et al. [38] proposed an airborne non-contact near-infrared soil moisture detection system using near-infrared spectroscopy to measure the reflectance spectral characteristics of the soil surface. This system provides non-destructive, rapid and efficient detection of soil moisture with practical effectiveness.
However, the above systems still require optimization and refinement in practical applications to meet different soil monitoring demands. With the development of 5G, wireless communication has made significant progress in soil environment monitoring, overcoming the temporal and spatial limitations of traditional methods. Here, 5G extends the data transmission range and can realize real-time collection and precise analysis of soil data, which significantly improves the monitoring efficiency and accuracy. LoRa offers new possibilities for soil parameter monitoring. Ji et al. [39] designed a multi-parameter soil monitoring system for agricultural fields based on LoRa technology. This system adopts the LoRa-based self-organizing network transmission mode to monitor parameters, e.g., soil temperature, humidity, and nutrient content, in real time. The system improves the transmission success rates and effectively meets the agricultural production needs for soil environment monitoring. Table 5 presents an overview of the recent research on soil monitoring technologies.
The above analysis illustrates that current environmental information collection systems lack the integration of image collection and pest monitoring and control, hindering comprehensive data analysis throughout the entire crop growth cycle. Such drawbacks limit the application of the system across the entire crop growth cycle, especially in key areas, e.g., digital twin, yield prediction, and intelligent regulation. For example, digital twin technology relies on substantial multidimensional data support. However, the current environmental information collection systems are constrained by the types of collected data (no image data type), making it challenging to build a comprehensive digital twin model for crops. Kang et al. [40] emphasized that the use of plant models, predictions, and data-driven and knowledge-based models is effective for simulating and managing crop growth. Additionally, they introduced the concept of a parallel management system, which integrates virtual agricultural systems and computational experiments to simulate crop growth and optimize management strategies—a method that is crucial for digital twin applications. In terms of yield prediction and intelligent control, the absence of full-cycle crop growth data limits the accuracy of predictions for potential issues during growth (e.g., pest outbreaks and environmental parameter anomalies). These factors can lead to suboptimal crop growth and prevent precise control and intervention, which can negatively impact crop yield and quality. Such limitations hinder the intelligence level of agricultural production and weaken the system’s ability to provide decision-making support for crop growth and management. A key solution is to enhance precision agriculture through intelligent monitoring and management systems, as Fri-ha et al. [41] highlighted in their study on IoT-enabled smart agriculture systems. They emphasized that real-time sensor networks and cloud data analytics facilitate precision agriculture practices, boosting yields while reducing environmental impacts. By combining real-time crop monitoring with AI, these systems can issue early warnings of potential threats and drive proactive countermeasures, aligning with the vision of sustainable and autonomous agricultural practices. As future agricultural development moves toward smart farms and unmanned farms, the integration of these technologies will be essential to the future growth of autonomous farming and intelligent agriculture. Therefore, improving environmental information collection systems should involve breakthroughs in data diversity and comprehensiveness, integrating functions for image collection, pest monitoring, and control. This will lay a robust data foundation for building digital twins, supporting crop growth prediction and regulation and providing a basis for scientific decision-making, thereby offering a complete solution for efficient agricultural management.
In conclusion, existing crop growth information collection systems suffer from incomplete data collection and limited functionality. Few studies have integrated pest control, environmental data collection, and image acquisition into a single crop growth information collection system. Moreover, most existing systems collect a limited range of environmental parameters and rely on single-view image acquisition, which constrains their ability to comprehensively monitor crop growth dynamics. In response to the aforementioned limitations, this paper presents a crop growth information collection system based on a solar insecticidal lamp, which integrates pest control, environmental data acquisition, and multi-view image monitoring into a unified system. This system is capable of capturing crop growth images from the top, left, and right views, enabling real-time, efficient, and scalable crop monitoring. Additionally, a visualization platform is developed with functionalities for real-time data display, dynamic plotting of environmental parameter curves, and data storage. By combining hardware and software components, this paper improves the functionality and applicability of crop growth information collection and monitoring. This integrated approach significantly enhances the system’s functionality and broadens its scope of application.

2. System Framework Design and Implementation

2.1. Requirements Analysis and Design Goals

The collection and analysis of crop growth information are crucial in precision agriculture. However, current integrated systems for crop growth information collection are still in the early stages and fail to meet the demands for multi-angle, multi-function, and full-stage monitoring, which is primarily reflected in the following aspects. (1) Environmental data collection: Key parameters, e.g., temperature, relative humidity, light intensity, soil temperature and humidity, soil acidity and alkalinity, soil conductivity, and nitrogen, phosphorus and potassium (NPK) content, in the soil directly affect the growing conditions of crops. Real-time monitoring of these parameters enables timely optimization of irrigation and fertilization strategies to support healthy crop development. (2) Crop growth data monitoring: Crop parameters, e.g., crop height, leaf color, and pests and diseases, are monitored by a multi-perspective approach, which enables accurate assessment of crop health and growth and facilitates targeted management interventions. (3) Supporting visualization software platforms: The platform provides detailed records, query capabilities, and data storage for both environmental information and crop phenotypic information throughout the growth cycle of crops, which is conducive to understanding the dynamics of crop development and providing a solid foundation for decision-making.
Based on the above demand analysis, the design goals of the proposed system are listed as follows:
(1)
Pest information collection module (PICM): When pests approach the metal mesh, the metal mesh will release high-voltage pulses, and the electrocuted insect corpses will fall into the insect storage box. The sound sensor records the number of insects killed by detecting the level changes.
(2)
Environmental information collection module (EICM): Serving as the core platform for collecting environmental data and implementing eco-friendly pest control. It integrates various sensors to monitor conditions, e.g., air temperature and humidity, light intensity, soil temperature and moisture, pH levels, soil conductivity, and the concentrations of nitrogen, phosphorus, and potassium (NPK). This integration supports seamless environmental data acquisition and pest control, contributing to optimal crop growth conditions.
(3)
Multi-view image collection module (MICM): This module is equipped with three cameras positioned to capture images from the left, right, and top views. It enables the collection of full-cycle images of the crop growth process and high-frequency images detailing crop morphological characteristics and growth status. The multi-angle approach improves the accuracy of monitoring the crop height, leaf color, and pest and disease conditions.
(4)
Visualization software: LabVIEW software (LabVIEW 2022 32-bit) is used to display the collected data in the form of continuous statistical graphs, visually illustrating trends in the air temperature, humidity, light intensity, and soil parameters. This comprehensive visualization aids in monitoring and analyzing fluctuations in crop growth data throughout the growth process.
Additionally, to ensure real-time monitoring of system reliability and simplify subsequent maintenance, the EICM includes an INA219 power detection chip. This chip collects the voltage and current of the circuit board, metal mesh, insecticide lamp, and solar panels. However, as this component is not directly related to plant growth information, it will not be further discussed in this paper.

2.2. System Framework Design

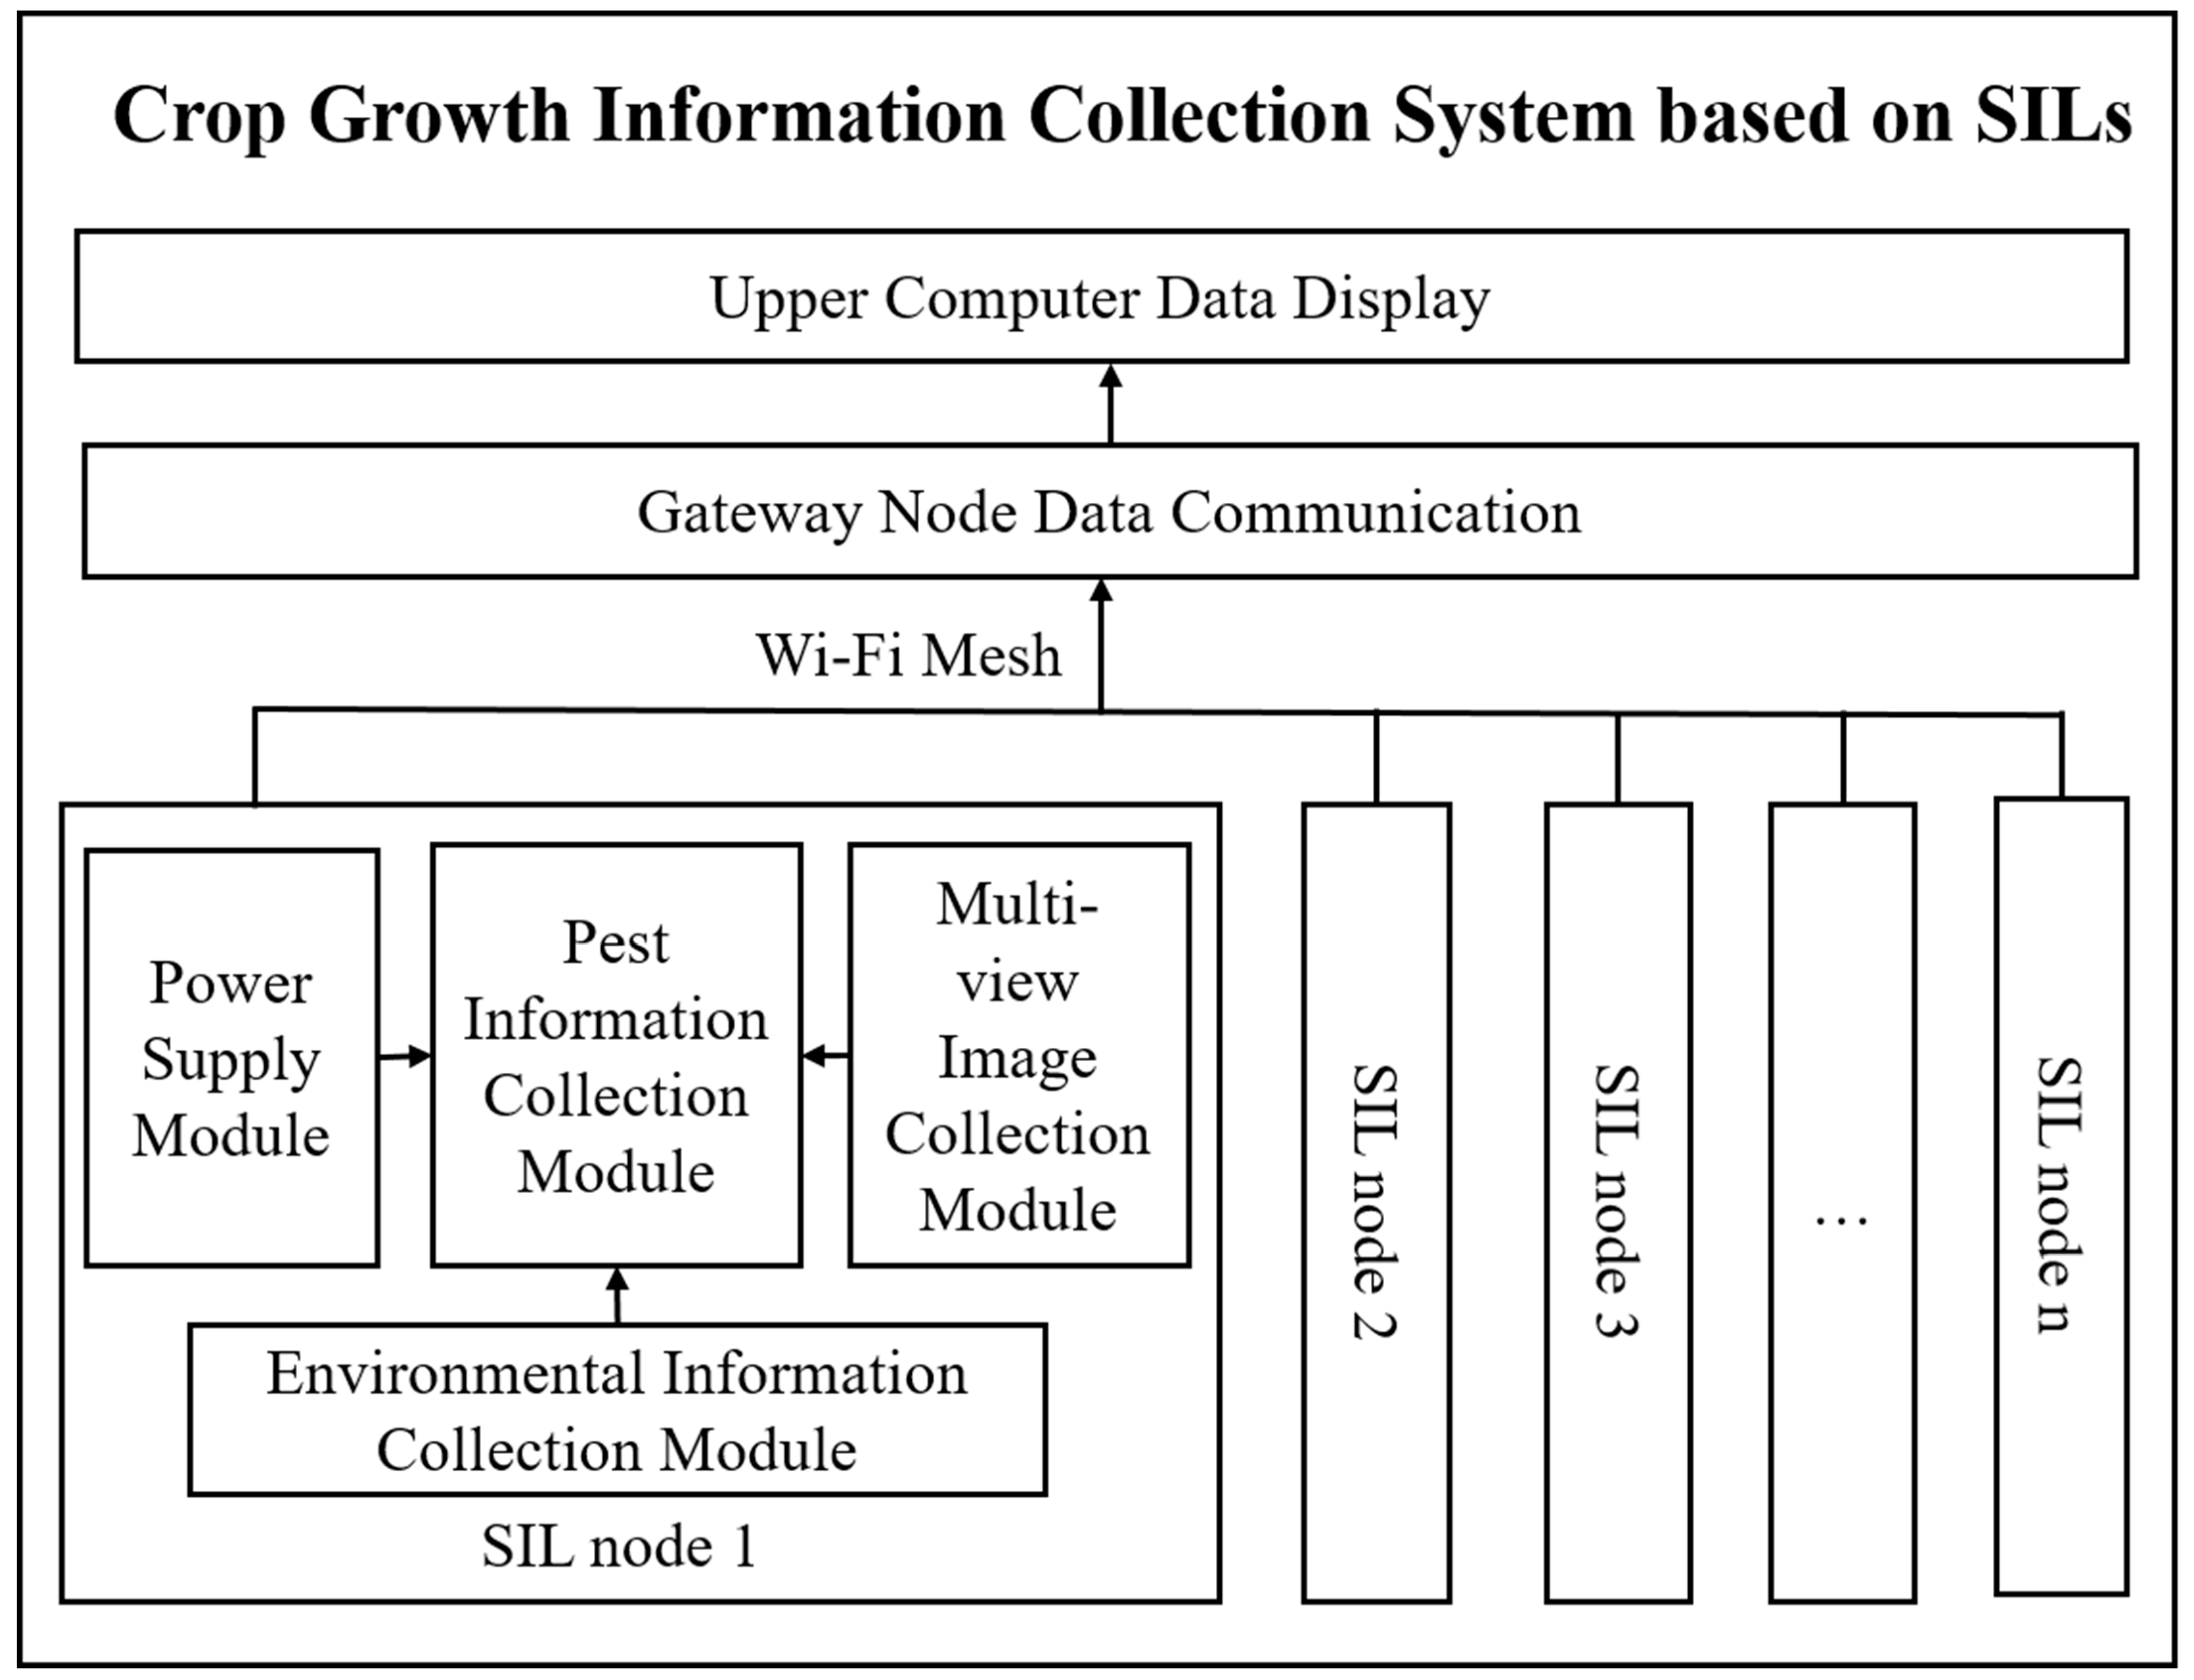
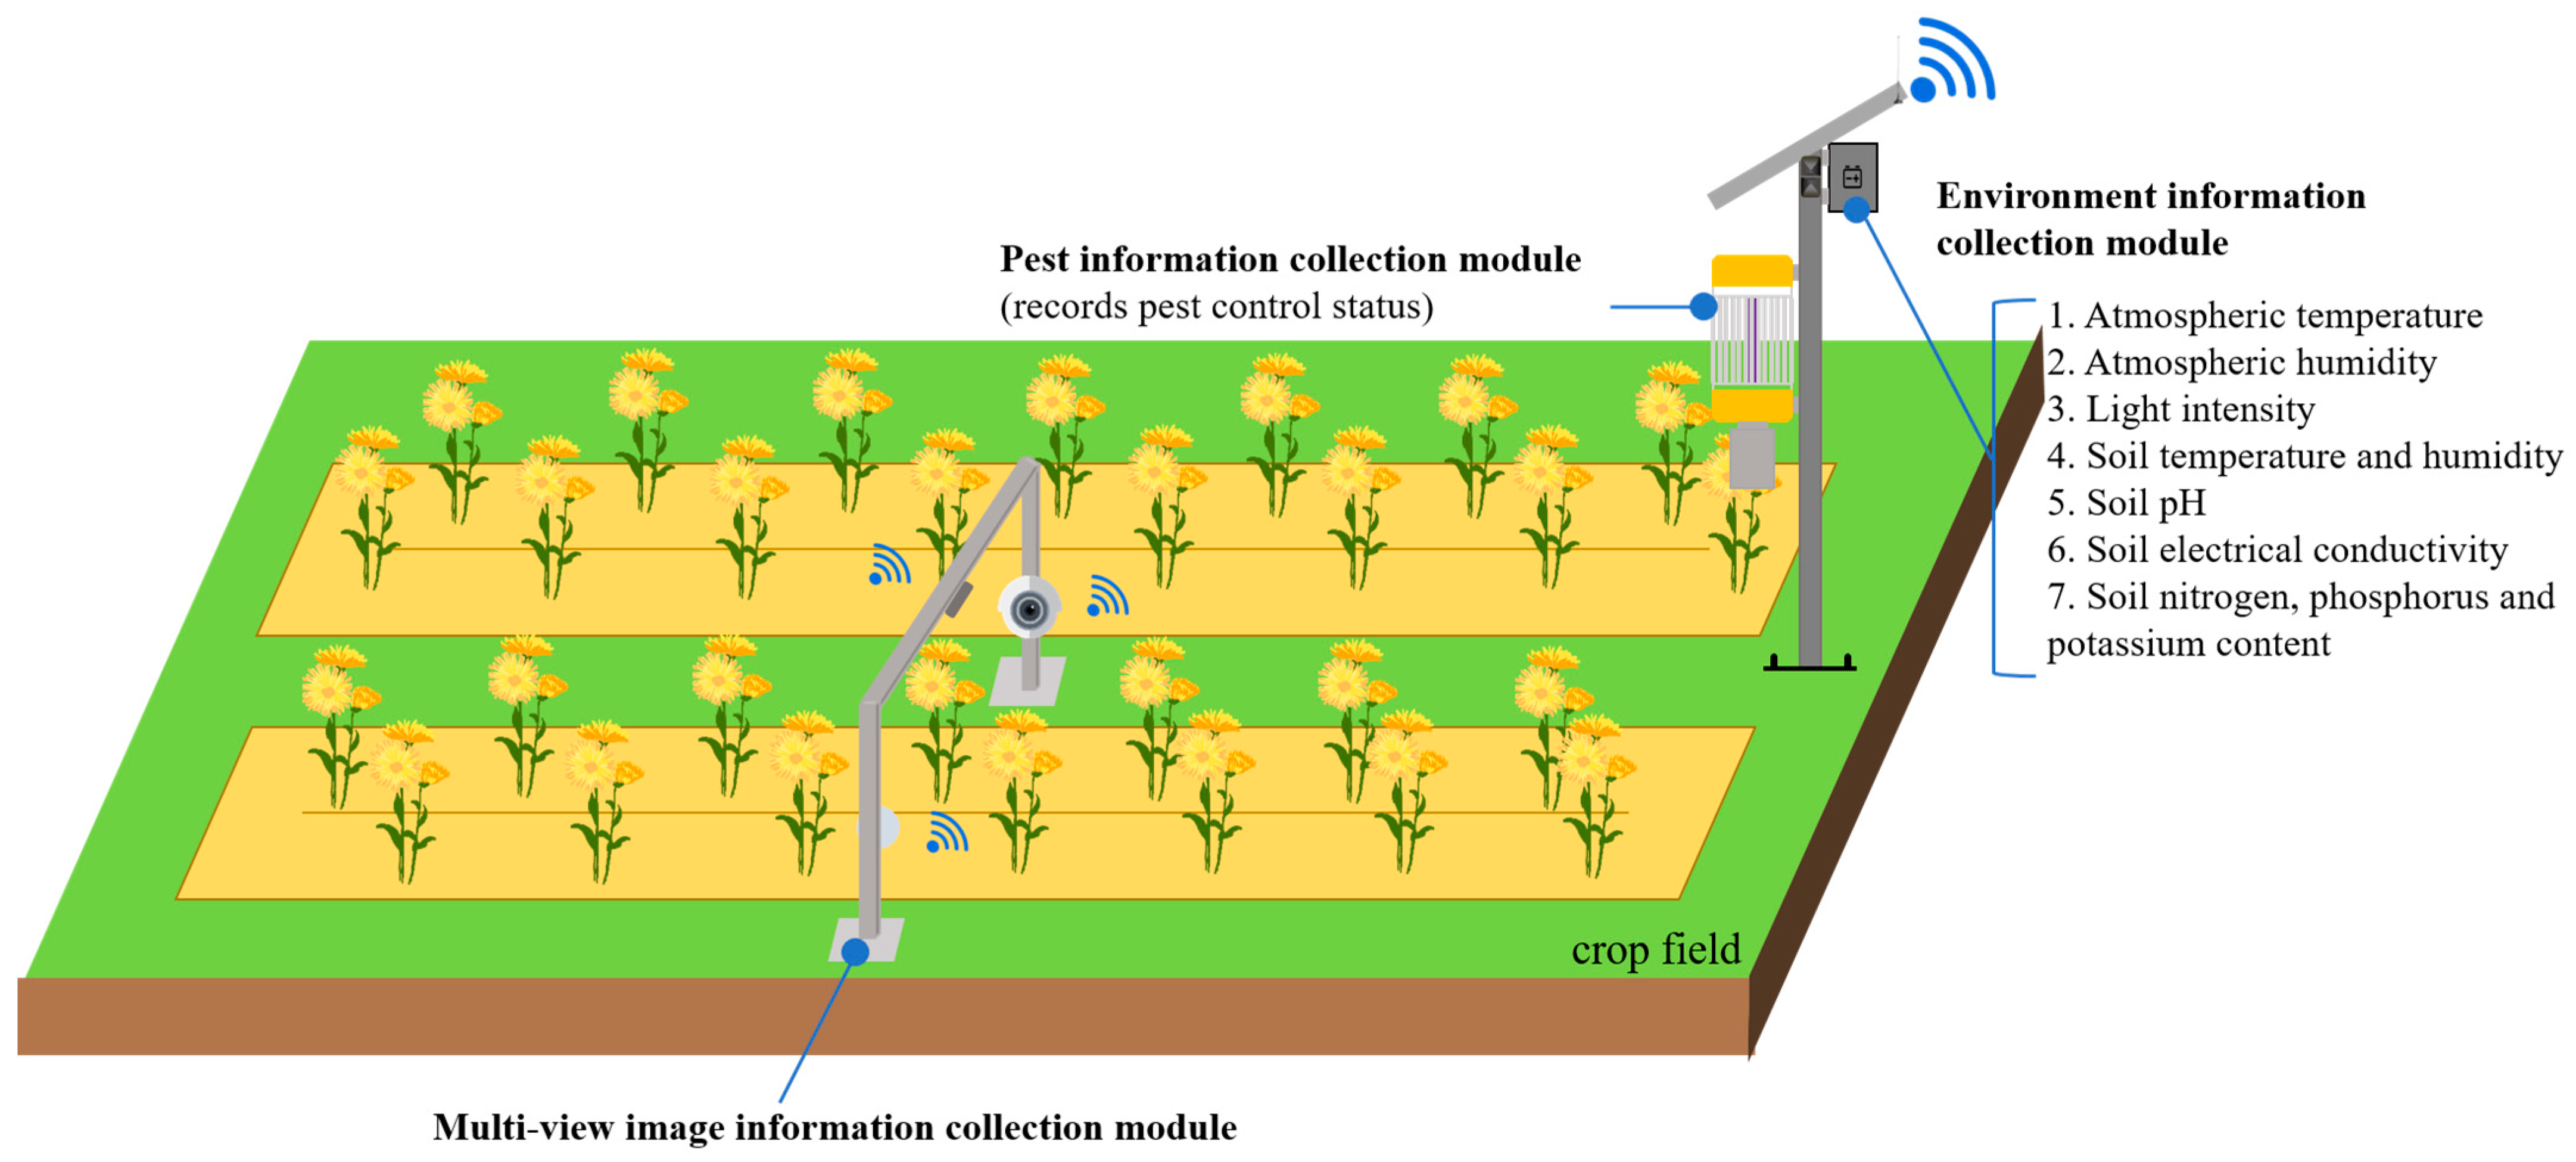
The crop growth information collection system based on SILs consists of four main components: the PICM, the EICM, the MICM, and the upper computer data display module. The overall framework of the crop growth and phenotypic information collection platform based on SILs is shown in Figure 2. Figure 3 illustrates a schematic diagram of the expected simulation deployment.
The SIL platform is primarily responsible for pest control during crop growth, while the EICM continuously monitors and gathers real-time environmental data. The multi-view image acquisition module employs three cameras to capture crop growth images from multiple perspectives. Data transmission is enabled through a Wi-Fi wireless communication module and a gateway, with data processing, storage, and display handled by the main control unit and the host computer.

3. Hardware Structure Design

The hardware structure design of the crop growth information collection system is mainly divided into four modules, including the pest information collection module (PICM), environmental information collection module (EICM), multi-view image collection module (MICM) and power supply module (PSM). This system uses the ESP32-S3 (LeXin Information Technology (Shanghai) Co., Ltd., Shanghai, China.) as the core component, integrating various sensors to realize real-time measurement and collection of the atmospheric temperature and humidity, equipment box temperature, light intensity, soil temperature and humidity, electrical conductivity, pH value, and soil nitrogen, phosphorus and potassium content in soil. The ESP32-S3 is set within the PICM, which serves as the main controller of the entire system. Information transmission between the various sensors and the PICM occurs via the serial port. For example, a sound sensor captures the sound pulse and the voltage pulse generated by the SIL when killing insects, providing critical indicators for assessing the pest situation and the insecticidal performance of SILs. These data are subsequently uploaded to the upper computer for analysis.
In addition, the hardware integrates the MICM based on visible light imaging technology, which collects real-time crop growth data through three cameras positioned at different angles and uploads it to the upper computer. Communication between the PICM and the MICM relies on the built-in Wi-Fi module of the ESP32-S3. The Wi-Fi module wirelessly transmits the data to the gateway. Then, the gateway transmits the data to the upper computer. The hardware structure design is shown in Figure 4.

3.1. Pest Information Collection Module Design

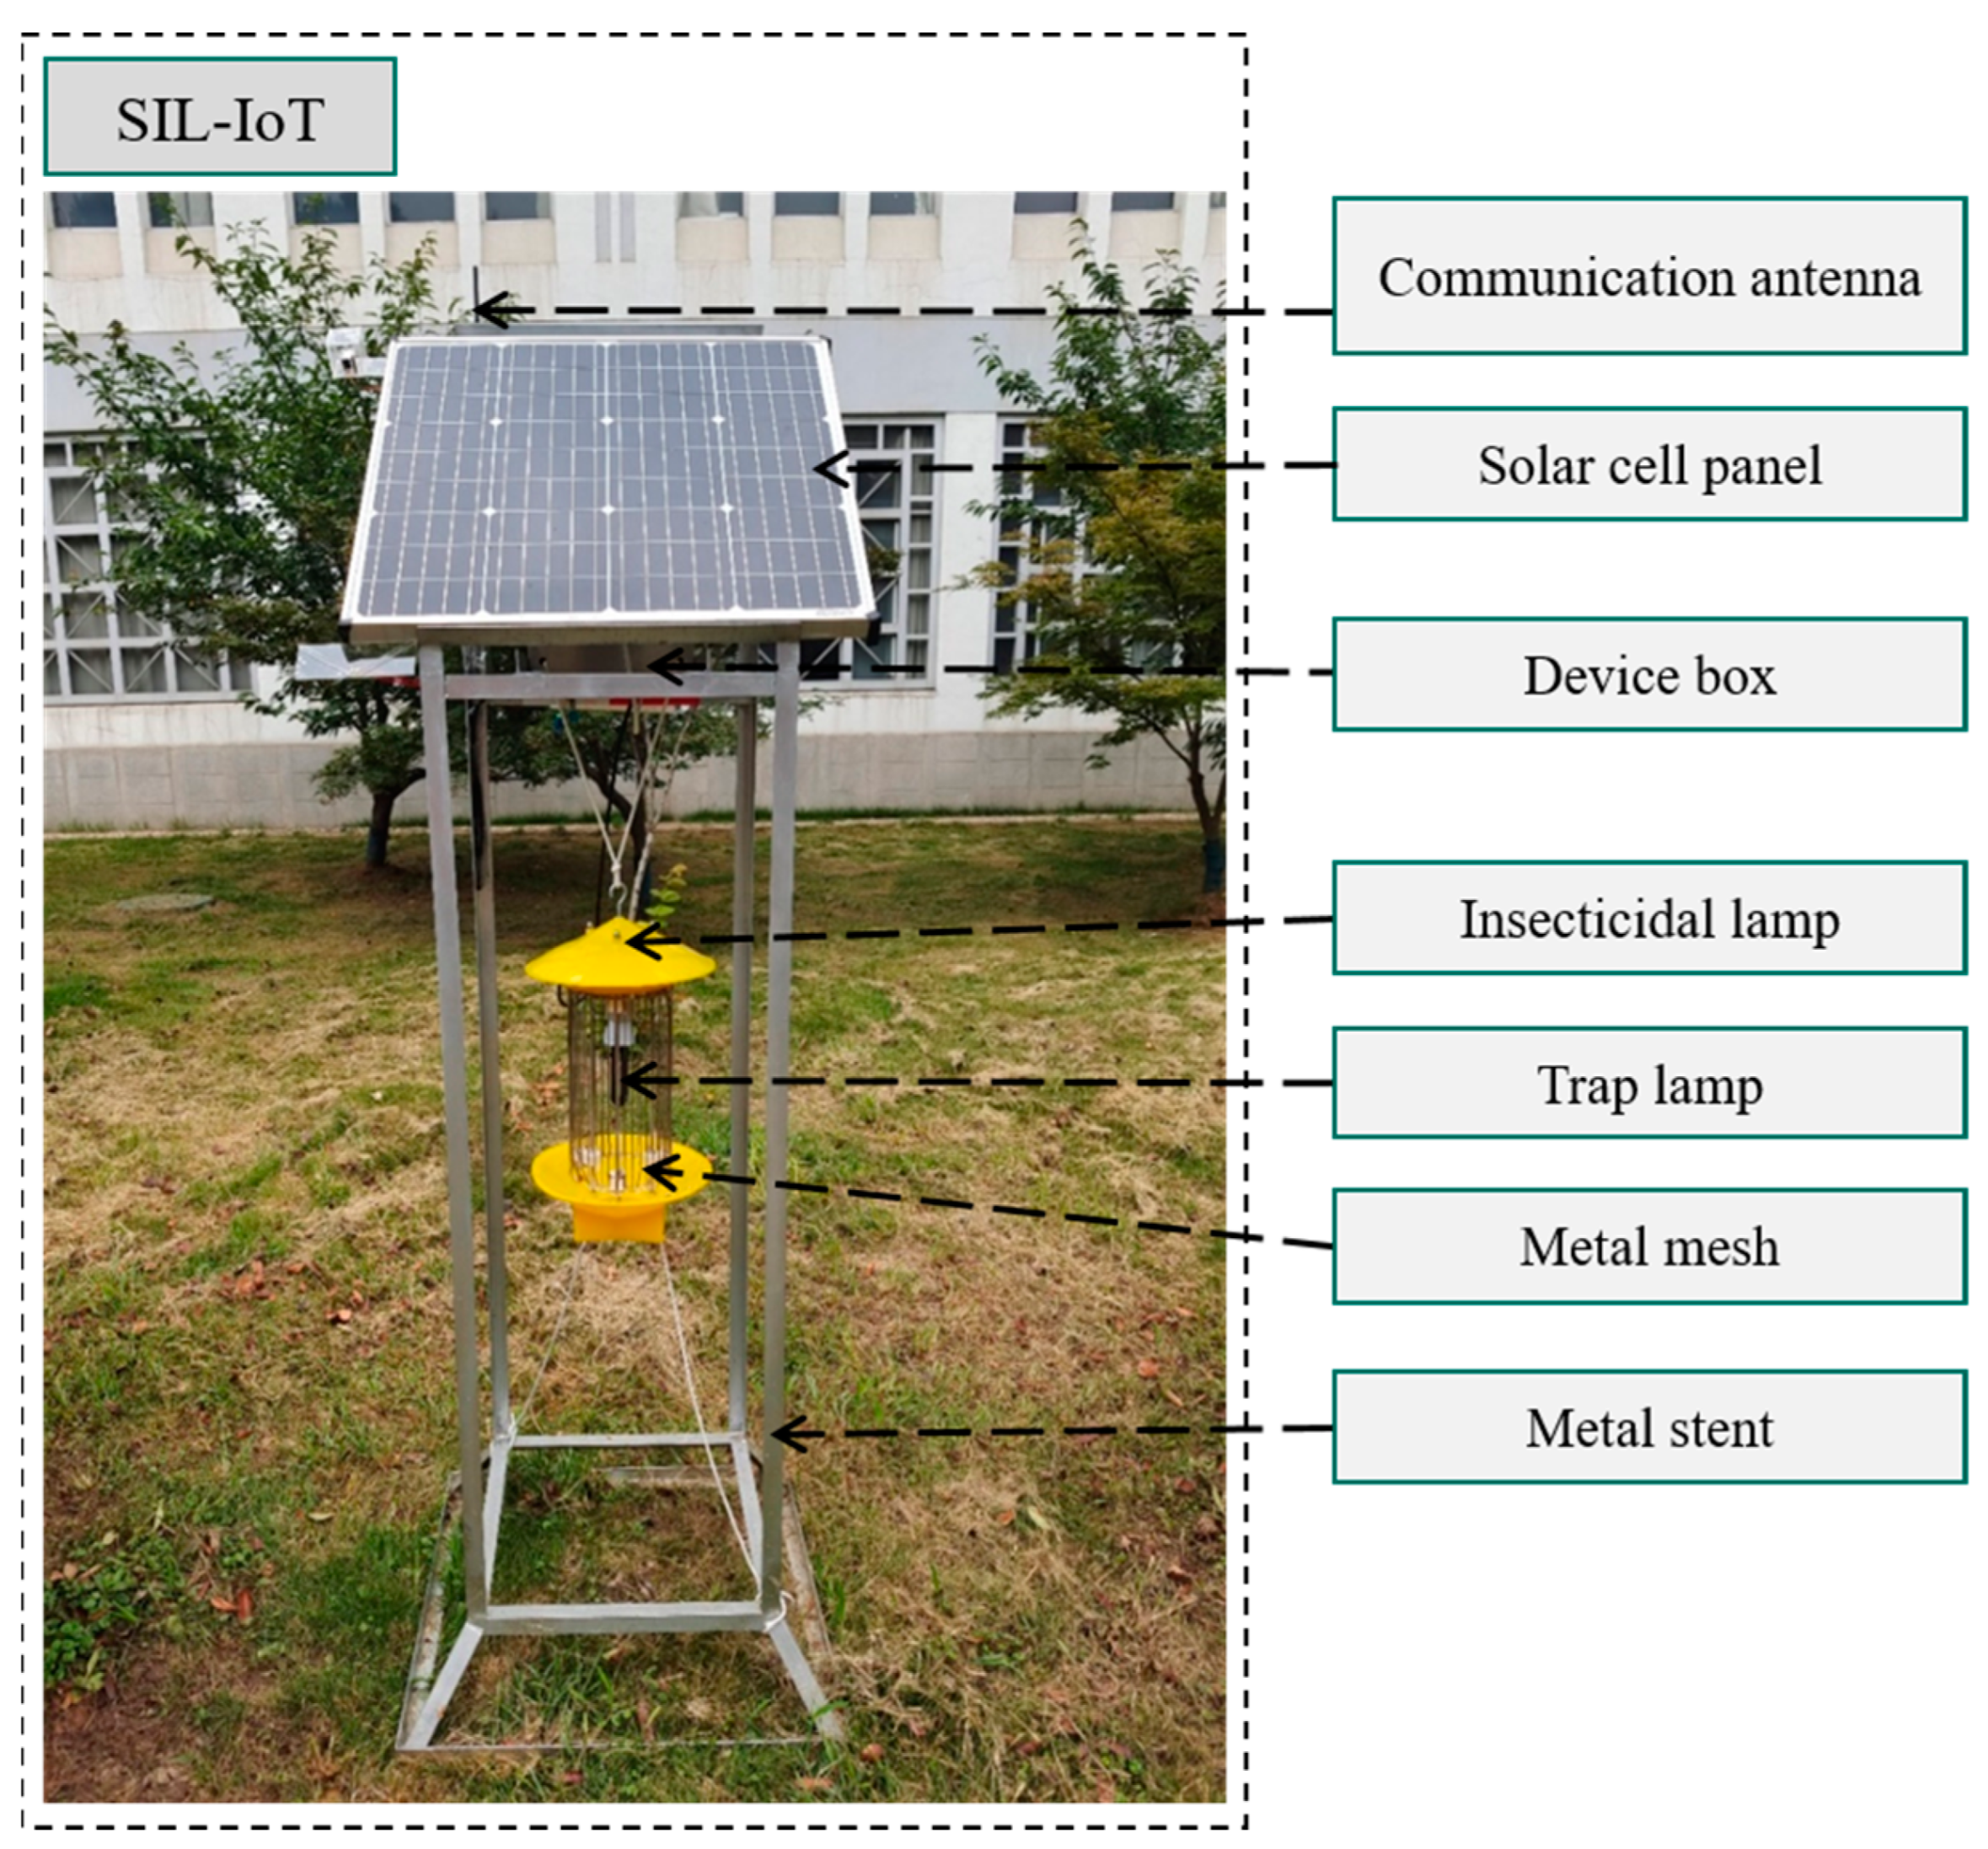
The PICM integrates the SIL-IoTs with the crop growth information collection system, allowing the SILs to perform pest control and monitor and collect crop growth information. This integration achieves the dual functionality of pest control and growth information monitoring. The physical structure of the SILs is shown in Figure 5, which mainly consists of six components: communication antenna, solar cell panel, device box, insect trap, metal mesh, and metal stent.
An SIL uses the phototaxis of insects to attract insects. When insects approach the metal mesh, they are killed through the high-voltage power grid. Although an SIL is effective in pest control, it may have some negative effects on beneficial insects. Previous studies have researched the specific impact of SILs on beneficial insects and proposed optimization measures: (1) set the switching period of the SIL reasonably and turn it on during periods when beneficial insects are less active; and (2) optimize the spectral bands to avoid wavelengths that are particularly sensitive to beneficial insects. These methods can reduce the harm to beneficial insects.

3.2. Environmental Information Collection Module Design

3.2.1. Component Selection

To ensure the stable operation of the node, the hardware design prioritizes low power consumption and a small size. During the design process, minimizing the number of components is critical, with particular emphasis on the power consumption of each component. A lower number of components results in reduced overall power consumption, improved system integration, and enhanced stability. Therefore, this platform uses the ESP32-S3-WROOM-1U (LeXin Information Technology (Shanghai) Co., Ltd., Shanghai, China.) module as the main controller. The ESP32-S3 is a low-power, highly integrated microcontroller that integrates both Wi-Fi and low-power Bluetooth wireless communication. Its key advantages include low power consumption, powerful wireless communication capabilities, extensive peripheral interfaces, and built-in security features, making it ideal for IoT systems that require real-time data processing and wireless connectivity. Additionally, the system incorporates a range of sensors to collect environmental and crop-related data, including a DHT11 temperature and humidity sensor (Aosong Electronics Co., Ltd., Guangzhou, China.), a DS18B20 temperature sensor (Tengjun Electronic Technology Co., Ltd., Dongguan, China.), an FC-04 sound sensor (Shenzhen Vanke Sheng Technology Co., Ltd., Shenzhen, China.), a GY-39 light intensity sensor (Shenzhen Diushitou Technology Co., Ltd., Shenzhen, China.), and a Kenqi-RS485 soil synthesizer sensor (Jiayi Electronic Technology Co., Ltd., Weihai, China.). These components collectively contribute to the system’s ability to monitor key environmental parameters efficiently while maintaining a low-power and highly integrated hardware configuration.
The DHT11 is a digital temperature and humidity sensor for collecting atmospheric temperature and humidity data. It has a simple interface, making it easy to integrate with various microcontrollers and single-chip systems without additional calibration or debugging. Furthermore, the DHT11 sensor is cost-effective, which is very suitable for large-scale deployment or low-cost projects. Table 6 summarizes the related parameters of the DHT11 sensor.
The DS18B20 is a high-precision digital temperature sensor. It features various temperature alarm functions. It operates reliably in harsh environments, being especially suitable for outdoor applications. The DS18B20 sensor has the characteristics of high precision, strong stability, and high reliability, along with waterproof, dustproof and anti-interference capabilities. In this system, the DS18B20 sensor is used to monitor the internal temperature of the equipment box in real time, ensuring that the sensor in the equipment box can work under stable conditions. Table 7 lists the hardware parameters of the DS18B20 sensor.
The FC-04 is a sensor that detects the sound intensity of the surrounding environment. It identifies the presence or absence of sound by setting the sound intensity trigger threshold. There are only two output forms, zero or one. When the SIL is working, the metal mesh will produce a sound higher than the set threshold during the discharge insecticidal process. At this time, the sensor outputs a high-level signal, and the number of insects killed is judged by the change in the level, which helps us evaluate the insecticidal effect and the performance of the SIL.
The GY-39 is a sensor that integrates the temperature, humidity, air pressure and light intensity. This system only uses the light intensity value. It is characterized by low power consumption, a small size, easy installation, and being easy to use and integrate. It supports Wi-Fi connection and is suitable for mobile devices and remote wireless transmission applications. The GY-39 sensor is used to collect and record the light intensity value during crop growth in real time. If the light is too strong or insufficient, timely shading or supplementary light measures can be taken to ensure that the crops grow under suitable light conditions. Table 8 details the hardware parameters of the GY-39 sensor.
The Kenqi-RS485 is a soil parameter detection sensor capable of monitoring the soil temperature, humidity, conductivity, pH value, and nitrogen, phosphorus and potassium (NPK) content in real time. It can be buried in the soil for a long time, is waterproof and has corrosion resistance, making it suitable for different types of soil. The Kenqi-RS485 sensor is used to record soil parameters in real time, and when an imbalance in the soil parameters is detected, adjustment measures can be taken in time. Table 9 summarizes the key parameters of the Kenqi-RS485 sensor.
The Kenqi-RS485 supports two measurement methods: rapid measurement method and buried measurement method. The rapid measurement method requires the selection of appropriate measurement points, avoiding hard objects such as stones and ensuring that the steel needle will not be obstructed during insertion. The specific operation is to remove the topsoil first, maintain the natural tightness of the lower soil, hold the sensor tightly and insert it vertically into the soil to avoid shaking left and right. To improve the accuracy, it is necessary to perform multiple measurements within a small area and take the average value. In contrast, the buried measurement method is more suitable for long-term monitoring. This involves digging a vertical pit with a diameter greater than 20 cm, inserting the steel needle of the sensor horizontally into the pit wall, and then filling the pit. After stabilization, continuous monitoring and recording can be carried out for several days, months or even longer. In this study, the buried measurement method was chosen to achieve continuous monitoring of the soil conditions.

3.2.2. Circuit Design

In this study, the printed circuit board (PCB) schematic was designed using Jialichuang EDA to interconnect the whole circuit. Figure 6 shows the schematic diagram, which includes the main chip ESP32-S3, along with various environmental sensors: the DHT11 temperature and humidity sensor, DS18B20 temperature sensor, FC-04 sound sensor, GY-39 light intensity sensor, Kenqi-RS485 soil sensor, and power monitor. The ESP32-S3 has a total of 41 pins, with a filter capacitor C3 (100 nF) connected between the GND pin and the 3.3 V power pin to maintain stable voltage input. The environmental information collection sensors transmit data via digital signals, utilizing pins 9, 15, 16, 17, 18, 19, and 20 for digital signal transmission. Data storage is performed by pins 4, 21, 22, 23, and 38. Additionally, pins 36 and 37 are allocated to program downloading and debugging, incorporating an external download button circuit; pressing the button connects pins 1 and 2, allowing the program to be downloaded. Serial communication between the ESP32-S3 and the Raspberry Pi is facilitated by pins 10 and 11.
To minimize the electromagnetic interference caused by high-voltage discharges from the metal grid, micro-holes were incorporated into the PCB design. This enhancement protects the IoT device from interference, ensuring reliable performance. The final physical diagram of the EICM is shown in Figure 7. The main control chip, the ESP32-S3, is centrally positioned on the board, while the power interface is located at the bottom. Additionally, five sensor interfaces are designed to connect with various sensors responsible for collecting the atmospheric temperature and humidity, equipment box temperature, light intensity, insecticidal sound, and a range of soil parameters.

3.3. Multi-View Image Collection Module Design

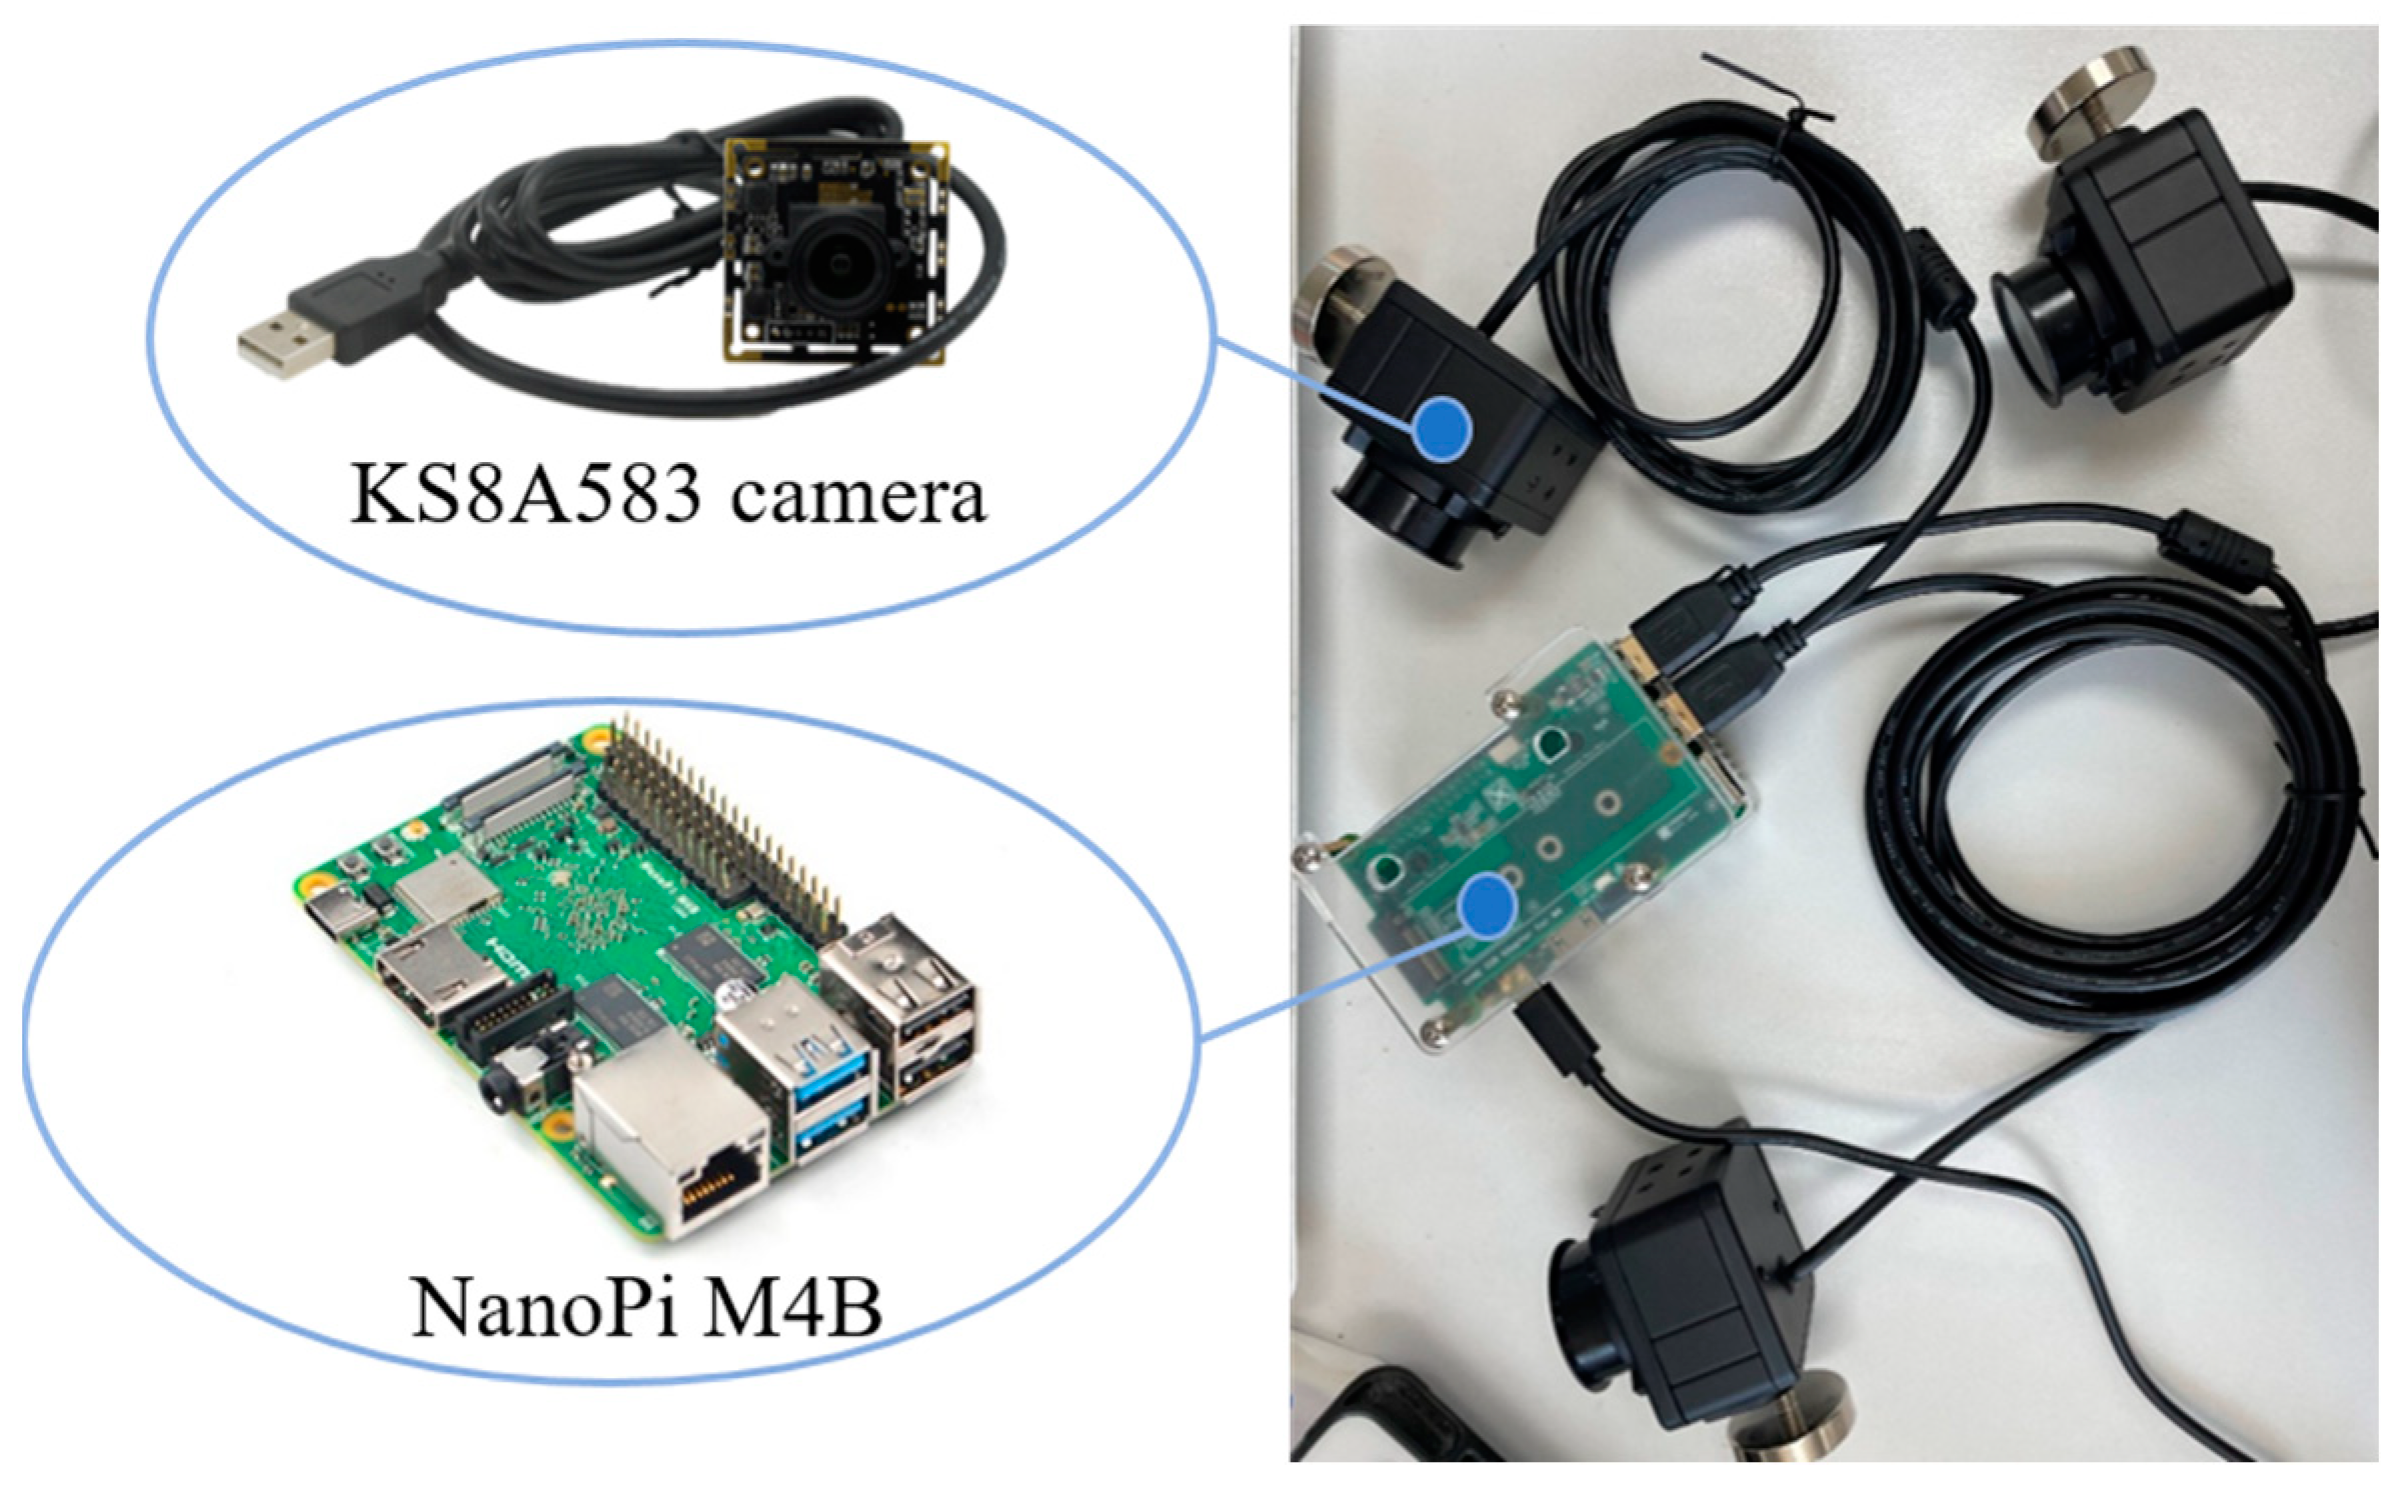
To enhance the efficiency of image data collection while minimizing the deployment costs and complexity, an MICM has been specifically designed for monitoring crop growth. Since crop growth image collection requires a large amount of hardware and software resources, this paper adopts a camera module driven by the NanoPi M4B (Guangzhou FriendlyARM Computer Tech Co., Ltd., Guangzhou, China.) main controller board. The NanoPi M4B is an embedded ARM computer based on the Rockchip RK3399 SoC, which offers extensive interfaces, compact dimensions (85 mm × 56 mm), and powerful processing capabilities, making it an ideal choice for this application.
The NanoPi M4B supports the 64-bit FriendlyCore system firmware, which includes Qt 5.10.0 and is based on Ubuntu Core 18.04. The NanoPi M4B is equipped with a parallel camera interface and a full-color LCD interface, making it highly suitable for real-time image collection. For the camera, a KS8A583 (Shenzhen Kingsen Technology Co., Ltd., Shenzhen, China.) 1/2.5-inch high-definition visible light image sensor was selected. The KS8A583 features 8 megapixels and a resolution of 3840 × 2160, utilizing Pregius series technology, making it ideal for 24/7 monitoring throughout the entire crop growth cycle. Table 10 summarizes the specifications and advantages of the NanoPi and camera modules.
To achieve all-round observation of the crop growth process, the design uses three cameras to monitor the crop growth from the top, left and right views, respectively. Such an arrangement enables the comprehensive collection of crop growth conditions. The initial design features a removable stand with a height of 1.3 m and a width of 1.4 m, providing support for the high-definition cameras and allowing for adjustments to the distance between the cameras and the crops. The dimensions of the detachable stand can be flexibly modified based on the specific crop variety and height. The schematic diagram of the removable bracket is shown in Figure 8.

4. Software Framework Design and Implementation

The software component of this platform is divided into two main parts: the embedded software and the upper computer software. The embedded software includes the program design for both the EICM and the MICM. In contrast, the upper computer software is responsible for the real-time display of sensor data, showing dynamic curves of the data changes. Additionally, it provides a data storage function, allowing for easy retrieval and analysis of historical data. Communication between the embedded and upper computer software is facilitated via Wi-Fi, ensuring seamless data transmission. The software architecture of the platform is illustrated in Figure 9.

4.1. Environmental Information Collection Module Program Design

In this paper, the ESP32-S3 code was developed using the Arduino platform. The ease of use and flexibility of Arduino make it ideal for reading environmental data from various sensors, thereby simplifying the development process and reducing the development time. Using the Arduino IDE platform, the ESP32-S3 can quickly integrate and read environmental parameters such as the temperature and humidity, light intensity, soil, etc. Additionally, its built-in Wi-Fi module facilitates data exchange with other devices or servers. Arduino supports IoT applications, enhancing real-time monitoring, data uploading, and remote control, providing an efficient development tool for smart agriculture and environmental monitoring.

4.1.1. DHT11 Temperature and Humidity Sensor

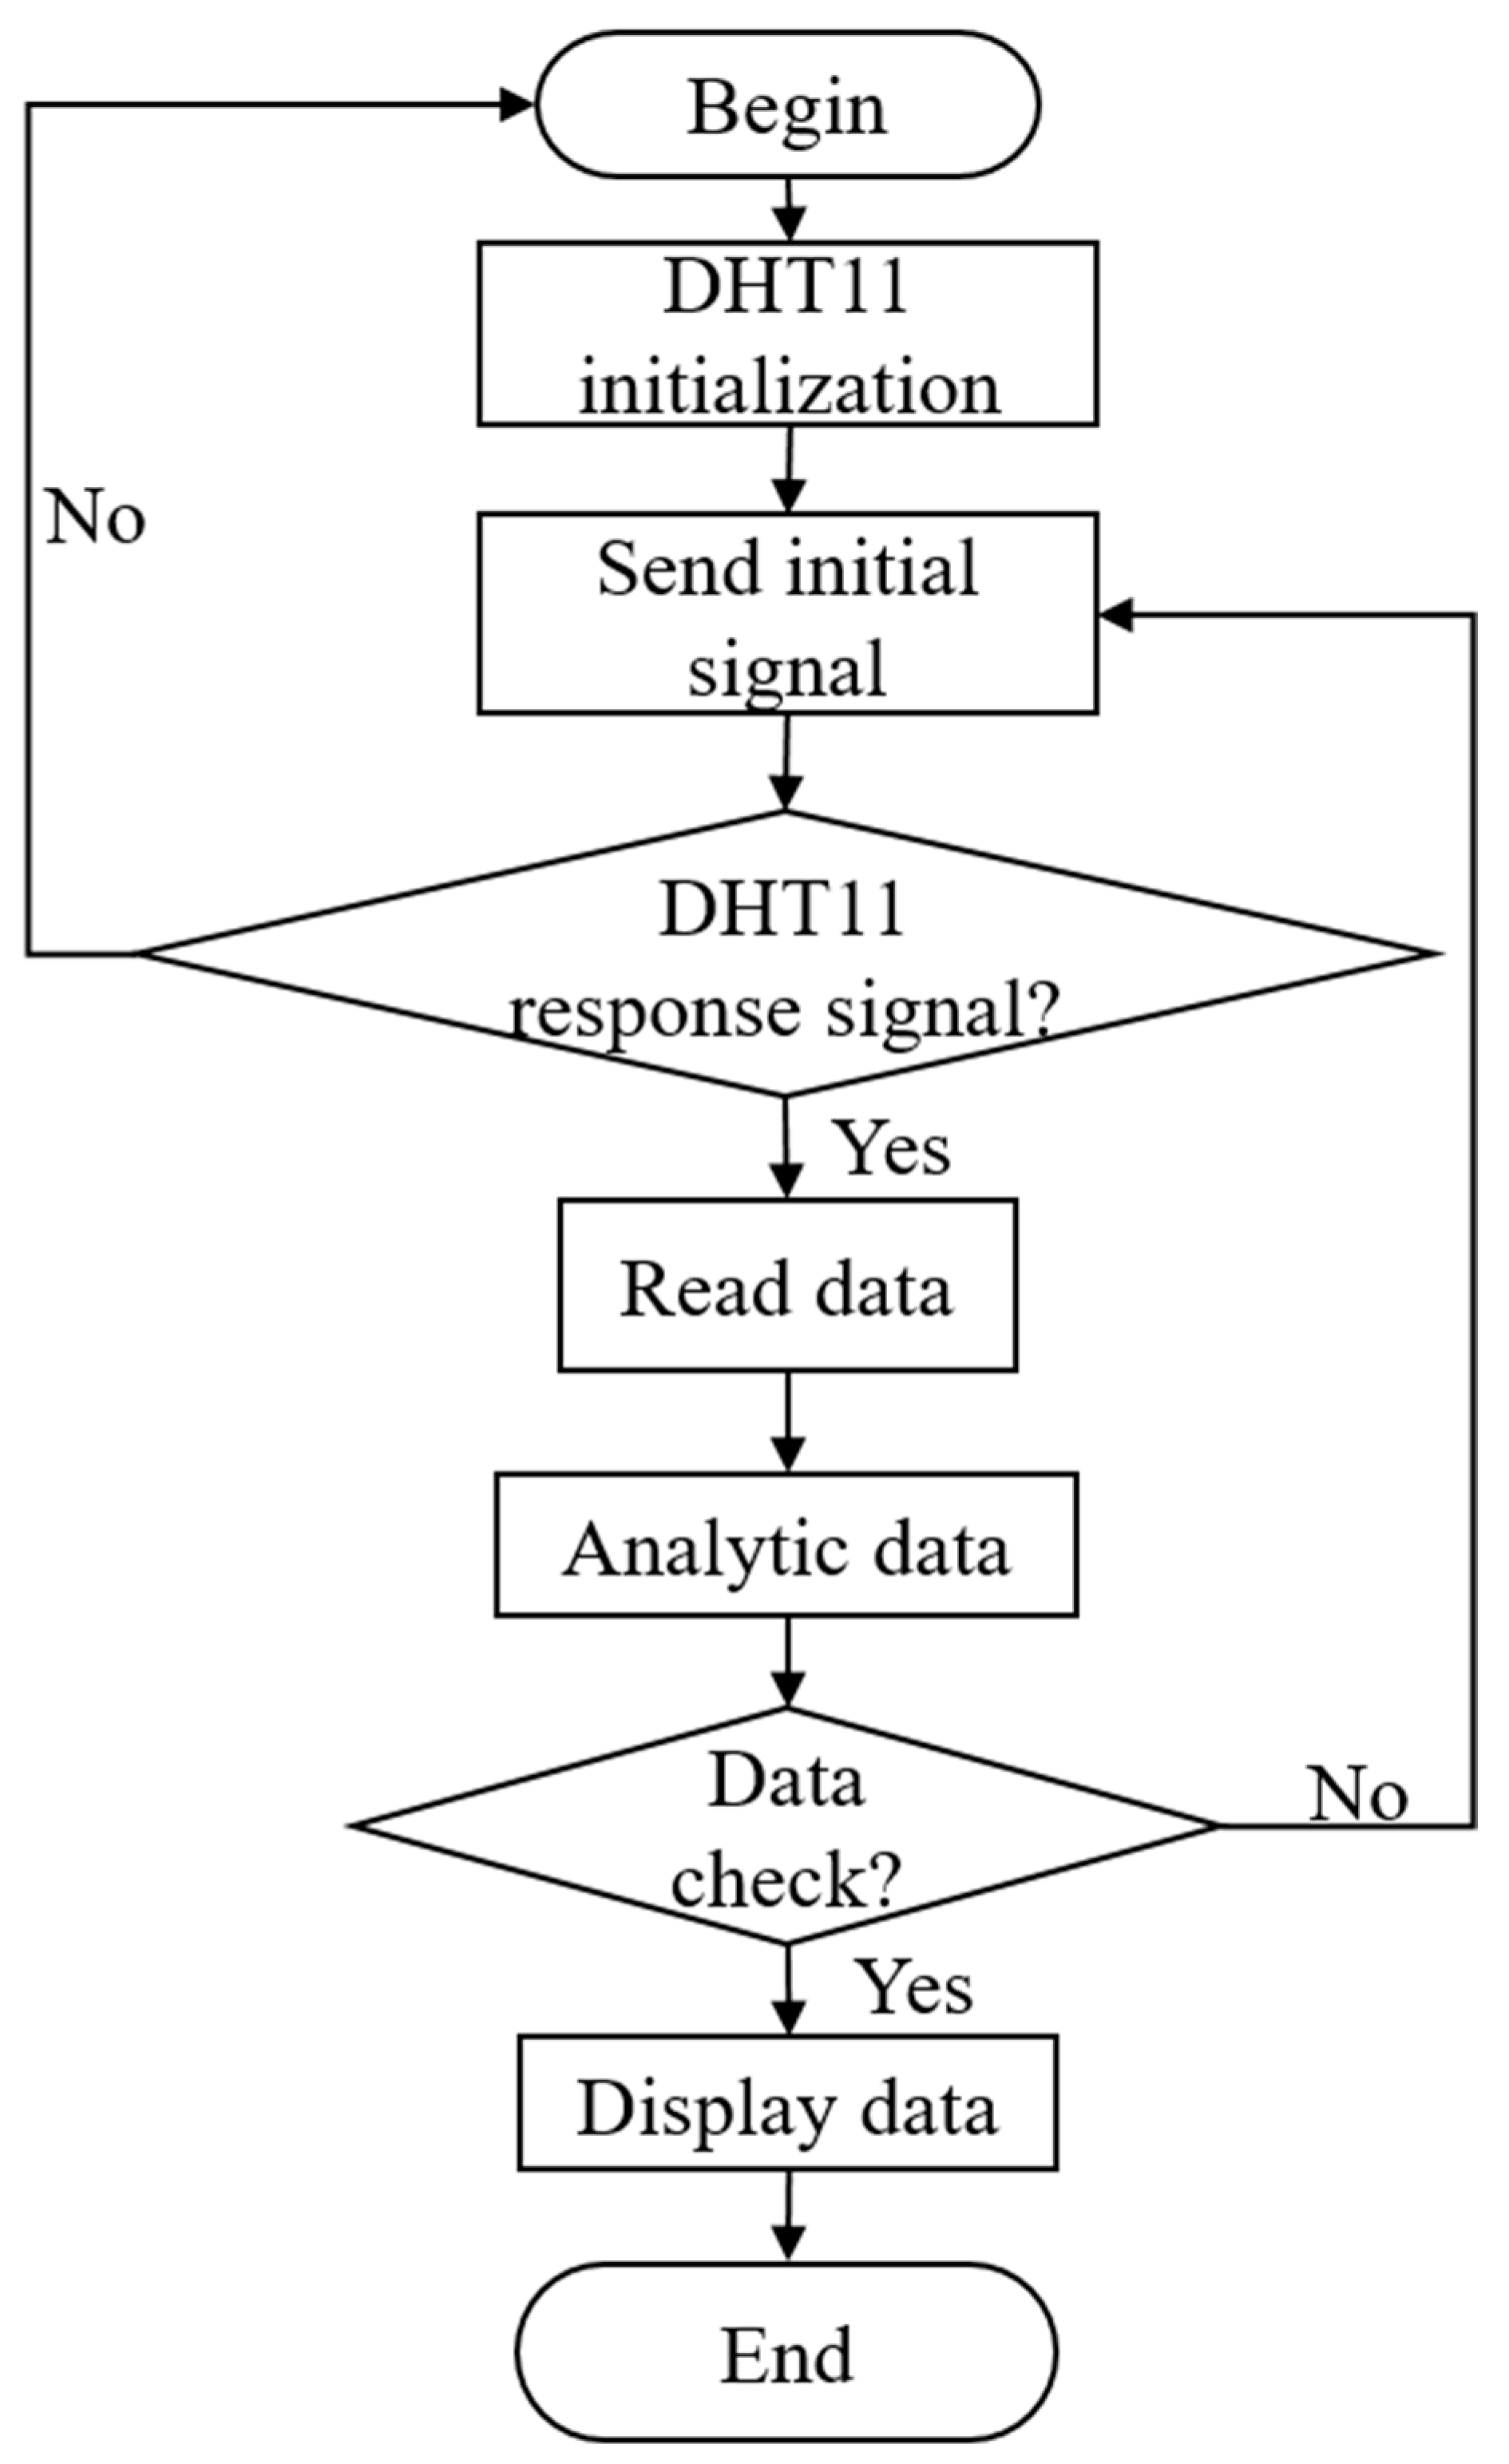
The DHT11 temperature and humidity sensor communicates with the ESP32-S3 via the General Purpose Input Output (GPIO) pin 7, using a single-wire bus for data transmission. The DHT11 sensor can be easily controlled using the C programming language with the DHT11 library. By invoking the read () function, the temperature and humidity values are obtained and outputted to the serial monitor through Serial.print (). The process of obtaining temperature and humidity data from the DHT11 sensor is illustrated in Figure 10, and the detailed steps are as follows:
(1)
Initialization: The driver initializes the sensor by setting the GPIO pin mode and communication rate. The ESP32-S3 sends a start signal, pulls down the data line low for over 18 ms, and then pulls it high for 20~40 μs, waiting for the DHT11 to respond.
(2)
Response signal: The DHT11 responds to the host’s start signal by pulling the data line down for about 80 μs, and then pulling it up for about 80 μs. Then, the DHT11 sends 40 bits of binary data, where a high level represents a one and a low level represents a zero.
(3)
Data parsing: The ESP32-S3 parses the received data packet, including splitting the data segmentation, checksum verification, format conversion, and calculation of the temperature and humidity values. We defined the data packet format as shown in Figure 11, where 16 bits represent the temperature, 16 bits represent the humidity, and the last 8 bits are used for the checksum. The checksum is calculated by summing the first 32 bits and comparing it with the last 8 bits. If the checksum fails, the sensor retransmits the data.
(4)
Data output: Once the checksum is verified as correct, the sensor releases the bus. The ESP32-S3 then converts and outputs the temperature and humidity data to the upper computer display.

4.1.2. DS18B20 Temperature Sensor

The DS18B20 temperature sensor is mainly used for monitoring the temperature of the equipment box in real time. It communicates with the ESP32-S3 via a single bus protocol, connected to GPIO pin 17 for data transfer. Before reading temperature data, the DS18B20 sensor must be initialized, following the process outlined in Figure 12:
(1)
Reset signal: The ESP32-S3 sends a reset signal to the DS18B20, pulls the data line down for over 480 μs and then pulls it up for about 60 μs. The system waits for the response from the DS18B20. If the response is successful, the DS18B20 pulls the data line low for about 60 μs, and then returns to the high-level state (about 480 μs) at the time of power-on reset.
(2)
Send command: The ESP32-S3 sends a “Read ROM” or “Skip ROM” command, prompting the DS18B20 to return its unique ROM code for identification.
(3)
Temperature conversion: The ESP32-S3 sends a temperature conversion command, pulling the data line low for at least 1 μs, and then pulling it high again. The DS18B20 starts the temperature conversion and stores the converted data in the internal memory at address 0x44.
(4)
Read data: After the temperature conversion is completed, the ESP32-S3 sends a read command that lasts at least 1 μs. Then, the DS18B20 returns 9 bytes of temperature data, where each data bit lasts about 60 μs, and a high level represents one and a low level represents zero.
(5)
Data parsing: The ESP32-S3 parses the returned raw temperature data and converts it into standard Celsius format.
(6)
CRC checksum: The ESP32-S3 verifies the CRC checksum. If the checksum is correct, it outputs the temperature value to the upper computer for display and closes the program to release the bus.

4.1.3. GY-39 Light Intensity Sensor

The GY-39 light intensity sensor and the ESP32-S3 use the Inter-Integrated Circuit (IIC) bus protocol for data transmission, and the devices communicate with each other through the address. The process of reading data from the GY-39 sensor via the ESP32-S3 is illustrated in Figure 13. The steps involved are as follows:
(1)
Initialization: The I2C address of the GY-39 sensor is defined. The setup function initializes the serial communication and the IIC bus, configuring the ESP32-S3 as the master device.
(2)
Send read command: The ESP32-S3 sends a command to read light intensity data from the GY-39, specifying the address of the data to be read. The Wire.requestFrom() function is utilized to request the 2-byte raw light intensity raw data packet.
(3)
Receive and parse the data: After receiving the read command, the GY-39 sends a response signal and sends the data back to the ESP32-S3. The Wire.read() function is used to parse the raw data packet byte by byte, combining the high 8 bits and low 8 bits to form the actual 16-bit sensor data through bitwise operations.
(4)
Data output: The parsed data are processed and output through the serial port.
The GY-39 light intensity sensor collects the light intensity of the environment during crop growth, which can accurately measure changes in the light intensity. These data can help build a digital twin model of the crop growth environment, enabling simulations of crop growth under various light conditions and helping predict changes in the light requirements for optimal crop development.

4.1.4. FC-04 Sound Sensor

The FC-04 sound sensor is used to monitor the frequency and size of the sound generated by the insecticidal lamp when working. Since the sensor outputs a digital signal, it is directly connected to I/O pin 42 of the master control unit for data transmission. The ESP32-S3 reads data from the FC-04 sensor in the following three steps:
(1)
Set I/O Pins: The I/O pins of the FC-04 are configured to output mode. The integrated level comparator within the FC-04 outputs a high-level signal upon detecting surrounding insecticidal sounds.
(2)
Read data: The ESP32-S3 continuously monitors the level changes in the I/O pins and records these variations.
(3)
Data Processing and Transmission: The system filters and processes the collected insecticidal sound data. The processed data are transmitted to the upper computer through the serial port or other communication methods for user access.

4.1.5. Kenqi-RS485 Soil Sensor

The Kenqi-RS485 soil sensor is mainly used to collect various soil parameters. Data collection begins by inserting the probe at the bottom of the sensor into the soil. The sensor communicates with the main controller through the Modbus-RTU communication protocol. The data frame format of the Modbus-RTU protocol is defined as shown in Figure 14. The Modbus-RTU protocol contains four parts:
(1)
Address code: Indicates the address of the sensor, usually represented as an 8-bit binary number.
(2)
Function code: Specifies the type of operation for the communication, also represented as an 8-bit binary number.
(3)
Data area: Contains the request or response data. The length of this section depends on the type of communication operation.
(4)
Error check: Verifies the integrity of the communication frame using a 16-bit cyclic redundancy check (CRC) code.

4.2. Multi-View Image Collection Module Program Design

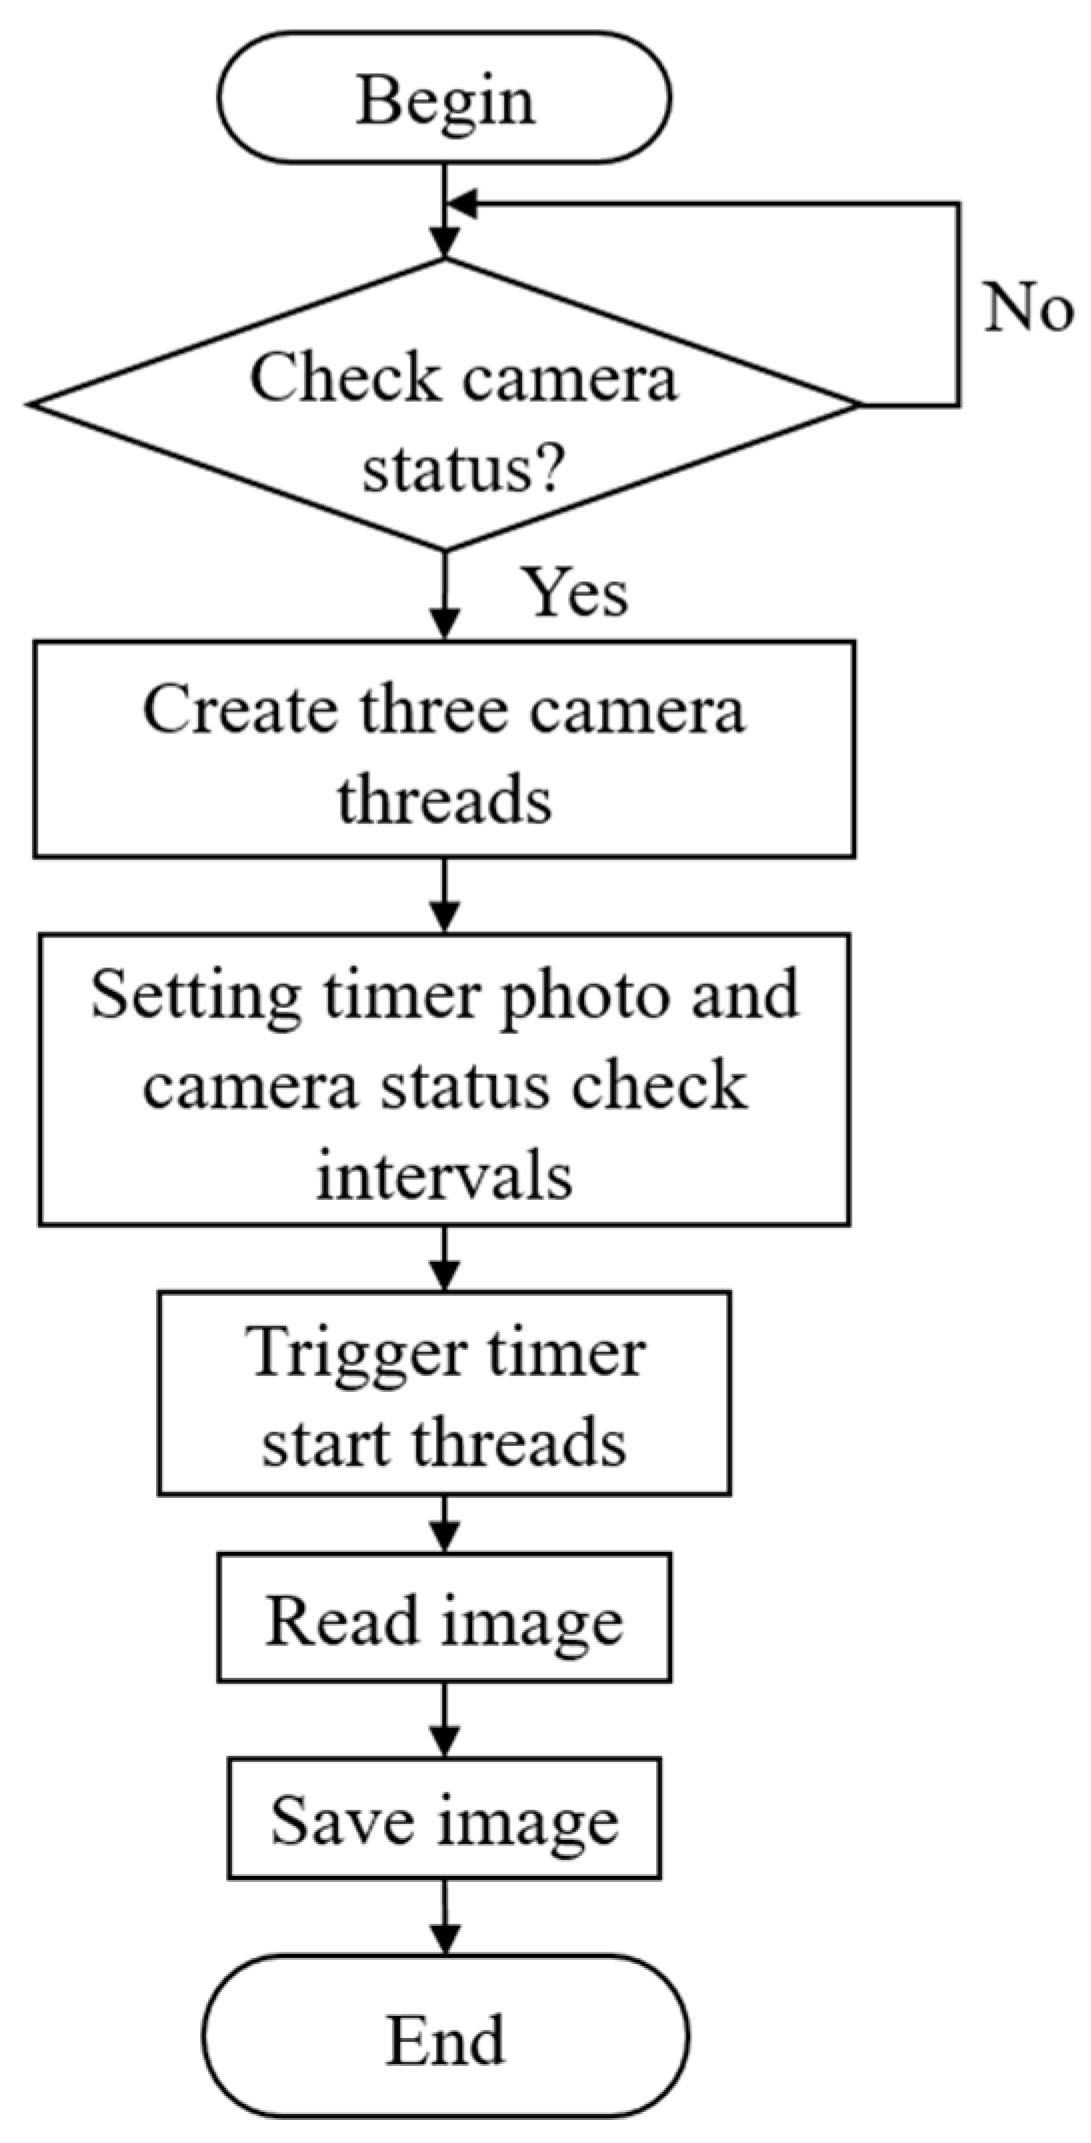
In the MICM, the system uses external USB cameras to monitor the crop growth process. To achieve all-round observation from three angles (top view, left view and right view), the system uses three threads to control three KS8A583 cameras synchronously. Initially, a Task object is created in the main function, and the Qt event loop is initiated to continuously manage events such as timers and tasks. Within the Task object, the three threads create corresponding Camera objects and control the photo-taking and image-saving functions through the signaling and slotting mechanism, with a five-minute time interval between image collections.
Additionally, the Task object checks the status of the cameras every five minutes. If any camera encounters an issue, its photo-taking function is immediately stopped to prevent further errors. Figure 15 shows the flowchart of the camera driver program for the MICM.

4.3. Upper Computer Software

This platform supports 24 h continuous monitoring of the crop growth environment and provides functionalities for real-time data collection, remote monitoring, data storage, and historical data querying. LabVIEW (LabVIEW 2022 32-bit) is selected as the development tool for the upper computer due to its ability to integrate with various hardware devices and sensors. LabVIEW supports multiple communication protocols and interfaces while offering powerful graphical programming capabilities, making it an ideal choice for the system’s software development.

5. Experimental Implementation and Testing

5.1. Experimental Scenario

The test crop in this paper takes cut chrysanthemum as the sample. At the time of transplanting, the seedlings had an average height of approximately 8 cm, with seven leaves. After 90 days of growth, they reached a final height of over 90 cm, with 35 leaves at harvest. The growth trend throughout the chrysanthemum’s life cycle is illustrated in Figure 16. The data collection period spans from 17 May 2023 to 26 September 2023, precisely covering the entire growth cycle of cut chrysanthemums. This period ensures comprehensive monitoring of the crop’s development, making it an ideal sample for the experiment.
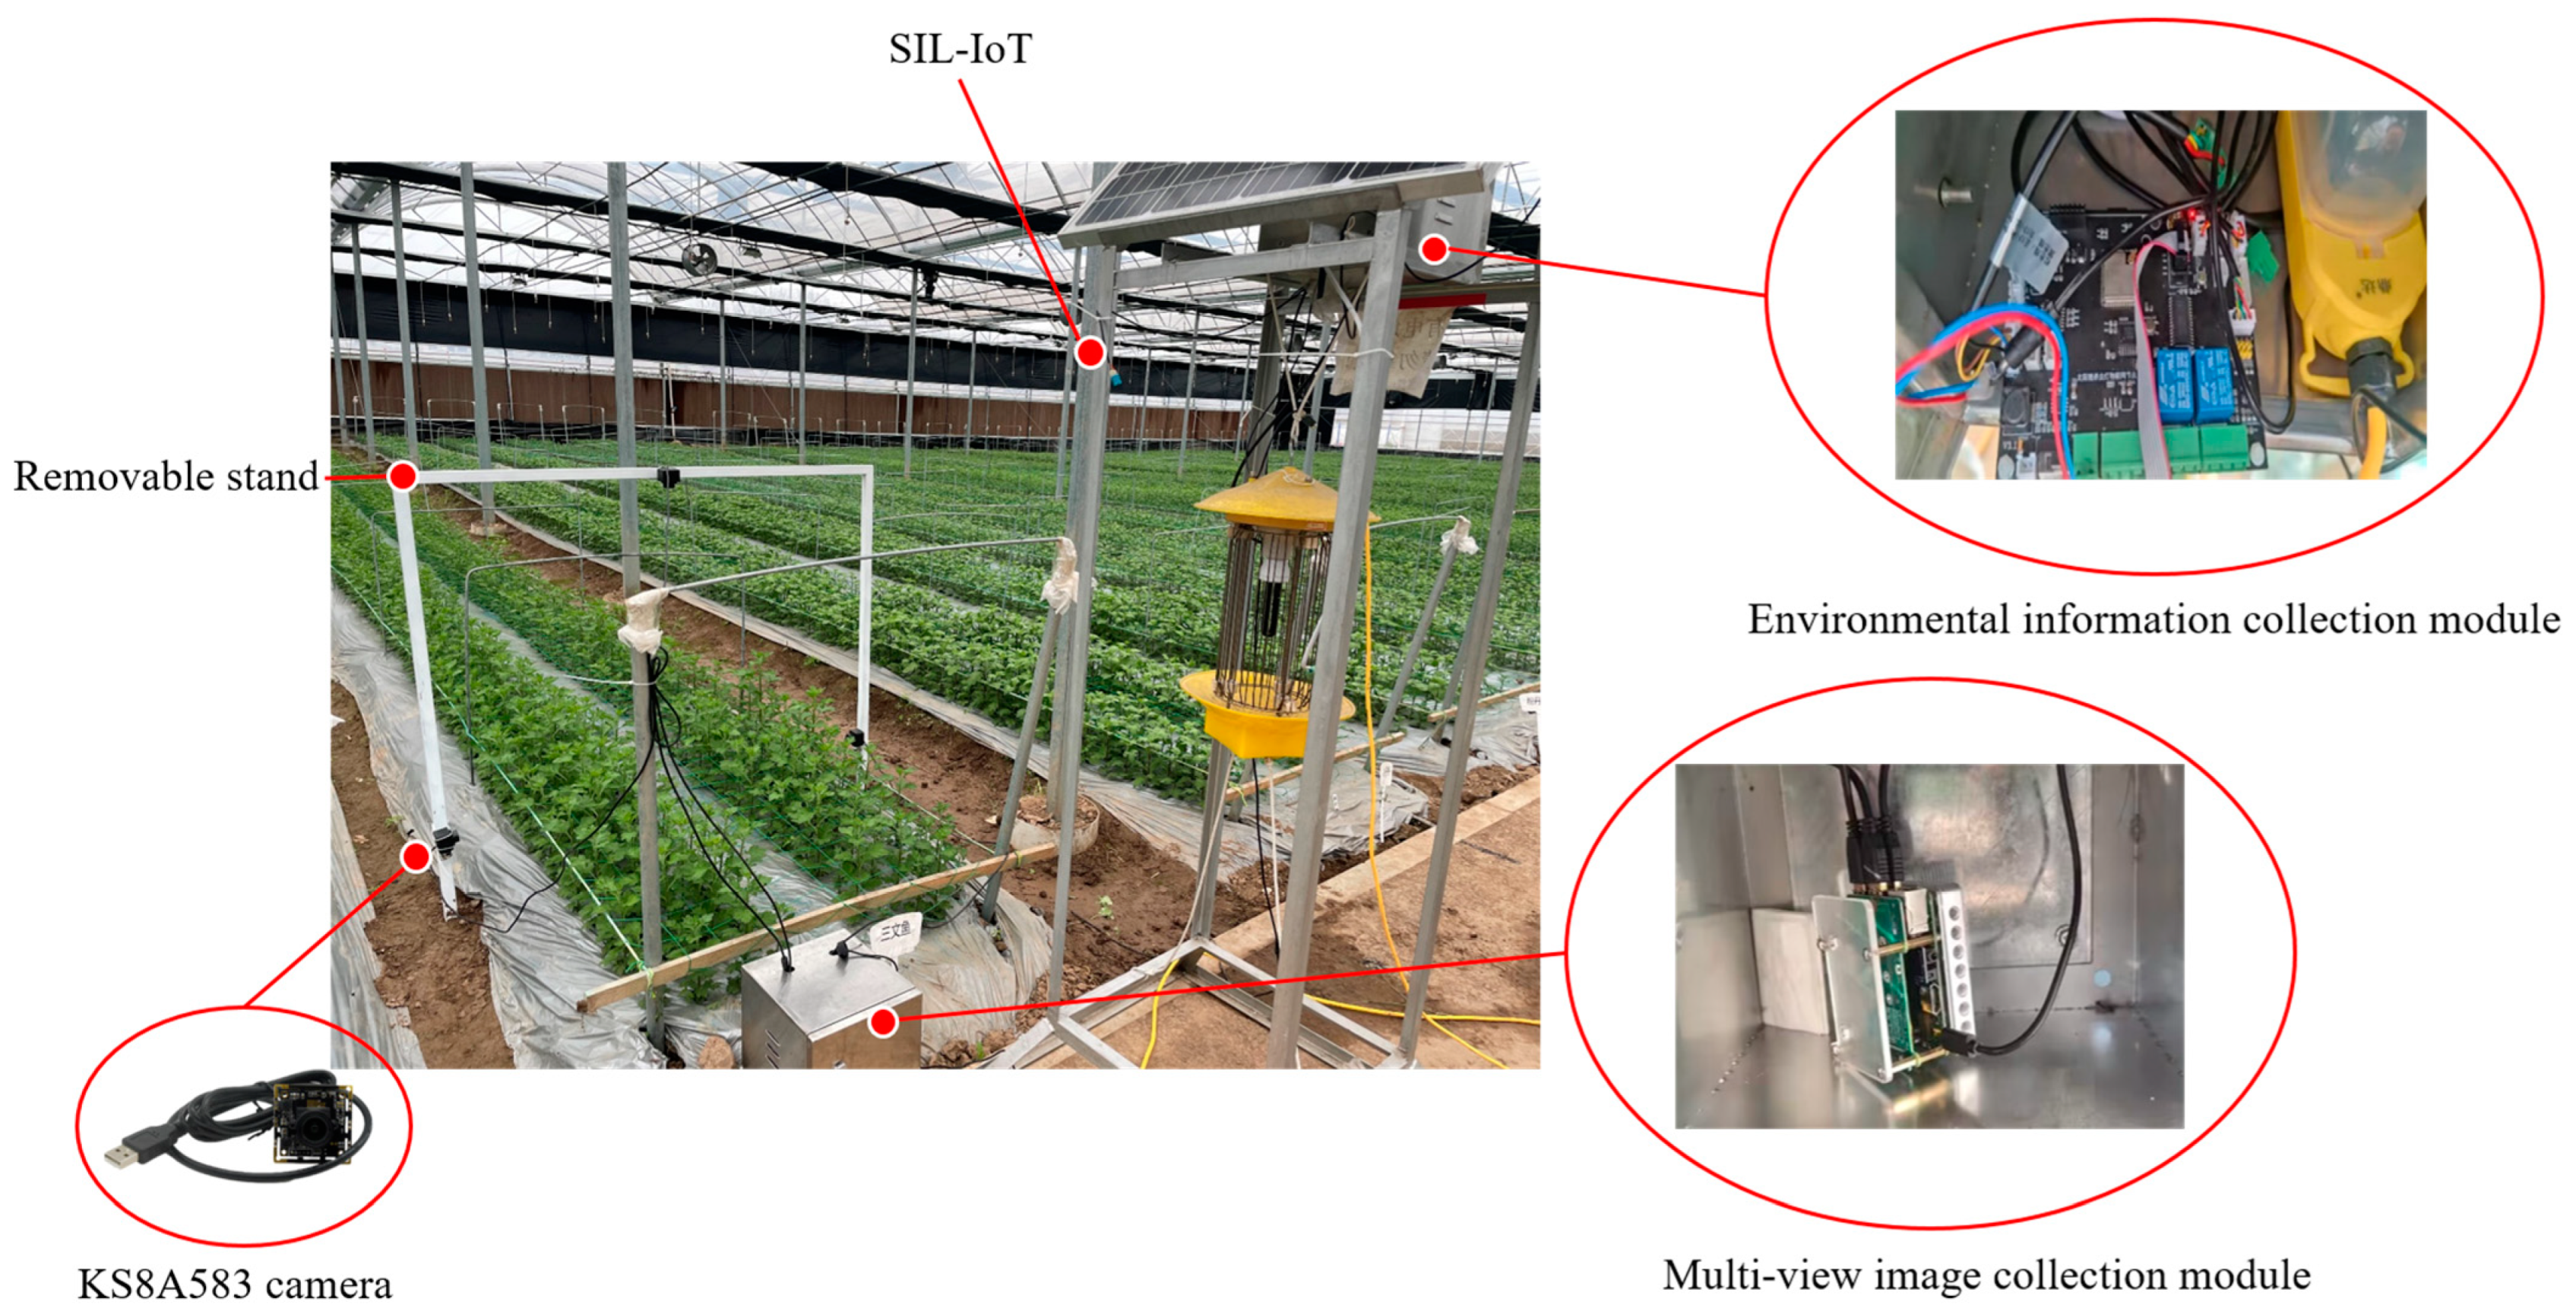
The experimental site is the chrysanthemum garden demonstration base located in Wai Sha Village, Baguazhou Street, Qixia District, Nanjing City. The experimental area spans 100 m × 50 m. Field deployment of the device is illustrated in Figure 17.

5.2. Experiment on Environmental Information Collection

In the environmental information collection experiment, the sensors are deployed according to specific guidelines: the temperature and humidity sensor is placed vertically at 10 cm above the soil surface to monitor atmospheric conditions; the soil sensor is inserted into a pre-excavated pit measuring 15 cm in width and 20 cm in depth; the probe steel needle is inserted horizontally into the pit wall to avoid stones and ensure complete insertion to ensure the accuracy of the data; and the light intensity sensor is placed on the solar panel to monitor changes in light intensity. The system is powered by a solar panel and a 12 V DC power supply. Upon powering on the device (indicated by the red LED on the circuit board), each sensor initializes and begins collecting data. The blue LED indicator on the collection end flashes once every 5 s to indicate successful data collection, while the yellow LED indicator flashes once every 5 s to confirm successful data transmission.
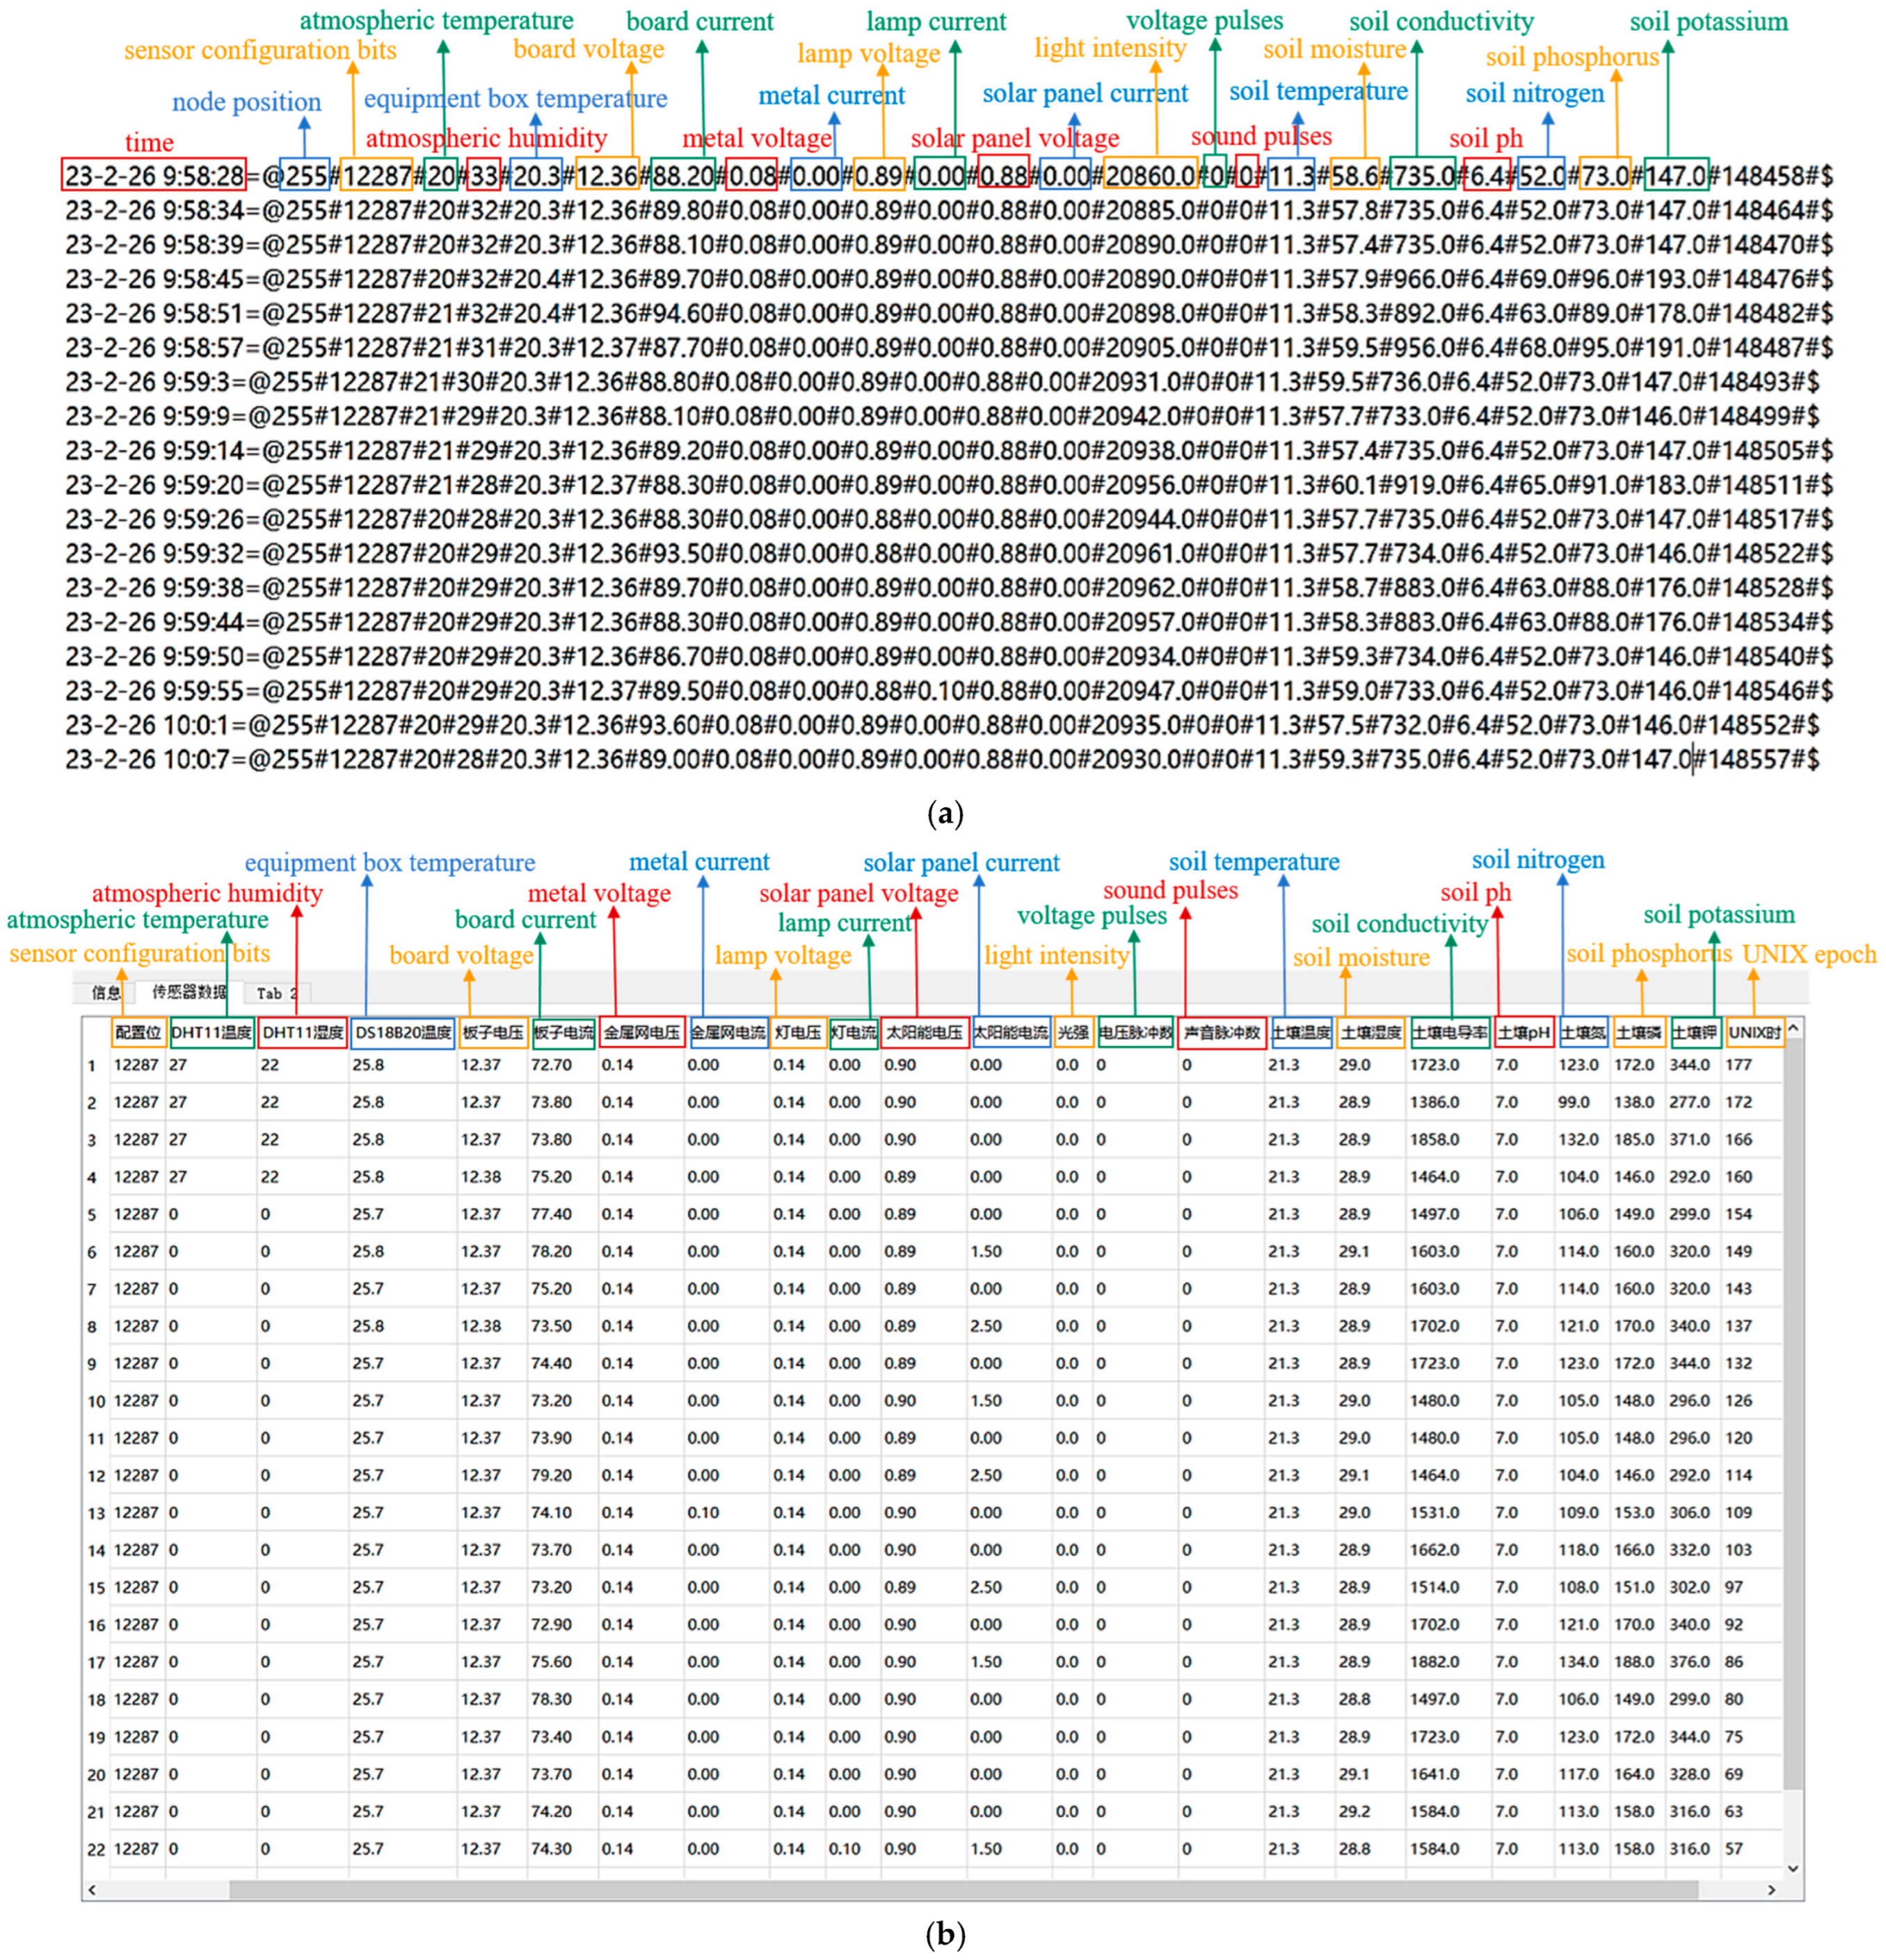
Figure 18a presents the raw data collected in its original format, where each data frame starts with the character “@” and ends with “$.” Different data types are separated by “#”, including items, e.g., collection time, node number, sensor configuration bits, atmospheric temperature, atmospheric humidity, equipment box temperature, current and voltage, light intensity, voltage pulse, sound pulse, soil temperature, soil humidity, soil pH, soil conductivity, and soil nitrogen, phosphorus, potassium content and UNIX epoch. Unix epoch is used to record the collection time of environmental data. Figure 18b illustrates the analyzed growth environment data. The test results indicate that the environmental collection functionality of the crop growth information collection platform demonstrates effective data collection, satisfying the design requirements.

5.3. Experiment on Multi-View Image Collection

Image collection throughout the entire growth cycle of the crop was achieved using a NanoPi to control three cameras, capturing video simultaneously from the left, top, and right views. The connection and arrangement of the devices are illustrated in Figure 19, where each camera is connected to its respective USB port on the NanoPi for image collection.
Three cameras simultaneously captured two rows of chrysanthemum stereo images every five minutes and transmitted the data in real time. Figure 20 shows images of chrysanthemums taken in an agricultural field, showcasing the growth conditions at three different times: 07:00, 12:00, and 18:00. Specifically, Figure 20a–c display left-view images of chrysanthemums, while Figure 20d–f present top-view images and Figure 20g–i show right-view images. These images demonstrate that the cameras can clearly capture the growth of the crop regardless of the lighting conditions. Figure 21 provides an example of the growth trend images collected during the experiment. By analyzing these images, the crop’s growth process can be visualized, offering valuable insights into its physiological mechanisms and growth patterns.

5.4. Experiment on Insecticidal Counting

This platform uses a sound sensor to detect and count insecticidal sounds. When an insecticidal lamp is working, insecticidal sounds are generated, and the sound sensor records the number of insects killed by detecting changes in the level. The amplitude changes reflect the intensity of the insect killing activity. The data in Figure 22 show that the insecticidal lamp generates voltage and sound pulses when working at night. The testing results demonstrate that the sound sensor can effectively collect insecticidal sound data [42].

5.5. Experiment on Upper Computer

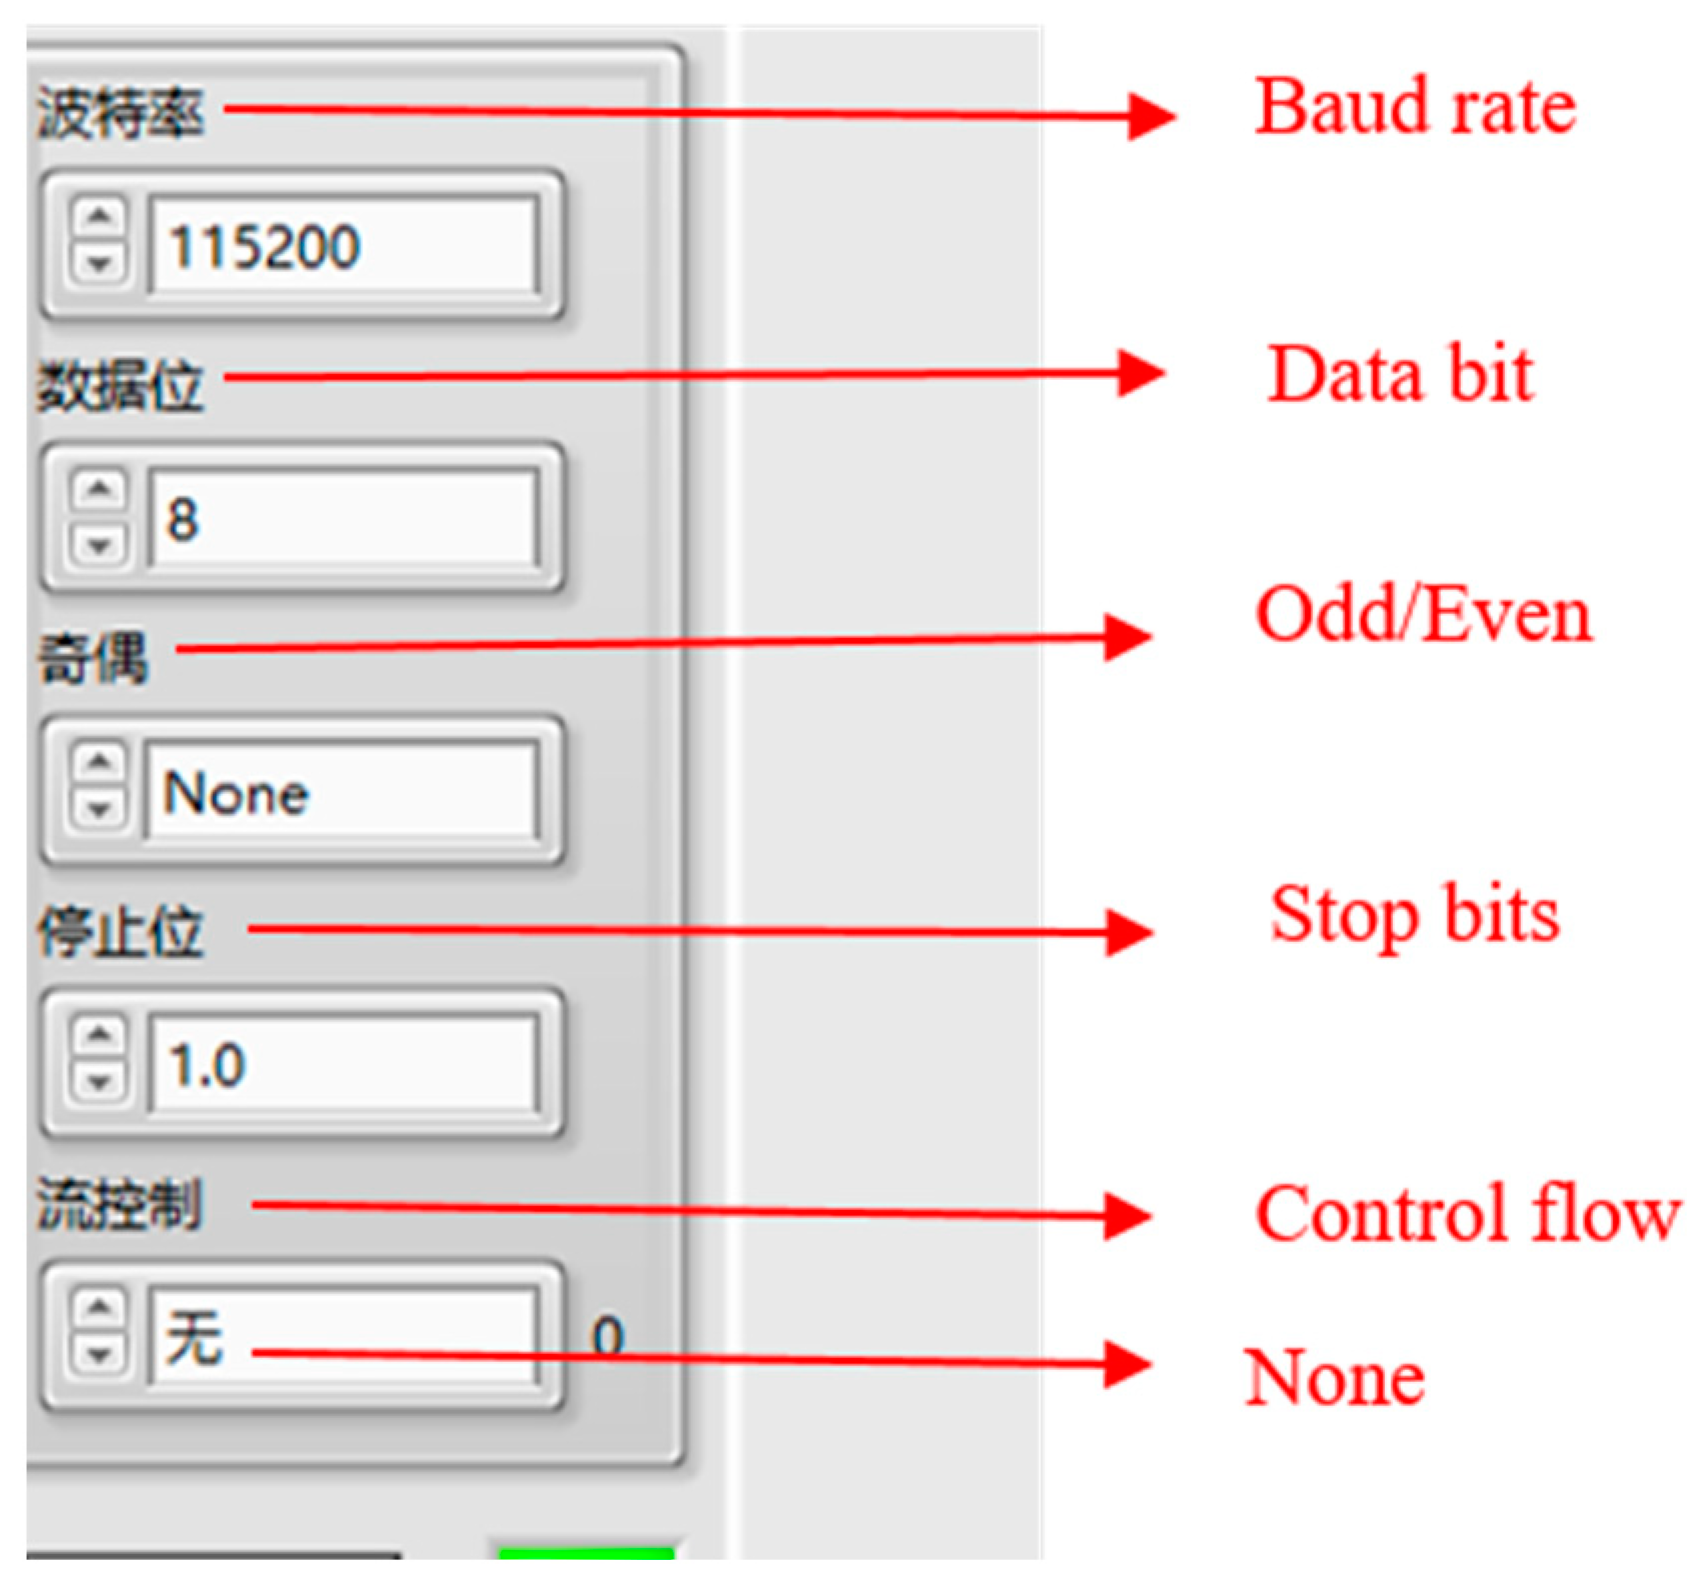
Before testing the real-time reading and storage functions of the upper computer, the serial port must be configured in LabVIEW software. The specific configuration information is shown in Figure 23.
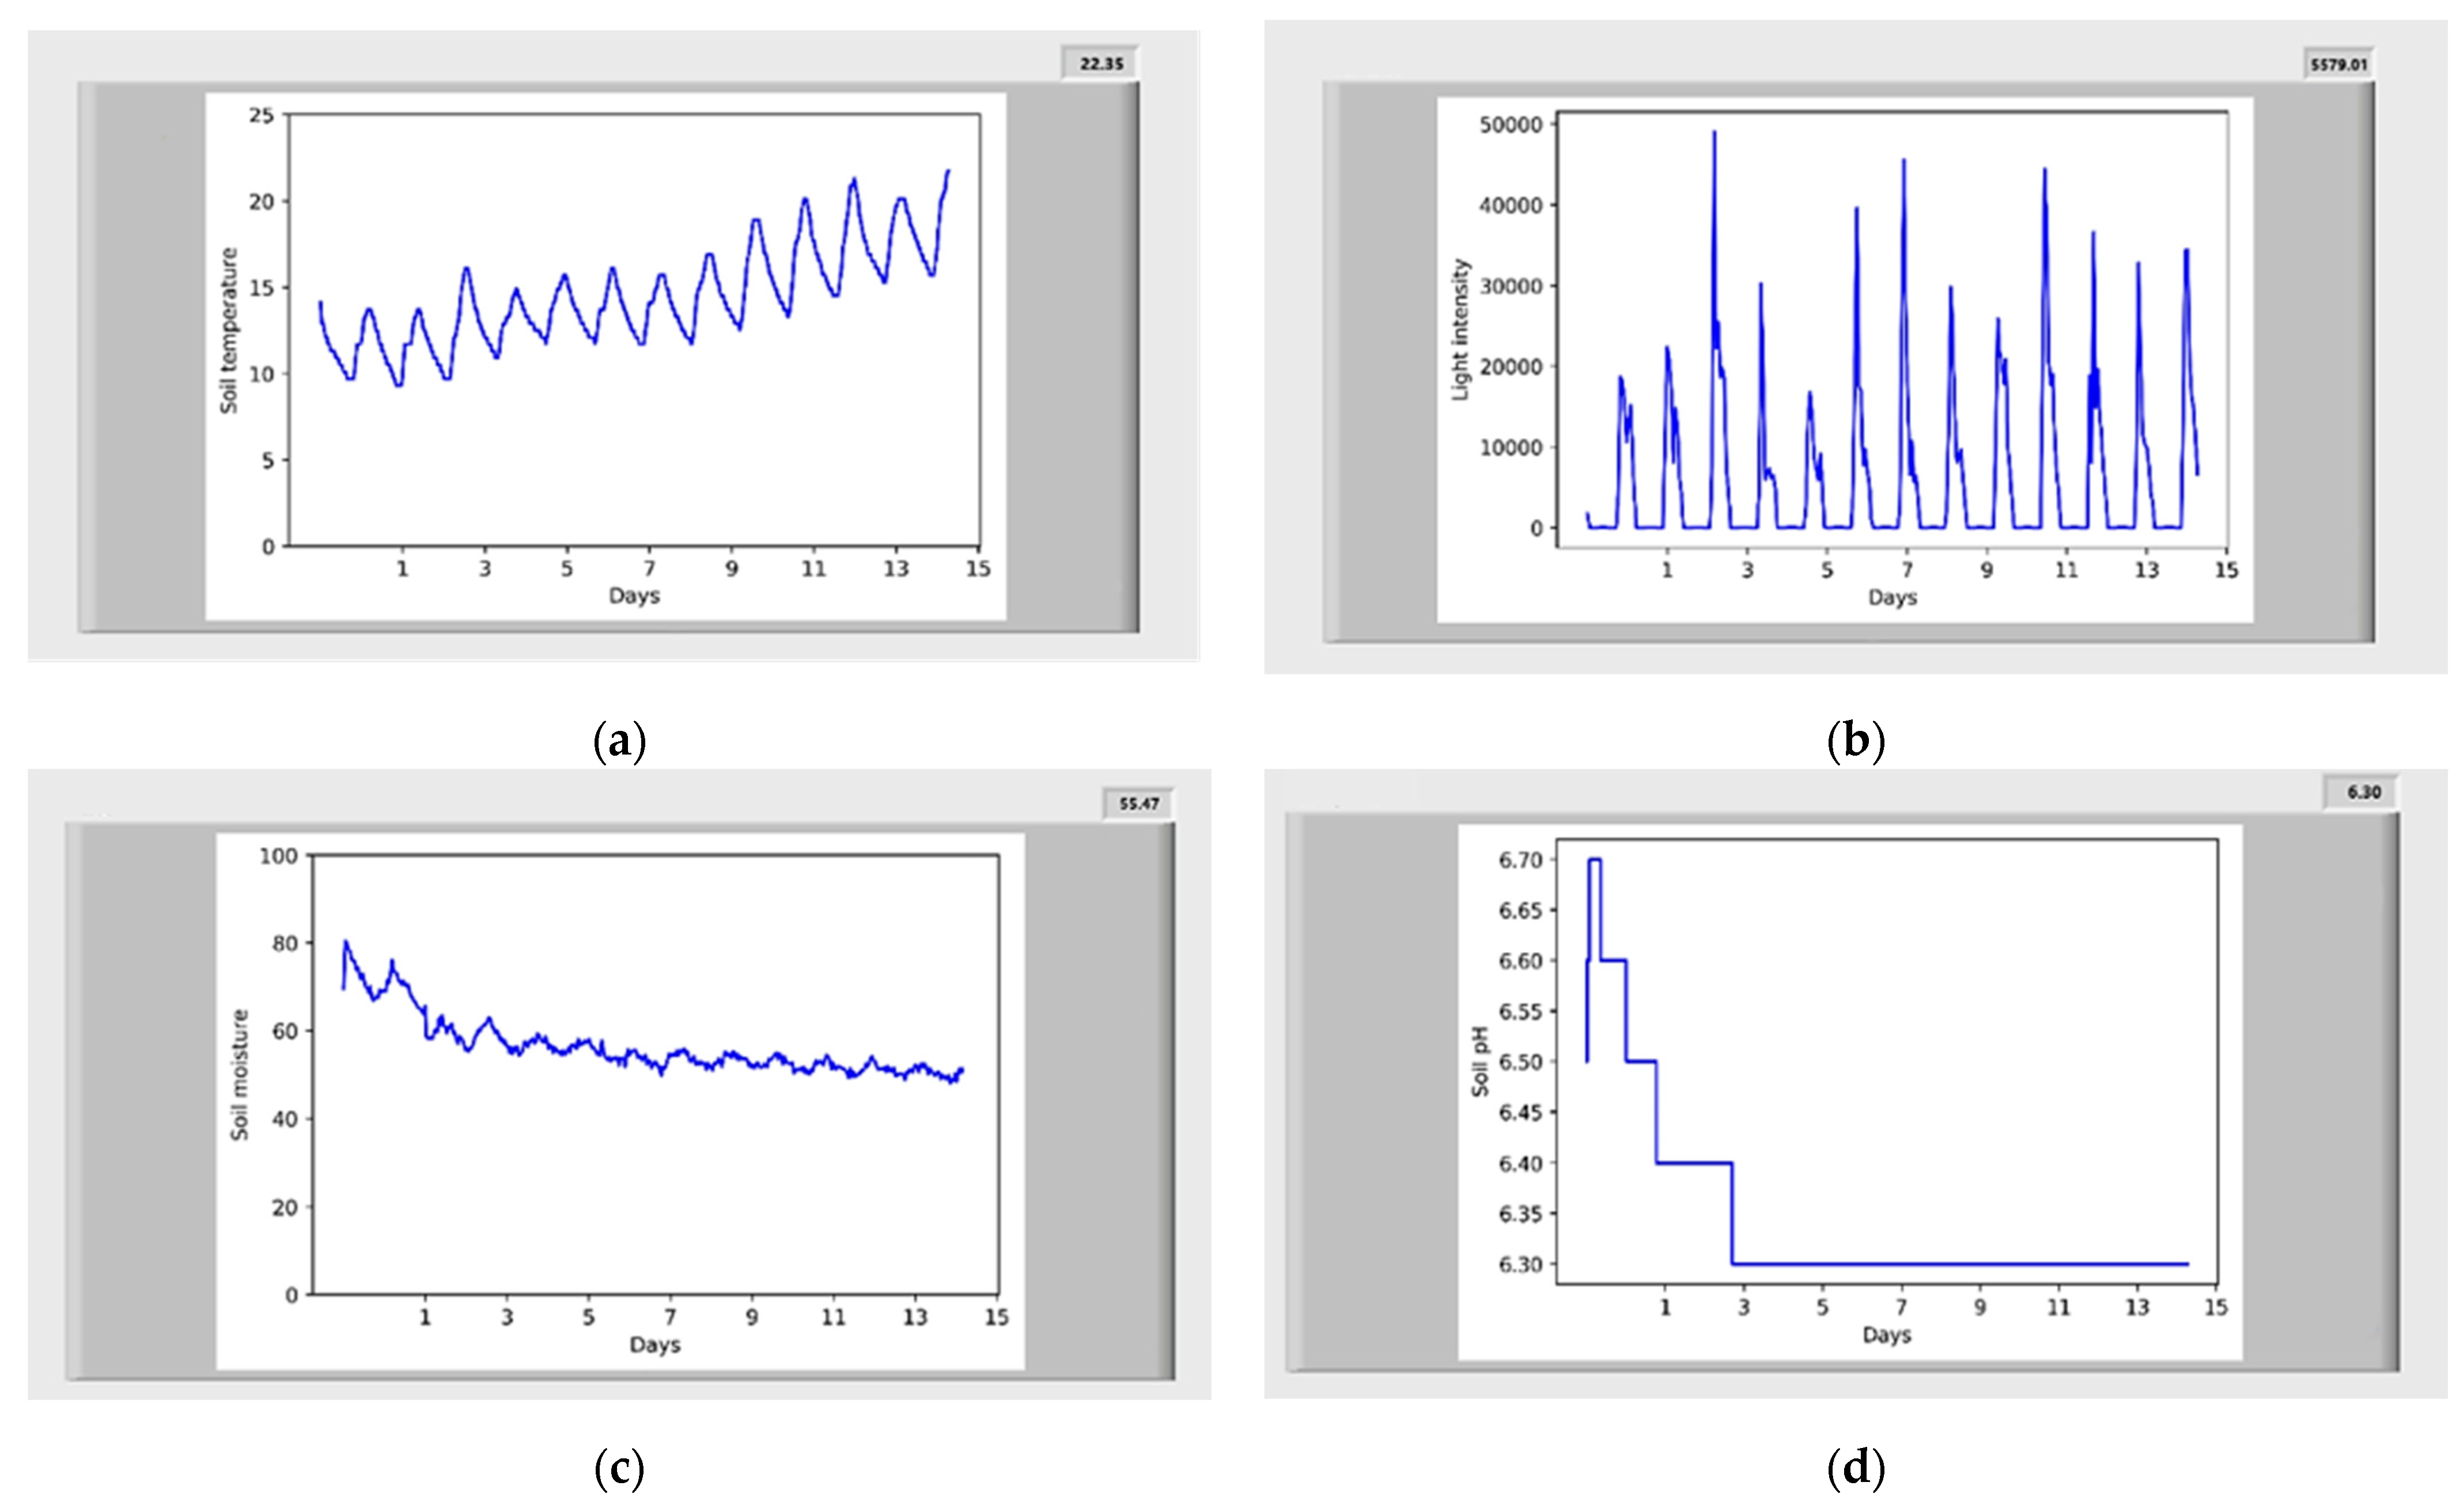
Upon completing the system configuration, users need to log in and open the serial port to receive data. The environmental data display interface on the upper computer allows for real-time observation of the dynamic change curves of the environmental data, as shown in Figure 24. Figure 24a,b illustrate the variation curves of the soil temperature and light intensity over a 15-day period. Both parameters exhibit periodic fluctuations. The soil temperature changes in response to day–night temperature differences and shows a gradual increase as the weather warms during the observation period. The light intensity varies with the alternation of day and night, with its peak value influenced by the natural sunlight. Figure 24c,d show the variation curves of the soil moisture and soil pH over 15 days. Due to the fertilization on the second day of data collection, significant fluctuations in the soil moisture and pH were observed during days 1–3, with smaller fluctuations occurring between days 4 and 15. Section 3.2.1 introduces the buried measurement method of the Kenqi-RS485 soil sensor. This method has more accurate data after a stable period, which is one of the reasons for the fluctuation of the values during days 1–3. Then, the smaller fluctuations occurring between days 4 and 15. The test results demonstrate that the environmental data reception and dynamic curve functions performed well, with strong curve continuity and no noticeable interruptions caused by the discharge of the SILs.

5.6. Performance Comparison

To evaluate the performance of the proposed system, performance indicators such as the pest control, cost, long-term monitoring, data acquisition interval, and multi-view image collection were compared with existing systems (e.g., UAV-based, hyperspectral-based, and sensor-based systems). Table 11 summarizes the comparison results.
Unlike other systems, the proposed system incorporates pest control using an SIL, addressing crop growth monitoring and pest management simultaneously. Compared to UAV-based and hyperspectral-based systems, the proposed system is cost-effective, relying on affordable components such as SILs, sensors, and cameras, making it suitable for large-scale deployment and easy maintenance. Additionally, it supports long-term and continuous monitoring, which most existing systems do not due to reliance on periodic manual intervention or limited endurance. While UAV systems provide only top-view imagery and hyperspectral systems offer single-view perspectives, the proposed system integrates multi-view cameras, capturing the top, left, and right views of crops. This multi-perspective approach enhances the comprehensiveness of crop growth monitoring, improving phenotypic analysis and growth tracking accuracy.
In summary, the proposed system offers an integrated, efficient, and practical solution for crop growth information collection. By combining pest control, real-time monitoring, and multi-view imaging, it addresses the limitations of existing systems, making it a strong candidate for real-time crop monitoring in agricultural fields.

6. Conclusions

This paper introduces a crop growth information collection platform, which adopts SILs as carriers and multi-view cameras as observation tools for realizing comprehensive monitoring of the crop growth process. The platform integrates two hardware modules with the ESP32-S3 as a microprocessor, which are equipped with a variety of environmental sensors and three industrial cameras that can simultaneously capture from the top, left, and right perspectives. By using LabVIEW, the platform realizes real-time data display, dynamic curve plotting, and data storage. The results show that the system excels in data acquisition and real-time transmission. In addition, the proposed system has been successfully applied to planting bases, meeting the requirements of crop pest control and growth information collection. At the same time, this paper has certain limitations. The EICM only collects essential environmental parameters and does not include crop information itself, such as leaf moisture, chlorophyll content, and plant height. Additionally, the dynamic change curve cannot be displayed on mobile devices. Furthermore, the removable stand is not easy to apply to large and long plants. Future work will explore the application of automatic retractable stands in larger agricultural areas.
In the future, due to the increasing demand for tracking and recording the entire process of crop growth in the agricultural field, related equipment and software services will become popular. In order to ensure the long-term feasibility of the platform in sustainable agricultural practices, the following aspects need to be addressed:
(1)
Hardware maintenance and upgrade: Regular replacement of hardware components such as sensors and insecticidal lamp parts is necessary to ensure the system consistently provides high-quality environmental and crop growth data.
(2)
Data acquisition and transmission optimization: Improve data collection modules and refine transmission protocols, e.g., 5G technology, to improve both the accuracy of data collection and the stability of data transmission. Additionally, implement strategies to prevent interference when deploying multiple devices in the field.
(3)
Ecological sustainability: Integrating eco-friendly strategies, such as precise control of the operating times and spectral bands for SILs, can minimize the impact on beneficial insects and reduce the environmental burden.
Through the above measures, the SIL-based crop growth and phenotypic information collection platform will be an essential component of data collection for smart agriculture and promote the development of unmanned farms. The pest control module integrated into the platform can automatically detect pest threats and combine environmental data for intelligent prevention and control. This capability is beneficial for reducing pesticide usage and promoting green agricultural practices. By integrating environmental monitoring and pest control, the system offers a holistic solution for intelligent crop management on unmanned farms. In addition, the proposed system meets the demands of future agricultural, e.g., efficiency, low-energy consumption, and autonomous management.
In summary, the proposed system (1) provides a comprehensive technical path for smart agriculture through the integration of hardware and software; (2) promotes the process of unmanned farms from theory to practice; (3) and provides strong support for the full intelligent management of crop production.

Author Contributions

Conceptualization, L.S. and H.Z.; methodology, L.S. and H.Z.; software, N.J.; hardware K.L.; investigation, N.J. and T.H.; writing—original draft preparation, N.J. and T.H.; writing—T.H.; writing—review and editing, R.H. and X.Y.; project administration, L.S.; funding acquisition, H.Z. All authors have read and agreed to the published version of the manuscript.

Funding

The work is supported by the Huanghuaihai Smart Agriculture Technology Key Laboratory of the Ministry of Agriculture and Rural Affairs (No. 202405) and the Foundation of Key Laboratory of Landscaping (No. KFL202402), Ministry of Agriculture and Rural Affairs, P.R. China.

Data Availability Statement

Data are contained within the article.

Conflicts of Interest

The authors declare no conflicts of interest.

References

  1. Xu, R.; Yang, W.; Hu, G.; Geng, J. Analysis on the Research, Development and Application of Agricultural Insecticidal Lamps in My Country. Agric. Sci. Eng. China 2022, 34, 68–70. [Google Scholar] [CrossRef]
  2. Yao, H.; Shu, L.; Lin, W.; Huang, K.; Martínez-García, M.; Zou, X. Pests Phototactic Rhythm Driven Solar Insecticidal Lamp Device Evolution: Mathematical Model Preliminary Result and Future Directions. IEEE Open J. Ind. Electron. Soc. 2024, 5, 236–250. [Google Scholar] [CrossRef]
  3. Qiu, Z.; Qiu, P.; Zhu, Q.; Wang, R. Insect Trapping Method Based on Progressive Star Network. Int. J. Online Biomed. Eng. (Ijoe) 2015, 11, 56–60. [Google Scholar] [CrossRef]
  4. Tu, H.; Tang, N.; Hu, X.; Yao, Z.; Wang, G.; Wei, H. LED Multispectral Circulation Solar Insecticidal Lamp Application in Rice Field. Trans. Chin. Soc. Agric. Eng. 2016, 32, 193–197. [Google Scholar]
  5. Ma, Q.; Tian, M.; Tang, W. Research and Design of Distributed Solar Insect Killer Lamp Remote Control System Based on WSN. Internet Things Technol. 2017, 7, 77–79+83. [Google Scholar] [CrossRef]
  6. Cao, J. The Design and Research of an Intelligent Solar Insect Killing Lamp. Master’s Thesis, Guizhou University, Guiyang, China, 2018. [Google Scholar]
  7. Zhu, C. Research on Intelligent Management Systemof Plant Protection Insecticide Lamp Basedon Internet of Things Technology. Master’s Thesis, Anhui University, Hefei, China, 2019. [Google Scholar]
  8. Yang, T. Remote Control System of Solar Insecticidal Lamp Based on NB-IoT. Master’s Thesis, Beijing Forestry University, Beijing, China, 2020. [Google Scholar]
  9. Wang, X. Study on Effect of Improved Solar Pest-Killing Lamp on Trapping and Killing Field Pests in Liangshan Prefecture. J. Xichang Univ. (Nat. Sci. Ed.) 2020, 34, 9–13+92. [Google Scholar] [CrossRef]
  10. Han, H.; Zhang, J.; Liu, M.; Zhao, F.; Wang, G.; Lv, Y. The Application of Fan Suction Solar Energy Insecticidal Lamp in Fresh Corn Fields and its Effect on the Biodiversity of Arthropods. J. Plant Prot. 2020, 47, 1234–1243. [Google Scholar] [CrossRef]
  11. Zhang, Z.; Leng, Z.; Zhu, C.; Zhu, Z.; Su, Y. Design and Implementation of Remote State Monito Ring and Control System for Internet of Things Insecticidal Lamp. Comput. Appl. Softw. 2021, 38, 37–41. [Google Scholar]
  12. Wang, J.; Yu, G.; Zhang, E. Plant Protection Insecticide Lamp and Environmental Monitoring System Based on Internet of Things. China Sci. Technol. Inf. 2021, 9, 91–92. [Google Scholar]
  13. Liang, F. Research and Application of Greenhouse Environment Monitoring and Early Warning System. Master’s Thesis, Jilin Agricultural University, Changchun, China, 2016. [Google Scholar]
  14. López-Martínez, J.; Blanco-Claraco, J.L.; Pérez-Alonso, J.; Callejón-Ferre, Á.J. Distributed Network for Measuring Climatic Parameters in Heterogeneous Environments: Application in A Greenhouse. Comput. Electron. Agric. 2018, 145, 105–121. [Google Scholar] [CrossRef]
  15. Foughali, K.; Fathallah, K.; Frihida, A. Using Cloud IOT for disease prevention in precision agriculture. Procedia Comput. Sci. 2018, 130, 575–582. [Google Scholar] [CrossRef]
  16. Wang, X.; Sun, H.; Long, Y.; Zheng, L.; Liu, H.; Li, M. Development of Visualization System for Agricultural UAV Crop Growth Information Collection. IFAC-Pap. 2018, 51, 631–636. [Google Scholar] [CrossRef]
  17. Kochhar, A.; Kumar, N. Wireless Sensor Networks for Greenhouses: An End-to-end Review. Comput. Electron. Agric. 2019, 163, 104877. [Google Scholar] [CrossRef]
  18. Wang, J. Design of Low Power Consumption Wireless System for Information Collection of Facility Agriculture. Master’s Thesis, Hebei Agricultural University, Baoding, China, 2020. [Google Scholar]
  19. Luo, J. Testing and Evaluation of Cgmd302 Crop Growth Monitoring and Diagnosis Instrument. Master’s Thesis, Nanjing Agricultural University, Nanjing, China, 2015. [Google Scholar]
  20. Xu, R. Remote Monitoring Device for Corn Plant Growth Information. Master’s Thesis, Jilin Agricultural University, Changchun, China, 2017. [Google Scholar]
  21. Zhou, T. Estimation of Wheat Yield Based on WOFOST Model and Uavimage Assimilation. Master’s Thesis, Yangzhou University, Yangzhou, China, 2019. [Google Scholar]
  22. Zhou, L. Research on Wheat Phenotypic Information Perception Method Based on Spectrum and Image. Ph.D. Thesis, Zhejiang University, Hangzhou, China, 2022. [Google Scholar]
  23. Wang, W. Study on Rapid Detection Method of Rice Root and Stem Phenotypic Information Under Cadmium Stress. Ph.D. Thesis, Zhejiang University, Hangzhou, China, 2021. [Google Scholar]
  24. Pan, B. Design of Growth Information Detection System for Wheat Plot Breeding Based on Vision. Master’s Thesis, Anhui Agricultural University, Hefei, China, 2022. [Google Scholar]
  25. Li, S.; Zhang, A.; Zhang, X.; Yang, Z.; Li, M. Method for Extracting Three-Dimensional Phenotypic Information of Corn Seedlings at Leaf Scale. Laser Optoelectron. Prog. 2023, 60, 71–79. [Google Scholar]
  26. Wang, N.; Suomalainen, J.; Bartholomeus, H.; Kooistra, L.; Masiliūnas, D.; Clevers, J.G.P.W. Diurnal Variation of Sun-Induced Chlorophyll Fluorescence of Agricultural Crops Observed from A Point-Based Spectrometer on A UAV. Int. J. Appl. Earth Obs. Geoinf. 2021, 96, 102276. [Google Scholar] [CrossRef]
  27. Chamara, N.; Bai, G.; Ge, Y. AICropCAM: Deploying classification, segmentation, detection, and counting deep-learning models for crop monitoring on the edge. Comput. Electron. Agric. 2023, 215, 108420. [Google Scholar] [CrossRef]
  28. Tesfaye, K.; Takele, R.; Shelia, V.; Lemma, E.; Dabale, A.; Sibiry Traore, P.C.; Solomon, D.; Hoogenboom, G. High Spatial Resolution Seasonal Crop Yield Forecasting for Heterogeneous Maize Environments in Oromia, Ethiopia. Clim. Serv. 2023, 32, 100425. [Google Scholar] [CrossRef]
  29. Song, Y.; Bi, J.; Wang, X. Design and Implementation of Intelligent Monitoring System for Agricultural Environment in IoT. Internet Things 2024, 25, 101029. [Google Scholar] [CrossRef]
  30. Chen, T.; Tang, H. Remote Monitoring and Forecasting System of Soil Moisture Based on ARM and GPRS. Trans. CSAE 2012, 28, 162–166. [Google Scholar]
  31. Qin, Y.; Chen, X.; Zhou, K.; Klenk, P.; Roth, K.; Sun, L.; Dai, H.; Huang, D.; Mao, H. Ground-penetrating Radar for Monitoring theDistribution of Near-surface Soil Water Content in the Gurbantünggüt Desert. Environ. Earth Sci. 2013, 70, 7. [Google Scholar] [CrossRef]
  32. Tan, Y. Rescarch of Wirelcss Mcasurement Systerm for Soil Moisture. Master’s Thesis, Anhui Agricultural University, Hefei, China, 2013. [Google Scholar]
  33. Xue, F. Study on Intelligent Acquisition System of Farmland Soil Information. Master’s Thesis, Nanjing University of Information Science and Technology, Nanjing, China, 2014. [Google Scholar]
  34. Gao, Z.; Liu, X. Chinese Herbal Medicine Soil Detection System Based on ZigBee. J. Jingchu Univ. Technol. 2014, 29, 37–41. [Google Scholar] [CrossRef]
  35. Xiao, Y.; Li, H.; Wang, X. Soil Moisture Monitoring System. In Proceedings of the Exploring Science Academic Seminar (2016), Changsha, China, 18–20 March 2016; p. 1. [Google Scholar]
  36. Qin, L.; Mu, Y.; Liu, S.; Shang, M. Design and Implementation of A Multi-Parameter Monitoring Station for Soil Moisture and Environmental Information In Winter Wheat Production. Internet Things Technol. 2019, 9, 13–15+18. [Google Scholar] [CrossRef]
  37. Cao, Y.; Zhou, H.; Yin, F. Design of Multi-purpose Soil Moisture Collection Device. Wirel. Internet Technol. 2022, 19, 116–118. [Google Scholar]
  38. Zhu, W.; Feng, Z.; Wu, S.; Mei, H.; Cui, B.; Wei, X.; Luo, J. Development of An Airborne Non-contact Near-infrared Soil Moisture Detection System. Trans. Chin. Soc. Agric. Eng. 2022, 38, 73–80. [Google Scholar]
  39. Ji, W.; Wang, J.; Wang, X. Design of Multi-parameter Monitoring System of Agricultural Field Soil Based on LoRa. Radio Eng. 2023, 53, 456–464. [Google Scholar]
  40. Kang, M.; Wang, F.-Y. From Parallel Plants to Smart Plants: Intelligent Control and Management for Plant Growth. IEEE/CAA J. Autom. Sin. 2017, 4, 161. [Google Scholar] [CrossRef]
  41. Friha, O.; Ferrag, M.A.; Shu, L.; Maglaras, L.; Wang, X. Internet of Things for the Future of Smart Agriculture: A Comprehensive Survey of Emerging Technologies. IEEE/CAA J. Autom. Sin. 2021, 8, 718. [Google Scholar] [CrossRef]
  42. Yang, X.; Shu, L.; Li, K.; Huo, Z.; Shu, S.; Nurellari, E. SILOS: An Intelligent Fault Detection Scheme for Solar Insecticidal Lamp IoT with Improved Energy Efficiency. IEEE Internet Things J. 2023, 10, 920–939. [Google Scholar] [CrossRef]
Figure 1. Development history of insecticidal lamps [2].
Electronics 14 00370 g001
Figure 2. System framework.
Electronics 14 00370 g002
Figure 3. Deployment diagram.
Electronics 14 00370 g003
Figure 4. Overall hardware structure design.
Electronics 14 00370 g004
Figure 5. Components of the SIL.
Electronics 14 00370 g005
Figure 6. Circuit design of the environmental information collection module.
Electronics 14 00370 g006
Figure 7. Physical figure of the PCB and related interfaces.
Electronics 14 00370 g007
Figure 8. Schematic diagram of the image information collection module.
Electronics 14 00370 g008
Figure 9. Software architecture of the crop growth information collection system.
Electronics 14 00370 g009
Figure 10. Flowchart of reading temperature and humidity data by the DHT11 sensor.
Electronics 14 00370 g010
Figure 11. DHT11 data packet format.
Electronics 14 00370 g011
Figure 12. Flowchart of reading temperature data by the DS18B20 sensor.
Electronics 14 00370 g012
Figure 13. Flowchart of reading light intensity data by the GY-39.
Electronics 14 00370 g013
Figure 14. Modbus protocol data format.
Electronics 14 00370 g014
Figure 15. Flowchart of the camera driver.
Electronics 14 00370 g015
Figure 16. Growth trend chart of chrysanthemum during its growing period (this figure is supported by the Key Laboratory of Landscaping, Ministry of Agriculture and Rural Affairs, Nanjing Agricultural University, Nanjing, China).
Electronics 14 00370 g016
Figure 17. Experimental equipment deployment diagram.
Electronics 14 00370 g017
Figure 18. Sample of the environmental data. (a) Data frames collected by the sensors. (b) Environmental data after parsing.
Electronics 14 00370 g018
Figure 19. Equipment connection and layout.
Electronics 14 00370 g019
Figure 20. Sample of chrysanthemum images.
Electronics 14 00370 g020
Figure 21. Sample of chrysanthemum growth trend images.
Electronics 14 00370 g021
Figure 22. Sample of the voltage impulse and acoustic impulse in the data frames.
Electronics 14 00370 g022
Figure 23. Serial configuration, where the Chinese configuration information is translated into English in the figure.
Electronics 14 00370 g023
Figure 24. The fluctuation curves of the soil temperature, light intensity, soil moisture, and soil pH over 15 days: (a) soil temperature, (b) light intensity, (c) soil moisture, and (d) soil pH value.
Electronics 14 00370 g024
Table 1. Application status of the camera in the SIL system.
YearResearcherResearch ContentCamera FunctionCrop Growth Detection
2015Qiu et al. [3]Design a “star net” composed of different types of insecticidal lampsNoNo
2016Tu et al. [4]Design an LED multispectral SIL that uses light of different wavelengths to kill corresponding insectsNoNo
2017Ma et al. [5]Collect the working environment data of insecticidal lamps and capture insecticidal pictures in real time, and upload them in real time through WSN technologyPest identification, pest monitoring, insecticidal lamp controlNo
2019Cao [6]Design a solar self-luminous multi-mode insecticidal lamp using luminescent materialsNoNo
2019Zhu [7]Use IoT technology to realize remote control of insecticidal lampsInsecticidal lamp working status monitoringNo
2019Yang [8]Use NB-IoT technology to realize remote monitoring of insecticidal lampsNoNo
2020Wang [9]Improve light spectrum to increase pest killing rateNoNo
2020Han et al. [10]Analyze the effectiveness of fan-suction SILs in corn fieldsNoNo
2021Zhang et al. [11]Design a system for remote status monitoring and control of IoT-based SILsInsecticidal lamp working status monitoringNo
2021Wang et al. [12]Design an insecticidal lamp that can change the color of the light and monitor the surrounding environmentNoNo
Table 2. Recent advances in SIL products.
Company NameProduct ModelCameraEnvironmental Information CollectionCrop Growth Environment Monitoring
Zhejiang Longhao Agricultural Technology Co., Ltd., Taizhou, China.Solar frequency-vibration insecticidal lamp GP-LH18BNoAtmospheric temperature and humidityNo
Changzhou Jinhe New Energy Technology Co., Ltd., Changzhou, China.Electric shock insecticidal lamp 3S-SPX-JH-DJ01NoLight intensity, temperature and humidityNo
Chengdu Bion Technology Co., Ltd., Chengdu, China.Solar insecticidal lamp BA-T/RLNoAtmospheric temperatureNo
Shandong Wanxiang Environmental Technology Co., Ltd., Weifang, China.Solar pest monitoring lamp WX-CQD6YesLight intensity, weather conditionsNo
Shandong Tianhe Environmental Technology Co., Ltd., Weifang, China.Pest monitoring lamp TH-CQ1YesLight intensity, weather conditionsNo
Table 3. Current status of research on agri-environmental information collection systems.
YearResearcherData CollectionImage Collection FunctionRelated to Growth Information Collection
2016Liang [13]Temperature and humidity, light intensity, CO2 concentrationNoNo
2018López-Martínez et al. [14]Atmospheric temperature and humidity, soil temperature and humidity, light intensityNoNo
2018Foughali et al. [15]Air humidity, CO2 concentration, light intensityNoNo
2018Xu Wang [16]Light intensity, UAV information collection, remote systemNoNo
2019Kochhar et al. [17]/NoNo
2020Wang [18]Air temperature and humidity, CO2 concentration, light intensity, soil temperature and humidityNoNo
Table 4. Recent research on crop growth information collection systems.
YearResearcherEnvironmental ParametersImage Collection DeviceRelated to SILs
2015Luo [19]Leaf area, leaf dry weight and nitrogen contentCGMD302 crop growth monitor (National Engineering and Technology Center for Information Agriculture, Nanjing, China.)No
2017Xu [20]Corn growth imageCMOS image sensor (OmniVision Technologies, Inc., Santa Clara, CA, USA.)No
2019Zhou [21]Wheat growth imageUAVsNo
2021Zhou [22]Wheat seed, leaf moisture content and canopy informationHyperspectral instrument and UAVsNo
2021Wang [23]Rice rhizome informationHyper-spectrometerNo
2022Pan [24]Wheat growth imageHT SUA502-T (Shenzhen Huateng Vision Technology Co., Ltd., Shenzhen, China.)No
2022Li et al. [25]Corn seedling image, plant height and leaf perimeterHUAWEI P30 (Huawei Technologies Co., Ltd., Shenzhen, China.)No
2021Wang et al. [26]Crop traits, day and night patternsUAVsNo
2023Nipuna et al. [27]Crop classification, plant type identification and countingMeidas SL122 trail cameras, OV5642 imaging sensors with ArduCAM camera, Raspberry Pi cameraNo
2023Kindie et al. [28]Soil, temperature, humidity, climateNoNo
2024Song et al. [29]Temperature, humidity, light intensityCloud big screenNo
Table 5. Recent research on soil monitoring technology.
YearResearcherCollection DeviceSoil DataRelated to SILs
2013Qin et al. [31]RadarSoil moisture contentNo
2013Tan [32]Soil temperature and humidity sensor, DS18B20 temperature sensor (Dallas Semiconductor Corporation, Dallas, TX, USA.)Soil moisture contentNo
2014Xue [33]SHT11 temperature and humidity sensor (SENSIRION, Zurich, Switzerland.)Soil temperature and humidityNo
2014Gao et al. [34]Soil moisture sensor, pH sensorSoil moisture, pH valueNo
2016Xiao et al. [35]Soil temperature and humidity sensorSoil temperature, moisture contentNo
2019Qin et al. [36]Soil moisture sensorSoil moisture contentNo
2022Cao et al. [37]Soil temperature and humidity sensor, conductivity sensorSoil moisture contentNo
2022Zhu et al. [38]Near-infrared spectrumSoil temperature and humidityNo
2023Ji et al. [39]MS10 soil temperature and humidity sensor, VMS-3000-TR-PH-N01 nitrogen, phosphorus and potassium sensorSoil temperature and humidity, nutrient contentNo
Table 6. DHT11 temperature and humidity sensor parameters.
Parameter NameParameter Value
Working voltage3–5.5 V
Humidity measurement range20~90% RH
Temperature measurement range0~50 °C
Humidity accuracy±5% RH
Temperature accuracy±2 °C
Output signalDigital signal
Table 7. DS18B20 temperature sensor parameters.
Parameter NameParameter Value
Working voltage3–5.5 V
Measurement range−55 °C~125 °C
Temperature accuracy±0.5 °C
Data transmission methodDigital signal
Table 8. GY-39 light intensity sensor parameters.
Parameter NameParameter Value
Working voltage3.3 V~5 V
Working current5 mA
Temperature measurement range−40 °C~85 °C
Humidity measurement range0~100%
Light intensity measurement range0.045 lux~188,000 lux
Light intensity accuracy±5%
Data transmission methodDigital signal
Table 9. Kenqi-RS485 soil sensor parameters.
Parameter NameParameter Value
Working voltage12 V~24 V DC
Working temperature range−40 °C~85 °C
Response time≤1 s
Soil temperature accuracy±0.5 °C
Soil moisture accuracy±3% (0~53 °C)
±5% (53~100 °C)
Soil conductivity accuracy±3%
Soil PH accuracy±0.3 pH
Soil NPK accuracy±2% F·s
Table 10. Component and related parameters of the multi-view image collection module.
ComponentModelAdvantages
NanoPiNanoPi M4BFast data processing speed, rich interfaces
Industry cameraKS8A583High resolution, high frame rate, low noise
Table 11. Performance comparison with existing systems.
SystemPest ControlCostLong-Term MonitoringData Acquisition IntervalMulti-View Image Collection
Sensor-based [20]NoLowNoNoNo
UAV-based [22]NoHighNoNoTop view
Hyperspectral-based [23]NoHighNo5 daysNo
UAV- and hyperspectral-based [26]NoVery highNoAbout 25 minTop view
Proposed systemYesLowYesReal timeTop, left and right view
Disclaimer/Publisher’s Note: The statements, opinions and data contained in all publications are solely those of the individual author(s) and contributor(s) and not of MDPI and/or the editor(s). MDPI and/or the editor(s) disclaim responsibility for any injury to people or property resulting from any ideas, methods, instructions or products referred to in the content.