Abstract
Finger vein recognition has gained significant attention for its importance in enhancing security, safeguarding privacy, and ensuring reliable liveness detection. As a foundation of vein recognition systems, vein detection faces challenges, including low feature extraction efficiency, limited robustness, and a heavy reliance on real-world data. Additionally, environmental variability and advancements in spoofing technologies further exacerbate data privacy and security concerns. To address these challenges, this paper proposes MixCFormer, a hybrid CNN–transformer architecture that incorporates Mixup data augmentation to improve the accuracy of finger vein liveness detection and reduce dependency on large-scale real datasets. First, the MixCFormer model applies baseline drift elimination, morphological filtering, and Butterworth filtering techniques to minimize the impact of background noise and illumination variations, thereby enhancing the clarity and recognizability of vein features. Next, finger vein video data are transformed into feature sequences, optimizing feature extraction and matching efficiency, effectively capturing dynamic time-series information and improving discrimination between live and forged samples. Furthermore, Mixup data augmentation is used to expand sample diversity and decrease dependency on extensive real datasets, thereby enhancing the model’s ability to recognize forged samples across diverse attack scenarios. Finally, the CNN and transformer architecture leverages both local and global feature extraction capabilities to capture vein feature correlations and dependencies. Residual connections improve feature propagation, enhancing the stability of feature representations in liveness detection. Rigorous experimental evaluations demonstrate that MixCFormer achieves a detection accuracy of 99.51% on finger vein datasets, significantly outperforming existing methods.
1. Introduction
Biometrics [1] is a method of identity recognition or verification based on an individual’s inherent biological characteristics. Compared to traditional authentication methods, such as passwords, identification cards, and physical keys, biometric features offer distinct advantages: they are not only challenging to replicate but also immune to being forgotten, thus significantly enhancing both security and convenience. Currently, biometric authentication techniques are broadly classified into two categories: physiological features [2] and behavioral patterns [3]. Physiological features include static biometric identifiers, such as fingerprint recognition [4], face recognition [5], vein recognition [6], and iris recognition [7], whereas behavioral patterns encompass dynamic characteristics related to user behavior, such as gait [8], eye movement [9], signature [10], and voice [11].
Vein recognition technology is increasingly gaining prominence in the field of biometric identification due to its unique physiological characteristics and resistance to forgery. Venous blood vessels, which are located beneath the skin, exhibit high connectivity and are difficult to observe under visible light [12]. To capture vein patterns, infrared light with a wavelength of approximately 850 nm is typically employed, as it can penetrate the skin and reveal the underlying vascular structures. This characteristic confers a significant advantage in terms of the stability and biological viability of vein-based biometric traits. However, with the widespread adoption of biometric systems, there has been a concurrent rise in the sophistication of attacks targeting these systems [13]. A growing concern is the threat of spoofing, in which attackers attempt to bypass authentication mechanisms using forged, printed, or electronically reproduced vein patterns. Such attacks pose a substantial risk to the security and integrity of biometric systems. Consequently, ensuring the robustness of these systems—particularly in terms of preventing spoofing and implementing reliable liveness detection—has become an urgent and critical challenge.
1.1. Related Work
The primary objective of finger vein liveness detection is to confirm that the user is a living physiological entity and to ensure that the biometric traits being presented originate from a living individual rather than from a static image or synthetic material. Currently, the methods for biometric in vivo detection can be broadly classified into two categories: traditional methods and deep-learning-based methods.
Traditional methods mainly rely on feature analysis techniques and are divided into three main categories, such as manual feature extraction, machine-learning algorithms, and biophysical feature detection. (1) Manual feature extraction techniques, such as edge detection [14] and texture analysis [15], have been widely employed in vein recognition. For example, in [16], Gabor filters and local binary patterns (LBP) are utilized to differentiate between live and forged vein samples by extracting features from vein images. While these methods have demonstrated promising results in terms of recognition accuracy, they are often sensitive to variations in lighting conditions and image quality, and their robustness remains a challenge. (2) Machine-learning algorithms, including support vector machines (SVMs) and random forests, are commonly applied for vein feature classification and recognition. In [17], SVM was used to enhance the accuracy of vein liveness detection, while [3] investigated the impact of feature fusion on detection performance. However, these traditional machine-learning approaches still face limitations in terms of adaptability and generalization when handling complex datasets, particularly struggling with diverse attack scenarios. (3) Biophysical detection methods, such as blood flow monitoring and temperature change analysis, have been explored to improve vein liveness detection. In [18], a real-time blood flow monitoring technique was proposed to enhance the reliability of liveness detection, while [19] introduced a method based on temperature variations for vein liveness recognition. Although these approaches improve security to some extent, the challenge of effectively integrating multiple detection mechanisms to address emerging attack strategies remains a pressing issue in practical applications.
Deep-learning-based methods have demonstrated exceptional performance in finger vein liveness detection, leveraging a range of advanced algorithms, including convolutional neural networks (CNNs) [20], long short-term memory networks (LSTMs) [21], transformers [22], and multimodal learning approaches [23], among others. Researchers have capitalized on the robust image processing capabilities of CNNs to automatically extract features from vein images through multiple layers of convolution and pooling operations, significantly enhancing recognition accuracy [24]. Meanwhile, LSTMs are well suited for capturing dynamic features within sequential vein images owing to their ability to process time-series data, thus improving the system’s adaptability to complex, real-world environments [21]. Building on this, studies such as [25,26] have combined CNNs and LSTMs to further boost recognition performance by utilizing CNNs to extract spatial features and LSTMs to handle temporal dependencies. Additionally, the transformer architecture has been employed in [27] to capture global feature information using a self-attention mechanism, making it particularly effective for processing high-dimensional data and yielding superior recognition results. For instance, Qin et al. [28] introduced a label-enhanced multiscale vision transformer for palm vein recognition, while an attention-based label enhancement (ALE) scheme, combined with an interactive vein transformer (IVT) [22], was proposed to learn label distributions for vein classification tasks. Wang et al. [29] also proposed a hybrid deep-learning model that integrates the strengths of both CNNs and transformers, further improving vein recognition performance. Multimodal learning, on the other hand, strengthens the robustness of the system by fusing multimodal data, such as vein images, fingerprints, and facial features. For example, [30,31] proposed a multimodal framework based on CNNs, which significantly enhances recognition accuracy by combining vein and fingerprint features. Similarly, ref. [32] improved the system’s ability to handle complex environments by integrating vein images with electrocardiogram (ECG) data using a multi-channel CNN. Moreover, the deep fusion framework developed by Alay et al. [33] demonstrated a substantial improvement in both security and accuracy by jointly analyzing vein images, iris, and facial features. Additionally, Tao et al. [34] applied transfer learning in multimodal settings, which reduced the dependence on large training datasets, thereby enhancing the overall recognition performance.
1.2. Motivation
Based on the analysis above, we observe that traditional manual feature extraction techniques, such as edge detection and texture analysis, can enhance recognition accuracy to some extent. However, their robustness is compromised by variations in lighting conditions and image quality, which results in insufficient reliability in practical applications. Moreover, machine-learning algorithms exhibit limited adaptability and generalization ability when dealing with complex data, particularly when confronted with diverse attack scenarios. Biophysical feature detection methods, while providing an additional layer of judgment based on physiological characteristics, still face limitations in terms of real-time processing and adaptability. In contrast, deep-learning methods, including CNNs, LSTMs, and transformers, demonstrate superior capabilities in feature extraction and dynamic behavior analysis. However, these approaches are not without their shortcomings. Although CNNs excel at feature extraction, they are highly sensitive to noise and lighting variations, which can lead to lower recognition rates [35]. Furthermore, CNNs are prone to overfitting when trained on smaller datasets, especially when data diversity is limited. In such cases, the model may learn unrepresentative features, negatively affecting its accuracy in real-world applications [36]. While generative adversarial networks (GANs) can augment data, they tend to be unstable when generating small sample sizes or specific features (e.g., finger vein patterns), leading to the production of samples with significant deviations that reduce the model’s generalization ability [37]. LSTMs, which are designed to capture dynamic features in time-series data, face challenges related to high computational complexity and the issue of vanishing gradients when dealing with long sequences [38]. Although transformers can capture global features through a self-attention mechanism, they require large amounts of training data to perform optimally and exhibit poor performance in small-sample environments [39]. Additionally, due to the relatively subtle nature of finger vein features and the limited sample size, the transformer model may struggle to fully extract local features, which negatively impacts recognition accuracy [12,40]. In multimodal learning, the fusion of multiple biological features may result in information conflict due to the inherent heterogeneity of the features, which can affect the overall recognition performance [41]. Furthermore, multimodal models typically require large amounts of labeled data for adequate training, which presents challenges in real-world applications, particularly in terms of privacy and data collection [23]. Moreover, these models often exhibit high computational complexity and poor real-time performance, making them less suitable for scenarios that require rapid responses.
In summary, the existing deep-learning methods for finger vein liveness detection face several key challenges: (1) Insufficient Robustness: Although deep-learning techniques excel at feature extraction, their ability to withstand biometric attacks, such as forgery or spoofing, has not been fully validated. This lack of robustness makes the system vulnerable to various types of attacks, compromising its security and reliability. (2) High Data Dependency: Deep-learning models typically require large quantities of high-quality labeled data for effective training. However, in the context of finger vein liveness detection, obtaining such data is often hindered by privacy concerns and difficulties in data collection. This heavy reliance on extensive datasets limits the applicability of deep-learning models in small-sample scenarios, making it challenging to achieve satisfactory performance in real-world applications where data may be limited. (3) High Computational Complexity and Poor Real-Time Performance: Deep-learning models are computationally intensive, and overfitting can occur, particularly when training data are sparse. Overfitting reduces the model’s ability to generalize to unseen data, thereby diminishing detection accuracy. This is especially problematic when the model encounters novel attack samples, as it may struggle to accurately identify new or previously unseen threats. Furthermore, the high computational demands of deep-learning models can result in poor real-time performance, which is critical in time-sensitive applications, further limiting their effectiveness in practical deployment.
1.3. Our Work
To address the shortcomings in existing finger vein liveness detection methods, we propose a hybrid CNN–transformer architecture based on Mixup data enhancement, named MixCFormer, which improves the robustness and generalization ability of the model through the introduction of residual linking. The MixCFormer architecture consists of three main modules: Firstly, a preprocessing method involving baseline drift elimination and morphological filtering is used to extract features from finger vein videos. This approach reduces the interference of background noise and illumination changes, enhances the prominence of vein features, and improves the model’s resistance to forgery and overall robustness. Secondly, sample augmentation is achieved through the Mixup data enhancement module, which alleviates the issue of insufficient training data and significantly improves the model’s adaptability to diverse attack samples. Finally, a complementary feature extraction architecture that combines convolutional neural networks (CNNs) and the transformer is adopted. Deeper feature fusion between local and global features is facilitated through residual linking, where the CNN branch extracts local, detailed features, and the transformer branch captures global dependencies, resulting in a more comprehensive and robust feature representation. To summarize, the contributions of our work are summarized as follows:
- MixCFormer Architecture: We propose MixCFormer, a convolutional–transformer hybrid architecture with residual linking, which combines the local feature extraction capabilities of CNNs with the global context modeling of transformers. The CNN branch captures local vein texture features, while the transformer branch integrates global information to capture long-range dependencies. Residual linking enhances the efficiency of feature transfer, improving the stability of feature representation. This architectural synergy enables MixCFormer to achieve higher accuracy and robustness in the complex task of finger vein liveness detection.
- Mixup Data Enhancement: We introduce the Mixup data augmentation technique to improve the generalization ability of the model, reduce reliance on large-scale real datasets, and enhance the recognition accuracy for forged samples. Additionally, we construct a novel dataset that includes real live finger vein data as well as three types of attack samples (two live attacks and one non-live attack). This dataset enriches the diversity of training samples and provides a comprehensive validation foundation, enhancing the model’s ability to recognize and resist various attack scenarios.
- Feature Sequence Processing: We propose an innovative approach that converts finger vein video data into feature sequences for more efficient processing. This method optimizes feature extraction and matching by capturing dynamically changing temporal information, which enhances the discriminative power between live and forged vein samples. As a result, the model’s real-time performance and recognition speed are improved.
- Noise and Light Variation Suppression Techniques: For the first time, we apply a combination of baseline drift cancellation, morphological filtering, and Butterworth filtering to mitigate the impact of noise and light variation on finger vein liveness detection. Baseline drift cancellation eliminates low-frequency noise; morphological filtering optimizes image structure and accentuates vein features; and Butterworth filtering reduces high-frequency noise. The integration of these three techniques significantly enhances the model’s robustness, maintaining excellent detection performance under complex lighting conditions and noisy environments, thereby improving the overall reliability and practicality of the system.
- Experimental Validation and Performance Enhancement: Rigorous experimental evaluations demonstrate that MixCFormer outperforms the current state-of-the-art methods in terms of detection accuracy on finger vein datasets. This performance validation underscores the effectiveness and innovation of the proposed architecture, highlighting MixCFormer’s potential for enhanced performance and broader application in finger vein liveness detection tasks.
2. The Proposed Approach
2.1. MixCFormer Model
The architecture of the MixCFormer algorithm is illustrated in Figure 1. The process begins with the preprocessing of a vein image that contains both live vein data and three types of attack data (two live attacks and one non-live attack). To mitigate the effects of background noise and illumination variations, three techniques—baseline drift elimination, morphological filtering, and Butterworth filtering—are applied. These methods effectively reduce unwanted noise and simultaneously optimize the feature structure of the vein image, thereby enhancing the clarity and distinctiveness of the vein patterns. Following this, two vein images are randomly selected from each training batch and combined using the Mixup technique. The images are linearly fused based on weighted coefficients, generating a new sample with blended features. The weights are drawn randomly from a Beta distribution, which ensures a diverse set of samples, thus improving the generalization capacity and robustness of the model. Finally, a hybrid CNN–transformer architecture is employed to fully exploit the strengths of both convolutional neural networks (CNNs) and transformer models for efficient feature extraction and global modeling of vein characteristics. The CNN is responsible for extracting local features from the finger vein images, preserving fine details and texture information. Meanwhile, the transformer’s self-attention mechanism models global vein features by capturing dependencies across different regions, thereby enhancing the ability to distinguish between live and fake vein patterns. Moreover, residual connections are utilized to facilitate the exchange of features between the CNN and transformer modules, promoting the stability of feature representations and improving the transfer of depth information across layers. This dual-module approach ensures both local detail preservation and comprehensive global context understanding, leading to a more robust and discriminative model for vein recognition.
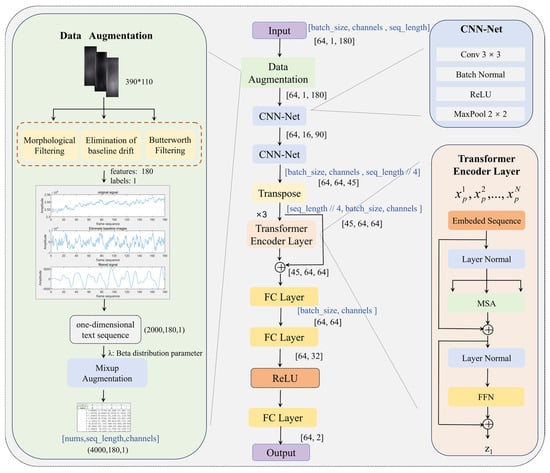
Figure 1.
MixCFormer structure.
2.2. Data Acquisition and Processing
2.2.1. Acquisition of Attack Data
The schematic diagram of the finger vein image acquisition process is shown in Figure 2. A finger vein acquisition device and a finger-clip pulse oximeter, developed by our team (Figure 3), were used to construct large-scale, refined finger vein video datasets. The datasets comprised both real vein samples and three types of attack sample video data, totaling 10,476 video samples. The specific data collection methods are as follows:
- (1)
- Acquisition of Real Human Vein Data: The heart rate of each subject was first measured using a finger-clip pulse oximeter to confirm their liveliness. Subsequently, the finger vein acquisition device was used to capture video data of the veins from the index, middle, and ring fingers of both hands. This process was repeated six times for each subject, with vein data collected from all six fingers. Before each acquisition, the heart rate was re-measured to ensure the validity of the data, ensuring that all six sets of video samples were from live subjects, thus providing high-quality finger vein data.
- (2)
- Acquisition of Heart-Rate-Based Attack Data: To increase the diversity of attack samples, two types of heart-rate-based attack data were designed:
- Attack Type I: The subject wore thin gloves with disturbance patterns (Figure 4a), simulating surface disturbances on the finger veins. The data collection process was identical to that of real human vein data, with the same procedure applied to all six fingers.
- Attack Type II: The subject wore thick gloves (Figure 4b) with disturbance patterns drawn on the glove surfaces, adding further intrusion to the detection algorithm. The acquisition method was the same as for real vein data.
- (3)
- Acquisition of Heart-Rate-Free Attack Data: A prosthetic finger made from colored clay (Figure 4c) was used to simulate attacks without heart rate. Each colored clay prosthesis was modeled to resemble the index, middle, and ring fingers of both hands. The finger vein data of these prostheses were recorded using the same video acquisition method to create samples of heart-rate-free attack data.
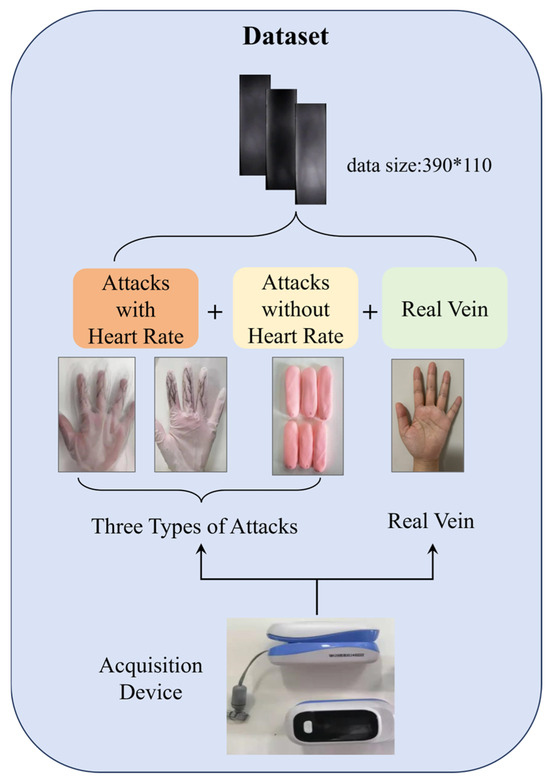
Figure 2.
Schematic diagram of the finger vein image acquisition process.
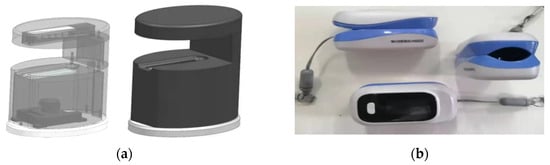
Figure 3.
Acquisition equipment: (a) Front vein acquisition device; (b) Finger-clip pulse oximeter.
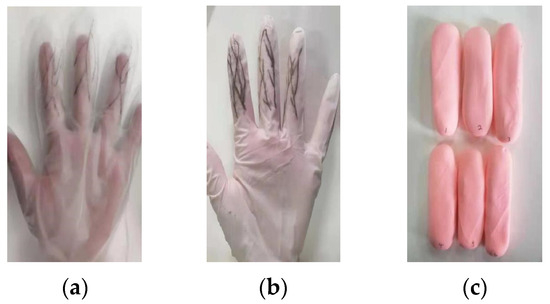
Figure 4.
Three forms of attacks: (a) Thin gloves; (b) Thick gloves; (c) Colored clay.
Finally, for the acquired finger vein video data with a duration of 6 seconds, frame extraction was performed at a sampling frequency of 30 frames per second to generate the corresponding finger vein images. The finger vein images corresponding to the three attack scenarios are shown in Figure 5. The thoughtful design of this attack dataset is evident in its diversity and relevance: by incorporating a range of attack samples with and without heart rate, the dataset effectively simulates various interference scenarios that may occur in real-world applications, thereby enhancing the robustness and generalization ability of the model in distinguishing between camouflage and prosthesis attacks. The heart-rate-based attack data improve the model’s ability to recognize interference in genuine live conditions, while the heart-rate-free attack data enhance the model’s effectiveness in identifying non-live attacks.
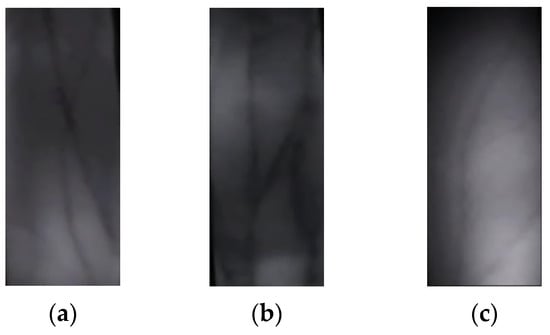
Figure 5.
Finger images captured under three attacks: (a) Thin gloves; (b) Thick gloves; (c) Colored clay.
To evaluate MixCFormer’s performance against previously unencountered attack types, we introduced additional potential attack vectors: gel prosthetic fingers, which mimic the elasticity and texture of real skin; printed vein patterns, representing printed copies of vein images; and silicone fingers, modeled to closely resemble human skin but with altered vein patterns. Although these samples were not included in the training set, incorporating them into the evaluation process allowed us to assess the model’s generalization ability. This approach enhances the security and adaptability of the system, providing comprehensive data to support the practical application of finger vein recognition technology.
2.2.2. Generating the Sequence Signal
The finger vein attack dataset is generated through a series of processing steps applied to video images, including frame extraction, image cropping, grayscale conversion, feature extraction, baseline drift correction [42], morphological filtering [43], and bandpass filtering [44]. These stages convert video frames into time-series data that capture the unique characteristics of finger vein patterns. Initially, video frames are extracted and cropped to focus on the region of interest (ROI) containing the veins. The images are then converted to grayscale to enhance contrast and highlight vein structures. Feature extraction isolates key vein patterns, which are corrected for baseline drift to address sensor or environmental variations. Morphological filtering refines the image, removing noise and enhancing vein clarity. Finally, bandpass filtering retains relevant frequency components for vein analysis while eliminating noise. This multi-step pipeline results in time-series data that accurately represent vein patterns for further analysis and recognition. Next, the process is implemented in the following three steps:
Step 1: Preprocessing: For each finger vein video, 180 frames were extracted sequentially. Each frame underwent region cropping and grayscale conversion to focus on key vein regions, reducing background interference and enhancing the legibility of vein features. The grayscale conversion utilized a weighted average method to transform RGB three-channel pixel values into grayscale values, as expressed in Equation (1). During the cropping operation, the target region was confined to a predefined range, and the image size was standardized to 390 × 110 pixels. This standardization improves processing efficiency and ensures effective alignment of features across images.
where represents the grayscale image of the k-th frame, and ,, and B denote the pixel values of the vein image in the red, green, and blue channels, respectively. This transformation reduces the image to a two-dimensional grayscale matrix, facilitating subsequent processing. During the cropping operation, the target region is confined to a specific range, and the image size is standardized to 390 × 110 pixels, improving both processing efficiency and feature alignment accuracy.
To further enhance the visibility of vein features, each frame of the grayscale image is processed through frame-by-frame accumulation and averaging, yielding a mean grayscale matrix (shown in Equation (2)), where denotes the number of frames (N = 180). The resulting mean grayscale image minimizes inter-frame noise, amplifies vein detail and edge information, and achieves a more stable distribution of vein features. This refined image provides a clearer and more reliable foundation for subsequent feature detection.
For each grayscale image , the total grayscale value of the frame is computed as the sum of all pixel grayscale values. These values are then arranged chronologically to form a time series . This signal sequence captures temporal variations in the finger vein features, offering dynamic information critical for vein detection. The formula for calculating the summed grayscale value is expressed as follows:
Here, m and n denote the number of rows and columns in the grayscale image, respectively. The time-series data represent the temporal fluctuations in the intensity of the vein features across the video. By combining the grayscale values from all 180 frames, a comprehensive data sequence is generated. This sequence reflects the dynamic behavior of vein features over time. The original waveform of the time series is depicted in Figure 6.
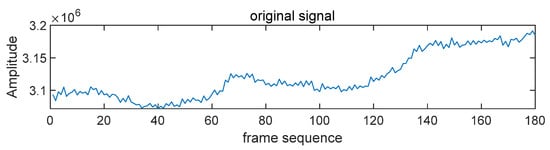
Figure 6.
The original waveform of the time series.
In addition, to enhance the dataset’s diversity and simulate environmental disturbances encountered in real-world scenarios, Gaussian and Poisson noise were introduced into the training samples. Gaussian noise was simulated by adding zero-mean random noise to grayscale images, with the standard deviation ranging from 0.01 to 0.1. This variation models low-light environmental disturbances of differing intensities. Poisson noise, on the other hand, was incorporated to emulate photon counting errors in imaging sensors, effectively capturing image quality fluctuations induced by light variations. These noise-augmented images were included in the training dataset, and the model’s robustness under varying noise conditions was rigorously evaluated through cross-validation. This approach ensures improved generalization to environmental perturbations in real-world scenarios.
Step 2: Baseline Drift Correction and Morphological Filtering: The extracted time-series signals often exhibit baseline drift caused by environmental changes or finger movement, leading to signal instability. To address this, we apply morphological filtering to remove low-frequency baseline drift. First, a linear structuring element (SE) is defined. Morphological opening and closing operations are then applied to the signal to remove high-frequency noise and low-frequency drift, respectively. The opening operation () smooths spikes in the signal, while the closing operation () fills in deep valleys, effectively removing baseline drift from the original signal. The equation for baseline drift correction is as follows:
where SE is defined as a linear structural element with a length of 15 and an angle of 0, and and represent the morphological opening and closing operations, respectively. The corrected time series is denoted as . As illustrated in Figure 7, the application of these operations effectively removes the low-frequency baseline drift from the signal, resulting in a more stable signal while preserving the vein eigenfrequency.
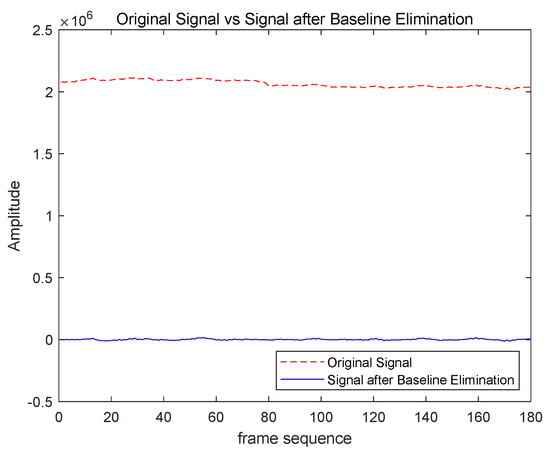
Figure 7.
Comparison of before and after baseline drift correction.
Additionally, to further improve noise immunity during preprocessing, we investigated advanced morphological operators, such as top-hat and bottom-hat filtering. These operators are designed to enhance vein features by isolating bright and dark regions in the signal. However, the experimental results indicated that their performance improvement was not significantly different from the original morphological filtering approach. Consequently, the current method retains the use of open and closed operations in the baseline drift correction pipeline, effectively stabilizing the signal without altering the frequency characteristics of the vein features.
Step 3: Butterworth Filter Design: Building upon the previous step, a Butterworth bandpass filter is designed to effectively remove high-frequency noise and residual low-frequency interference from the signal. The Butterworth filter is particularly suited for this task due to its smooth frequency response in the passband, which minimizes amplitude distortion while maintaining the desired frequency characteristics. Its rapid attenuation in the stopband ensures efficient suppression of high-frequency noise, making it an ideal choice for processing biological signals. The design process consists of two key stages: (1) parameter setting and filter design, and (2) filtering of the vein signal.
- (1)
- Parameter Setting and Filter Design
To design the filter, it is essential to select the appropriate passband and stopband frequencies to effectively extract the vein signal characteristics. Based on the spectral properties of the finger vein signal, the passband frequency () is set between 0.7 Hz and 3.5 Hz to retain the main low-frequency components of the vein signal. The stopband frequency () is set between 0.5 Hz and 5 Hz to ensure that high-frequency noise is adequately suppressed. This frequency selection is guided by an analysis of the finger vein signal spectrum, ensuring that the filter preserves the core information of the vein signal while removing unwanted noise.
Additionally, the normalized passband frequency () and stopband frequency () are calculated based on the set passband frequency , stopband frequency , and sampling frequency . These calculations are used to further define the design parameters of the filter, as outlined in Equations (5) and (6).
where the sampling frequency () is 30 Hz. To ensure signal fidelity within the passband and effectively attenuate noise in the stopband, the minimum filter order is calculated (as shown in Equation (7)) based on the specified passband and stopband frequencies, along with the corresponding attenuation requirements. Specifically, the maximum attenuation in the passband () is set to 3 dB, and the minimum attenuation in the stopband () is set to 18 dB.
- (2)
- Vein Signal Filtering
During the filtering stage, the vein signal, after baseline drift elimination, is input into the designed Butterworth filter. The filter removes high-frequency noise, leaving the low-frequency components intact and resulting in a smooth signal curve that effectively eliminates noise interference. The specific formula is as follows:
Here, represents the vein signal after baseline drift correction, and is the smoothed signal after filtering. The filtering effect is illustrated in Figure 8. Compared to the pre-filtered signal , the filtered vein signal exhibits a smoother curve, with more stable fluctuations and no noticeable high-frequency noise components. This smooth signal provides a high-quality dataset for subsequent feature extraction and matching, improving the accuracy and stability of the biometric system. Consequently, the processed feature signal is stored in an Excel table, ensuring a reliable data foundation for further analysis and model training.
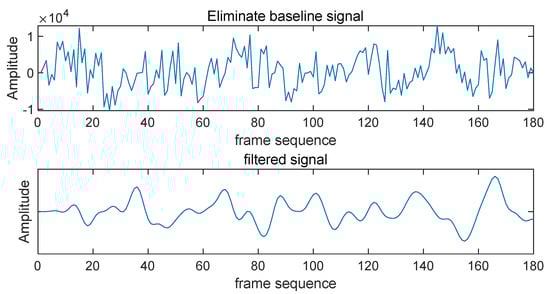
Figure 8.
Comparison of signals before and after Butterworth filtering.
2.3. Mixup Data Augmentation
We adopt the Mixup [45] data augmentation method to generate new samples by linearly combining the original data samples, aiming to improve the generalization ability of the model, reduce overfitting, and enhance its ability to recognize diverse attack samples. In the finger vein liveness detection task, the diversity of the dataset and the number of samples are limited, especially in complex environments where the collection of real samples is both difficult and costly. Therefore, the Mixup method effectively extends the training set by generating new samples to alleviate the problem of insufficient data.
The core idea of the Mixup [46] method is to generate new sample pairs by linearly interpolating the training samples. In the finger vein liveness detection task, the input signals are finger vein video sequences, and these sequences are expressed as time-series data formed by the pixel values of each image frame over time. Specifically, two vein signal sequences and and their corresponding labels and are set, and Mixup generates new signal sequences and label pairs using the following formula:
where is a weighting factor sampled from the Beta distribution, typically in the interval [0, 1]. This factor controls the mixing ratio between the samples. By applying linear interpolation, we augment the original sequence of 2000 samples to generate 4000 new samples. These augmented samples enhance the diversity of the training data while preserving temporal consistency, thereby helping the model capture the underlying patterns and variations in the venous signals more effectively.
2.4. CNN–Transformer Hybrid Model
The CNN–transformer hybrid model used for finger vein liveness detection is designed to effectively extract and classify vein features. The model begins by processing the input data through a series of convolutional layers to capture local features. Specifically, it consists of two convolutional layers that expand the input feature dimensions from 1 channel to 16 and 64 channels, respectively. This is complemented by batch normalization and ReLU activation functions, which ensure a non-linear representation of the features. Simultaneously, a max pooling layer is employed to reduce the dimensionality of the feature map, enhancing the efficiency of feature representation. Next, the model incorporates a transformer layer to capture global feature dependencies using a multi-head self-attention mechanism. The data processed by the convolutional layers are reshaped to suit the transformer input format and passed through three transformer encoder layers for feature extraction. Residual concatenation is applied to the transformer output to facilitate efficient information flow and improve model stability. Finally, the extracted features are processed by a fully connected layer, and the output layer generates the final classification results, distinguishing between live and forged samples. The overall architectural design (shown in Figure 9) effectively combines the local feature extraction capabilities of the convolutional network with the global modeling strengths of the transformer, providing robust support for finger vein liveness detection.
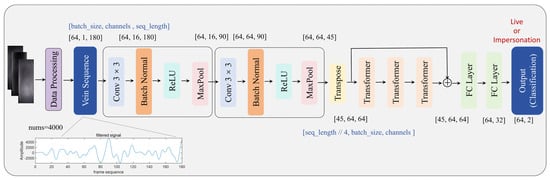
Figure 9.
CNN–transformer feature extraction model structure.
2.4.1. CNN Feature Extraction
In the finger vein liveness detection task, the inputs consist of finger vein sequences, with each sequence capturing the structural features of the finger veins. The CNN module is designed to extract local information from these sequences and convert it into high-level features, thus providing a rich representation of the local characteristics for the transformer encoder. The module first processes the vein image through a series of convolution operations, which include two convolutional layers and a max pooling layer. Let the input sequence be denoted as , where represents the batch size (initial value 64), C denotes the number of channels (initial value 1), and is the sequence length (initial value 180). The first convolutional layer is responsible for extracting the initial local features of the vein signal. After this layer, the number of output channels is increased to 16. The output feature at the -th layer, denoted as , can be expressed as Equation (11).
where represents the input to the -th layer, with the convolution kernel having a size of 3, a stride of 1, and a padding of 1. The ReLU activation function is applied to introduce non-linearity into the model. Through successive convolution layers, the model is able to capture local information from the input image, resulting in a series of feature maps that highlight important characteristics, such as edges and textures, which are crucial for live detection.
Subsequently, a max pooling operation is applied to extract the maximum value within each local region, which serves to downscale the feature maps while enhancing the robustness of the extracted features. The pooling operation can be expressed as Equation (12).
The pooling operation reduces the feature size while preserving key features, thereby lowering computational complexity and improving the model’s generalization ability. After the two layers of convolution and pooling, the CNN module outputs a feature map with the size of , where is the final number of channels (64), and is the reduced sequence length (45) after pooling.
2.4.2. Transformer Coding Module
The transformer module utilizes a convolutional layer to extract local features, which are subsequently used to capture global dependencies in the finger vein signals. Initially, the input sequence is processed through an embedding layer and a positional encoding layer. This step is essential for effectively capturing the temporal variation patterns of the finger vein features, allowing the model to learn the time-dependent information of the signal. This, in turn, provides a solid foundation for subsequent feature extraction and dependency modeling. Once the signals are embedded and position-encoded, they are passed into the transformer encoder, which consists of multiple stacked encoder layers, as shown in Figure 10. Each encoder layer contains two main components: a self-attention mechanism [47] and a feed-forward neural network (FFN) [48]. The self-attention mechanism is used to identify the dependencies between elements within the input sequence. Following this, the feed-forward neural network processes the output of the self-attention mechanism, enhancing the model’s ability to capture non-linear relationships. Each encoder layer is followed by a residual connection and layer normalization. These components are designed to facilitate gradient flow, accelerate the training process, and ensure efficient information propagation through the deep network. Notably, the input and output dimensions of each encoder layer are kept consistent, preventing issues related to missing information or dimensional mismatches.
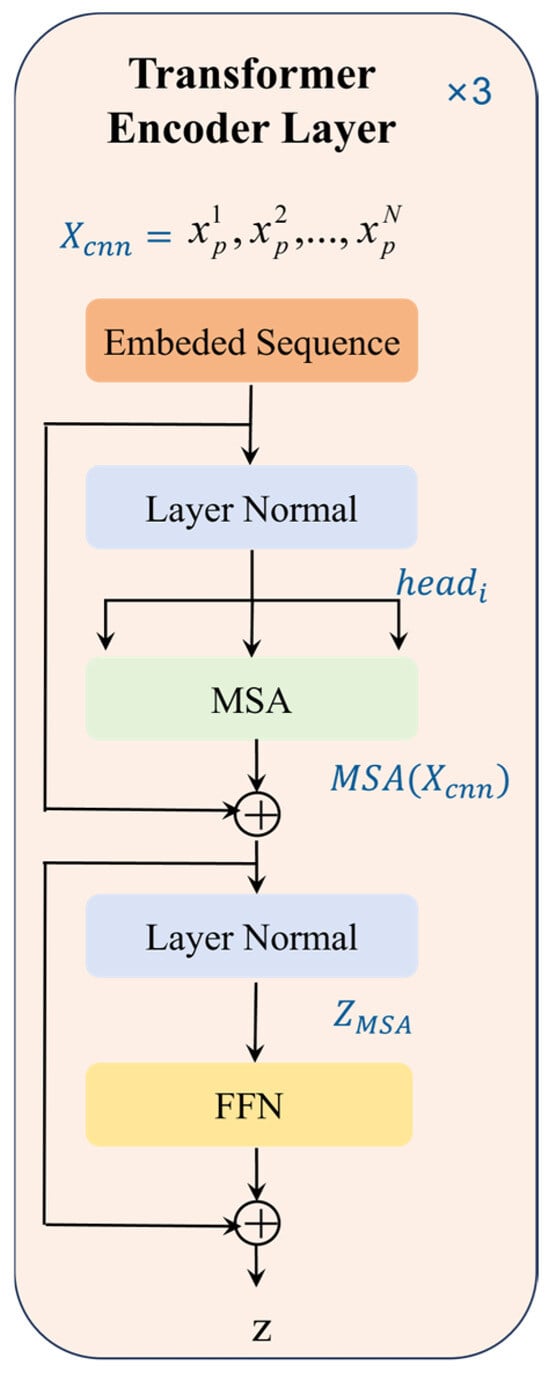
Figure 10.
Structure of the transformer encoder.
In our model, we use three stacked encoder layers, each with an input dimension of 64, which corresponds to the length of the feature vector at each time step. Each encoder layer employs four attention heads, and a dropout rate of 0.3 is set to effectively prevent overfitting. The main components of the transformer encoder include the self-attention mechanism, multi-head attention mechanism, feed-forward neural network (FFN), as well as residual connections and layer normalization. The specific process can be divided into the following three steps:
Step 1: Self-Attention Mechanism and Multi-Head Attention Mechanism
The core of the transformer module is the self-attention mechanism, which aims to capture the global dependencies between time steps in the finger vein signal sequence. For the input sequence , let , where is the input feature vector at the -th time step with feature dimension 45. The first step involves computing the query (), key (), and value () matrices through linear transformations as follows:
where , , and are learned parameter matrices that correspond to the linear mappings of the queries, keys, and values, respectively. The output of the self-attention mechanism is computed using scaled dot-product attention. Thus, we first calculate the dot product between the query and key matrices and then divide the result by , where is the dimension of the query and key vectors. This scaling factor helps stabilize the gradients during training. Next, the softmax function is applied to the scaled result to obtain the attention weights. Finally, the attention weights are multiplied by the value matrix to compute the output of the self-attention mechanism, as shown in Equation (12). This process efficiently captures the correlations between different time steps in the sequence of finger vein signals, enabling the model to better understand the temporal evolution of vein image features over time.
To capture features from different subspaces within the input sequence, the transformer model employs the multi-head attention mechanism. By computing multiple attention heads in parallel, the model is able to extract information from various subspaces, thereby enhancing its learning capacity. The formula is as follows:
where is the linear projection matrix, and denotes the computation result of the ith head, specifically
Step 2: Residual Connection and Layer Normalization
After the multi-head self-attention output, residual connections and layer normalization are applied. The input is added to the output of the multi-head self-attention, effectively addressing the vanishing gradient problem. Layer normalization ensures consistency in feature distribution, which further enhances the stability of model training. This residual connection structure is used repeatedly within the transformer encoder module to facilitate effective gradient propagation throughout the deep network. The specific operation is denoted as
Step 3: Feed-Forward Network (FFN)
The next component is the feed-forward neural network (FFN), which consists of two fully connected layers and an activation function (typically ReLU) to enhance the non-linear feature representation. The calculation formula for the FFN is as follows:
where and are the weight matrices, and and are the bias terms. The output of the FFN is then passed through residual connectivity followed by layer normalization, producing the final output of the encoder layer, as denoted by
The output is then used as the input to the next encoder layer or the subsequent classification module. In the context of finger vein liveness detection, the encoder module, stacked with multiple layers, effectively captures the global, time-dependent features of the input signal. This enables the extraction of rich feature representations, which are essential for the subsequent classification module to distinguish between live and forged samples.
In our study, we conducted experiments to assess how varying the depth and width of the transformer component in MixCFormer affects its ability to capture global dependencies in vein data. We systematically altered the number of encoder layers and attention heads, observing that increasing these parameters enhanced the model’s capacity to learn complex patterns. However, beyond a certain threshold, additional layers and heads led to diminishing returns and increased computational costs. Therefore, we selected an architecture with three encoder layers and four attention heads, balancing performance and efficiency. This configuration effectively captures global dependencies in vein data without incurring unnecessary computational overhead.
2.4.3. Fully Connected Network
The fully connected classification network [49] plays a crucial role in performing the final classification of the features extracted through the convolution, pooling, and transformer encoding processes. This module comprises multiple fully connected layers, denoted as fc, fc1, and fc2, as shown in Figure 11. The fully connected layer network (FCLN), also referred to as a multi-layer perceptron (MLP), is a standard neural network structure consisting of several fully connected layers. Each fully connected layer contains multiple neurons, with each neuron connected to every neuron in the preceding layer. Through adjusting the connection weights and bias terms, the neurons are capable of learning the features of the input data. This process involves performing a non-linear transformation via an activation function, allowing the network to capture the complex relationships inherent in the data. In the MixCFormer model, the fully connected layers are responsible for mapping and transforming the extracted vein features into the output space of the target task. Specifically, the input layer of the fully connected network receives 64 output features from the transformer. The output layer consists of two neurons for the binary classification task, corresponding to the two classes. The detailed structure of the network is shown in Figure 11. The output features from the transformer are first linearly transformed by the fully connected layer fc to produce a feature representation of size 64. This layer performs a weighted combination of the features extracted at each time step by the transformer, effectively fusing them and extracting high-level features for classification. The resulting feature vector is then passed through the fully connected layer fc1, which reduces the feature dimension to 32. This compression helps eliminate unnecessary noise or redundant features while retaining important information. The fc1 layer is followed by a ReLU activation function, enabling the network to learn non-linear relationships more effectively and enhancing its capacity to represent complex patterns. Finally, after passing through the fc2 layer, the output features are mapped to the target category dimensions, yielding the binary classification output: either live (1) or forged (0). This final output indicates the model’s confidence in the classification of the input data.
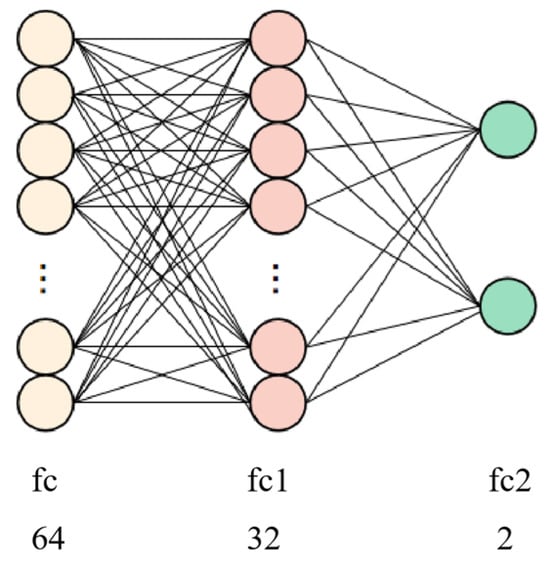
Figure 11.
Classification structure of fully connected networks.
2.5. Model Training and Optimization
In the training and optimization of deep-learning models, selecting an appropriate loss function is crucial for achieving optimal performance. In the context of binary classification tasks, such as finger vein liveness detection, the traditional cross-entropy loss [50] is commonly employed to quantify the discrepancy between the model’s predicted probability distribution and the actual label distribution. However, in scenarios characterized by class imbalance, reliance on cross-entropy loss may cause the model to become biased toward the majority class, thereby compromising its generalization capabilities. To address this issue, we adopted focal loss, a loss function specifically designed to mitigate class imbalance in classification problems. Focal loss has demonstrated significant efficacy in tasks like object detection. It is defined as follows:
where represents the model’s predicted probability for the true class; is a focusing parameter that adjusts the rate at which easy examples are down-weighted; and is a balancing factor that addresses class imbalance. By incorporating these parameters, focal loss effectively diminishes the impact of easily classified samples, directing the model’s attention toward more challenging cases. This focus enhances the model’s performance in imbalanced datasets. In the specific application of finger vein liveness detection, employing focal loss enables the model to concentrate more on difficult-to-classify samples during training, thereby improving its generalization ability and accuracy. This approach ensures that the model is less influenced by the predominance of majority class samples and is better equipped to handle the complexities inherent in imbalanced data distributions.
To optimize the loss function, we use the Adam optimizer [51]. Adam is a gradient-based first-order optimization method that combines the momentum approach with an adaptive learning rate strategy. This allows the learning rate for each parameter to be adjusted dynamically during the training process, thereby accelerating convergence and enhancing training stability. The update formula for the Adam optimizer is as follows:
where and are the momentum and variance estimate of the gradient, respectively; and are the decay coefficients; is the learning rate (initially set to 0.0001); and is a small smoothing term that prevents division by zero. By dynamically adjusting the learning rate, the Adam optimizer accelerates the training process, reduces training time, and mitigates issues such as vanishing or exploding gradients, which are common challenges in traditional gradient descent methods.
3. Experimental Results
To evaluate the proposed approach, we conducted algorithm validation using a finger vein dataset and performed fair comparison experiments with a baseline algorithm. All experiments were carried out on a system running the Windows 11 operating system, equipped with an Intel(R) Core (TM) i7-14650HX processor. The programming environment was Python 3.10.14, with PyTorch 2.4.0 as the deep-learning framework, and CUDA 12.6 serving as the parallel computing platform. The experiments were executed on NVIDIA GeForce RTX 4060 GPUs. During training, the model was configured with an epoch size of 500, a batch size of 64, an initial learning rate of 0.0001, an image resolution of 390 × 110 pixels, and a sequence dimension of 180. All other hyperparameters were set to their default values.
3.1. Dataset Description
The finger vein video dataset consists of 10,476 videos, including 2556 real finger vein videos and three types of attack videos. The attack videos include: 2592 finger vein videos of real individuals wearing thin gloves, 2772 finger vein videos of real individuals wearing thick gloves, and 2556 non-pulsating finger vein videos created using colored clay. Each video is 6 s long. Figure 12 presents screenshots from some of the videos in the datasets, where (a) shows a screenshot of a real person’s finger vein video; (b) depicts a screenshot of a real person’s thin-gloved finger vein video; (c) shows a screenshot of a real person’s thick-gloved finger vein video; and (d) illustrates a screenshot of a colored clay finger prosthesis vein video.
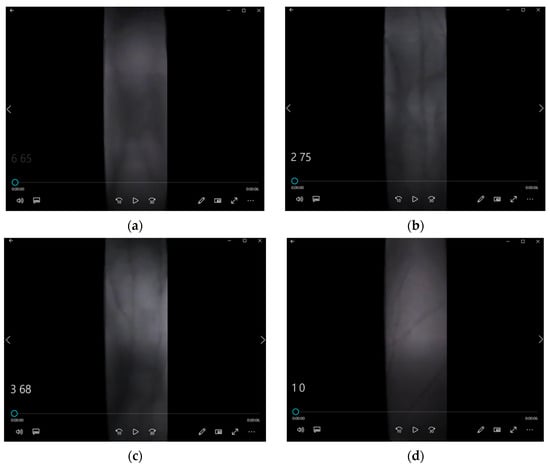
Figure 12.
Screenshots from the finger vein video dataset: (a) Real person’s finger vein video; (b) Real person’s finger vein video with thin gloves; (c) Real person’s finger vein video with thick gloves; (d) Finger vein video with colored clay prosthesis.
During data collection, a finger vein acquisition device was used to capture video of the vein patterns from the index, middle, and ring fingers of both the left and right hands of each subject. Video data were collected from all six fingers (left and right index, middle, and ring fingers) for each subject, with six repetitions per finger. Before each data acquisition session, the subject’s heart rate was re-measured to ensure that all six consecutive video sets were collected from living subjects, thereby ensuring the quality of the finger vein video samples.
We processed 1000 real human finger vein videos and 1000 prosthetic finger vein videos on MATLAB R2024a environment. Each video was converted into 180 frames, and the finger vein information was extracted from these frames by applying algorithms to eliminate baseline drift and perform filtering. Each set of 180 frames from a video was represented as a feature vector, which was then uniformly output into an Excel file. Since the data in each frame are time-dependent, the sequence of 180 data points can be treated as a time series. Next, we labeled the time series of the 1000 real finger vein videos as ‘1’ and the time series of the 1000 prosthetic finger vein videos as ‘0’, resulting in a dataset with 2000 columns and 180 rows of finger vein time-series data. Subsequently, we applied Mixup data augmentation to expand the dataset, generating a total of 4000 finger vein sequence samples.
3.2. Evaluation Metrics
In the context of finger vein recognition systems, particularly for the task of finger vein liveness detection, evaluating the performance of the model is crucial. To achieve this, we utilize a range of evaluation metrics, including training loss, test loss, training accuracy, test accuracy, precision, and recall. These metrics provide a thorough assessment of the model’s performance across various stages and offer a well-rounded perspective on its classification capabilities. Additionally, we introduce feature entropy as an evaluation metric. Derived from the information theory, feature entropy quantifies the complexity and uncertainty within the feature distribution extracted by the model. Let the feature extracted by the model be a random variable with probability distribution (i.e., the normalized frequency distribution of the feature values); then, the feature entropy is defined as
where is the dimension of the feature space, and is the probability of feature xi. A higher entropy value indicates greater uncertainty, suggesting that the feature distribution is more variable or influenced by noise. Conversely, a lower entropy value reflects a more stable and concentrated feature distribution, signifying consistent feature extraction by the model. In the context of finger vein liveness detection, feature entropy helps assess the impact of noise or perturbations on the model’s feature extraction process. A significant increase in entropy under noisy conditions indicates substantial interference caused by the noise, while minimal changes suggest that the model effectively suppresses noise influence and maintains robust feature extraction.
3.3. Comparison and Analysis
To evaluate the performance of our approach, we conducted a comprehensive comparative experiment, incorporating 10 benchmarks under both the baseline model and MixUp data augmentation settings. The primary objective of this experiment was to compare the performance of several mainstream network architectures, including CNN, LSTM, and transformer, in the specific task of finger vein recognition. Additionally, to ensure a thorough evaluation, we examined various typical algorithm combinations. We systematically compared the models based on four key experimental metrics: test accuracy, precision, recall, and feature entropy.
3.3.1. Comparison Experiment
In the experiments, the finger vein dataset was split into training and test sets in an 8:2 ratio to assess the performance of the MixCFormer algorithm. After 300 training epochs, the experimental results are presented in Figure 13.
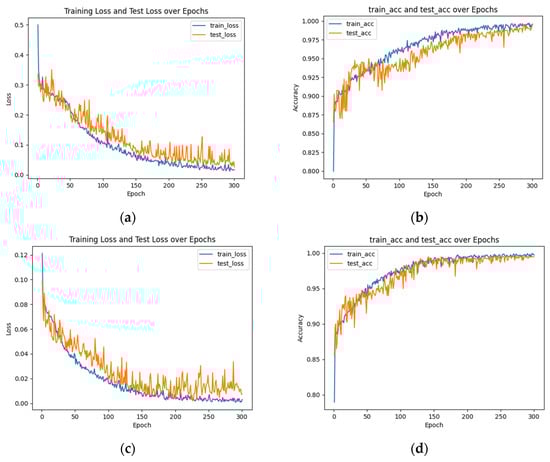
Figure 13.
Experimental results of MixCFormer algorithm training and testing: (a) Loss curve with cross-entropy loss function; (b) Accuracy with cross-entropy loss function; (c) Loss curve with focal loss function; (d) Accuracy with focal loss function.
Specifically, Figure 13a shows the loss function curves for both the training and validation sets over the course of training; Figure 13b displays the trends in training accuracy and test accuracy; Figure 13c presents the precision curves; and Figure 13d illustrates the recall and F1-score variations. The results in Figure 13 indicate that the model’s loss function for both the training and validation sets gradually decreases as training progresses, suggesting that the model is converging and effectively learning the data features. The accuracy on the test set reached 99.50%, which is very close to the 99.72% achieved on the training set, demonstrating the model’s strong generalization ability without overfitting. Furthermore, the precision was 99.51%, indicating the model’s effectiveness in minimizing false positives, i.e., incorrectly classifying negative samples as positive. As shown in the precision curve in Figure 13c, precision continues to improve as training progresses, further validating the efficiency of the MixCFormer algorithm for finger vein recognition. Additionally, the recall and F1-score curves in Figure 13d exhibit a consistent upward trend, indicating that the model successfully maintains high sensitivity while reducing false positives. These results suggest that the MixCFormer algorithm strikes an effective balance between recall and F1-score while simultaneously improving recognition accuracy, leading to more comprehensive performance optimization.
Accurate measurements of the mean inference time and its standard deviation are crucial for evaluating the performance of the MixCFormer model. The mean inference time represents the average duration the model requires to process a single input, while the standard deviation indicates the variability of these durations. In our tests, MixCFormer achieved a mean inference time of 0.105 ms per sample, with a standard deviation of 0.156 ms.
In our study, we evaluated the MixCFormer model’s performance using both cross-entropy loss and focal loss to assess the impact of different loss functions. The training curves and confusion matrices are presented in Figure 13 and Figure 14. The MixCFormer algorithm achieved a high accuracy of 99.5% in finger vein authentication tasks, with negligible false positives, indicating its effectiveness in distinguishing between genuine and forged images. While the convergence trends for both loss functions were similar, slight differences were observed in the confusion matrices: with cross-entropy loss, the model exhibited two false negatives on the test set, whereas with focal loss, it showed two false positives. Overall, the low error rates demonstrate that the MixCFormer algorithm performs well in terms of both sensitivity and accuracy.
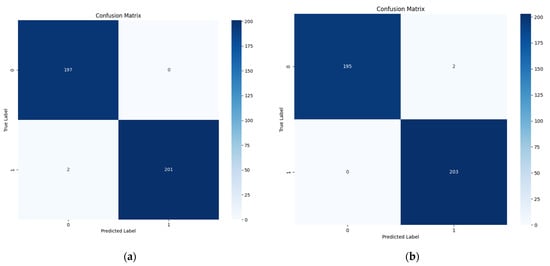
Figure 14.
Confusion matrix for the MixCFormer algorithm with different loss functions: (a) Cross-entropy loss; (b) Focal loss.
To evaluate the performance of the improved MixCFormer algorithm, we conducted a series of comparative experiments with several representative models. The results of these experiments are summarized in Table 1 and Table 2. Additionally, we compared and analyzed the loss function curves of the different models throughout the training process, as illustrated in Figure 15. These comparisons allowed for an in-depth analysis of each model’s performance in the finger vein recognition task, focusing on key metrics, such as loss function, precision, recall, and F1-score. Furthermore, the performance trends of the models during both the training and testing phases are visualized in line graphs, as shown in Figure 16. Collectively, these experimental results provide a comprehensive quantitative analysis, which enables a more thorough evaluation of the advantages of the MixCFormer algorithm.

Table 1.
Comparative experimental results on finger vein datasets.
Table 2.
Comparison of experimental metrics for different algorithms.
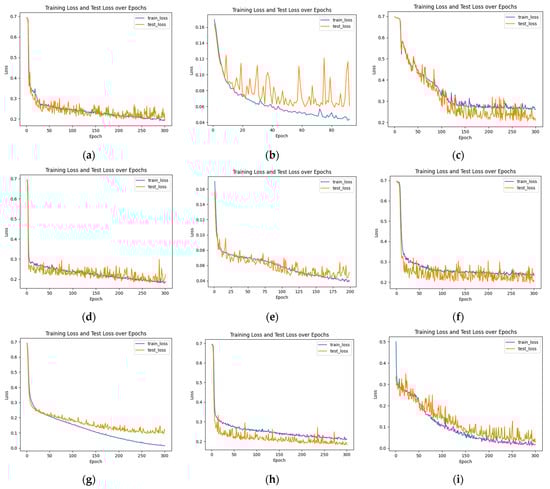
Figure 15.
Loss function curves for different model training and testing experiments: (a) GRU; (b) CNN; (c) LSTM; (d) CNN + LSTM; (e) CFormer; (f) CLT; (g) MixCNN; (h) MixCLT; (i) MixCFormer.
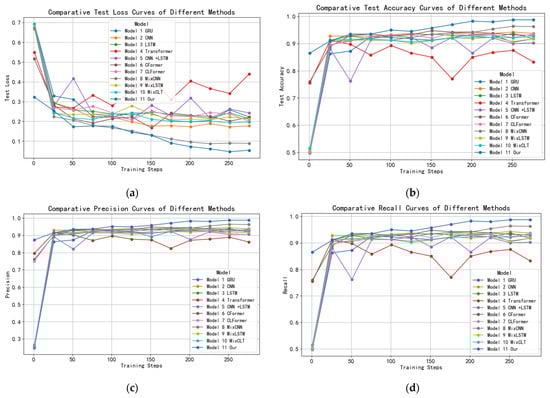
Figure 16.
Performance comparison curve of different algorithms: (a) Test loss curves; (b) Test accuracy curves; (c) Precision curves; (d) Recall and F1-score curves.
Table 1 presents a comparative analysis of MixCFormer and 10 other classical recognition algorithms on the finger vein dataset. Among the individual models, CNN achieves the highest precision of 94.50%, followed by LSTM at 94.39% and GRU at 93.78%, while the transformer performs the worst, with 91.50%. Cascade models, such as CNN + LSTM (93.57%) and CFormer (95.50%), show improved performance, with CFormer outperforming the others. Applying MixUp data augmentation to CNN (MixCNN) leads to a significant precision boost to 97.53%, demonstrating the effectiveness of MixUp in enhancing model robustness. However, MixLSTM (93.43%) and MixCLT (93.73%) show more modest improvements. Notably, our proposed MixCFormer model achieves the highest precision of 99.51%, showcasing its superior performance in vein authenticity recognition, surpassing all other models in both individual and combined configurations.
Table 2 presents a comprehensive comparison of experimental metrics—test loss, test accuracy, precision, recall, and F1-score—across various algorithms for vein authenticity recognition. GRU, CNN, and LSTM perform similarly, with CNN achieving the highest test accuracy of 94.25% and precision of 94.50%. The transformer exhibits the lowest performance across all metrics, with a test accuracy of 91.50% and all other scores at 91.50%, indicating its relative inefficacy for this task. Cascade models like CNN + LSTM and CFormer show improvements, with CFormer achieving the highest performance among the cascade models, with 95.50% accuracy and perfect precision, recall, and F1-score of 95.50%. When MixUp data augmentation is applied, MixCNN leads with a substantial boost in performance, achieving 97.50% accuracy, 97.53% precision, and 97.50% recall, demonstrating the effectiveness of MixUp in improving model robustness. While MixLSTM and MixCLT show some gains, their results remain lower than MixCNN. Finally, our model stands out with exceptional results—99.50% test accuracy, 99.51% precision, recall, and F1-score—outperforming all other models and demonstrating the superior effectiveness of our proposed method in vein authenticity recognition.
Figure 15 illustrates the loss function curves for different models during the training and testing phases. The analysis reveals that the MixCFormer model (i) demonstrates the fastest convergence and the most stable performance, with the loss function rapidly and consistently decreasing to 0.0414 after 300 training epochs. In contrast, the CFormer (e) models exhibit slower convergence and more fluctuating loss curves, indicating lower learning efficiency. Further examination shows that the CNN, transformer, and CFormer models experience overfitting after approximately 130 epochs, as evidenced by an increase in the loss function on the test set. The MixCNN model (g) displays a smoother loss curve, suggesting greater stability during training. Hybrid models, such as MixCFormer (i) and MixCNN (g), benefit from the integration of multiple architectures, leading to a faster reduction in the loss function. Overall, the MixCFormer model outperforms all other models in terms of both convergence speed and stability, underscoring its superior performance in the finger vein recognition task.
As shown in Figure 16, MixCFormer demonstrates a stable convergence trend throughout the training process. As the number of iterations increases, the training loss gradually decreases and eventually stabilizes, indicating that the model effectively learns without overfitting. The test accuracy consistently rises, surpassing that of other algorithms, which highlights its superior generalization ability. Additionally, MixCFormer excels in precision, recall, and F1-score, with all metrics continuously improving during training and stabilizing in the later stages, significantly outperforming the comparison models. These trends confirm that MixCFormer excels across all key performance metrics, offering both improved stability and efficient learning capabilities.
In addition, to evaluate the performance of MixCFormer under unknown attack types, we introduced potential attack vectors, such as gel fake fingers, printed vein patterns, and silicone fingers. Even though these samples are not included in the training set, MixCFormer shows strong robustness in testing, with a detection accuracy of about 95% against these never-before-seen attack types. In addition, the model shows good generalization capabilities against a variety of synthetic attack attempts. The diverse data design used in these evaluations provides a solid foundation for adversarial training, effectively enhancing the security and adaptability of the system.
3.3.2. Effect of Noise Enhancement on Model Robustness
To validate the impact of noise enhancement on the MixCFormer model’s robustness and generalization capability, we conducted two sets of experiments: (1) Standard Dataset Performance: Evaluating the model on a clean, standard dataset; (2) Simulated Noisy Dataset Performance: Assessing the model on datasets augmented with Gaussian and Poisson noise of varying intensities. The noise parameters were designed to simulate different disturbance scenarios, ranging from mild (e.g., Gaussian noise with a standard deviation of σ = 0.01) to severe (σ = 0.1). For Poisson noise, similar intensity levels were used to mimic photon counting errors under varying light conditions. The model performance was evaluated using classification accuracy and uncertainty metrics derived from feature entropy. Cross-validation was employed to ensure reliable results.
The experimental results, presented in Table 3, demonstrate the classification accuracy under different noise intensities. The findings reveal that slight Gaussian noise (σ = 0.01) has negligible impact on model accuracy, while higher noise levels (σ = 0.1) lead to a modest decrease in accuracy (approximately 1.5%). A similar trend was observed with Poisson noise. However, training the model on noise-enhanced datasets significantly improved its robustness and adaptability in real-world disturbed environments, yielding a 2% improvement in accuracy under low-light and motion blur simulation scenarios compared to models trained without noise enhancement.
Table 3.
Model precision under different noise conditions (%).
To further evaluate the model’s performance under varying noise conditions, we analyzed the entropy values of the extracted features as an indicator of uncertainty. The results, summarized in Table 4, indicate that models trained with noise enhancement exhibit entropy values closer to those obtained with clean datasets, even under high noise conditions. This suggests improved stability in the feature extraction process, further reinforcing the benefits of noise-enhanced training for robust and reliable performance in challenging environments.
Table 4.
Comparison of feature entropy values (in bits).
3.4. Ablation Experiment
To validate the contribution of each component in the model to the performance, we conducted ablation experiments focusing on the roles of Mixup enhancement, data preprocessing, and key modules of the model architecture. First, retraining the model after disabling Mixup enhancement reveals that the accuracy decreases from 99.51% to 95.5% (results summarized in Table 5), indicating that Mixup significantly improves the robustness of the model by increasing data diversity and suppressing overfitting. In terms of data preprocessing, after removing baseline drift correction, morphological filtering, and Butterworth filtering, the accuracy drops to 93.24%, 94.62%, and 92.81%, respectively, demonstrating the key roles of these steps in removing signal bias, refining vein structure, and suppressing noise.
Table 5.
Ablation experimental results of data preprocessing process.
In addition, to explore the contribution of CNN and transformer components, we performed multiple sets of experiments, shown in Table 6. The accuracy of the 3 × 3 and 5 × 5 convolutional kernels was 94.5% and 94.61%, respectively, when using only CNN; the accuracy of the transformer alone was 91.50%. The model combining the two (CFormer) significantly improves the performance, achieving 95.5% and 96.08% accuracy for different convolutional kernel sizes. However, removing the residual connections drastically decreases the accuracy to 88.72% and 89.53%, validating the necessity for residual connections in mitigating gradient vanishing and enhancing feature propagation. In terms of inference time, our MixCFormer algorithm demonstrates a mean inference time of 0.105 milliseconds. For comparison, the CNN model achieves an average inference time of 0.014 milliseconds; the transformer model records 0.205 milliseconds; and the CFormer model registers 0.077 milliseconds. The overall experimental results show that Mixup enhancement, data preprocessing, and the transformer–CNN hybrid architecture are the core factors to improve model robustness and accuracy.
Table 6.
Ablation experimental results for network models.
4. Conclusions
In this paper, we introduce MixCFormer, a hybrid CNN–transformer architecture for finger vein liveness detection. The architecture combines preprocessing techniques (baseline drift elimination and morphological filtering) to improve vein feature extraction, Mixup augmentation to address data scarcity, and a CNN–transformer hybrid for local and global feature fusion. Residual linking further optimizes feature transfer, improving model stability. The experimental results show that MixCFormer outperforms state-of-the-art methods in detection accuracy, robustness, and adaptability, especially under noisy and variable lighting conditions. The experimental results demonstrate that MixCFormer outperforms state-of-the-art methods in terms of detection accuracy, robustness, and adaptability.
In our future work, we will focus on further optimizing data augmentation techniques to enhance the model’s robustness and improve its adaptability to a wide range of attack scenarios. Simultaneously, we will prioritize the construction of more diverse finger vein datasets to strengthen the model’s generalization capability across different environments and lighting conditions. In terms of feature extraction, we plan to integrate time-series modeling more effectively to capture dynamic vein patterns, enabling real-time detection. Additionally, we will investigate the methods for extracting additional vital sign information, such as pulse and heartbeat, from vein data, thereby unlocking the full potential of vein recognition technology in biometric security applications. Furthermore, we will explore the potential of transfer learning techniques, where a model trained on one dataset can be adapted to other attack scenarios with minimal fine-tuning. This approach aims to enhance the model’s adaptability and efficiency in handling various attack types.
Author Contributions
Conceptualization, Z.W. and H.Q.; methodology, Z.W. and S.Y.; software, Y.L.; validation, Z.W.; formal analysis, H.Q.; investigation, Z.W. and J.W.; resources, Z.W.; data curation, Z.W.; writing—original draft preparation, Z.W.; writing—review and editing, Z.W., S.Y. and J.W.; visualization, Z.W. and S.Y.; supervision, Z.W.; project administration, Z.W.; funding acquisition, Z.W. All authors have read and agreed to the published version of the manuscript.
Funding
This research was funded in part by the National Natural Science Foundation of China (grant 62301241) and in part by the Key Research Program of Higher Education Institutions in Henan Province (grant 25A510017).
Data Availability Statement
The data presented in this study are available on request from the corresponding author.
Acknowledgments
The authors would like to acknowledge the anonymous reviewers and editors whose thoughtful comments helped to improve this manuscript.
Conflicts of Interest
The authors declare no conflicts of interest.
References
- Jain, A.K.; Kumar, A. Biometrics of next generation: An overview. Second. Gener. Biom. 2010, 12, 2–3. [Google Scholar]
- Zhang, L.; Li, W.; Ning, X.; Sun, L.; Dong, X. A local descriptor with physiological characteristic for finger vein recognition. In Proceedings of the 2020 25th International Conference on Pattern Recognition (ICPR), Milan, Italy, 10–15 January 2021; pp. 4873–4878. [Google Scholar]
- Shaheed, K.; Liu, H.; Yang, G.; Qureshi, I.; Gou, J.; Yin, Y. A systematic review of finger vein recognition techniques. Information 2018, 9, 213. [Google Scholar] [CrossRef]
- Chugh, T.; Cao, K.; Jain, A.K. Fingerprint spoof buster: Use of minutiae-centered patches. IEEE Trans. Inf. Forensics Secur. 2018, 13, 2190–2202. [Google Scholar] [CrossRef]
- Opanasenko, V.M.; Fazilov, S.K.; Mirzaev, O.N.; Sa’dullo ugli Kakharov, S. An Ensemble Approach To Face Recognition In Access Control Systems. J. Mob. Multimed. 2024, 20, 749–768. [Google Scholar] [CrossRef]
- Shen, J.; Liu, N.; Xu, C.; Sun, H.; Xiao, Y.; Li, D.; Zhang, Y. Finger vein recognition algorithm based on lightweight deep convolutional neural network. IEEE Trans. Instrum. Meas. 2021, 71, 1–13. [Google Scholar] [CrossRef]
- Nguyen, K.; Proença, H.; Alonso-Fernandez, F. Deep learning for iris recognition: A survey. ACM Comput. Surv. 2024, 56, 1–35. [Google Scholar] [CrossRef]
- Cola, G.; Avvenuti, M.; Musso, F.; Vecchio, A. Gait-based authentication using a wrist-worn device. In Proceedings of the 13th International Conference on Mobile and Ubiquitous Systems: Computing, Networking and Services, New York, NY, USA, 28 November 2016; pp. 208–217. [Google Scholar]
- Qin, H.; Zhu, H.; Jin, X.; Song, Q.; El-Yacoubi, M.A.; Gao, X. EmMixformer: Mix transformer for eye movement recognition. arXiv 2024, arXiv:2401.04956. [Google Scholar]
- Poddar, J.; Parikh, V.; Bharti, S.K. Offline signature recognition and forgery detection using deep learning. Procedia Comput. Sci. 2020, 170, 610–617. [Google Scholar] [CrossRef]
- Xie, J.; Zhao, Y.; Zhu, D.; Yan, J.; Li, J.; Qiao, M.; He, G.; Deng, S. A machine learning-combined flexible sensor for tactile detection and voice recognition. ACS Appl. Mater. Interfaces 2023, 15, 12551–12559. [Google Scholar] [CrossRef]
- Hou, B.; Zhang, H.; Yan, R. Finger-vein biometric recognition: A review. IEEE Trans. Instrum. Meas. 2022, 71, 1–26. [Google Scholar] [CrossRef]
- Mathur, L.; Matarić, M.J. Introducing representations of facial affect in automated multimodal deception detection. In Proceedings of the 2020 International Conference on Multimodal Interaction, New York, NY, USA, 22 October 2020; pp. 305–314. [Google Scholar]
- Hsia, C.-H.; Yang, Z.-H.; Wang, H.-J.; Lai, K.-K. A new enhancement edge detection of finger-vein identification for carputer system. Appl. Sci. 2022, 12, 10127. [Google Scholar] [CrossRef]
- Godoy, R.I.U.; Panzo, E.G.V.; Cruz, J.C.D. Vein Location and Feature Detection using Image Analysis. In Proceedings of the 2021 5th International Conference on Electrical, Telecommunication and Computer Engineering (ELTICOM), Medan, Indonesia, 15–16 September 2021; pp. 33–37. [Google Scholar]
- Khellat-Kihel, S.; Cardoso, N.; Monteiro, J.; Benyettou, M. Finger vein recognition using Gabor filter and support vector machine. In Proceedings of the International Image Processing, Applications and Systems Conference, Sfax, Tunisia, 5–7 November 2014; pp. 1–6. [Google Scholar]
- Park, K.R. Finger vein recognition by combining global and local features based on SVM. Comput. Inform. 2011, 30, 295–309. [Google Scholar]
- Krishnan, A.; Thomas, T.; Mishra, D. Finger vein pulsation-based biometric recognition. IEEE Trans. Inf. Forensics Secur. 2021, 16, 5034–5044. [Google Scholar] [CrossRef]
- Crisan, S.; Tebrean, B. Low cost, high quality vein pattern recognition device with liveness Detection. Workflow and implementations. Measurement 2017, 108, 207–216. [Google Scholar] [CrossRef]
- Das, R.; Piciucco, E.; Maiorana, E.; Campisi, P. Convolutional neural network for finger-vein-based biometric identification. IEEE Trans. Inf. Forensics Secur. 2018, 14, 360–373. [Google Scholar] [CrossRef]
- Qin, H.; Wang, P. Finger-vein verification based on LSTM recurrent neural networks. Appl. Sci. 2019, 9, 1687. [Google Scholar] [CrossRef]
- Qin, H.; Gong, C.; Li, Y.; El-Yacoubi, M.A.; Gao, X.; Wang, J. Attention Label Learning to Enhance Interactive Vein Transformer for Palm-Vein Recognition. IEEE Trans. Biom. Behav. Identity Sci. 2024, 6, 341–351. [Google Scholar] [CrossRef]
- Tyagi, S.; Chawla, B.; Jain, R.; Srivastava, S. Multimodal biometric system using deep learning based on face and finger vein fusion. J. Intell. Fuzzy Syst. 2022, 42, 943–955. [Google Scholar] [CrossRef]
- Liu, W.; Lu, H.; Wang, Y.; Li, Y.; Qu, Z.; Li, Y. Mmran: A novel model for finger vein recognition based on a residual attention mechanism: Mmran: A novel finger vein recognition model. Appl. Intell. 2023, 53, 3273–3290. [Google Scholar] [CrossRef]
- Wang, Y.; Wu, W.; Yao, J.; Li, D. A Palm Vein Recognition Method Based on LSTM-CNN. In Proceedings of the 2023 IEEE 5th International Conference on Civil Aviation Safety and Information Technology (ICCASIT), Dali, China, 11–13 October 2023; pp. 1027–1030. [Google Scholar]
- Abbas, T. Finger Vein Recognition with Hybrid Deep Learning Approach. J. La Multiapp 2023, 4, 23–33. [Google Scholar] [CrossRef]
- Li, X.; Zhang, B.-B. FV-ViT: Vision transformer for finger vein recognition. IEEE Access 2023, 11, 75451–75461. [Google Scholar] [CrossRef]
- Qin, H.; Gong, C.; Li, Y.; Gao, X.; El-Yacoubi, M.A. Label enhancement-based multiscale transformer for palm-vein recognition. IEEE Trans. Instrum. Meas. 2023, 72, 2509217. [Google Scholar] [CrossRef]
- Wang, S.; Qin, H.; Zhang, X.; Xiong, Z.; Wu, Y. VeinCnnformer: Convolutional neural network based transformer for vein recognition. In Proceedings of the Fourth International Conference on Computer Vision and Data Mining (ICCVDM 2023), Changchun, China, 20–22 October 2023; pp. 400–407. [Google Scholar]
- Kim, W.; Song, J.M.; Park, K.R. Multimodal biometric recognition based on convolutional neural network by the fusion of finger-vein and finger shape using near-infrared (NIR) camera sensor. Sensors 2018, 18, 2296. [Google Scholar] [CrossRef]
- Alshardan, A.; Kumar, A.; Alghamdi, M.; Maashi, M.; Alahmari, S.; Alharbi, A.A.; Almukadi, W.; Alzahrani, Y. Multimodal biometric identification: Leveraging convolutional neural network (CNN) architectures and fusion techniques with fingerprint and finger vein data. PeerJ Comput. Sci. 2024, 10, e2440. [Google Scholar] [CrossRef]
- El-Rahiem, B.A.; El-Samie, F.E.A.; Amin, M. Multimodal biometric authentication based on deep fusion of electrocardiogram (ECG) and finger vein. Multimedia Syst. 2022, 28, 1325–1337. [Google Scholar] [CrossRef]
- Alay, N.; Al-Baity, H.H. Deep learning approach for multimodal biometric recognition system based on fusion of iris, face, and finger vein traits. Sensors 2020, 20, 5523. [Google Scholar] [CrossRef]
- Tao, Z.; Zhou, X.; Xu, Z.; Lin, S.; Hu, Y.; Wei, T. Finger-Vein Recognition Using Bidirectional Feature Extraction and Transfer Learning. Math. Probl. Eng. 2021, 2021, 6664809. [Google Scholar] [CrossRef]
- Huang, Z.; Guo, C. Robust finger vein recognition based on deep CNN with spatial attention and bias field correction. Int. J. Artif. Intell. Tools 2021, 30, 2140005. [Google Scholar] [CrossRef]
- Babalola, F.O.; Bitirim, Y.; Toygar, Ö. Palm vein recognition through fusion of texture-based and CNN-based methods. Signal Image Video Process. 2021, 15, 459–466. [Google Scholar] [CrossRef]
- Yang, H.; Fang, P.; Hao, Z. A gan-based method for generating finger vein dataset. In Proceedings of the 2020 3rd International Conference on Algorithms, Computing and Artificial Intelligence, Sanya, China, 24–26 December 2020; pp. 1–6. [Google Scholar]
- Madhusudhan, M.; Udayarani, V.; Hegde, C. An intelligent deep learning LSTM-DM tool for finger vein recognition model USING DSAE classifier. Int. J. Syst. Assur. Eng. Manag. 2024, 15, 532–540. [Google Scholar] [CrossRef]
- Lu, S.; Fung, S.; Pan, W.; Wickramasinghe, N.; Lu, X. Veintr: Robust end-to-end full-hand vein identification with transformer. Vis. Comput. 2024, 40, 7015–7023. [Google Scholar] [CrossRef]
- Li, X.; Feng, J.; Cai, J.; Lin, G. FV-MViT: Mobile Vision Transformer for Finger Vein Recognition. Sensors 2024, 24, 1331. [Google Scholar] [CrossRef]
- Abdullahi, S.B.; Bature, Z.A.; Chophuk, P.; Muhammad, A. Sequence-wise multimodal biometric fingerprint and finger-vein recognition network (STMFPFV-Net). Intell. Syst. Appl. 2023, 19, 200256. [Google Scholar] [CrossRef]
- Chen, Y.; Ji, D.; Ma, Q.; Zhai, C.; Ma, Y. A Novel Generative Adversarial Network for the Removal of Noise and Baseline Drift in Seismic Signals. IEEE Trans. Geosci. Remote Sens. 2024, 62, 5904814. [Google Scholar] [CrossRef]
- Khosravy, M.; Gupta, N.; Patel, N.; Senjyu, T.; Duque, C.A. Particle swarm optimization of morphological filters for electrocardiogram baseline drift estimation. In Applied Nature-Inspired Computing: Algorithms and Case Studies; Springer: Singapore, 2020; pp. 1–21. [Google Scholar]
- Zhang, X.; Jiang, S. Application of fourier transform and butterworth filter in signal denoising. In Proceedings of the 2021 6th International Conference on Intelligent Computing and Signal Processing (ICSP), Xi’an, China, 9–11 April 2021; pp. 1277–1281. [Google Scholar]
- Zhang, Z.; Wang, H.; Geng, J.; Deng, X.; Jiang, W. A New Data Augmentation Method Based on Mixup and Dempster-Shafer Theory. IEEE Trans. Multimedia 2023, 26, 4998–5013. [Google Scholar] [CrossRef]
- Kong, F.; Zhang, R.; Guo, X.; Mensah, S.; Mao, Y. Dropmix: A textual data augmentation combining dropout with mixup. In Proceedings of the 2022 Conference on Empirical Methods in Natural Language Processing, Abu Dhabi, United Arab Emerites, 7–11 December 2022; pp. 890–899. [Google Scholar]
- Li, Y.; Lu, H.; Wang, Y.; Gao, R.; Zhao, C. ViT-Cap: A novel vision transformer-based capsule network model for finger vein recognition. Appl. Sci. 2022, 12, 10364. [Google Scholar] [CrossRef]
- Sağ, T.; Abdullah Jalil Jalil, Z. Vortex search optimization algorithm for training of feed-forward neural network. Int. J. Mach. Learn. Cybern. 2021, 12, 1517–1544. [Google Scholar] [CrossRef]
- Basha, S.S.; Dubey, S.R.; Pulabaigari, V.; Mukherjee, S. Impact of fully connected layers on performance of convolutional neural networks for image classification. Neurocomputing 2020, 378, 112–119. [Google Scholar] [CrossRef]
- Mao, A.; Mohri, M.; Zhong, Y. Cross-entropy loss functions: Theoretical analysis and applications. In Proceedings of the International Conference on Machine Learning, Honolulu, HI, USA, 23–29 July 2023; pp. 23803–23828. [Google Scholar]
- Chandriah, K.K.; Naraganahalli, R.V. RNN/LSTM with modified Adam optimizer in deep learning approach for automobile spare parts demand forecasting. Multimedia Tools Appl. 2021, 80, 26145–26159. [Google Scholar] [CrossRef]
Disclaimer/Publisher’s Note: The statements, opinions and data contained in all publications are solely those of the individual author(s) and contributor(s) and not of MDPI and/or the editor(s). MDPI and/or the editor(s) disclaim responsibility for any injury to people or property resulting from any ideas, methods, instructions or products referred to in the content. |
© 2025 by the authors. Licensee MDPI, Basel, Switzerland. This article is an open access article distributed under the terms and conditions of the Creative Commons Attribution (CC BY) license (https://creativecommons.org/licenses/by/4.0/).