
Enhanced Fault Prediction for Synchronous Condensers Using LLM-Optimized Wavelet Packet Transformation


Abstract
1. Introduction
2. Background and Related Work
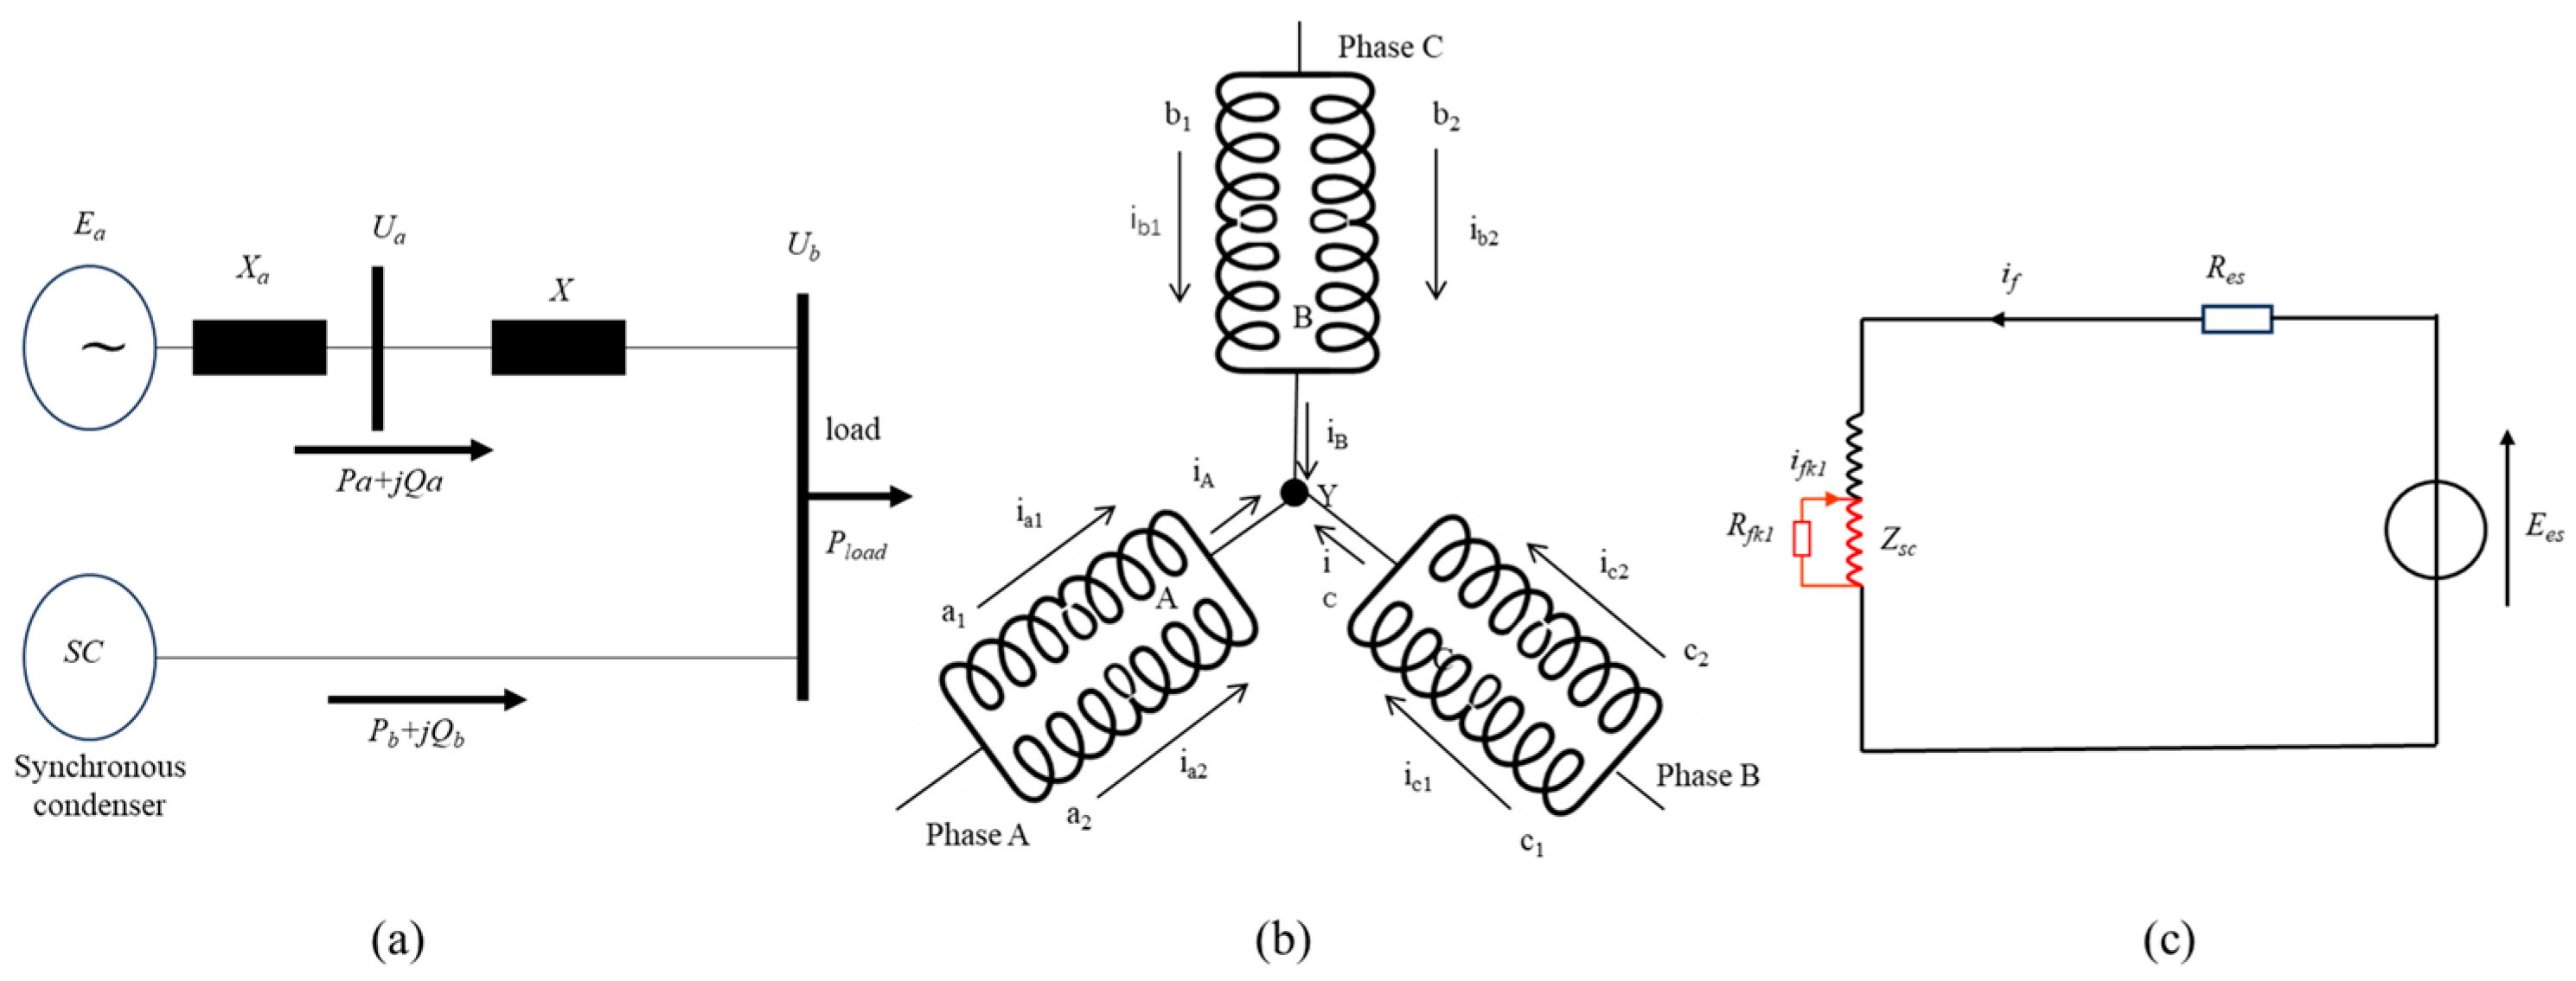
2.1. Synchronous Condensers Fault Types
2.2. Traditional Fault Detection and Diagnosis Methods
2.3. LLMs for Industrial Fault Prediction and Diagnosis
3. LLM-Driven Intelligent Framework
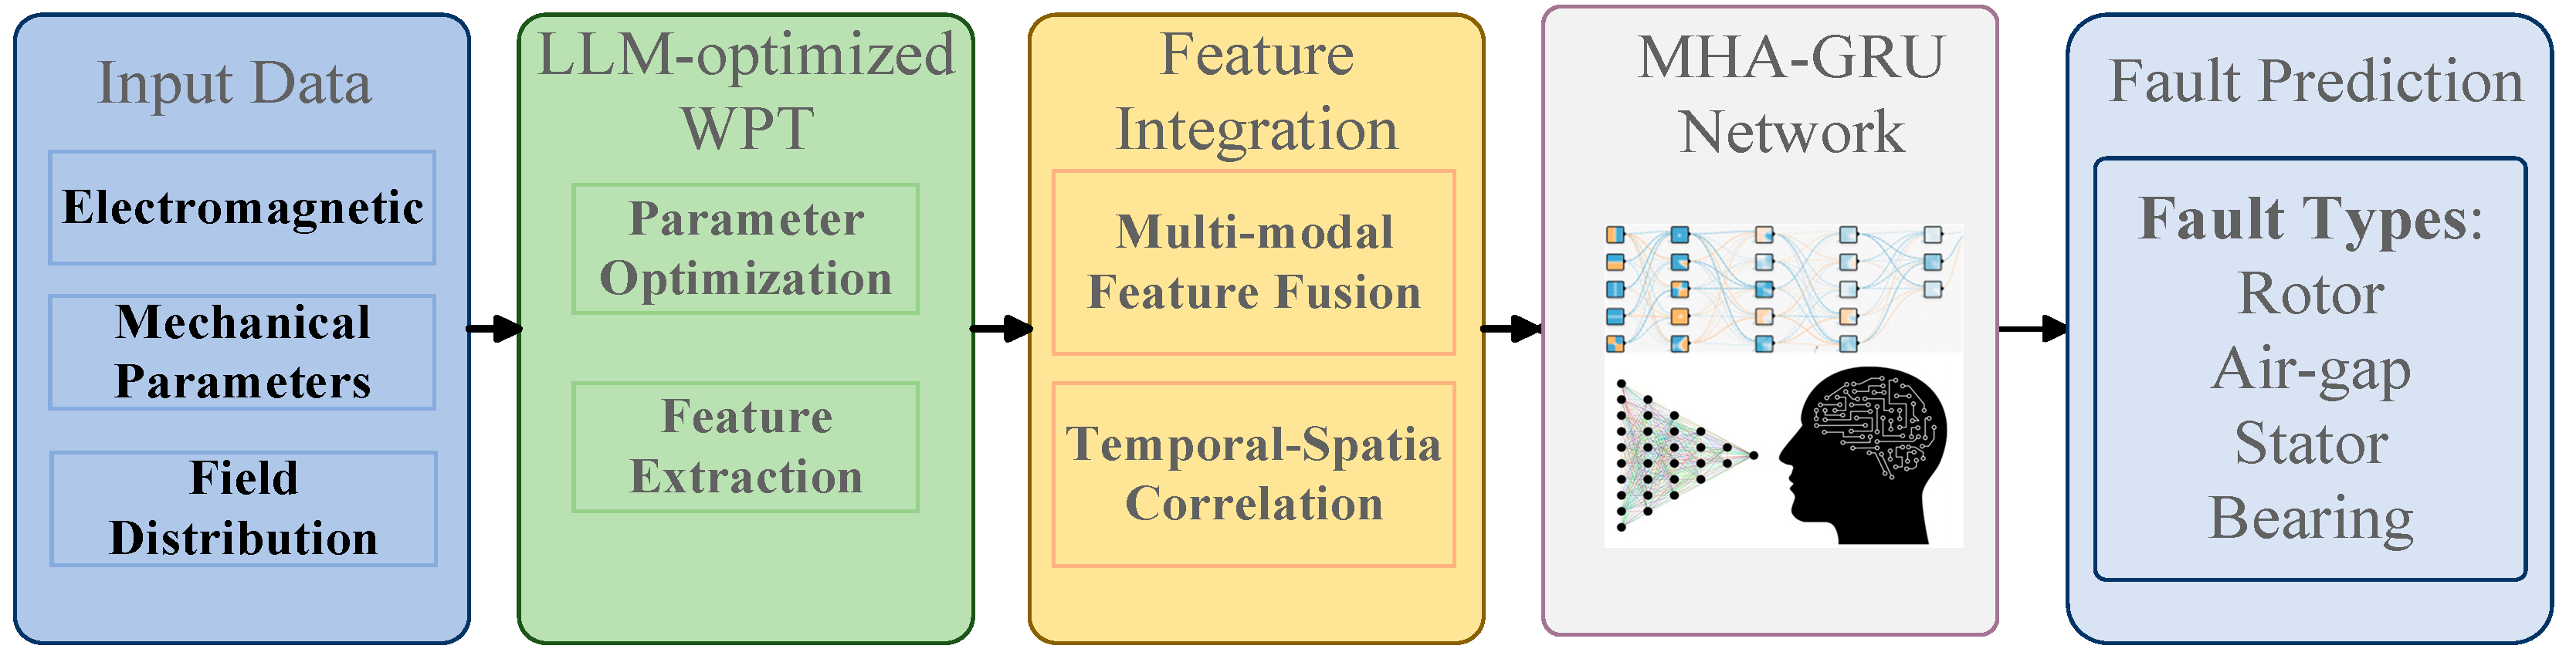
3.1. Integration Framework of LLM-Optimized WPT and MHA-GRU Network
3.2. Neural Network Architecture Design
- (1)
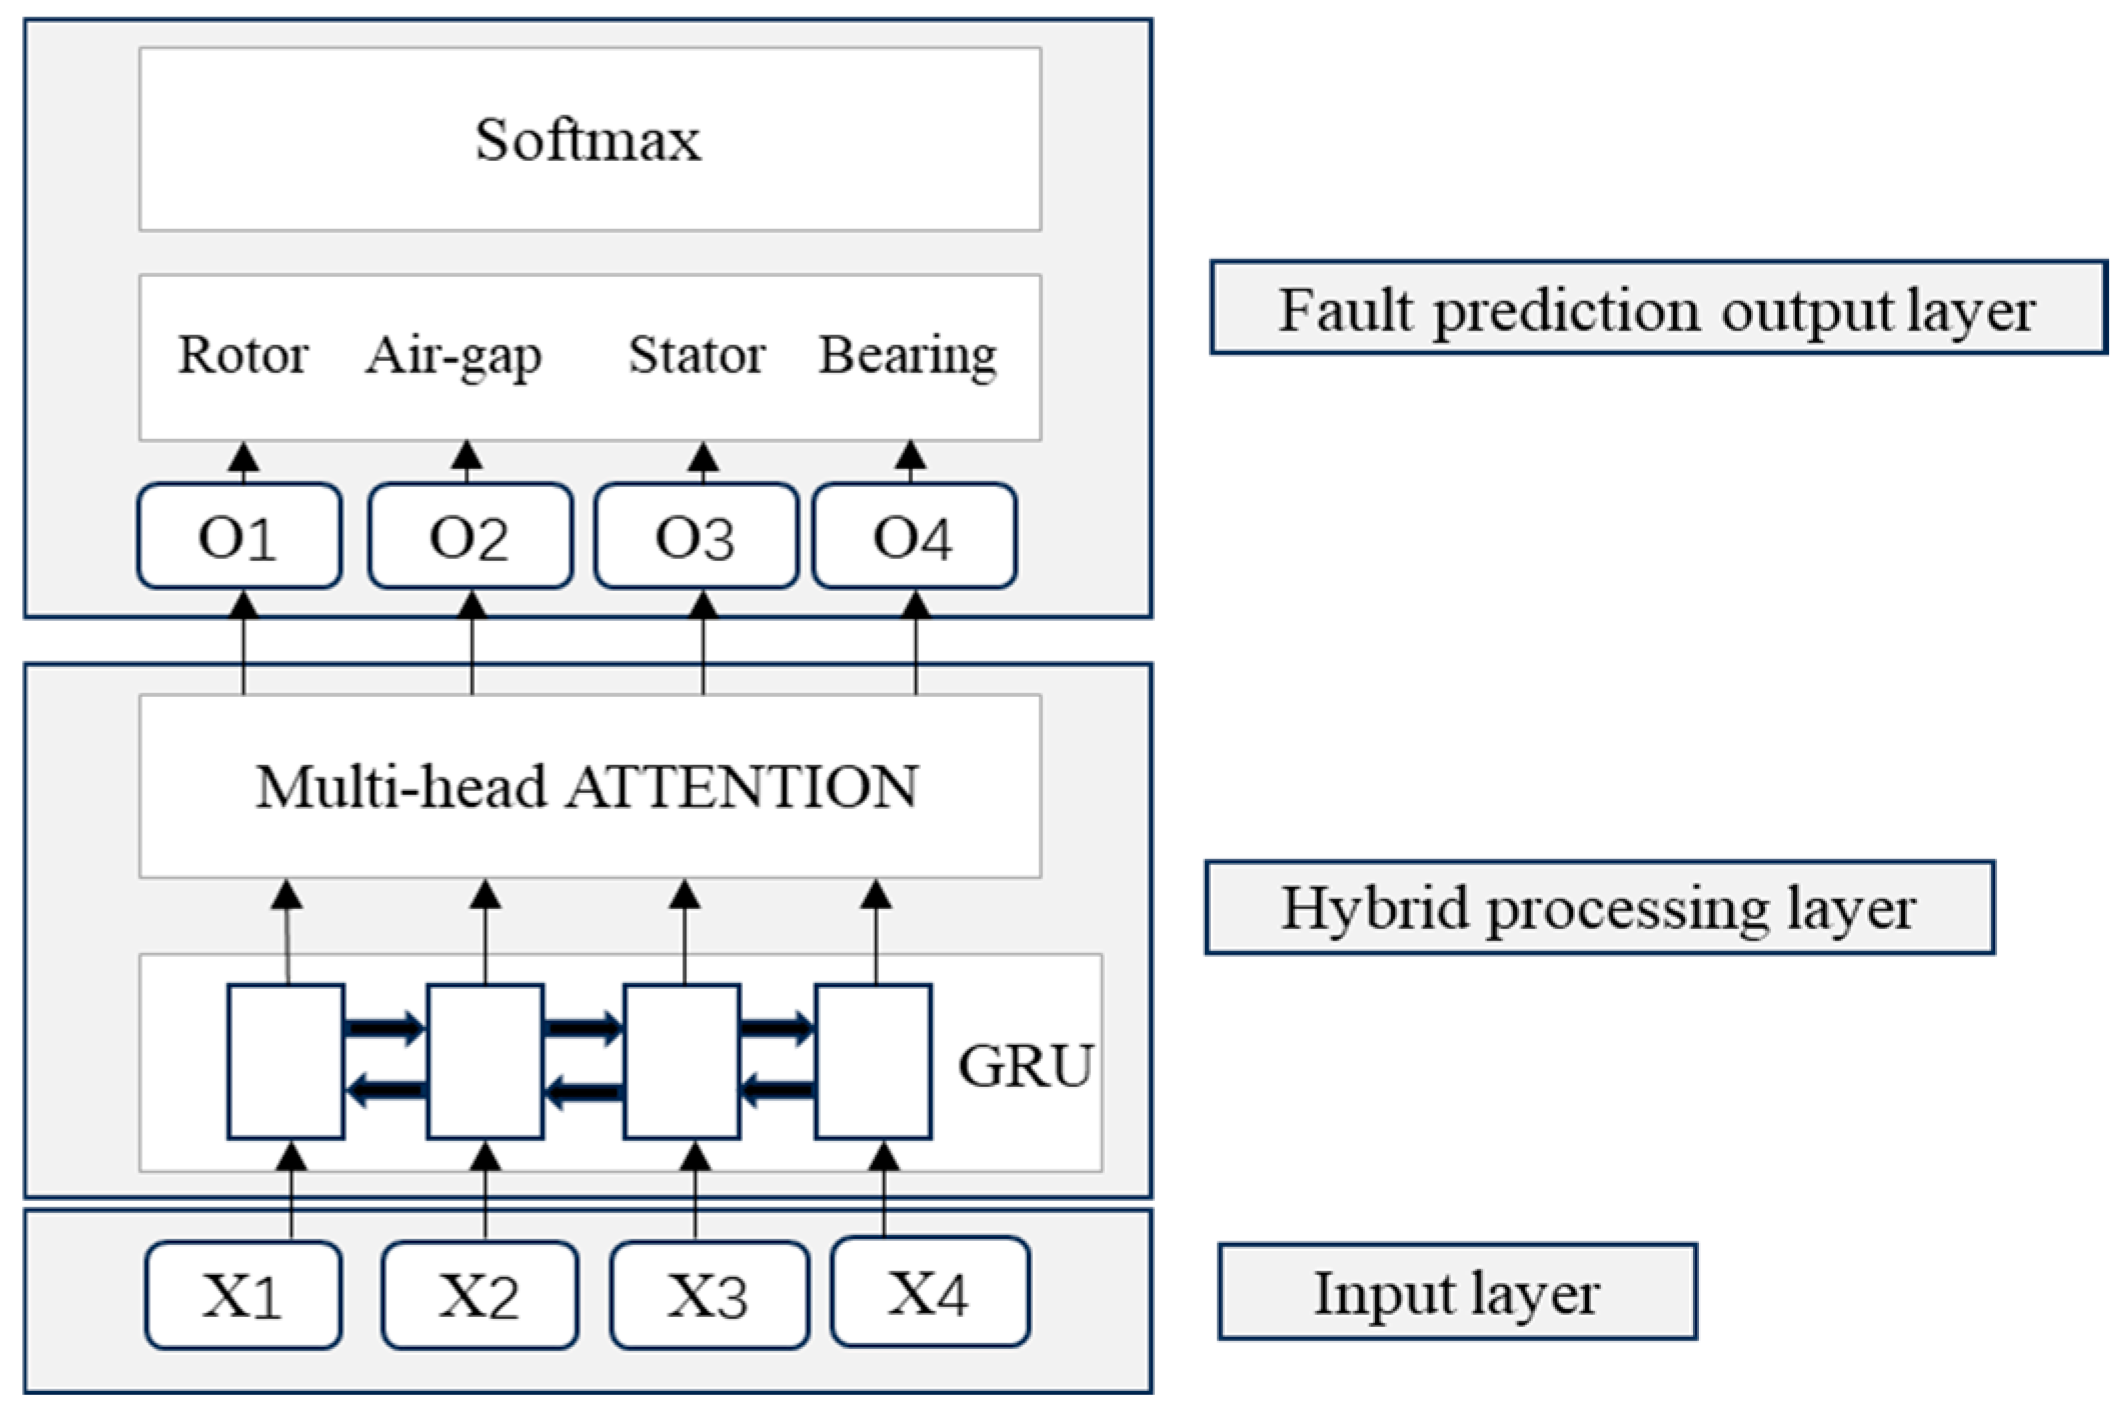
- MHA-GRU Network Architecture:
- (2)
- Input Layer:
- (3)
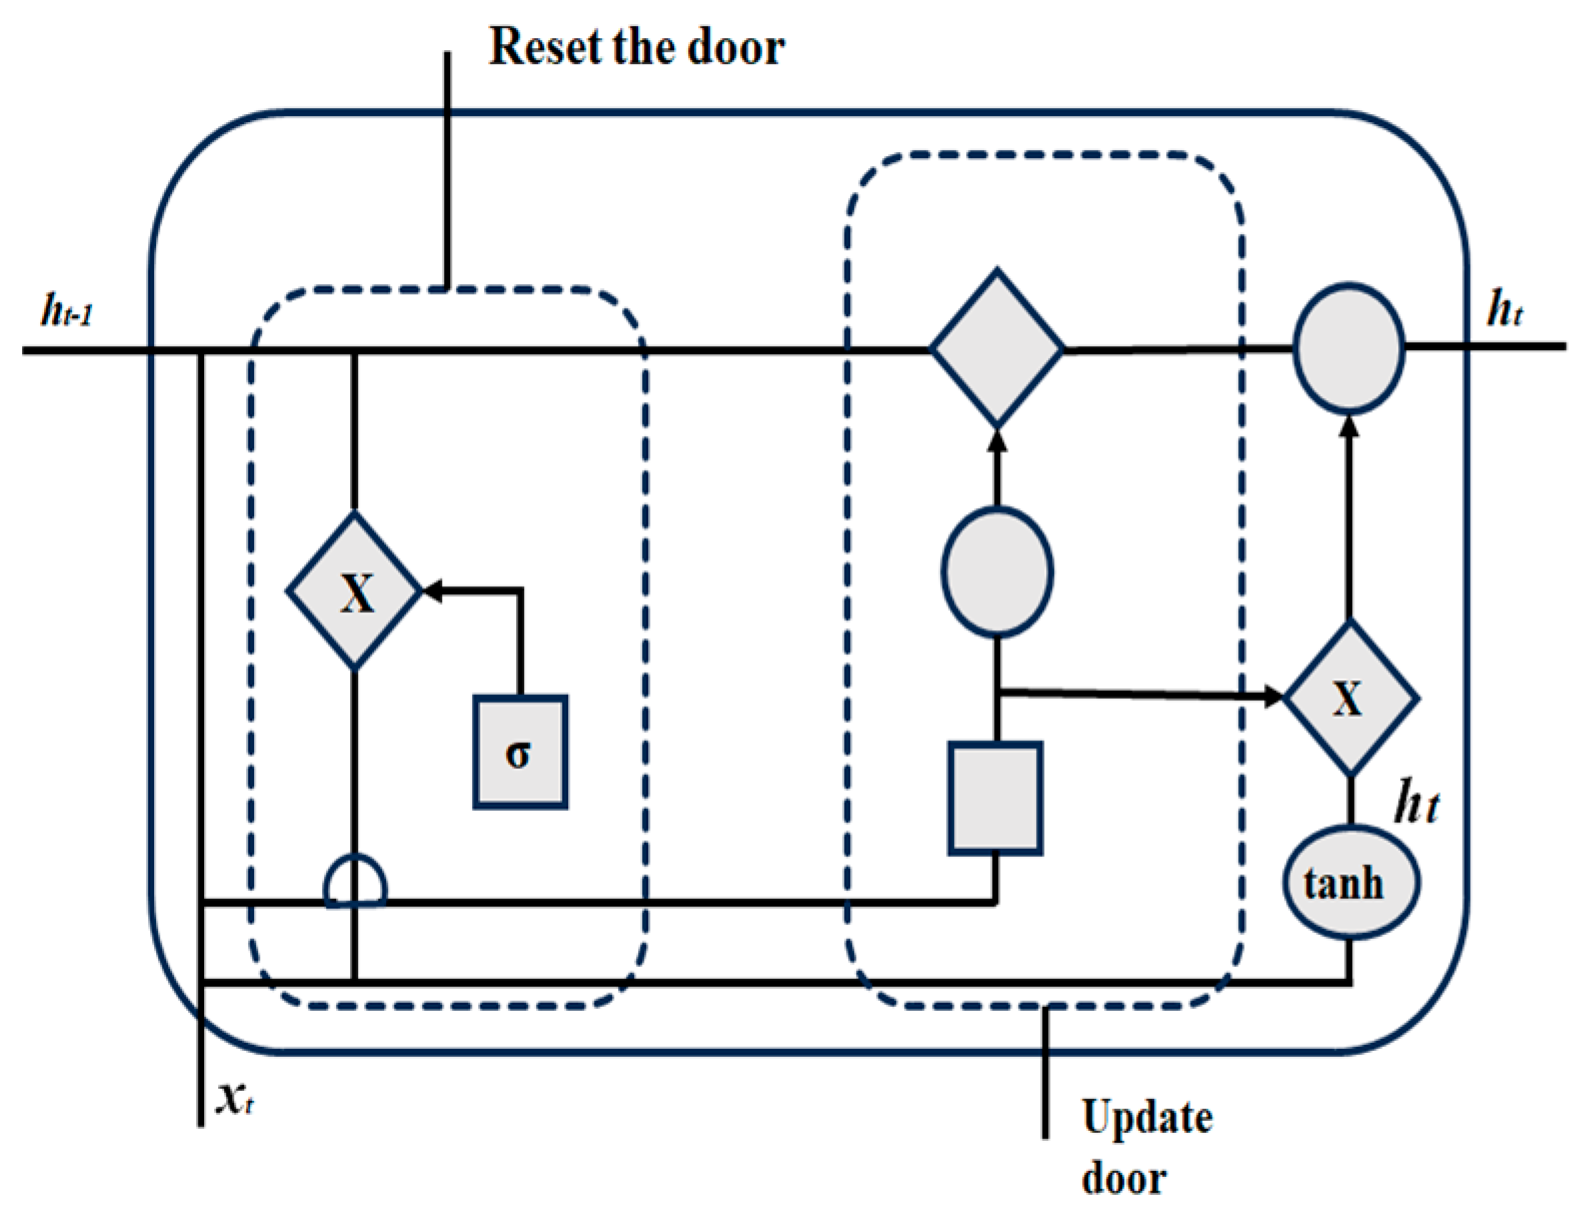
- Hybrid Processing Layer:
- (3)
- Fault Prediction Output Layer:
3.3. Multi-Modal Feature Learning
3.4. LLM-Based Decision Making
4. Feature Processing and Enhancement
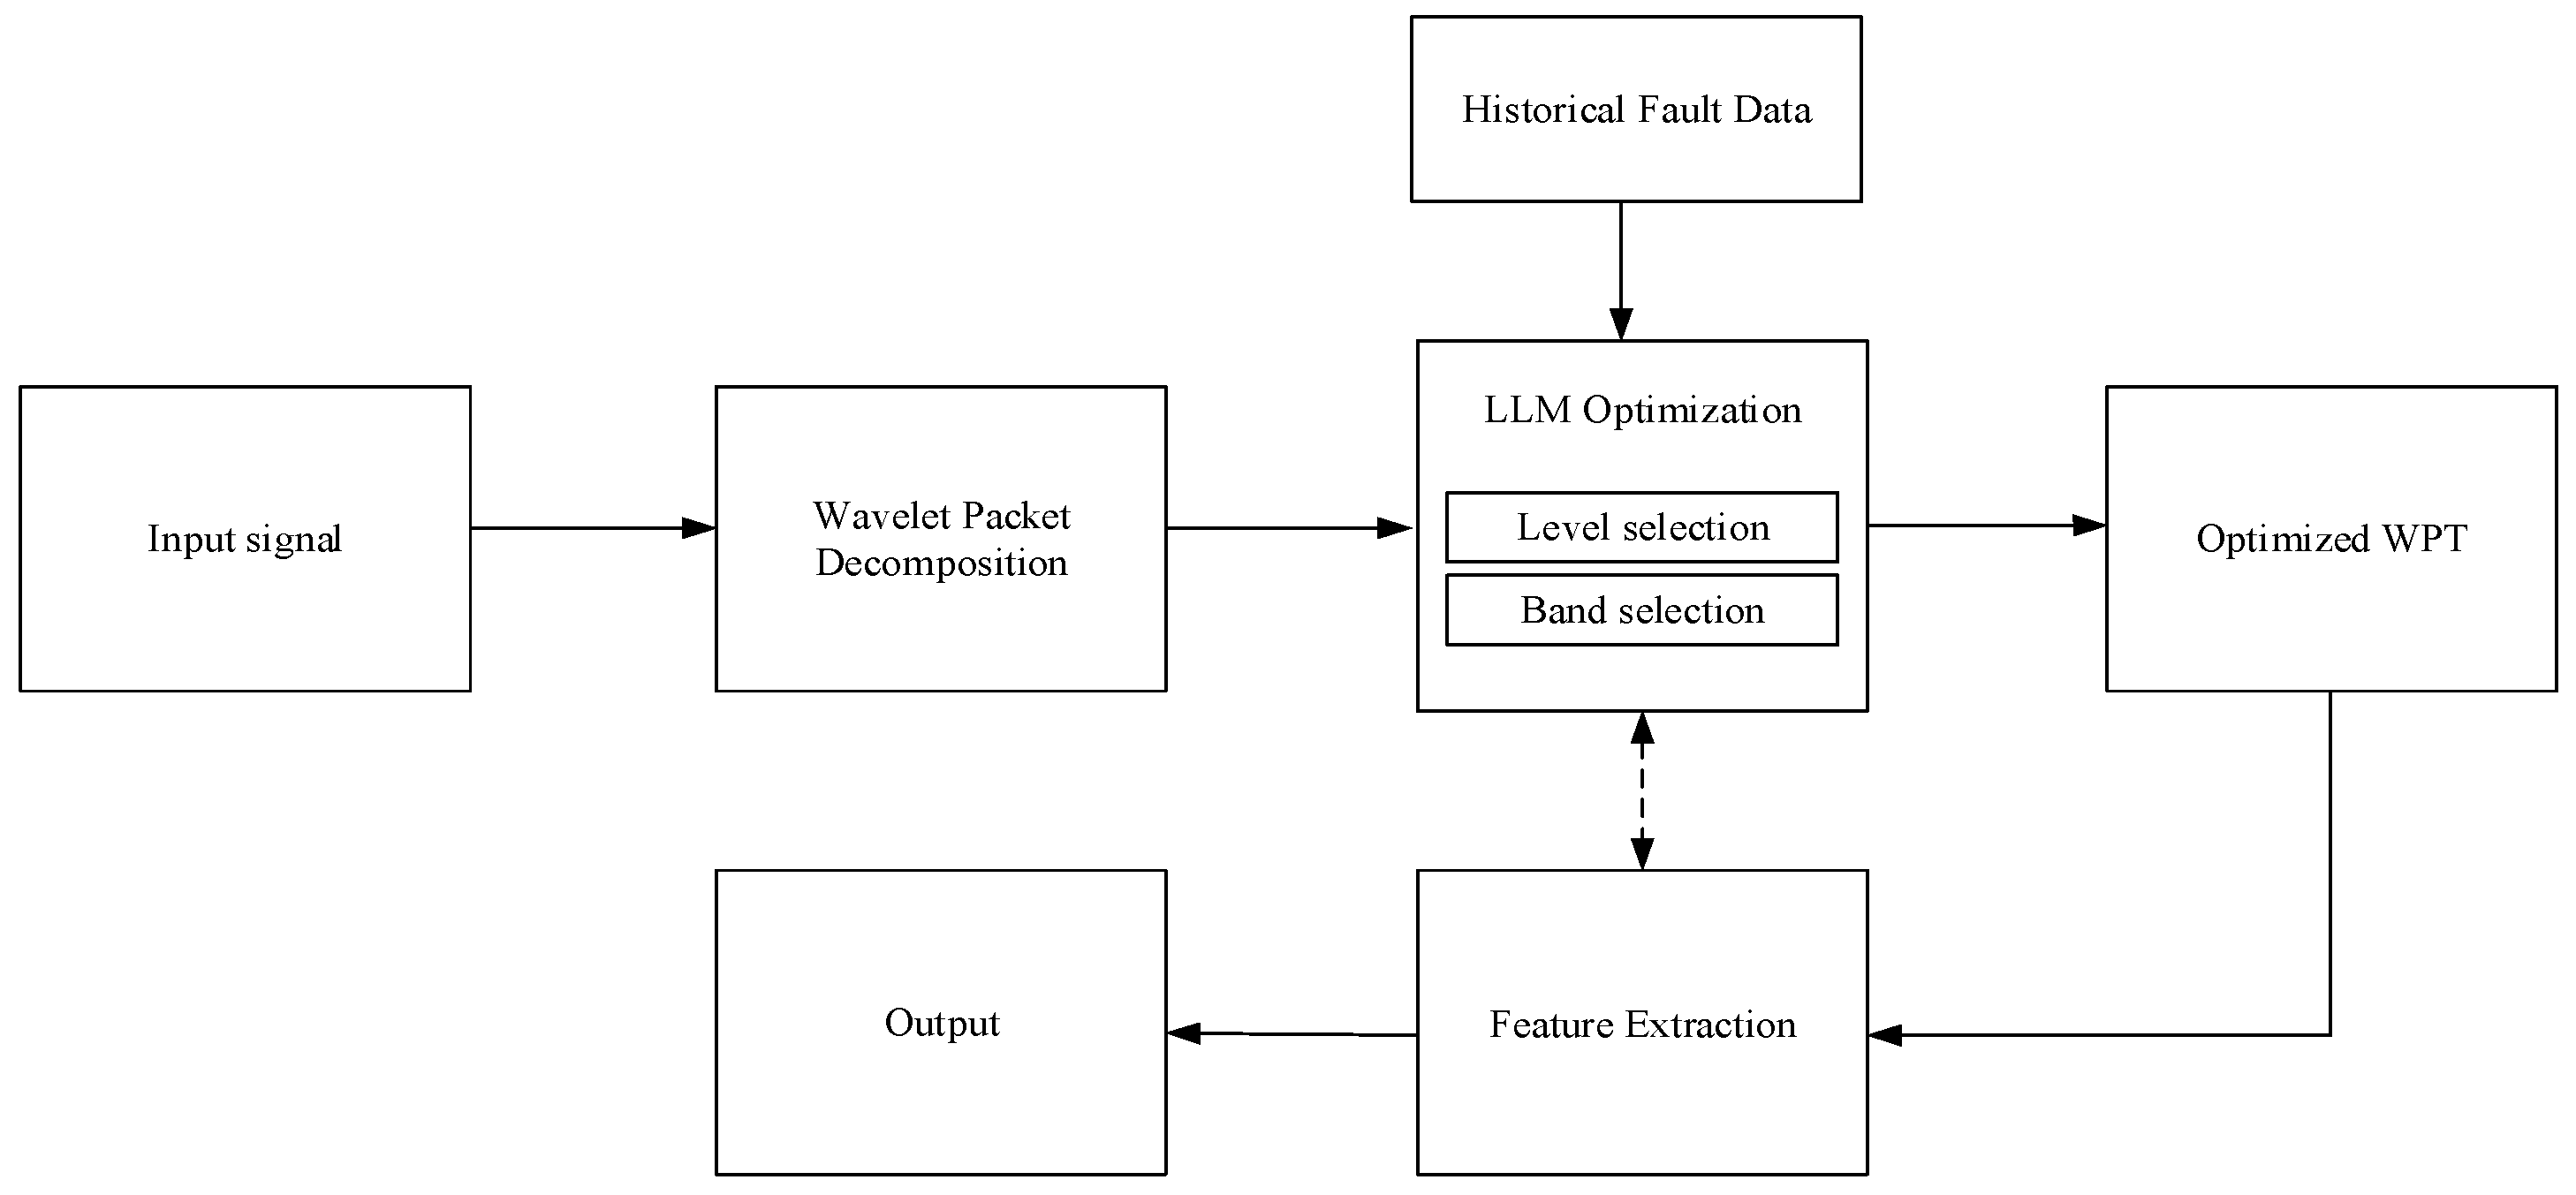
4.1. Wavelet Packet Transform
4.2. Fault Feature Extraction via Wavelet Packet Transform
4.3. Optimal Wavelet Packet Selection Using LLM
4.4. Prediction Process Flow for Synchronous Condenser Fault Detection
5. Experiment Results and Analysis
5.1. Experimental Setup and Implementation
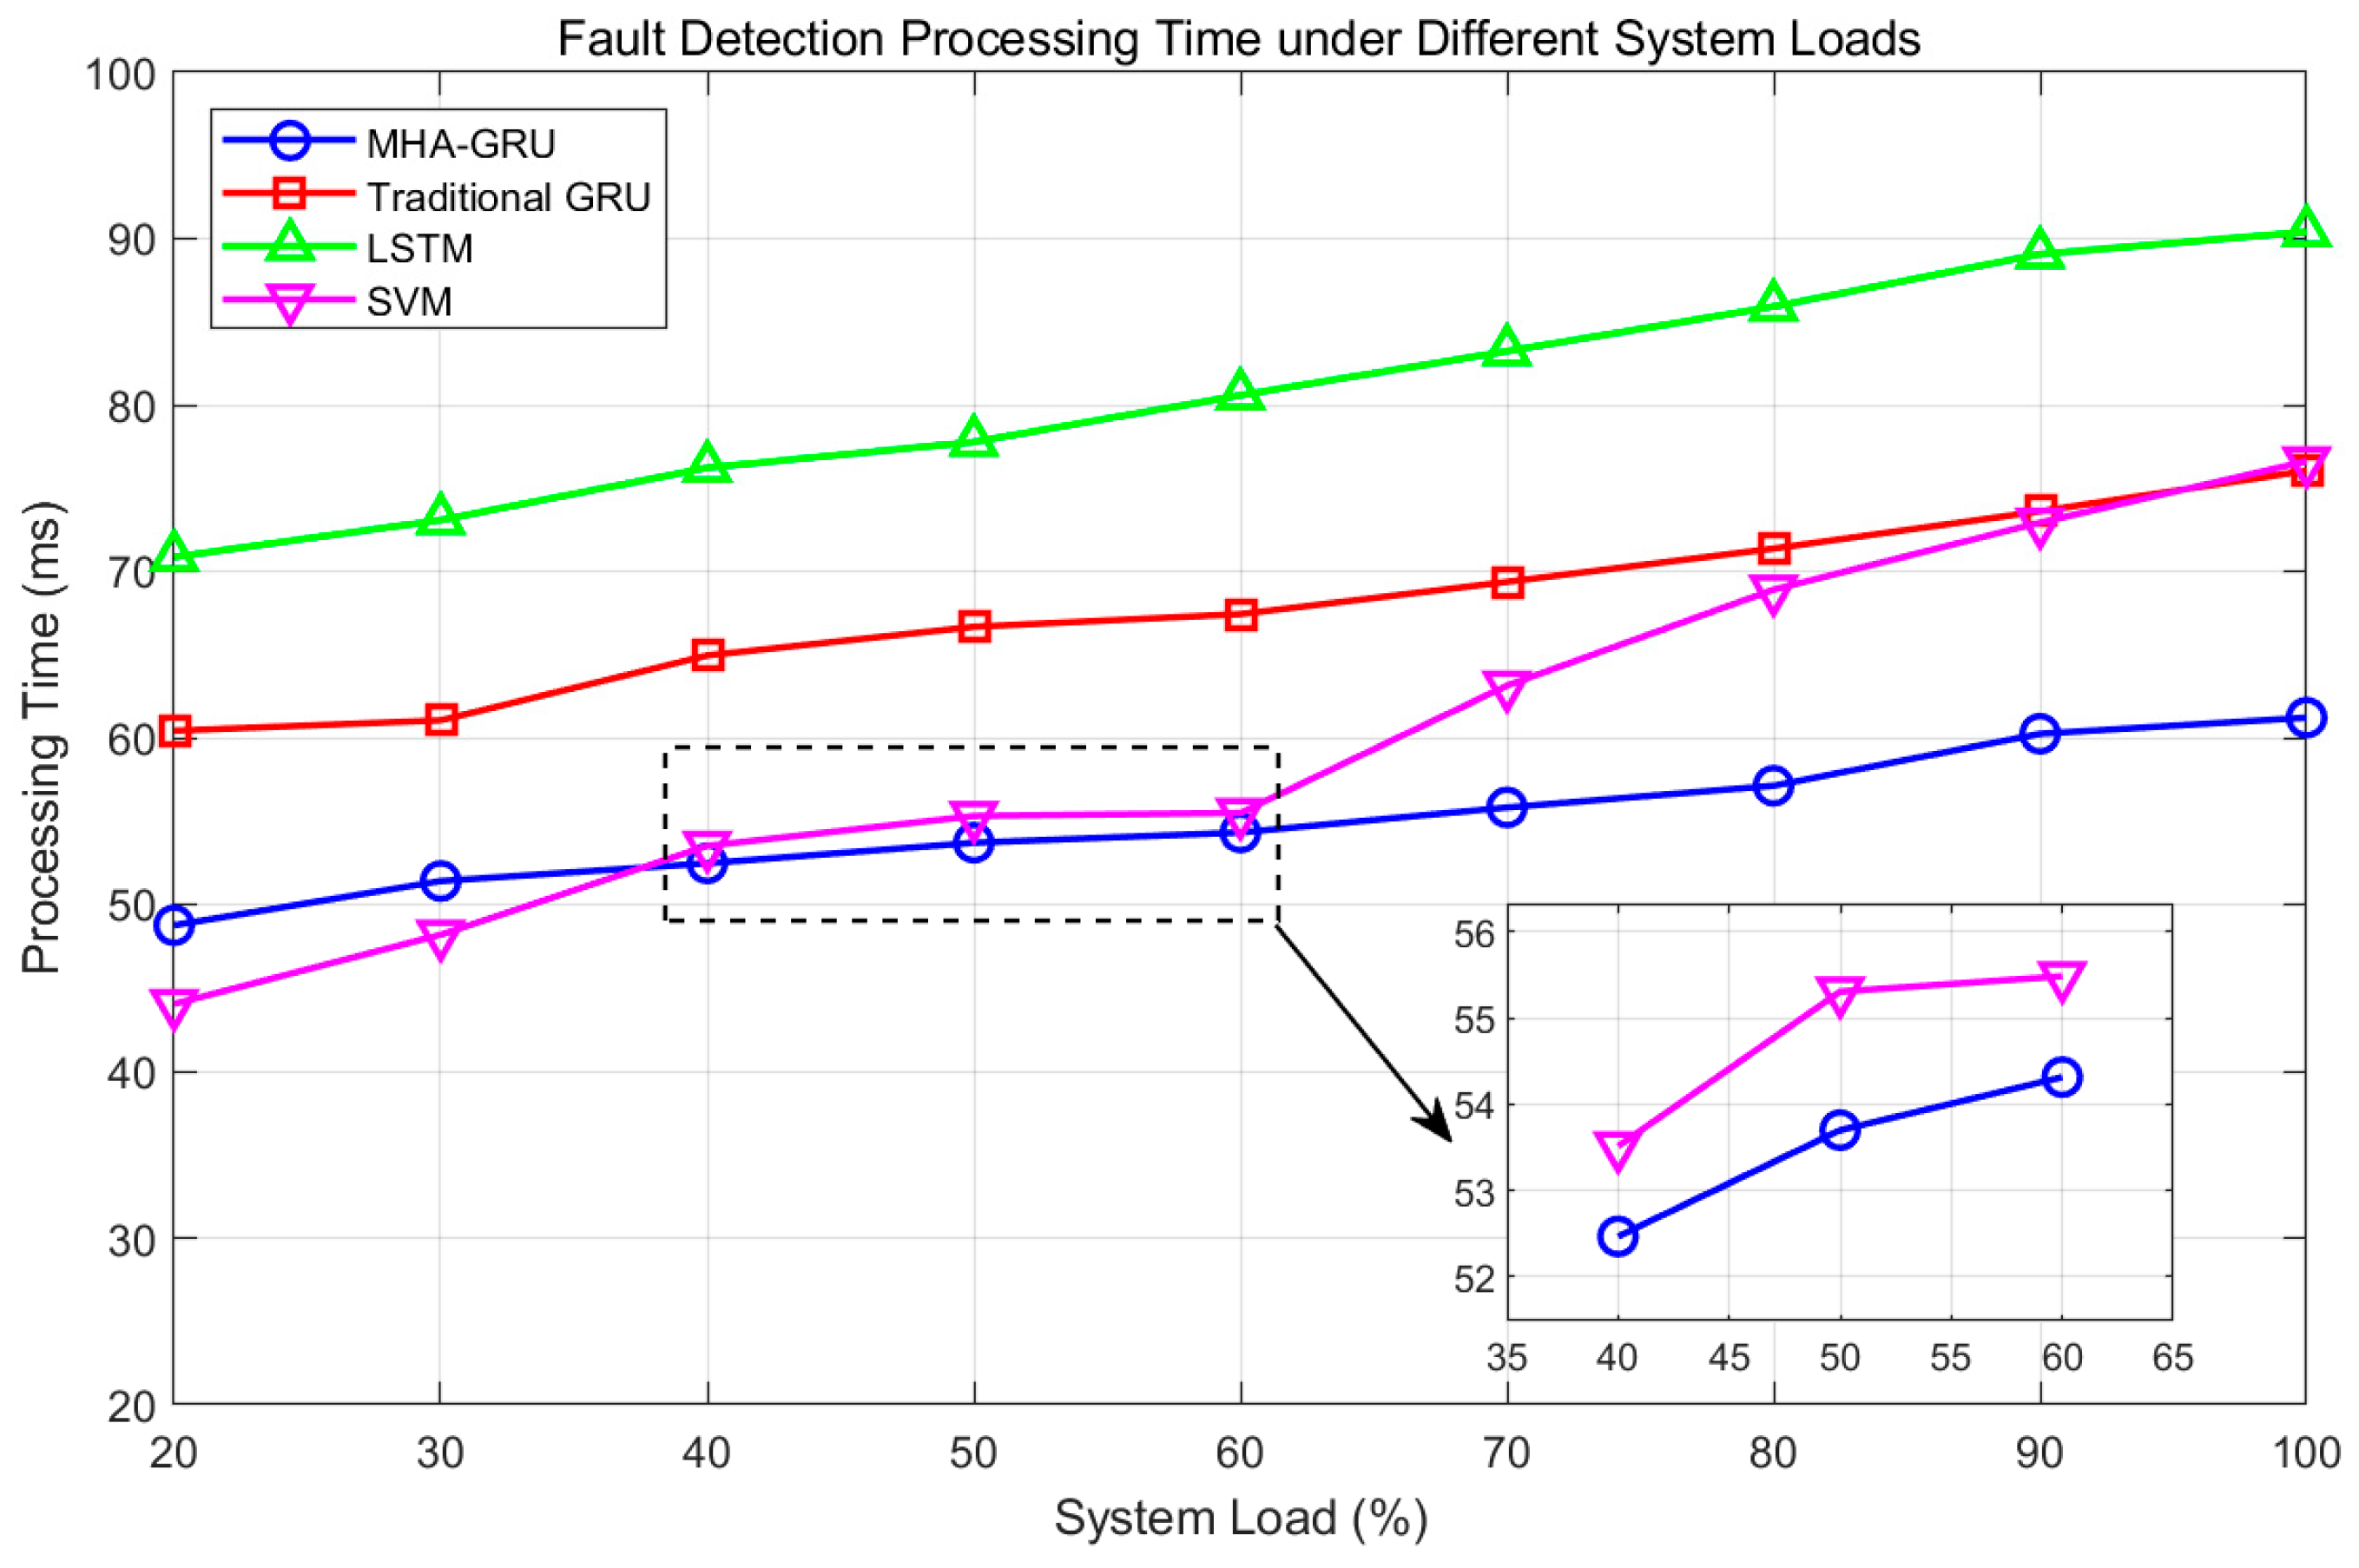
5.2. Comprehensive Performance Analysis
5.3. LLM Feature Enhancement Analysis
5.4. Framework Generalization and Adaptability
6. Conclusions
Author Contributions
Funding
Data Availability Statement
Conflicts of Interest
References
- Yousaf, M.Z.; Mirsaeidi, S.; Khalid, S.; Raza, A.; Zhichu, C.; Rehman, W.U.; Badshah, F. Multisegmented Intelligent Solution for MT-HVDC Grid Protection. Electronics 2023, 12, 1766. [Google Scholar] [CrossRef]
- Purbowaskito, W.; Wu, P.-Y.; Lan, C.-Y. Permanent Magnet Synchronous Motor Driving Mechanical Transmission Fault Detection and Identification: A Model-Based Diagnosis Approach. Electronics 2022, 11, 1356. [Google Scholar] [CrossRef]
- Kuai, Z.; Huang, G. Fault Diagnosis of Diesel Engine Valve Clearance Based on Wavelet Packet Decomposition and Neural Networks. Electronics 2023, 12, 353. [Google Scholar] [CrossRef]
- Yuan, X.; Wang, Y.; Yang, C.; Ge, Z.; Song, Z.; Gui, W. Weighted Linear Dynamic System for Feature Representation and Soft Sensor Application in Nonlinear Dynamic Industrial Processes. IEEE Trans. Ind. Electron. 2018, 65, 1508–1517. [Google Scholar] [CrossRef]
- Qiang, C.Q.; Ping, L.J.; Haq, A.U.; He, L.; Haq, A. Net Traffic Classification Based on GRU Network Using Sequential Features. In Proceedings of the 18th International Computer Conference on Wavelet Active Media Technology and Information Processing (ICCWAMTIP), Chengdu, China, 17–19 December 2021; pp. 460–465. [Google Scholar]
- Guo, T.; Zhang, T.; Lim, E.; López-Benítez, M.; Ma, F.; Yu, L. A Review of Wavelet Analysis and Its Applications: Challenges and Opportunities. IEEE Access 2022, 10, 58869–58903. [Google Scholar] [CrossRef]
- Rehman, A.U.; Chen, Y.; Zhao, Y.; Cheng, Y.; Zhao, Y.; Tanaka, T. Detection of Rotor Inter-turn Short Circuit Fault in Doubly-fed Induction Generator using FEM Simulation. In Proceedings of the 2018 IEEE 2nd International Conference on Dielectrics (ICD), Budapest, Hungary, 1–5 July 2018; pp. 1–4. [Google Scholar]
- Lare, P.; Sarabi, S.; Delpha, C.; Nasr, A.; Diallo, D. Stator winding Inter-turn short-circuit and air gap eccentricity fault detection of a Permanent Magnet-Assisted Synchronous Reluctance Motor in Electrified vehicle. In Proceedings of the 2021 24th International Conference on Electrical Machines and Systems (ICEMS), Gyeongju, Republic of Korea, 31 October–3 November 2021; pp. 932–937. [Google Scholar]
- Taghipour-GorjiKolaie, M.; Razavi, S.M.; Shamsi-Nejad, M.A.; Darzi, A. Inter-turn stator winding fault detection in PMSM using magnitude of reactive power. In Proceedings of the 2011 IEEE International Conference on Computer Applications and Industrial Electronics (ICCAIE), Penang, Malaysia, 4–7 December 2011; pp. 256–261. [Google Scholar]
- Zhu, W.; Huang, P. Performance Degradation Assessment of Rolling Bearing Based on Difference of Eigenvalues in Random Matrix Theory. In Proceedings of the 2023 10th International Conference on Dependable Systems and Their Applications (DSA), Tokyo, Japan, 10–11 August 2023; pp. 559–564. [Google Scholar]
- Lu, Y.; Li, Q.; Liang, S.Y. Adaptive prognosis of bearing degradation based on wavelet decomposition assisted ARMA model. In Proceedings of the 2017 IEEE 2nd Information Technology, Networking, Electronic and Automation Control Conference (ITNEC), Chengdu, China, 15–17 December 2017; pp. 733–736. [Google Scholar]
- Wang, L.; Wang, H.; Lu, T.; Wang, C. Synchronous Condenser Reactive Power Output Model Based on DAG-CNN. In Proceedings of the 2021 International Conference on Communications, Information System and Computer Engineering (CISCE), Beijing, China, 14–16 May 2021; pp. 674–678. [Google Scholar]
- Trummer, I. Large Language Models: Principles and Practice. In Proceedings of the IEEE 40th International Conference on Data Engineering (ICDE), Utrecht, The Netherlands, 13–17 May 2024; pp. 5354–5357. [Google Scholar]
- Li, W.; Xuan, W.; Min, W. Motor bearing fault diagnosis based on wavelet packet decomposition of instantaneous power. In Proceedings of the 2010 International Conference on Computer Design and Applications, Qinhuangdao, China, 25–27 June 2010; pp. V3-457–V3-459. [Google Scholar]
- Yang, H.; Lin, L.; Zhong, S.; Guo, F.; Cui, Z. Aero Engines Fault Diagnosis Method Based on Convolutional Neural Network Using Multiple Attention Mechanism. In Proceedings of the 2021 IEEE International Conference on Sensing, Diagnostics, Prognostics, and Control (SDPC), Weihai, China, 13–15 August 2021; pp. 13–18. [Google Scholar]
- Sun, C.; Zhang, Y.; Xu, S.; Tian, W.; Gu, B.; Cheng, M.; Chao, W. Equivalent analysis of Stator Inter-Turn Fault in Different Winding Topologies of Synchronous Condenser. In Proceedings of the 2022 IEEE 5th International Electrical and Energy Conference (CIEEC), Nangjing, China, 27–29 May 2022; pp. 4994–4998. [Google Scholar]
- Dey, R.; Salem, F.M. Gate-variants of Gated Recurrent Unit (GRU) Neural Networks. In Proceedings of the 60th International Midwest Symposium on Circuits and Systems (MWSCAS), Boston, MA, USA, 6–9 August 2017; pp. 1597–1600. [Google Scholar]
- Han, X.; Liang, Y.; Zhu, E.; Bian, X. Nonlinear Transient Mathematical Model of Large-Capacity Synchronous Condenser Based on Time-Varying Reactance Parameters. IEEE Access 2023, 11, 5411–35420. [Google Scholar] [CrossRef]
- Zainuddin, Z.; EA, P.A.; Hasan, M.H. Predicting Machine Failure Using Recurrent Neural Network-Gated Recurrent Unit (RNN-GRU) through Time Series Data. Bull. Electr. Eng. Inform. 2021, 10, 870–878. [Google Scholar]
- Fu, X.; Li, H.; Xu, D.; Lin, M.; Zou, J. Analysis of Air-Gap Magnetic Field in Homopolar Inductor Alternator by Analytical Method and FEM. IEEE Trans. Magn. 2015, 51, 8100604. [Google Scholar]
- Liu, X.; Zhang, Y.; Wang, X. Research on Air Gap Magnetic Field for Permanent Magnet Toroidal Motor with Rotor Eccentricity. In Proceedings of the 2023 26th International Conference on Electrical Machines and Systems (ICEMS), Zhuhai, China, 5–8 November 2023; pp. 2712–2716. [Google Scholar]
- Ren, Z.; Wang, C.; Ye, L.; Hu, J.; Liu, Y.; Zhou, W. Analysis of Electromagnetic Characteristics of Synchronous Condenser Under Stator Inter-Tum Short Circuit Fault. In Proceedings of the 2018 21st International Conference on Electrical Machines and Systems (ICEMS), Jeju, South Korea, 7–10 October 2018; pp. 2638–2642. [Google Scholar]
- Chen, J.; Chuan, S.; Chao, X. Research on Fault Analysis and Remote Fault Diagnosis Technology of New Large Capacity Synchronous Condenser. In Proceedings of the 2024 IEEE 4th International Conference on Power, Electronics and Computer Applications (ICPECA), Shenyang, China, 26–28 January 2024; pp. 87–91. [Google Scholar]
- Hussein, A.M.; Obed, A.A.; Zubo, R.H.A.; Al-Yasir, Y.I.A.; Saleh, A.L.; Fadhel, H.; Sheikh-Akbari, A.; Mokryani, G.; Abd-Alhameed, R.A. Detection and Diagnosis of Stator and Rotor Electrical Faults for Three-Phase Induction Motor via Wavelet Energy Approach. Electronics 2022, 11, 1253. [Google Scholar] [CrossRef]
- Chen, S.; Li, Z.; Pan, G.; Xu, F. Power Quality Disturbance Recognition Using Empirical Wavelet Transform and Feature Selection. Electronics 2022, 11, 174. [Google Scholar] [CrossRef]
- Kareem, A.B.; Hur, J.-W. Towards Data-Driven Fault Diagnostics Framework for SMPS-AEC Using Supervised Learning Algorithms. Electronics 2022, 11, 2492. [Google Scholar] [CrossRef]
- Liu, W.; Yang, X.; Jinxing, S. An Integrated Fault Identification Approach for Rolling Bearings Based on Dual-Tree Complex Wavelet Packet Transform and Generalized Composite Multiscale Amplitude-Aware Permutation Entropy. Shock. Vib. 2020, 2020, 8851310. [Google Scholar] [CrossRef]
- Shcherbatov, I.; Lisin, E.; Rogalev, A.; Tsurikov, G.; Dvořák, M.; Strielkowski, W. Power Equipment Defects Prediction Based on the Joint Solution of Classification and Regression Problems Using Machine Learning Methods. Electronics 2021, 10, 3145. [Google Scholar] [CrossRef]


| Data Category | Signal Acquisition | Feature Characteristics | Processing Method |
|---|---|---|---|
| Mechanical Parameters | Shaft-mounted sensors and vibration probes | Acceleration, Displacement, Velocity, Vibration modes | Wavelet decomposition, Time-frequency analysis |
| Electrical Indicators | Current/voltage sensors and power analyzers | Phase voltage, Current amplitude, Power factor, Harmonics | FFT analysis, Power spectrum density |
| Field Distribution | Embedded flux sensors and field probes | Magnetic field intensity, Flux density, Field symmetry | Spatial-temporal decomposition |
| System Parameter | Value/Description |
|---|---|
| Training Epochs | 50 |
| Batch Size | 64 |
| Learning Rate | 0.001 |
| Attention Heads | 8 |
| Hidden Layer Size | 256 |
| Dropout Rate | 0.2 |
| Sequence Length | 2048 |
| Model Architecture | MHA-GRU with 3 layers |
| Software Framework | PyTorch 1.8 |
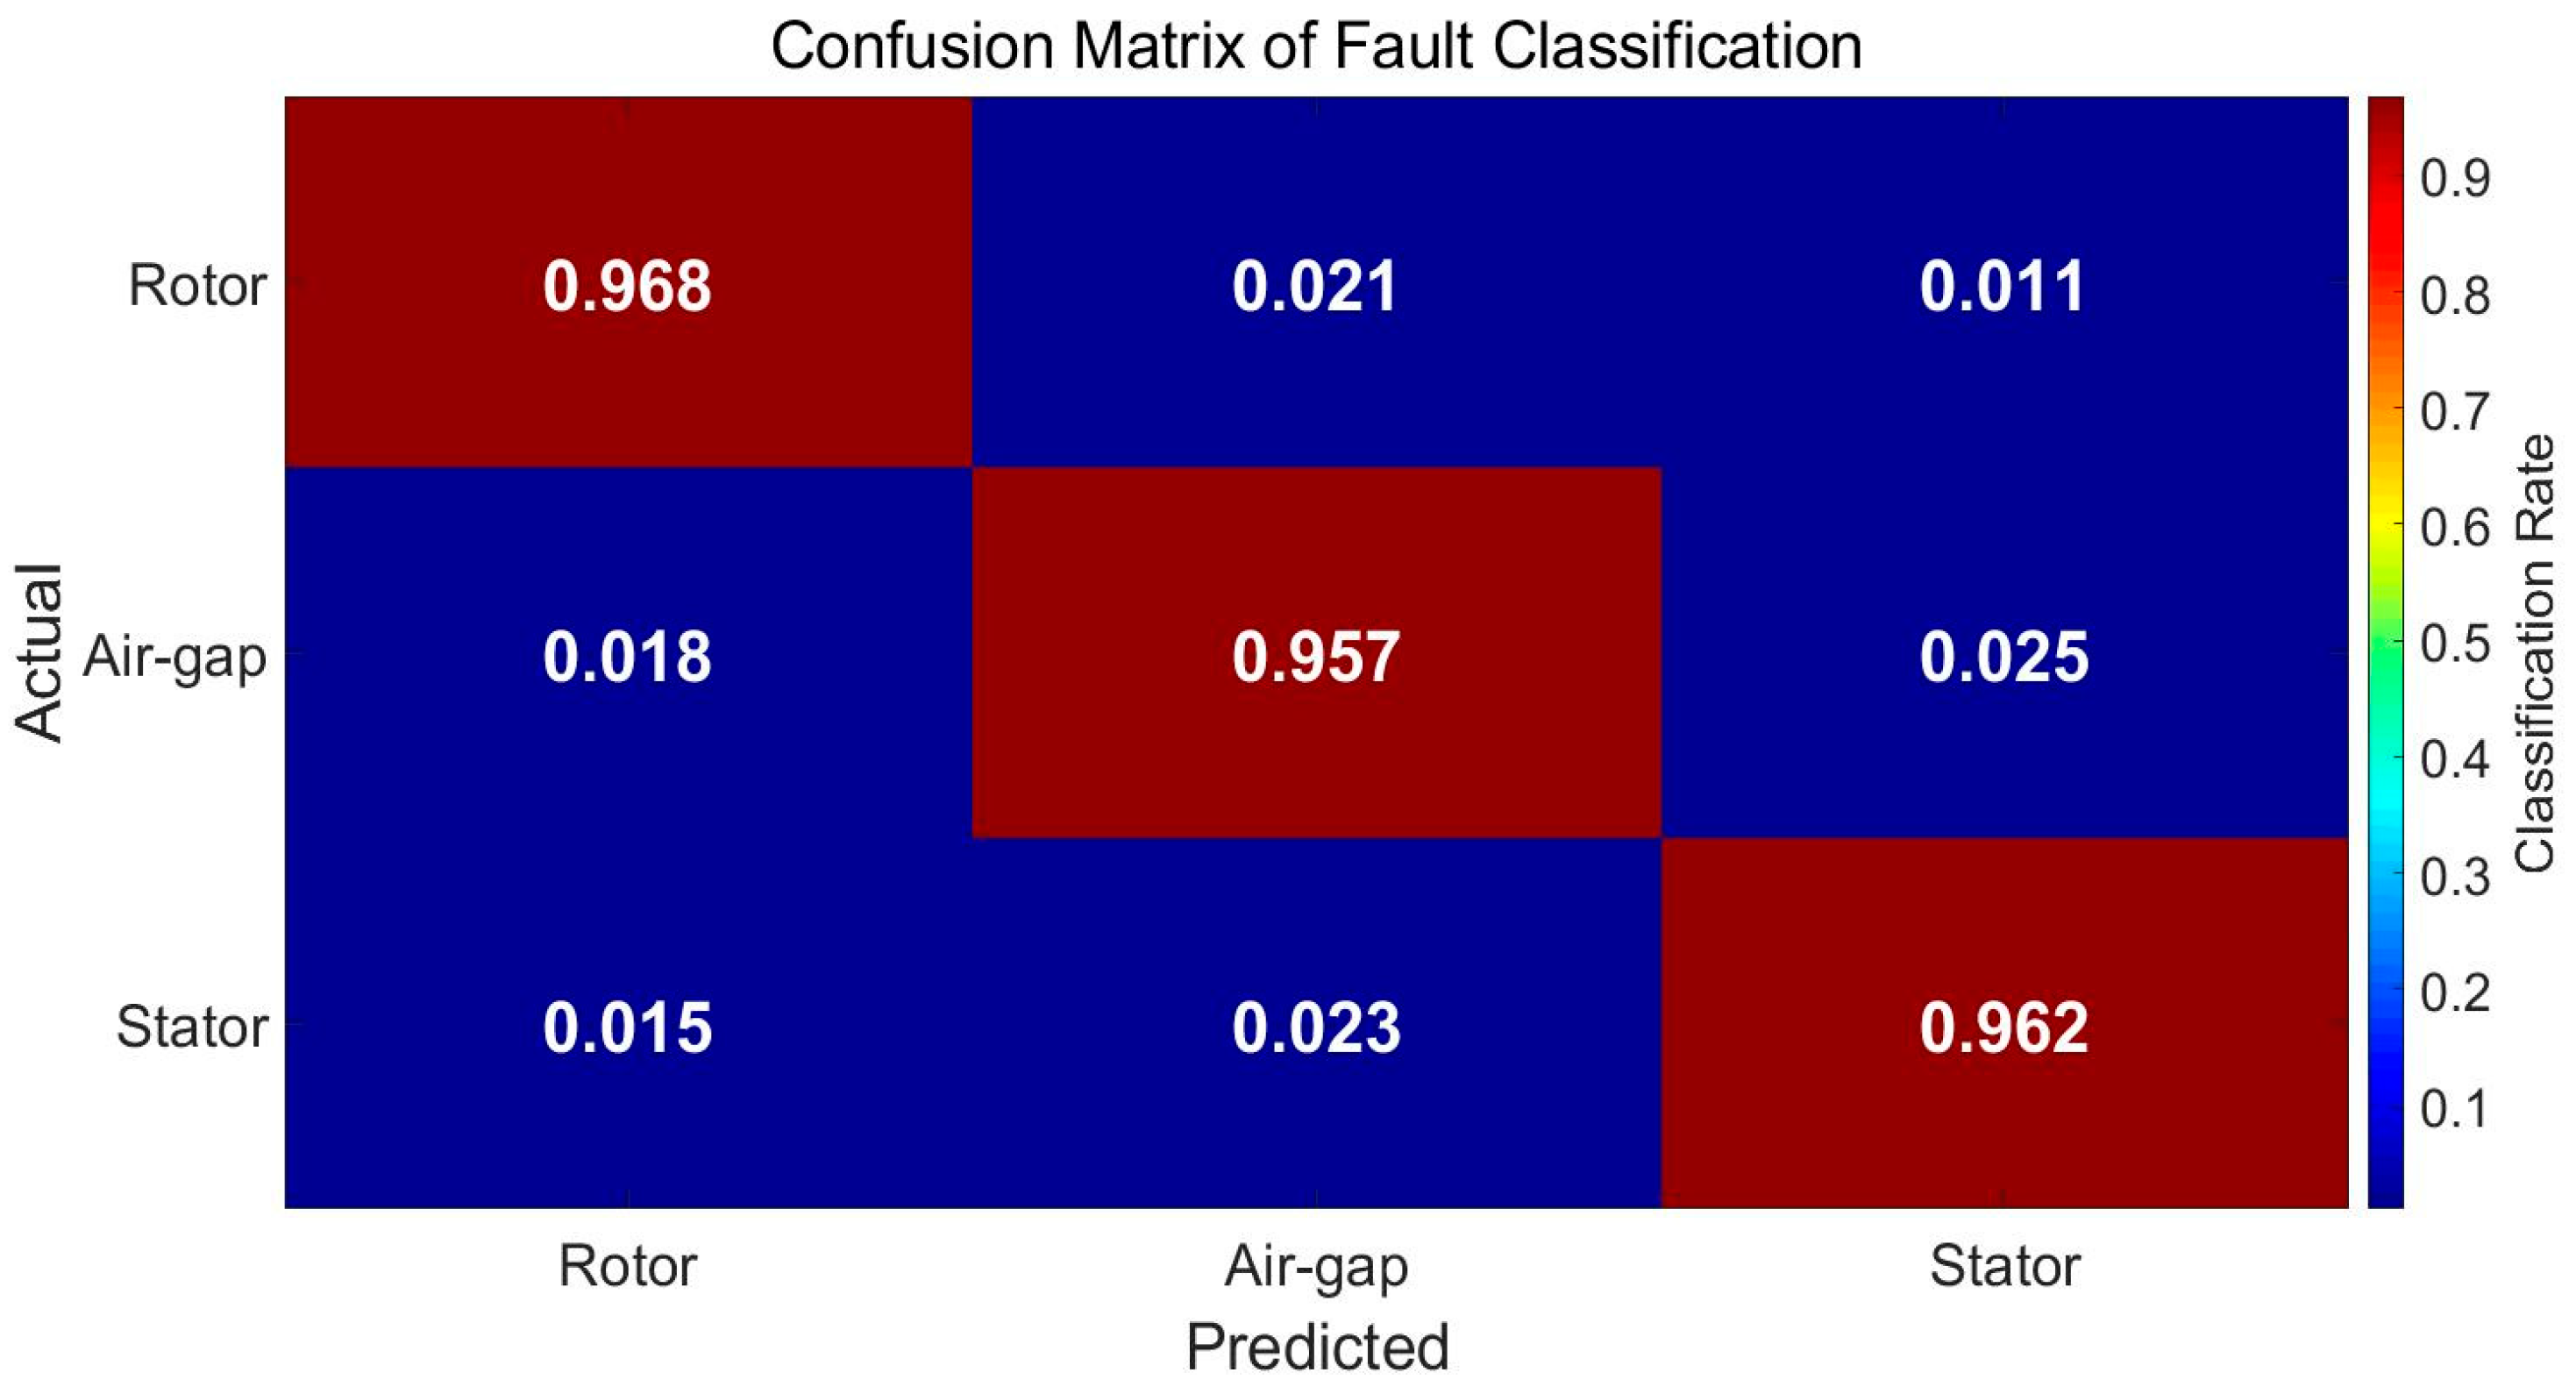
| Fault Type | Accuracy (%) | Precision (%) | F1-Score (%) | Detection Time (ms) |
|---|---|---|---|---|
| Rotor Winding | 96.8 ± 0.5 | 95.9 ± 0.6 | 96.2 ± 0.4 | 42 ± 5 |
| Air-Gap Eccentricity | 95.7 ± 0.7 | 94.8 ± 0.8 | 95.1 ± 0.6 | 45 ± 6 |
| Stator Winding | 96.2 ± 0.6 | 95.4 ± 0.7 | 95.8 ± 0.5 | 43 ± 4 |
| Normal | 97.5 ± 0.4 | 96.9 ± 0.5 | 97.1 ± 0.4 | 40 ± 3 |
| Signal Region | Sample Range | Amplitude Range | Best Performance |
|---|---|---|---|
| Normal Operation | 0–100 | 465–475 | MHA-GRU (±0.5 deviation) |
| Fault Development | 100–150 | 455–465 | MHA-GRU (fastest response) |
| Critical Region | 150–200 | 460–472 | MHA-GRU (minimum error) |
| Post-Recovery | 200–300 | 462–476 | MHA-GRU (best stability) |
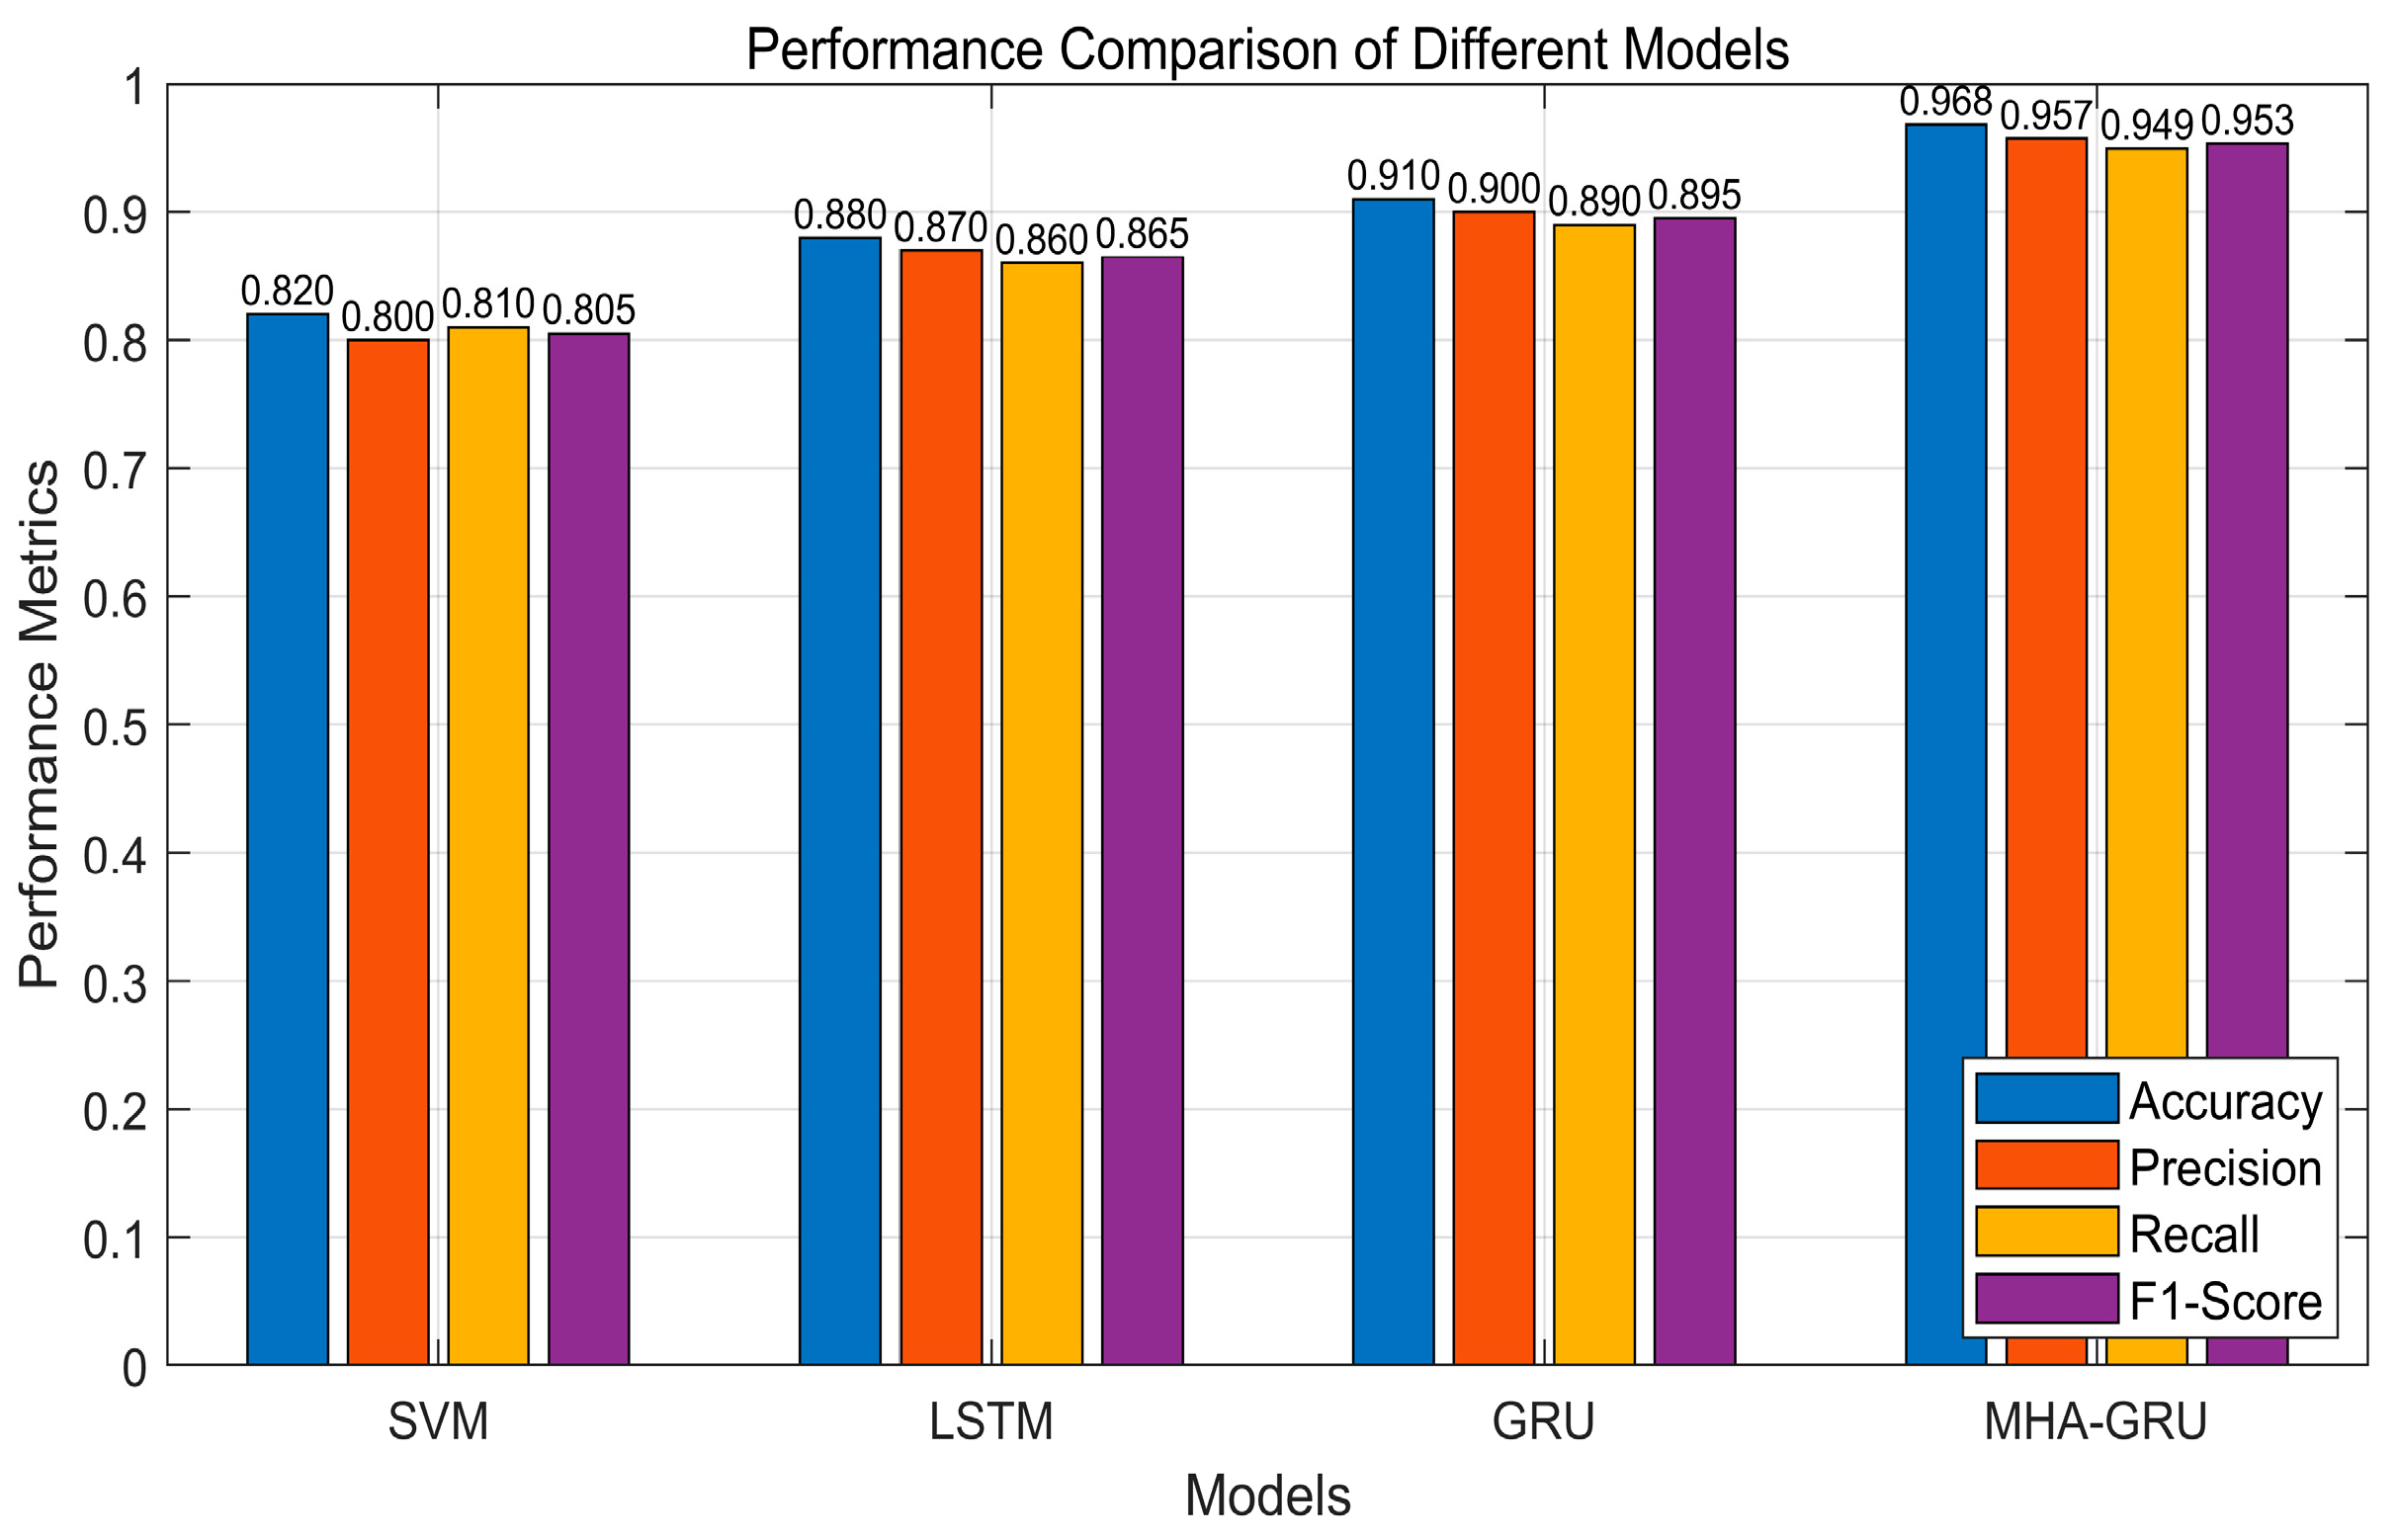
| Method | Accuracy (%) | Precision (%) | Recall (%) | F1-Score (%) | Parameters (M) |
|---|---|---|---|---|---|
| Traditional DNN | 91.2 | 90.8 | 91.0 | 90.9 | 0.048 |
| RNN | 93.5 | 93.1 | 93.3 | 93.2 | 0.041 |
| LSTM | 94.1 | 93.8 | 94.0 | 93.9 | 0.052 |
| Attention-RNN | 95.8 | 95.5 | 95.6 | 95.5 | 0.047 |
| MHA-GRU | 98.7 | 98.5 | 98.6 | 98.5 | 0.044 |
Disclaimer/Publisher’s Note: The statements, opinions and data contained in all publications are solely those of the individual author(s) and contributor(s) and not of MDPI and/or the editor(s). MDPI and/or the editor(s) disclaim responsibility for any injury to people or property resulting from any ideas, methods, instructions or products referred to in the content. |
© 2025 by the authors. Licensee MDPI, Basel, Switzerland. This article is an open access article distributed under the terms and conditions of the Creative Commons Attribution (CC BY) license (https://creativecommons.org/licenses/by/4.0/).
Share and Cite
Zhang, D.; Li, S.; Hong, T.; Zhang, C.; Zhao, W. Enhanced Fault Prediction for Synchronous Condensers Using LLM-Optimized Wavelet Packet Transformation. Electronics 2025, 14, 308. https://doi.org/10.3390/electronics14020308
Zhang D, Li S, Hong T, Zhang C, Zhao W. Enhanced Fault Prediction for Synchronous Condensers Using LLM-Optimized Wavelet Packet Transformation. Electronics. 2025; 14(2):308. https://doi.org/10.3390/electronics14020308
Chicago/Turabian StyleZhang, Dongqing, Shenglong Li, Tao Hong, Chaofeng Zhang, and Wenqiang Zhao. 2025. "Enhanced Fault Prediction for Synchronous Condensers Using LLM-Optimized Wavelet Packet Transformation" Electronics 14, no. 2: 308. https://doi.org/10.3390/electronics14020308
APA StyleZhang, D., Li, S., Hong, T., Zhang, C., & Zhao, W. (2025). Enhanced Fault Prediction for Synchronous Condensers Using LLM-Optimized Wavelet Packet Transformation. Electronics, 14(2), 308. https://doi.org/10.3390/electronics14020308