Article

Characterization of Students’ Thinking States Active Based on Improved Bloom Classification Algorithm and Cognitive Diagnostic Model

1
School of Information and Communication, Guilin University of Electronic Technology, Guilin 541004, China
2
Guangxi Wireless Broadband Communication and Signal Processing Key Laboratory, Guilin University of Electronic Technology, Guilin 541004, China
3
Guangxi Jet Toll Technology Co., Ltd., Nanning 530022, China
*
Author to whom correspondence should be addressed.
Electronics 2025, 14(19), 3957; https://doi.org/10.3390/electronics14193957
Submission received: 12 August 2025 / Revised: 6 October 2025 / Accepted: 6 October 2025 / Published: 8 October 2025

Abstract

A student’s active thinking state directly affects their learning experience in the classroom. To help teachers understand students’ active thinking states in real-time, this study aims to construct a model which characterizes their active thinking states. The main research objectives are as follows: (1) to achieve accurate classification of the cognitive levels of in-class exercises; (2) to effectively quantify the active thinking state of students through analyzing the correlation between student cognitive levels and exercise cognitive levels. The research methods used in this study to achieve these objectives are as follows: First, LSTM and Chinese-RoBERTa-wwm models are integrated to extract sequential and semantic information from plain text while TBCC is used to extract the semantic features of code text, allowing for comprehensive determination of the cognitive level of exercises. Second, a cognitive diagnosis model—namely, the QRCDM—is adopted to evaluate students’ real-time cognitive levels with respect to knowledge points. Finally, the cognitive levels of exercises and students are input into a self-attention mechanism network, their correlation is analyzed, and the thinking activity state is generated as a state representation. The proposed text classification model outperforms baseline models regarding ACC, micro-F1, and macro-F1 scores on two sets of exercise datasets in Chinese containing mixed code texts, with the highest ACC, micro-F1, and macro-F1 values reaching 0.7004, 0.6941, and 0.6912, respectively. This proves the proposed model’s effectiveness in classifying the cognitive level of exercises. The accuracy of the thinking activity state characterization model reaches 61.54%. In particular, this is higher than the random baseline, thus verifying the model’s feasibility.

1. Introduction

The active thinking state is a key indicator for evaluating the quality of classroom teaching, reflecting the quality and level of students’ thinking activities during the learning process. To effectively assess this state, existing studies often infer students’ thinking levels indirectly through their performance in answering questions [1]. However, a standard that helps teachers to assess students’ thinking activity levels is needed [2]. Therefore, a group of educational psychologists proposed “Bloom’s Taxonomy” [3], and Krathwohl et al. extended the cognitive domain in this taxonomy to enable the classification of cognitive (thinking) levels of exercises [4]. In recent years, many researchers have used machine learning and deep learning technologies to realize automatic classification of the cognitive levels of exercises [5,6]. The BloomNet model, constructed by Waheed et al. based on the Transformer architecture, has further improved the classification accuracy of cognitive levels [7].
However, the above methods only allow for analysis from the perspective of exercises, ignoring students’ mastery of knowledge points [8] and their actual interactions with exercises [9]. Therefore, it is necessary to combine students’ cognitive levels with those of exercises to effectively characterize their thinking activity. Starting from students’ performance in answering questions, researchers have proposed many classical cognitive diagnostic models. For example, NeuralCDM [10] integrates neural networks to learn complex student–exercise interaction behaviors, while RCD [11] enables the unified modeling of interactions and structural relationships through a multi-layer student–exercise–concept relationship map.
However, these two methods still have shortcomings regarding modeling the active thinking state: (1) They fail to enable a combined analysis of students’ cognitive level and the thinking level of exercises; instead, they mostly measure the cognitive level of exercises according to their average difficulty, ignoring the content and level of the exercises [12]. (2) They lack the ability to effectively process Chinese exercises which combine code and text (such as code filling-in-the-blank questions), with the sparse semantic meaning and complex structure of code posing challenges for classification of the cognitive levels of exercises.
Inspired by the aforementioned studies, this paper proposes a model that characterizes the active thinking state of students by integrating the cognitive levels of Chinese mixed code–text exercises and the cognitive states of students. The Quantitative Relationship Cognitive Diagnosis Model (QRCDM) [13] is used to characterize students’ cognitive levels with respect to exercises, while the Chinese-FRLT model is simultaneously employed to obtain the cognitive levels of the exercises. Finally, these two components are combined through an attention mechanism to achieve accurate characterization of the students’ active thinking state. The specific research objectives are outlined below:
  • The first objective is to improve the robustness of cognitive level classification for exercises, enabling it to cope with noise and semantic distortions present in complex Chinese text.
  • The second objective is to solve the cognitive classification challenge for hybrid code-and-text exercises, thereby achieving a unified semantic understanding of both programming code and Chinese language.
  • The third objective is to create a multi-fused representation model of active thinking states by correlating exercise cognitive hierarchy with student cognitive states, resulting in a concrete state representation.
To address these research objectives, this study mainly makes the following contributions:
  • A new text classification framework with dual capabilities—namely, robustness to noise and context awareness—is proposed. This framework integrates FreeLB, Chinese-RoBERTa-wwm, and LSTM architectures, which addresses the problems of global semantic distortion and local structural sparsity of text classification models in long-text contexts, significantly enhancing the model’s robustness with complex linguistic phenomena and its ability for deep semantic understanding.
  • A text classification model based on improved Chinese-RoBERTa-wwm and TBCC is proposed. This model can fully learn and understand the problems of semantic sparsity and complex sentence structure in the code text of code-filling exercises, improving classification accuracy with exercise datasets, including mixed code texts.
  • A characterization method for an active thinking state that integrates students’ cognitive states and the cognitive level of exercises is proposed. This method analyzes the correlation between the two dimensions—namely, students’ cognitive states and the cognitive level of exercises—and enables a concrete numerical evaluation of students’ active thinking levels during classroom learning.
The rest of this paper is organized as follows: Section 2 provides a brief overview of the related work. Section 3 provides a detailed introduction to the model for characterization the thinking active states. Section 4 showcases the experimental results and analyzes the reliability of the proposed algorithm. Section 5 provides a summary of the paper.

2. Related Work

In the Chinese sentiment analysis task, Cui et al. [14] improved the BERT model by proposing the whole-word masking (wwm) strategy, in which complete Chinese words are masked. This significantly improved the performance of BERT in Chinese multicategory sentiment classification, especially in the processing of fine-grained sentiment classification, when compared with the traditional word-level masking strategy. However, the BERT model only uses textual semantic information for text classification and does not fully utilize other feature information. Therefore, Xu [15] proposed a Chinese text categorization method that combines semantic and structural information, effectively fusing the Chinese-BERTology-wwm and GCN models through cross-entropy and hinge loss, which demonstrated good results on publicly available datasets of Chinese sentiment and news headline text. Regarding innovations in model infrastructure, Benjamin et al. [16] have recently explored a text classification framework based on ModernBERT. This framework, leveraging its deep sparse activation mechanism and more modern pre-training strategies, demonstrated exceptional generalization ability and robustness in long-text understanding and cross-domain transfer tasks. On the other hand, to optimize the efficiency and performance of the attention mechanism itself, Sun et al. [17] proposed a grouped-head latent attention model. By grouping attention heads and performing computations in a low-dimensional latent space, the model effectively reduces computational complexity and achieves a better balance between accuracy and speed on long-sequence text classification and machine translation datasets.
Through the abovementioned deep learning approach, Bloom cognitive hierarchical classification models have made significant progress in exercise classification tasks in the field of education. Gani [18] et al. compared and analyzed various Bloom cognitive hierarchy classification models and proposed to first use a RoBERTa model to extract the text word vectors of English in-class exercise texts, then combined a CNN model to classify the Bloom cognitive hierarchy of the exercises. This approach effectively improved classification accuracy, and the superior performance of the combined RoBERTa–CNN model in the cognitive classification task was verified. Baharuddin et al. [19] utilized the IndoBERT model to automatically classify the Bloom cognitive hierarchy of exercises from different courses in Indonesian elementary school in an automated manner. They verified that the pre-trained model had a stronger ability to adapt to multi-language exercises when compared with the machine learning model from the perspective of a non-English language, and it achieved an accuracy of more than 93% on three datasets.
In addition, to address the scarcity of automatic exercise classification systems for the Kazakhstani language, Mukanova et al. [20] trained a BERT model on a corpus of 50,000 Kazakhstani exercises and achieved an F1 score of 94%, proving that the BERT model can understand the nuances of different languages more effectively compared with other models. This shows that pre-trained models are suitable for classifying the text of exercises in different languages, as they can effectively extract textual semantic information and realize the accurate classification of Bloom’s cognitive hierarchy.
Cognitive diagnosis (CD) allows for the determination of students’ mastery of knowledge points by assessing their responses to exercises [21]. IRT [22] diagnoses students’ cognitive abilities based on their proficiency in specific knowledge points and the difficulty of exercises, but it neglects their proficiency in different knowledge points. The method based on DINA [23] addresses this issue through the consideration of factors such as carelessness and guessing when students answer questions; however, it only categorizes cognitive states into two values (i.e., 0 or 1), which reduces the model’s accuracy. Compared with IRT and DINA, neural network-based methods can learn more features characterizing students, knowledge points, and exercises, resulting in cognitive diagnosis models which perform better [24]. Chris et al. proposed the DKT model based on the recurrent neural network (RNN) architecture, which enables cognitive diagnosis of students and, for the first time, demonstrated the effectiveness and potential of deep learning in knowledge tracing tasks [25]. Zhang et al. attempted to apply dynamic key-value memory networks (DKVMNs) to cognitive tracing, integrating knowledge relationships to achieve more accurate knowledge state predictions than the DKT model; however, this model overlooks the explicit and implicit relationships between exercises and knowledge points [26]. To solve the above issues, Yang et al. [13] proposed a cognitive model based on quantitative relationships (QRCDM), which predicts students’ mastery of knowledge points by extracting both the explicit correlations between exercises and knowledge points and the implicit associations between exercises and unrelated knowledge points.
There is currently a lack of advanced Chinese Bloom classification models to address the issue of sparse Chinese exercises; furthermore, the complex structure and sparse semantics of code texts within exercises are often overlooked. This makes it difficult to construct an active thinking state representation model which is applicable to multiple course domains. Additionally, existing active thinking state representation models ignore the correlation between the cognitive levels of exercises and students’ cognitive states. They fail to consider that the cognitive level of an exercise determines the highest level of thinking a student can achieve upon completing it, consequently failing to effectively represent students’ active thinking states. Therefore, this study integrated Transformer-based networks with a tree structures for code classification (TBCC) [27] model and the Chinese-FRL framework to determine the cognitive levels of Chinese exercises. An attention mechanism model is incorporated to combine the cognitive levels of exercises with students’ mastery of exercises, and thus achieved an accurate representation of students’ active thinking states.

3. Method

This chapter aims to introduce a comprehensive model capable of accurately characterizing students’ active thinking states. The model primarily addresses three core research objectives: ① enhancing the robustness of cognitive level classification for complex Chinese exercise texts; ② achieving cognitive level classification for exercise texts containing hybrid code; ③ developing a characterization method for active thinking states that integrates the cognitive level of exercises with students’ cognitive abilities.
First, we proposed the Chinese-FRL model, which integrates global attention with local sequential features from both preceding and subsequent contexts to achieve dual contextual awareness of texts. This model excavates deep-level semantic information in Chinese text, effectively enhancing the robustness of cognitive level classification for complex Chinese exercises. Subsequently, to address the challenge of text classification models struggling with structurally unique and semantically sparse code-mixed texts, the Chinese-FRLT framework was constructed by combining Chinese-FRL with code parsing classification models, enabling effective classification of exercise texts containing mixed code. Finally, to achieve the goal of effectively characterizing students’ active thinking states, the model uses the Chinese-FRLT output for the exercise cognitive level matrix Y and the QRCEM output for the student cognitive degree matrix E. These are then processed through a self-attention network to determine the student’s active thinking state as “Sensitive”, “Excited”, “Active”, “Sluggish”, and “Dull”.
The overall model is illustrated in Figure 1. The construction methods and technical implementations of each module will be described in detail in the following sections.

3.1. Chinese-FRLT

Since in-class exercises often contain mixed code elements, the key to accurately determining their level in Bloom’s taxonomy lies in achieving cognitive level classification for these code-mixed exercise texts. To address this objective, the overall framework of the text classification model based on the improved Chinese-RoBERTa-wwm and TBCC models, called Chinese-FRLT, is shown in Figure 2.
The steps of the proposed algorithm are as follows: First, separating code texts from Chinese texts is the fundamental step for classifying code-mixed texts. Thus, the text recognition module is used to distinguish between Chinese exercise text and program code text in the Chinese exercise dataset. The exercise text and code text are purified using a keyword-based text classifier, text cleaning, and logic discriminators. Then, in order to capture the global attention results within Chinese exercise texts, the purified exercise text is preprocessed to obtain the embedding E B , which is input into the Chinese-RoBERTa-wwm model to obtain sequence information T and semantic information C. Next, to capture the preceding and subsequent local features in the Chinese exercise text, an LSTM model is employed to extract the deep-level local correlations from the sequence information T, which is combined with the semantic information C. The Softmax function is then used to output the Bloom cognitive hierarchical classification results for the exercise text, thereby improving performance on complex Chinese exercise text classification. Simultaneously, the purified code text is parsed through an Abstract Syntax Tree (AST) to obtain the embedding E T , which is then sequentially input into the Transformer model and a pooling layer to learn and extract the semantic information of the code text. The Softmax function is also used to output the Bloom cognitive hierarchical classification results for the code text, thereby achieving accurate cognitive level classification for code text. Finally, the gradient parameters of the Chinese-RL-wwm model are returned to the FreeLB module to compute the perturbation value δ t , which is added to the embedding E B in the training process to enhance the model’s generalization ability.

3.1.1. Text Recognition Module

Accurate distinction between code and Chinese text is a prerequisite for the Chinese-FRLT model, which in turn enables the cognitive-level classification of mixed-format text data. If the input exercise text does not conform to the coding logic of the program or contains Chinese text, the TBCC model will be unable to complete subsequent classification tasks. Therefore, a text recognition module was added to the Chinese-FRLT model to ensure that the exercise text input into the TBCC model is pure code text.
The text recognition module is primarily composed of a keyword-based text classifier, as code text contains specific identifiers that are sparse or even absent in Chinese text. Compared with deep learning networks, keyword-based text classifiers have the following advantages: they do not require large amounts of training data and computing resources, thus avoiding tedious parameter tuning optimization, and can rapidly and efficiently complete text recognition tasks.
Assume that a segment of exercise text is denoted as T = { t 1 , t 2 , , t n } and the set of keywords in the code text is denoted as K = { k 1 , k 2 , , k n } , where t i represents the i-th tokenized word in the exercise text and k i represents the i-th keyword or identifier character, such as ‘if’ in program code. Based on the keyword set K, the computational formula of the text recognition module is as follows:
f ( T ) = c i , t i k i d i , t i k i
where c i represents the i-th code text in the code text set C, and d i represents the i-th Chinese text in the Chinese text set D.
In addition, to refine the code text and improve the accuracy of the text recognition module, the module also includes a re-evaluation and text cleaning process. The overall process of the text recognition module is illustrated in Figure 2. The re-evaluation step involves secondary parsing and evaluation of the already classified code text, while text cleaning involves removing all irrelevant text from the classified text. Some exercises may contain both Chinese text and code text, leading to misidentification of code text. Such text may not necessarily contain complete program code, but the Chinese text content of the exercise contains all the necessary information. Therefore, for this kind of exercise, if it is recognized and classified as plain text in the process of re-judgment, then text cleaning is carried out to remove all the code text and only retain the Chinese text; if it is recognized and classified as code text in the re-judgment step, then text cleaning will be carried out to remove all the Chinese text and only retain the code text. The re-judgment method involves determining whether the code can be parsed as AST: if it can be parsed, it will be finally classified as code text; if not, the Chinese text will be retained and the code text will be removed.

3.1.2. Text Classification Framework Based on Chinese-RoBERTa-wwm and LSTM

Inspired by the literature [6], this section builds upon global attention information by employing LSTM to secondarily extract fine-grained dependencies between word vectors and capture deeper semantic features. We propose a textual word vector representation framework based on Chinese-RoBERTa-wwm and LSTM (henceforth referred to as Chinese-RL-wwm), thereby achieving the goal of enhancing the robustness of complex Chinese text classification. The framework passes and splices the semantic feature information in the form of vectors to the two models by means of dimensional changes, and the process of feature information extraction is shown in Figure 3. Chinese-RoBERTa-wwm is utilized to capture both the sequential and semantic information of Chinese text, while the LSTM is employed to extract deep associative features from sequential information. These features are then concatenated with the semantic information to form the semantic features of the input text.
During the acquisition of the global attention information, Figure 3a shows that special token markers [CLS] and [SEP] are used to mark the beginning and end of sentences, respectively. Then, the WordPiece tokenizer is used to tokenize the sentences to construct three sets of embedding vectors; namely, E T o k e n = { E [ C L S ] , } , E S e g m e n t = { E A , } , and E P o s i t i o n = { E 0 , } . These three sets are concatenated to form the input for Chinese-RoBERTa-wwm, denoted E B E R T .
The Chinese-RoBERTa-wwm model is composed of a stack of 12 layers of bidirectional Transformers, forming a Seq2Seq model based on a self-attention mechanism network architecture [28]. Initially, E B E R T is used as the input for Q, K, and V in the attention mechanism; then, based on the residual connection method, E B E R T is connected with A T T O U T through residual connection as shown in Equation (2):
A T T O U T = A t t e n t i o n ( E B E R T , E B E R T , E B E R T , m a s k ) o u t p u t 1 = L a y e r N o r m ( A T T O U T + E B E R T )
Then, o u t p u t 1 is input into the Point-wise Feed-Forward Neural Network layer, followed by another Layer Normalization layer to connect o u t p u t 1 with the residual of the output of the Point-wise Feed-Forward Neural Network layer, resulting in the output of the encoder layer, denoted output, as shown in Equation (3):
o u t p u t = L a y e r N o r m [ o u t p u t 1 + F e e d F o r w a r d ( o u t p u t 1 ) ]
Finally, the output is fed into the next layer of the encoder network. After passing through the 12 stacked layers of the encoder network, the final semantic information C H and sequential information T i H are obtained as outputs.
Subsequently, to mine deeper semantic features for more robust classification of complex Chinese text, the model leverages an LSTM to extract local contextual dependencies between word vectors from the Chinese-RoBERTa output sequence T i H . Through the use of three gate control units—namely, the forget gate f t , the input gate i t , and the output gate o t —selective forgetting of the previous timestep sequence information, selective updating of the current timestep sequence information, and the selection of specific sequence information as the output of the current timestep are achieved. The gate formulas are given in Equation (4):
f t = S i g m o i d ( W f · [ h t 1 , T i ] + b f ) i t = S i g m o i d ( W i · [ h t 1 , T i ] + b i ) o t = S i g m o i d ( W o · [ h t 1 , T i ] + b o )
where ( W f , b f ), ( W i , b i ), and ( W o , b o ) represent the weight and bias matrices of the forget gate, input gate, and output gate, respectively, while h t 1 denotes the state vector from the previous timestep.
After passing through the three gates, the calculation methods for the new candidate value vector C ˜ t and the state vector h t are as shown in Equation (5):
C ˜ t = t a n h ( W C · [ h t 1 , T i ] + b C ) C t = f t × C t 1 + i t C ˜ t h t = o t × t a n h ( C t )
where W C and b C represent the weight and bias matrices of the candidate value layer, respectively.
At this stage, the h t -vector contains the local contextual features from the text sequence. This representation, when integrated with the semantic information C, attains a dual-awareness capability for both the local and global context. The resulting feature is then input into a Softmax layer to obtain the final classification result, P, as shown in Equation (6):
P = S o f t m a x [ W ( h t C ) + b ]
where W represents the weight parameters of the fully connected layer, while b represents the bias parameters.

3.1.3. TBCC Model

The selection of an appropriate code classification model is key to accomplishing the goal of cognitive level classification for hybrid exercise texts. Traditional text representation models struggle to effectively understand the structured semantics of code. To address this issue, this study introduces the TBCC (Tree-Based Code Classification) model, whose core lies in using Abstract Syntax Trees (ASTs) to represent the logical structure of code. The TBCC Model section of Figure 2 illustrates the overall algorithmic framework of TBCC. First, the input code snippets are parsed into standard Abstract Syntax Trees (ASTs) using an AST parser. Each standard AST is then divided into a set of small subtrees using a pre-order traversal algorithm. Second, all subtree sequences are transformed into word vectors through an embedding layer. Then, a Transformer is used to encode the subtree sequences, and a pooling layer is employed to sample them into a single vector. Finally, Softmax is utilized for label prediction.

3.1.4. FreeLB Adversarial Training

In real-world scenarios, irrelevant information contained in text data can easily affect the robustness and generalization of classification models. To address this issue, FreeLB (Free Large-Batch) Adversarial Training is utilized, which involves adding perturbations to the embedding layer of the classification model to enhance its classification accuracy and generalization ability [29]. Before training, perturbations δ 0 and gradients g 0 are initialized based on the confirmed perturbation range [−ε, ε]. During the model training process, the accumulated gradient parameters θ L for each perturbation are first computed. Then, the perturbations δ t are updated through gradient ascent, followed by adding them to the gradient parameters g i obtained in each training iteration. Finally, the average of the g i obtained after K iterations is calculated to obtain the gradient parameter g K , which is used to update the model parameters, θ , as shown in Equation (7):
θ = θ τ g K
where θ represents the trainable parameter in adversarial training.

3.2. Cognitive Level Diagnosis Model (QRCDM)

Providing precise and interpretable inputs to accurately represent students’ active thinking states is a crucial prerequisite. Consequently, we incorporated the Quantitative Relationship Cognitive Diagnosis Model (QRCDM). The Model quantitatively represents implicit relationships as numbers between 0 and 1, allowing for description of these implicit relationships according to the contribution matrices of exercises and knowledge points. First, the following assumptions are proposed based on the interactions between students and exercises: there exist explicit relationships between exercises and the associated knowledge points, and there exist implicit relationships between exercises and unmarked knowledge points. Based on these assumptions, the contribution matrices of exercises and knowledge points are obtained separately through neural networks. Finally, the proficiency of students in knowledge points and the scores of students’ exercise answers are predicted based on the contribution matrices and the suspicion probability of students, ensuring the interpretability of the model.

3.3. Self-Attention-Based Prediction of Student Interest Features

Since a problem’s cognitive level dictates the maximum potential for a student’s mental engagement, their performance (as an indicator of cognitive level) is inherently constrained by this level. Therefore, establishing the student’s position within this cognitive hierarchy is important for characterizing their dynamic state of thinking. In-class exercises in courses such as “C Language Fundamentals” consist of one or more different knowledge points, which are rigorously discussed and analyzed by multiple instructors in the course. For example, the exercise “Describe the structural composition of C code” reflects the knowledge point “The structure of C language”. To determine the cognitive ability of students, the input data of the cognitive diagnostic model are the scores for each knowledge point in the exercises. However, when the analysis of thinking state is conducted from the perspective of in-class exercise scores, as the difficulty of each knowledge point differs between the exercises, it is not possible to use the average method to obtain the students’ results. Therefore, it is necessary to assign full grades according to the difficulty of knowledge points and use the weighted summation method to accurately obtain students’ exercise grades. This value serves as an indicator of the student’s cognitive level for the given exercise. A box plot is used to classify the difficulty of knowledge points in this study.
The box plot consists of five main elements: maximum, minimum, upper quartile ( Q 3 ), lower quartile ( Q 1 ), and median ( Q 2 ). Among them, Q 2 is the second quartile of all the values in the data arranged from smallest to largest, Q 1 is the fourth quartile after ordering of the data, Q 3 is the third quartile after ordering of the data, the upper limit is the maximum value within the non-anomalous range (Equation (8)), the lower limit is the minimum value within the non-anomalous range (Equation (9)), and the outliers consist of the data that are located outside the lower and upper limits.
Maximum = Q 3 + 1.5 × ( Q 3 Q 1 )
Minimum = Q 1 1.5 × ( Q 3 Q 1 )
To achieve the research objective of characterizing students’ thinking active states, it is necessary to employ a suitable model to integrate the exercise’s cognitive level with the student’s cognitive level. All knowledge points in the Classroomdata dataset are used as elements in the box plot, the averages of the knowledge point grades are used as the element values, and the values of the five elements that make up the box plot were calculated from the element values. The box plot drawn based on the calculation results is shown in Figure 4; there were two outliers, the corresponding element values of which were replaced with the average of all element values. Based on the five elements of the box plot, four intervals were obtained: [maximum, Q 3 ), [ Q 3 , Q 2 ), [ Q 2 , Q 1 ), and [ Q 1 , minimum). The corresponding difficulty measures of knowledge points were defined as 1, 2, 3, and 4, respectively.
The weight of each knowledge point in the exercises was then classified, based on the difficulty of the knowledge points; then, based on these weights, the weighted summation method was used to calculate the students’ exercise grades. After obtaining the students‘ performances in the exercises, as shown in Figure 3, the resulting values were formatted into a one-dimensional matrix X, which was combined with the QRCDM to obtain the students‘ cognitive level matrix E and the Bloom cognitive hierarchical classification model to obtain the cognitive hierarchy matrix Y of the exercises. The correlations between these three matrices were analyzed using the self-attention mechanism network, thus obtaining the students’ thinking activity T when answering the exercises, how much students learnt from the exercises, which is their thinking activity in the classroom learning moment. The formula for the self-attention mechanism network is shown in Equation (10):
T = A t t e n t i o n ( X , E , Y ) = s o f t m a x ( X E T d k ) Y
The process culminates in normalizing the student’s mental engagement to a [0, 1] value, thereby determining their thinking active state and fulfilling the methodology for constructing the target model.

3.4. Experimental Setup

Experiments were conducted on four in-class exercise datasets with hybrid code and Chinese text to validate the superiority and efficacy of the proposed Chinese-FRL and Chinese-FRLT frameworks in addressing Objectives 1 and 2. Baseline models like BERT and ModernBERT were evaluated using Micro-F1, Macro-F1, and Accuracy. For Objective 3, the model’s effectiveness was verified by performing a correlation analysis where final exam scores served as an external criterion for the active thinking state.

3.4.1. Datasets

  • Introduction to the dataset used to validate the Chinese-FRLT model.
To ensure that the Chinese-FRLT model is reliable and stable in the exercise Bloom cognitive classification task, it was necessary to verify the model using public and in-class exercise datasets. Therefore, experiments were conducted using the public dataset Toutiao-S and the in-class exercise datasets Bloom-5classes and Bloom-6classes. Detailed introductions to these three datasets are provided below.
The Toutiao-S dataset is a subset of the Chinese news headline classification corpus from Toutiao, containing 5 categories and 17,500 news headlines. Among them, 15,000 headlines were used for training, while 2500 headlines were used for testing. Additionally, based on the original Sina News classification system, the THUCNews dataset was reorganized to include 10 categories and 55,315 news headlines. Among them, 45,315 headlines were used for training, while 10,000 headlines were used for testing.
The Bloom-5classes dataset was selected from the final exams and textbook exercises of a “C Language Programming” course. After discussions with the course instructor, it was determined that the “analysis” of Bloom cognitive levels is suitable for programming questions, but not compatible with descriptive questions such as multiple-choice, fill-in-the-blank, and programming questions. However, Chinese-RoBERTa-wwm cannot effectively process programming questions. Therefore, this dataset consisted of only five Bloom cognitive levels: Remembering, Understanding, Applying, Evaluating, and Creating. It comprises 1011 exercise questions, with 807 used for training and 204 used for testing.
The Bloom-6classes dataset, based on the Bloom-5classes dataset, incorporates exam papers, textbook exercises, and MOOC question banks from the “Introduction to Computer Science” course [30]. It also includes subjective questions related to Bloom cognition and exercises from the textbook “Computer Science: An Interdisciplinary Approach” published by Princeton University [31]. This dataset covers six levels of Bloom cognitive levels and consists of 2824 exercise questions, with 2122 used for training and 702 used for testing.
To validate the Chinese-FRLT model in classifying mixed exercise texts, 2704 code texts were added to two sets of publicly available Chinese news headline datasets; namely, Toutiao-S and THUCNews. These code texts consisted of three categories, with 1894 in the training set and 810 in the testing set, labeled as Toutiao-S(2) and THUCNews(2), respectively. Additionally, 500 code texts were added to the two sets of Chinese Bloom exercise datasets; namely, Bloom-5classes and Bloom-6classes. These code texts included three categories, with 400 in the training set and 100 in the testing set; these were labeled Bloom-5classes(2) and Bloom-6classes(2), respectively.
2.
Introduction to the experimental dataset for characterization of the active state.
To validate the cognitive activity state representation model proposed in this paper, the Classroomdata dataset was constructed based on the exercise-answering behaviors of students in an offline smart classroom. It consists of historical behavioral data from students who participated in the “C Language Programming” course in 2022, including 58 students, 11,310 interactions between knowledge points, and 45 knowledge points. We assigned randomized IDs to all students to anonymize data allocation, ensuring no personal data was involved or collected. Additionally, based on the exercises attempted by these students, a Test dataset comprising 43 questions was created.

3.4.2. Evaluation Indicators and Baseline Model

For assessing the methodologies used to achieve Research Objectives 1 and 2, as there is no deep learning text classification model specifically for classifying Chinese course exercise datasets to effectively evaluate the performance of the Chinese-FRLT model, we selected the multi-head attention variant Grouped-head Latent Attention, the classic large-scale Chinese pre-trained model Chinese-RoBERTa-wwm, and improved pre-trained models including Chinese-BERT-wwm-GCN-LP, Chinese-RoBERTa-wwm-GCN-LP, and ModernBERT as baseline models. Using ACC, micro-F1, and macro-F1 scores as evaluation metrics, comparisons between the baseline models (as detailed in Table 1) and the Chinese-FRLT model were conducted on the four datasets.
For assessing the methodology used to achieve Research Objectives 3, as there is no existing benchmark for this pioneering approach to modeling active thinking states, the model’s output is evaluated by comparing its similarity with final exam scores, which are used as an indirect reflection of thinking engagement. This similarity comparison constitutes the evaluation criterion for Research Objective 3.

4. Experimental Results and Performance Analysis

4.1. Experimental Environment and Hyperparameter Settings

The experimental environment of this study is detailed in Table 2.
The learning rate for the Chinese-RoBERTa-wwm module was set to 8 × 10 5 , while that for the LSTM module was 8 × 10 4 . The weight decay coefficients for both modules were set to 1 × 10 5 , while the learning rate of FreeLB was set to 4.5 × 10 2 with a delta of 5 × 10 2 . The hidden layer embedding dimension for the Chinese-RoBERTa-wwm module was set to 768, while that for the LSTM was 512, according to the original standards. The dropout regularization parameters were set to 0, as per the requirements of FreeLB. The number of iterations for stochastic gradient descent was set to 50, and an Adam optimizer was used for gradient descent optimization. The TBCC module employed eight attention heads, with the learning rate set to 4.5 × 10 2 and an Adam optimizer used for gradient descent optimization.
To conserve computational resources and enable lightweight deployment in real-world scenarios, the number of hidden layers in the RoBERTa base of the Chinese-RoBERTa-wwm module was reduced from 12 to 6 for the experiments on the Bloom-5classes and Bloom-6classes datasets.

4.2. Analysis of Experimental Results of Chinese-FRLT Model in Four Chinese Datasets

4.2.1. Introduction to Dataset for Validating the Models Characterizing the Active Thinking State

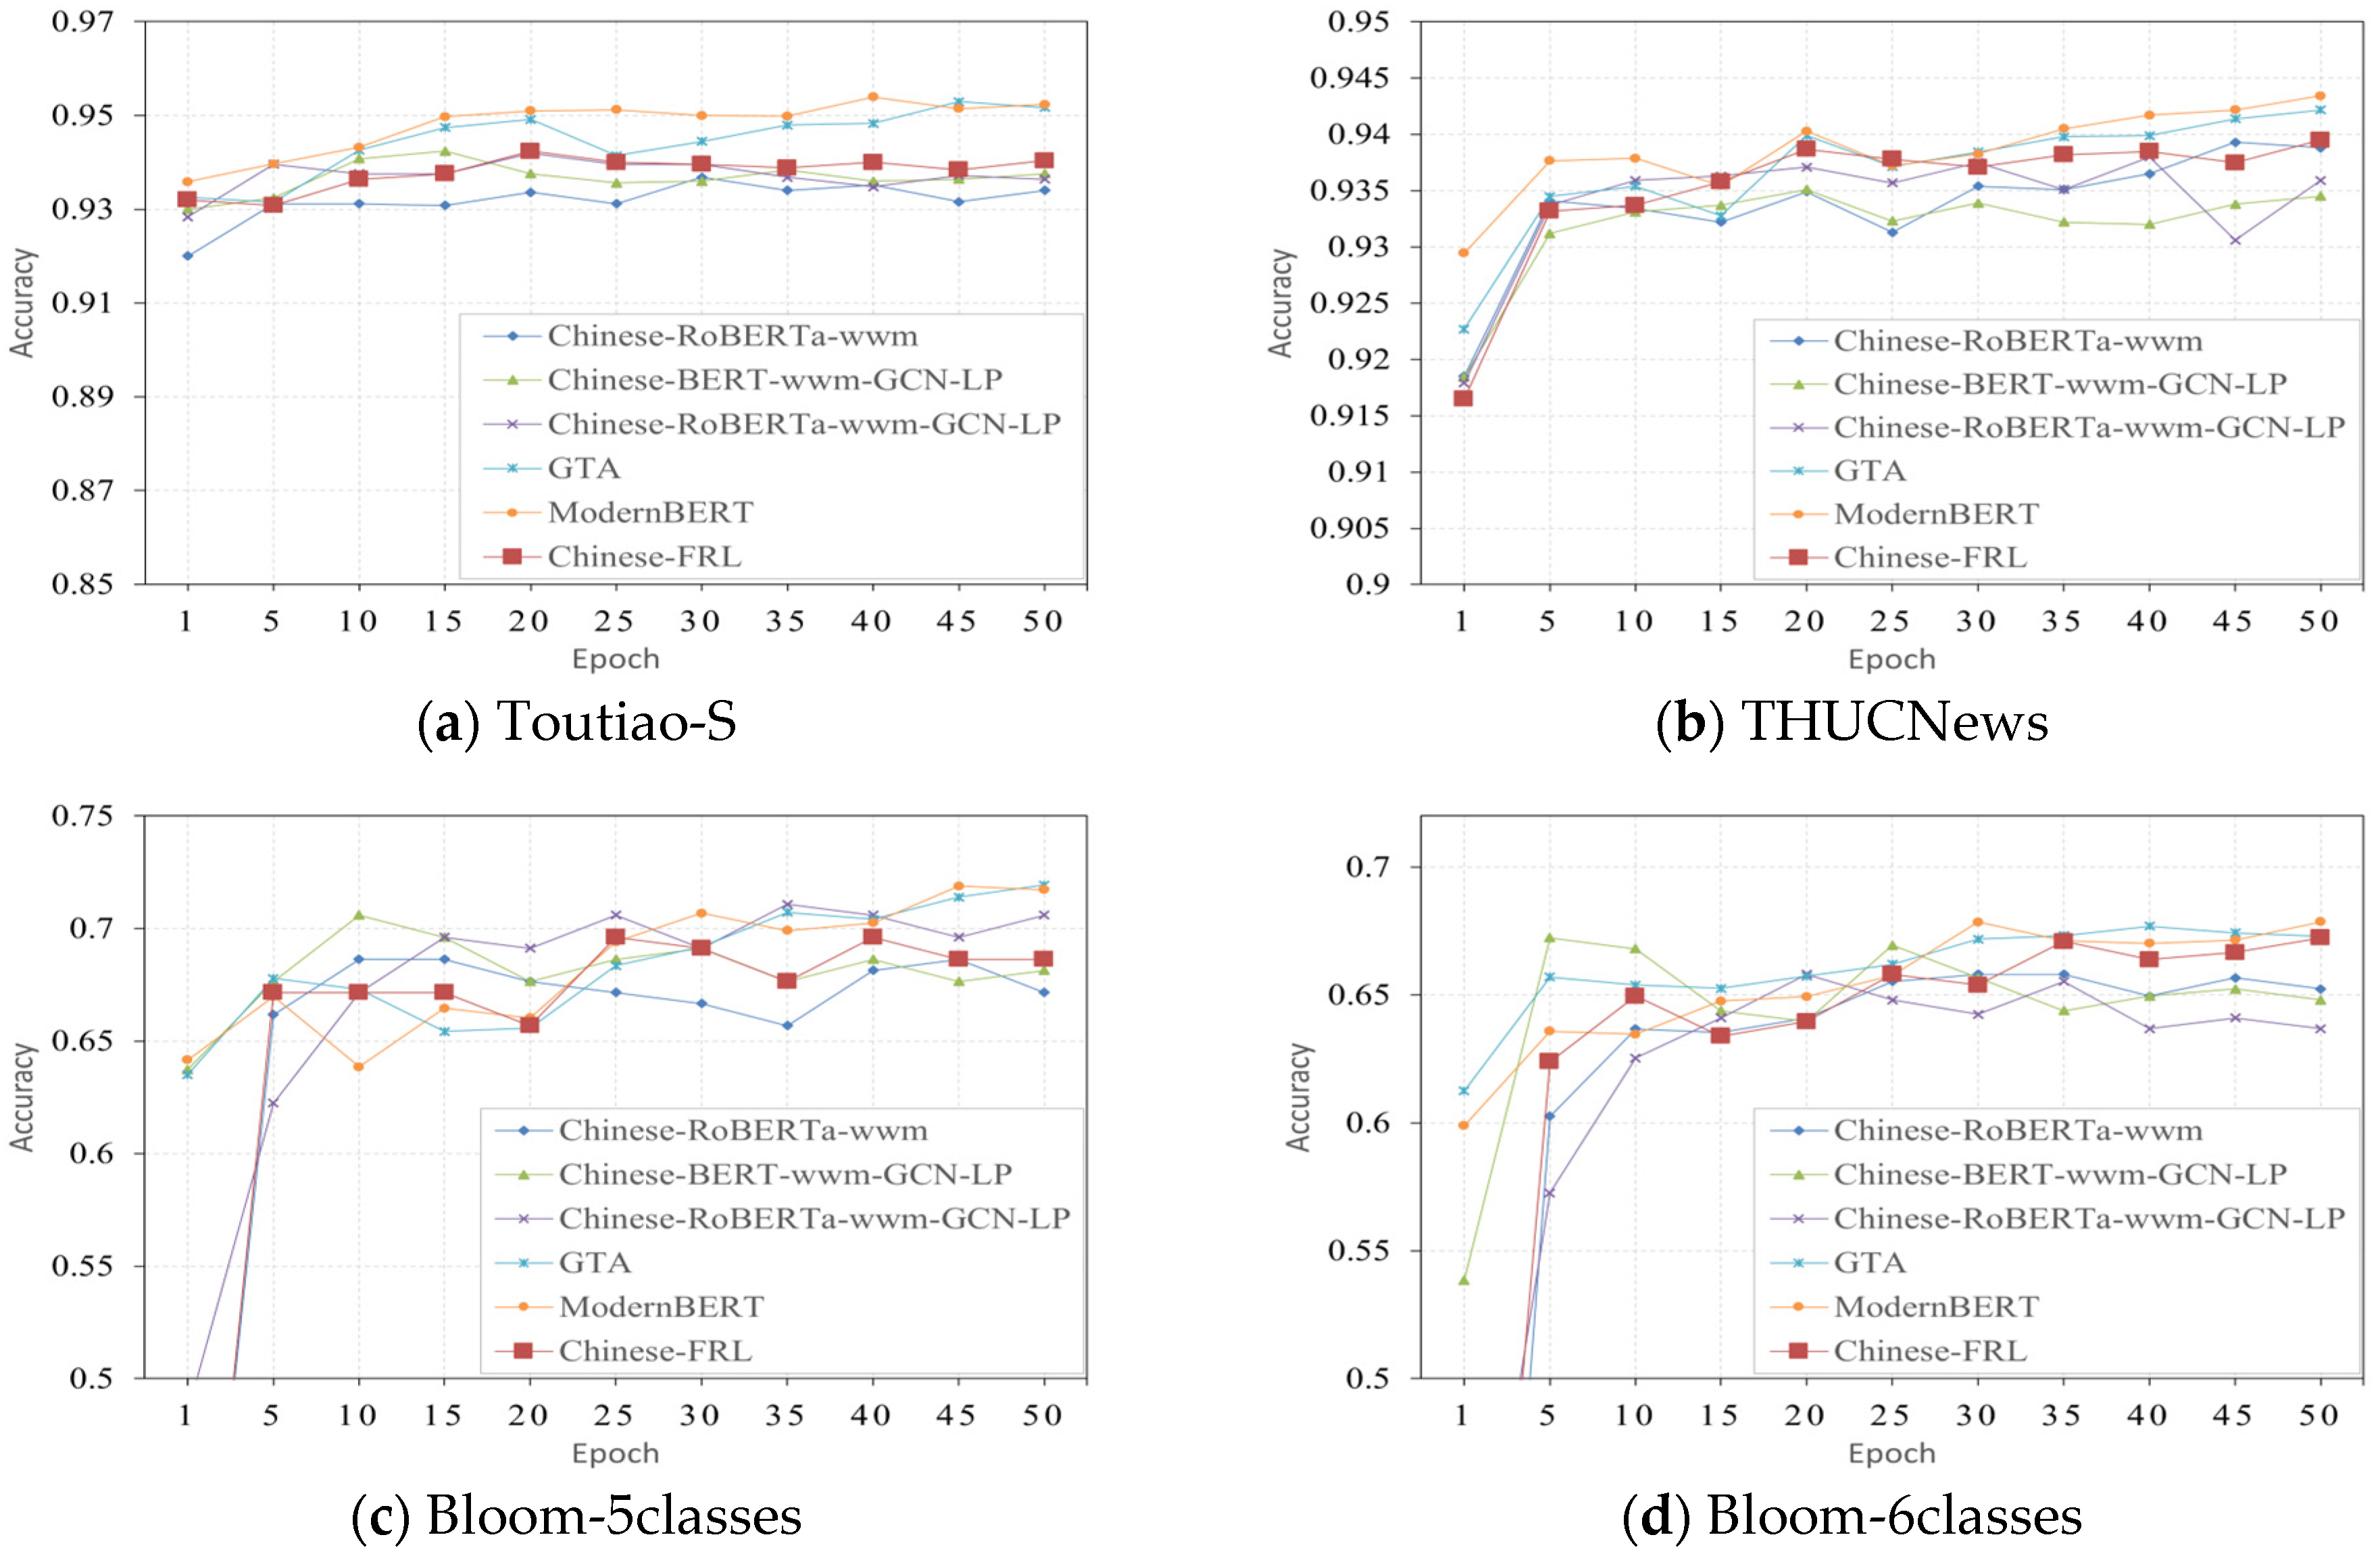
The ACC curves for each model of the four datasets are shown in Figure 5.
It can be observed from Figure 5a,b that after integrating the Chinese-RL-wwm framework with FreeLB adversarial training the proposed model generally outperformed the other baseline models, yet was slightly lower than the GTA and ModernBERT models. This can be attributed to the fact that these two baseline models feature longer Token inputs and more complex local feature extraction methods, thereby gaining a performance advantage in public datasets with balanced categories. However, Figure 5c,d show that when the categories in the dataset are imbalanced and the performance of the proposed Chinese-FRL model did not significantly differ from those of the two advanced baseline models. Consequently, these results demonstrate the effectiveness of Chinese-FRL in classifying Chinese exercise data—a task typically characterized by category imbalance.
In the following, we substitute Chinese-RoBERTa-wwm (12 hidden layers), Chinese-BERT-wwm-GCN-LP, Chinese-RoBERTa-wwm-GCN-LP, GTA, ModernBERT, Chinese-FRL (12 hidden layers), and Chinese-FRL (6 hidden layers) with A, B, C, D, E, F, and G, respectively. The performance metrics of the proposed Chinese-FRL framework and the baseline models on the four datasets are shown in Table 3 and analyzed as follows.
  • The Chinese-BERT-wwm-GCN-LP and Chinese-RoBERTa-wwm-GCN-LP models classify texts by integrating semantic information and structural information. The proposed Chinese-FRL framework, which adopts a method that combines sentence semantic information and sequence information, outperformed the three baseline models regarding classification performance. Although its classification effect was inferior to that of GTA and ModernBERT, the accuracy difference remained within 1.5%. This proves that the proposed framework can also effectively extract the implicit shallow and deep semantic features of Chinese texts.
  • The proposed model did not perform as well as GTA and ModernBERT when classifying the Bloom-5classes exercise dataset, which has sparse data and imbalanced categories. This is because GTA and ModernBERT use a combination of grouped-head attention mechanisms and Flash Attention, respectively, which can extract more local feature information than an LSTM. However, when classifying the Bloom-6classes exercise dataset, which has a balanced number of categories, the performance gap between the Chinese-FRL framework and GTA or ModernBERT was not significant, with the accuracy difference being within 1%. This indicates that, under the condition of balanced categories, combining FreeLB with Chinese-RL-wwm enables the effective classification of sparse Chinese exercise data.

4.2.2. Analysis of Experimental Results for Chinese-FRLT Model with Four Chinese Datasets

The ACC curves for each model ofon the four datasets are shown in Figure 6.
It can be seen, from Figure 6a,b, that the performance of the proposed Chinese-FRLT model was slightly poorer than that of GTA and ModernBERT. This is because the Toutiao-S (2) and THUCNews (2) datasets contain a large amount of pure text data, and the latter two models achieve higher accuracy when classifying such data. However, Figure 6c,d show that when the proportion of code text in the dataset increased, as the proposed model integrates a specific classification model (TBCC) for this type of text and leverages the respective advantages of each component through the text recognition module, the ACC curve of the proposed model surpassed that of the baseline models during the subsequent training process, demonstrating the effectiveness of this model in classifying the cognitive levels of mixed-code exercise texts.
In the following, we substitute Chinese-RoBERTa-wwm (12 hidden layers), Chinese-BERT-wwm-GCN-LP, Chinese-RoBERTa-wwm-GCN-LP, GTA, ModernBERT, Chinese-FRL (12 hidden layers), Chinese-FRL (6 hidden layers), Chinese-FRLT (12 hidden layers), and Chinese-FRLT (6 hidden layers) with A, B, C, D, E, F, G, H, and I, respectively. The performance metrics of the proposed Chinese-FRLT model on the Toutiao-S(2), THUCNews(2), Bloom-5classes(2), and Bloom-6classes(2) datasets with added code text, compared with the baseline models, are shown in Table 4, with a detailed analysis as follows.
  • The proposed Chinese-FRLT model outperformed the baseline models regarding ACC and both F1 evaluation metrics on the two exercise datasets with added code text. This demonstrates the superiority of the proposed model in the field of Chinese text classification, as well as its effectiveness in classifying the Bloom cognitive levels of Chinese exercises that contain mixed code.
  • The classification performance of the proposed Chinese-FRLT model was significantly better than that of the Chinese-RoBERTa-wwm model. This indicates the effectiveness of using a text recognition module for the initial classification of mixed texts, enabling the Chinese-FRL and TBCC modules to handle the corresponding text types. The Chinese-BERT-wwm-GCN-LP and Chinese-RoBERTa-wwm-GCN-LP models require the generation of adjacent information between texts through a GCN before processing text, while code text is composed of relevant symbols and various logical structures, resulting in sparse semantic feature information. The classification performance of the proposed Chinese-FRLT model was superior to that of these two models, indicating that the combination with TBCC allows for parsing of the structure of code text to generate code snippets effectively, thereby mining semantic feature information in code text.
  • When classifying datasets with a high proportion of pure text, the proposed Chinese-FRLT model performed slightly worse than GTA and ModernBERT, with an accuracy difference of less than 0.8%. This is because both GTA and ModernBERT use longer Token inputs and more advanced attention mechanisms. However, the classification results for subsequent exercise datasets revealed that this does not mean they can effectively classify exercise data that are sparse and imbalanced. This also proves that integrating a specific code parsing and classification model allows for the more effective classification of text data mixed with code.

4.2.3. Ablation Experiment

  • Influence of individual modules in the Chinese-FRLT model on its performance.
To evaluate the effectiveness of each module in the Chinese-FRLT model, ablation experiments were conducted on four datasets: Toutiao-S(2), THUCNews(2), Bloom-5classes(2), and Bloom-6classes(2). Different modules were removed from the Chinese-FRLT model in each ablation experiment to verify their effectiveness. Specifically, “Chinese-FRL” refers to removing the TBCC module, “Chinese-RLT” refers to removing the FreeLB module, and “Chinese-FRT” refers to using Chinese-RoBERTa-wwm instead of the Chinese-RL-wwm module. Additionally, in the Bloom-5classes(2) and Bloom-6classes(2) datasets, the number of hidden layers in Chinese-RoBERTa-wwm was reduced to six layers. The experimental results are presented in Table 5.
The classification results from the four datasets shown in Table 5 indicate that the method of using an LSTM to extract deep contextual features and combining them with semantic information to represent word vectors is effective in obtaining rich semantic information features for word vectors across datasets with different categories and quantities; the addition of FreeLB adversarial training enhances the robustness of models comprising different modules and is applicable to various datasets; and the integration of the TBCC model allows for the effective identification and processing of structurally complex and semantically sparse code text, enhancing the model’s ability to classify mixed text. Although their contributions to the overall model are not identical, removing any of these modules would lead to a performance decrease, indicating that the introduction of these three modules is effective and their functions in the model are complementary.
2.
The effect of the number of hidden layers in Chinese-RoBERTa-wwm.
To verify the effectiveness of the Chinese-FRLT model, the number of hidden layers of RoBERTa base in the Chinese-RoBERTa-wwm structure was initially set to six, and ablation experiments with different numbers of hidden layers for two datasets, Bloom-5classes(2) and Bloom-6classes(2), were carried out. The results are shown in Table 6.
From Table 6 and the experimental results, it can be concluded that reducing the number of hidden layers in the RoBERTa base leads to the model’s inability to effectively extract text feature information, resulting in a significant decrease in its performance. On the other hand, when there are too many hidden layers in the RoBERTa base, the model’s spatial complexity increases, leading to increased memory consumption and the neglect of locally important information, which prevents the model from achieving optimal classification performance. When the number of hidden layers in the RoBERTa base was set to six, all metrics were optimized.

4.3. Performance Analysis of Models Characterizing the Active State of Thinking

4.3.1. Comparison of Single- and Multi-Tasking

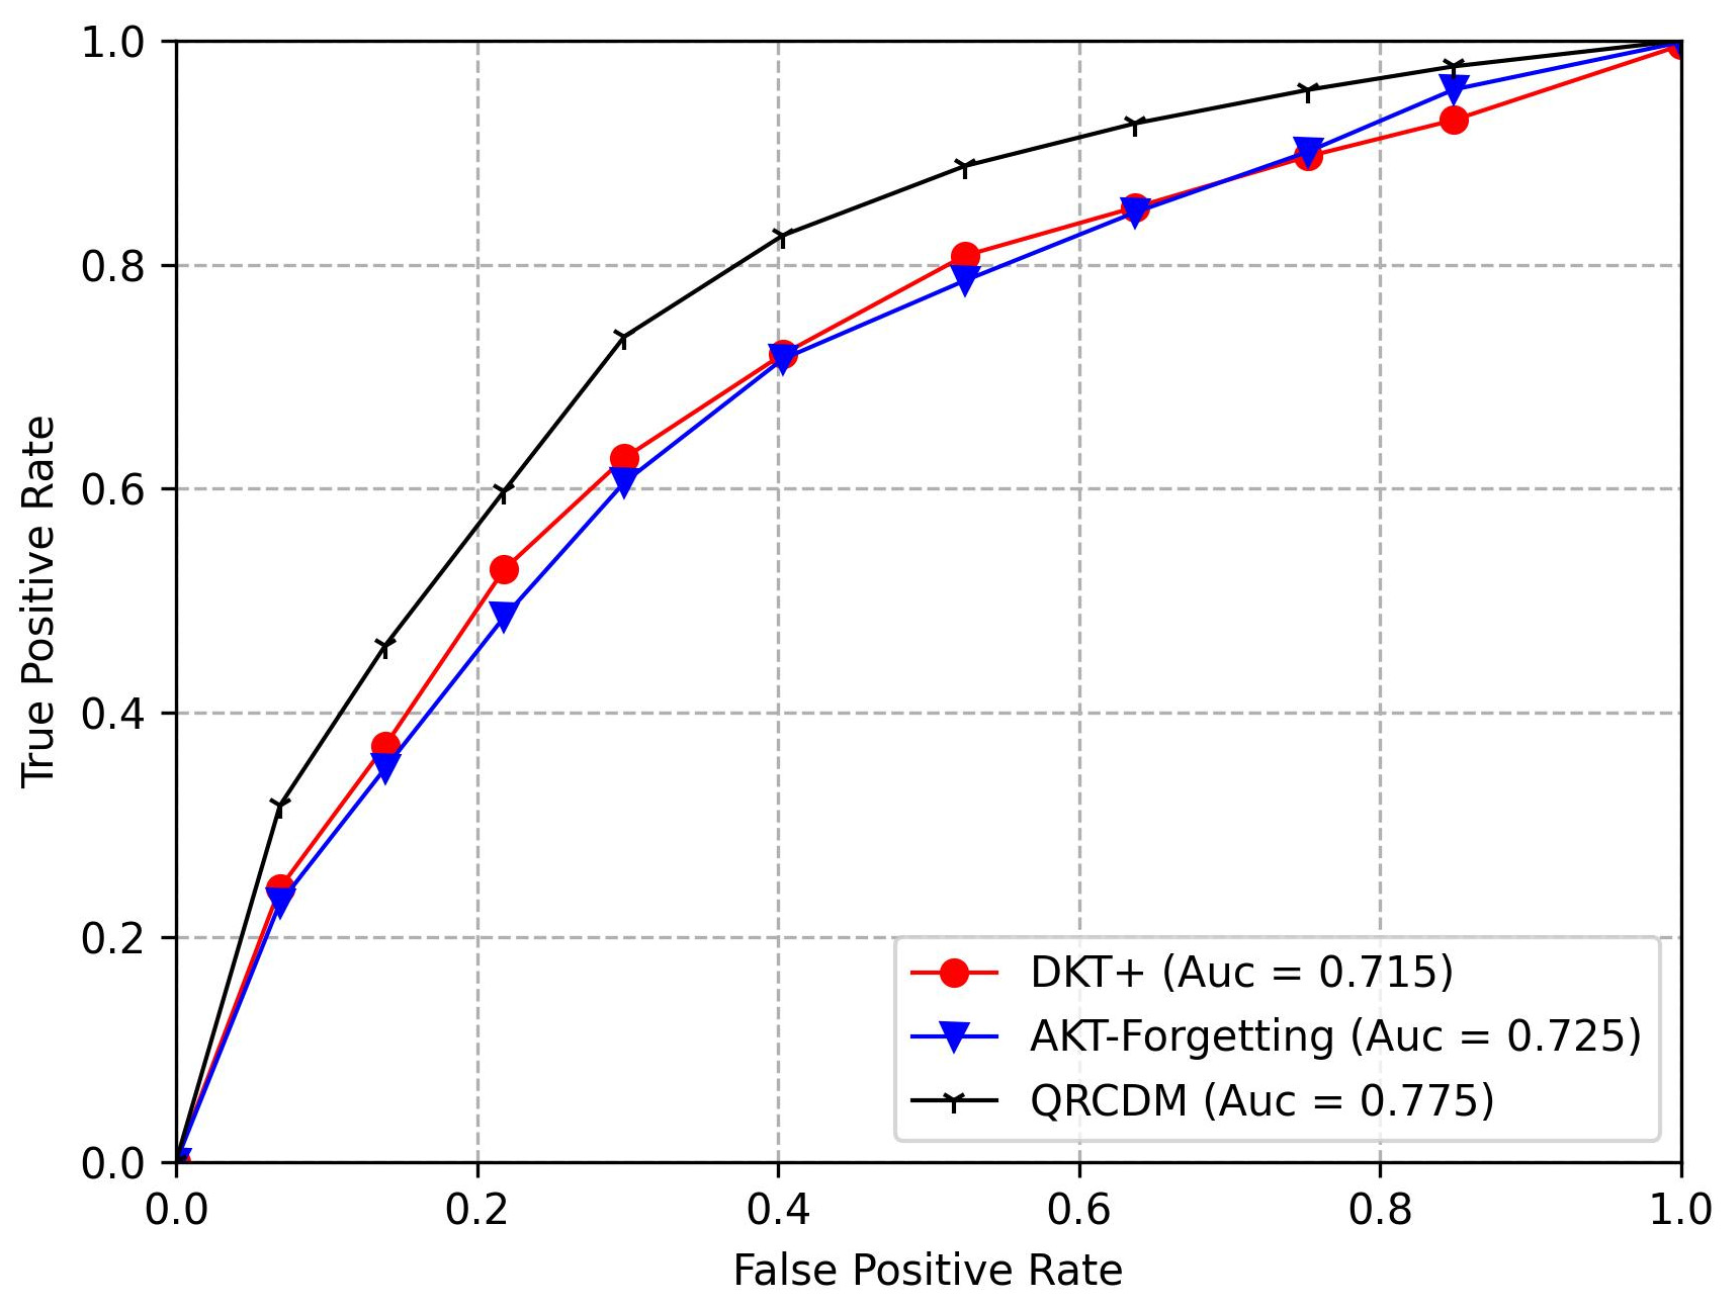
In order to verify that the QRCDM can be effectively applied to the Classroomdata dataset, it was compared with the DKT [24] and DKVMN [25] diagnostic models. DKT is a diagnostic model that uses Recurrent Neural Networks to track students’ knowledge states, while DKVMN is a diagnostic model that uses memory-enhanced neural networks to construct static and dynamic matrices to store and update all knowledge points and student learning states, respectively. All models were trained and tested on the Classroomdata dataset, and the AUC curves are shown in Figure 7.
From the above figure, it can be observed that QRCDM performed the best on the Classroomdata dataset, maintaining the highest level of accuracy in diagnostic results. The performance metrics for the QRCDM compared with other cognitive diagnostic models are shown in Table 7, with the specific analysis as follows.
In the Classroomdata dataset, QRCDM outperformed DKT and DKVMN regarding the AUC and MAE metrics. It also outperformed DKT regarding the ACC and RMSE metrics and showed comparable performance to DKVMN. This suggests that compared with the RNN-based DKT and memory-enhanced neural network-based DKVMN, QRCDM—which utilizes matrix factorization for feature extraction—is more suitable for diagnosing students’ cognitive levels in this context.

4.3.2. Analysis and Evaluation of a Model for Characterizing the Active State of Thinking Based on the Classroomdata Dataset

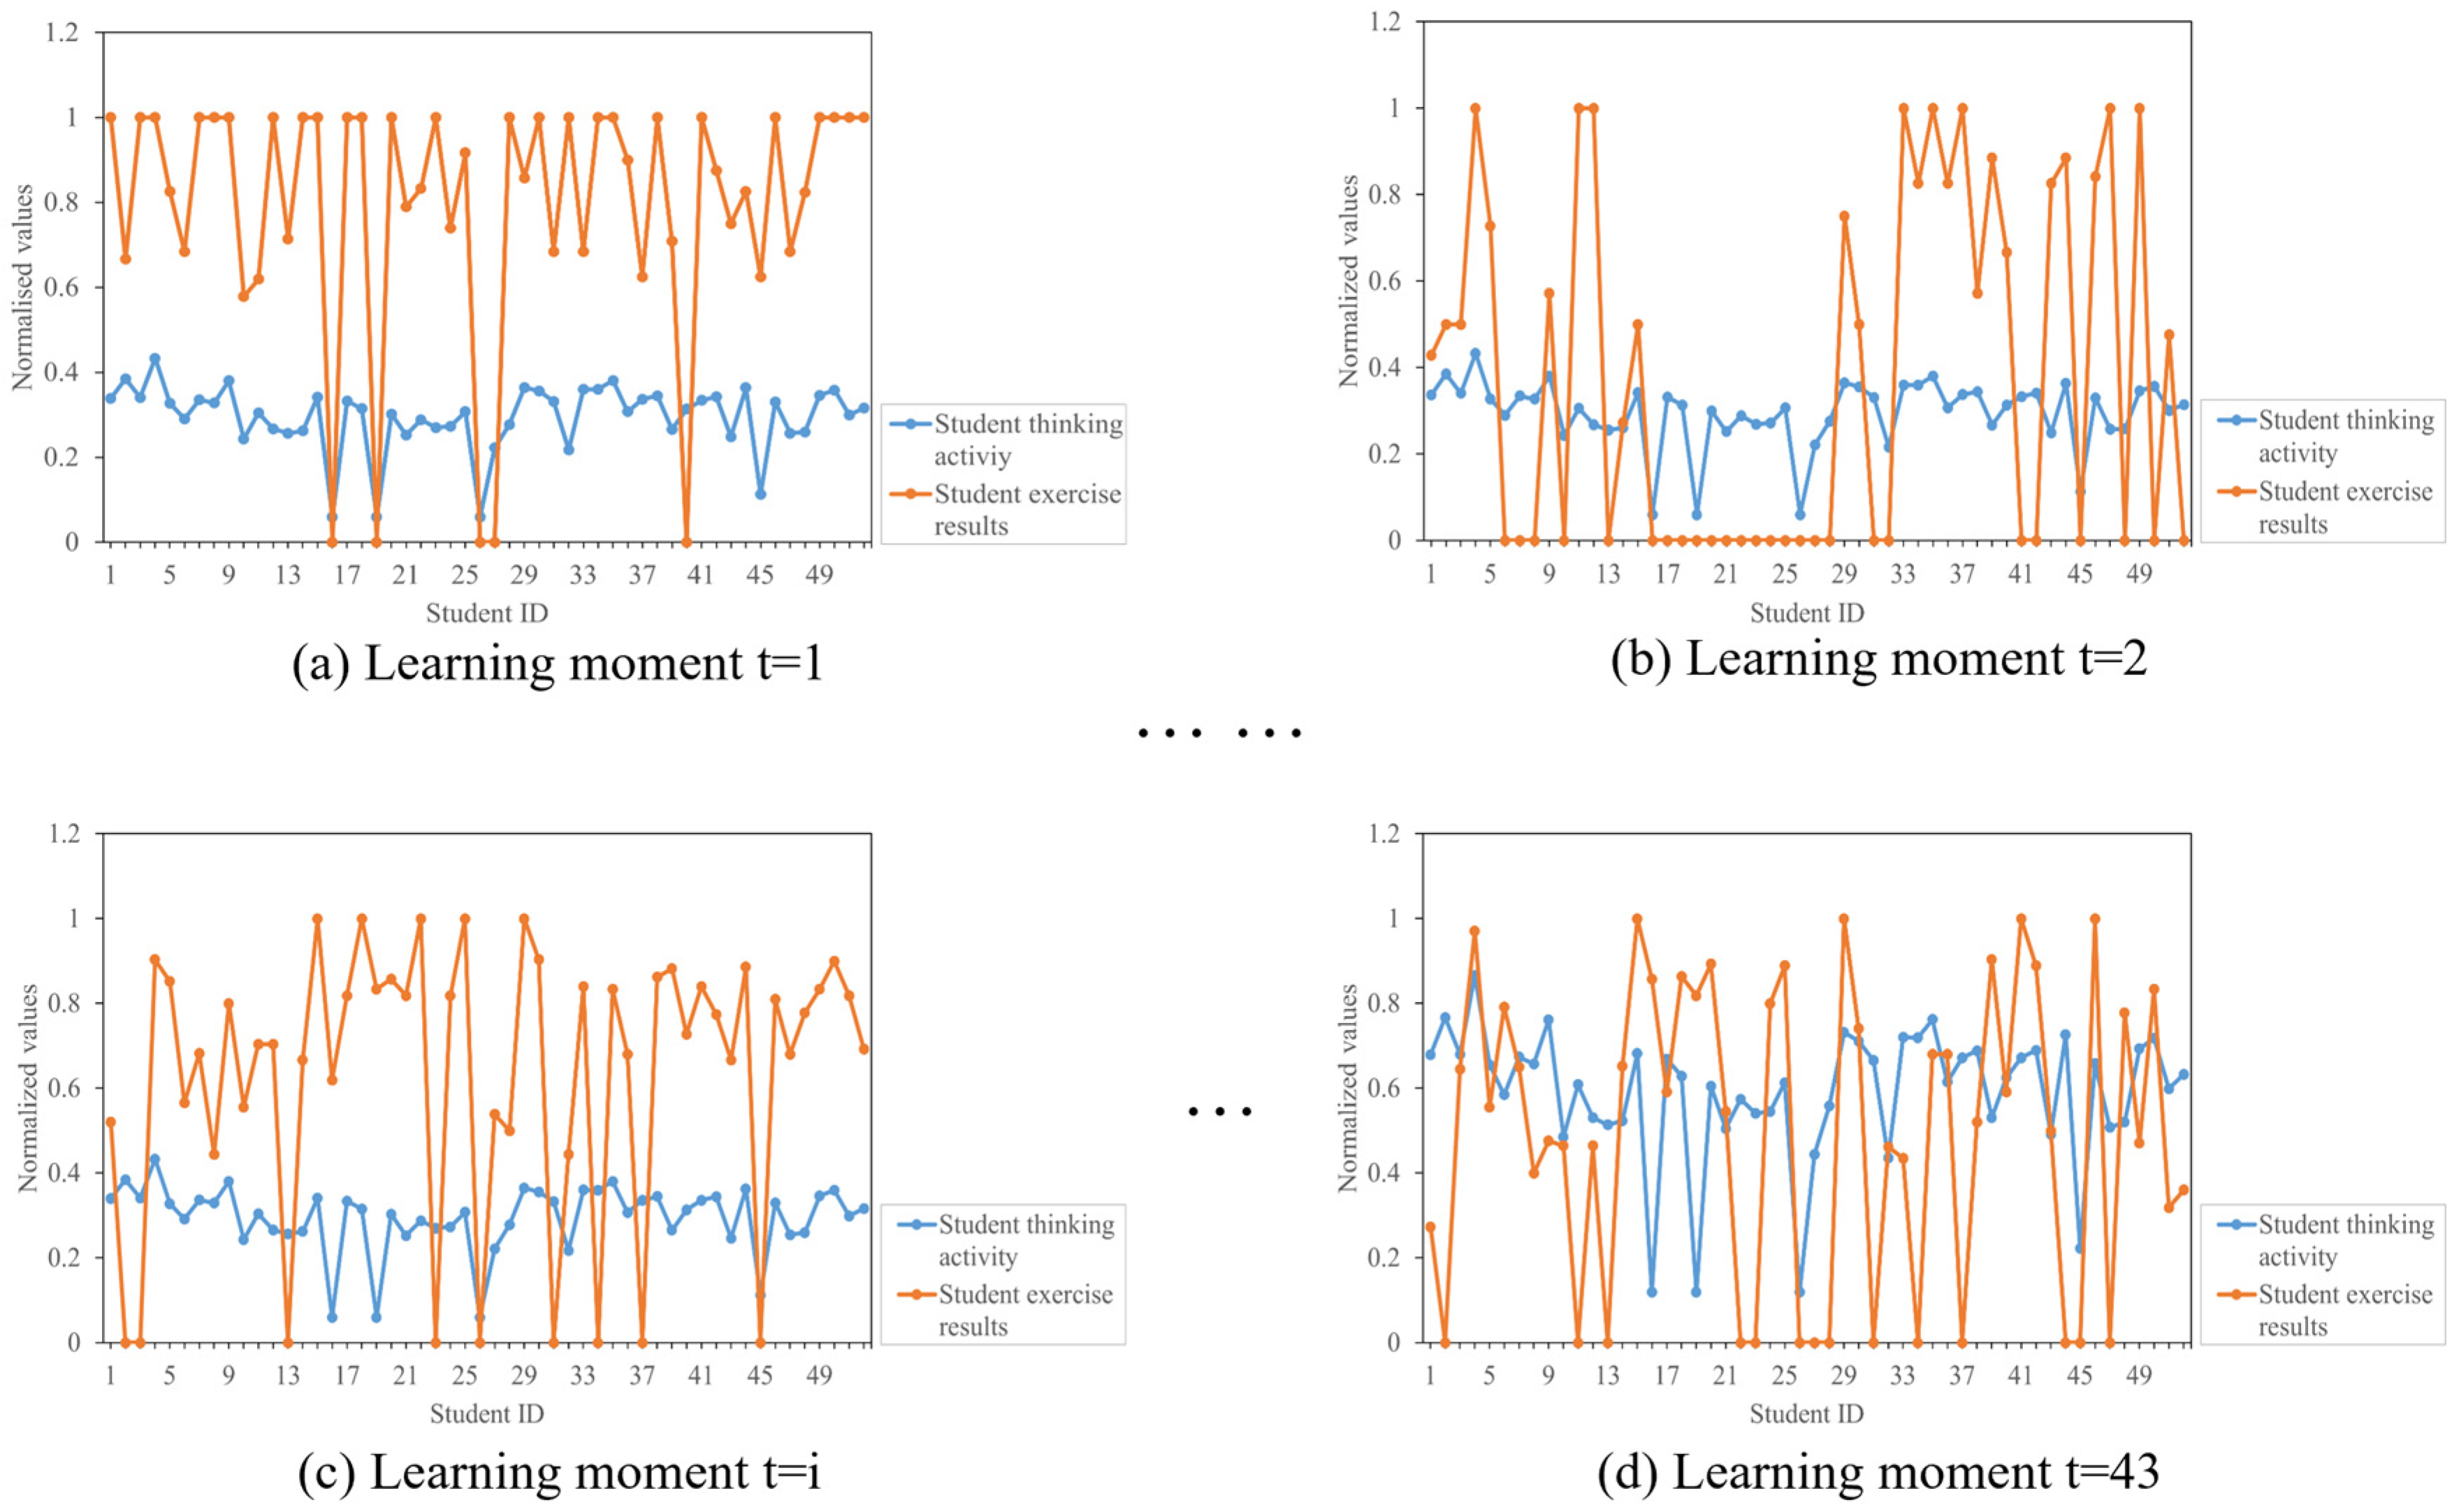
Based on the exercises and student responses in the Classroomdata dataset, the exercise sequence was considered as a time series reflecting each student’s offline classroom learning. The Bloom cognitive level of exercises obtained with the Chinese-FRLT model, the cognitive level of student exercises obtained with the QRCDM, and the in-class exercise scores of students were separately input into a self-attention mechanism network to obtain the temporal thinking activity of each student, which was then compared with the in-class exercise scores of students at each learning moment. The comparison results are shown in Figure 8.
Based on Figure 8, the following analysis can be performed:
Figure 8b shows that the student’s exercise scores remained at a high level over consecutive time periods; however, at the same time, their thinking activity continued to be in a low state. This abnormal pattern of “high scores–low activity” suggests that the student may not have completed the answers entirely independently, and there is a possibility that they partially drew on external information. However, this conclusion is only a hypothesis based on patterns in the data.
Figure 8a,c,d, show that in the early stages—where both the knowledge points and exercise contents are relatively simple—the fluctuations in thinking activity in the students show a positive correlation with their exercise scores. However, as the difficulty of the knowledge points and exercises gradually increased, despite their attempts to maintain a relatively high level of thinking activity, their exercise scores declined. This reflects that the increase in learning difficulty had a direct impact on their scores.
To represent the temporal thinking activity state based on students’ sequential thinking activity, the value range of thinking activity was defined from 0 to 1 and divided into five equal parts to correspond to different thinking activity states: Torpid, 0–0.2; Slow, 0.2–0.4; Active, 0.4–0.6; Excited, 0.6–0.8; and Sensitive, 0.8–1.0. The results reflecting each student’s thinking activity state are represented in Table 8.
From Table 8, it can be observed that the students’ temporal cognitive states remained relatively stable and did not present sudden significant changes. Furthermore, at earlier learning moments, most students exhibited a sluggish cognitive state, indicating a lower level of knowledge absorption. However, contrary to this trend, some students’ scores in the exercises in Figure 8 contradict this, indicating potential cheating behaviors while answering the exercises.
To assist teachers in analyzing the temporal cognitive states of all students in the classroom, the cognitive activity levels of students in the class at the same moments as those shown in Figure 8 were compared with their respective exercise scores. The comparison results are illustrated in Figure 9.
Based on Figure 9, the following analysis can be performed:
As shown in Figure 9d, students’ cognitive activity levels present large variations, likely influenced by factors such as the difficulty of the knowledge points or other classroom-related factors. Figure 9a indirectly reflects that most students’ mental activity is related to the difficulty and quantity of knowledge points in the course. Figure 9b reflects that only a portion of students with high cognitive activity levels were able to achieve high scores. Additionally, Figure 9c demonstrates that the change trends in cognitive activity levels for all students in the class gradually align with the trends in their exercise scores, validating that the proposed cognitive activity state representation model can, to some extent, reflect the temporal changes in students’ cognitive activity levels, laying the foundation for subsequent analyses of collective cognitive activity states.
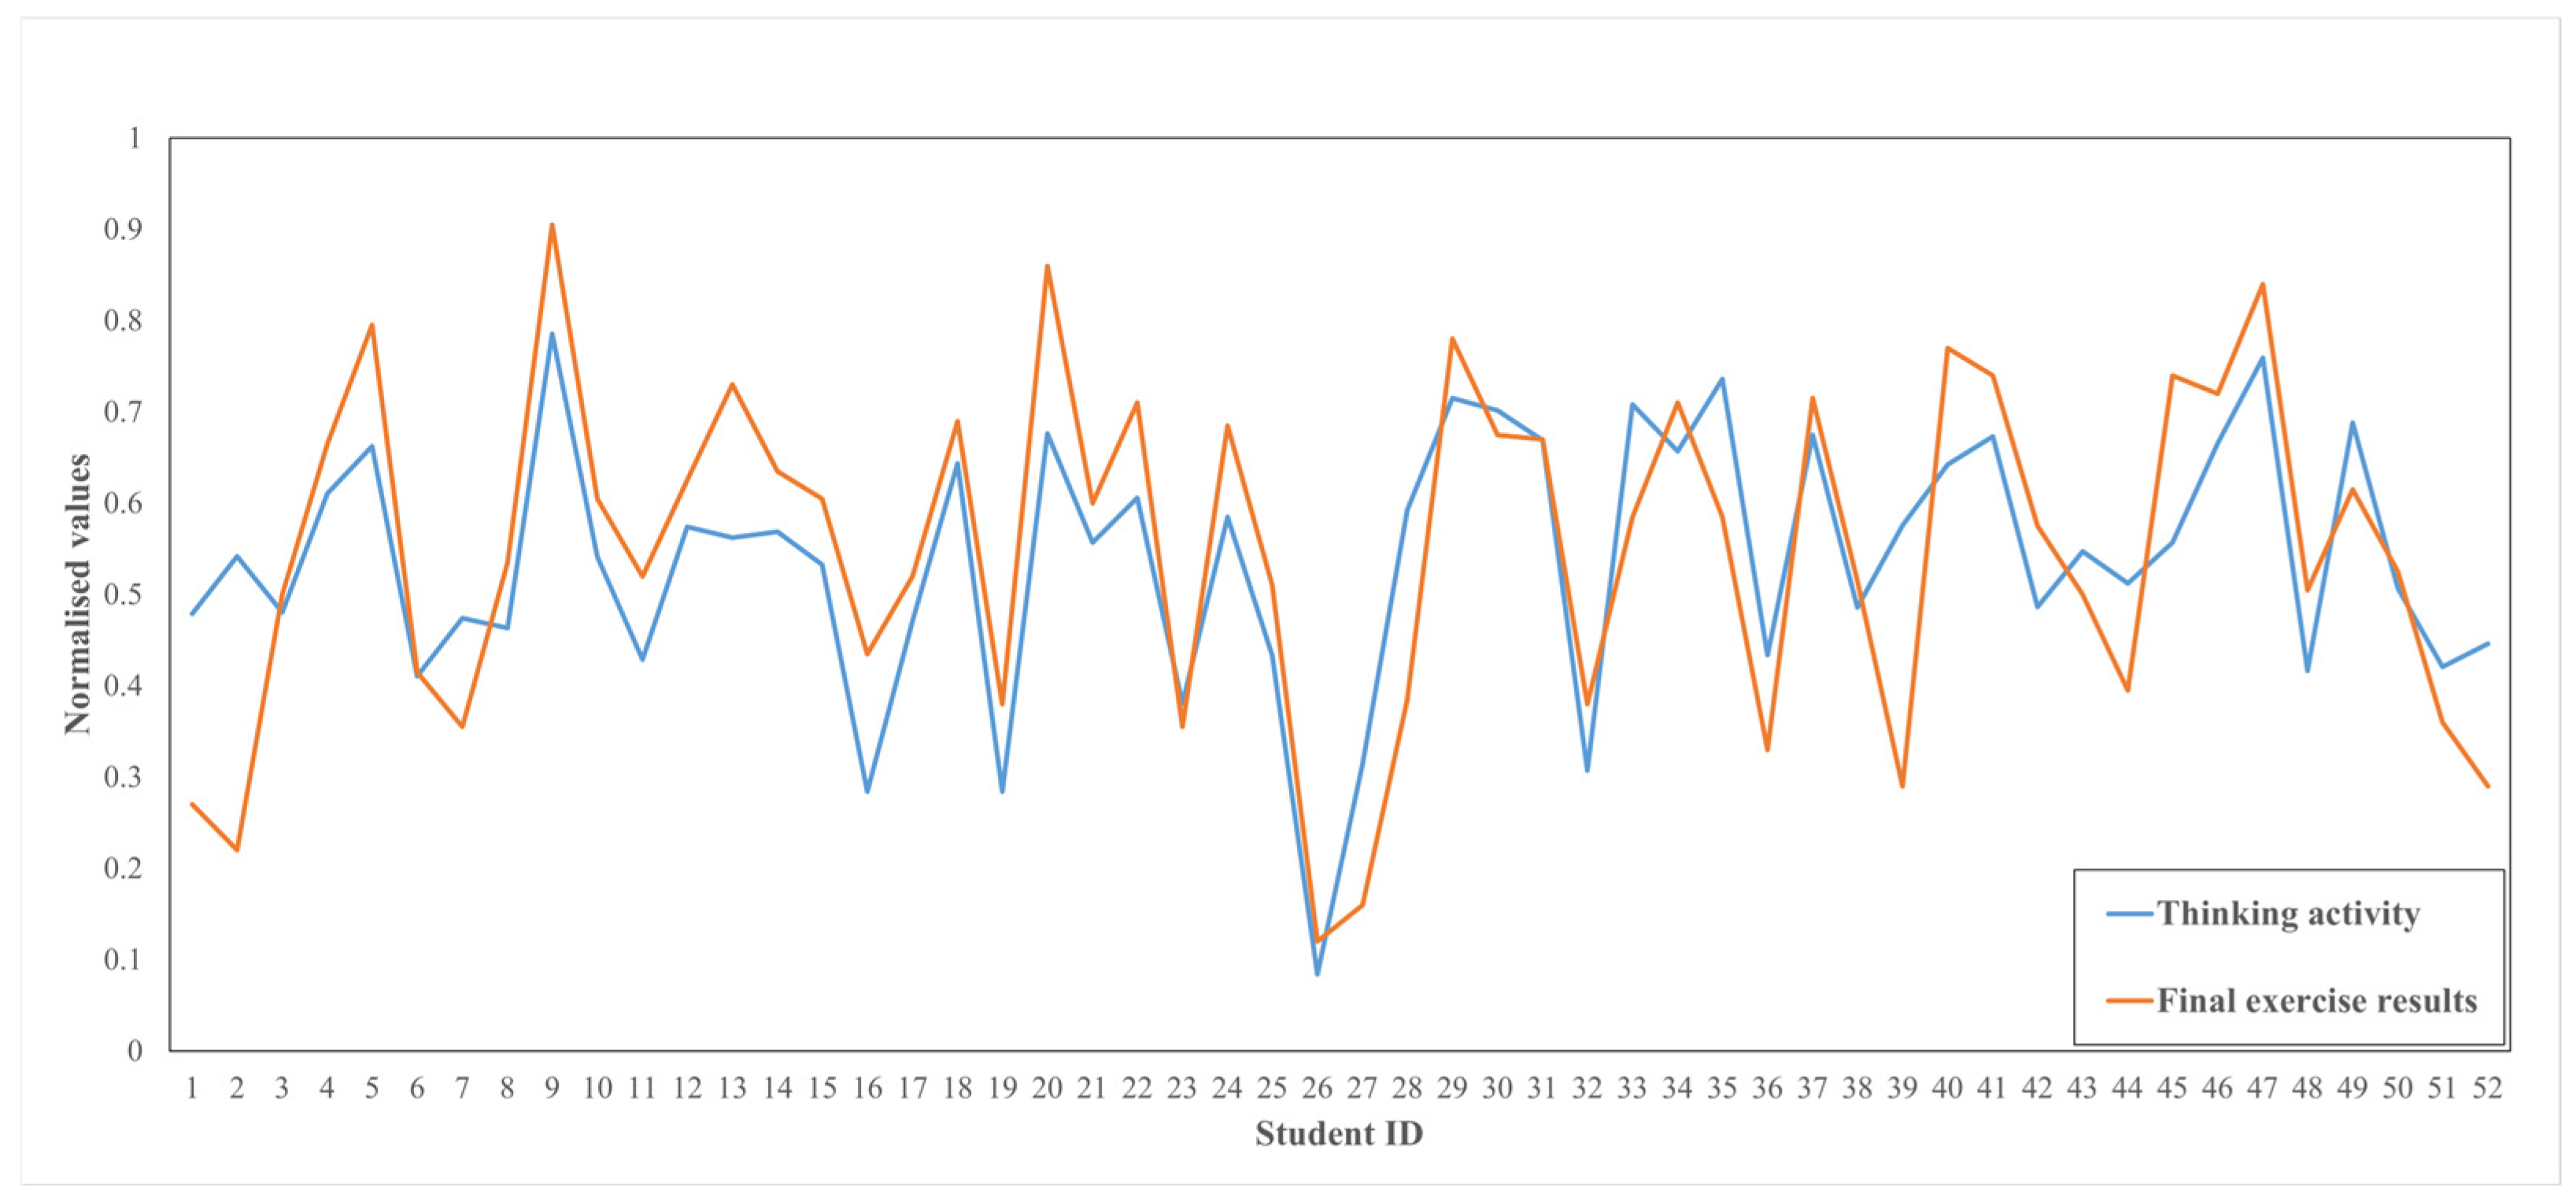
To further validate the effectiveness of the proposed method, the average cognitive activity level of students at each learning moment was calculated and compared with the normalized final scores. The results are presented in Figure 10.
From the above figure, it can be seen that the students’ cognitive activity levels align closely with their final exam scores. However, due to the possibility of individual students engaging in cheating during in-class exercises (as the in-class exercises can be completed outside of class), there are inevitably cases where certain students’ final exam scores differ significantly from their cognitive activity levels. For example, Student 1 exhibited a noticeable difference between their final exam score and cognitive activity level. To validate the effectiveness of this cognitive activity state representation method, the cognitive activity states were characterized according to the method described in Table 8. Subsequently, the final exam scores, which range from 0 to 100 points, were normalized to range from 0 to 1, and then divided into five intervals corresponding to the five levels of cognitive activity states through quintile partitioning: very poor (0–0.2), poor (0.2–0.4), moderate (0.4–0.6), good (0.6–0.8), and excellent (0.8–1.0). The accuracy of representing cognitive activity states was calculated using Equation (11).
A C C T = i = 1 N f ( T i , s c o r e i ) N
where N represents the total number of students, the function f(∙) determines whether the cognitive activity state of a student corresponds to their final exam score interval, T i represents the cognitive activity state of the i-th student, and s c o r e i represents the final exam score of the i-th student.
Finally, the accuracy of representing cognitive activity states was 61.54%, with a total of 32 correct representations out of 52 students. The specific calculated quantities are shown in Table 9.
The 61.54% accuracy rate indicates that the setup of completing in-class exercises after class introduces unavoidable “noise”. For example, the abnormal situation shown by student No. 1 suggests that non-independent completion behaviors interfered with the true measurement of thinking activity. The final exam results themselves are a comprehensive outcome affected by multiple factors (e.g., on-the-spot performance and depth of review) and it is difficult to fully capture these complex variables solely through the activity level determined during in-class exercises. Additionally, the method of categorizing continuous scores into five fixed intervals may not be sufficiently precise, leading to the misjudgment of some students who fall on the boundaries of these intervals.
From a statistical perspective, an accuracy rate of 61.54% is significantly higher than the probability of random guessing, which proves that the observed correlation is not accidental and falls within the moderately acceptable level in educational empirical research. This confirms the value of “process-oriented assessment”—that is, focusing on the learning process itself has predictive power for outcomes. To summarize, this accuracy rate indicates that the proposed method is feasible as a preliminary and auxiliary diagnostic tool, but is not sufficient to serve as an absolute evaluation criterion. To improve its reliability, future research may consider further optimizing the representation accuracy by controlling the exercise completion environment, integrating multi-dimensional data such as classroom participation, or adopting more advanced algorithmic models.

5. Conclusions

This paper addresses the goal of real-time monitoring of students’ in-class active thinking stage by introducing a novel representation model that fuses exercise cognitive hierarchy and student cognitive levels. A series of experiments demonstrate the following conclusions for the three research objectives.
First, to improve the robustness of cognitive hierarchy classification for complex Chinese text, the Chinese-FRLT model proposed herein effectively automates the classification of exercise cognitive levels. It extracts dual-contextual textual features by fusing Chinese-RoBERTa-wwm with LSTM, attaining strong classification performance (up to 0.9309 accuracy) on multiple mixed Chinese datasets. This success verifies the model’s ability to delve into deep-level semantic features in Chinese text, thus achieving the first research aim. Secondly, towards automating classification of code-text hybrid exercises, the TBCC module proves capable of effectively parsing code’s structured semantics. This implementation allows Chinese-FRLT to uniformly interpret program logic in mixed exercises, achieving 0.7004 accuracy and successful cognitive level categorization, thereby fulfilling the second research goal. Finally, the newly developed model for active thinking states integrates QRCDM-based cognitive diagnostics with exercise cognitive levels. A significant positive correlation was found between the model’s output and final grades, with a prediction accuracy of 61.54% that significantly exceeded the random baseline. These results confirm that the model’s quantitative output reliably mirrors actual student learning states, thus successfully achieving the third research objective.
In conclusion, this study achieves its defined goals by delivering a viable tool for teachers to monitor overall class and individual student engagement in real-time, facilitating dynamic instructional adjustments and personalized support.

Author Contributions

Methodology, Y.L. and Z.S.; Software, Y.L. and H.Y.; Validation, Y.L. and C.L.; Formal analysis, Y.L., H.Y. and J.M.; Investigation, C.L. and J.M.; Resources, Z.S. and J.M.; Data curation, Y.L. and J.M.; Writing—original draft, Y.L.; Visualization, H.Y.; Supervision, Z.S.; Project administration, Z.S. All authors have read and agreed to the published version of the manuscript.

Funding

This work was supported by the National Natural Science Foundation of China (62177012, 61967005, 62267003), Guangxi Natural Science Foundation (under Grant No. 2024GXNSFDA010048), and the Project of Guangxi Wireless Broadband Communication and Signal Processing Key Laboratory (GXKL06240107).

Data Availability Statement

All datasets used in this study can be accessed at https://github.com/anglgn/Chinese-Text-Classification-Dataset (accessed on 28 March 2024).

Conflicts of Interest

Author Chenchen Lu was employed by the company Guangxi Jet Toll Technology Co., Ltd. The remaining authors declare that the research was conducted in the absence of any commercial or financial relationships that could be construed as a potential conflict of interest.

References

  1. Yeru, T.; Zuozhang, D. Genetic principles and their implications for the study of learning interes. Educ. Explor. 2012, 9, 5–7. [Google Scholar]
  2. Al-Mudimigh, A.S.; Ullah, Z.; Shahzad, B. Critical success factors in implementing portal: A comparative study. Glob. J. Manag. Bus. Res. 2010, 10, 129–133. [Google Scholar]
  3. Al-Sudairi, M.; Al-Mudimigh, A.S.; Ullah, Z. A Project management approach to service delivery model in portal implementation. In Proceedings of the 2011 Second International Conference on Intelligent Systems, Modelling and Simulation, Phnom Penh, Cambodia, 25–27 January 2011; IEEE: Piscataway, NJ, USA, 2011; pp. 329–331. [Google Scholar]
  4. David, R.K. A revision of bloom’s taxonomy: An overview. Theory Into Pract. 2002, 41, 212–218. [Google Scholar]
  5. Kusuma, S.F.; Siahaan, D.; Yuhana, U.L. Automatic Indonesia’s questions classification based on bloom’s taxonomy using Natural Language Processing a preliminary study. In Proceedings of the 2015 International Conference on Information Technology Systems and Innovation (ICITSI), Bali, Indonesia, 16–19 November 2015; IEEE: Piscataway, NJ, USA, 2015; pp. 1–6. [Google Scholar]
  6. Das, S.; Mandal, S.K.D.; Basu, A. Identification of cognitive learning complexity of assessment questions using multi-class text classification. Contemp. Educ. Technol. 2020, 12, ep275. [Google Scholar] [CrossRef]
  7. Waheed, A.; Goyal, M.; Mittal, N.; Gupta, D.; Khanna, A.; Sharma, M. BloomNet: A Robust Transformer based model for Bloom’s Learning Outcome Classification. arXiv 2021, arXiv:2108.07249. [Google Scholar] [CrossRef]
  8. Gan, W.; Sun, Y.; Peng, X.; Sun, Y. Modeling learner’s dynamic knowledge construction procedure and cognitive item difficulty for knowledge tracing. Appl. Intell. 2020, 50, 3894–3912. [Google Scholar] [CrossRef]
  9. Piech, C.; Bassen, J.; Huang, J.; Ganguli, S.; Sahami, M.; Guibas, L.J.; Sohl-Dickstein, J. Deep knowledge tracing. Adv. Neural Inf. Process. Syst. 2015, 28, 201–204. [Google Scholar]
  10. Wang, F.; Liu, Q.; Chen, E.; Huang, Z.; Chen, Y.; Yin, Y.; Wang, S. Neural cognitive diagnosis for intelligent education systems. In Proceedings of the AAAI Conference on Artificial Intelligence, New York, NY, USA, 7–12 February 2020; Volume 34, pp. 6153–6161. [Google Scholar]
  11. Gao, W.; Liu, Q.; Huang, Z.; Yin, Y.; Bi, H.; Wang, M.C.; Su, Y. RCD: Relation map driven cognitive diagnosis for intelligent education systems. In Proceedings of the 44th International ACM SIGIR Conference on Research and Development in Information Retrieval, Online, 11–15 July 2021; pp. 501–510. [Google Scholar]
  12. Pandey, S.; Srivastava, J. RKT: Relation-aware self- Attention Is All You Need for knowledge tracing. In Proceedings of the 29th ACM International Conference on Information & Knowledge Management, Online, 19–23 October 2020; pp. 1205–1214. [Google Scholar]
  13. Yang, H.; Qi, T.; Li, J.; Ren, M.; Zhang, L.; Wang, X. A novel quantitative relationship neural network for explainable cognitive diagnosis model. Knowl. Based Syst. 2022, 250, 109156. [Google Scholar] [CrossRef]
  14. Cui, Y.; Che, W.; Liu, T.; Qin, B.; Yang, Z. Pre-training with whole word masking for ChineseBERT. IEEE/ACM Trans. Audio Speech Lang. Process. 2021, 29, 3504–3514. [Google Scholar] [CrossRef]
  15. Xu, X.; Chang, Y.; An, J.; Du, Y. Chinese text classification by combining Chinese-BERTology-wwm and GCN. PeerJ Comput. Sci. 2023, 9, e1544. [Google Scholar] [CrossRef]
  16. Warner, B.; Chaffin, A.; Clavié, B.; Weller, O.; Hallström, O.; Taghadouini, S.; Poli, I. Smarter, Better, Faster, Longer: A Modern Bidirectional Encoder for Fast, Memory Efficient, and Long Context Finetuning and Inference. arXiv 2024, arXiv:2412.13663. [Google Scholar] [CrossRef]
  17. Sun, L.; Deng, C.; Jiang, J.; Zhang, H.; Chen, L.; Wang, J. GTA: Grouped-head latenT Attention. arXiv 2025, arXiv:2506.17286. [Google Scholar]
  18. Gani, M.O.; Ayyasamy, R.K.; Sangodiah, A.; Fui, Y.T. Bloom’s Taxonomy-based exam question classification: The outcome of CNN and optimal pre-trained word embedding technique. Educ. Inf. Technol. 2023, 28, 15893–15914. [Google Scholar] [CrossRef]
  19. Baharuddin, F.; Naufal, M.F. Fine-Tuning IndoBERT for Indonesian Exam Question Classification Based on Bloom’s Taxonomy. J. Inf. Syst. Eng. Bus. Intell. 2023, 9, 253–263. [Google Scholar] [CrossRef]
  20. Mukanova, A.; Barlybayev, A.; Nazyrova, A.; Kussepova, L.; Matkarimov, B.; Abdikalyk, G. Development of a Geographical Question- Answering System in the Kazakh Language. IEEE Access 2024, 12, 105460–105469. [Google Scholar] [CrossRef]
  21. Bi, H.; Chen, E.; He, W.; Wu, H.; Zhao, W.; Wang, S.; Wu, J. BETA-CD: A Bayesian meta-learned cognitive diagnosis framework for personalized learning. In Proceedings of the AAAI Conference on Artificial Intelligence, Montréal, QC, Canada, 8–10 August 2023; Volume 37, pp. 5018–5026. [Google Scholar]
  22. Vucetich, J.A.; Bruskotter, J.T.; Ghasemi, B.; Nelson, M.P.; Slagle, K.M. A Flexible Inventory of Survey Items for Environmental Concepts Generated via Special Attention to Content Validity and Item Response Theory. Sustainability 2024, 16, 1916. [Google Scholar] [CrossRef]
  23. Darman, D.R.; Suhandi, A.; Kaniawati, I.; Wibowo, F.C. Development and Validation of Scientific Inquiry Literacy Instrument (SILI) Using Rasch Measurement Model. Educ. Sci. 2024, 14, 322. [Google Scholar] [CrossRef]
  24. Gao, L.; Zhao, Z.; Li, C.; Zeng, Q. Deep cognitive diagnosis model for predicting students’ performance. Future Gener. Comput. Syst. 2022, 126, 252–262. [Google Scholar] [CrossRef]
  25. Lynn, H.M.; Pan, S.B.; Kim, P.A. Deep Bidirectional GRU Network Model for Biometric Electrocardiogram Classification based on Recurrent Neural Networks. IEEE Access 2019, 7, 145395–145405. [Google Scholar] [CrossRef]
  26. Zhang, W.; Gong, Z.; Luo, P.; Li, Z. DKVMN-KAPS: Dynamic Key-Value Memory Networks Knowledge Tracing with Students’ Knowledge-Absorption Ability and Problem-Solving Ability. IEEE Access 2024, 12, 55146–55156. [Google Scholar] [CrossRef]
  27. Hua, W.; Liu, G. Transformer-based networks over tree structures for code classification. Appl. Intell. 2022, 52, 8895–8909. [Google Scholar] [CrossRef]
  28. Vaswani, A.; Shazeer, N.; Parmar, N.; Uszkoreit, J.; Jones, L.; Gomez, A.N.; Polosukhin, I. Attention Is All You Need. arXiv 2017, arXiv:1706.03762. [Google Scholar]
  29. Zhu, C.; Cheng, Y.; Gan, Z.; Goldstein, T.; Liu, J. FreeLB: Enhanced Adversarial Training for Language Understanding. arXiv 2019, arXiv:1909.11764. [Google Scholar]
  30. Dong, R.S. Introduction to Computer Science: Thinking and Methods, 3rd ed.; Higher Education Press: Beijing, China, 2015; pp. 1–335. [Google Scholar]
  31. Sedgewick, R. Computer Science: An Interdisciplinary Approach; Gong, X.L., Translator; Machine Press: Beijing, China, 2020; pp. 1–636. [Google Scholar]
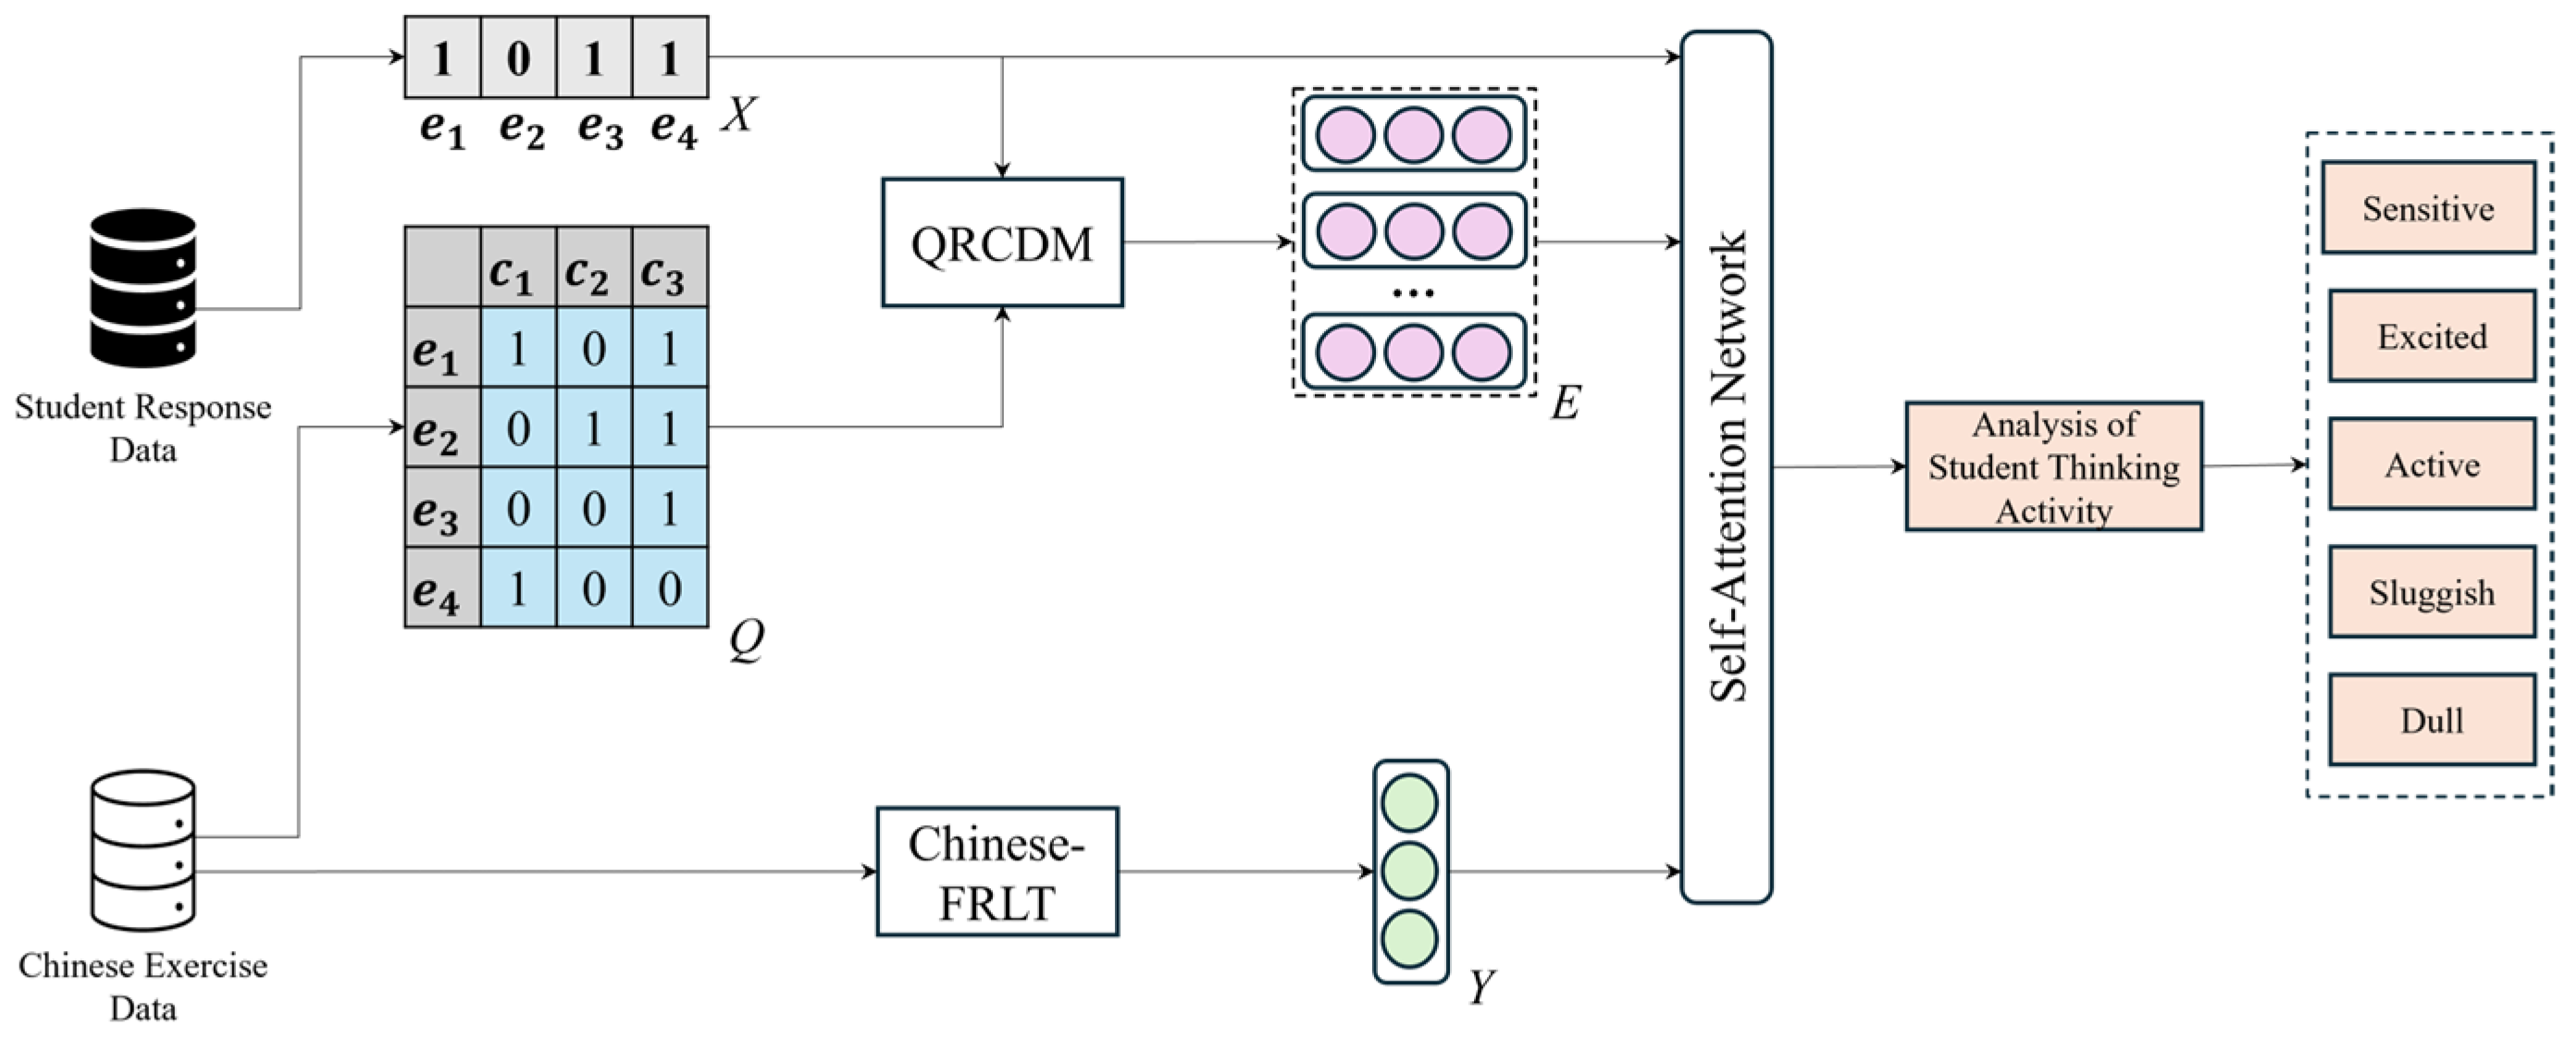
Figure 1. Flowchart of the model for characterizing active thinking states (the dotted box of E represents a multi-dimensional vector, while the dotted box of the noun on the right of the figure represents a noun that will be obtained through final classification).
Electronics 14 03957 g001
Figure 2. Block diagram of the Chinese-FRLT model (Each dotted box in the figure corresponds to a processing module that constitutes Chinese-FRLT, with the name below the dotted box).
Electronics 14 03957 g002
Figure 3. Framework of Chinese-RL-wwm (the Chinese in (a) input refers to the input Chinese text sequence, each dotted box in the figure corresponds to a processing module that constitutes Chinese-FRL, with the name below the dotted box).
Electronics 14 03957 g003
Figure 4. Box plot based on the difficulty of knowledge points in the Classroomdata dataset.
Electronics 14 03957 g004
Figure 5. Comparison of ACC curves between Chinese-FRL and baseline models for four datasets (the number of hidden layers in the RoBERTa base for Chinese-FRL in (a,b) is twelve, the number of hidden layers in the RoBERTa base for Chinese-FRL in (c,d) is six).
Electronics 14 03957 g005
Figure 6. Comparison of ACC curves between Chinese-FRLT and baseline models on four datasets (the number of hidden layers in the RoBERTa base for Chinese-FRL in (a,b) is twelve, the number of hidden layers in the RoBERTa base for both Chinese-FRL and Chinese-FRLT in (c,d) is six).
Electronics 14 03957 g006
Figure 7. AUC curve comparison between QRCDM and baseline models.
Electronics 14 03957 g007
Figure 8. Comparison chart of temporal thinking activity and temporal exercise performance among 52 students in the class (where i represents any student within this interval).
Electronics 14 03957 g008
Figure 9. Plot of the thinking activity state of all students in the class at a certain time point versus their performance in the exercise (where i denotes the learning moment).
Electronics 14 03957 g009
Figure 10. Comparison between students’ thinking activity and final grade.
Electronics 14 03957 g010
Table 1. Information for baseline models.
Baseline ModelModel Introduction
Chinese-RoBERTa-wwm [14]Large-scale pre-trained model that utilizes bidirectional Transformers and dynamic wwm to learn contextual semantic information from Chinese texts such as in-class exercises in Chinese courses.
Chinese-BERT-wwm-GCN-LP [15]A Chinese text classification model that uses Chinese-BERT-wwm to obtain contextual semantic features of Chinese texts such as in-class exercises in Chinese courses, employs GCN to learn the structural correlations between words in the text, and then fuses the two sets of features using cross-entropy and hinge loss.
Chinese-RoBERTa-wwm-GCN-LP [15]A Chinese text classification model that uses Chinese-RoBERT-wwm to obtain contextual semantic features of Chinese texts such as in-class exercises in Chinese courses, employs GCN to learn the structural correlation between words in the text, and then fuses the two sets of features using cross-entropy and hinge loss.
ModernBERT [16]The dimensions of the model’s feedforward network are first expanded in stages and a soft activation mechanism is introduced. Subsequently, a dynamic frequency coordinator is used to adaptively adjust the training frequency of different expansion modules, thereby constructing an efficient and high-performance large-scale pre-trained model.
Grouped-head Latent Attention (GTA) [17]By grouping multi-head attention and enabling each attention group to learn an independent, trainable shared attention basis function in the latent space, long-sequence dependencies are modeled efficiently while reducing the computational complexity.
Table 2. Experimental environment.
Experimental EnvironmentEnvironment Configuration
Operating systemLinux, Ubuntu 20.04.2 LTS
CPUIntel(R) Xeon(R) Gold 6330H, Intel Corporation, Santa Clara, CA, USA
GPUGeForce RTX 3090, NVIDIA, Santa Clara, CA, USA
RAM32 GB
ROM1 T SSD
Programming LanguagePython 3.8
FrameworkPytorch 2.0.0-gpu, cuda 11.8
Table 3. Performance metrics for Chinese-FRL and all baseline models with four Chinese datasets.
ModelDataset
Toutiao-STHUCNews Bloom-5classesBloom-6classes
#ACC#micro-F1#macro-F1#ACC#micro-F1#macro-F1#ACC#micro-F1#macro-F1#ACC#micro-F1#macro-F1
A0.93760.93770.93750.93960.93970.93960.71570.70190.69790.67520.67610.6739
B0.94240.94240.94230.93560.93570.93570.71080.70920.70150.67380.67540.6725
C0.94320.94320.94320.93850.93850.93840.72060.71890.71120.66100.66370.6584
D0.95570.95570.95550.95170.95160.95150.72340.72030.71870.68310.68420.6819
E0.96110.96110.96090.95630.95620.95610.72840.72630.72370.68640.68790.6850
F0.94600.94600.94580.94090.94090.94080.71080.69640.69270.67520.67430.6737
G-- -- 0.71570.70130.69910.67950.67820.6771
Table 4. Performance metrics for all models on the four Chinese datasets.
ModelDataset
Toutiao-S(2)THUCNews(2)Bloom-5classes(2)Bloom-6classes(2)
#ACC#micro-F1#macro-F1#ACC#micro-F1#macro-F1#ACC#micro-F1#macro-F1#ACC#micro-F1#macro-F1
A0.85320.85330.85310.91320.91350.91280.65920.65370.65140.65220.65390.6513
B0.86370.86370.86340.91160.91170.91140.66780.66230.66070.65590.65720.6541
C0.86040.86030.86020.91390.91380.91360.66120.65740.65590.64470.64540.6432
D0.91570.91570.91550.93340.93340.93310.69390.68820.68730.67010.67270.6984
E0.91820.91820.91810.93680.93670.93650.69890.69370.69260.67230.67430.6708
F0.86430.86440.86410.91510.91510.91500.63820.63380.63150.65730.65890.6559
G------0.64940.64430.64190.66340.66530.6618
H0.91250.91240.91230.93090.93100.93070.68890.68280.68010.67700.67850.6753
I------0.70040.69410.69120.67950.68110.6775
Table 5. The ablation experiment results for Chinese-FRLT.
ModelDataset
Toutiao-S(2)THUCNews(2)Bloom-5classes(2)Bloom-6classes(2)
#ACC#micro-F1#macro-F1#ACC#micro-F1#macro-F1#ACC#micro-F1#macro-F1#ACC#micro-F1#macro-F1
Chinese-FRL0.86430.86440.86410.91510.91510.91500.64940.64430.64190.66340.66530.6618
Chinese-RLT0.89110.89110.89080.92790.92800.92740.69570.69310.69170.66950.66430.6682
Chinese-FRT0.88160.88170.88130.92870.92870.92860.69640.69290.69080.67240.66780.6703
Chinese-FRLT0.91250.91240.91230.93090.93100.93070.70040.69410.69120.67950.68110.6775
Table 6. Performance of Chinese-FRLT with different numbers of RoBERTa hidden layers.
Num of Hidden LayersDatasets
Bloom-5classes(2)Bloom-6classes(2)
#ACC#micro-F1#macro-F1#ACC#micro-F1#macro-F1
Four0.67840.67650.67540.6337 0.6319 0.6312
Six0.70040.69410.69120.67950.68110.6775
Eight0.70040.69870.69580.6484 0.6473 0.6459
Ten0.70040.69830.69530.66400.66250.6617
Twelve0.68890.68280.68010.67700.67850.6753
Table 7. Performance metrics for QRCDM and baseline models on the Classroomdata dataset.
DatasetModelAUCACCMAERMSE
ClassroomdataDKT0.7150.7360.2640.514
DKVMN0.7250.7890.2640.466
QRCDM0.7750.7800.2200.469
Table 8. Thinking activity state time-series for all students.
Student IDLearning Moments
123456743
1TorpidTorpidTorpidTorpidActiveActiveTorpidExcited
2TorpidTorpidTorpidTorpidActiveExcitedTorpidExcited
3TorpidTorpidTorpidTorpidActiveActiveTorpidExcited
4ActiveActiveActiveActiveActiveExcitedActiveSensitive
… …
52TorpidTorpidTorpidTorpidActiveActiveTorpidExcited
Table 9. The state of active thinking, normalized final grade value, and corresponding grade intervals for students.
Student IDActive Thinking StateNormalized Final Grade ValuePerformance IntervalStudent IDActive Thinking StateNormalized Final Grade ValuePerformance Interval
1Active0.27Bad27Torpid0.16Terrible
2Active0.415Medium28Active0.525Medium
3Active0.50Medium29Excited0.78Well
… …… …
26Torpid0.12Terrible52Active0.29Bad
Disclaimer/Publisher’s Note: The statements, opinions and data contained in all publications are solely those of the individual author(s) and contributor(s) and not of MDPI and/or the editor(s). MDPI and/or the editor(s) disclaim responsibility for any injury to people or property resulting from any ideas, methods, instructions or products referred to in the content.