Article

VimGeo: An Efficient Visual Model for Cross-View Geo-Localization

1
School of Electronic and Electrical Engineering, Shanghai University of Engineering Science, Shanghai 201620, China
2
Yangzhou Petroleum Branch, Yangzhou 225002, China
3
School of Information Technology, Murdoch University, Perth 6150, Australia
*
Author to whom correspondence should be addressed.
Electronics 2025, 14(19), 3906; https://doi.org/10.3390/electronics14193906
Submission received: 25 August 2025 / Revised: 24 September 2025 / Accepted: 25 September 2025 / Published: 30 September 2025

Abstract

Cross-view geo-localization is a challenging task due to the significant changes in the appearance of target scenes from variable perspectives. Most existing methods primarily adopt Transformers or ConvNeXt as backbone models but often face high computational costs and accuracy degradation in complex scenarios. Therefore, this paper proposes a visual Mamba framework based on the state-space model (SSM) for cross-view geo-localization. Compared with the existing methods, Vision Mamba is more efficient in modeling and memory usage and achieves more efficient cross-view matching by combining the twin architecture of shared weights with multiple mixed losses. Additionally, this paper introduces Dice Loss to handle scale differences and imbalance issues in cross-view images. Extensive experiments on the public cross-view dataset University-1652 demonstrate that Vision Mamba not only achieves excellent performance in UAV target localization tasks but also attains the highest efficiency with lower memory consumption. This work provides a novel solution for cross-view geo-localization tasks and shows great potential to become the backbone model for the next generation of cross-view geo-localization.

1. Introduction

Cross-view geo-localization refers to matching an image from one perspective (e.g., drone or street view images) with a pre-existing image database with known locations (e.g., satellite images) so as to infer the geographic coordinates [1]. In recent years, cross-view geo-localization has attracted widespread attention due to its research value and practical applications in the fields such as remote sensing, agriculture, and autonomous driving [2]. However, the significant differences in resolution, viewpoint, and geographic scale between the cross-view images make this task highly challenging. Cross-view image matching requires extracting robust features from visually distinct images, prompting researchers to develop various models and methods to enhance adaptability and accuracy. Traditional computer vision methods, such as the key-point-based matching algorithms like SIFT (Scale-Invariant Feature Transform) and SURF (Speeded-Up Robust Features), usually perform poorly in cross-view scenarios as these methods primarily rely on local features and geometric information [3,4], which struggle to maintain robustness under large viewpoint variations. Consequently, deep learning models have become mainstream for cross-view matching [5], leveraging semantic features learned from large-scale data to better adapt to cross-view characteristics.
Currently, convolutional neural networks (CNNs) and Vision Transformers (ViTs) have achieved the state-of-the-art performance in the filed of cross-view geo-localization [6,7,8,9,10,11]. CNNs extract features through stacked convolutional operations, while ViTs model long-range dependencies via self-attention mechanisms. However, these models still exhibit limitations in cross-view geo-localization. Compared to general vision tasks, cross-view scenarios typically involve complex, multi-object, and multi-scale scenes. CNNs, limited by their local receptive fields, struggle to capture complex feature representations [12], while ViTs, despite their ability to model long-range dependencies, present significant challenges in model efficiency and memory usage due to their high complexity [13,14]. Recently, Mamba, a state-space model (SSM)-based approach [15], has emerged as a novel paradigm [16,17,18]. By introducing a selection mechanism to control information propagation along sequence dimensions, Mamba achieves long-range dependency modeling with linear computational complexity. While Mamba has shown success in remote sensing tasks closely related to cross-view geo-localization [19,20], its application as a backbone model in cross-view geo-localization remains underexplored. Furthermore, most existing methods predominantly employ Triplet Loss or its variants [21,22], which may overemphasize abundant negative samples in class-imbalanced scenarios, causing difficulties in learning the features of positive samples. Dice Loss, a specifically used loss function in medical image segmentation, focuses more on foreground regions and can better address class imbalance issues [23]. It can be leveraged as a supplementary loss for cross-view geo-localization.
In this paper, we propose a novel method for introducing Vision Mamba into cross-view geo-localization. By using a shared-weight twin Vision Mamba as the backbone and employing hybrid loss functions, we aim to achieve more efficient and faster implementations. Moreover, we introduce Dice Loss to deal with the imbalance and scale differences in cross-view images. The following summarizes our contribution in this work:
  • A Vision Mamba framework based on state-space models (SSMs) is proposed, which has advantages in efficiency and representational capability. It shows great potential to replace Transformer and ConvNeXt as the foundational model for cross-view geo-localization.
  • Dice Loss is introduced to solve the problem of regional scene size imbalance across different perspectives in cross-view tasks, aiming to enhance the model’s performance and robustness.
  • The framework achieved superior performance in drone-view target localization on the public dataset University-1652, while maintaining the highest efficiency and the lowest GPU memory usage.

2. Related Works

2.1. Cross-View Geo-Localization

Traditional image matching algorithms (such as SIFT [24], ORB [25], and SURF [26]) rely on handcrafted local feature descriptors that construct feature vectors by extracting keypoints and neighborhood gradient information for similarity measurement in feature space. While performing well under minor viewpoint changes, these methods suffer significantly degraded generalization in cross-view scenarios due to complex geometric transformations and inconsistent semantic distributions between image pairs, leading to poor performance in complex scenes. For instance, SIFT detects keypoints through Difference-of-Gaussian pyramids and generates 128-dimensional descriptors robust to rotation/scale changes but struggles with computational complexity and feature degradation under extreme perspective differences; ORB combines FAST corner detection with BRIEF binary descriptors to improve real-time performance but exhibits limited adaptability to affine transforms and illumination changes. Core limitations include vulnerability to geometric deformation (e.g., texture feature failure from orthographic vs. perspective projection differences in ground/aerial building images) and feature space misalignment from semantic gaps (e.g., lack of correspondence between drone-captured rooftops and ground-view facades). Post-processing via complex geometric models like homography estimation also fails with dynamic occlusions and large viewpoint shifts. Improved methods like HGA algorithm [27] (enhancing rotation/blur robustness through block gradients and dartboard structures) and FREAK (generating descriptors via quantized intensity differences) still cannot fundamentally resolve semantic gaps, while the evident ceiling effect of handcrafted features accelerates the paradigm shift toward deep learning.
With advancing cross-view datasets, deep learning methods leveraging end-to-end global semantic feature learning have become mainstream. Workman et al. pioneered CVUSA [28] and CVACT [29] datasets containing panoramic ground/satellite image pairs, providing foundational data albeit with homogeneous scenes and limited dynamic variations. Zhu et al. subsequently proposed VIGOR [9], addressing traditional datasets’ lack of illumination/weather diversity and scene variety. Recent datasets University-1652 [30] (1652 university buildings with multi-altitude drone views) and SUES-200 [31] (200 locations) significantly expanded coverage, where University-1652’s spiral drone photography enables ground/drone/satellite three-view associations, elevating generalization demands and creating new cross-view matching pathways. Since University-1652’s introduction, deep learning approaches based on diverse backbone models have been continuously refined: Zhai et al. applied NetVLAD [32] in Siamese-like structures to enhance viewpoint invariance through global descriptor aggregation; Shi et al. [11] boosted performance using spatial-aware layers; SIRNet [33] added refinement modules to CNN backbones with Softmax-based adaptive processes; TransGeo [10] utilized Transformer multi-head attention to capture cross-scale spatial relationships and reduce geometric deformation interference; Shen et al. proposed MCCG [6] adopting ImageNet-1K pre-trained ConvNeXt backbones with feature cropping and multi-classifier prediction, establishing pre-trained ConvNeXt as the field’s mainstream solution; Deuser et al. [34] implemented symmetric contrastive loss from multimodal pre-training where batch positives contrast with negatives while symmetrically learning discriminative features across views, significantly improving accuracy. Crucially, multimodal pre-training markedly enhanced cross-view semantic alignment efficiency. Despite significant progress, challenges remain including semantic ambiguity under extreme viewpoint differences, balancing real-time requirements with computational resources, and adapting to multi-temporal data.

2.2. Mamba

In recent years, with the rapid development of deep learning technologies, innovations in model architecture have become the core driving force for artificial intelligence advancement. Transformer models dominate natural language processing and computer vision through their global attention mechanisms, yet their inherent quadratic computational complexity (O(N2)) limits scalability in long-sequence tasks. When processing high-resolution imagery like 4K content, GPU memory consumption and computational latency increase exponentially, severely constraining practical applications. Against this backdrop, Mamba [16] has emerged as a novel sequence modeling architecture based on structured state-space models (SSMs), attracting widespread attention across domains for its near-linear complexity and efficient information selection mechanism. This framework parameterizes SSMs as input-dependent functions and leverages dynamic evolution equations for hidden states, enabling adaptive capture of critical information while filtering irrelevant content, thereby demonstrating exceptional long-range dependency modeling capabilities in large-scale data processing. Compared to Transformers’ quadratic complexity (O(N2)) from self-attention mechanisms, Mamba reduces complexity to linear (O(N)) through time-varying parameterization and hardware-aware parallel scan algorithms while preserving long-range dependency modeling advantages. In other computer vision domains such as medical image segmentation and remote sensing, Mamba architecture has been effectively integrated with networks like UNet, achieving promising results [35,36,37]. In the field of cross-view geolocation, preliminary explorations of Mamba have been conducted. Tian et al. proposed CMIN [38], which incorporates a Siamese Feature Extraction Module (SFEM) and a Local Cross-Attention Module (LCAM) alongside Mamba, achieving promising results on the UL14 dataset.

2.3. Loss Function

The technological evolution of cross-view image geolocation has consistently centered on feature representation learning, with loss functions—as core mechanisms driving feature optimization—undergoing innovative development from traditional handcrafted features to deep learning representations and further to multimodal fusion. Initially, manually designed features were employed; with breakthroughs in deep learning, features extracted by models like convolutional neural networks (CNNs) replaced traditional handcrafted features [28]. While backbone networks such as VGG and ResNet automatically learn hierarchical visual representations, optimizing feature space structure became critical. To better achieve this, Vo et al. [39] introduced Soft-margin Triplet Loss as the standard for cross-view geolocation. Unlike the rigid boundary constraints of traditional Triplet Loss, this method incorporates learnable margin parameters that dynamically adjust distance thresholds between positive and negative sample pairs, effectively addressing large difficulty variations in cross-view scenarios. Hu et al. [22] enhanced global descriptor generation by modifying the NetVLAD layer, proposing a Weighted Soft-margin Ranking Loss that innovatively introduces a distance scaling mechanism where distances between positive and negative samples undergo nonlinear transformations; by setting weight coefficients to prioritize hard samples, this approach improves model robustness in complex scenes. To tackle multimodal interference in challenging environments, Arandjelović et al. [32] used Quadruplet Loss with two negative samples to better capture relative relationships between samples, extending standard triplets by adding a second negative sample to construct quadruplet constraints that enhance feature discriminability through dual comparisons while improving intra-class compactness and inter-class separation. Additionally, Weyand et al. [40] transformed geolocation into a classification problem, optimizing regional classification accuracy via Cross-Entropy Loss for location prediction. Due to its stability and ease of optimization, Cross-Entropy Loss has been widely adopted as a foundational loss in cross-view geolocation. This paradigm shift reduces computational complexity but introduces the challenge of resolving contradictions between continuous geographic distribution and discrete grid partitioning. Deuser et al. [34] applied symmetric contrastive loss from multimodal pretraining, enforcing feature space alignment across bidirectional views (e.g., satellite-to-ground and ground-to-satellite) where within each batch, positives consistently contrast with negatives while symmetrically learning discriminative features across both perspectives, thereby enhancing viewpoint consistency and generalization through this training strategy.

3. Proposed Method

As shown in Figure 1, this chapter will first introduce the fundamental principles of SSM, followed by an explanation of how Vision Mamba incorporates SSM, or Mamba, into the field of cross-view geographic image matching. Secondly, in deep metric learning for cross-view geo-localization, Triplet Loss is typically used as the default and is extended in various ways. Fabian Deuser et al. [34] designed a symmetric InfoNCE Loss, which has been proven universally effective on datasets for cross-view geo-localization. Building upon this, Dice Loss and KL divergence are utilized to optimize the model for Mamba.

3.1. Vision Mamba

Vision Mamba primarily consists of several components: input images undergo patch embedding and positional encoding similar to Vision Transformers, decomposing into patch sequences; followed by processing through Mamba blocks employing bidirectional scanning and parallel computation to reduce latency and increase throughput; concluding with downsampling modules to enhance spatial context modeling, expand receptive fields, and improve efficiency. Mamba is built upon state-space models (SSMs). Its core idea is to decompose complex dynamic systems into two interrelated components: the evolution of system states and the changes in observations. State-space models describe the system’s evolution through state equations and observation equations, mapping a one-dimensional function or sequence x ( t ) R y ( t ) R via a hidden state h ( t ) R M . This system uses A R N × N as the evolution parameter and B R N × 1 and C R 1 × N as projection parameters. The process can be expressed in the following linear ordinary differential equations (ODEs).
h ( t ) = A h ( t ) + B x ( t ) y ( t ) = C h ( t )
Mamba implements this system in a discretized form, introducing a time-scale parameter Δ . It applies zero-order hold (ZOH) to the continuous parameters A and B, transforming them into discrete parameters, defined as follows:
A ¯ = exp ( Δ A ) B ¯ = ( Δ A ) 1 exp ( Δ A ) I · Δ B
After discretization, the original equation can be rewritten as
h t = A ¯ h t 1 + B ¯ x t y t = C ¯ h t
The final output can be computed using convolution:
K ¯ = ( C B ¯ , C A B ¯ , , C A ¯ L 1 B ¯ ) y = x K ¯
where L is the length of the input sequence x, and K R L is a structured convolution kernel. Vision Mamba draws inspiration from the model designs of ViT and BERT. It transforms an image τ R H × W × C into a one-dimensional sequence of image patch embeddings using two-dimensional convolution. To preserve the relative spatial position information within the image, positional encoding tokens P are inserted. To address the serialization bottleneck in traditional state-space models (SSMs), Vision Mamba innovatively introduces a parallel scan algorithm through hardware-aware parallelization, reducing sequence modeling complexity from O(L) to O(log L) (where L is sequence length) while preserving long-range dependency modeling. This algorithm transforms hidden state recurrence into parallelizable prefix-sum operations, leveraging GPU/TPU parallel architectures for computational acceleration. Traditional SSM recurrence follows h t = A ¯ h t 1 + B ¯ x t , requiring sequential computation that scales linearly with sequence length. Vision Mamba adopts Blelloch’s parallel prefix-sum algorithm, decomposing recurrence into two phases: upsweep partitions sequences into blocks for parallel local prefix-sum computation; downsweep propagates global prefix sums using intermediate results via binary tree structures with depth l o g 2 L , optimizing overall complexity to O(log L).
Bidirectional scanning employs forward and backward paths: the forward path processes patches from top-left in raster-scan order to capture local-to-global dependencies; the backward path inversely scans from bottom-right to model reverse long-range correlations—both paths share SSM parameters but maintain independent hidden states. To integrate the complementary information from both scanning directions, the hidden state features from the forward scan h f o r w a r d and the backward scan h b a c k w a r d are combined through element-wise summation: h f i n a l = h f o r w a r d h b a c k w a r d . This operation is performed for each token position, resulting in a comprehensive final representation h f i n a l that encompasses the full bidirectional context. The integrated features are then passed to subsequent network layers for further processing. Output tokens are dynamically weighted through gating to integrate spatial dependencies from both directions.

3.2. Dice Loss

Traditional deep metric learning for image retrieval tasks commonly employs Triplet Loss as the supervisor, training models by progressively reducing distances between identical targets across different scenes. In cross-view matching, drone and satellite views likewise represent identical geographic locations from distinct perspectives; hence, conventional methods predominantly adopt Triplet Loss. However, as methodologies evolve, limitations of triplet-based approaches—including sample selection sensitivity, model collapse risks, and low information utilization—have become apparent. Dice Loss, commonly used in medical image segmentation, excels at measuring the similarity of spatial overlapping regions and can effectively handle data with different feature distributions. Based on this, we introduce Dice Loss to improve the similarity metric for cross-view image matching tasks, ensuring better robustness and convergence in feature matching. Dice Loss is a loss function derived from the Dice Similarity Coefficient (DSC), which was initially applied in medical image segmentation. Its primary purpose is to measure the overlap between the model’s prediction and the ground truth, thereby assessing the model’s segmentation performance. Dice Loss is particularly suitable for imbalanced data scenarios and is especially sensitive to small targets or sparsely distributed features. Mathematically, the Dice coefficient measures the overlap between two sets, defined as
D S C ( P , G ) = 2 | P G | | P | + | G |
where
  • P represents the model’s predicted results.
  • G represents the ground truth labels.
The Dice coefficient ranges from 0 to 1, with a higher value indicating greater overlap between the two sets. Dice Loss is the complement of the Dice coefficient, defined as
D i c e L o s s ( P , G ) = 1 2 | P G | | P | + | G |
In binary classification problems, the discrete form of the Dice coefficient can be expressed as
Dice = 2 i = 1 N y pred ( i ) y true ( i ) + ϵ i = 1 N y pred ( i ) + i = 1 N y true ( i ) + ϵ
where y pred [ 0 , 1 ] H × W is the model’s output probability map, y true [ 0 , 1 ] H × W is the ground-truth binary label, N is the total number of pixels, and ϵ is a smoothing term (preventing division by zero). For multi-class tasks, the common practice is to compute the Dice Loss category-wise and then average the results:
L Dice - Multi = 1 C c = 1 C 1 2 i = 1 N y pred , c ( i ) y true , c ( i ) i = 1 N y pred , c ( i ) + i = 1 N y true , c ( i ) + ϵ
where C is the number of classes.
In cross-view matching tasks, networks must process images from diverse perspectives while capturing structural differences in scenes, where a primary challenge is the significant geometric variations and regional scale differences across viewpoints. Dice Loss enhances matching performance by maximizing overlapping regions (intersections) to reduce mispredictions, thereby reinforcing feature consistency across images from different perspectives—unlike traditional Cross-Entropy or Triplet Losses that primarily focus on local discrepancies rather than global consistency. For handling data imbalance, Dice Loss offers distinct advantages by avoiding domination from large background areas and better concentrating on target regions while inherently emphasizing positive samples, making it suitable for imbalanced positive/negative scenarios. This loss effectively improves similarity measurement in cross-view matching, granting models enhanced robustness and convergence. In this study, Dice Loss is adapted for contrastive learning by: Softmax-normalizing output features; redefining reference image features as ground truth G and query image features as predictions P; computing Dice Loss between P and G; and jointly optimizing results with symmetric InfoNCE Loss to guide training. An ablation study on the loss weights confirmed that an equal weighting scheme ( λ Infonce = λ Dice = λ KL ) yielded optimal performance, with the model showing robustness to minor variations around these values.

4. Experiments

4.1. Datasets and Evaluation Protocols

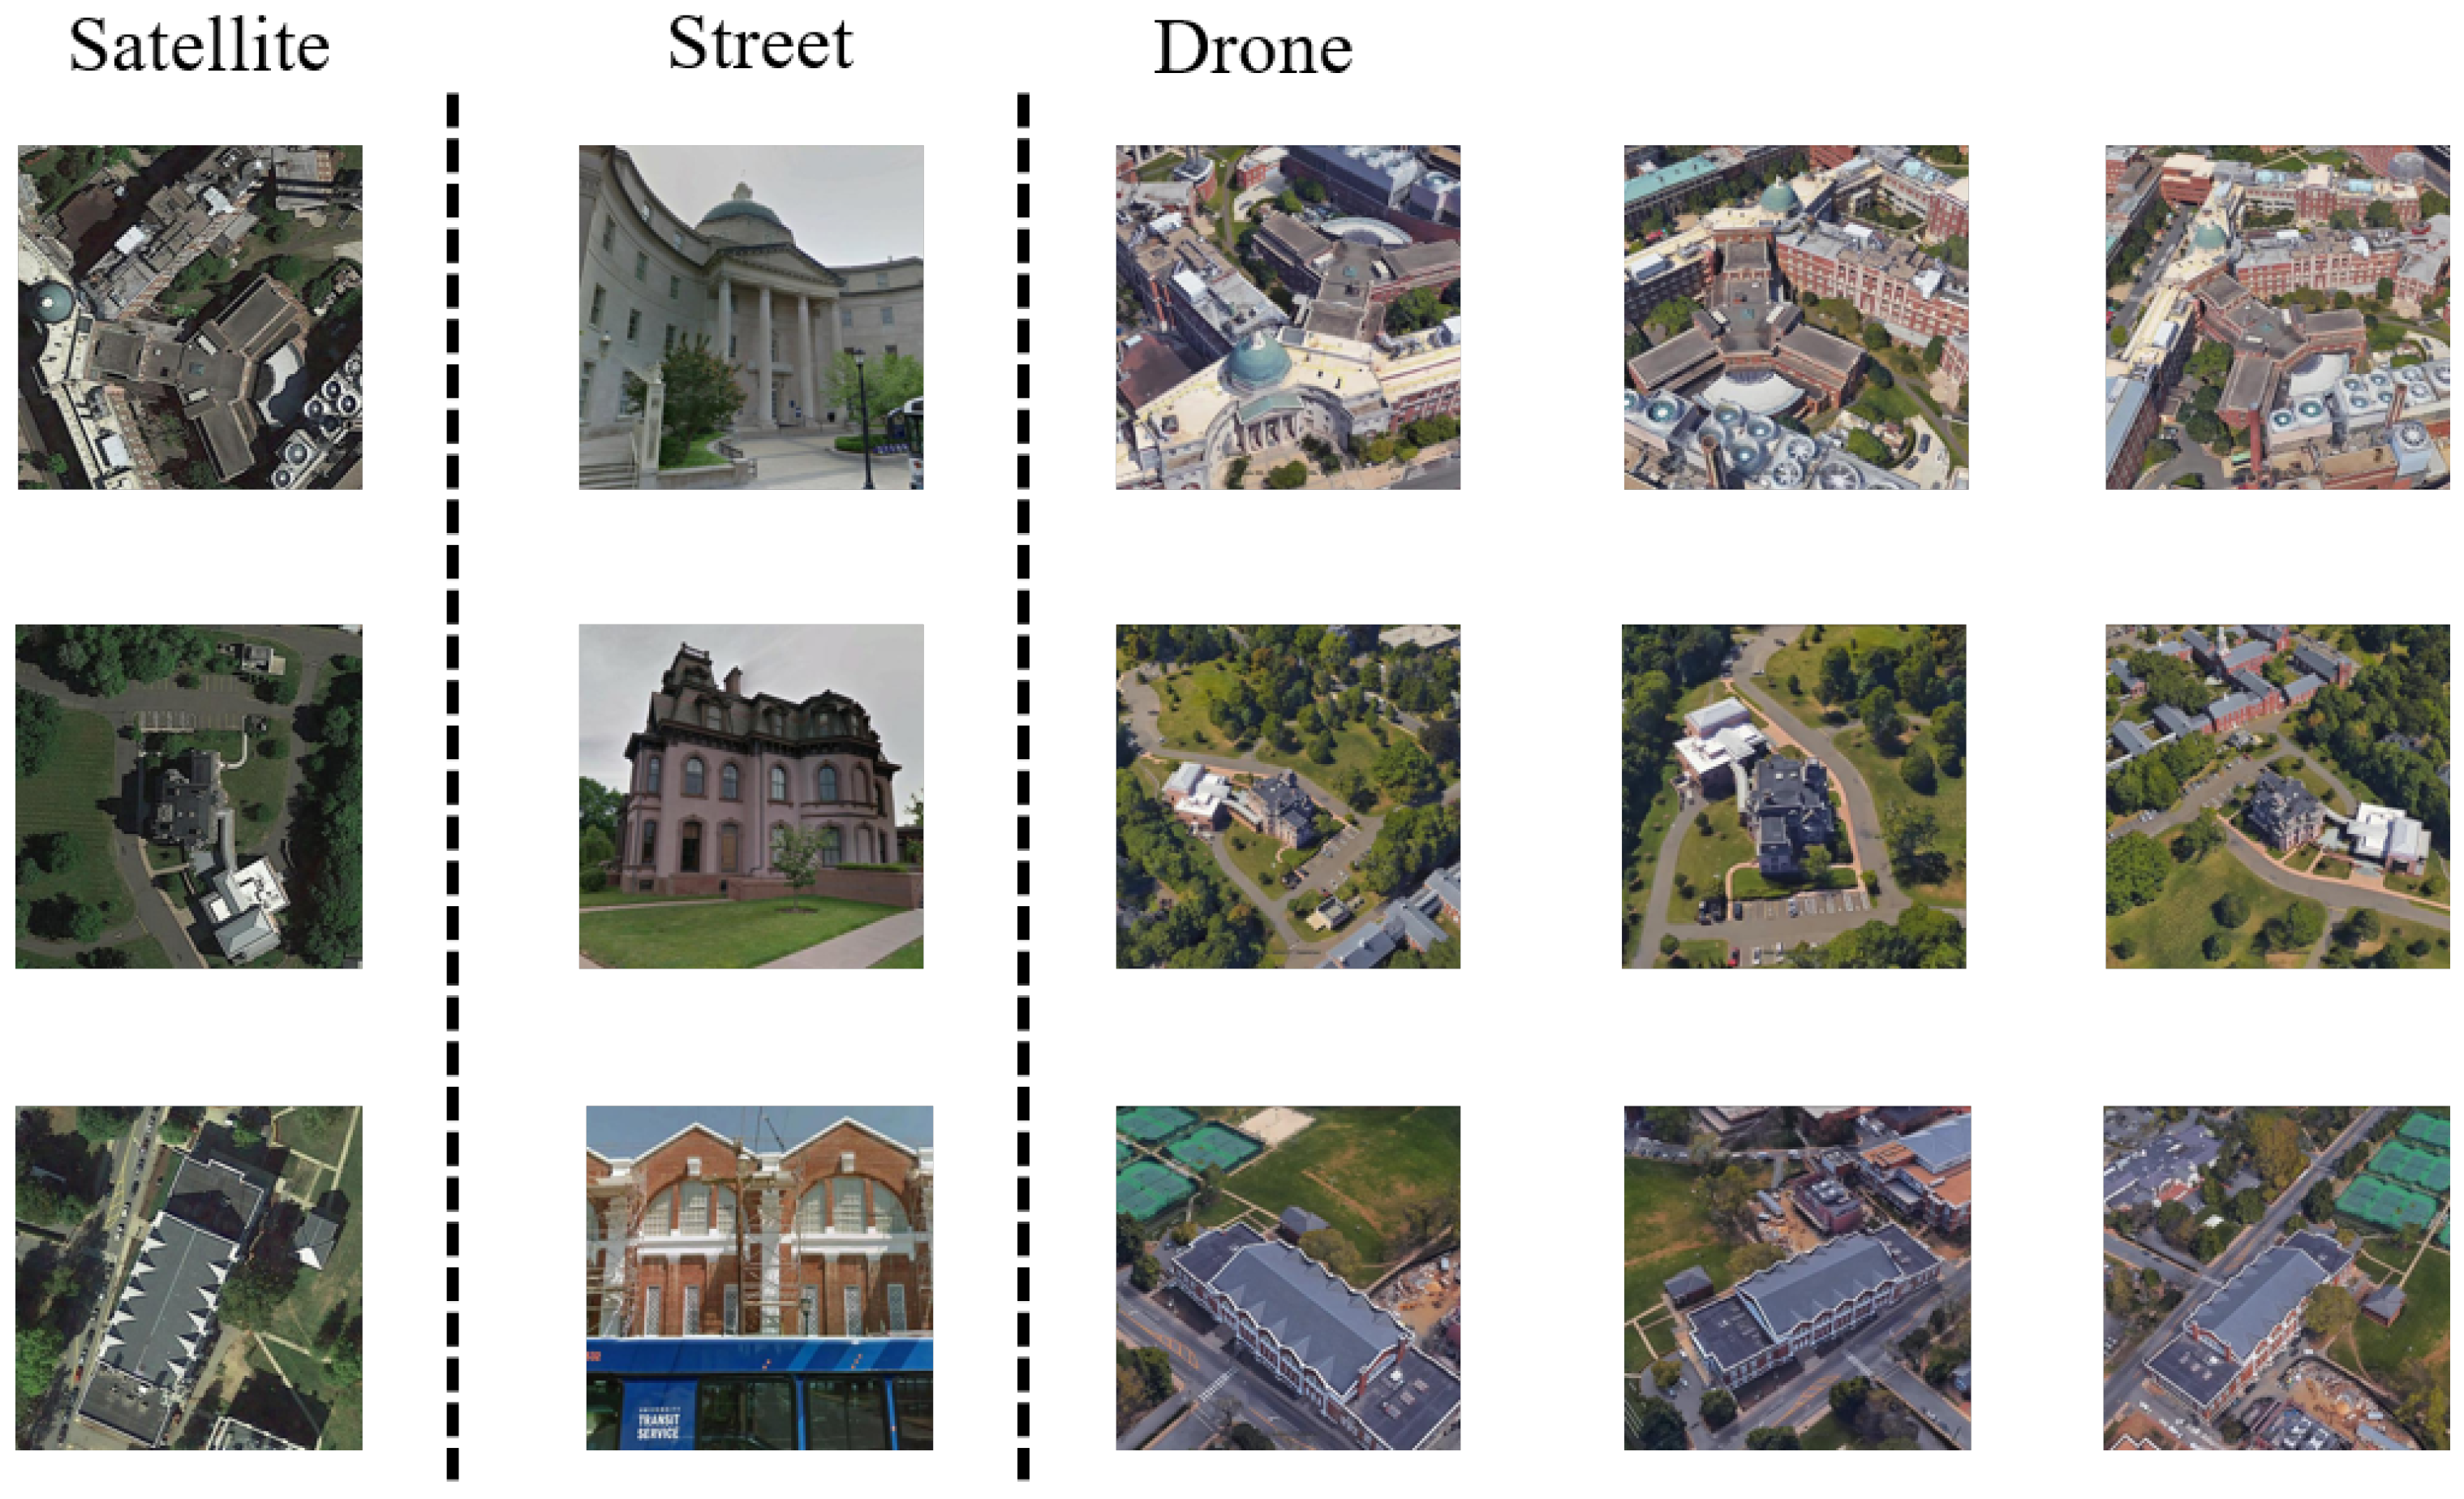
Our work primarily focuses on matching drone views and satellite views. Therefore, we train and evaluate our method on a public large-scale geo-localization dataset widely used in recent studies, namely, University-1652 [30]. This dataset contains images from three platforms, including ground camera, drone, and satellite images of 1652 university buildings from 72 universities around the world. It is widely used in cross-view geo-localization research, with the task of matching drone views to corresponding satellite images and vice versa. Another notable feature of this dataset is that some buildings in the test set have only satellite images without corresponding drone views. Our model is trained on the training set, and all reported results are on the official test subset. In addition to the recall rate, the average precision (AP) is also indicated. Figure 2 shows some samples of images with different views from the University-1652 dataset.

4.2. Implementation Details

In the experiments of this study, we employed Vision Mamba pre-trained on ImageNet as backbone initialization weights. During training, input images were resized to 384 × 384 pixels with data augmentation applied through random cropping, random horizontal flipping, label smoothing regularization, and random erasing. Because the University-1652 benchmark contains one-to-many matching tasks, we employed a custom sampler to ensure that each batch contains at most one image per class. This prevents the InfoNCE Loss from incorrectly treating other intra-class positives as negative samples. For model optimization, all experiments utilized the AdamW optimizer with an initial learning rate of 0.001 and weight decay of 0.01. The learning rate followed a cosine annealing scheduler accompanied by linear warmup at a 0.1 multiplier. Classification network parameters were initialized via Kaiming Initialization. The implementation was built using Python’s PyTorch (Python Version: 3.11, PyTorch Version: 2.1.2 + CUDA12.1) deep learning framework, with all experiments conducted on a single NVIDIA RTX 4090 GPU.

4.3. Comparison with the State-of-the-Art Methods

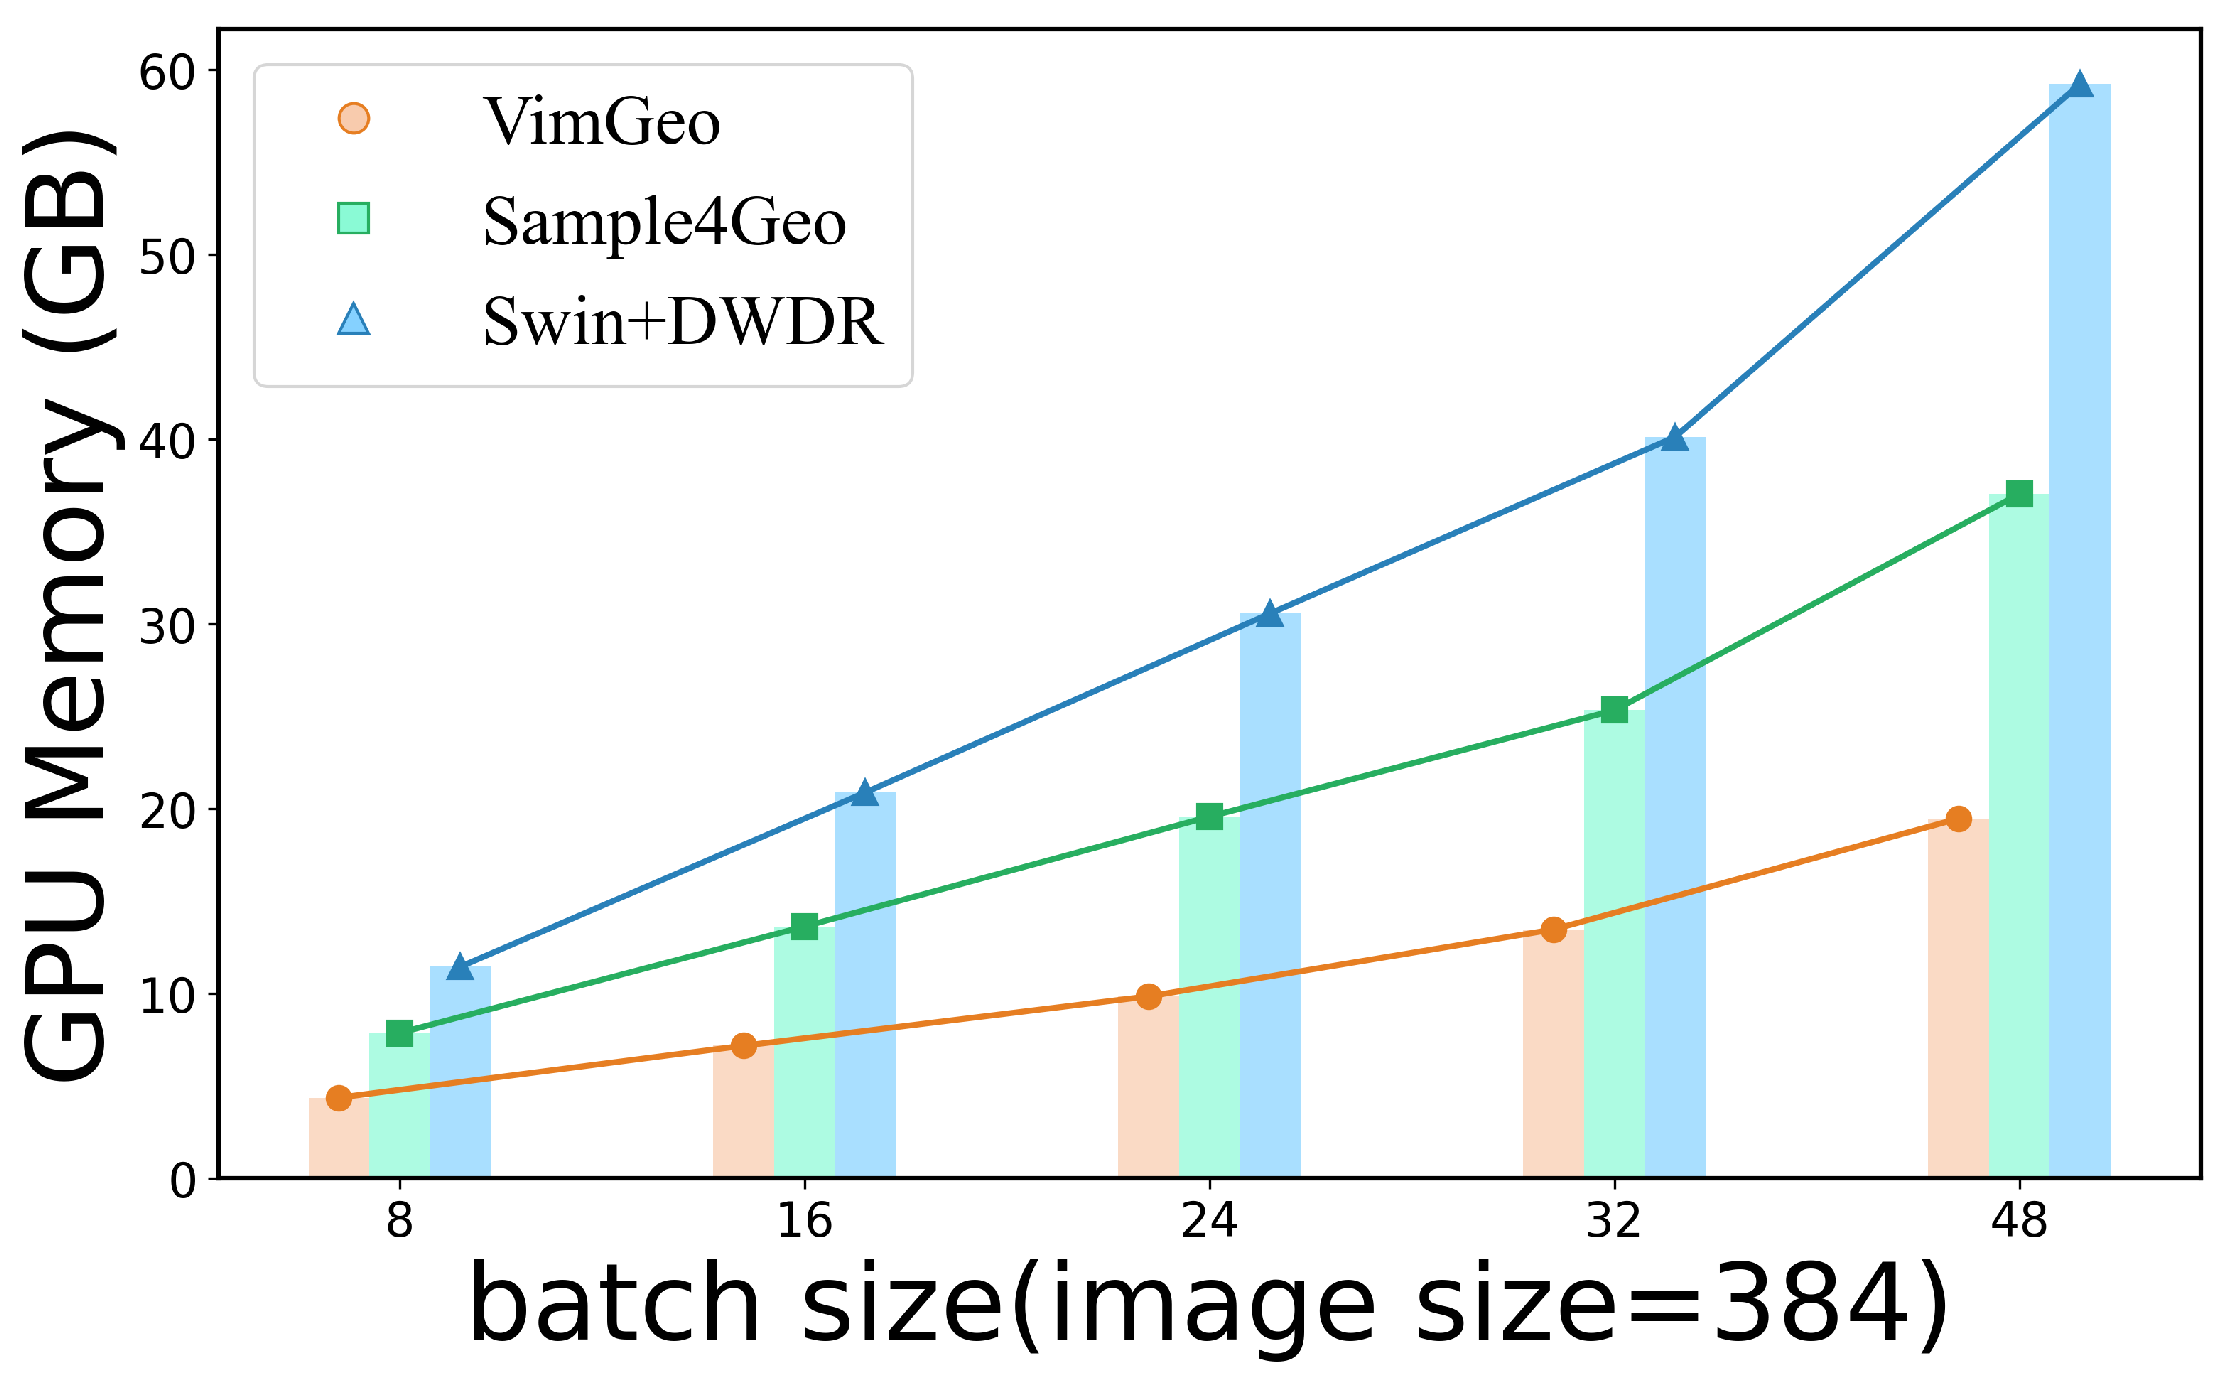
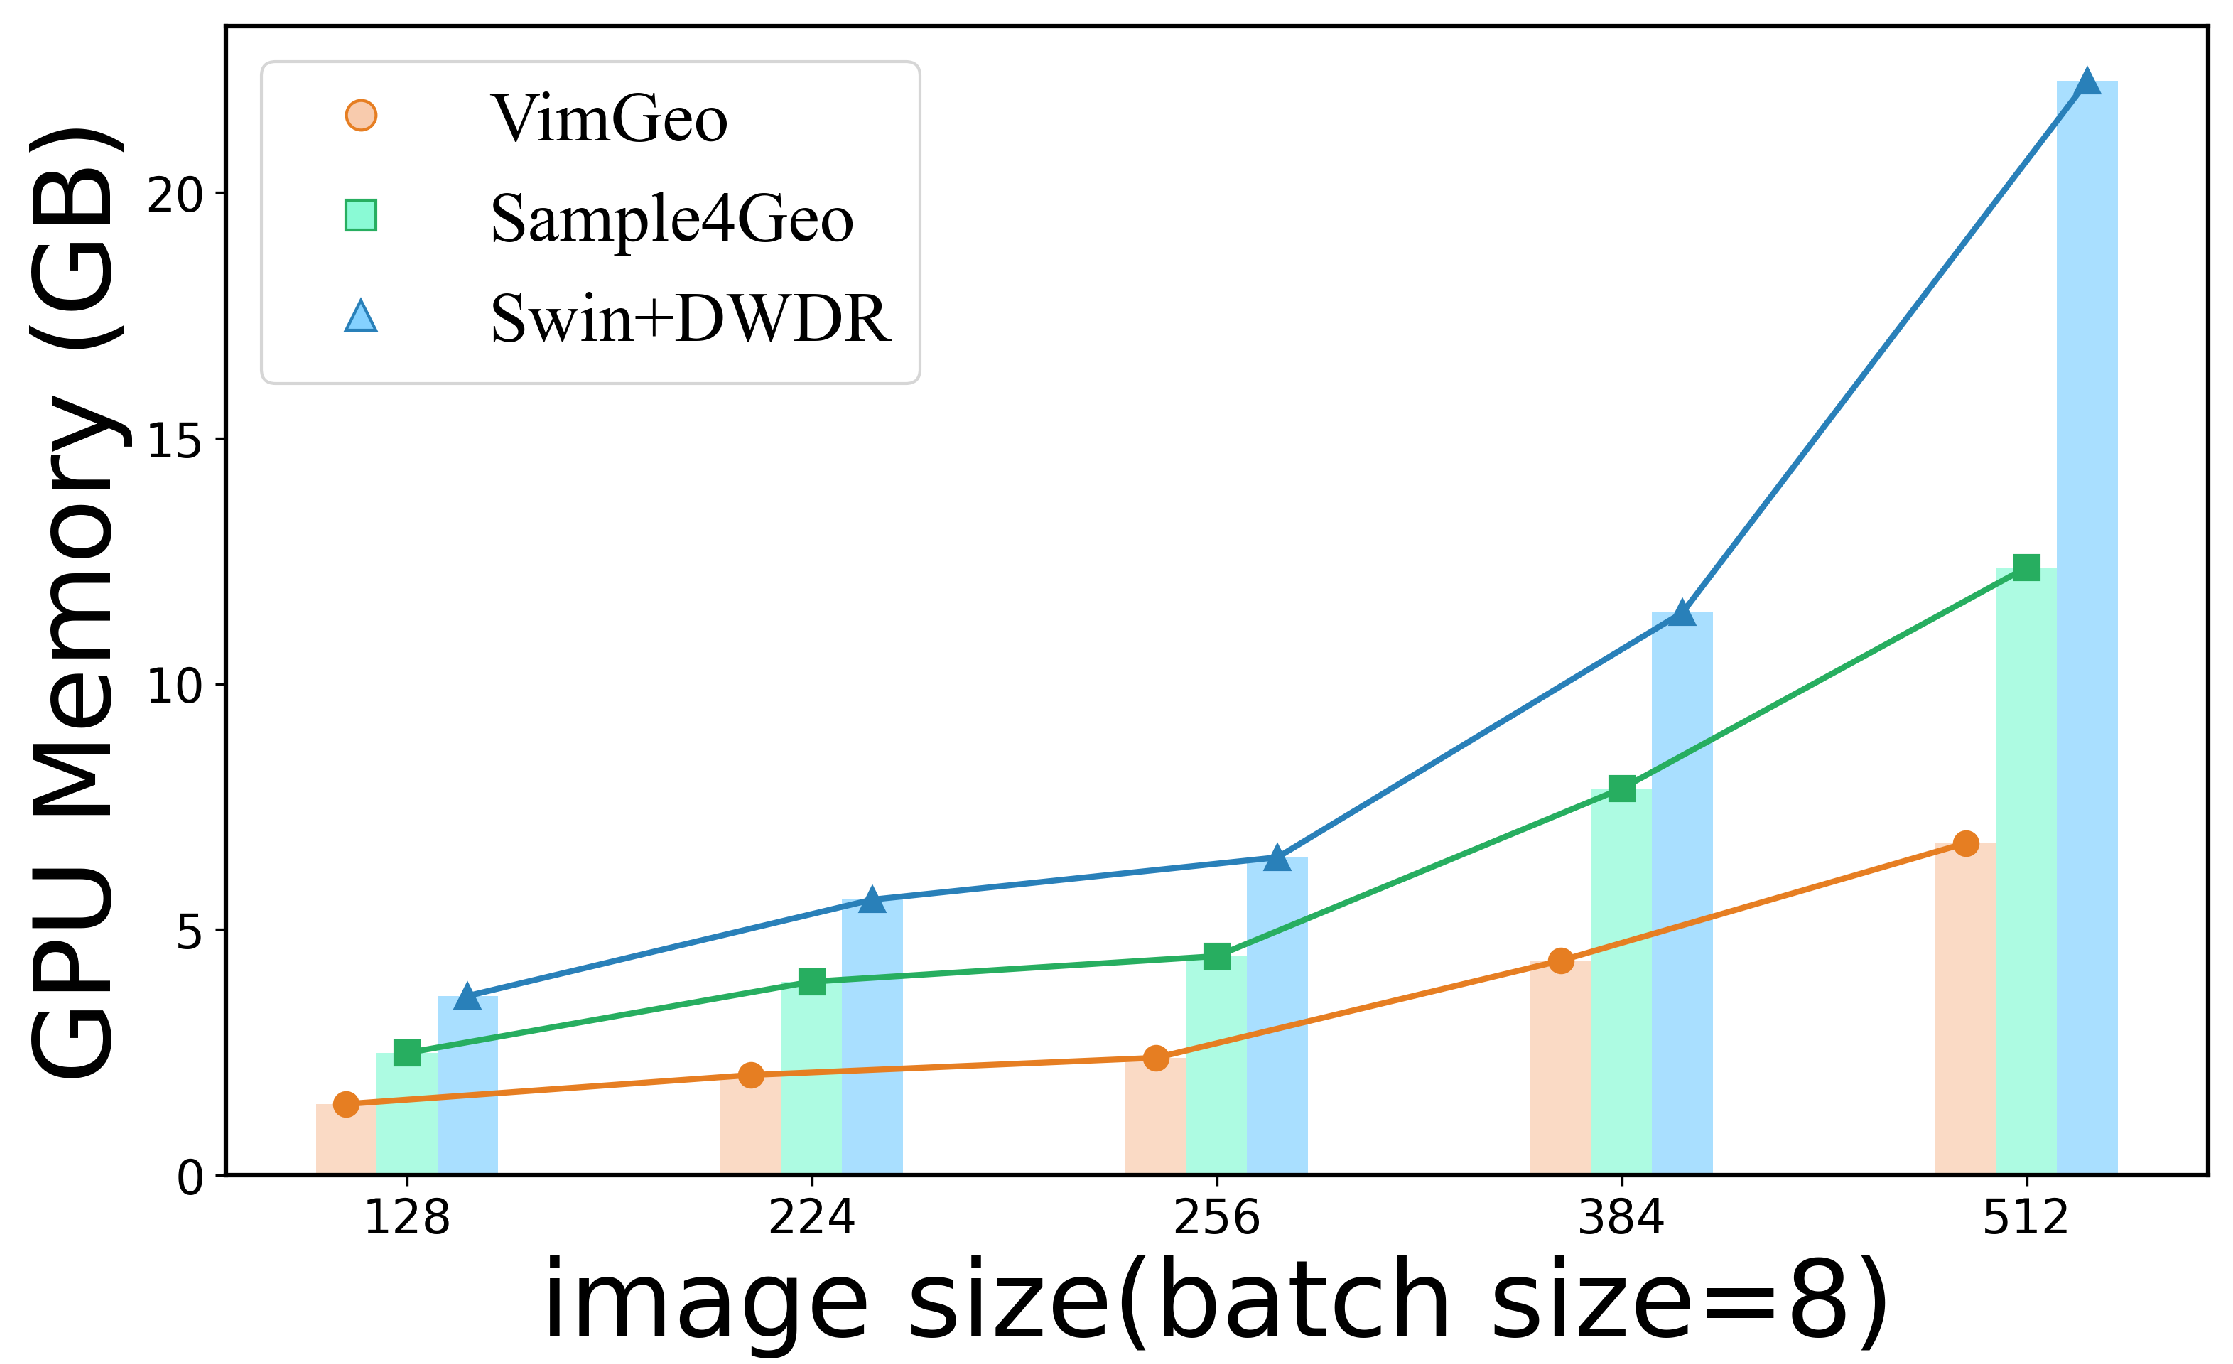
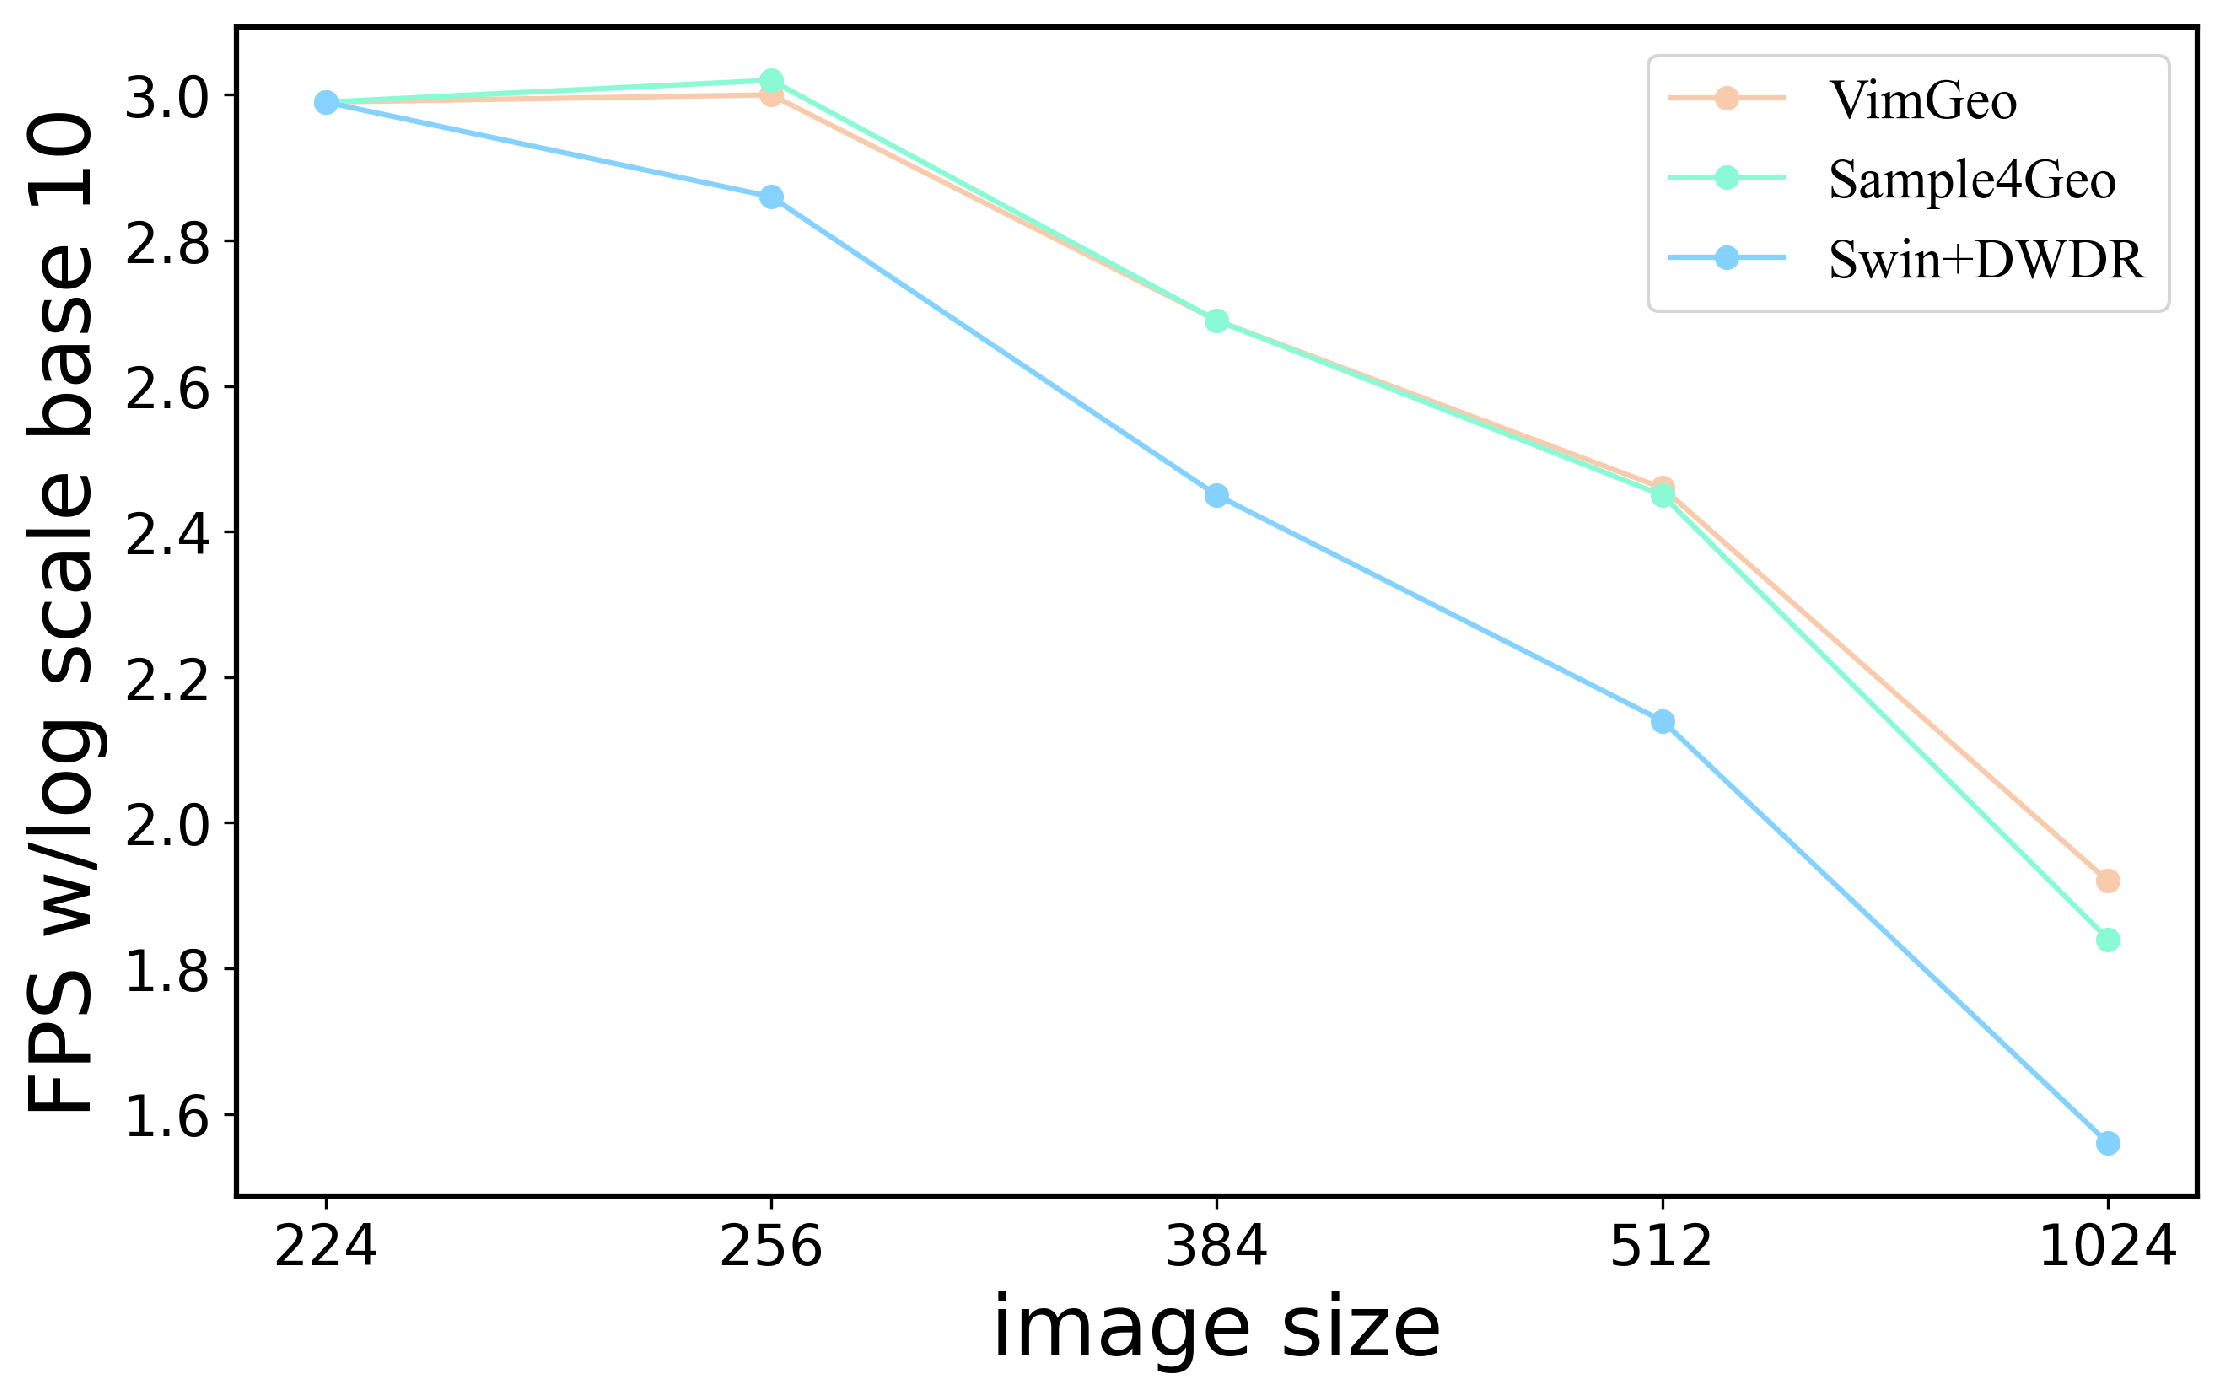
As shown in Table 1, in the UAV-view target localization task (drone → satellite), the introduced VisionMamba architecture achieves 91.27% Recall@1 and 92.61 AP. In the satellite-view navigation task (satellite → drone), it achieves 95.01% Recall@1 and 90.77 AP. The proposed method has advantages over most of the mainstream methods currently available. Compared to Sample4Geo, which uses a parameter count similar to ConvNeXt-T, our method shows advantages in both R@1 and AP, demonstrating its superiority. Additionally, it presents the parameter counts of our method and other mainstream methods, where our approach requires significantly fewer parameters than typical methods. As shown in Figure 3, Figure 4 and Figure 5, compared with existing mainstream frameworks in the field of cross-view localization, Vim has lower GPU memory usage and better inference performance. This is especially notable when processing larger images and larger batches. Vim is better suited for handling the increasing trend towards higher-resolution and larger-scale datasets, aligning more closely with the future development trends of models.

4.4. Ablation Study

4.4.1. Impact of Feature Dimension

In the ablation experiments of the VimGeo model, this paper systematically investigates the influence of feature representation dimensionality on cross-view geolocation performance. Given that the baseline model adopts a 384-dimensional feature embedding space, to explore the nonlinear relationship between feature dimensionality and model representational capacity, experiments maintain unchanged parameters such as network depth, the number of attention heads, and training strategy while, respectively, reducing the feature dimensionality to 192 dimensions and expanding it to 768 dimensions for comparative analysis. As shown in Table 2, when dimensionality decreases to 192 dimensions, the model’s Recall@1 metric on the University-1652 dataset significantly drops from the baseline 91.27% to 71.20%, and AP accuracy decreases from 92.61% to 75%. This may arise from the low-dimensional space’s inability to sufficiently encode complex geometric and semantic relationships in cross-view images, particularly when processing samples with perspective differences exceeding 45° between drone and satellite imagery, where insufficient feature discriminability leads to a sharp increase in mismatch rates. When dimensionality increases to 768 dimensions, despite enhanced theoretical representational capacity, Recall@1 actually decreases from the baseline 91.27% to 82.79%, and AP accuracy drops from 92.61% to 82.75%. This phenomenon can be attributed to overfitting issues induced by high-dimensional space: with relatively limited training data, expanded model parameters reduce generalization capability, significantly increase feature space redundancy, and substantially raise computational costs. Notably, this conclusion differs from empirical patterns in NLP models like BERT (where higher dimensionality yields better performance), reflecting the uniqueness of feature encoding in visual cross-modal tasks. Excessively high dimensions may introduce noise features irrelevant to perspective transformation, while drone–satellite image pairs with strong geometric distortions require precise geometric invariance in feature space rather than mere semantic richness. Based on the above experimental results and theoretical analysis, this paper ultimately establishes the 384-dimensional feature embedding as the optimized configuration for the baseline model, balancing model accuracy with computational efficiency. This finding also provides critical guidance for feature dimensionality design in cross-view geolocation: the optimal dimensionality of feature space must comprehensively consider data scale, task complexity, and hardware constraints as indiscriminate dimensionality increase may prove counterproductive.

4.4.2. Impact of Weight Sharing

Traditional methods in cross-view matching often employ separate encoders for satellite and street-view images [33,43]. Consequently, this paper also tested a Vision Mamba backbone architecture without weight sharing. Table 3 indicates that weight sharing yields superior performance across both evaluation metrics. We posit that this improvement stems from the shared encoder’s role as a strong regularizer, which effectively forces the model to learn a unified feature space that is invariant to the extreme viewpoint changes between drone and satellite perspectives. By leveraging the same set of parameters to process both views, the encoder is compelled to extract and emphasize common, semantically meaningful features while suppressing view-specific nuisances. In contrast, a dual-encoder architecture may overfit to the idiosyncrasies of each specific view, leading to a weaker alignment between the two modalities. Thus, the performance superiority observed numerically is likely a direct consequence of this improved cross-view feature consistency, demonstrating that weight sharing is a powerful strategy for enhancing model generalization in cross-view geo-localization tasks.

4.4.3. Impact of Different Loss Functions

To demonstrate the effect of the introduced network modifications and losses, we conducted ablation studies. Currently, the latest models show high accuracy in the satellite-to-drone task, and the differences between models are minimal. Most research focuses on improving the drone-to-satellite task. Therefore, in the ablation experiments, we only present the results for the drone-to-satellite perspective task. As shown in Table 4, we conducted ablation experiments on the various losses introduced into the model. Compared to the initial model without Dice Loss and KL Loss, the model with Dice Loss alone improved recall by 4% and AP by 5% in the drone-to-satellite task. Using both Dice Loss and KL Loss together resulted 5.5% improvement in recall and 6.5% improvement in AP. This demonstrates that the introduced Dice Loss and KL Loss are effective for cross-view geo-localization. Additionally, we observed that the effects of Dice Loss and KL Loss are different, with each making a distinct contribution to the model. Dice Loss performs better than Triplet Loss and has more potential when combined with other losses.

4.5. Impact of Input Size on Matching Performance

In the cross-view geolocation tasks, selecting input image size critically balances model performance and computational efficiency. This study systematically explores this design trade-off through ablation experiments. Smaller input sizes reduce computational load and GPU memory consumption but compress fine-grained details, impairing the model’s ability to capture critical textures and edge features, thereby diminishing discriminative representation. Conversely, excessively large sizes provide richer context and finer details yet substantially increase training memory overhead and computation time, with performance gains exhibiting marginal diminishing returns or even degradation beyond a certain threshold.
To identify the optimal balance between performance and resource consumption, we conducted controlled experiments varying only input dimensions. As shown in Table 5, both drone→satellite and satellite→drone tasks exhibit minor performance fluctuations across sizes, indicating the proposed method’s robustness to dimensional variations. When increasing from 224 × 224 to 384 × 384, retrieval accuracy progressively improves across tasks, confirming that enhanced resolution enriches visual information for better feature alignment. Further upscaling to 512 × 512, despite offering richer details, causes GPU memory saturation and forced batch size reduction, destabilizing feature learning during training and resulting in slightly inferior performance compared to 384 × 384.
Considering both retrieval accuracy and hardware constraints, 384 × 384 is established as the baseline input size. This configuration delivers near-optimal performance in both tasks while maintaining acceptable memory and computational demands, ensuring training/deployment feasibility and efficiency.

4.6. Impact of Transfer Learning on Matching Efficiency

To evaluate whether models pre-trained on ImageNet [44] enhance discriminative feature extraction, this study compares models trained from scratch on University-1652 against those initialized with ImageNet pre-trained weights. Performance differences on University-1652 are analyzed in Table 6. The results confirm that transfer learning from ImageNet significantly outperforms training solely on University-1652. Consequently, all benchmark tests in this paper utilize ImageNet pre-trained models. This underscores the critical importance of initial weight selection for cross-view matching, necessitating task-specific adaptation.

4.7. Impact of Mixup and Augmix Data Augmentation on Matching Efficiency

AugMix [45] and MixUp [46], two data augmentation methods widely adopted in deep learning to enhance model generalization and robustness, operate through distinct mechanisms: MixUp generates synthetic samples via linear interpolation of two distinct training instances and their labels, encouraging smoother decision boundaries by simulating intermediate data distributions; AugMix produces diversified augmented versions by blending multiple augmentation operations applied to the same image, constraining model outputs through consistency loss to improve robustness and uncertainty estimation. Both methods are commonly applied simultaneously to input image processing in remote sensing fields relevant to cross-view matching tasks. To identify optimal data augmentation strategies, this study investigates the impact of jointly applying AugMix and MixUp on model-matching performance. As Table 7 demonstrates, the combined AugMix and MixUp augmentation causes substantial accuracy degradation in drone→satellite tasks and marginal accuracy improvement in satellite→drone tasks, while overall AP decreases across both tasks. Furthermore, AugMix + MixUp increases convergence difficulty—slowing loss reduction and requiring additional training epochs. Consequently, the baseline model adopts conventional augmentations (random cropping, horizontal flipping, label smoothing regularization, and random erasing) without MixUp/AugMix, ensuring optimal accuracy and AP for drone→satellite tasks. This indicates that neither complex image processing nor artificially increased training difficulty through “hard samples” necessarily improves model training efficacy.

4.8. Visualization of VimGeo Network Matching Results

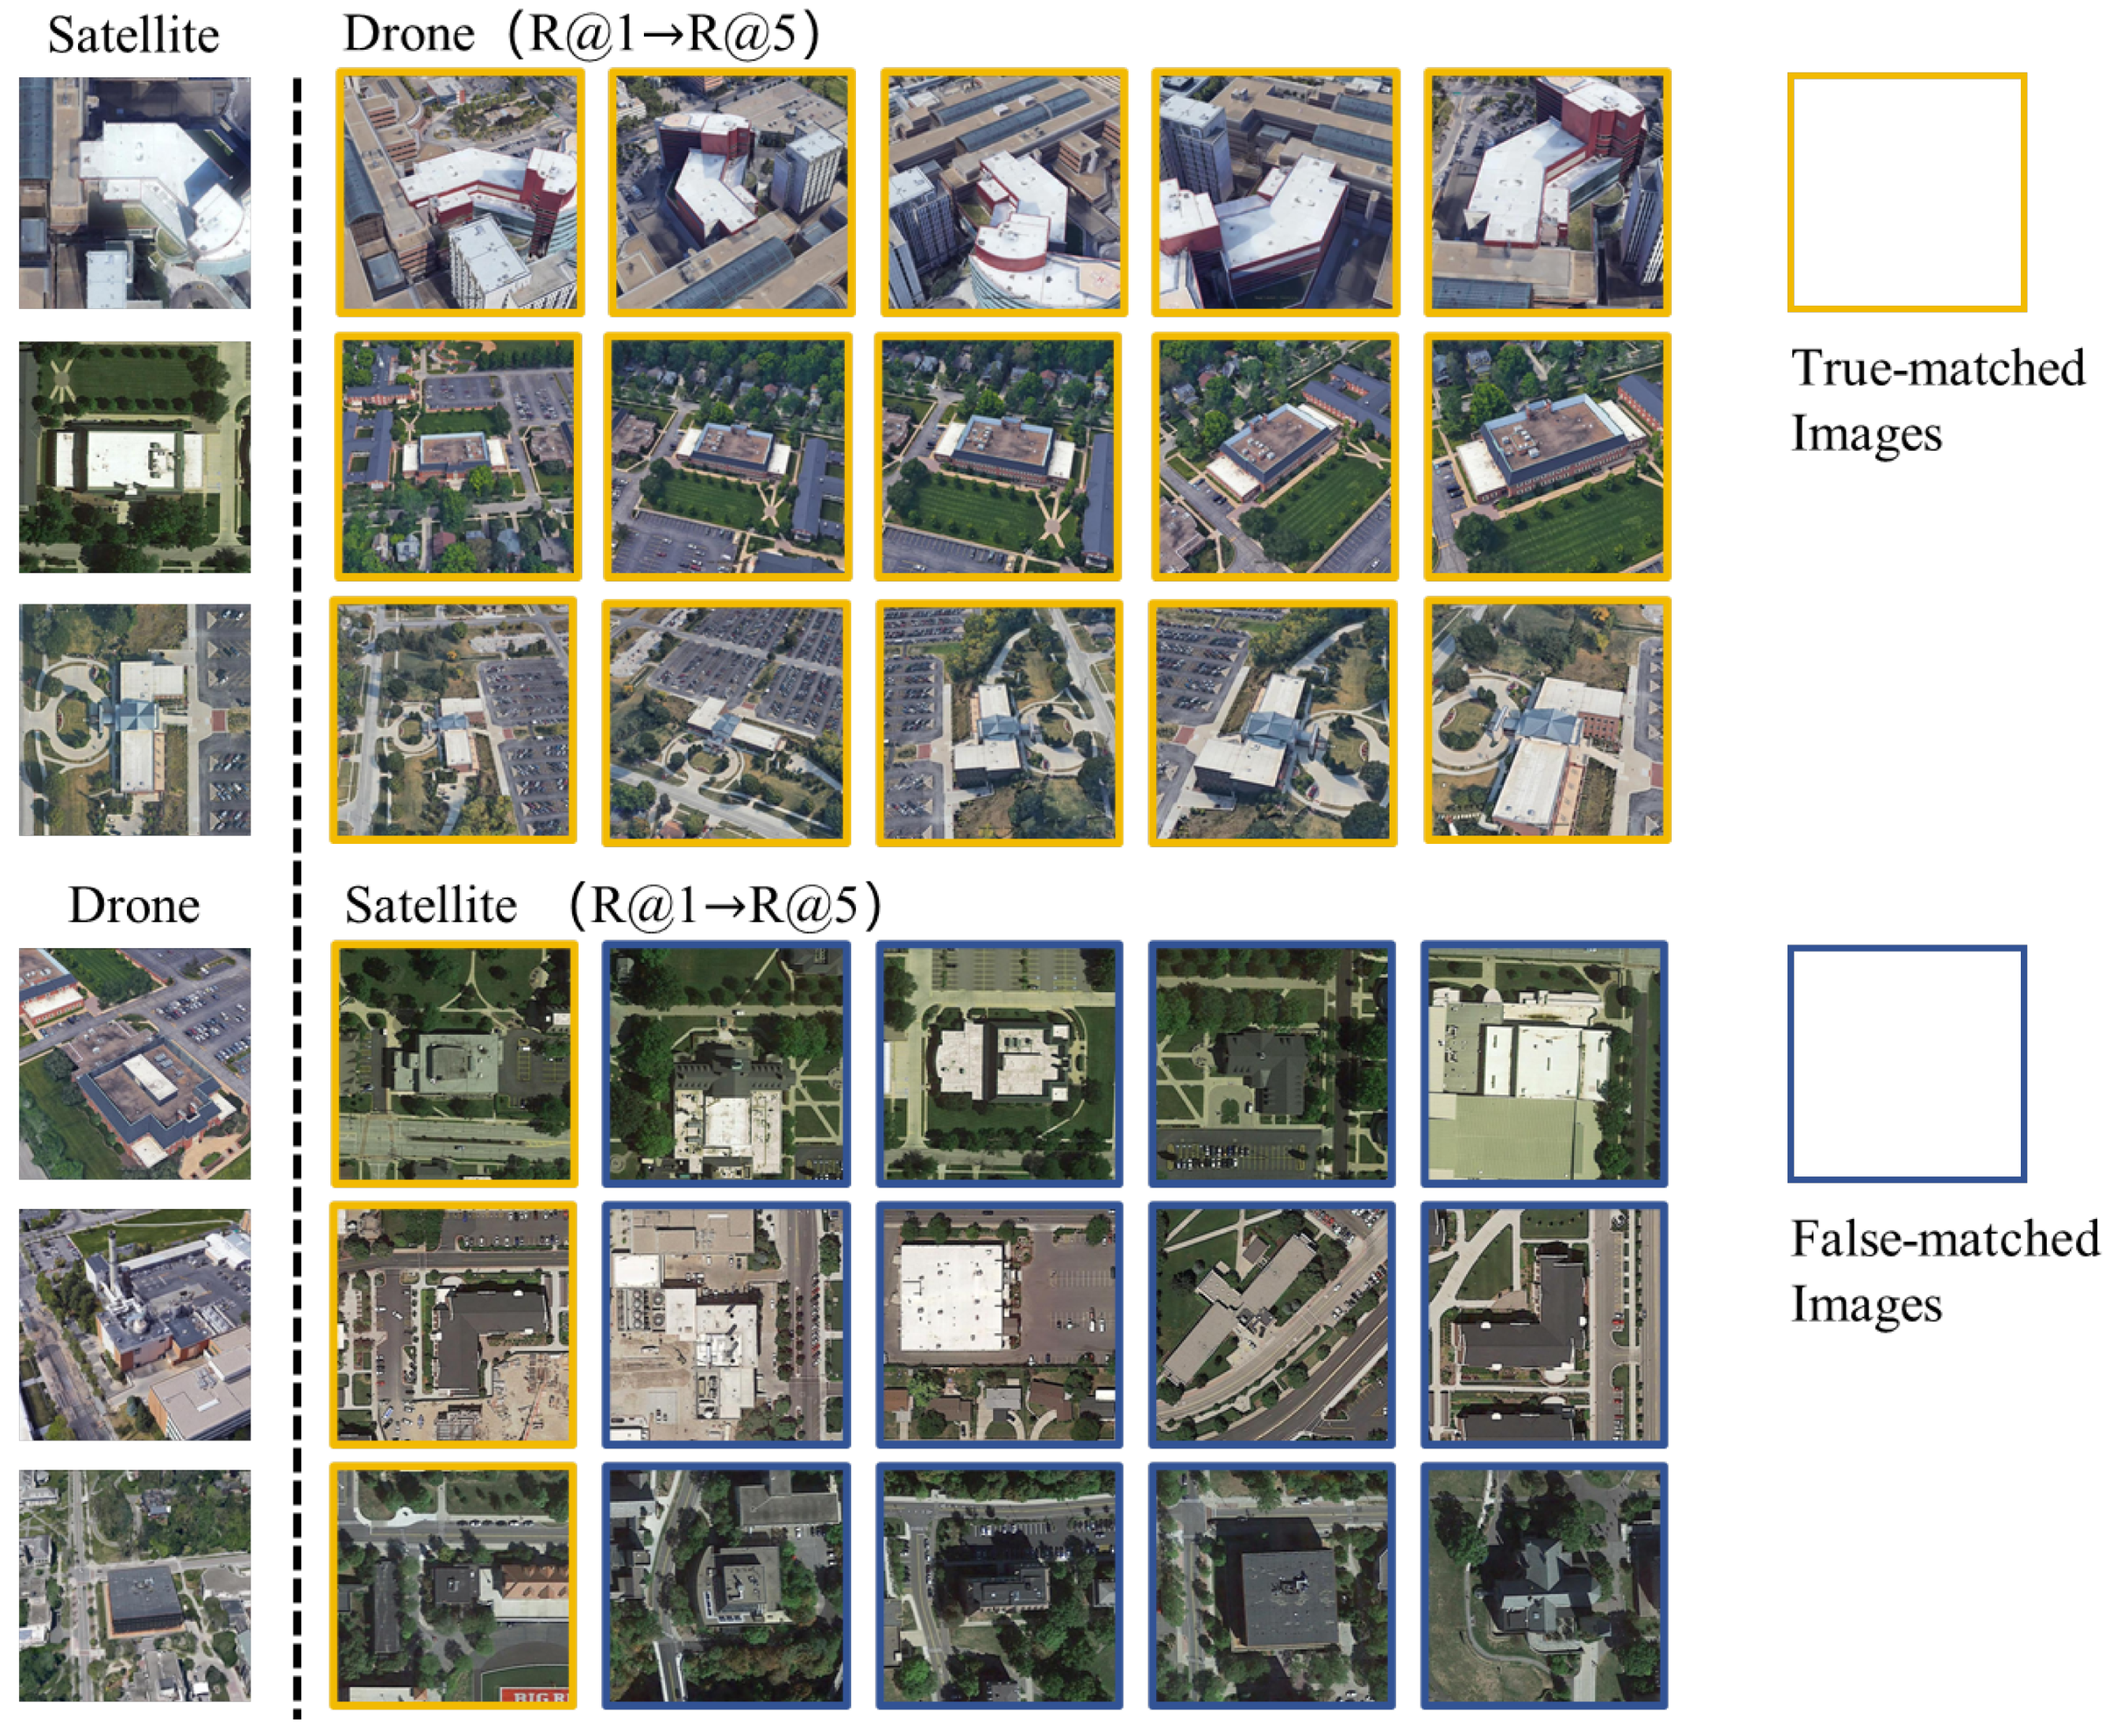
In this section, retrieval results of VimGeo on the University-1652 dataset are visualized. Figure 6 displays the top-5 retrieval matches for both tasks. It can be observed that in the drone→satellite task, VimGeo consistently retrieves correct matches even in highly similar scenarios. Across both tasks, VimGeo achieves exceptional accuracy, with its top-5 results never failing to hit the correct target.

5. Conclusions

In this paper, we investigate the cross-view geo-localization task of drone and satellite views and propose a more efficient and innovative model approach. The proposed model introduces the novel VisionMamba network, and in terms of loss design, uses InfoNCE Loss along with Dice Loss and KL Loss as training objectives. Our experiments show that the new model and loss functions achieve excellent results on the public dataset University-1652. Compared to other state-of-the-art methods, the proposed model does not require complex preprocessing or special attention mechanisms or feature aggregation modules and outperforms other methods in terms of inference speed and GPU memory usage. These results demonstrate that VisionMamba has great potential to become the next-generation visual backbone in the cross-view geo-localization field. However, our work is subject to inherent limitations of the Vision Mamba architecture itself. Firstly, its performance is tied to the predefined scanning strategy, which may not be optimal for capturing all spatial relationships compared to the flexible global attention of Transformers. Secondly, the selective scan mechanism, while efficient, remains an approximation for modeling extremely long and complex visual sequences. In the future, we will test on more datasets and can further explore the application of Vim models with larger parameter sizes as well as investigate adaptive scanning mechanisms and more stable training protocols for the cross-view geo-location task.

Author Contributions

Conceptualization, K.Y. and F.S.; Data curation, Y.Z., L.W. and F.W.; Formal analysis, L.W.; Investigation, A.A.M.M. and Q.W.; Software, K.Y.; Supervision, Y.Z., A.A.M.M. and F.W.; Resources, F.W.; Validation, Q.W.; Writing—original draft, K.Y.; Writing—review & editing, Y.Z. and F.S. All authors have read and agreed to the published version of the manuscript.

Funding

This work was supported in part by the National Natural Science Foundation of China under Grant 42375140, in part by the Shanghai Natural Science Foundation under Grant 17ZR1411900, and in part by the Innovation Fund for Industry-University-Research of Chinese Universities under Grant 2021ZYB01003.

Data Availability Statement

The original contributions presented in this study are included in the article. Further inquiries can be directed to the corresponding author.

Conflicts of Interest

Author Li Wang was employed by the company Yangzhou Petroleum Branch. The remaining authors declare that the research was conducted in the absence of any commercial or financial relationships that could be construed as a potential conflict of interest.

References

  1. Arafat, M.Y.; Alam, M.M.; Moh, S. Vision-based navigation techniques for unmanned aerial vehicles: Review and challenges. Drones 2023, 7, 89. [Google Scholar] [CrossRef]
  2. Tian, Y.; Chen, C.; Shah, M. Cross-view image matching for geo-localization in urban environments. In Proceedings of the IEEE Conference on Computer Vision and Pattern Recognition, Honolulu, HI, USA, 21–26 July 2017; pp. 3608–3616. [Google Scholar]
  3. Lowe, D.G. Object recognition from local scale-invariant features. In Proceedings of the Seventh IEEE International Conference on Computer Vision, Kerkyra, Greece, 20–27 September 1999; Volume 2, pp. 1150–1157. [Google Scholar]
  4. Bay, H.; Ess, A.; Tuytelaars, T.; Van Gool, L. Speeded-up robust features (SURF). Comput. Vis. Image Underst. 2008, 110, 346–359. [Google Scholar] [CrossRef]
  5. Lin, T.Y.; Cui, Y.; Belongie, S.; Hays, J. Learning deep representations for ground-to-aerial geolocalization. In Proceedings of the IEEE Conference on Computer Vision and Pattern Recognition, Boston, MA, USA, 7–12 June 2015; pp. 5007–5015. [Google Scholar]
  6. Shen, T.; Wei, Y.; Kang, L.; Wan, S.; Yang, Y.H. MCCG: A ConvNeXt-based multiple-classifier method for cross-view geo-localization. IEEE Trans. Circuits Syst. Video Technol. 2023, 34, 1456–1468. [Google Scholar] [CrossRef]
  7. Wang, T.; Zheng, Z.; Zhu, Z.; Sun, Y.; Yan, C.; Yang, Y. Learning cross-view geo-localization embeddings via dynamic weighted decorrelation regularization. IEEE Trans. Geosci. Remote Sens. 2024, 62, 1–12. [Google Scholar] [CrossRef]
  8. Zhu, R.; Yang, M.; Yin, L.; Wu, F.; Yang, Y. Uav’s status is worth considering: A fusion representations matching method for geo-localization. Sensors 2023, 23, 720. [Google Scholar] [CrossRef]
  9. Zhu, S.; Yang, T.; Chen, C. Vigor: Cross-view image geo-localization beyond one-to-one retrieval. In Proceedings of the IEEE/CVF Conference on Computer Vision and Pattern Recognition, Nashville, TN, USA, 20–25 June 2021; pp. 3640–3649. [Google Scholar]
  10. Zhu, S.; Shah, M.; Chen, C. Transgeo: Transformer is all you need for cross-view image geo-localization. In Proceedings of the IEEE/CVF Conference on Computer Vision and Pattern Recognition, New Orleans, LA, USA, 18–24 June 2022; pp. 1162–1171. [Google Scholar]
  11. Shi, Y.; Liu, L.; Yu, X.; Li, H. Spatial-aware feature aggregation for image based cross-view geo-localization. Adv. Neural Inf. Process. Syst. 2019, 32, 1–11. [Google Scholar]
  12. Hu, Z.; Fu, Z.; Yin, Y.; De Melo, G. Context-aware interaction network for question matching. arXiv 2021, arXiv:2104.08451. [Google Scholar] [CrossRef]
  13. Dosovitskiy, A.; Beyer, L.; Kolesnikov, A.; Weissenborn, D.; Zhai, X.; Unterthiner, T.; Dehghani, M.; Minderer, M.; Heigold, G.; Gelly, S.; et al. An image is worth 16x16 words: Transformers for image recognition at scale. arXiv 2020, arXiv:2010.11929. [Google Scholar]
  14. Zhou, Q.; Sheng, K.; Zheng, X.; Li, K.; Sun, X.; Tian, Y.; Chen, J.; Ji, R. Training-free transformer architecture search. In Proceedings of the IEEE/CVF Conference on Computer Vision and Pattern Recognition, New Orleans, LA, USA, 18–24 June 2022; pp. 10894–10903. [Google Scholar]
  15. Gu, A.; Goel, K.; Ré, C. Efficiently modeling long sequences with structured state spaces. arXiv 2021, arXiv:2111.00396. [Google Scholar]
  16. Gu, A.; Dao, T. Mamba: Linear-time sequence modeling with selective state spaces. arXiv 2023, arXiv:2312.00752. [Google Scholar] [CrossRef]
  17. Zhu, L.; Liao, B.; Zhang, Q.; Wang, X.; Liu, W.; Wang, X. Vision mamba: Efficient visual representation learning with bidirectional state space model. arXiv 2024, arXiv:2401.09417. [Google Scholar] [CrossRef]
  18. Liu, Y.; Tian, Y.; Zhao, Y.; Yu, H.; Xie, L.; Wang, Y.; Ye, Q.; Liu, Y. VMamba: Visual State Space Model. arXiv 2024, arXiv:2401.10166. [Google Scholar] [PubMed]
  19. Chen, K.; Chen, B.; Liu, C.; Li, W.; Zou, Z.; Shi, Z. Rsmamba: Remote sensing image classification with state space model. IEEE Geosci. Remote Sens. Lett. 2024, 21, 8002605. [Google Scholar] [CrossRef]
  20. Ma, X.; Zhang, X.; Pun, M.O. Rs3mamba: Visual state space model for remote sensing image semantic segmentation. IEEE Geosci. Remote Sens. Lett. 2024, 21, 6011405. [Google Scholar] [CrossRef]
  21. Liu, H.; Feng, J.; Qi, M.; Jiang, J.; Yan, S. End-to-end comparative attention networks for person re-identification. IEEE Trans. Image Process. 2017, 26, 3492–3506. [Google Scholar] [CrossRef]
  22. Hu, S.; Feng, M.; Nguyen, R.M.; Lee, G.H. Cvm-net: Cross-view matching network for image-based ground-to-aerial geo-localization. In Proceedings of the IEEE Conference on Computer Vision and Pattern Recognition, Salt Lake City, UT, USA, 18–23 June 2018; pp. 7258–7267. [Google Scholar]
  23. Milletari, F.; Navab, N.; Ahmadi, S.A. V-net: Fully convolutional neural networks for volumetric medical image segmentation. In Proceedings of the 2016 Fourth International Conference on 3D Vision (3DV), Stanford, CA, USA, 25–28 October 2016; pp. 565–571. [Google Scholar]
  24. Lowe, D.G. Distinctive image features from scale-invariant keypoints. Int. J. Comput. Vis. 2004, 60, 91–110. [Google Scholar] [CrossRef]
  25. Leonardis, A.; Leonardis, A.; Pinz, A.; Bischof, H. Computer Vision-ECCV 2006: 9th European Conference on Computer Vision, Graz, Austria, 7–13 May 2006: Proceedings; Springer Science & Business Media: Berlin/Heidelberg, Germany, 2006; Volume 1. [Google Scholar]
  26. Rublee, E.; Rabaud, V.; Konolige, K.; Bradski, G. ORB: An efficient alternative to SIFT or SURF. In Proceedings of the 2011 International Conference on Computer Vision, Barcelona, Spain, 6–13 November 2011; pp. 2564–2571. [Google Scholar]
  27. Yang, C.; Zhang, X.; Li, J.; Ma, J.; Xu, L.; Yang, J.; Liu, S.; Fang, S.; Li, Y.; Sun, X.; et al. Holey graphite: A promising anode material with ultrahigh storage for lithium-ion battery. Electrochim. Acta 2020, 346, 136244. [Google Scholar] [CrossRef]
  28. Workman, S.; Souvenir, R.; Jacobs, N. Wide-area image geolocalization with aerial reference imagery. In Proceedings of the IEEE International Conference on Computer Vision, Santiago, Chile, 7–13 December 2015; pp. 3961–3969. [Google Scholar]
  29. Liu, L.; Li, H. Lending orientation to neural networks for cross-view geo-localization. In Proceedings of the IEEE/CVF Conference on Computer Vision and Pattern Recognition, Long Beach, CA, USA, 15–20 June 2019; pp. 5624–5633. [Google Scholar]
  30. Zheng, Z.; Wei, Y.; Yang, Y. University-1652: A multi-view multi-source benchmark for drone-based geo-localization. In Proceedings of the 28th ACM International Conference on Multimedia, Seattle, WA, USA, 12–16 October 2020; pp. 1395–1403. [Google Scholar]
  31. Zhu, R.; Yin, L.; Yang, M.; Wu, F.; Yang, Y.; Hu, W. SUES-200: A multi-height multi-scene cross-view image benchmark across drone and satellite. IEEE Trans. Circuits Syst. Video Technol. 2023, 33, 4825–4839. [Google Scholar] [CrossRef]
  32. Arandjelovic, R.; Gronat, P.; Torii, A.; Pajdla, T.; Sivic, J. NetVLAD: CNN architecture for weakly supervised place recognition. In Proceedings of the IEEE Conference on Computer Vision and Pattern Recognition, Las Vegas, NV, USA, 27–30 June 2016; pp. 5297–5307. [Google Scholar]
  33. Shi, Y.; Yu, X.; Wang, S.; Li, H. Cvlnet: Cross-view semantic correspondence learning for video-based camera localization. In Proceedings of the Asian Conference on Computer Vision, Macao, China, 4–8 December 2022; Springer: Berlin/Heidelberg, Germany, 2022; pp. 123–141. [Google Scholar]
  34. Deuser, F.; Habel, K.; Oswald, N. Sample4geo: Hard negative sampling for cross-view geo-localisation. In Proceedings of the IEEE/CVF International Conference on Computer Vision, Paris, France, 1–6 October 2023; pp. 16847–16856. [Google Scholar]
  35. Cao, Y.; Liu, C.; Wu, Z.; Zhang, L.; Yang, L. Remote sensing image segmentation using vision mamba and multi-scale multi-frequency feature fusion. Remote Sens. 2025, 17, 1390. [Google Scholar] [CrossRef]
  36. Ma, C.; Wang, Z. Semi-mamba-unet: Pixel-level contrastive and pixel-level cross-supervised visual mamba-based unet for semi-supervised medical image segmentation. arXiv 2024, arXiv:2402.07245. [Google Scholar] [CrossRef]
  37. Liao, W.; Zhu, Y.; Wang, X.; Pan, C.; Wang, Y.; Ma, L. Lightm-unet: Mamba assists in lightweight unet for medical image segmentation. arXiv 2024, arXiv:2403.05246. [Google Scholar]
  38. Tian, L.; Shen, Q.; Gao, Y.; Wang, S.; Liu, Y.; Deng, Z. A Cross-Mamba Interaction Network for UAV-to-Satallite Geolocalization. Drones 2025, 9, 427. [Google Scholar] [CrossRef]
  39. Vo, N.N.; Hays, J. Localizing and orienting street views using overhead imagery. In Proceedings of the Computer Vision–ECCV 2016: 14th European Conference, Amsterdam, The Netherlands, 11–14 October 2016; Proceedings, Part I 14. Springer: Cham, Switzerland, 2016; pp. 494–509. [Google Scholar]
  40. Weyand, T.; Kostrikov, I.; Philbin, J. Planet-photo geolocation with convolutional neural networks. In Proceedings of the Computer Vision–ECCV 2016: 14th European Conference, Amsterdam, The Netherlands, 11–14 October 2016; Proceedings, Part VIII 14. Springer: Cham, Switzerland, 2016; pp. 37–55. [Google Scholar]
  41. Wang, T.; Zheng, Z.; Yan, C.; Zhang, J.; Sun, Y.; Zheng, B.; Yang, Y. Each part matters: Local patterns facilitate cross-view geo-localization. IEEE Trans. Circuits Syst. Video Technol. 2021, 32, 867–879. [Google Scholar] [CrossRef]
  42. Zhu, Y.; Yang, H.; Lu, Y.; Huang, Q. Simple, effective and general: A new backbone for cross-view image geo-localization. arXiv 2023, arXiv:2302.01572. [Google Scholar] [CrossRef]
  43. Lin, T.Y.; Belongie, S.; Hays, J. Cross-view image geolocalization. In Proceedings of the IEEE Conference on Computer Vision and Pattern Recognition, Portland, OR, USA, 23–28 June 2013; pp. 891–898. [Google Scholar]
  44. Deng, J.; Dong, W.; Socher, R.; Li, L.J.; Li, K.; Li, F.F. Imagenet: A large-scale hierarchical image database. In Proceedings of the 2009 IEEE Conference on Computer Vision and Pattern Recognition, Miami, FL, USA, 20–25 June 2009; pp. 248–255. [Google Scholar]
  45. Hendrycks, D.; Mu, N.; Cubuk, E.D.; Zoph, B.; Gilmer, J.; Lakshminarayanan, B. Augmix: A simple data processing method to improve robustness and uncertainty. arXiv 2019, arXiv:1912.02781. [Google Scholar]
  46. Zhang, H.; Cisse, M.; Dauphin, Y.N.; Lopez-Paz, D. mixup: Beyond empirical risk minimization. arXiv 2017, arXiv:1710.09412. [Google Scholar]
Figure 1. Architecture overview of our VimGeo. We utilize VisionMamba pretrained on ImageNet1K as the encoder, the satellite view branch, and drone view branch share weights. InfoNCE Loss is used as the main loss, combined with KL Loss and Dice Loss, to learn distinguishing features across the two views. Detailed information about the VisionMamba structure is provided in the rectangular box below.
Electronics 14 03906 g001
Figure 2. Examples for the University-1652 dataset.
Electronics 14 03906 g002
Figure 3. GPU memory efficiency comparison. Benchmark of recent cross-view geo-localization frameworks shows our model’s superior memory efficiency during batch inference. VimGeo’s GPU memory usage decreases significantly with increasing batch sizes under typical inputs.
Electronics 14 03906 g003
Figure 4. GPU memory efficiency comparison. Comparison of cross-view geo-localization frameworks shows our model maintains better memory efficiency. VimGeo’s GPU memory usage decreases notably with higher image resolutions during batch inference.
Electronics 14 03906 g004
Figure 5. Comparison of inference speed between recent approaches with different framework and our model. We performed batch inference and logarithmic-scale FPS benchmark tests on architectures with the same backbone. At smaller resolutions, VimGeo achieves performance comparable to Sample4Geo. As the input image resolution increases, VimGeo shows higher FPS.
Electronics 14 03906 g005
Figure 6. Visualization results of satellite-view and drone-view images processed by our method. The first three rows display the top-5 retrieval results of drone-view target localization on University-1652. The last three rows display the top-5 retrieval results of drone navigation on University-1652. The yellow box indicates a correctly matched image, and the blue box indicates a falsely matched image.
Electronics 14 03906 g006
Table 1. Comparison with state-of-the-art results and parameters on University-1652.
Method# Params (M)Drone→SatSat→Drone
R@1 AP R@1 AP
LPN [41]138.475.9379.1486.4578.48
SAIG-D [42]15.6 × 278.8581.6286.4578.48
DWDR [7]109.186.4188.4191.3086.02
MBF [8]25.5 + 9989.0590.6192.1584.45
MCCG [6]88.689.6491.3294.3089.39
Sample4Geo (nano) [34]15.588.1389.9692.2987.62
Sample4Geo (tiny) [34]28.690.4591.9293.7289.55
Ours26.091.2792.6195.0190.77
Table 2. Effect of different feature dimension combinations on performance.
DimensionDrone→SatSat→Drone
R@1 AP R@1 AP
19271.2075.0079.0371.53
38491.2792.6195.0190.77
76882.7985.3591.0182.75
Table 3. Impact of share weights on model performance.
Share WeightsDrone→SatSat→Drone
R@1APR@1AP
91.2792.6195.0190.77
89.9891.6294.5789.60
Table 4. Effect of different loss combinations on performance.
Loss ComponentsDrone2Sat
InfoNCEDiceKLTripletR@1AP
87.2289.18
88.9190.58
89.5491.17
91.2792.61
87.9489.85
3.465.32
When using hard samples in the same batch, the Triplet Loss causes the model to collapse easily. To overcome this problem, we employ contrastive learning with implicit Triplet Loss combined with InfoNCE Loss.
Table 5. Effect of different image input sizes on model performance.
Image SizeDrone→SatSat→Drone
R@1APR@1AP
22487.0189.0592.2986.12
25689.8091.4794.5789.46
38491.2792.6195.0190.77
51291.1992.5894.1590.72
Table 6. Test results of transfer learning models and pre-trained weights on University-1652.
Train SetDrone→SatSat→Drone
R@1APR@1AP
ImageNet3.525.0414.984.21
University-165212.5116.7617.2611.69
University-1652 (ImageNet pre-trained)91.2792.6195.0190.77
Table 7. Effect of AugMix and MixUp on model performance.
Augmentation MethodsDrone→SatSat→Drone
R@1APR@1AP
AugMix + MixUp87.9989.9295.5887.04
Traditional91.2792.6195.0190.77
Disclaimer/Publisher’s Note: The statements, opinions and data contained in all publications are solely those of the individual author(s) and contributor(s) and not of MDPI and/or the editor(s). MDPI and/or the editor(s) disclaim responsibility for any injury to people or property resulting from any ideas, methods, instructions or products referred to in the content.