Article

A Machine Learning Approach to Investigating Key Performance Factors in 5G Standalone Networks

Faculty of Information Technology, Department of Computer Science, Al-Farabi Kazakh National University, Almaty 050040, Kazakhstan
*
Author to whom correspondence should be addressed.
Electronics 2025, 14(19), 3817; https://doi.org/10.3390/electronics14193817
Submission received: 18 August 2025 / Revised: 22 September 2025 / Accepted: 22 September 2025 / Published: 26 September 2025

Abstract

Traditional machine learning approaches for 5G network management relieve data from operational networks, which are often noisy and confounded, making it difficult to identify key influencing factors. This research addresses the critical gap between correlation-based prediction and interpretable, data-driven explanation. To this end, a software-defined standalone 5G architecture was developed using srsRAN and Open5GS to support multi-user scenarios. A multi-user environment was then simulated with GNU Radio, from which the initial dataset was collected. This dataset was further generated using a Conditional Tabular Generative Adversarial Network (CTGAN) to improve diversity and balance. Several machine learning models, including Linear Regression, Decision Tree, Random Forest, Gradient Boosting, and XGBoost, were trained and evaluated for predicting network performance. Among them, XGBoost achieved the best results, with an R2 score of 0.998. To interpret the model, we conducted a SHAP (SHapley Additive exPlanations) analysis, which revealed that the download-to-upload bitrate ratio (dl_ul_ratio) and upload bitrate (brate_ul) were the most influential features. By leveraging a controlled experimental 5G environment, this study demonstrates how machine learning can move beyond predictive accuracy to uncover the fundamental principles governing 5G system performance, providing a robust foundation for future network optimization.

1. Introduction

The transition from fifth generation (5G) wireless networks to the forthcoming sixth generation (6G) era represents a paradigm shift in telecommunications, introducing a level of systemic complexity that renders traditional network management approaches increasingly obsolete [1,2]. This evolution is not merely an incremental upgrade but a fundamental re-architecting of wireless systems to meet unprecedented performance demands, including terabit-per-second data rates, sub-millisecond latencies, and ultra-high reliability for mission-critical applications [3,4]. The operational challenges are immense, driven by the need to manage dynamic and often explosive traffic patterns, support massive machine-type communications (mMTC) with billions of connected devices, and satisfy the stringent quality of service (QoS) requirements of ultra-reliable low-latency communications (URLLC) [5]. Furthermore, architectural innovations such as Software-Defined Networking (SDN) and Network Function Virtualization (NFV), while offering greater flexibility and programmability, introduce additional layers of operational complexity that demand intelligent, automated control [6]. The increasingly distributed nature of these networks, which leverage edge and fog computing to reduce latency, further complicates resource allocation and system-wide optimization. This escalating complexity transforms the core challenge of network management from a set of procedural tasks into a large-scale, high-velocity data analytics problem, where the operational state of the network is defined by a continuous, high-dimensional stream of performance indicators and state information.
In response to this data-centric challenge, machine learning (ML) has emerged as the indispensable paradigm for managing and optimizing 5G and 6G networks [7,8]. The ability of ML algorithms to learn complex patterns from vast datasets makes them uniquely suited to automate and enhance critical network functions that are intractable for human operators or conventional algorithms. The academic literature is replete with applications of ML across the entire network stack. Deep Reinforcement Learning (DRL), for example, is widely proposed for dynamic resource allocation in network slicing, enabling autonomous agents to learn optimal policies in real time [9]. Similarly, deep learning models such as Long Short-Term Memory (LSTM) networks are extensively used for traffic prediction, allowing for proactive resource management [10]. Other key applications include ML-driven anomaly detection to enhance security [11] and beam selection in the Radio Access Network (RAN) [12]. The field is rapidly advancing, with techniques like Federated Learning (FL) being explored to enable collaborative model training across distributed nodes while preserving data privacy [13,14]. This widespread adoption of ML, however, rests on an often-unexamined assumption: that the data available for training is a sufficiently accurate and complete representation of the underlying network physics and dynamics.
The dominant and most widely published methodology in this domain involves applying ML algorithms to datasets collected from live, operational commercial networks or large-scale simulations designed to mimic such environments [15]. Numerous studies leverage real-world traffic data from active 5G deployments to train predictive models [16], while others utilize crowdsourced data from user equipment (UEs) to analyze performance patterns [17]. Anomaly detection frameworks are frequently validated using network flow data from live or simulated operational settings [11], and DRL agents are commonly trained in complex simulators that reflect the dynamics of production networks [8,15]. While this approach is valuable for performance benchmarking and developing models that can function in real-world conditions, it is fundamentally flawed for achieving a deep, scientific understanding of network behavior. The inherent characteristics of operational data obscure fundamental relationships, leading to models that may predict but cannot reliably explain network phenomena.
This prevailing paradigm suffers from several critical limitations. First, data from operational networks is inherently “noisy”, containing measurement errors, missing values, and artifacts from a multitude of unpredictable real-world events that are unrelated to the core network parameters under investigation [18]. This data necessitates extensive pre-processing and cleaning, which can inadvertently introduce biases and further obscure the ground truth [19]. Second, and more critically, live networks are chaotic and uncontrolled systems. Countless variables such as fluctuating user demand, environmental interference, hardware degradation, and competing traffic from various applications change simultaneously and unpredictably [20]. This lack of experimental control makes it statistically difficult to isolate the direct impact of any single parameter on a performance outcome. Consequently, models trained on such data are highly susceptible to learning spurious correlations that appear significant but are not. For instance, a model might observe a strong correlation between high interference and low throughput. However, the true root cause might be a confounding variable, such as high user density, which simultaneously causes both increased interference and resource contention leading to low throughput. An optimization strategy based on the model’s learned relationship focusing solely on interference mitigation would be ineffective because it misidentifies the underlying performance driver [21,22]. This failure to distinguish correlation from causation is a significant impediment to developing robust and efficient network control strategies [23,24].
Ultimately, these issues of data quality and uncontrolled confounding variables culminate in the well-known “black box” problem [25]. Complex models, particularly deep neural networks, may achieve high predictive accuracy on a given dataset but fail to provide transparent, interpretable insights into the reasoning behind their predictions. This lack of explainability is a major barrier to trust and deployment in critical network infrastructure, as operators cannot confidently re-architect a multi-million-dollar system based on the opaque recommendation of a model that may have learned flawed or non-generalizable relationships [26]. The very emergence of XAI as a field of study is a testament to this critical shortcoming. XAI refers to a set of methods and techniques that allow human users to comprehend and trust the results and output created by machine learning algorithms. It aims to answer questions such as ‘Why did the model make a specific prediction?’ and ‘Which features were most influential?’. However, even XAI techniques can be misleading if the underlying model has learned spurious correlations from confounded data; in such cases, XAI would merely be “explaining” a fundamentally incorrect relationship. This hinders scientific progress and the development of truly generalizable principles for network engineering. This research directly confronts the fundamental limitations of prior work by shifting the methodological foundation from the passive observation of chaotic, operational systems to active, controlled experimentation in a bespoke laboratory environment. We address the prevailing research gap by utilizing a highly controlled, software-defined 5G Standalone (SA) experimental testbed. While existing testbeds, such as those described in [16,17], have been crucial for performance benchmarking and demonstrating new technologies, our work carves a distinct niche. We specifically integrate this controlled 5G SA environment with XAI techniques to move beyond performance measurement towards deep explanation. Our primary goal is not merely to report throughput or latency, but to use machine learning as an analytical instrument to identify the key parameters driving system behavior, addressing a critical gap in the explanation of key performance drivers.
This approach provides distinct advantages that are unattainable with operational data, enabling a crucial transition from correlation-based prediction to the explanation of key performance drivers. Our testbed allows for the generation of controlled, high-fidelity data, free from the noise and unpredictable artifacts that contaminate real-world datasets [19]. Crucially, it empowers us to perform controlled experiments by systematically manipulating specific network parameters such as pathloss, modulation and coding schemes, or scheduling algorithms while holding all other variables constant [20]. This experimental control, facilitated by tools like GNU Radio for precise radio environment emulation, is the cornerstone of robust system analysis, allowing us to better distinguish strong associations from mere statistical correlation [21,22].
Therefore, the central objective of this paper is to answer the following scientific question: can machine learning models, when trained on data from a highly controlled software-defined 5G environment, uncover the fundamental, and potentially non-obvious, relationships between network parameters that govern system performance? Our goal is not merely to achieve state-of-the-art predictive accuracy, but to leverage ML as a powerful analytical instrument to probe the underlying dynamics of the 5G system. This paper demonstrates that by applying machine learning models to a high-fidelity dataset, founded on data from a controlled, software-defined 5G testbed, we can transcend the limitations of conventional predictive modeling. We develop an explanatory framework that isolates and reveals the core, fundamental principles of 5G system performance, providing a robust and generalizable foundation for future network optimization strategies.

2. Materials and Methods

2.1. 5G Standalone System Architecture

This research has developed a full-featured 5G Standalone (SA) system based on open-source software that provides complete independence from legacy 4G/LTE technologies. The 5G SA architecture is a radical rethinking of traditional network solutions based on the principles of software-defined networking (SDN) and network function virtualization (NFV).

2.1.1. Network Architecture Components

The realized 5G SA system includes the following key components:
The core network (5G Core Network):
  • AMF (Access and Mobility Management Function)—manages user registration, authentication and mobility procedures.
  • SMF (Session Management Function)—manages PDU sessions and QoS policies.
  • UPF (User Plane Function)—provides routing and forwarding of user traffic.
  • NRF (Network Repository Function)—provides network function discovery and registration services.
  • UDM/UDR (Unified Data Management/Repository)—manages subscription data and user profiles.
Radio Access Network (Radio Access Network):
  • gNB (Next Generation NodeB)—5G base station supporting NR PHY/MAC/RLC/PDCP protocols.
  • CU (Central Unit)—centralized unit for processing high-level proto-calls.
  • DU (Distributed Unit)—distributed physical layer processing unit.

2.1.2. Protocols and Interfaces

The system implements the full 5G NR protocol stack according to 3GPP Release 16 specifications:
  • Physical layer (PHY)—OFDM support with cyclic prefix, SC-FDMA multiple access in uplink.
  • Channel Access Layer (MAC)—resource scheduling, HARQ, power management.
  • Radio Link Control (RLC) layer—segmentation, ARQ, packet duplication.
  • Packet Data Convergence Layer (PDCP)—header compression, encryption, reordering.

2.2. Multi-User Scenarios (Multi-UE)

2.2.1. Multi-UE Concept

Multi-user scenarios in 5G networks present a challenging radio resource management problem in simultaneously serving multiple users with different qualities of service requirements. This study implements a scenario supporting up to 16 simultaneously active UEs, each characterized by a unique set of radio parameters and QoS requirements.

2.2.2. Model of a Multi-User System

The mathematical model of a multi-user system is described by the following parameters:
For each user i (i = 1, 2, …, N, where N is the total number of UEs):
  • R S R P i ( t ) is the received reference signal power at time t [dBm].
  • R S R Q i ( t ) —quality of the received reference signal [dB].
  • C Q L i ( t ) —channel quality indicator (0–15).
  • M C S i t —modulation and coding scheme (0–28).
  • B L E R i ( t ) —block error rate (0,1).
  • T h r o u g h p u t i ( t ) —throughput [Mbps].
  • T A i ( t ) —time advance [µs].

2.2.3. Resource Scheduling Algorithm

A modified Proportional Fair Scheduler (Proportional Fair Scheduler) algorithm is used for efficient radio resource management in a multi-user scenario:
P r i o r i t y i t = R i ( t ) R ¯ i ( t 1 )
where
  • R i ( t ) —instantaneous data transmission rate for U E i .
  • R ¯ i t 1 —average data rate for U E i in the previous time window.
The algorithm provides a trade-off between maximizing the overall system throughput and the fairness of resource allocation among users.

2.3. GNU Radio Architecture

GNU Radio is an open-source software platform for the design and implementation of Software Defined Radio (SDR) systems. In the context of this research, GNU Radio is used to create a flexible and customizable radio frequency part of the 5G SA system. Communication between the GNU Radio emulator and the srsRAN components is handled by ZeroMQ, a high-performance asynchronous messaging library.
Our framework specifically employs the request–reply (REQ-REP) pattern. The emulated UEs in GNU Radio use ZMQ REQ (Request) sockets, which act as clients to send I/Q data requests. The srsRAN system utilizes a corresponding ZMQ REP (Reply) socket, which acts as a server to receive the request from a UE, process the data, and send back confirmation. This pattern ensures a synchronized and orderly exchange of data between the radio emulator and the 5G network stack.
The main components of GNU Radio used in the study are the following:
  • GNU Radio Companion (GRC)—a graphical design environment for inline radio systems to run a multi-UE (multi-user) communication scenario.
  • Signal Processing Libraries—A set of blocks for modulation, demodulation, filtering, and other operations.
  • USRP Hardware Driver (UHD)—drivers for working with hardware SDR devices.
  • ZeroMQ blocks—interfaces for interprocess communication.

Experimental Control and Parameter Variation

To generate a clean dataset for analysis, a strict experimental protocol was followed. The multi-UE scenario was run under controlled conditions where specific input parameters were systematically varied while all others were held constant.
  • Independent Variable: The primary parameter varied during the experiments was the Pathloss [dB] for each of the three UEs. This was adjusted independently for each user via the GNU Radio GUI panel to simulate changes in signal attenuation and user location.
  • Controlled Variables: To isolate the impact of pathloss, key system parameters were held constant throughout all experimental runs. These included the Proportional Fair scheduling algorithm, the number of active UEs (three), the carrier frequency, and the channel bandwidth.
  • Data Collection: For each combination of pathloss settings, the system was run for a set duration, and the resulting Key Performance Indicators (KPIs), such as brate_dl and mcs_dl, were logged to form the initial dataset.
To provide a comprehensive understanding of the methodology, Figure 1 presents a conceptual high-level architecture of the experimental framework developed in this study.

2.4. Dataset and Augmentation

The study began with a dataset of Key Performance Indicators (KPIs) from an experimental 5G Standalone (SA) network. The initial dataset was gathered by running a series of controlled experiments in our 5G Standalone (SA) testbed, resulting in 500 high-fidelity samples, so its size was limited. To enhance the dataset without compromising its statistical integrity, a CTGAN was used. This approach allowed us to enrich the dataset by effectively interpolating between our observed experimental states while maintaining the statistical characteristics of the original data. The model was trained on the original data for 1000 epochs, using a batch size of 250. After training, this generative model produced 10,000 synthetic samples that maintained the statistical characteristics of the original dataset, resulting in a more robust and comprehensive dataset for model training.

Data Preprocessing and Feature Engineering

The augmented dataset underwent a preprocessing phase involving the following steps:
  • Data Cleaning: Numerical columns containing text suffixes (e.g., ‘k’ for thousands and ‘n’ for nanoseconds) were converted to a standard numeric format.
  • Removal of Irrelevant Features: As previously mentioned, the dataset was generated under specific conditions to analyze how certain parameters influence download speeds in an ideal network environment. Because the experiment focused on isolating a few key variables, other factors (like connection quality, signal strength, and error rates) were intentionally kept constant. This approach resulted in numerous columns containing only a single value. Since these constant features lack variance and provide no information for pattern recognition, they were removed during preprocessing. This step streamlines the dataset, focusing the analysis solely on the parameters that varied during the experiment.
On an exploratory basis, Feature Engineering was applied to investigate whether the dataset’s informational content could be enhanced. Two new features were created from the existing variables:
  • dl_ul_ratio: The ratio of downlink to uplink bitrate (brate_dl/brate_ul), designed to capture traffic asymmetry.
  • mcs_ta_interaction: The product of the Modulation and Coding Scheme and Timing Advance (mcs_dl * ta), intended to help the model capture non-linear relationships.

2.5. Modeling and Evaluation

The core of the methodology involved training, optimizing, and evaluating several machine learning models.

2.5.1. Machine Learning Models

To address the regression task of predicting network download speed, five distinct machine learning algorithms were selected. The choice of these models was deliberate, aiming to span a range of complexities and learning approaches. This strategy enables a thorough performance comparison, starting with a simple linear baseline to establish a benchmark and progressing to advance non-linear ensemble methods renowned for their high accuracy on complex, tabular data. This hierarchical approach allows us to not only find the best-performing model but also to understand the complexity of the underlying relationships within the network data. The models were configured with hyperparameters optimized for this specific task (as detailed in Section 3.3).
  • Linear Regression: A baseline model that assumes a linear relationship between features and the target [27].
  • Decision Tree (max_depth = 7, min_samples_leaf = 1, min_samples_split = 2): A non-linear model that partitions the data based on feature values [28].
  • Random Forest (max_depth = 7, min_samples_leaf = 1, n_estimators = 200): An ensemble method that builds multiple decision trees and merges their predictions to improve accuracy and control overfitting [29].
  • Gradient Boosting (learning_rate = 0.1, max_depth = 5, n_estimators = 300): An ensemble technique that builds models sequentially, where each new model corrects the errors of the previous one [30].
  • XGBoost (learning_rate = 0.05, max_depth = 7, n_estimators = 300, subsample = 0.7): A highly optimized and efficient implementation of the gradient boosting algorithm [31].
Before training, the data was split into training (80%) and testing (20%) sets. All features were scaled using StandardScaler, which standardizes features by removing the mean and scaling to unit variance.

2.5.2. Evaluation Metrics

The performance of the models was assessed using three standard regression metrics:
  • Mean Absolute Error (MAE): Measures the average magnitude of the errors in a set of predictions, without considering their direction.
M A E = 1 n i = 1 n | y i y ^ i |
  • Root Mean Squared Error (RMSE): This is the square root of the average of squared errors. It gives more weight to larger errors and is useful because the final error score is in the same units as the target variable.
R M S E = 1 n i = 1 n y i y ^ i 2
  • R-squared (R2): The coefficient of determination, which represents the proportion of the variance in the dependent variable that is predictable from the independent variable(s).
R 2 = 1 i = 1 n ( y i y ^ i ) 2 i = 1 n ( y i y ¯ i ) 2
where y i is the actual value, y 𝚤 ^ is the predicted value, y ¯ is the mean of the actual values, and n is the number of samples.

2.5.3. Model Optimization and Interpretation

To enhance model performance and gain insights into their behavior, hyperparameter tuning and model interpretation techniques were employed.
  • Hyperparameter Tuning: The optimal hyperparameters for the tree-based models, as listed in Section 3.1, were identified using GridSearchCV. This method performs an exhaustive search over a specified parameter grid, using 3-fold cross-validation to find the combination of parameters that yields the best performance on the R2 metric [32].
  • Model Interpretation: To address the “black box” problem and understand the drivers of the model’s predictions, we employed SHAP. Rooted in cooperative game theory, SHAP is a state-of-the-art framework that explains the output of any machine learning model by calculating each feature’s contribution to a prediction. It was chosen for its theoretical soundness and its ability to provide clear, global insights into feature importance. SHAP not only ranks features but also shows the direction and magnitude of their impact, allowing for a deeper analysis of the model’s decision-making process and the key parameters driving network performance [33].

3. Results

The presented images show the logs of the 5G Standalone experimental system with multiple users, demonstrating the different stages of the multi-user scenario. Figure 2 shows the overall performance statistics of the srsRAN system with three active UEs (IDs 4601-4603), where key performance parameters can be seen: throughput varies from 2.7 k to 5.4 k bps, RSRP signal levels are around 42.5–42.8 dBm, and data volumes transmitted reach 74 k bytes for the most active users, with the system showing an overload status (ovl) and delays of around 520 nanoseconds.
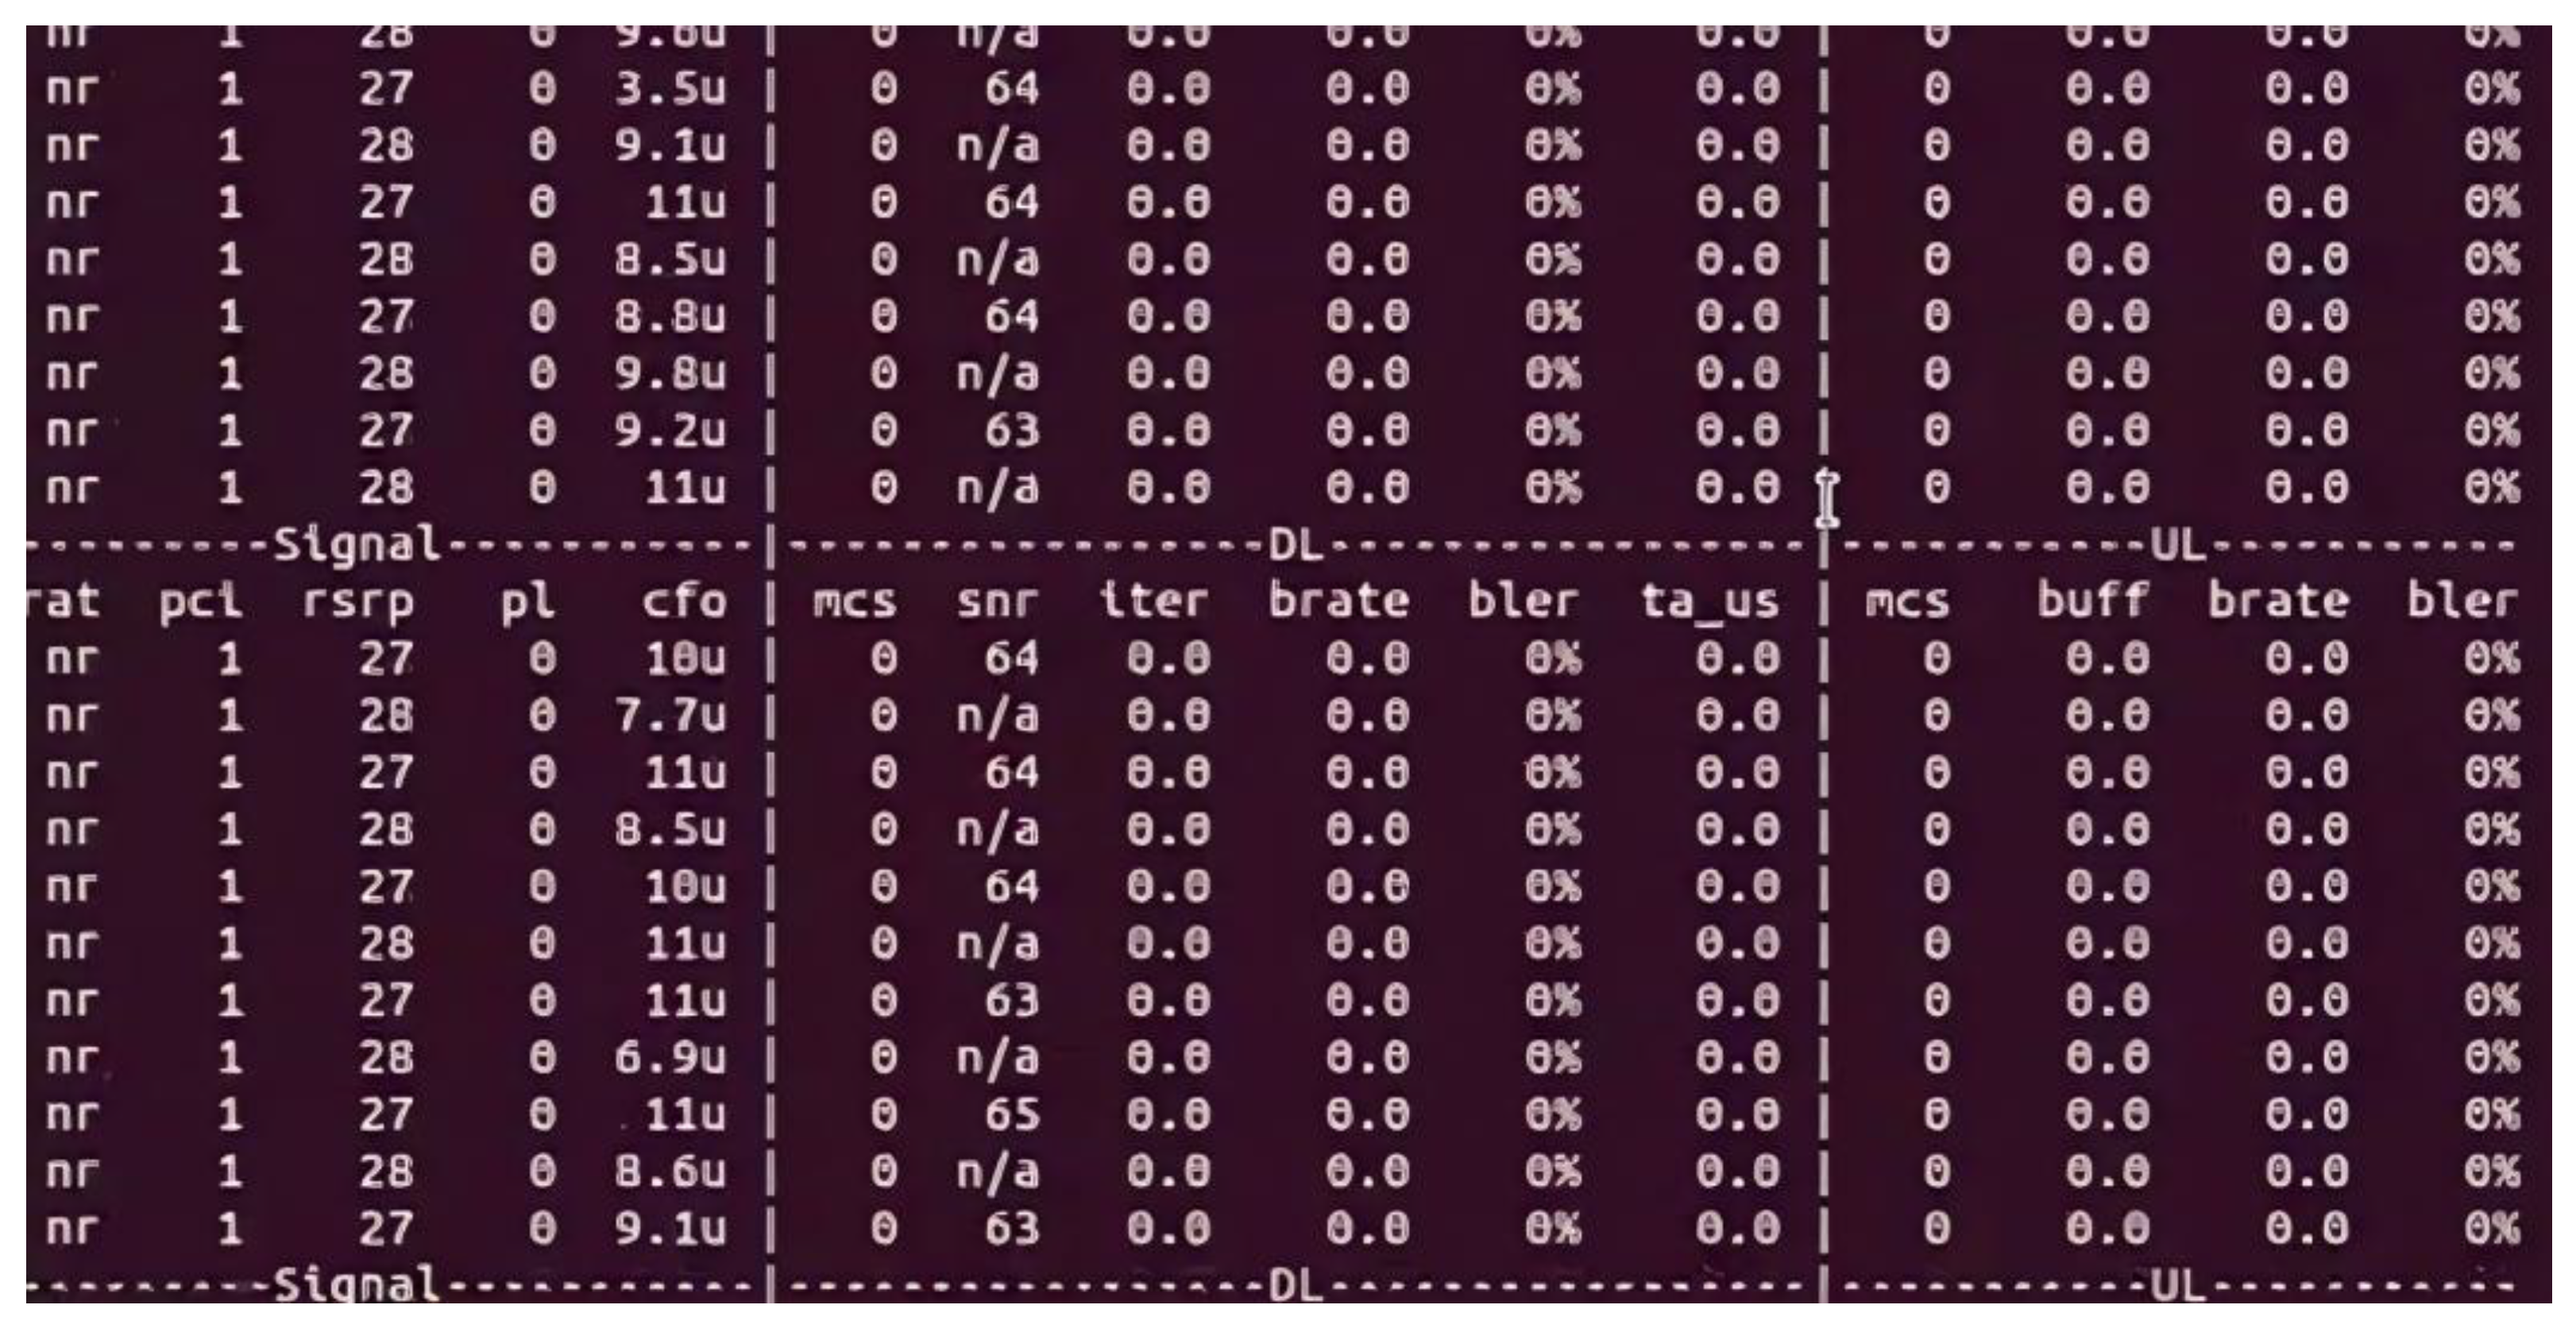
Figure 3 presents detailed radio channel telemetry at the 5G NR physical layer level, including metrics such as CQI (channel quality indicator), MCS (modulation and coding scheme with values up to 28), RSRP, SNR, and power control parameters; however, most values show zero or unavailable data (n/a), which is typical of the initial connection establishment phase or periods of low activity in the experimental environment. These logs confirm the successful implementation of a multi-user scenario in a software-defined 5G SA network where multiple UEs with different radio channel characteristics and quality of service requirements are simultaneously served, generating a rich dataset for further analysis using machine learning techniques.
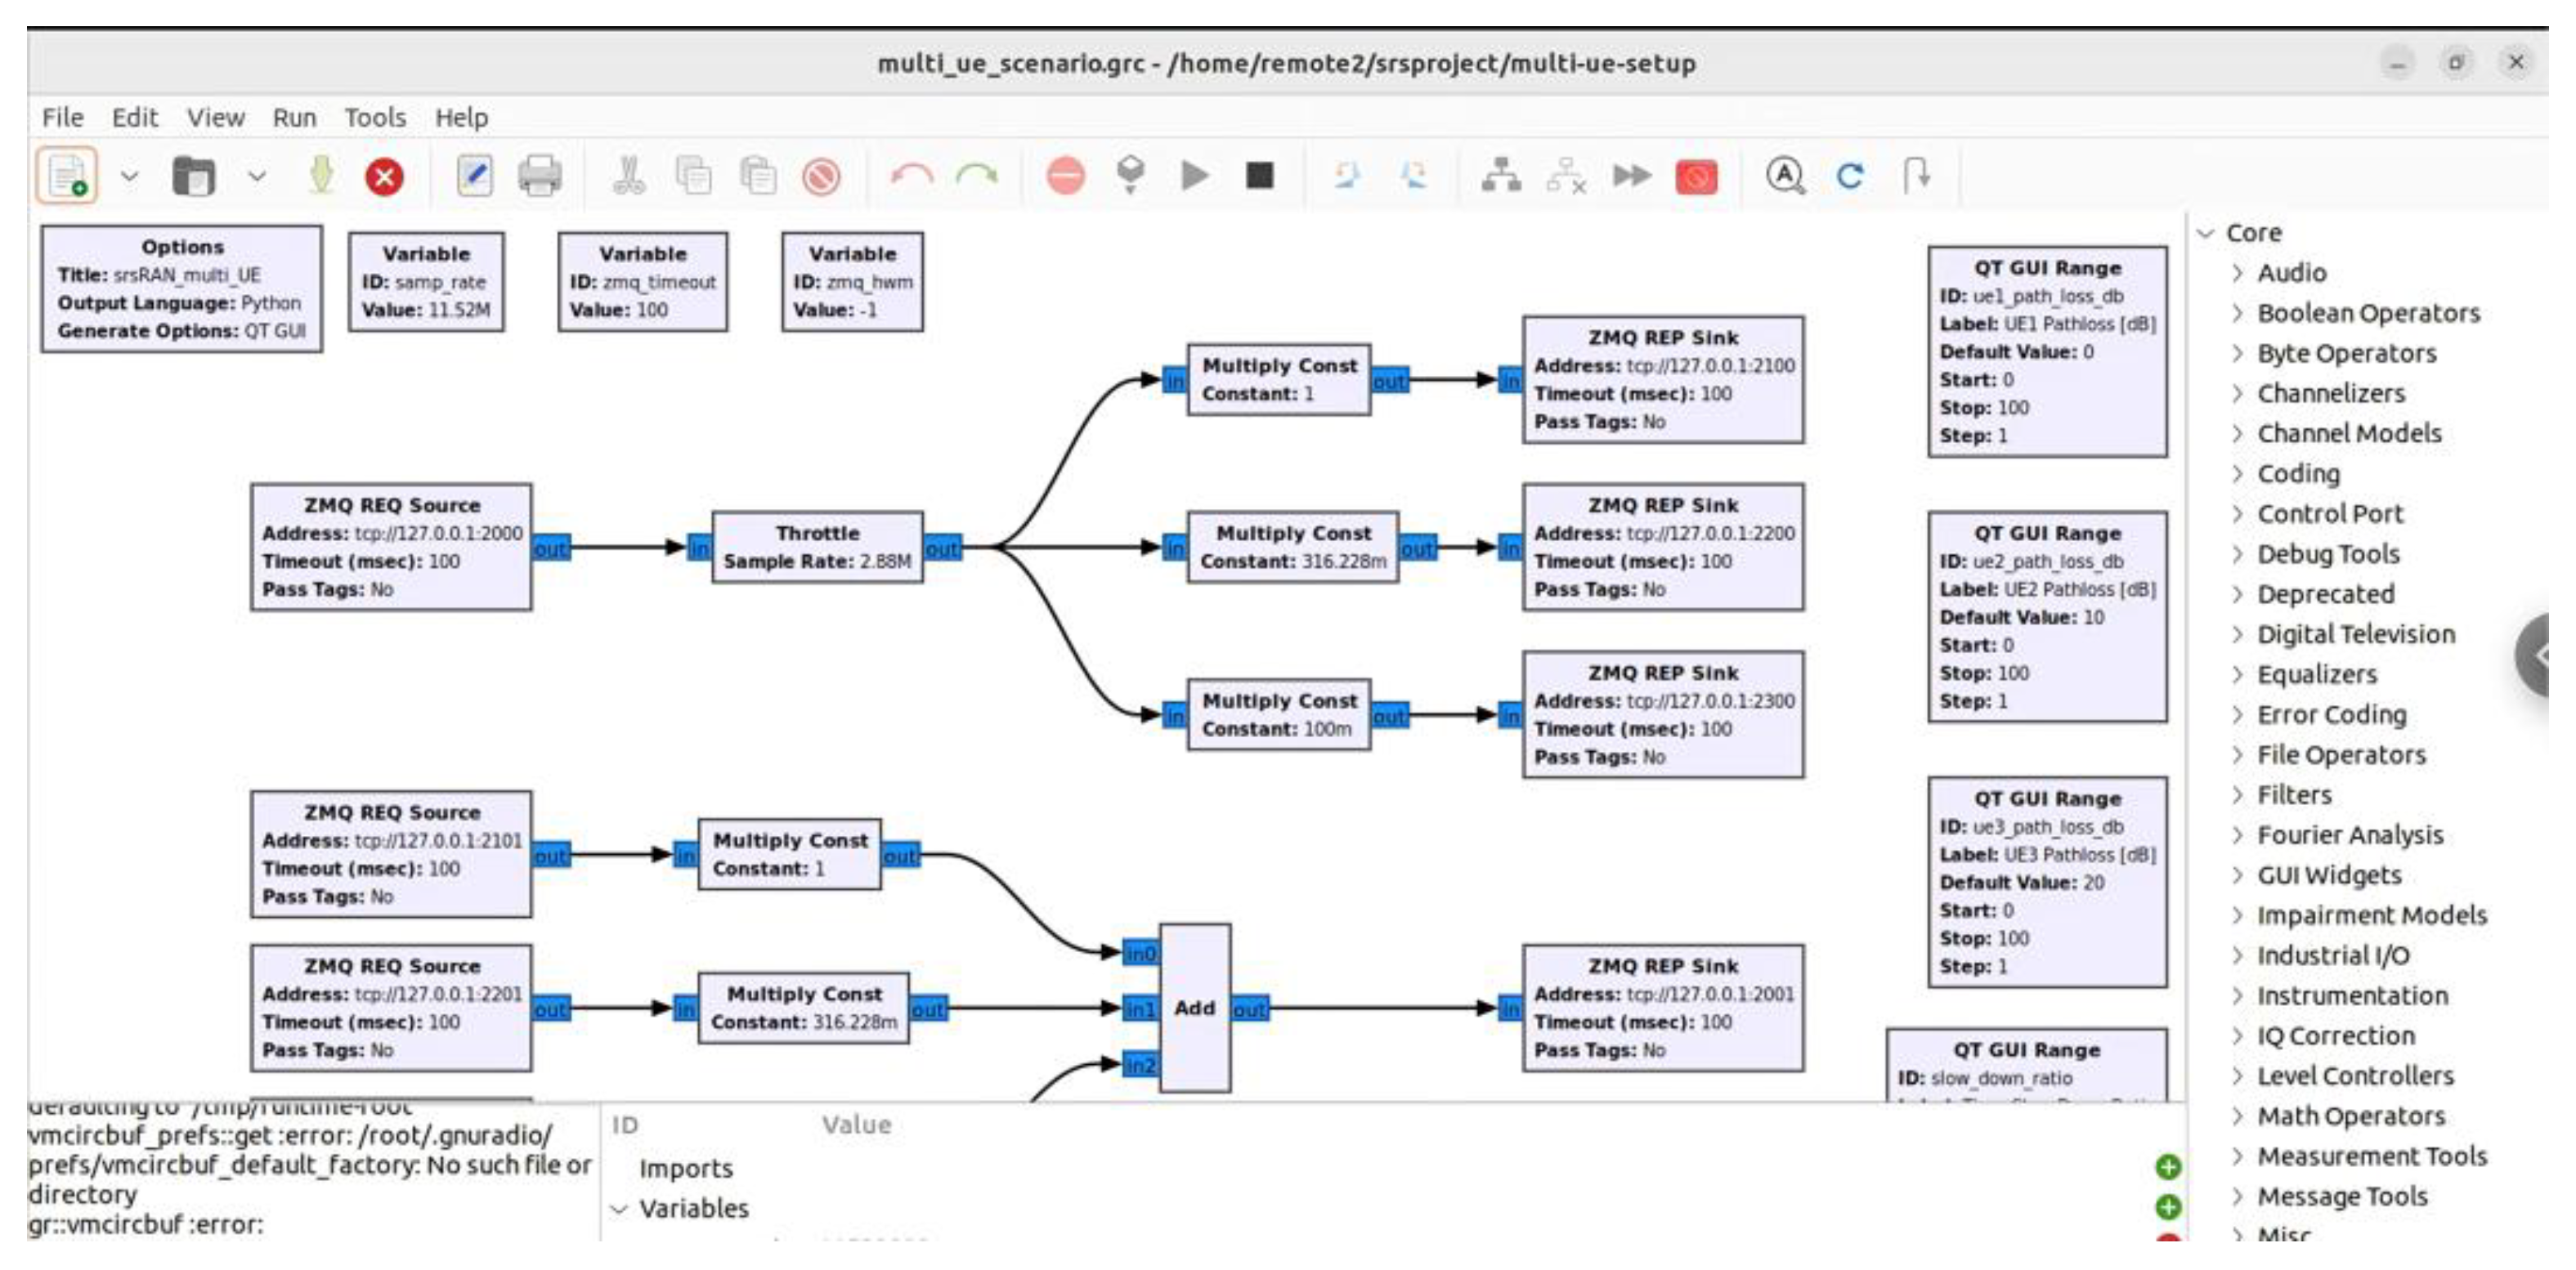
Figure 4 shows a GRC schematic for implementing a multi-user 5G SA scenario with radio emulation via ZeroMQ. The schematic demonstrates a software-defined radio architecture where multiple ZMQ REQ (ZeroMQ Request) sources with different addresses (tcp://127.0.0.0.1:2000, tcp://127.0.0.0.1:2001, tcp://127.0.0.0.1:2002) generate I/Q data from multiple emulated UEs, which are then passed through Throttle blocks to limit bandwidth and Multiply Const blocks to adjust the signal strength of each user. Signals from different users are combined using the Add block, simulating a superposition of signals in the radio airwaves, after which the resulting signal is fed into ZeroMQ REP Sink (ZeroMQ Reply Sink) blocks with corresponding TCP addresses for transmission to the srsRAN system via the ZeroMQ protocol. The right side of the diagram shows the QT GUI Range blocks for real-time interactive control of parameters, such as signal levels of different users, which allows dynamic modification of radio conditions and modeling of different load scenarios.
Simulation of communication between one base station (gNB) and three user devices (UE) with simulation of a real radio channel in GNU Radio Companion.

3.1. GNU Radio GUI Panel—Simulation Controls

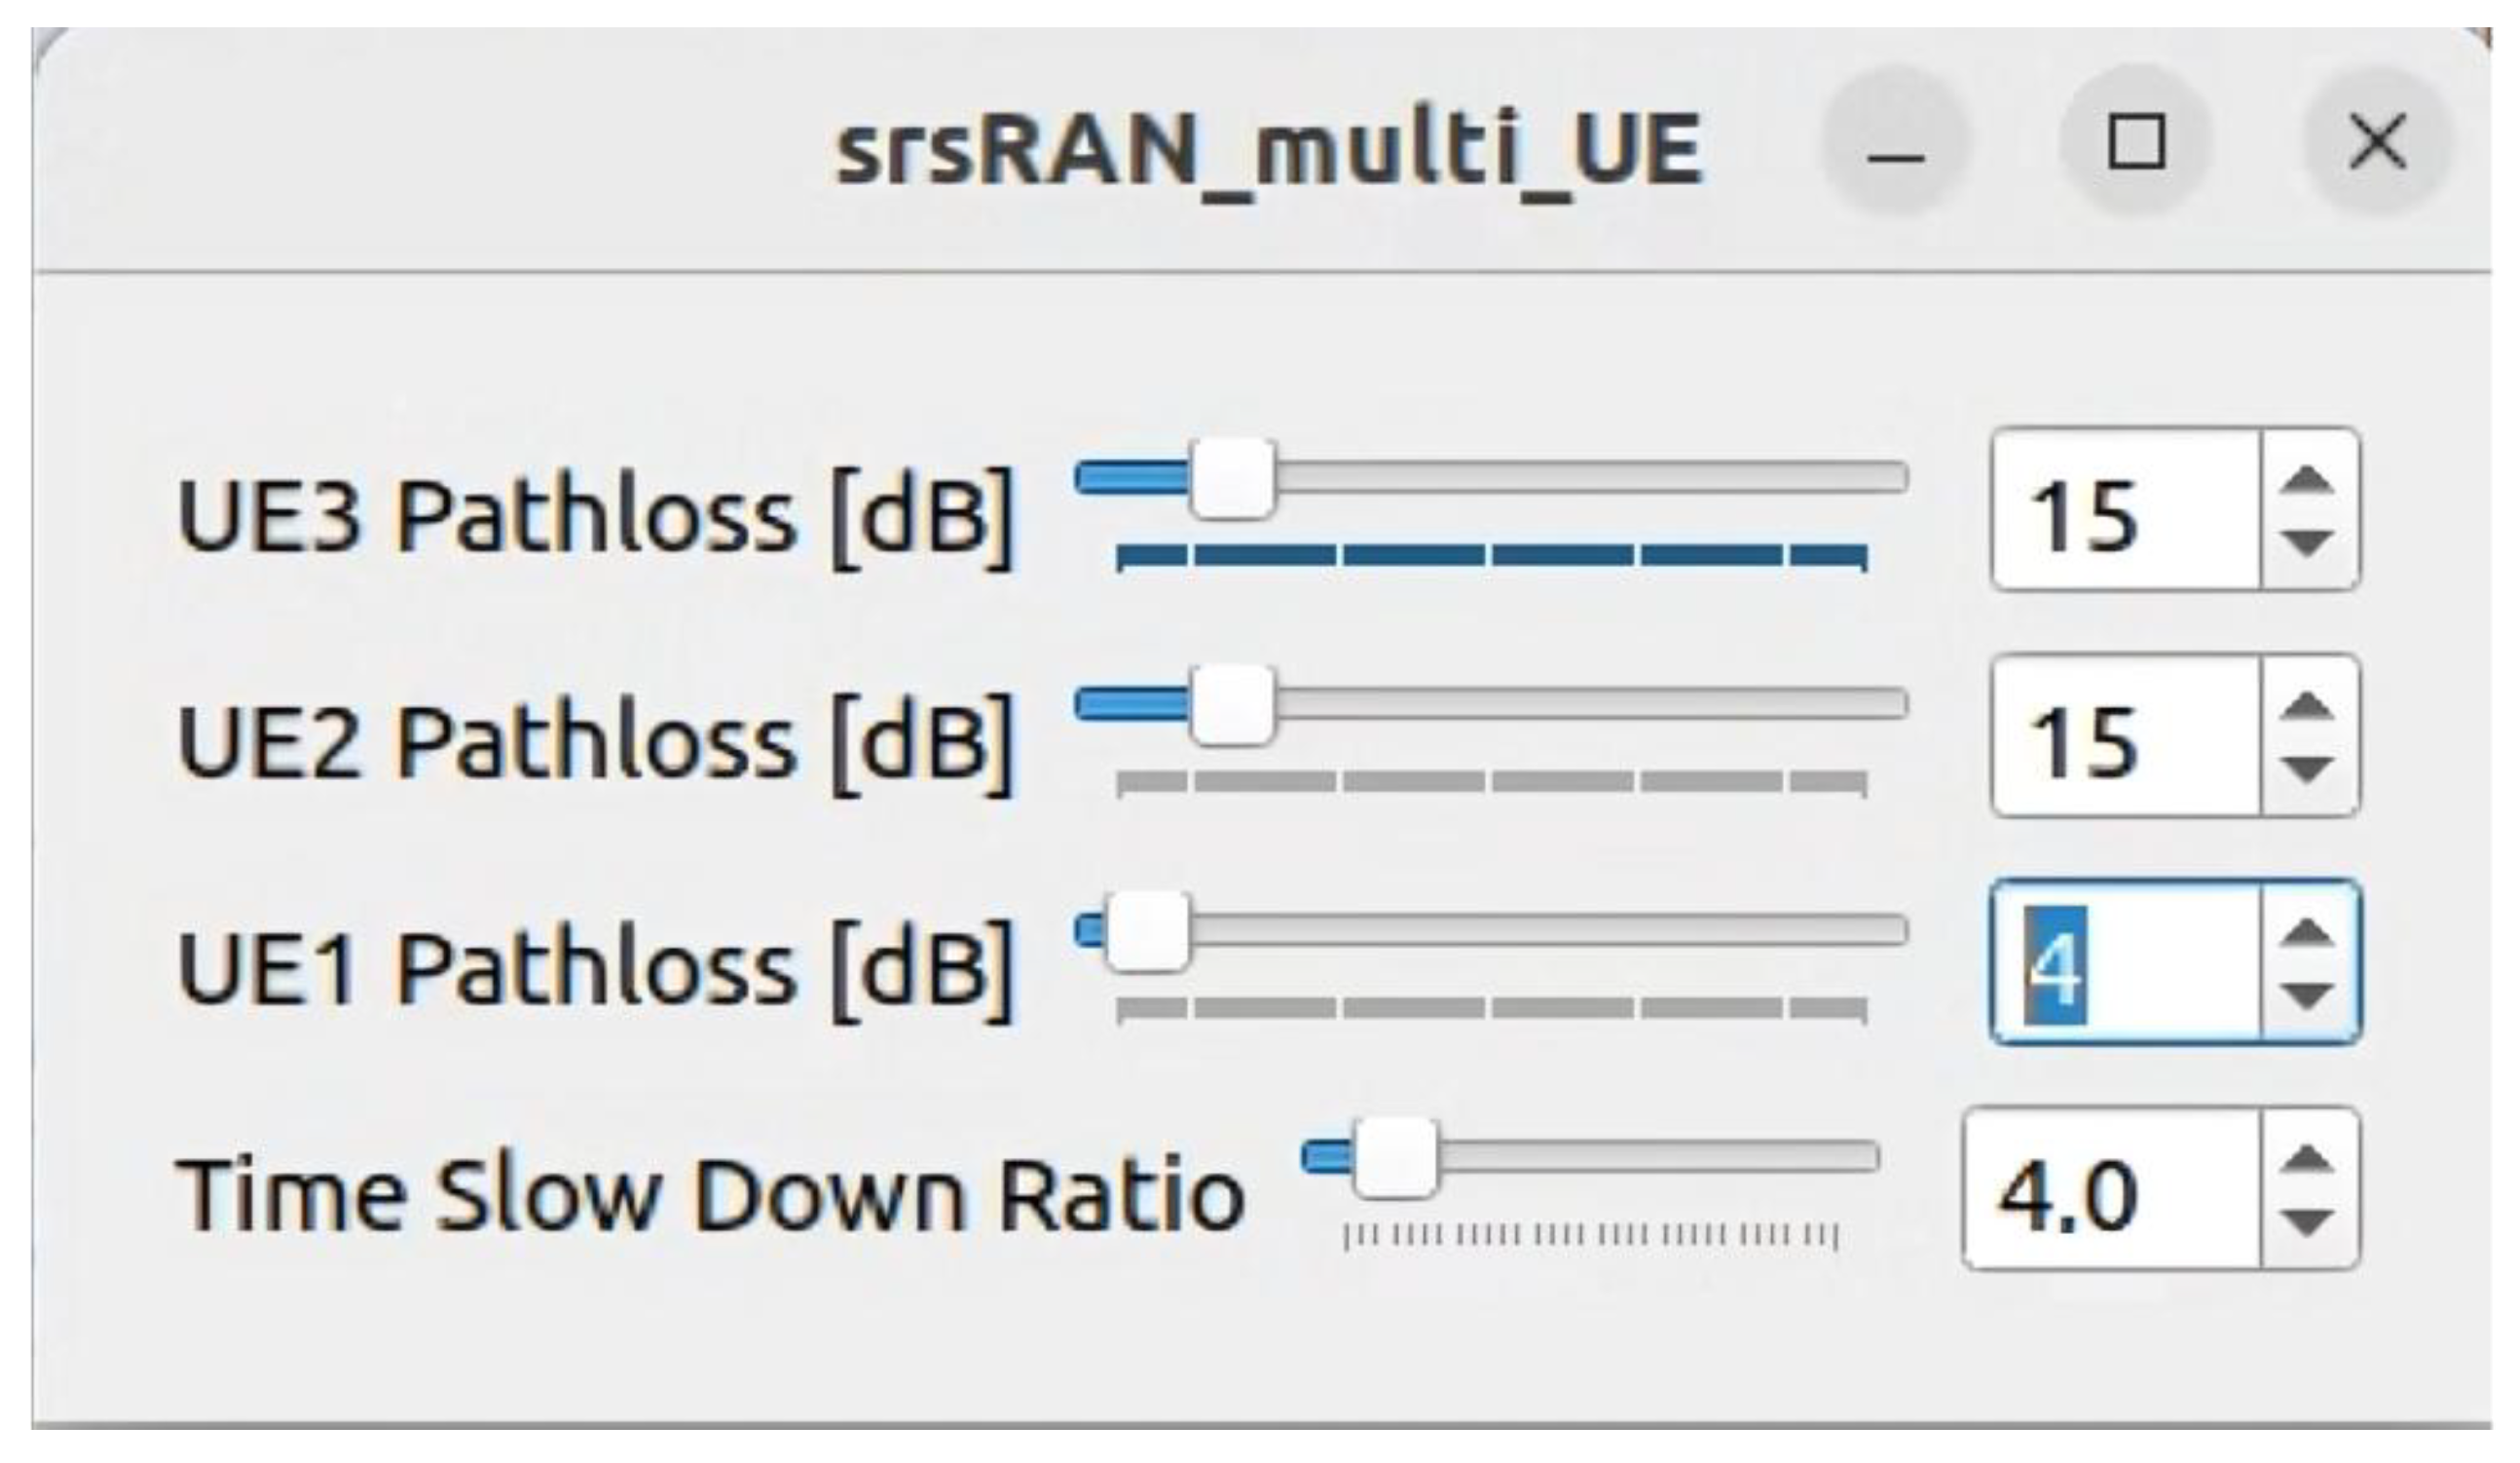
In the simulation, the Pathloss [dB] parameter for UE1, UE2, and UE3 defines the level of signal attenuation for each user device (see Figure 5): the lower the value in decibels, the closer the device is to the base station and the stronger the signal; conversely, a higher value indicates remoteness or the presence of obstacles that weaken the connection. This parameter can be changed during the simulation, which allows modeling subscriber movement or channel degradation.
The Time Slow Down Ratio parameter controls the speed of simulation execution, slowing it down or speeding it up, which is useful for log analysis and debugging—for example, to study in detail how the network reacts to changes in operating conditions.

3.2. Dataset and Target Variable

Following data preparation and enhancement, the final dataset was formulated. Table 1 offers a detailed breakdown of the variables that were instrumental in the training and subsequent evaluation of our models.
An initial exploratory analysis was conducted to understand the distribution of the target variable, brate_dl. As shown in Figure 6, the download speed exhibits a multimodal distribution, suggesting the presence of distinct operational states within the network environment from which the data was collected. This characteristic underscores the need for models capable of capturing complex, non-linear relationships.

3.3. Model Performance Comparison

The performance of the five regression models is quantitatively summarized in Table 2. To ensure the generalizability of these results, 3-fold cross-validation scores were also evaluated. As the table shows, the cross-validated R2 scores align closely with the test set scores, confirming that the models are robust and not overfitted. A clear hierarchy emerges from the results. The XGBoost model demonstrated superior performance, achieving the lowest MAE (37.375) and RMSE (83.309), coupled with the highest R2 score of 0.998. This indicates that the model can explain 99.8% of the variance in the target variable, signifying an exceptionally strong predictive capability. The Gradient Boosting model also performed impressively, with metrics closely trailing those of XGBoost, confirming the effectiveness of boosting algorithms for this dataset. While Random Forest and Decision Tree models provided reasonable predictions (R2 of 0.981 and 0.959, respectively), their error metrics were considerably higher. The Linear Regression model served as a baseline and, with an R2 of 0.869, performed the poorest, suggesting that the underlying relationships between the features and the download speed are predominantly non-linear. The outstanding performance of the tree-based ensemble methods, particularly XGBoost, justifies its selection for further in-depth analysis.

3.3.1. Analysis of the Best Model: XGBoost

Further analysis focused on the XGBoost model. Figure 7 provides a scatter plot of its predicted vs. actual values. The tight clustering of points along the diagonal identity line demonstrates the model’s high precision and lack of significant bias in its predictions across the range of download speeds.

3.3.2. Model Interpretation with SHAP

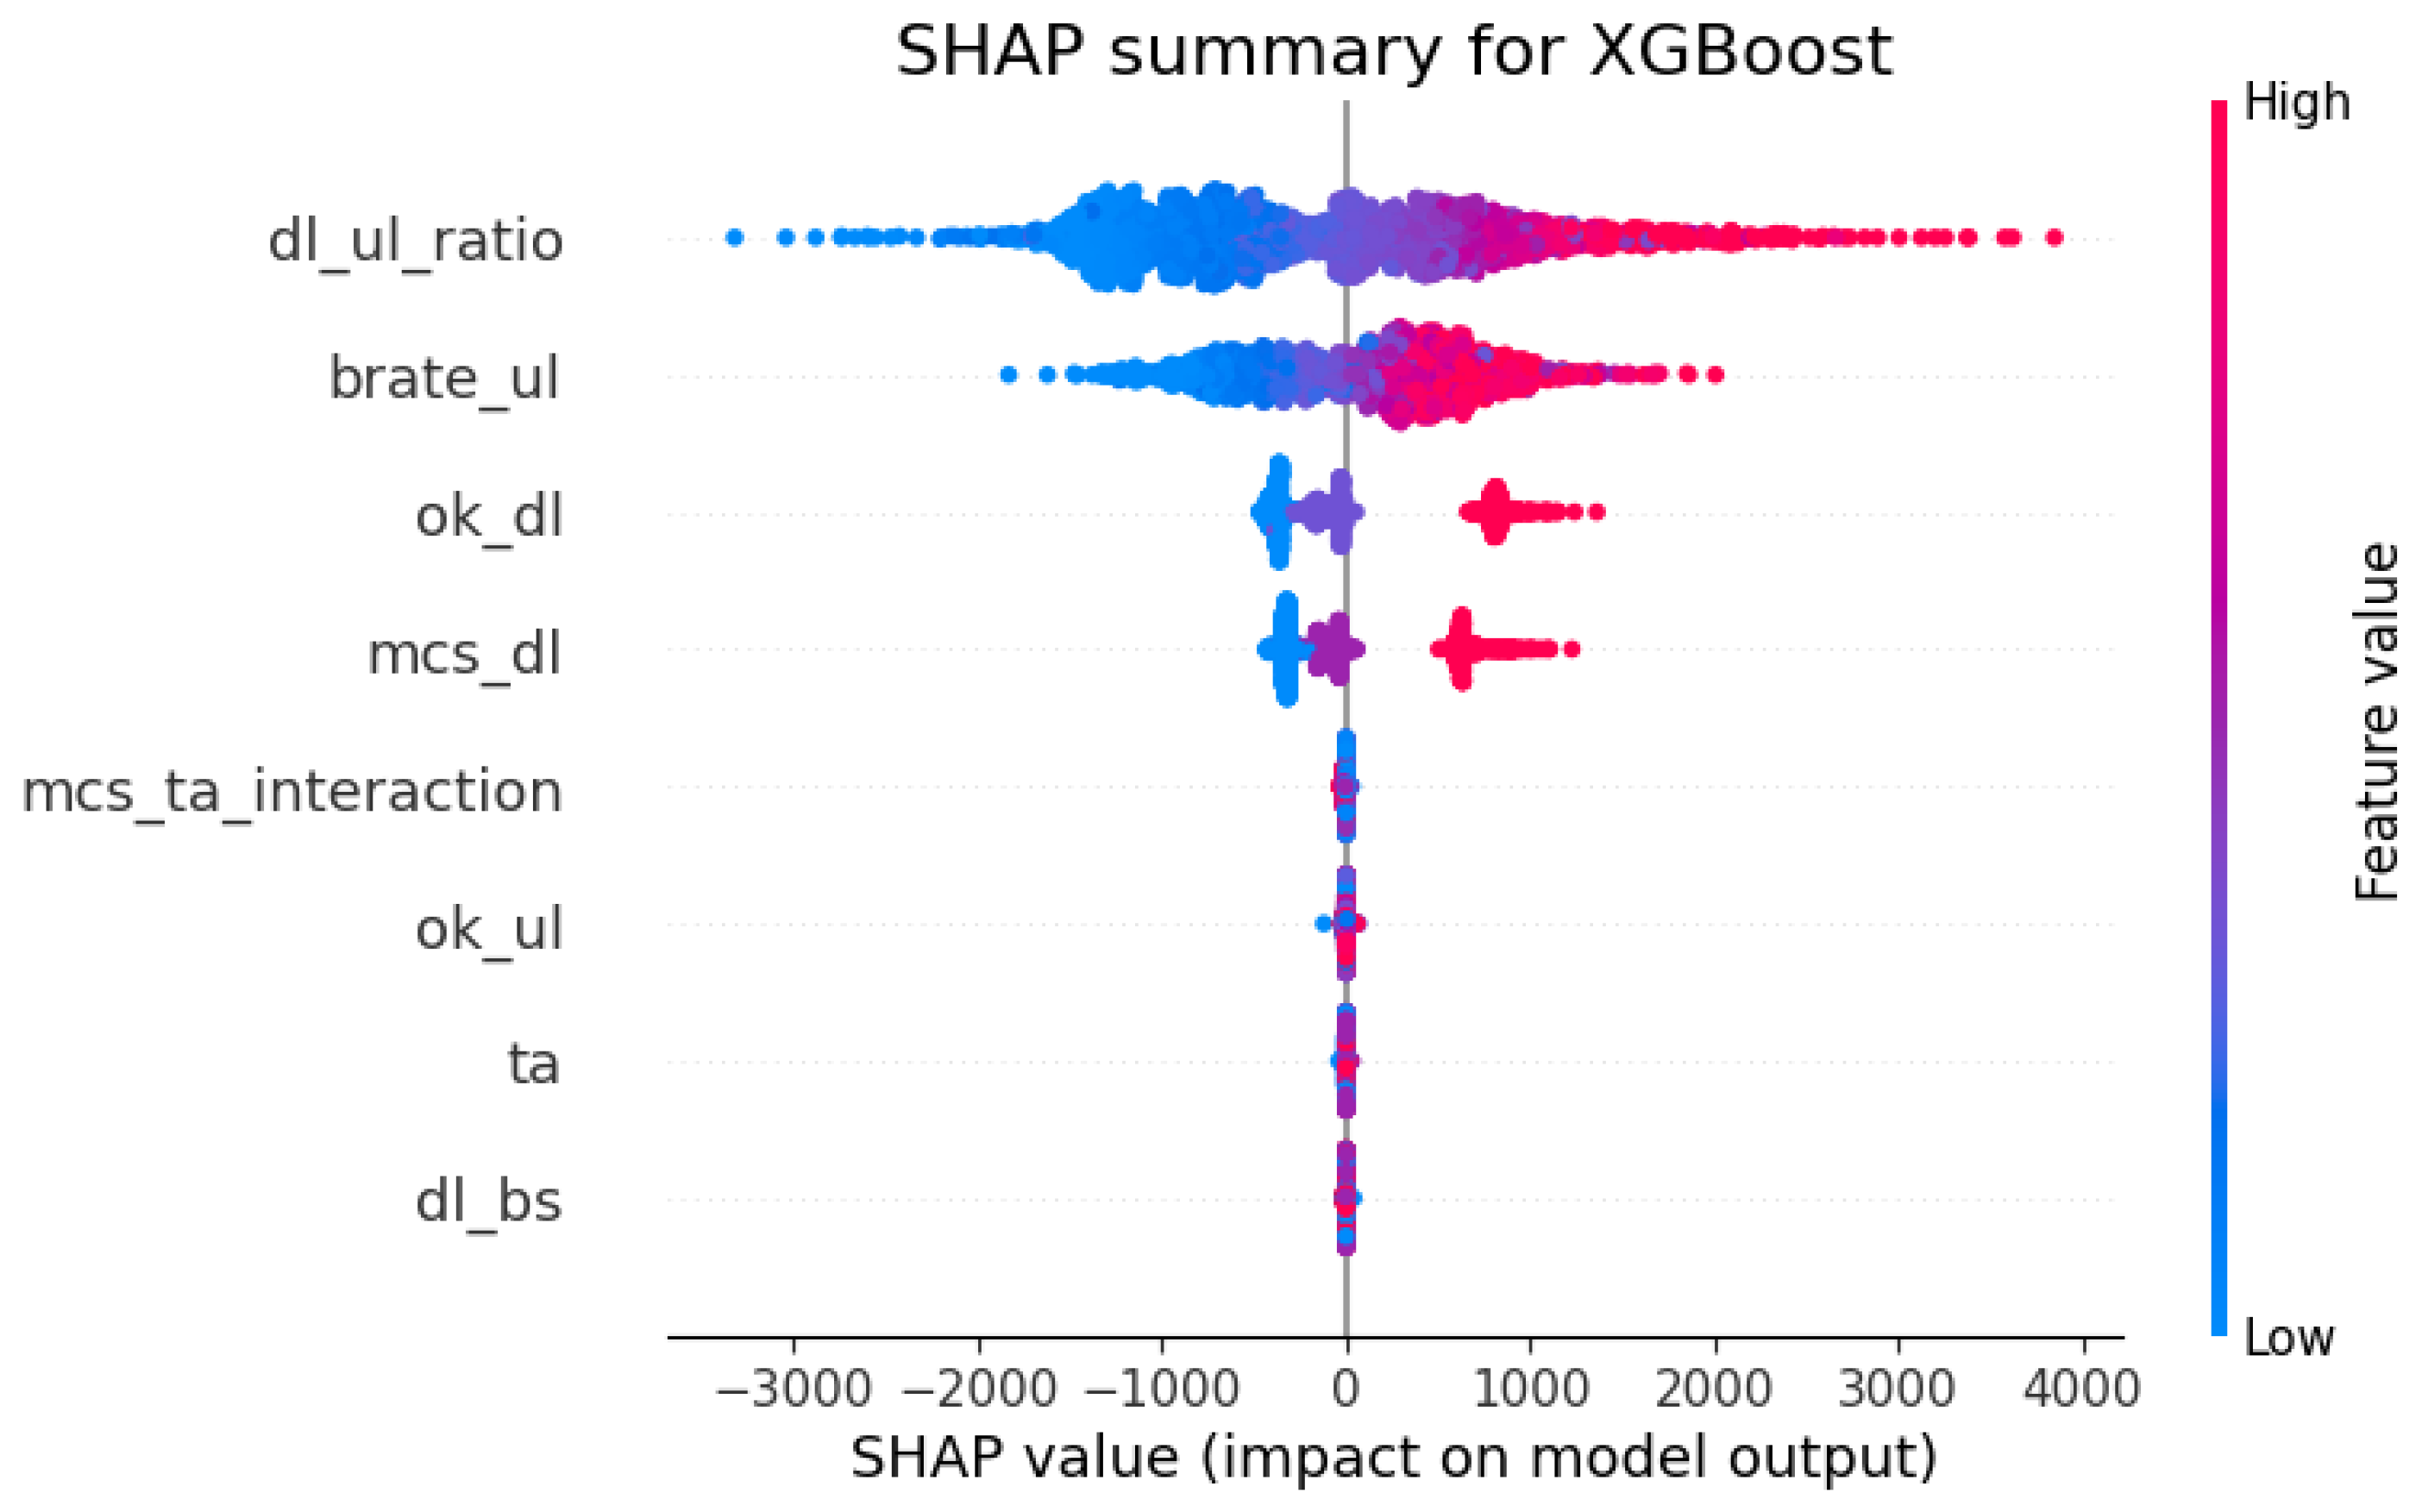
To understand the underlying drivers of the model’s predictions, a SHAP analysis was performed. The summary plot in Figure 8 illustrates the impact of each feature on the model’s output. The analysis reveals that dl_ul_ratio (the ratio of download to upload bitrate) and brate_ul (the upload bitrate) are the most influential features. This finding is strongly supported by fundamental network engineering principles.
The upload bitrate (brate_ul) serves as a powerful proxy for the overall radio link quality for a given user. In wireless systems, uplink and downlink conditions are closely coupled; a strong uplink connection capable of a high brate_ul generally signifies favorable channel conditions that also permit high download rates. Furthermore, critical control signals, such as channel quality feedback, are sent on the uplink. A robust uplink ensures this feedback is timely and accurate, allowing the base station to optimize downlink scheduling and achieve better performance.
The download-to-upload ratio (dl_ul_ratio) captures the traffic asymmetry and the network’s operational state. A high value for this feature indicates that network resources are predominantly allocated to serving downlink-heavy traffic (e.g., streaming). The model learns that when the system is in a state optimized for downloading, the resulting download speed (brate_dl) is naturally higher, making this ratio a very strong predictor.
For dl_ul_ratio and brate_dl, higher values (red points) correspond to a strong positive SHAP value, indicating they increase the predicted download speed, which aligns with expected network behavior.

4. Conclusions

This study successfully confronted the fundamental challenge of applying machine learning to network management, where models are frequently trained on chaotic, observational data from live systems. Such data is inherently “noisy” and filled with uncontrolled confounding variables, making it statistically difficult to isolate the impact of individual parameters and often leading to models that learn spurious correlations. Our research demonstrates a paradigm shift by moving from passive observation to active, controlled experimentation within a bespoke, software-defined 5G Standalone (SA) testbed. This methodology enabled the generation of controlled, high-fidelity data, free from the unpredictable artifacts that contaminate real-world datasets.
Our findings unequivocally establish the superiority of this approach. The XGBoost model, trained on our controlled dataset, achieved exceptional predictive power with an R2 score of 0.998, significantly outperforming other models, including a baseline Linear Regression model (R2 of 0.869). This highlights the predominantly non-linear relationships governing network performance. More significantly, this research transcends mere prediction. By employing SHAP for model interpretation, we created an explanatory framework that addresses the critical “black box” problem. The analysis revealed that the download-to-upload bitrate ratio (dl_ul_ratio) and the uplink bitrate (brate_ul) are the most dominant factors influencing download speeds. This ability to pinpoint and quantify the impact of specific parameters provides the clear, interpretable insights necessary for genuine network engineering.
Ultimately, this work validates the use of controlled experimental platforms to forge a path from correlation-based prediction to interpretable, data-driven explanation. The resulting framework provides a robust and generalizable foundation for developing intelligent, transparent, and efficient optimization strategies. As the telecommunications industry moves toward the unprecedented complexity of 6G, such a foundational, data-driven understanding will be indispensable for engineering the next generation of wireless networks.
Despite the promising results, this study has limitations that open avenues for future research. The experimental validation was conducted in a controlled, small-scale software-defined environment with only three UEs. While this approach was essential for isolating variables, the findings may not directly scale to large, dynamic commercial networks. Furthermore, while the use of CTGAN for data augmentation was effective, we acknowledge that any generative model can potentially introduce biases. However, since the CTGAN was trained exclusively on data from our controlled experimental environment, any learned biases would reflect the specific, clean dynamics of our testbed, aligning with the study’s primary objective. Therefore, future work should focus on validating these findings in larger, more heterogeneous testbeds. Nevertheless, this study provides a crucial methodological foundation for such future investigations.

Author Contributions

Conceptualization, Y.N. and T.I.; methodology, A.M.; software, A.M.; validation, A.M., Y.N., and S.A.; formal analysis, Y.N.; investigation, A.M.; resources, S.A.; data curation, S.A.; writing—original draft preparation, A.M. and S.A.; writing—review and editing, Y.N. and T.I.; visualization, A.M.; supervision, T.I.; project administration, T.I.; funding acquisition, T.I. All authors have read and agreed to the published version of the manuscript.

Funding

This research was funded by the Committee of Science of the Ministry of Science and Higher Education of the Republic of Kazakhstan (Grant No. BR24993211).

Data Availability Statement

The data presented in this study are available within the article.

Conflicts of Interest

The authors declare no conflicts of interest.

References

  1. Saad, W.; Bennis, M.; Chen, M. A vision of 6G wireless systems: Applications, trends, technologies, and challenges. IEEE Netw. 2019, 34, 134–142. [Google Scholar] [CrossRef]
  2. Zhang, Z.; Xiao, Y.; Ma, Z.; Xiao, M.; Ding, Z.; Lei, X.; Karagiannidis, G.K.; Fan, P. 6G wireless networks: Vision, requirements, architecture, and key technologies. IEEE Veh. Technol. Mag. 2019, 14, 28–41. [Google Scholar] [CrossRef]
  3. Tariq, F.; Khandaker, M.R.A.; Wong, K.K.; Imran, M.A.; Bennis, M.; Debbah, M. A speculative study on 6G. IEEE Wirel. Commun. 2020, 27, 118–125. [Google Scholar] [CrossRef]
  4. Strinati, E.C.; Barbarossa, S.; Gonzalez-Jimenez, J.L.; Ktenas, D.; Cassiau, N.; Maret, L.; Dehos, C. 6G: The next frontier: From holographic messaging to artificial intelligence using subterahertz and visible light communication. IEEE Veh. Technol. Mag. 2019, 14, 42–50. [Google Scholar] [CrossRef]
  5. Shafin, R.; Liu, L.; Chandrasekhar, V.; Chen, H.; Reed, J.; Zhang, J.C. Artificial intelligence-enabled cellular networks: A critical path to beyond-5G and 6G. IEEE Wirel. Commun. 2020, 27, 212–217. [Google Scholar] [CrossRef]
  6. Kato, N.; Fadlullah, Z.M.; Tang, F.; Mao, B.; Tani, S.; Okamura, A.; Liu, J. Optimizing space-air-ground integrated networks by artificial intelligence. IEEE Wirel. Commun. 2019, 26, 140–147. [Google Scholar] [CrossRef]
  7. Morocho-Cayamcela, M.E.; Lim, W. Artificial intelligence in 5G technology: A survey. In Proceedings of the 2019 International Conference on Information and Communication Technology Convergence (ICTC), Jeju Island, Republic of Korea, 16–18 October 2019; IEEE: Washington, DC, USA; pp. 560–565. [Google Scholar]
  8. Sun, Y.; Peng, M.; Mao, S. Deep reinforcement learning for intelligent resource management in 5G and beyond. IEEE Wirel. Commun. 2019, 26, 8–14. [Google Scholar]
  9. Cheng, N.F.; Pamuklu, T.; Erol-Kantarci, M. Reinforcement learning based resource allocation for network slices in O-RAN midhaul. In Proceedings of the 2023 IEEE 20th Consumer Communications & Networking Conference (CCNC), Las Vegas, NV, USA, 10–13 January 2025; IEEE: Washington, DC, USA; pp. 678–683. [Google Scholar]
  10. Gao, Z. 5G traffic prediction based on deep learning. Comput. Intell. Neurosci. 2022, 2022, 3174530. [Google Scholar] [CrossRef]
  11. Sinha, A.; Agrawal, A.; Roy, S.; Uduthalapally, V.; Das, D.; Mahapatra, R.; Shetty, S. AnDet: ML-Based Anomaly Detection of UEs in a Multi-Cell B5G Mobile Network for Improved QoS. In Proceedings of the 2024 International Conference on Computing, Networking and Communications (ICNC), Big Island, HI, USA, 19–22 February 2024; pp. 500–505. [Google Scholar]
  12. Bega, D.; Gramaglia, M.; Banchs, A.; Sciancalepore, V.; Costa-Perez, X. A deep learning approach to 5G network slicing resource management. IEEE Trans. Mob. Comput. 2020, 20, 3056–3069. [Google Scholar]
  13. Khan, L.U.; Saad, W.; Han, Z.; Hossain, E.; Hong, C.S. Federated learning for internet of things: Recent advances, taxonomy, and open challenges. IEEE Commun. Surv. Tutor. 2021, 23, 1759–1799. [Google Scholar] [CrossRef]
  14. Li, T.; Sahu, A.K.; Talwalkar, A.; Smith, V. Federated learning: Challenges, methods, and future directions. IEEE Signal Process. Mag. 2020, 37, 50–60. [Google Scholar] [CrossRef]
  15. Chen, T.; Yu, J.; Minakhmetov, A.; Gutterman, C.; Sherman, M.; Zhu, S.; Santaniello, S.; Biswas, A.; Seskar, I.; Zussman, G.; et al. A software-defined programmable testbed for beyond 5G optical-wireless experimentation at city-scale. IEEE Netw. 2022, 36, 108–115. [Google Scholar] [CrossRef]
  16. Nahum, C.V.; Pinto, L.D.N.M.; Tavares, V.B.; Batista, P.; Lins, S.; Linder, N.; Klautau, A. Testbed for 5G connected artificial intelligence on virtualized networks. IEEE Access 2020, 8, 223202–223213. [Google Scholar]
  17. Alsamhi, S.H.; Ma, O.; Ansari, M.S.; Almalki, F.A. Survey on Collaborative Smart Drones and Internet of Things for Improving Smartness of Smart Cities. IEEE Access 2019, 7, 128125–128152. [Google Scholar] [CrossRef]
  18. Fourati, H.; Maaloul, R.; Chaari, L. A Survey of 5G Network Systems: Challenges and Machine Learning Approaches. Int. J. Mach. Learn. Cyber. 2020, 12, 385–431. [Google Scholar] [CrossRef]
  19. Zhang, C.; Patras, P.; Haddadi, H. Deep Learning in Mobile and Wireless Networking: A Survey. IEEE Commun. Surv. Tutor. 2019, 21, 2224–2287. [Google Scholar] [CrossRef]
  20. Usama, M.; Ahmad, R.; Qadir, J. Examining machine learning for 5G and beyond through an adversarial lens. IEEE Netw. 2021, 35, 188–195. [Google Scholar] [CrossRef]
  21. Polaganga, R.K.; Liang, Q. Extending Causal Discovery to Live 5G NR Network With Novel Proportional Fair Scheduler Enhancements. IEEE Internet Things J. 2024, 12, 288–296. [Google Scholar] [CrossRef]
  22. Pearl, J. The seven tools of causal inference, with reflections on machine learning. Commun. ACM 2019, 62, 54–60. [Google Scholar] [CrossRef]
  23. Glymour, C.; Zhang, K.; Spirtes, P. Review of causal discovery methods based on graphical models. Front. Genet. 2019, 10, 524. [Google Scholar] [CrossRef]
  24. Shah, R.D.; Peters, J. The hardness of conditional independence testing and the generalized covariance measure. Ann. Stat. 2020, 48, 1514–1538. [Google Scholar] [CrossRef]
  25. Gunning, D.; Stefik, M.; Choi, J.; Miller, T.; Stumpf, S.; Yang, G.Z. XAI—Explainable artificial intelligence. Sci. Robot. 2019, 4, eaay7120. [Google Scholar] [CrossRef] [PubMed]
  26. Arya, L.; Raju, E.S.; Santosh, M.V.S.; MPJ, S.K.; Rastogi, R.; Elloumi, M.; Arumugam, T.; Namasivayam, B. Explainable Artificial Intelligence (XAI) for Ethical and Trustworthy Decision-Making in 6G Networks. In 6G Networks and AI-Driven Cybersecurity; IGI Global Scientific Publishing: Palmdale, PA, USA, 2025; pp. 217–250. [Google Scholar] [CrossRef]
  27. Montgomery, D.C.; Peck, E.A.; Vining, G.G. Introduction to Linear Regression Analysis, 6th ed.; John Wiley & Sons: Hoboken, NJ, USA, 2021. [Google Scholar]
  28. Mienye, I.D.; Jere, N. A Survey of Decision Trees: Concepts, Algorithms, and Applications. IEEE Access 2024, 12, 86716–86727. [Google Scholar] [CrossRef]
  29. Schonlau, M.; Zou, R.Y. The Random Forest Algorithm for Statistical Learning. Stata J. Promot. Commun. Stat. Stata 2020, 20, 3–29. [Google Scholar] [CrossRef]
  30. Bentéjac, C.; Csörgő, A.; Martínez-Muñoz, G. A Comparative Analysis of Gradient Boosting Algorithms. Artif. Intell. Rev. 2020, 54, 1937–1967. [Google Scholar] [CrossRef]
  31. Ogunleye, A.; Wang, Q.-G. XGBoost Model for Chronic Kidney Disease Diagnosis. IEEE/ACM Trans. Comput. Biol. Bioinf. 2020, 17, 2131–2140. [Google Scholar] [CrossRef]
  32. Pedregosa, F.; Varoquaux, G.; Gramfort, A.; Michel, V.; Thirion, B.; Grisel, O.; Blondel, M.; Müller, A.; Nothman, J.; Louppe, G.; et al. Scikit-Learn: Machine Learning in Python. arXiv 2012. [Google Scholar] [CrossRef]
  33. Lundberg, S.; Lee, S.-I. A Unified Approach to Interpreting Model Predictions. In Advances in Neural Information Processing Systems; NIPS: Cambridge, MA, USA, 2017. [Google Scholar]
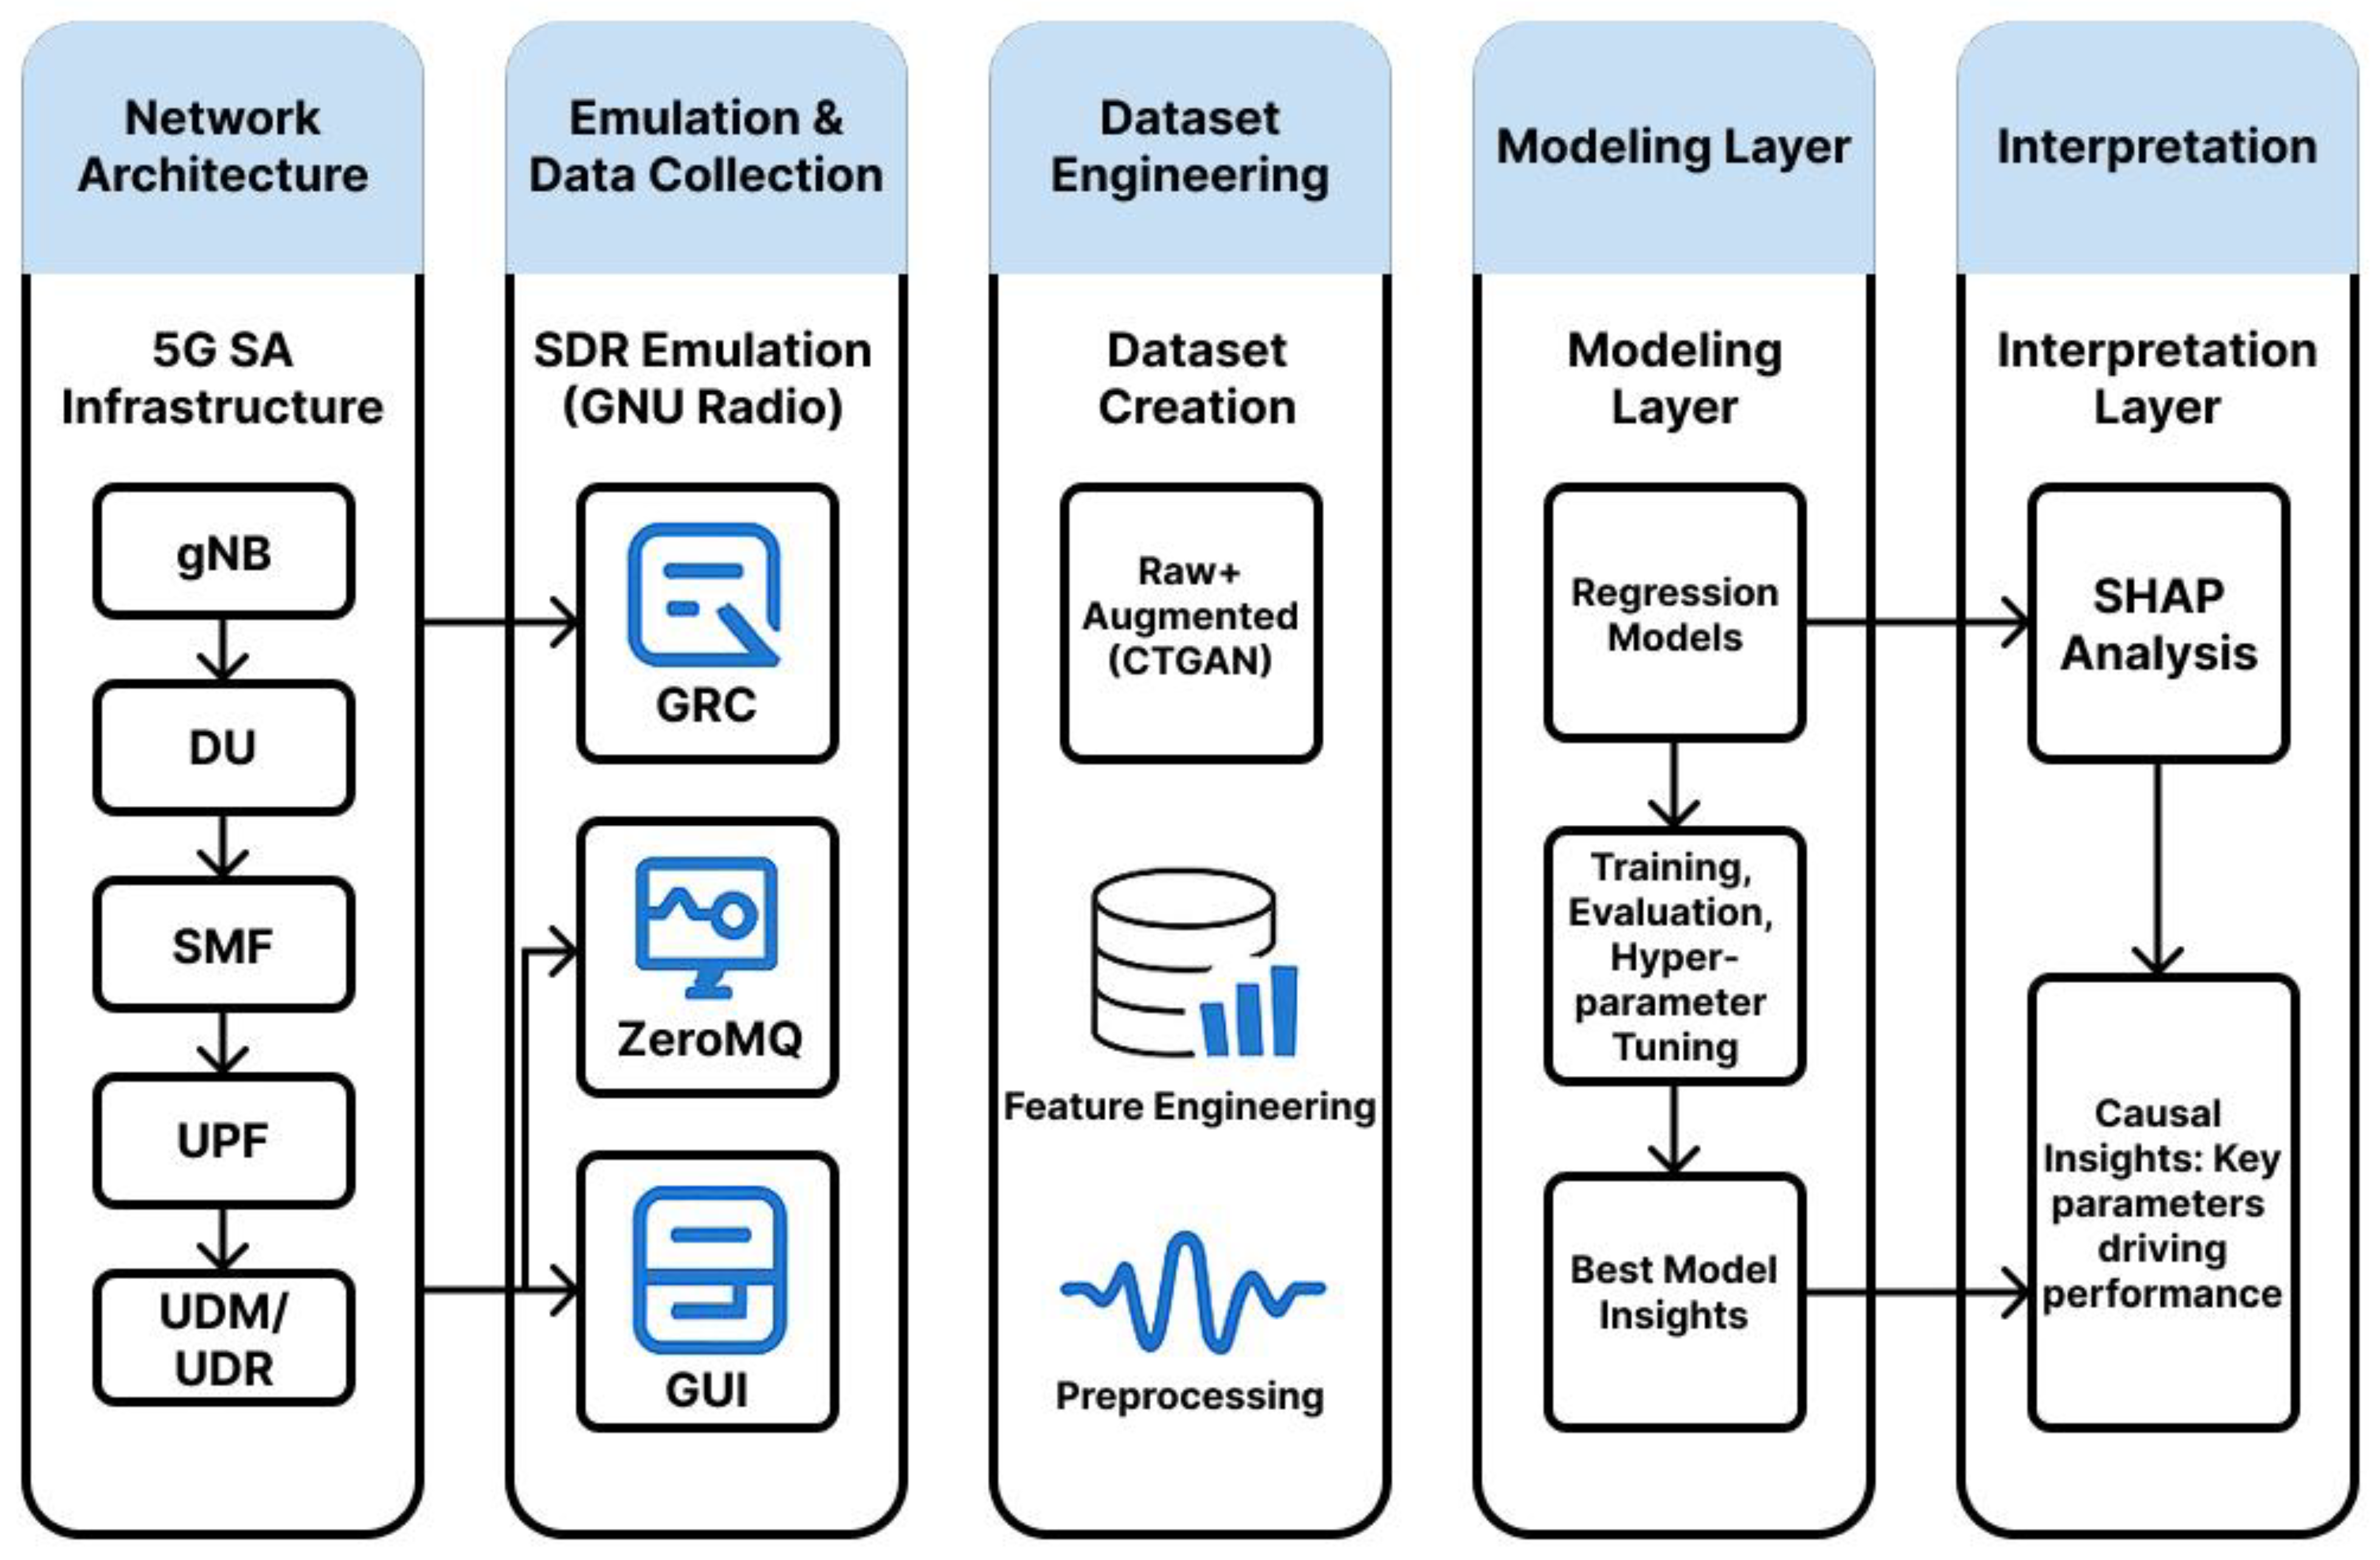
Figure 1. End-to-end architectural overview of the explanatory analysis pipeline in 5G SA systems.
Electronics 14 03817 g001
Figure 2. Live performance monitoring of a multi-UE 5G SA system in srsRAN.
Electronics 14 03817 g002
Figure 3. Detailed physical layer telemetry for a 5G NR connection.
Electronics 14 03817 g003
Figure 4. GNU Radio Companion schematic for a multi-user 5G emulation environment.
Electronics 14 03817 g004
Figure 5. Interactive GUI panel for real-time control of UE Pathloss in the GNU Radio simulation.
Electronics 14 03817 g005
Figure 6. Target variable distribution.
Electronics 14 03817 g006
Figure 7. Predicted vs. actual values (XGBoost).
Electronics 14 03817 g007
Figure 8. SHAP summary plot.
Electronics 14 03817 g008
Table 1. Final Dataset.
Column NameDescription
mcs_dlA parameter influencing download speed.
brate_dlThe download speed from the network.
ok_dlCount of successfully received download packets.
dl_bsThe volume of data queued for download.
brate_ulThe upload speed to the network.
ok_ulCount of successfully transmitted upload packets.
taSynchronizes a device’s signal with the cell tower.
dl_ul_ratioThe ratio of download speed to upload speed.
mcs_ta_interactionA combined value showing the interaction between mcs_dl and ta.
Table 2. Comparative performance metrics of the models.
ModelMAERMSER2R2 (3-Fold CV Mean)
XGBoost37.37583.3090.9980.996
Gradient Boosting45.16691.4370.9970.995
Random Forest150.927236.7350.9810.978
Decision Tree179.224352.2470.9590.967
Linear Regression417.181626.9360.8690.880
Disclaimer/Publisher’s Note: The statements, opinions and data contained in all publications are solely those of the individual author(s) and contributor(s) and not of MDPI and/or the editor(s). MDPI and/or the editor(s) disclaim responsibility for any injury to people or property resulting from any ideas, methods, instructions or products referred to in the content.