Article

Optimal Capacity Configuration of Multi-Type Renewable Energy in Islanded LCC-HVDC Transmission Systems

1
Southwest Branch of State Grid Corporation, Chengdu 610041, China
2
College of Electrical Engineering, Sichuan University, Chengdu 610065, China
*
Author to whom correspondence should be addressed.
Electronics 2025, 14(17), 3557; https://doi.org/10.3390/electronics14173557
Submission received: 26 July 2025 / Revised: 29 August 2025 / Accepted: 4 September 2025 / Published: 7 September 2025

Abstract

The islanded line-commutated-converter-based high-voltage direct-current (LCC-HVDC) transmission system is becoming a key solution for delivering multiple types of clean energy from large-scale renewable energy bases, including wind power, photovoltaic power, hydropower, and energy storage. However, the high penetration of renewable sources significantly increases the risks of frequency fluctuations and voltage violations due to their inherent volatility and uncertainty, posing serious challenges to system stability. To enhance the integration capacity of clean energy and ensure the stable operation of islanded systems, this paper proposes a maximum capacity optimization method tailored for islanded DC transmission involving multiple energy types. A K-medoids clustering algorithm is applied to historical data to extract typical wind and photovoltaic output scenarios, and a virtual balancing node is introduced. Subsequently, an active power droop control strategy and reactive power regulation are applied to enhance system frequency and voltage stability. Finally, the capacities of wind, photovoltaic, and energy storage systems are jointly optimized using particle swarm optimization. Simulation results demonstrate that the proposed approach can accurately determine the maximum allowable integration of wind and photovoltaic power while satisfying system operational constraints, and effectively reduce the required energy storage capacity.

1. Introduction

In recent years, the rapid expansion of renewable energy sources such as wind, photovoltaic (PV), and hydropower has created an urgent demand for efficient long-distance and large-capacity transmission technologies [1,2,3]. High-voltage direct-current (HVDC) systems, owing to their high efficiency and strong adaptability, have become a key solution for delivering multi-type renewable energy from large-scale bases [4,5,6]. In remote regions with limited conventional power support, islanded DC transmission systems are often formed, where challenges such as insufficient frequency support and difficult voltage regulation must be addressed to ensure safe and stable operation [7,8,9].
Compared with complex and costly flexible HVDC schemes, line-commutated converter HVDC (LCC-HVDC) systems offer higher feasibility in isolated scenarios due to their maturity, cost-effectiveness, and strong environmental adaptability [10,11,12]. However, the high penetration of volatile renewables in such systems exacerbates risks of frequency fluctuations and voltage instability, making optimal planning and coordinated control essential.
Research on Islanded DC systems has mainly focused on operational control and fault analysis. Reference [13] proposed a startup and coordination control strategy based on a Static Synchronous Compensator (STATCOM) for isolated direct-drive wind farms connected to LCC-HVDC systems. Reference [14] proposes a DC voltage control strategy for integrated systems based on cascaded hybrid high-voltage direct-current (HVDC) transmission, aiming to ensure the stable operation of large-scale isolated onshore wind farms under wind curtailment conditions. Reference [8] introduces a novel DC supplementary frequency robust controller that improves frequency stability at the sending end of HVDC island systems during operation. Reference [15] investigates the frequency and voltage characteristics of isolated HVDC systems along with corresponding control strategies. These studies provide valuable insights into system stability and control, but they mainly emphasize operational enhancement rather than capacity optimization for renewable accommodation.
A considerable amount of research has been conducted on renewable energy capacity configuration and system stability. Reference [16] proposes a novel data-driven distributed control method to address voltage stability issues arising from renewable energy integration. Reference [17] presents an offshore wind power accommodation strategy that considers both peak regulation capability and static security constraints, and verifies its feasibility in a regional power grid. Reference [18] develops a coordinated capacity planning method for PV generation and hybrid energy storage in a self-sufficient rail transit energy system, taking into account distributed PV power fluctuations and energy storage cycle life. Reference [19] proposes a hybrid optimal configuration approach for PV and wind thermal power plants based on multi-objective optimization, and employs an evolutionary algorithm to obtain the optimal capacity scheme. Reference [20] proposes an optimal capacity configuration model for wind power, PV power, hydropower, and energy storage systems, aiming to minimize the total system cost. However, most of the above methods do not fully consider the unique operational characteristics of islanded DC systems, making them less applicable to capacity optimization under complex operating scenarios.
Existing studies on capacity configuration mainly focus on cost minimization, storage lifetime, or sector-specific applications [18,20,21]. However, few works explicitly consider the operational characteristics and stringent stability constraints of islanded DC transmission systems. Table 1 compares the proposed method with representative studies, highlighting its originality in maximizing renewable accommodation while incorporating frequency and voltage stability into the optimization framework.
This paper proposes an optimal capacity configuration method for islanded LCC-HVDC transmission systems integrating multiple renewable sources, with system stability constraints. The main contributions are as follows:
(1)
Construction of typical wind and PV generation scenarios via a K-medoids clustering method, and development of an islanded power flow framework using a virtual balancing node.
(2)
Incorporation of active power droop control and quadratic programming-based reactive power optimization to enhance frequency and voltage stability.
(3)
A particle swarm optimization (PSO) algorithm is applied to realize the maximum capacity configuration of renewable energy in a water–wind–PV–storage-integrated islanded DC transmission system under operational constraints.
The remainder of this paper is structured as follows: Section 2 introduces the modeling of the islanded system and the K-medoids clustering method for typical scenario extraction. Section 3 formulates the islanded power flow model based on virtual nodes and presents the virtual balancing power allocation strategy based on droop control and quadratic programming. Section 4 presents the design of the particle swarm optimization algorithm and the capacity configuration strategy. Section 5 provides simulation results to validate the effectiveness of the proposed method. Section 6 is the conclusion of this paper.

2. Topology of DC Island Transmission and New Energy Scene Clustering

2.1. Topology of Islanded DC Transmission for Renewable Energy Integration

Figure 1 illustrates a typical islanded LCC-HVDC transmission system for renewable energy integration, which enables the bundling and long-distance centralized delivery of various clean energy sources such as wind power, PV power, hydropower, and energy storage. On the left side of the system are multiple types of renewable energy inputs, including hydropower units, wind turbines, PV arrays, and energy storage system. These sources are connected in parallel to an AC bus via power electronic interface converters, each providing active and reactive power support to enhance system controllability and operational flexibility. To cope with the power uncertainty caused by the intermittency of renewable energy sources, the energy storage system plays a key role in fast response and peak shaving.
Hydropower, wind, PV, and energy storage are connected to the common AC bus and then transmitted over long distances through the LCC-HVDC system. The LCC-HVDC converter station is equipped with converter transformers, valve groups, and reactive power compensation devices to provide the necessary voltage and reactive power support for the conversion process, thereby enhancing converter stability and overall system power quality.
Under islanded operating conditions, the system is decoupled from the main grid, resulting in significant power output fluctuations from renewable energy sources and lacking the inertia and frequency support provided by conventional synchronous generators, which can easily lead to frequency instability. To enhance the frequency regulation capability of the system and further expand renewable energy integration capacity, the LCC-HVDC system incorporates an active power droop control strategy. By emulating the active P/f characteristics of synchronous machines, this control dynamically adjusts the DC sending-end power. The mechanism automatically adjusts the active power output of the LCC based on system frequency deviations, thereby enabling frequency regulation functionality similar to that of synchronous generators. Consequently, it improves the stability of the islanded system and the grid integration adaptability of renewable energy. This virtual inertia control strategy improves frequency regulation capability while supporting the integration of high-penetration renewable energy sources.

2.2. Renewable Energy Scenario Clustering

Due to the significant randomness and uncertainty of PV and wind power generation, it is impractical to analyze and evaluate the power output of each day individually during actual operation. To reduce scenario dimensionality and improve computational efficiency, this paper employs the K-medoids clustering algorithm to extract typical scenarios from PV and wind power operation data. These representative renewable energy operating scenarios provide a basis for subsequent dispatch optimization and stability analysis.
K-medoids clustering is a typical partition-based clustering method that improves upon the K-means algorithm. Unlike K-means, it selects actual data samples as cluster centers, specifically those with the minimum total distance to other samples within the same cluster. This enhancement increases robustness to outliers and noise and mitigates the risk of converging to local optima. Given a predefined number of clusters K, the algorithm iteratively optimizes an objective function to minimize the total distance between data points and their respective cluster centers. The objective function J is defined as:
J = i = 1 K x j C i x j μ i 2
where Ci denotes the i cluster, xj represents a data point assigned to that cluster, and μi is the center of cluster i. The K-medoids algorithm begins by randomly initializing K cluster centers. It then classifies all data points based on the minimum distance criterion and selects the sample with the smallest total distance to all others in the cluster as the new center. This process is iteratively repeated until the cluster assignments remain unchanged or the objective function converges.
In this study, intraday PV and wind power outputs are structured as time-series feature vectors. After normalization, these data are input into the K-medoids clustering model to extract several representative operating scenarios. These typical scenarios not only retain the statistical characteristics and variability patterns of renewable energy generation but also provide a solid foundation for subsequent multi-scenario optimization and risk assessment.
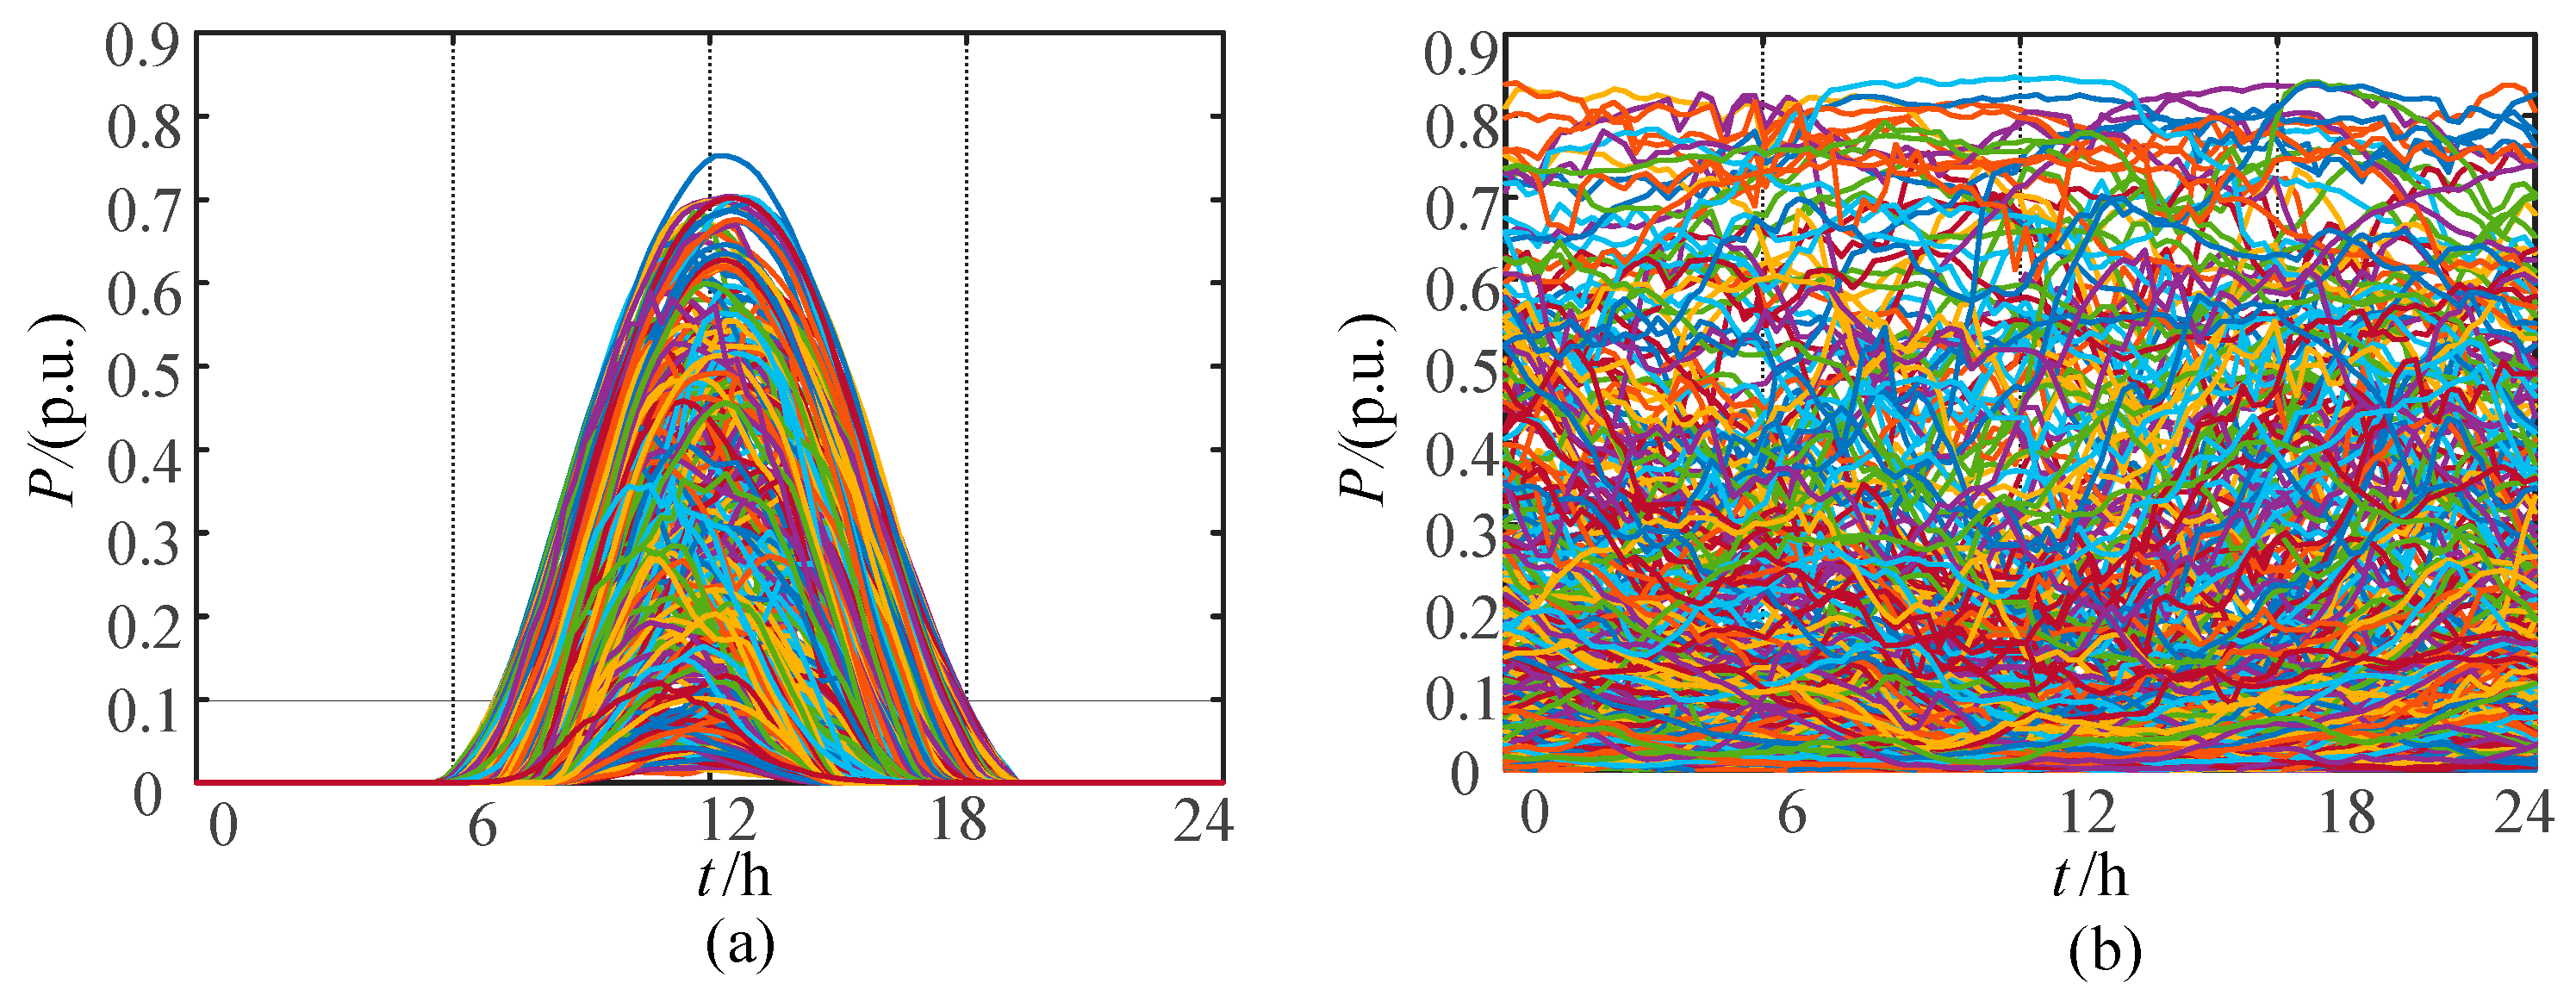
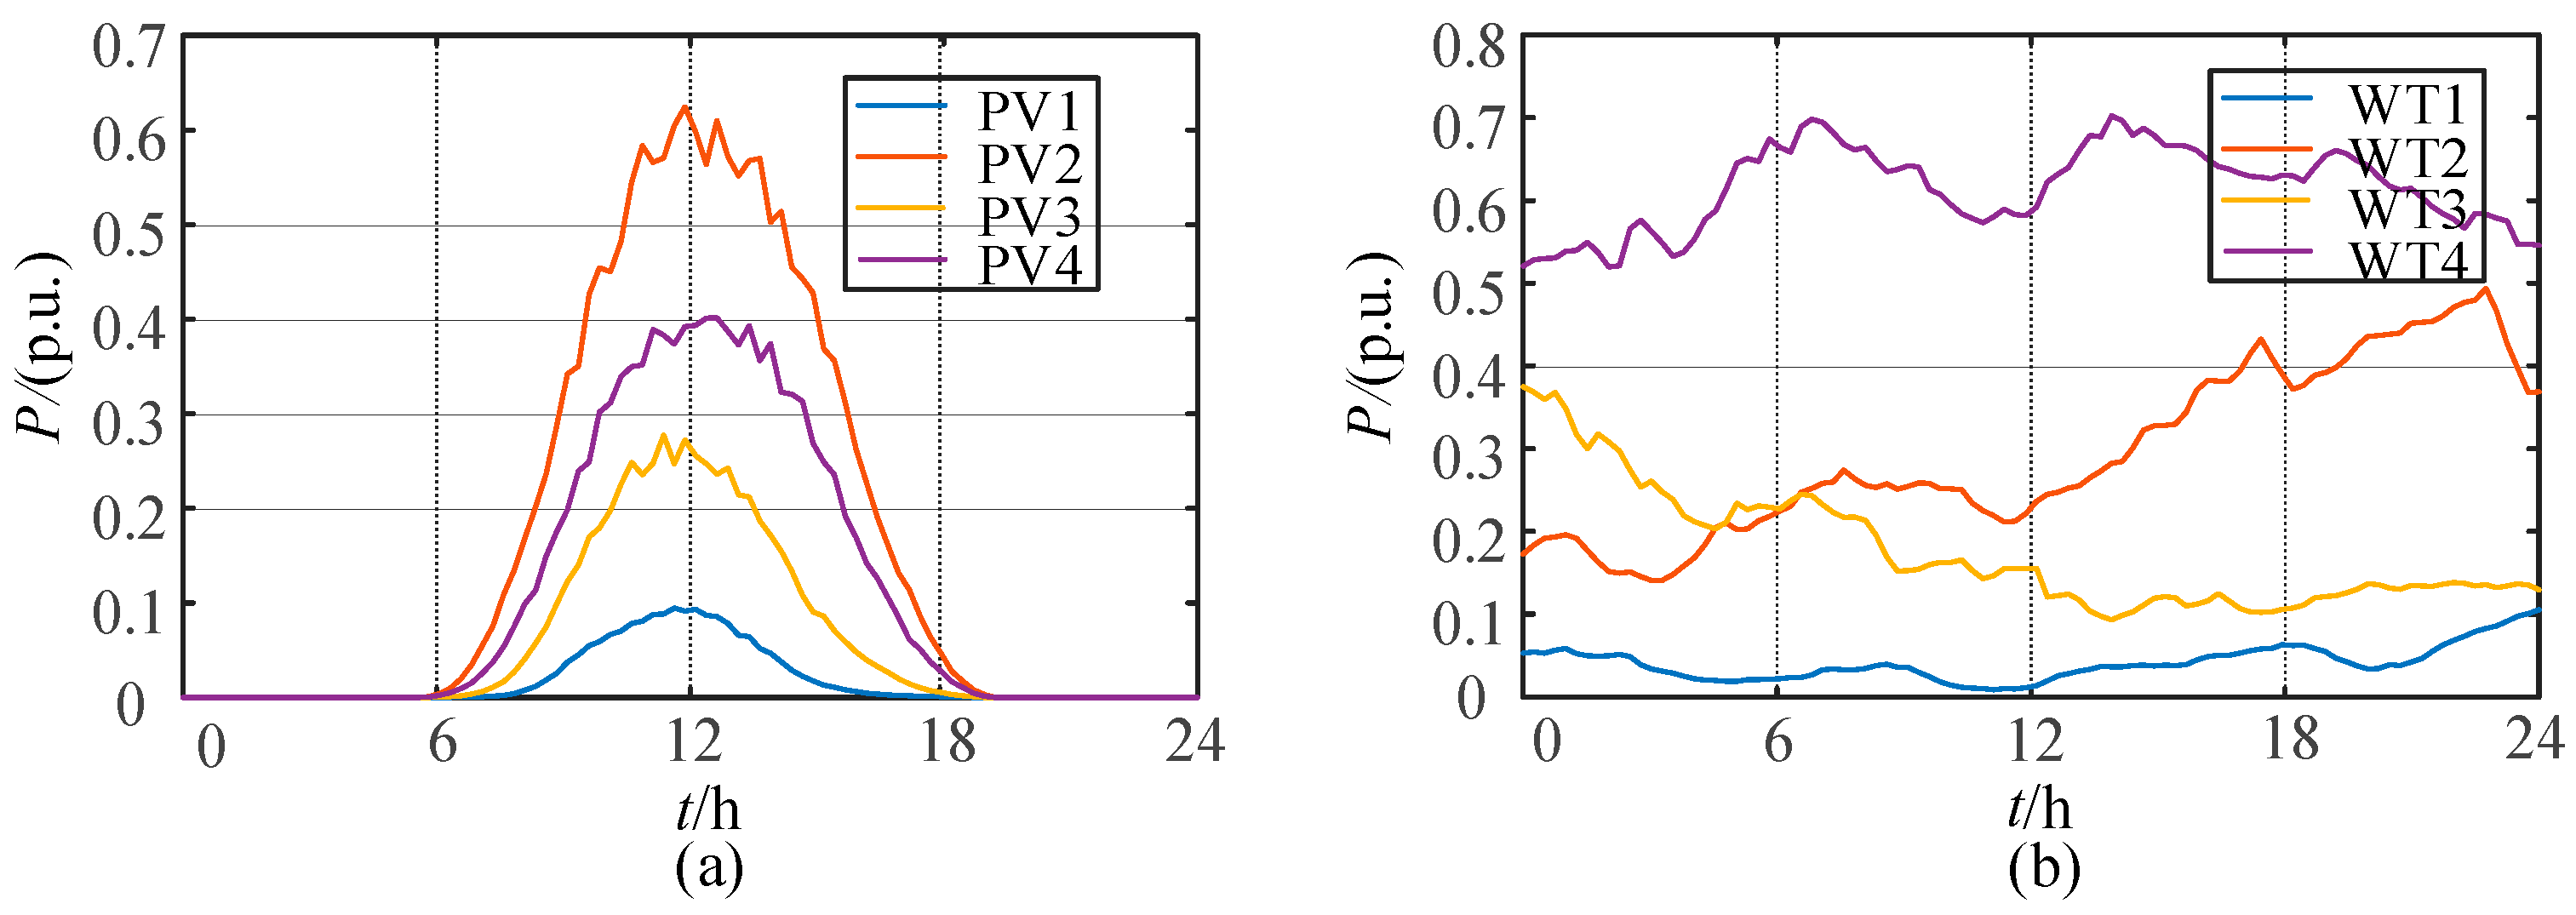
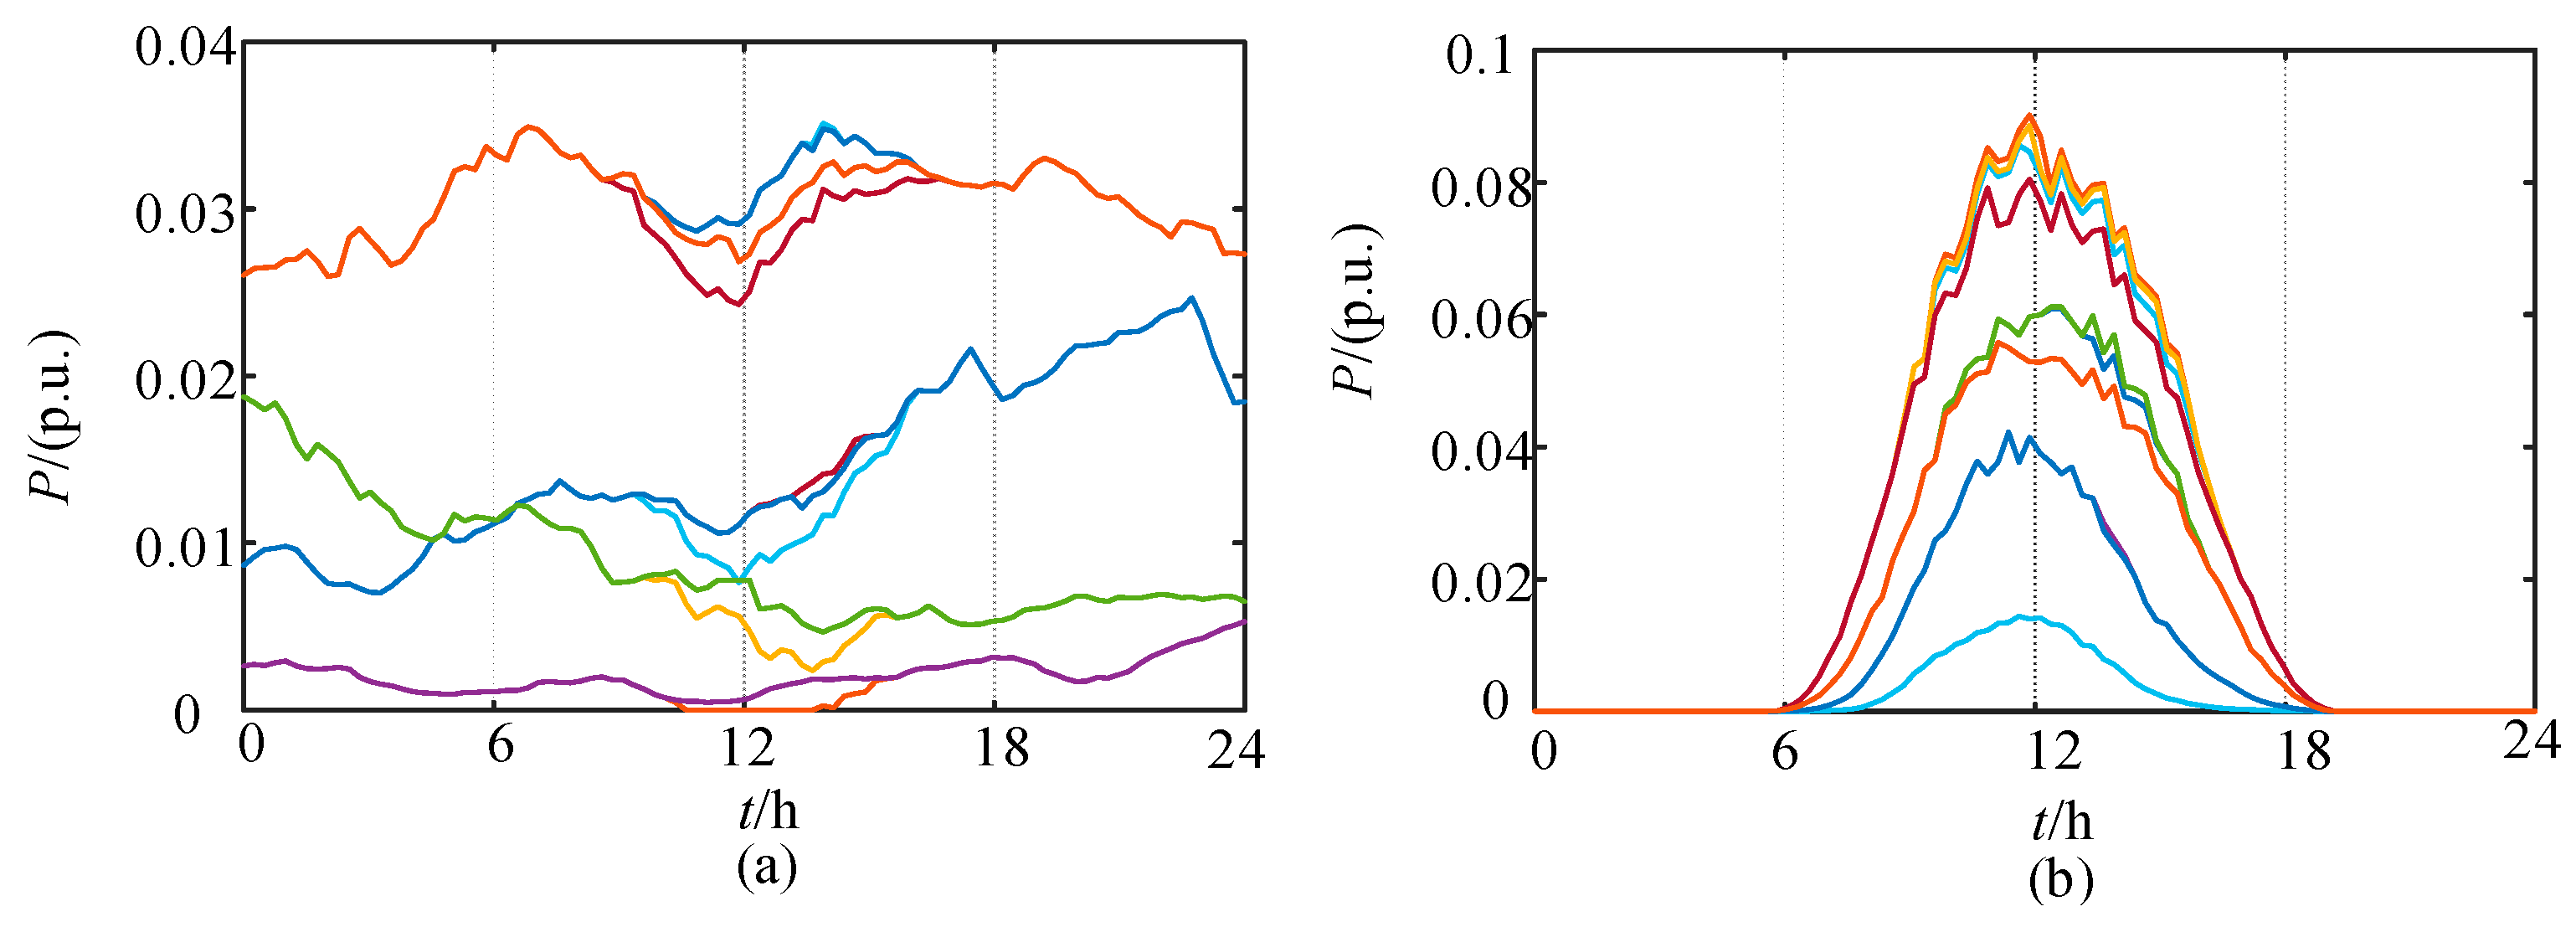
This study utilizes one year of operational data from a large-scale PV and wind power base in a selected region, with power outputs sampled at 15-min intervals, resulting in 96 data points per day, as illustrated in Figure 2. Based on the K-medoids clustering algorithm, daily power output profiles of PV and wind generation are analyzed to extract representative scenarios. Four typical PV power scenarios and four typical wind power scenarios are identified, as shown in Figure 3. In the figure, PV1 to PV4 represent typical PV power scenarios 1 to 4, while WT1 to WT4 represent typical wind power scenarios 1 to 4.
To verify the statistical validity of the PV and wind scenario clustering (Figure 2 and Figure 3), clustering evaluation metrics were calculated. The mean squared error (MSE) and annual occurrence probability of each representative scenario are reported in Table 2, demonstrating reasonable cluster compactness and capturing diverse operating conditions.

3. Power Flow Analysis of Islanded DC Transmission with Renewable Integration

3.1. Power Flow Modeling in Islanded Mode

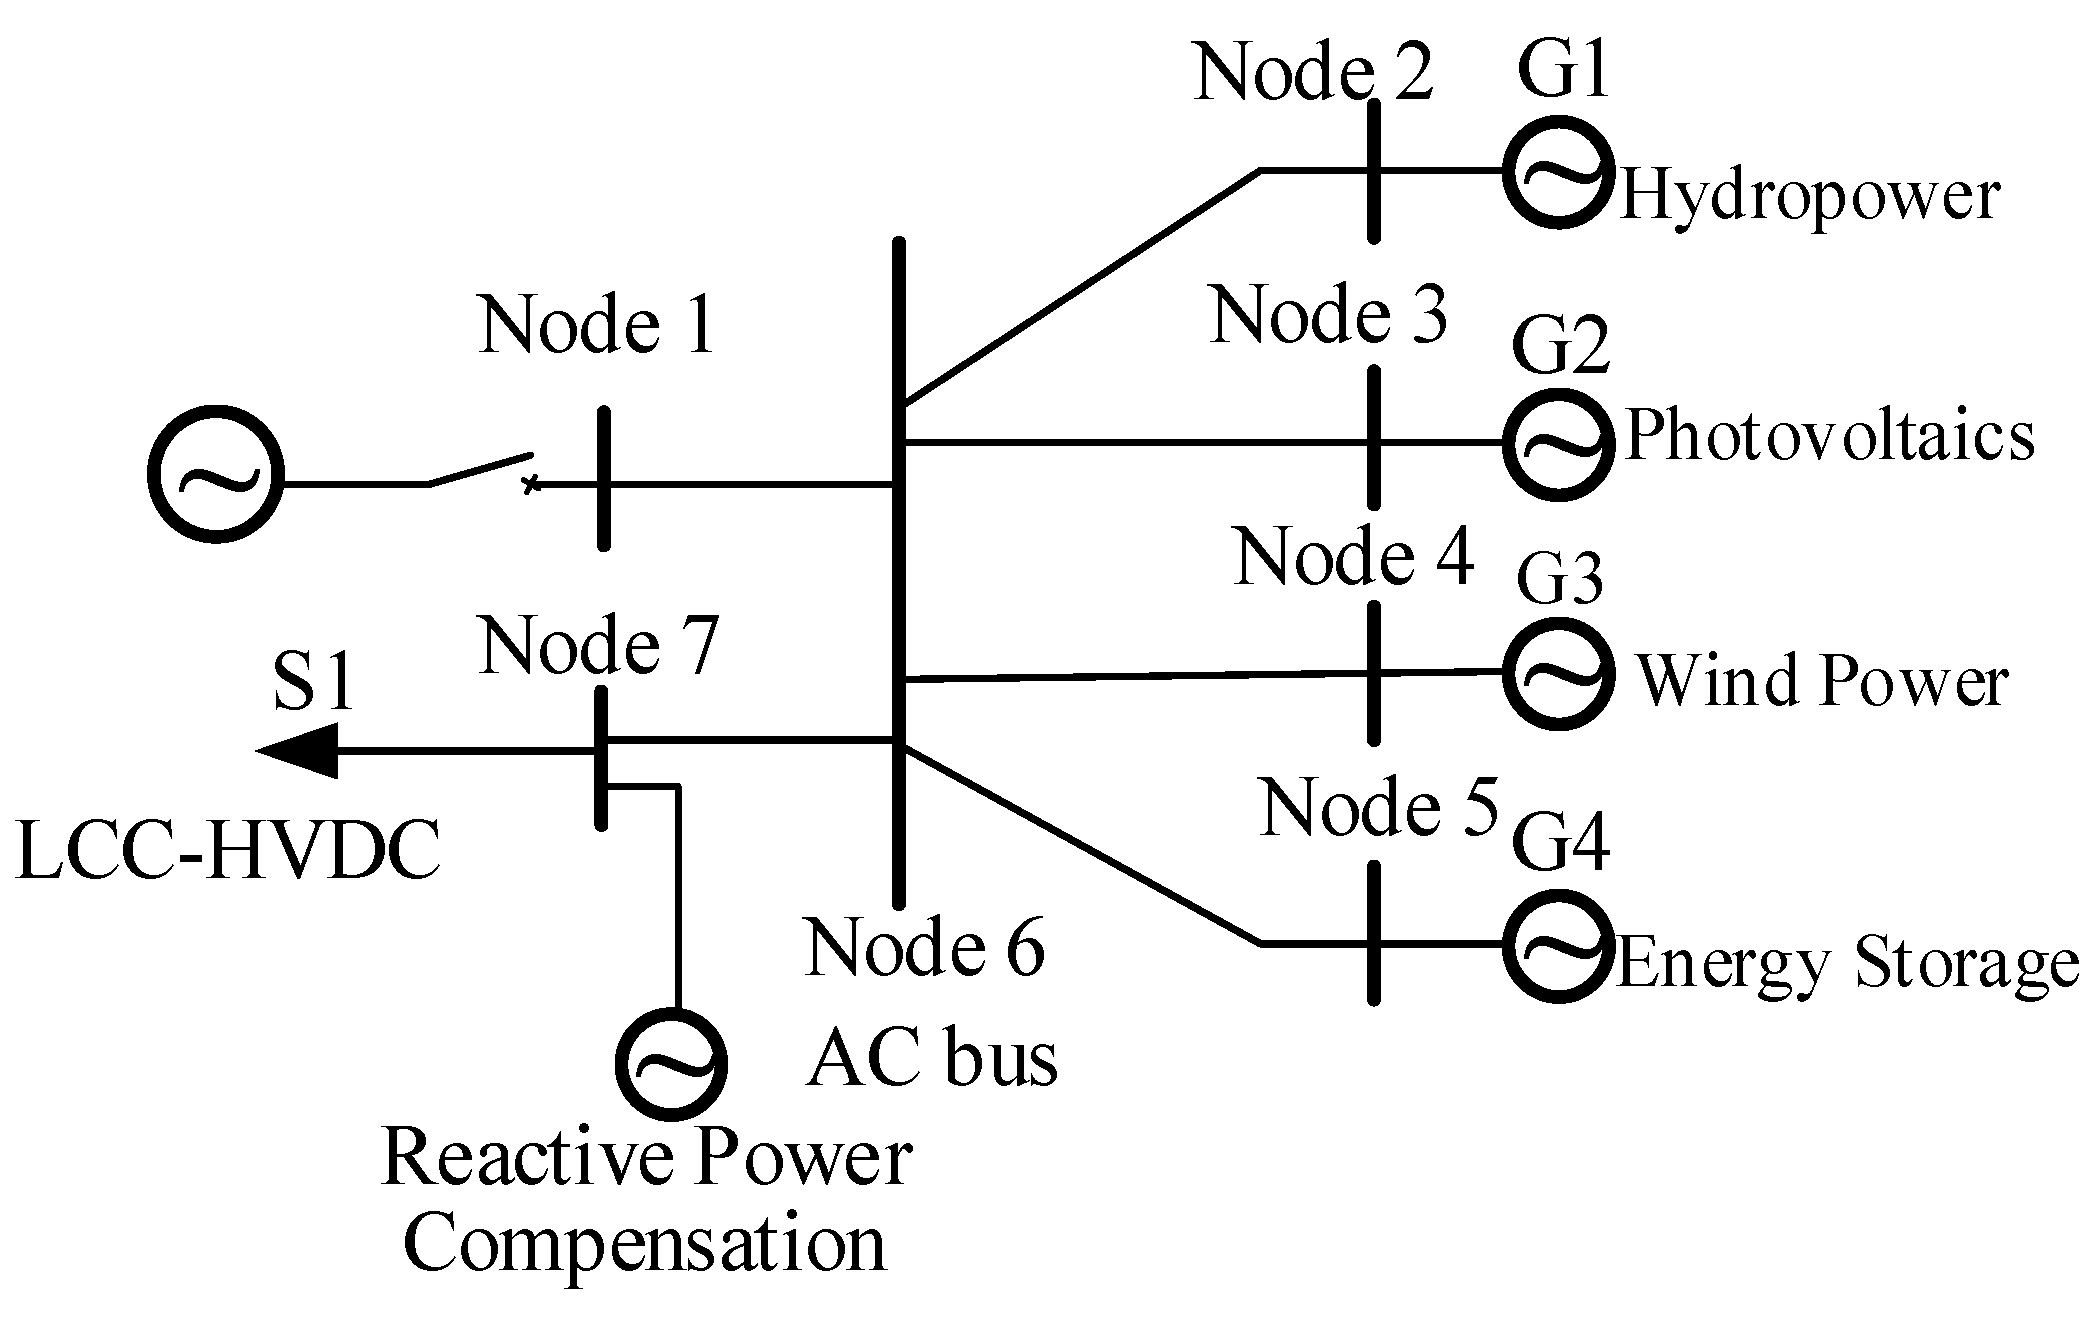
Based on Figure 1, the detailed topology of the hydropower, wind power, PV power, and energy storage integrated DC transmission system is shown in Figure 4. In the figure, G1–G4 represent the nodes of hydropower, PV power, wind power, and energy storage, respectively. S1 denotes the DC transmission power output, and Node 1 is the virtual balancing node.
In an islanded DC grid integrating hydropower, PV power, wind power, and energy storage, hydropower units are typically prioritized for frequency regulation, while the energy storage system alone lacks sufficient capacity to serve as a balancing node. As a result, active power imbalances must be coordinated and shared among the generation units and the DC transmission based on their respective droop control characteristics. Reactive power allocation is realized through a quadratic programming approach. This method minimizes the rate of reactive power changes at nodes, while satisfying node voltage constraints and ensuring reactive power balance, thereby minimizing the overall control cost.
Although there is no conventional slack bus in such islanded systems, a reference node (termed the virtual balancing node) must be designated as the electrical reference for power flow analysis. This virtual node absorbs system imbalances during iteration, and its power injection serves as the convergence criterion for the power flow computation. When the injected power at the virtual node approaches zero, the power flow is considered converged. In principle, any node can serve as the virtual reference, but in practice, nodes with strong control capabilities or potential interconnection to the main grid are typically preferred.

3.2. Active Power Droop Control

In the islanded hydropower, PV power, wind power, and energy storage, and LCC HVDC transmission system, a coordinated power allocation strategy based on frequency droop characteristics is adopted. This approach enhances the adaptability of the system to high renewable penetration and enables collaborative response and stable power delivery among distributed sources. Unlike conventional grids where a slack bus regulates the active power imbalance centrally, islanded systems lack sufficient centralized regulating capacity, causing system frequency to fluctuate with active power mismatches. To maintain frequency stability and coordinate multiple energy sources, this study employs a droop control strategy based on frequency response characteristics, explicitly modeling the coupling between frequency variations and active power output in the power flow analysis.
To further enhance the renewable energy hosting capacity, a P/f control strategy is adopted in the islanded LCC-HVDC system. The system-wide active power imbalance is collaboratively compensated by the generating units (G1–G4) and the LCC-HVDC converter according to their respective droop characteristics, enabling dynamic active regulation and coordinated internal power sharing.
The active power deficit of the system is obtained from the power flow calculation as the power injection at the virtual balancing node (Node 1). Given the fast dynamic response of the energy storage system, the power imbalance is first compensated by the energy storage unit, as expressed by the following equation:
P es = P es 0 + P 1
Due to energy storage constraints of capacity and power rating, if the energy storage power Pes exceeds its operational limits, the surplus power P2 is distributed among generating units based on their droop coefficients, as defined below:
P G = P G 0 + Δ P G = P G 0 + P 2 m 1 / n P wt = P wt 0 + Δ P wt = P wt 0 + P 2 m 2 / n P pv = P pv 0 + Δ P pv = P pv 0 + P 2 m 3 / n P dc = P dc 0 + Δ P dc = P dc 0 P 2 m 4 / n n = m 1 + m 2 + m 3 + m 4
where PG0, Pwt0, Ppv0 and Pdc0 denote the action powers of hydropower, wind power, PV power, and DC transmission at nominal frequency, respectively. PG, Pwt, Ppv and Pdc represent the active power outputs of hydropower, wind power, PV power, and DC transmission after droop control. ΔPG, ΔPwt, ΔPpv and ΔPdc are the corresponding active power increments. m1m4 denote the droop coefficients of hydropower, wind power, PV power, and DC transmission, respectively, and n is the overall system active power droop coefficient. The comprehensive description of the active power droop control strategy is presented in Appendix A.
The system frequency can be derived from (3) as follows:
Δ f = f N f = Δ P G 1 m 1
where Δf denotes the frequency deviation of the islanded system, fN and f represent the nominal and actual system frequencies, respectively, and ΔPG1 denotes the deviation between the actual active power of the hydropower unit after droop control and its rated value.

3.3. Quadratic Programming-Based Reactive Power Control

After the active power is allocated via droop control and the initial power flow calculation is performed, the reactive power injection Q1 at the virtual balancing node can be obtained. To ensure zero reactive power at this node and maintain all node voltages within their allowable limits, a quadratic programming-based reactive power optimization method is applied. According to the Newton–Raphson linearization principle, the relationship between voltage variations and reactive power changes can be expressed linearly as follows:
Δ P Δ Q = J P θ   J PV J Q θ   J QV Δ θ Δ V
where J and JPV represent the sensitivities of active power with respect to voltage angle and magnitude, respectively, and J and JQV denote the sensitivities of reactive power with respect to voltage angle and magnitude, respectively.
In transmission systems, the line inductance is significantly greater than resistance, implying that transmission lines are primarily reactance-dominated. As a result, the values of J and J are relatively small, and voltage angle variations are minimal. Active power mainly affects the voltage angle, while reactive power predominantly influences voltage magnitude. Accordingly, the voltage–reactive power relationship can be approximated as:
Δ Q = J QV Δ V
Based on the linearized model in Equation (6), the reactive power control problem is formulated as a quadratic programming problem that minimizes the overall control cost by adjusting only the reactive power, subject to the following constraints: all bus voltages must remain within their permissible limits, and the reactive power at the virtual balancing node must be zero. The quadratic programming model is given as follows:
min Δ Q ψ 2 + λ μ 2 + σ θ 2 Δ Q = J QV Δ V V min V 0 λ Δ V V max V 0 + σ Q min Q 0 Δ Q Q max Q 0 i = 1 n Δ Q i Q 1 = 0
where ∆Q = [∆Q2, …, ∆Qn] is the vector of reactive power variations at all nodes except the virtual slack bus, with n being the total number of nodes. ψ = diag(S1) is a positive definite diagonal weighting matrix with weight S1, and Vmax and Vmin are the voltage upper and lower limit vectors, respectively. Qmax and Qmin are the node reactive power upper and lower limit vectors, respectively. V0 and Q0 are the nodal voltages and reactive powers at the previous time step. The non-negative vectors λ and σ are slack variables introduced to convert hard voltage constraints into soft ones, to account for when there are insufficient control resources to meet the constraints. The variables λ and σ should be heavily penalized in the objective function by setting positive diagonal weighting matrices μ = diag(S2) and θ = diag(S3) with large diagonal elements, where S2 and S3 are weight coefficients.

3.4. Constraint Conditions

(1) Power balance constraint
P dc , t = P es , t + P pv , t + P wt , t + P G , t P line , t Q dc , t = Q es , t + Q pv , t + Q wt , t + Q G , t + Q c , t Q line , t
where Pdc,t, PG,t, Pes,t, Pwt,t, Ppv,t and Pline,t represent the DC transmission active power, hydropower generation, energy storage output, wind power output, PV power output, and line active power losses at time t, respectively. Qdc,t, QG,t, Qes,t, Qwt,t, Qpv,t, Qc,t and Qline,t represent the DC reactive power, reactive power output from hydropower, energy storage, wind power, PV generation, reactive power compensation devices, and line reactive power losses at time t, respectively.
(2) Energy Storage Constraints
E es , min E es E es , max 0 P es , dis P es , max P es , min P es , ch 0 E es ( 0 ) = 40 % E ES , max
where Ees (0) is the initial state-of-charge (SOC) of the energy storage system (ESS). Pes,dis and Pes,ch denote the charging and discharging power of ESS at time t, respectively. With discharging power taken as positive, EES,max is the rated maximum energy capacity of the ESS. Ees,min and Ees,max are typically set to 0.1EES,max and 0.9EES,max to define the upper and lower SOC limits.
(3) PV Constraints
V pv , min V pv V pv , max 0 P pv P pv , max Q pv = P pv tan ( c o s 1 ( φ pv ) ) S pv = ( P pv ) 2 + ( Q pv ) 2 cos φ pv min P p v / ( P pv ) 2 + ( Q pv ) 2 1
where Vpv,min and Vpv,max denote the minimum and maximum voltage limits, respectively. Vpv is the voltage at the PV node, and Ppv and Ppv,max are the active power output and its maximum value of the PV inverter, respectively. Qpv and Spv represent the reactive and apparent power of the PV inverter at a given time, respectively, and cos φ p v m i n is the minimum allowable power factor of the PV inverter.
(4) Wind power constraints
V wt , min V wt V wt , max 0 P wt P wt , max Q wt = P wt tan ( cos 1 ( φ w t ) ) S wt = ( P wt ) 2 + ( Q wt ) 2 cos φ wt min P wt / ( P wt ) 2 + ( Q wt ) 2 1
where Vwt,min and Vwt,max denote the minimum and maximum voltage limits, respectively. Vwt is the voltage at the wind power node, and Pwt and Pwt,max are the active power output and its maximum value of the wind power inverter, respectively. Qwt and Swt represent the reactive and apparent power of the wind power inverter at a given time, respectively, and cos φ w t m i n is the minimum allowable power factor of the wind power inverter.
(5) Hydropower Constraints
V h , min V h V h , max P h , min P h P h , max Q h = P h tan ( θ h ) S h = ( P h ) 2 + ( Q h ) 2 cos θ h min P h / ( P h ) 2 + ( Q h ) 2 1
where Vh,min and Vh,max denote the minimum and maximum voltage limits at the hydropower node, respectively. Ph, Ph,min and Ph,max are the active power output, minimum, and maximum output capacities of the hydropower unit, respectively. Qh and Sh represent the reactive and apparent power of the hydropower generator at a given time; θh denotes the generator power angle; cos θ h m i n is the lower bound of the power factor for the hydropower unit.
(6) LCC-HVDC Transmission Constraints
P dc , min P dc P dc , max Q dc = β P dc Q c , min Q c Q c , max
where Pdc denotes the DC power transmission, and Pdc,max and Pdc,min represent the maximum and minimum transmission capacity, respectively. The parameter β denotes the reactive-to-active power ratio, typically selected within the range of 0.4–0.6, to reflect the reactive power support requirements of the converter station during the rectification process. Qc denotes the reactive power output of the DC reactive compensation device, and Qc,max and Qc,min represent its upper and lower reactive power limits, respectively.
(7) Voltage and frequency constraints
To ensure power quality and system stability in the islanded network, voltage and frequency at each node must be maintained within prescribed operational limits.
V i min V i V i max f min f f max
where Vi denotes the voltage magnitude at bus node of i, and Vi,min and Vi,max represent its minimum and maximum allowable limits, typically ranging from 0.95 p.u. to 1.05 p.u. fmin and fmax define the permissible frequency range of the system.

4. Optimal Sizing of Renewable Energy Integration Using PSO

The energy storage output power is inherently coupled with the rated capacities of wind and PV generation. To further reduce the required DC transmission capacity, the relationships among the rated power of energy storage Pes,N, DC transmission Pdc,N, wind power Pwt,N, and PV power Ppv,N are formulated as follows:
P es , N = α ( P wt , N + P pv , N ) P dc , N = P h , N + γ ( P wt , N + P pv , N )
where α and γ are the output coefficients for the energy storage system and the DC transmission system, respectively, and Ph,N is the rated output power of the hydropower unit.
To maximize the renewable energy output while reducing the requirement for energy storage configuration, the objective function fobj is defined as:
f obj = 2 P es , N ( P pv , N + P wt , N )
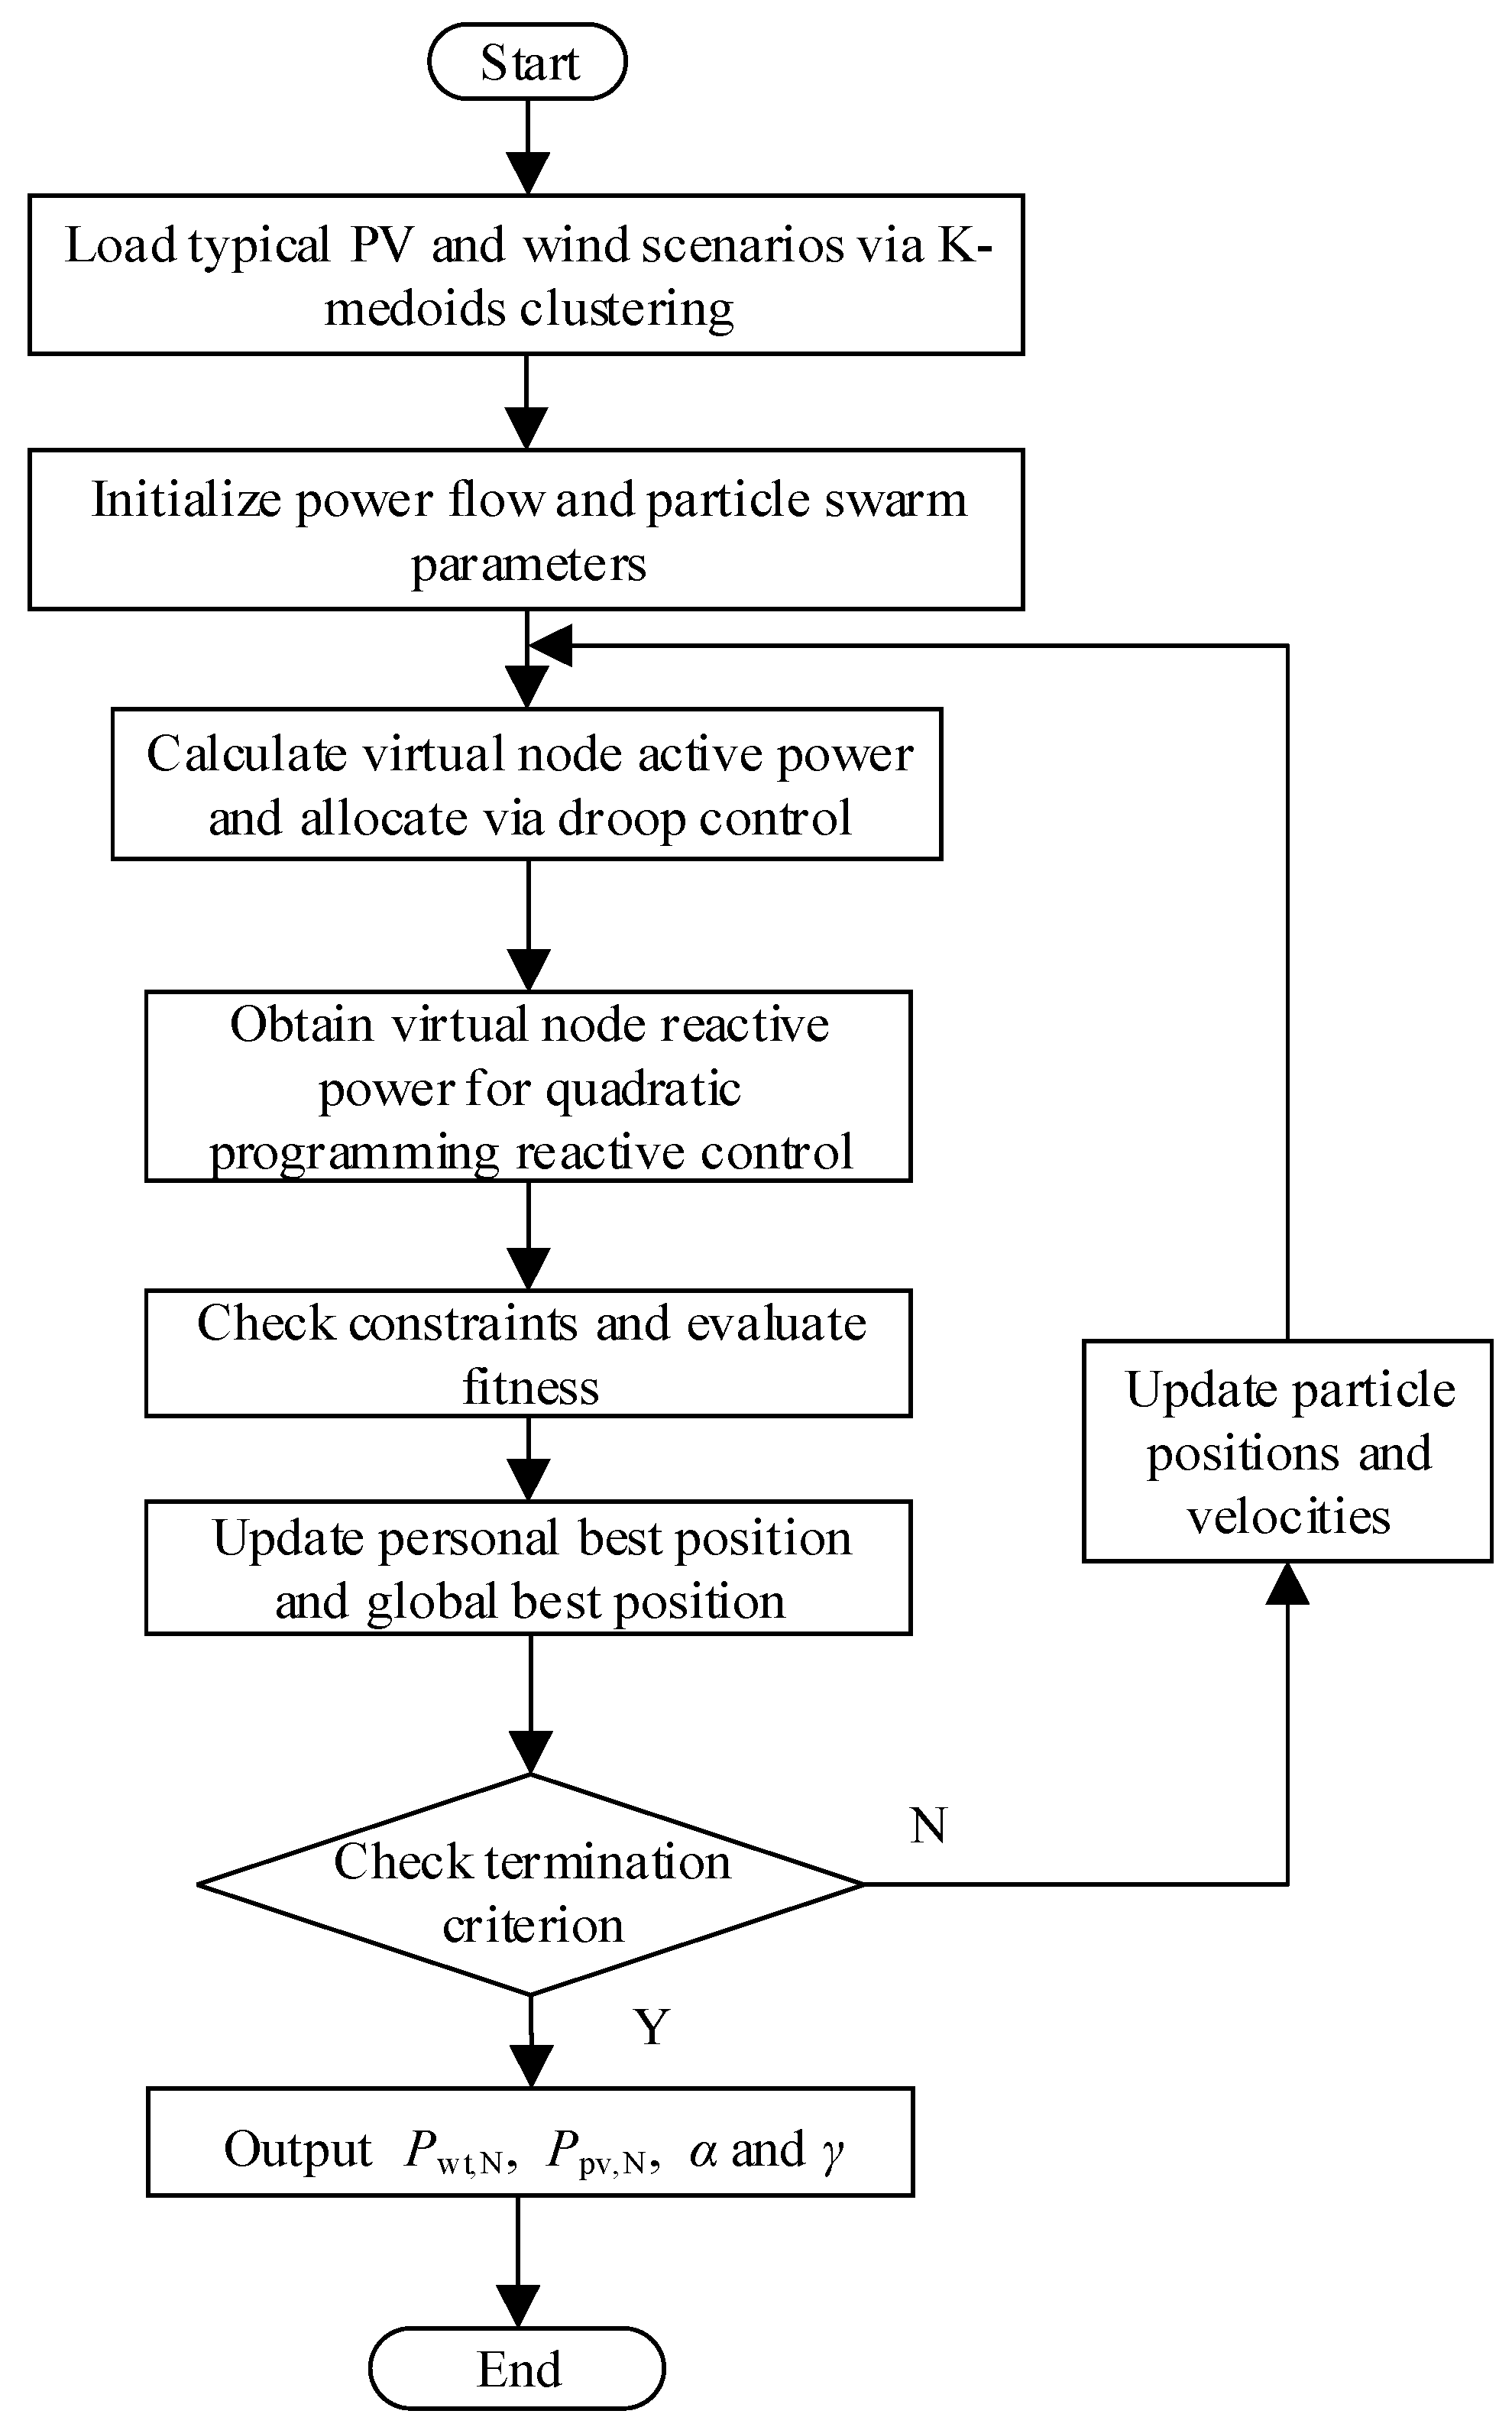
A maximum capacity optimization framework for islanded grids with high renewable penetration is developed. It integrates the PSO algorithm, K-medoids clustering, active power droop control, and reactive power quadratic programming optimization. The overall optimization process is illustrated in Figure 5. The detailed optimization procedure is outlined as follows:
(1)
Set the parameters of the PSO algorithm and initialize the capacity-related parameters for PV power, wind power, LCC-HVDC, and energy storage systems. Then, load the wind scenarios obtained via the K-medoids clustering algorithm.
(2)
The feasibility of solutions is evaluated based on active power droop control and quadratic programming-based reactive power optimization. If all constraints are satisfied, the fitness value is set to the objective function value; otherwise, penalty terms are incorporated to account for constraint violations.
(3)
Calculate the fitness values of individual particles and the entire swarm, reflecting how well each solution meets the optimization objectives.
(4)
Update the personal best and global best positions. For each particle, update its personal best position if its current fitness value is better than its historical best. Then, select the particle with the best personal fitness among all particles as the global best position.
(5)
Based on the current velocity and position of each particle, as well as its distances to the personal best and global best positions, the velocity and position are updated accordingly.
(6)
Steps 2 to 5 are iteratively repeated until either the maximum number of iterations is reached or the convergence tolerance is satisfied.

5. Simulation Verification

To validate the effectiveness of the proposed maximum capacity optimization method for multi-type clean energy integration, a power flow simulation study was conducted. An islanded DC transmission system integrating hydropower, wind power, PV, and energy storage sources was developed based on MATLAB 2023a. A joint frequency–voltage regulation and capacity optimization model under typical renewable output scenarios was established.

5.1. Control Performance Verification

The system configuration is shown in Figure 1, with major equipment parameters listed in Table 3.

5.2. Validation of Maximum Renewable Energy Capacity Configuration

Under the typical combined wind and PV output scenarios, this study employs the PSO algorithm to optimally configure the outputs of wind power, PV power, LCC-HVDC, and energy storage systems. The objective is to maximize the integration capacity of wind and PV generation while optimizing the energy storage capacity configuration, all under the constraints of system voltage, frequency, and other operational limits. The optimal configuration results are presented in Table 4.
Within the constructed optimization framework, the system achieves a maximum integration of 100 MW wind power and 304 MW PV power. The energy storage output coefficient α is 0.10, indicating that the energy storage system is responsible for only about 10% of the dynamic balancing tasks, which reflects high economic efficiency. The DC output coefficient β is 0.23.
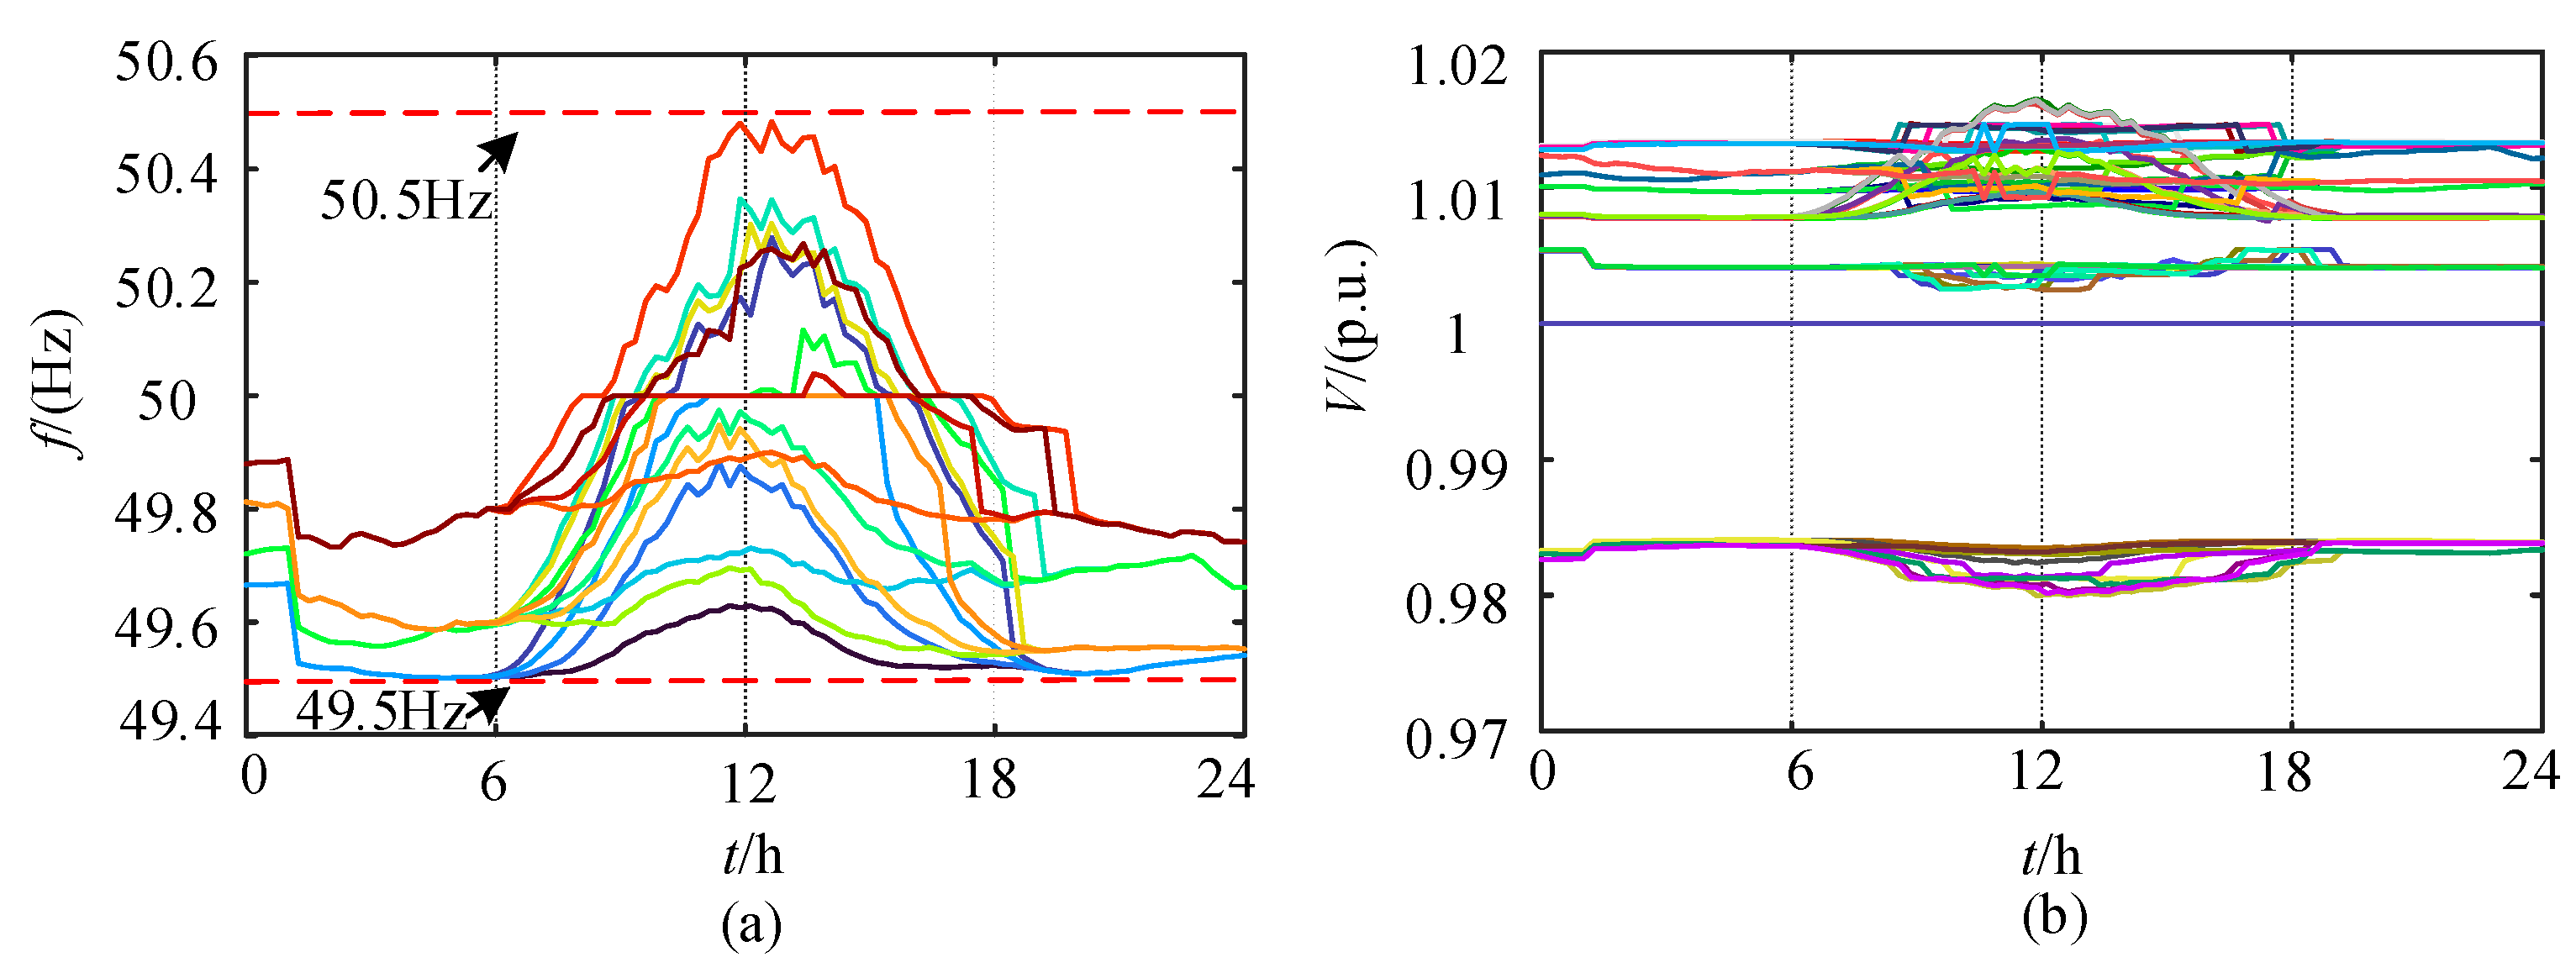
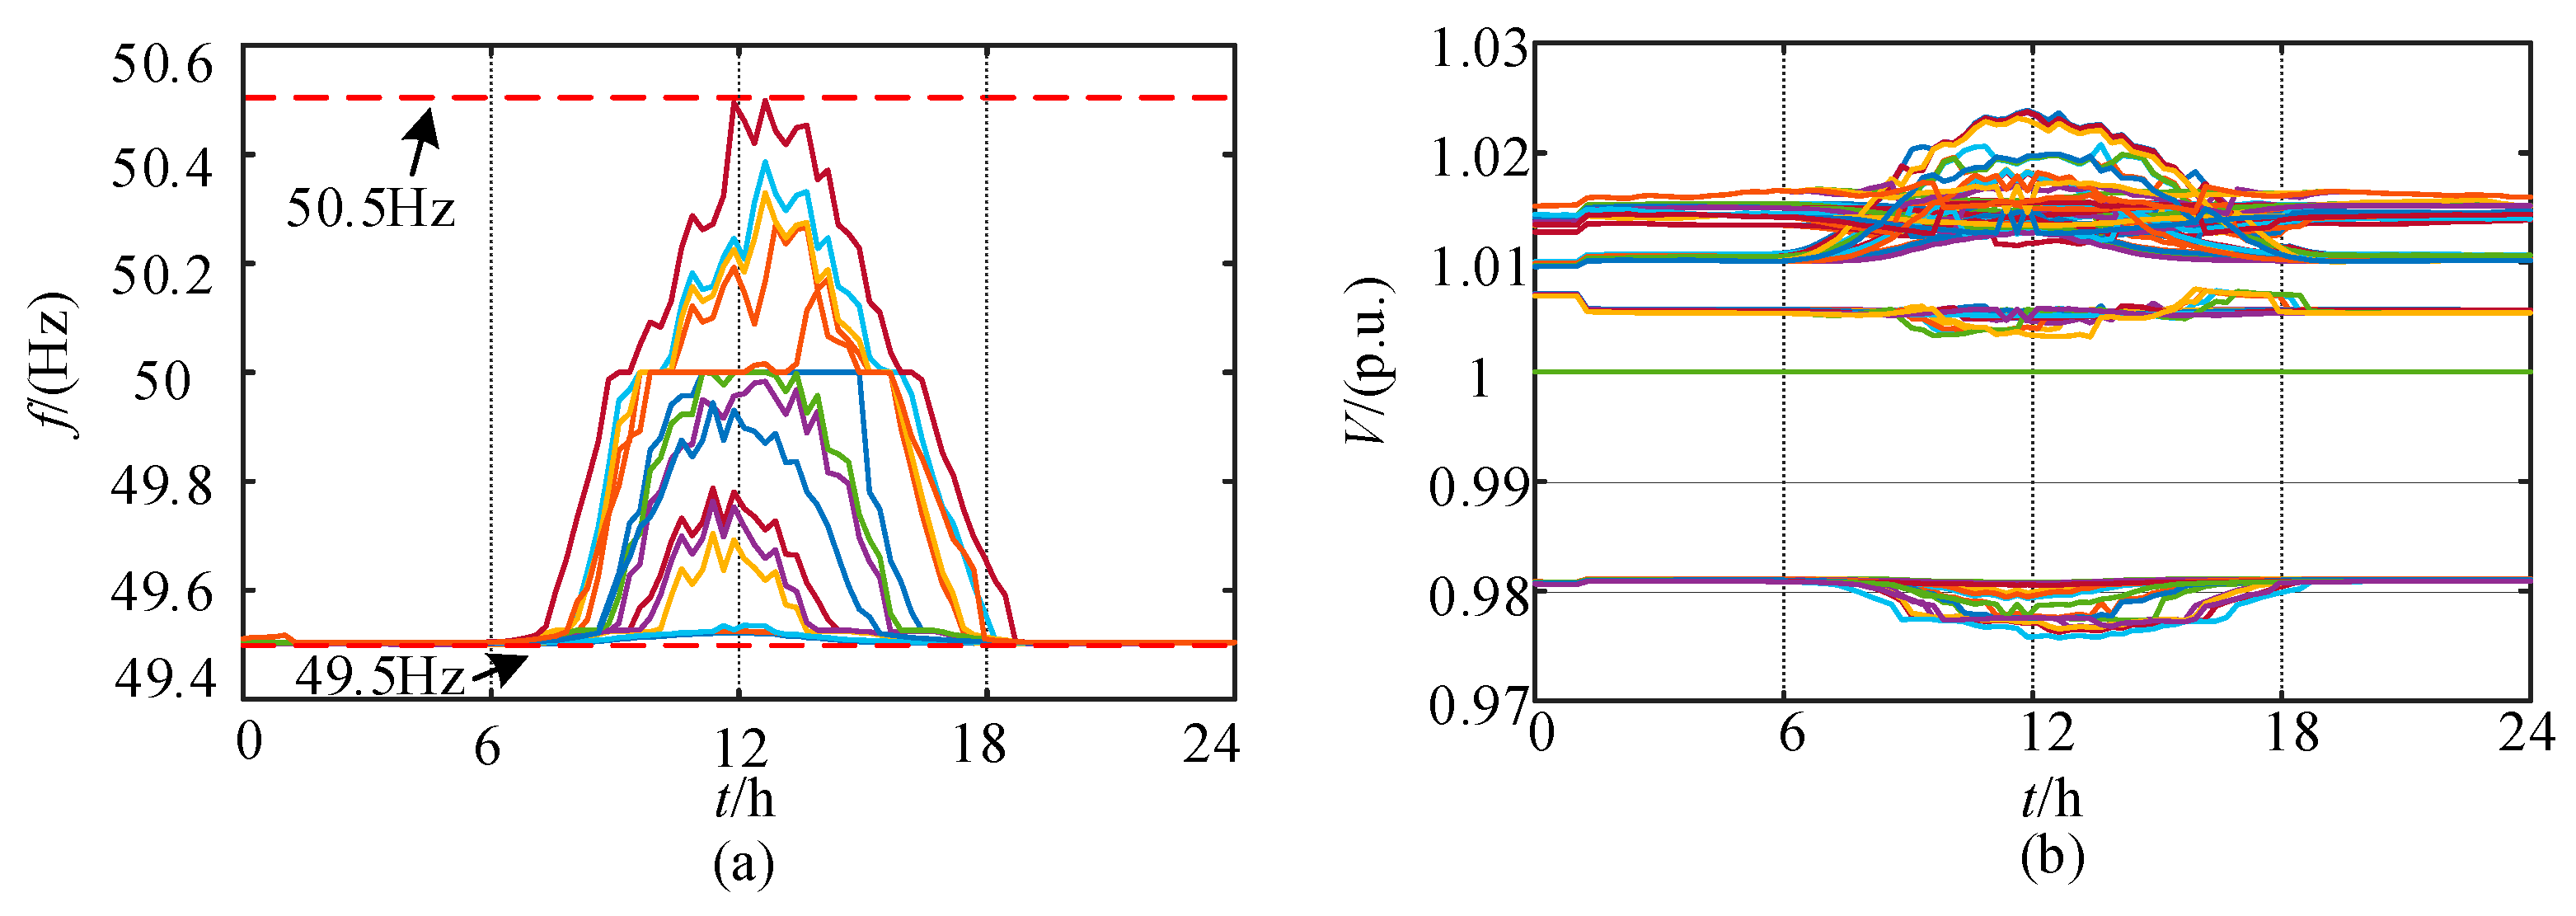
Based on the optimal configuration in Table 4, a total of 16 wind and PV output combinations are constructed using four typical wind scenarios and four typical PV scenarios extracted from Figure 3. The corresponding system voltage and frequency variations under each scenario are illustrated in Figure 6. The comparative evaluation shows that frequency fluctuations are consistently restricted to the permissible range of 49.5–50.5 Hz, and voltage variations are maintained within 0.97–1.02 p.u. across all 16 operating scenarios. The minimum frequency is close to 49.5 Hz, suggesting that the system has reached its maximum feasible renewable integration capacity.
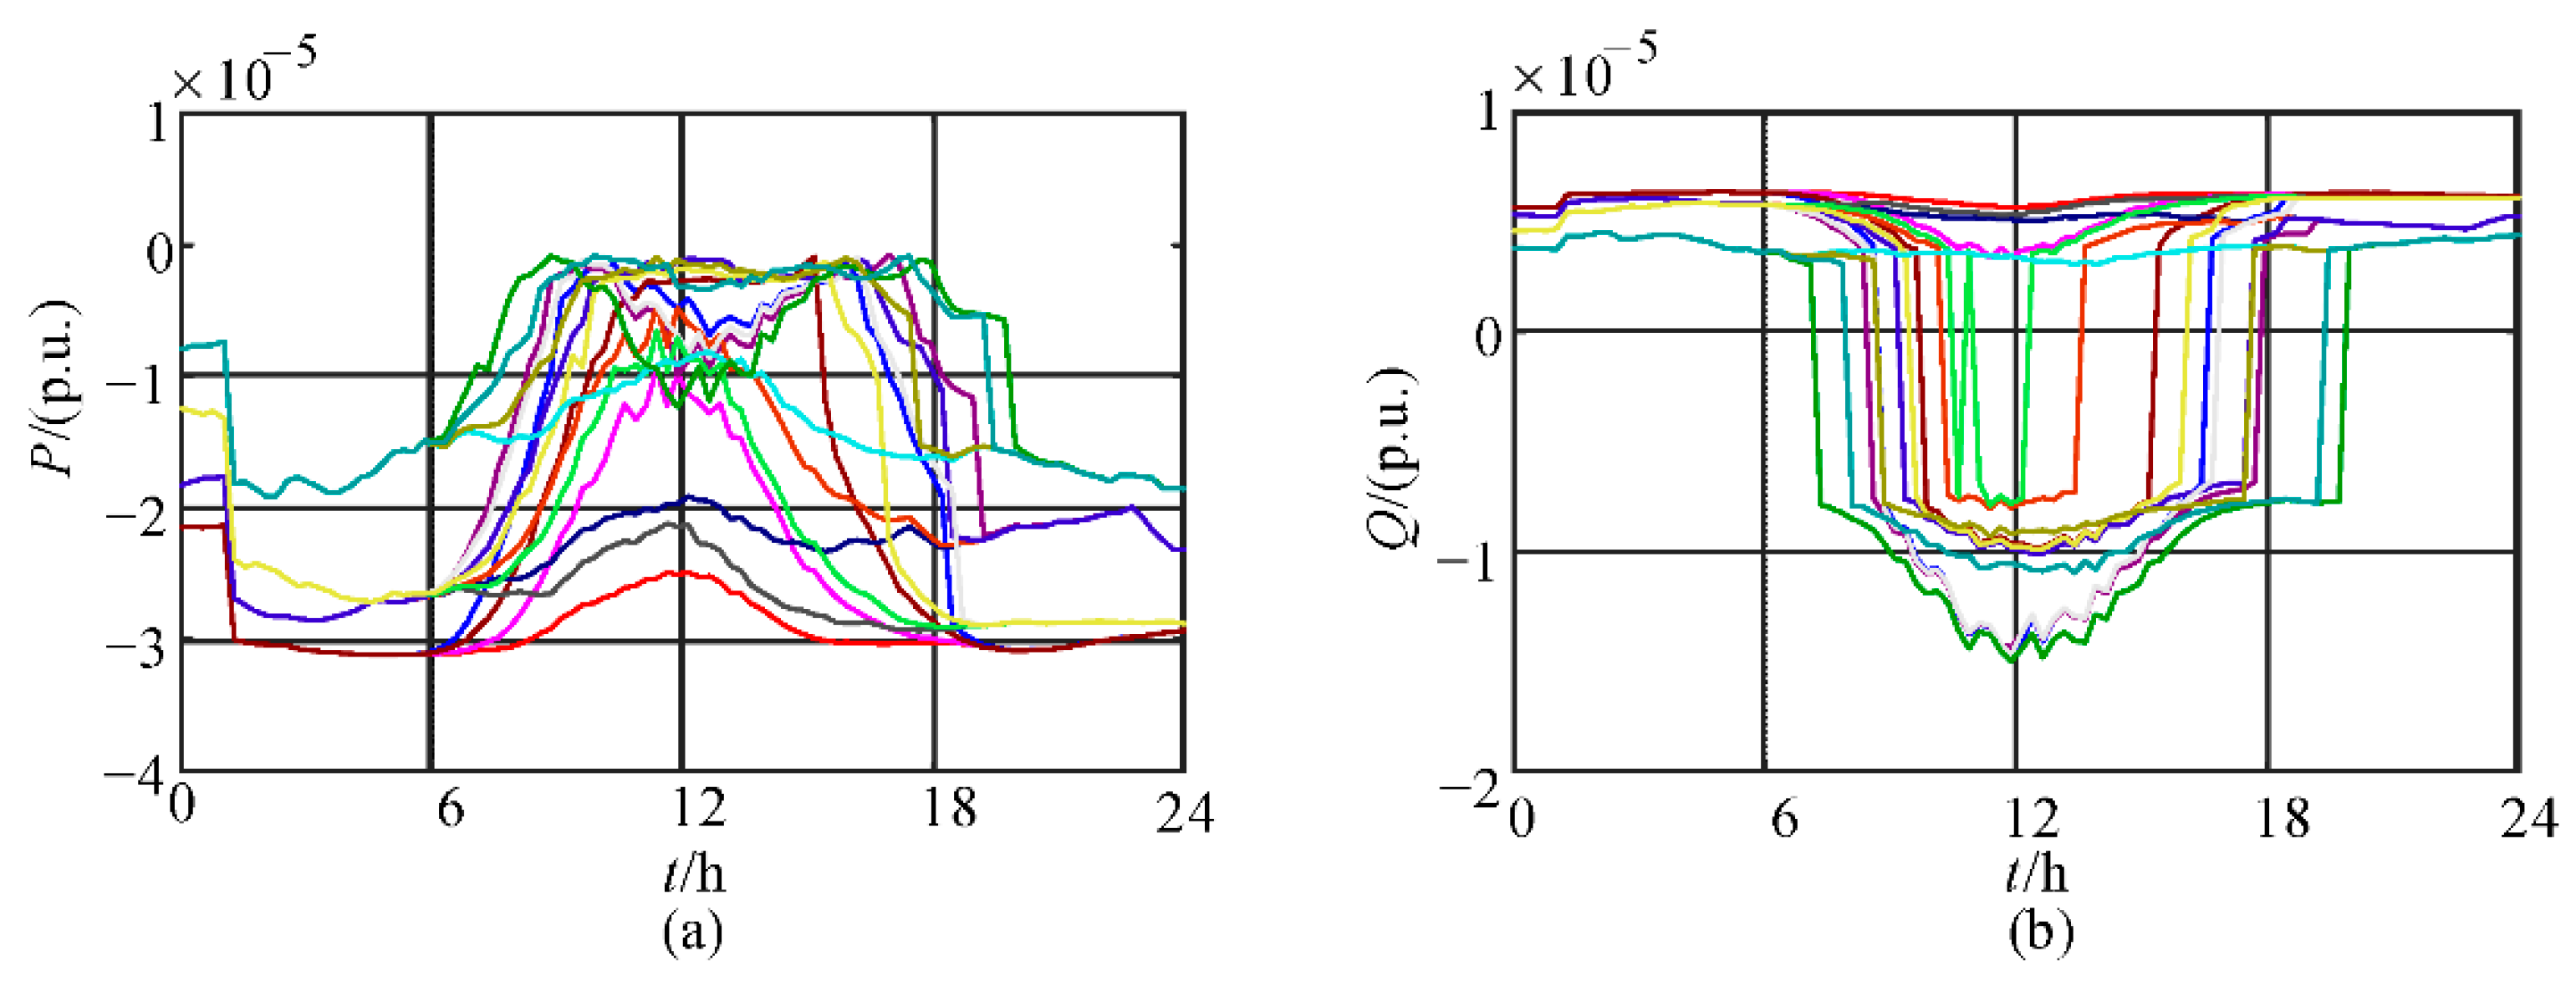
The output power of the virtual balancing node under different operating conditions is shown in Figure 7. The maximum injections are only 3.2 × 10⁻⁵ p.u. (active) and 1.4 × 10⁻⁵ p.u. (reactive), both negligible compared to the system capacity. These statistical results quantitatively confirm that the proposed droop and reactive power optimization ensures effective self-balancing, with variations significantly smaller than in conventional dispatch.
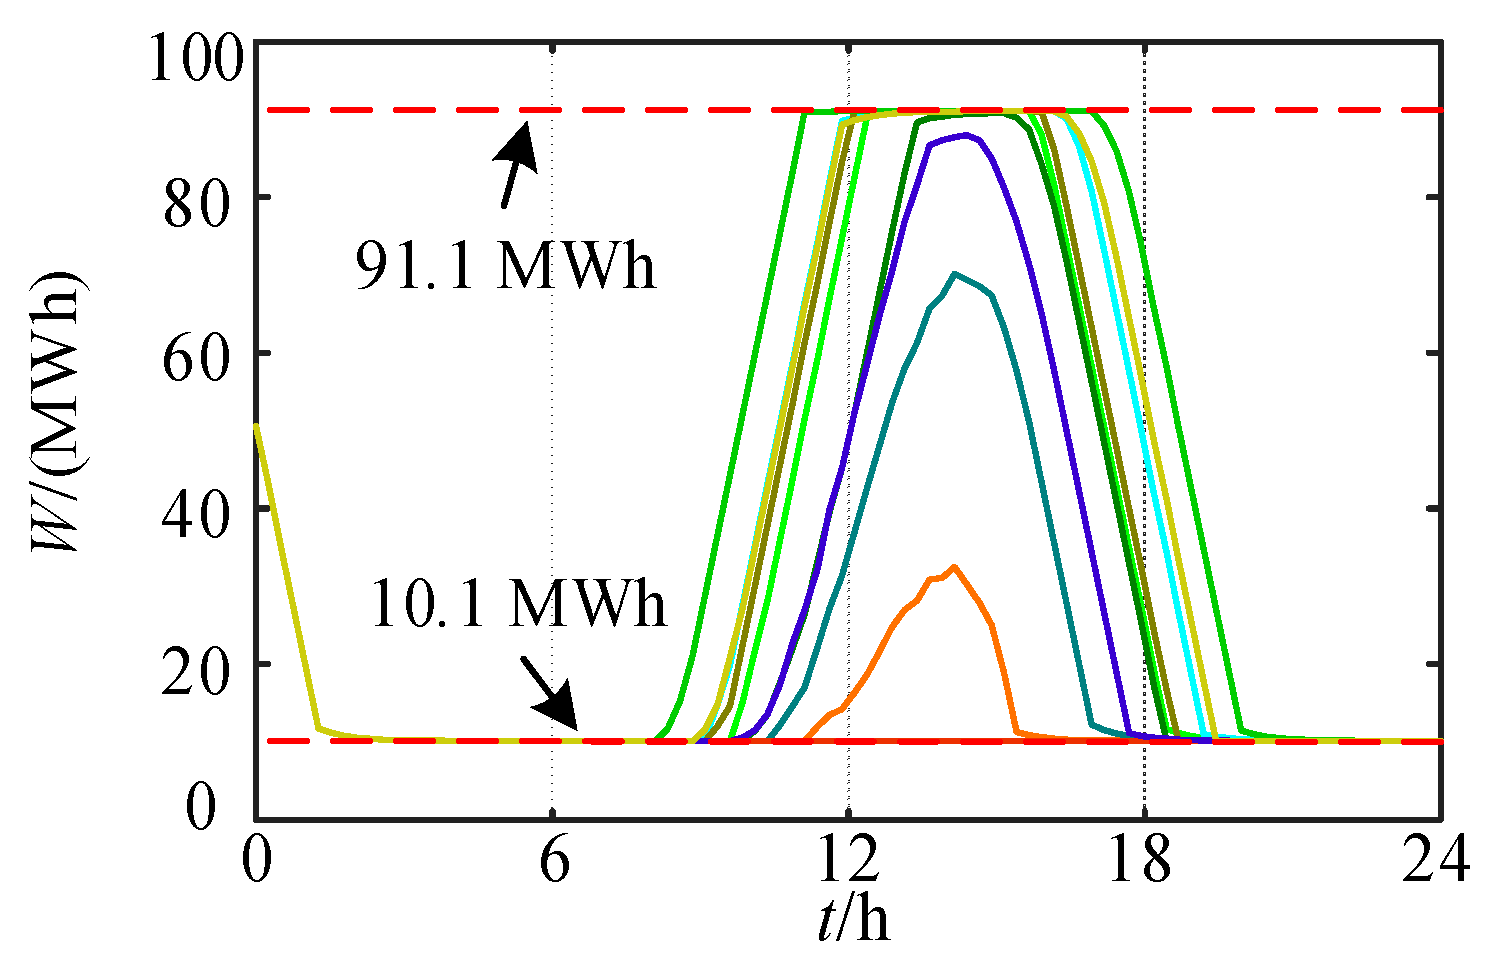
The variation in energy storage capacity is illustrated in Figure 8, with a maximum of 91.1 MWh and a minimum of 10.1 MWh. During the 24-h operation cycle, the energy storage capacity remains within this range, and the statistical evaluation indicates that fluctuations are well-bounded, demonstrating reliable SOC management compared with the uncontrolled case.
The actual outputs of wind and PV power are shown in Figure 9. It can be observed that wind and PV power participate in system frequency regulation during operation, without large-scale curtailment. The maximum curtailed wind and PV generation does not exceed 5% of the total renewable output, which indicates that under the current operational strategy, renewable energy sources are efficiently integrated into the system, exhibiting strong regulation capabilities and high accommodation potential.

5.3. Validation of Maximum Renewable Energy Capacity Configuration Under Hydropower Secondary Frequency Regulation

As shown in Figure 6, the maximum integration capacity of renewable energy in the islanded DC system is primarily constrained by frequency stability. Based on this, hydropower units are introduced to participate in secondary frequency regulation, providing additional adjustment to system frequency, with a maximum regulation capacity set at 100 MW (i.e., 0.05 p.u.). The maximum renewable energy capacity configuration under hydropower secondary frequency regulation is presented in Table 5. Under typical wind–PV output scenarios, the system achieves maximum integration capacities of 100 MW for wind power and 540 MW for PV power. Compared to the scenario without secondary frequency regulation, the PV integration capacity is significantly increased, confirming the positive impact of hydropower frequency regulation on enhancing renewable energy integration potential.
By introducing hydropower units with a maximum regulation capacity of 100 MW, additional balancing power is provided, which enhances frequency recovery capability and effectively increases system inertia. Especially at night, when PV support is unavailable and frequency deviations become more severe, secondary frequency regulation strengthens system stability, alleviates these deviations, and thereby increases renewable accommodation capacity.
Table 5 shows the optimal configuration results of the wind power, PV power, energy storage and LCC-HVDC under secondary frequency regulation participation. Based on these results and four typical wind scenarios and four typical PV scenarios extracted from Figure 3, a total of 16 typical joint wind and PV output scenarios were constructed. Steady-state power flow simulations were performed for each scenario to analyze system voltage and frequency variations under different operating conditions. Voltage and frequency under different scenarios with secondary frequency regulation are shown in Figure 10. As shown, frequency fluctuations in all scenarios remain within the range of 49.5 Hz to 50.5 Hz, and voltage levels stay within a range of 0.97 p.u. to 1.03 p.u. In addition, during nighttime, when PV generation is unavailable, the system frequency in most scenarios approaches the lower bound of 49.5 Hz. This indicates that the lack of PV support at night causes a larger frequency deficit, which consequently restricts the maximum renewable integration capacity. The comparative analysis further shows that the introduction of secondary frequency regulation enhances nighttime system strength, thereby mitigating the frequency deficit and increasing the renewable accommodation capacity.
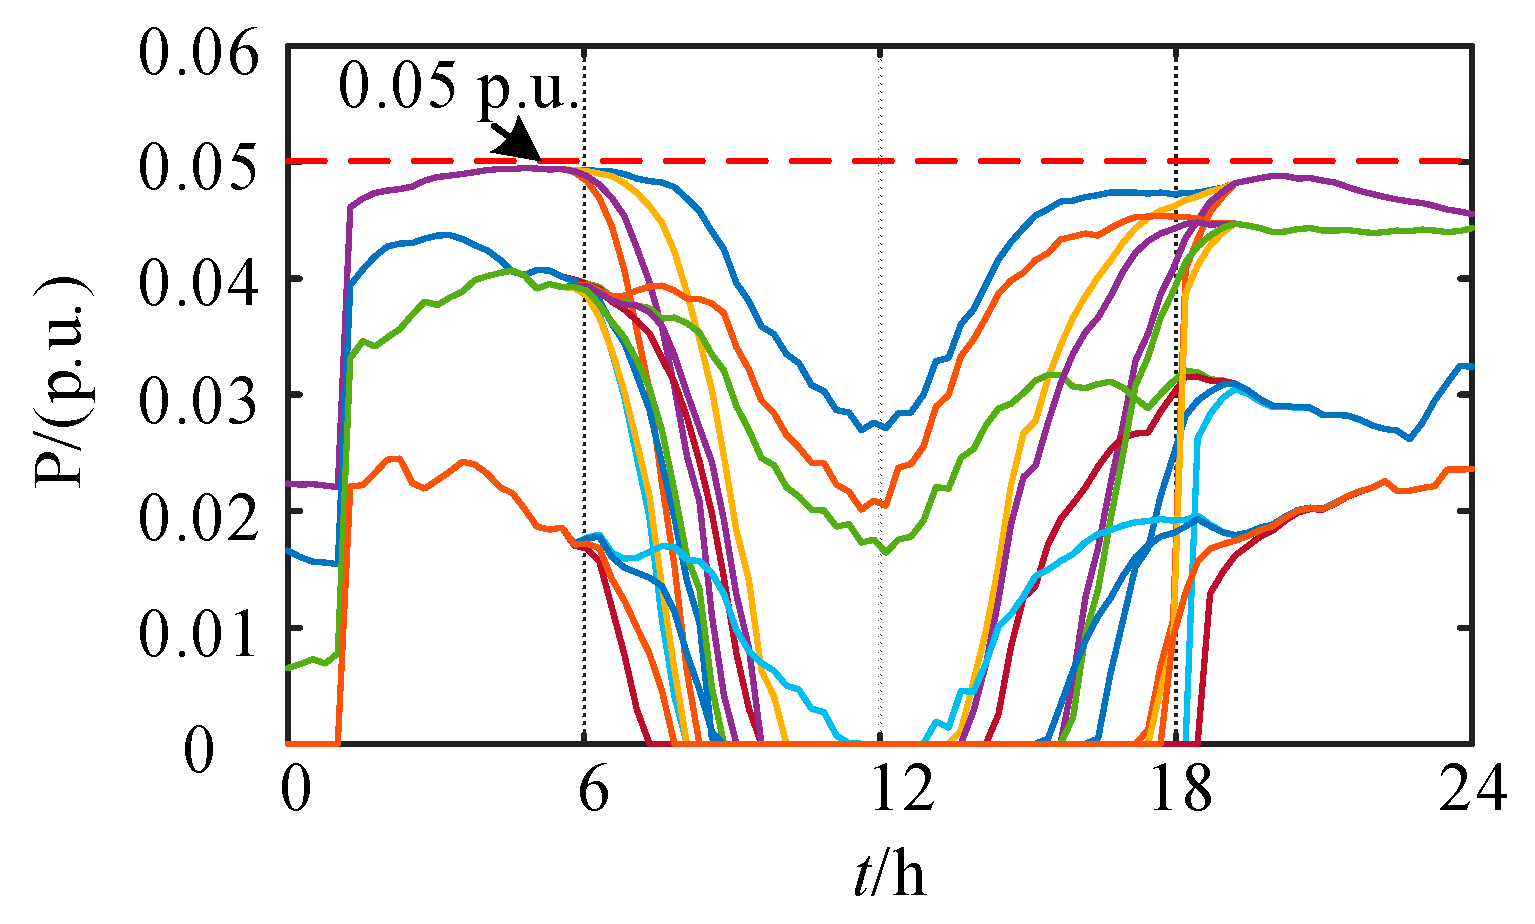
The distribution of additional active power output provided by hydropower units to support system frequency stability under the secondary frequency regulation mechanism is shown in Figure 11. As illustrated, the secondary frequency regulation output of hydropower mainly falls within the 0 to 0.05 p.u. range across typical operating scenarios. This indicates that the regulation magnitude stays within the preset secondary frequency regulation power limit without violations, thereby satisfying the power regulation constraints. It is also observed that during nighttime conditions, the hydropower output reaches higher levels and, in several scenarios, even approaches the maximum regulation value. This clearly indicates that secondary frequency regulation plays a crucial role in maintaining frequency stability at night, when renewable generation is limited.
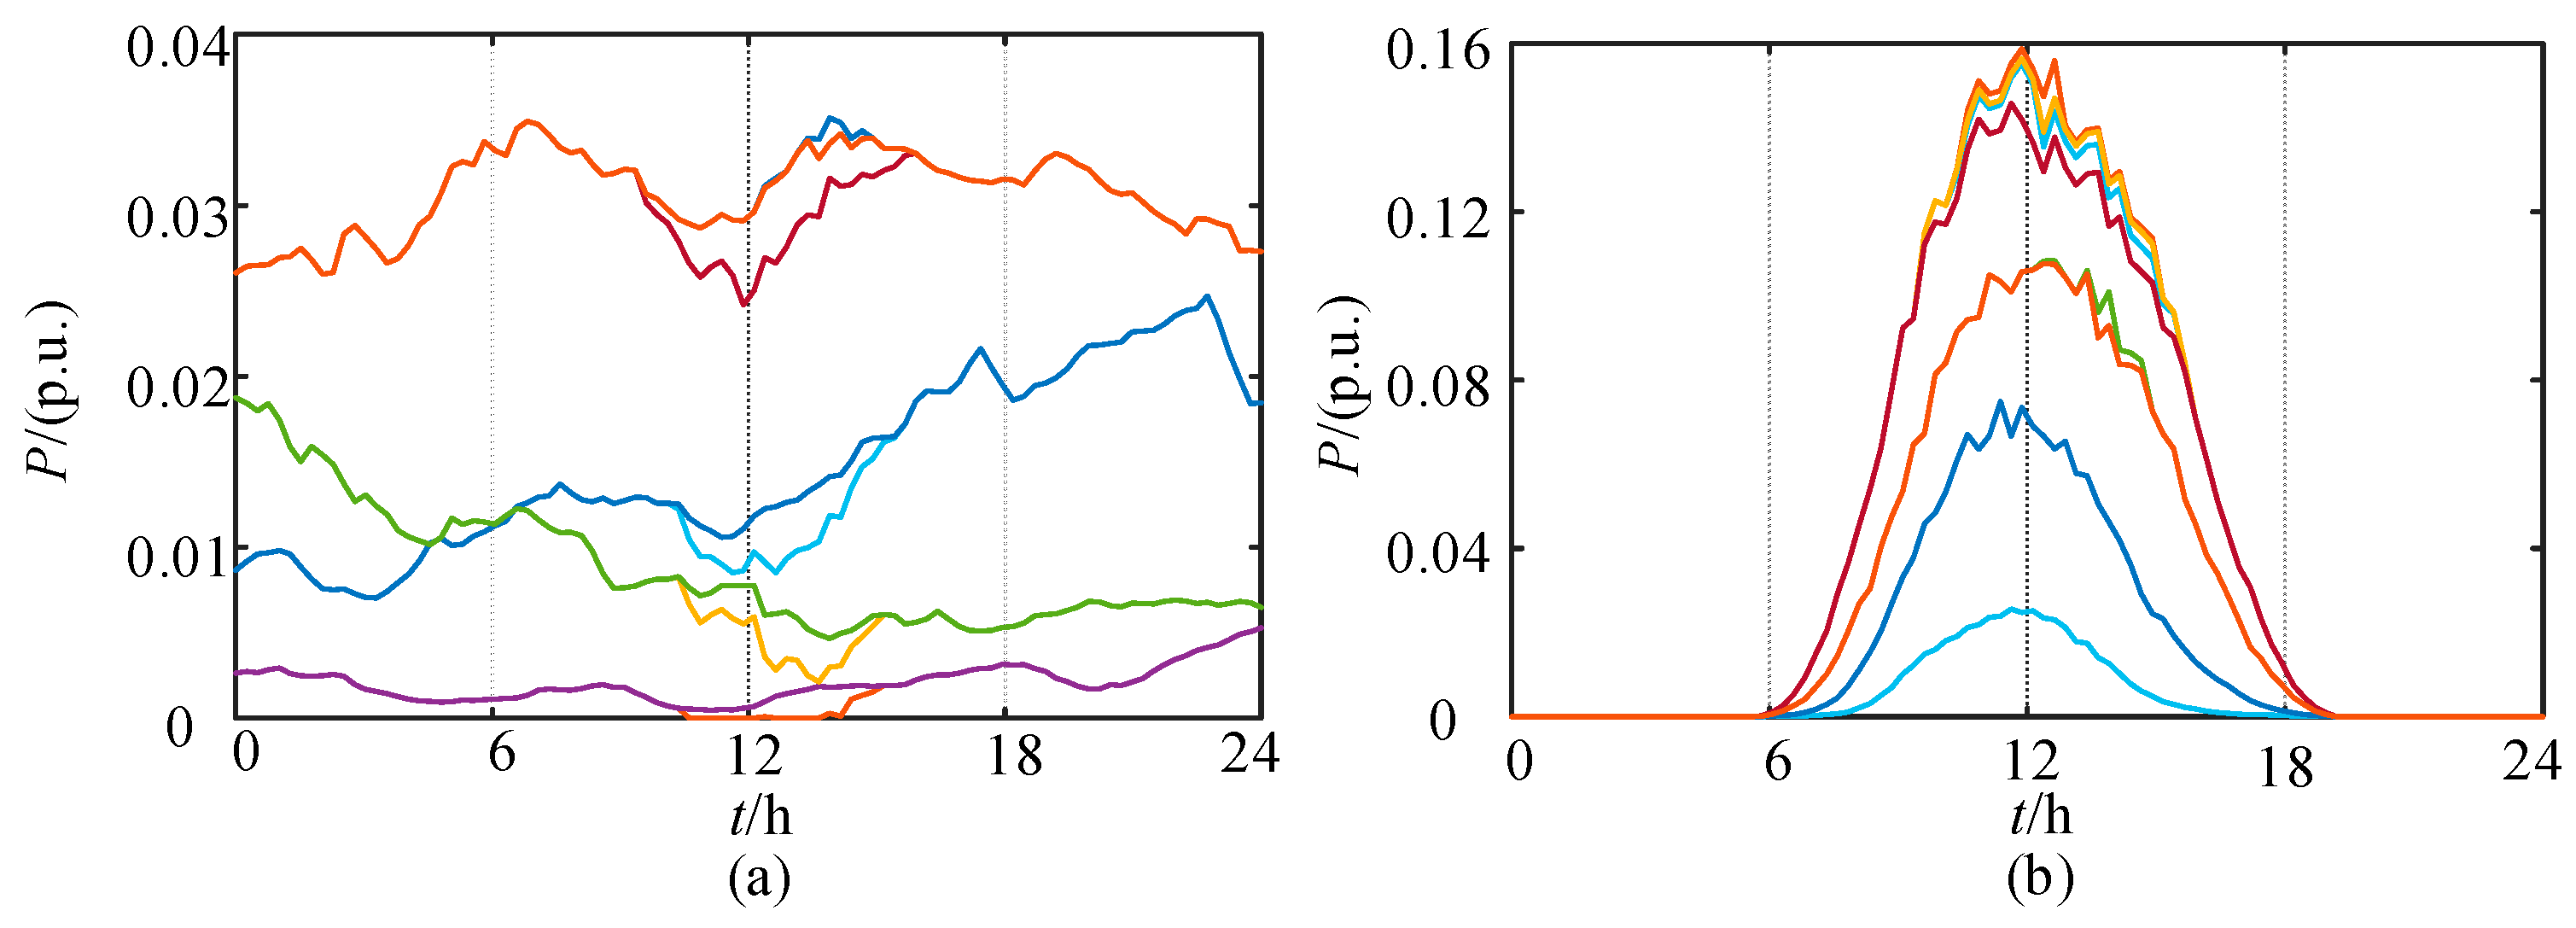
The actual outputs of wind and PV power under the secondary frequency regulation mechanism are shown in Figure 12. As illustrated, the output curves of both wind and PV power remain relatively stable during system frequency regulation, without significant large-scale curtailment. Compared with the case without secondary frequency regulation, the fluctuations of wind and PV outputs are noticeably reduced, indicating smoother renewable integration. This demonstrates that under the proposed coordinated control strategy, renewable energy can be effectively utilized, exhibiting strong regulation capability and enhanced system compatibility.
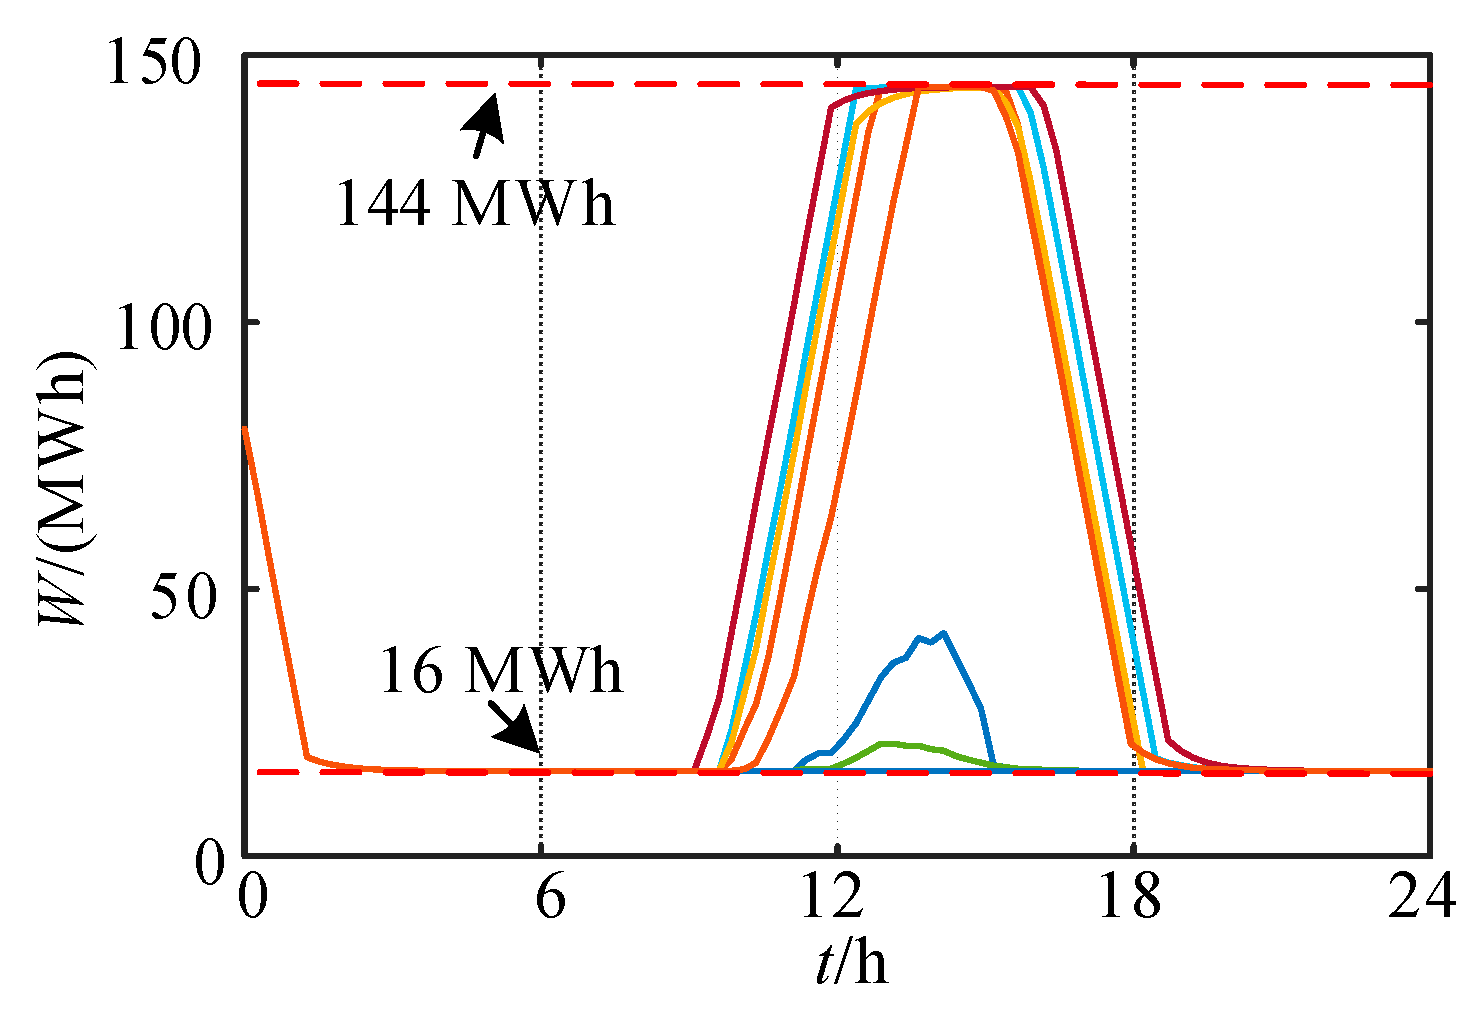
The variation in energy storage system capacity under secondary frequency regulation is shown in Figure 13, with a maximum capacity of 144 MWh and a minimum capacity of 16 MWh. Throughout the 24-h operating period, the energy storage capacity remains within this range without exceeding operational limits. It is also observed that the integration of secondary frequency regulation leads to a higher share of renewable output. However, since the energy storage system acts as the primary regulating resource, its output fluctuations become more pronounced, imposing greater operational stress.
To further verify the adaptability of the proposed method under different renewable participation conditions, the maximum renewable energy capacity configurations for the grid-connected, wind-only, and PV-only scenarios are summarized, as shown in Table 6. In the grid-connected case, the system can accommodate up to 1165 MW of wind power and 1091 MW of PV power, with relatively low storage participation (α = 0.1) and a DC output coefficient of 0.5. In the wind-only scenario, the maximum integration capacity is 355 MW, and the storage participation coefficient increases to 0.2 to ensure frequency stability, while the DC output coefficient decreases to 0.22. In the PV-only scenario, the maximum integration capacity reaches 416 MW, with a lower storage coefficient (α = 0.1) but a slightly higher DC output coefficient of 0.26. These results indicate that the renewable composition—whether mixed, wind-only, or PV-only—significantly affects the system’s maximum hosting capacity, storage requirements, and DC power delivery characteristics.

6. Conclusions

This paper proposed an optimal capacity configuration method for islanded DC transmission systems integrating hydropower, wind, PV, and energy storage. By combining a virtual balancing node, droop-based active power control, quadratic programming for reactive power, and PSO-based optimization, the approach enhances renewable penetration while reducing energy storage requirements. The following conclusions are drawn:
(1)
Typical wind and PV output scenarios are extracted using the K-medoids clustering method, effectively preserving the variability and uncertainty of renewable generation.
(2)
Based on a virtual balancing node, an islanded power flow model is developed, incorporating droop control for active power and quadratic programming for reactive power to coordinate frequency and voltage regulation. The maximum active and reactive power at the virtual balancing node is only 3.2 × 10⁻⁵ p.u. and 1.4 × 10⁻⁵ p.u., respectively, indicating the efficient self-balancing capability of the system.
(3)
Under the proposed optimization model, the method achieves maximum integration capacities of 100 MW for wind power and 304 MW for PV power without secondary frequency regulation. With hydropower secondary frequency regulation, the wind capacity remains at 100 MW, while the PV capacity increases to 540 MW, significantly enhancing renewable energy accommodation. Meanwhile, the required energy storage output coefficient is only 0.10, indicating that the strategy ensures system stability while balancing renewable energy utilization and overall economic efficiency.
This study is limited by assumptions such as ideal converter performance, simplified load representations, and a primary focus on steady-state scenarios. Future work will extend the framework to dynamic ramping events, contingency conditions, and transient disturbances in order to better assess control robustness and transient performance. The model will also be refined by incorporating non-ideal converter dynamics and stochastic load variations. Moreover, the proposed approach can be scaled to larger regional grids and AC/DC hybrid networks, thereby enhancing its applicability to real-world renewable integration.

Author Contributions

Conceptualization, Q.W., K.C., C.G. and J.L.; methodology, Y.T., C.H., C.G. and J.L.; software, Q.W., K.C. and. C.G.; validation, Y.T., Q.W. and C.H.; formal analysis, Y.T., C.H. and Q.W.; investigation, C.H. and C.G.; resources, C.H., K.C. and Q.W.; data curation, Y.T., C.H., K.C. and C.G.; writing—original draft preparation, C.H., K.C. and C.G.; writing—review and editing, C.H. and C.G.; visualization, Y.T., Q.W., C.H. and J.L.; supervision, Y.T., Q.W. and J.L.; project administration, Y.T., Q.W. and J.L.; funding acquisition, Y.T., Q.W. and J.L. All authors have read and agreed to the published version of the manuscript.

Funding

This work was supported by the Science and Technology Project of Southwest Branch of State Grid Corporation (Grant No. SGSW0000FGJS2400091).

Institutional Review Board Statement

Not applicable.

Informed Consent Statement

Not applicable.

Data Availability Statement

Data are contained within the article.

Conflicts of Interest

Authors Yuxuan Tao and Qing Wang were employed by the company Southwest Branch of State Grid Corporation. The remaining authors declare that the research was conducted in the absence of any commercial or financial relationships that could be construed as a potential conflict of interest.

Appendix A

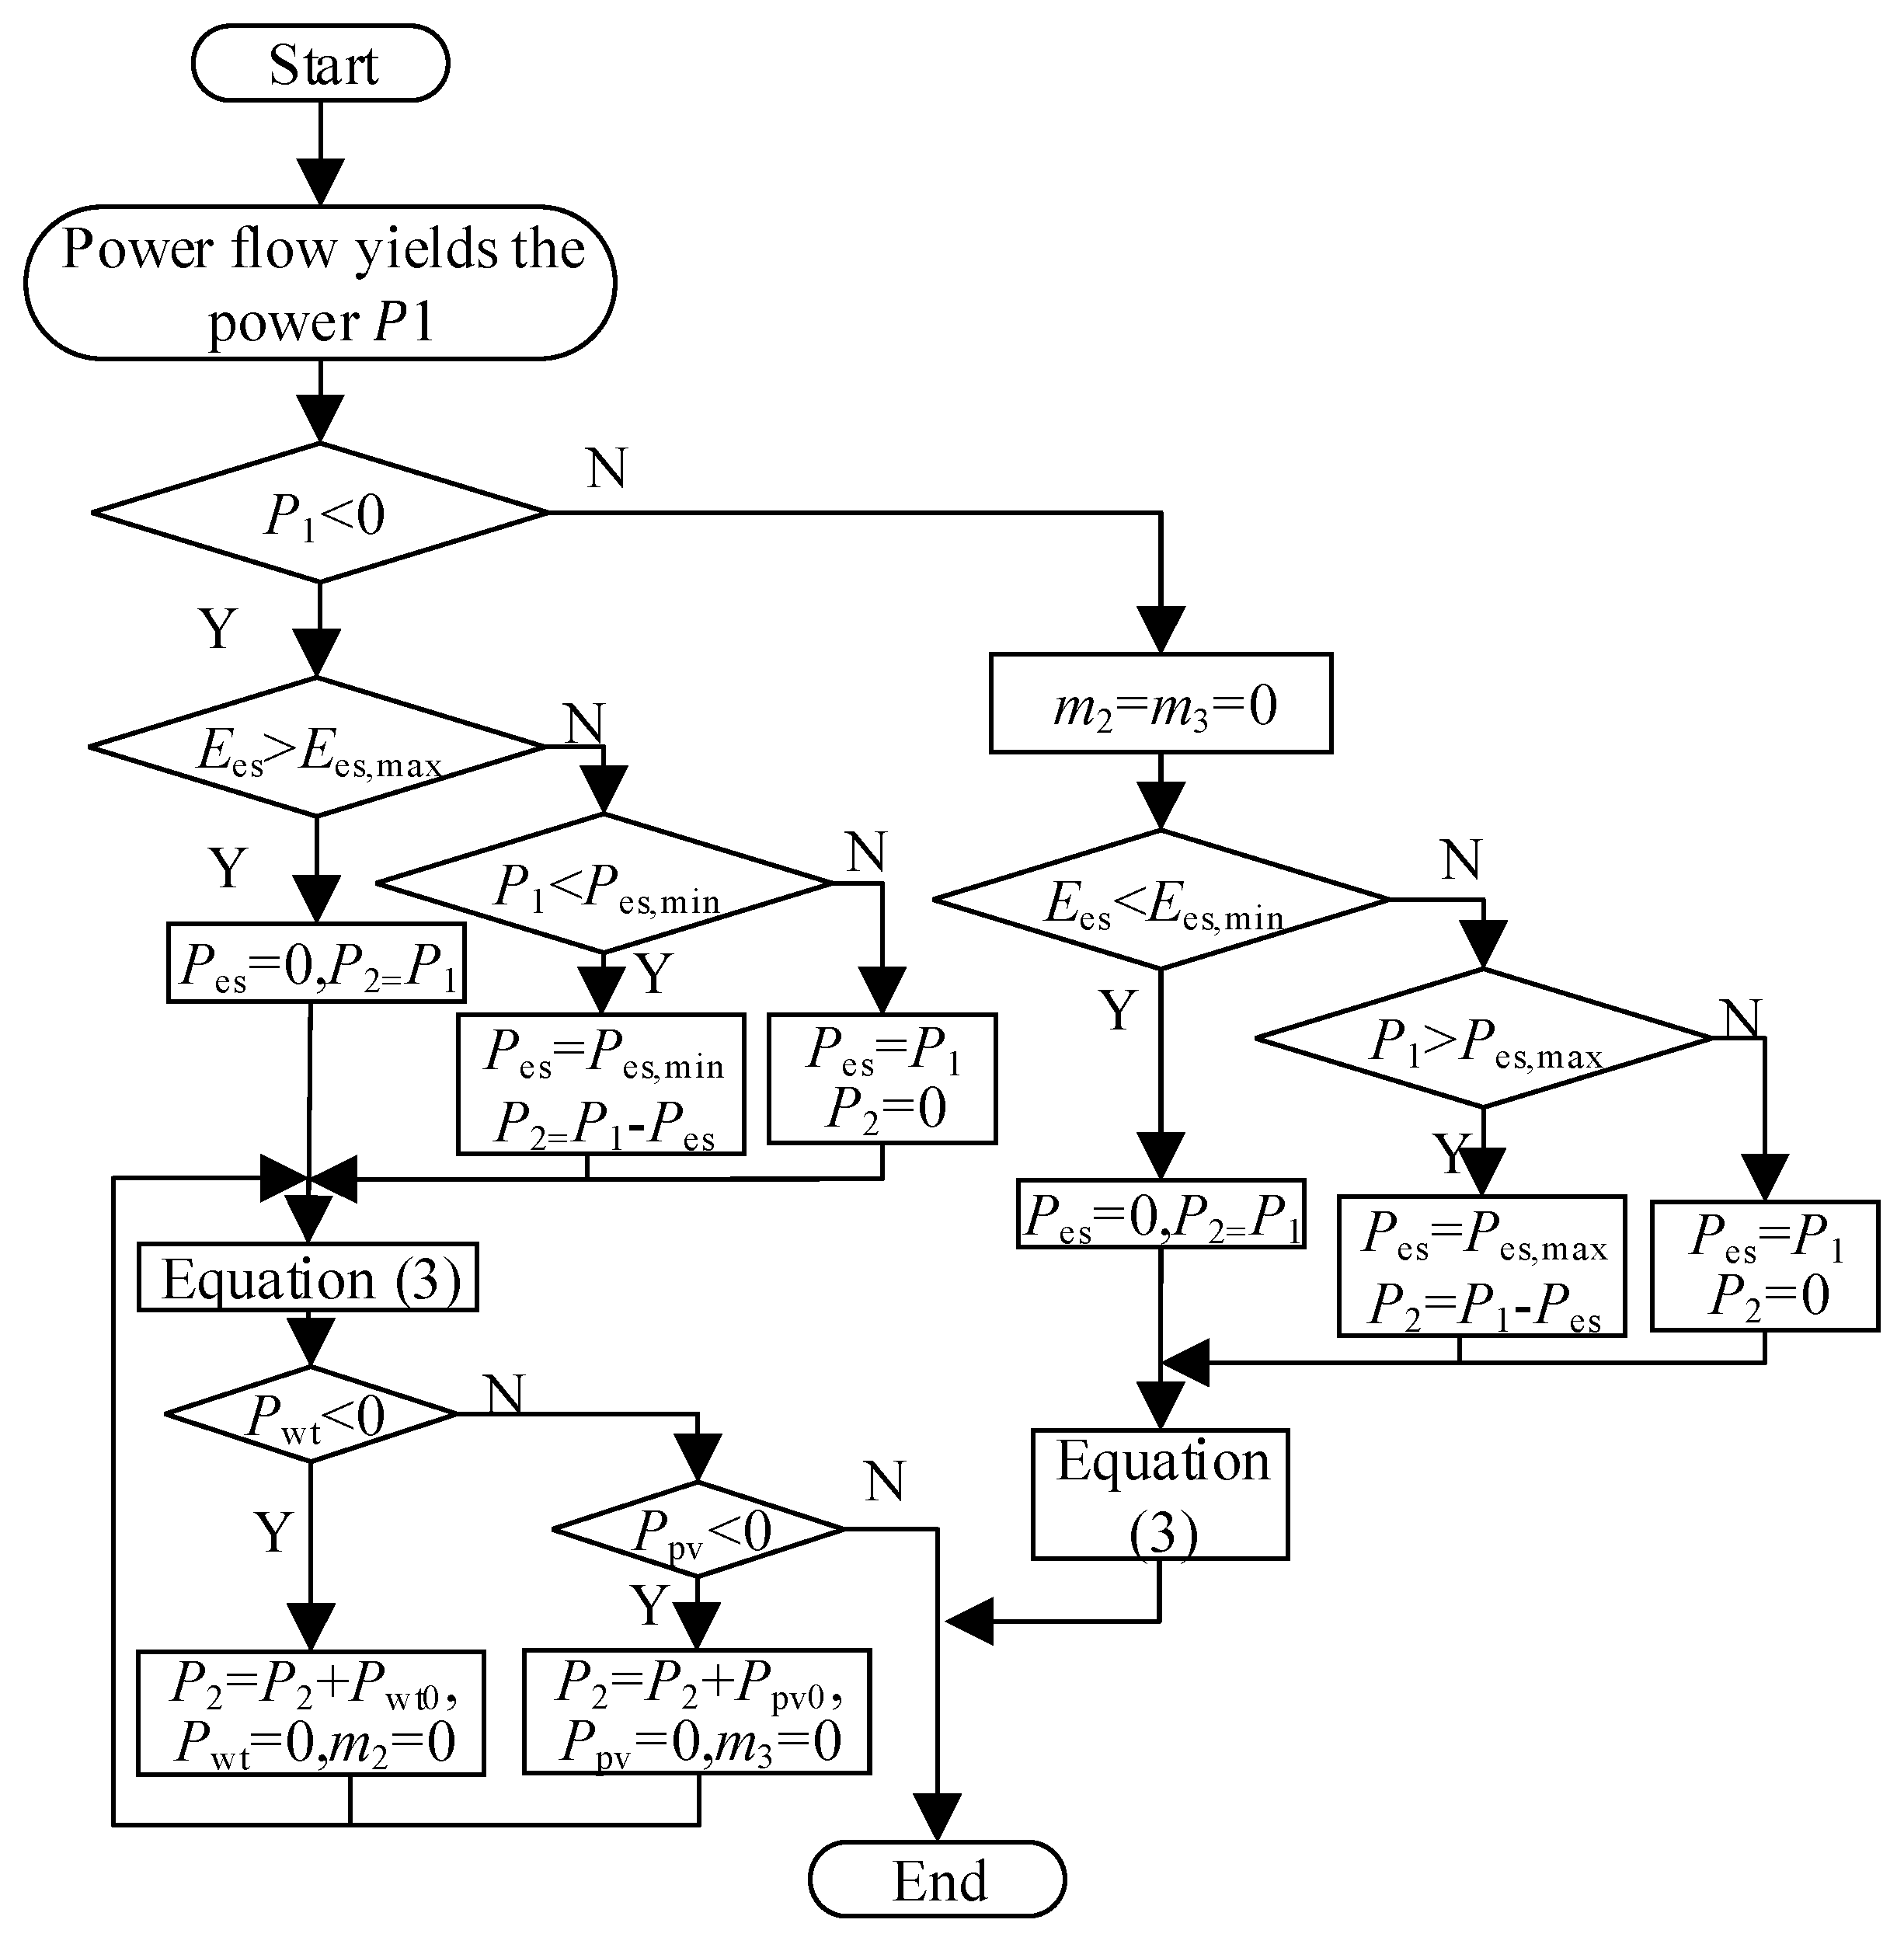
The active power droop allocation process is illustrated in Figure A1. In the figure, Ees, Ees,max and Ees,min denote the current, maximum, and minimum energy storage capacities, respectively. Pes,max and Pes,min represent the maximum discharge and charge powers of the energy storage system. The system power flow calculation yields the action power at the virtual balancing node P1, based on which the current system power state and dispatch requirements are determined.
Figure A1. Active power droop allocation flowchart.
Electronics 14 03557 g0a1
When P1 > 0, it indicates an active power deficit in the system, meaning that the load demand exceeds generation. Since wind and PV units are already operating at their maximum output levels, they cannot participate in further regulation, and thus their droop coefficients are set as m2 = m3 = 0. If the current state-of-charge of the energy storage system satisfies Ees < Ees,min, the energy storage is energy-depleted and unable to discharge. In this case, its output is set to Pes = 0, and the power deficit becomes P2 = P1, which is then allocated between hydropower and the LCC-HVDC according to (2). If Ees > Ees,min and P1 < Pes,max, the storage operates within its discharge range and can fully or partially supply the deficit, i.e., Pes = P1. When P1 > Pes,max, the energy storage reaches its discharge limit, supplying only Pes = Pes,max, and the remaining deficit P2 = P1Pes,max is distributed between hydropower and the LCC-HVDC according to (2).
When P1 < 0, the system experiences an active power surplus, which must be mitigated through source-side curtailment. The first step is to assess whether the energy storage system can absorb the excess power. If the current energy level satisfies EesEes,max, the energy storage unit is fully charged and cannot absorb additional power; thus, its output is set as Pes = 0. The resulting surplus P2 = P1 must then be curtailed by renewable sources such as wind and PV power. If the energy storage still has absorption capacity and the surplus exceeds the minimum charging power Pes,min, the system can be balanced by setting Pes = P1. However, if the surplus is less than Pes,min, the energy storage output is fixed at Pes = Pes,min, and the remaining surplus must be absorbed through coordinated curtailment among other generation units.
If the energy storage system is unable to fully absorb the power surplus, wind and PV generation units are sequentially curtailed based on Equation (2). If the curtailed wind power output becomes negative, indicating insufficient capacity for further reduction, the wind output is set to zero (Pwt = 0), and its droop coefficient is set to zero (m2 = 0). The initial wind output Pwt0 is then added back to the surplus (P2 = P2 + Pwt0), and the updated surplus P2 is redistributed. The PV units are treated similarly, ensuring that the final dispatched outputs of wind and PV generation are non-negative, i.e., Pwt ≥ 0 and Ppv ≥ 0, thereby satisfying operational constraints. The same logic applies to PV units. By maintaining non-negative dispatched outputs for both wind and PV generation, this approach ensures compliance with operational constraints.

References

  1. Mathew, E.C.; Sharma, R.; Das, A. A fault tolerant scheme for integration of remote renewable energy sources with HVDC system. IEEE Trans. Power Deliv. 2020, 35, 2876–2884. [Google Scholar] [CrossRef]
  2. Guo, C.; Zhang, J. Impact of grid-forming-based PV on SSTI stability of PV–thermal-bundled system transmitted by LCC-HVDC. IEEE Trans. Power Deliv. 2025, 40, 152–165. [Google Scholar] [CrossRef]
  3. Yang, Y.; Wen, Y.; Zhang, Z.; Dong, Y.; Shen, C.; Liu, Y. Toward 100% renewable power grids: A review. IEEE Access 2025, 13, 69690–69704. [Google Scholar] [CrossRef]
  4. Jiao, Y.; Li, B.; Ding, L.; Suo, Z.; Xu, D. DC/DC converter with high current capability for all DC renewable system. IEEE Trans. Power Electron. 2024, 39, 12091–12095. [Google Scholar] [CrossRef]
  5. Wang, W.; Li, G.; Guo, J. Large-scale renewable energy transmission by HVDC: Challenges and proposals. Engineering 2022, 19, 252–267. [Google Scholar] [CrossRef]
  6. Guo, H.; Zhang, Z.; Xu, Z. Parallel converter-based hybrid HVDC system for integration and delivery of large-scale renewable energy. J. Mod. Power Syst. Clean Energy 2025, 13, 688–697. [Google Scholar] [CrossRef]
  7. Teng, S.; Xiong, L.; Zheng, K.; Gang, M.; Wen, W.; Li, Q. Research on the full DC collection system for onshore large-scale islanded new energy. In Proceedings of the 6th International Conference on Energy Systems and Electrical Power (ICESEP), Wuhan, China, 21–23 June 2024; pp. 494–499. [Google Scholar]
  8. Xing, C.; Liu, M.; Peng, J.; Wang, Y.; Liao, J.; Zheng, Z.; Gao, S.; Guo, C. LCC-HVDC frequency robust control strategy based on system parameter identification in islanded operation mode. Electronics 2024, 13, 951. [Google Scholar] [CrossRef]
  9. Song, Y.; Zhang, J.; Zhao, Y.; Li, G.; Li, S.; Liu, Y.; Yang, L.; Zhou, Z.; Zhao, C. Sending end frequency and voltage under islanded operation mode of HVDC transmission system. In Proceedings of the IEEE Conference on Energy Internet and Energy System Integration (EI2), Beijing, China, 26–28 November 2017; pp. 1–6. [Google Scholar]
  10. Wu, J.Y.; Li, H.F.; Wang, G.; Liang, Y.S. An improved traveling-wave protection scheme for LCC-HVDC transmission lines. IEEE Trans. Power Deliv. 2017, 32, 106–116. [Google Scholar] [CrossRef]
  11. Liu, B.; Zhang, P.; Lu, G.; Chen, X. Influence analysis of oscillation harmonics in LCC-HVDC delivery system based on impedance modeling. IEEE Trans. Circuits Syst. I 2023, 70, 4194–4203. [Google Scholar] [CrossRef]
  12. Guo, C.; Liao, J.; Wang, Y.; Zhang, W.; Liu, Y.; Wang, H.; Yu, D. Fault location and protection for metallic return HVDC grid based on natural frequency extraction of modal derivative current. IEEE Trans. Instrum. Meas. 2025, 74, 3508116. [Google Scholar] [CrossRef]
  13. Ding, R.; Zhao, C.; Shen, X.; Liang, C.; Liao, M. Control strategy of islanded wind farms connected to LCC-HVDC. In Proceedings of the 8th International Conference on Energy, Electrical and Power Engineering (CEEPE), Wuxi, China, 25–27 April 2025; pp. 465–470. [Google Scholar]
  14. Meng, P.; Xiang, W.; Chi, Y.; Wang, Z.; Lin, W.; Wen, J. Resilient DC voltage control for islanded wind farms integration using cascaded hybrid HVDC system. IEEE Trans. Power Syst. 2022, 37, 1054–1066. [Google Scholar] [CrossRef]
  15. Wang, S.; Wang, Y.; Ma, J.; Wei, L.; Li, X.; Liu, X. Study of frequency and voltage characteristics of islanding HVDC system and the corresponding control strategy. In Proceedings of the International Conference on Power System Technology, Chengdu, China, 20–22 October 2014; pp. 2247–2251. [Google Scholar]
  16. Xiong, W.; Tang, Z.; Cui, X. Distributed data-driven voltage control for active distribution networks with changing grid topologies. Control Eng. Pract. 2024, 147, 105933. [Google Scholar] [CrossRef]
  17. Lin, K.; Lu, X.; Wu, F.; Shi, L. Evaluation of the renewable energy accommodation capacity in the regional power grid. In Proceedings of the 12th IEEE PES Asia-Pacific Power and Energy Engineering Conference (APPEEC), Nanjing, China, 20–23 September 2020; pp. 1–4. [Google Scholar]
  18. Xia, S.; Wu, J.; Ma, S.; Wang, Z.; Sun, C.; Tang, T.; Shao, C. Photovoltaic power generation and energy storage capacity cooperative planning method for rail transit self-consistent energy systems considering the impact of DoD. IEEE Trans. Smart Grid 2025, 16, 665–677. [Google Scholar] [CrossRef]
  19. Starke, A.R.; Cardemil, J.M.; Escobar, R.; Colle, S. Multi-objective optimization of hybrid CSP+PV system using genetic algorithm. Energy 2018, 147, 490–503. [Google Scholar] [CrossRef]
  20. Hou, H.; Xu, T.; Wu, X.; Wang, H.; Tang, A.; Chen, Y. Optimal capacity configuration of the wind–photovoltaic–storage hybrid power system based on gravity energy storage system. Appl. Energy 2020, 271, 115052. [Google Scholar] [CrossRef]
  21. Roy, P.; He, J.; Liao, Y. Cost optimization of battery and supercapacitor hybrid energy storage system for dispatching solar PV power. In Proceedings of the 2020 IEEE Energy Conversion Congress and Exposition (ECCE), Detroit, MI, USA, 11–15 October 2020; pp. 561–568. [Google Scholar]
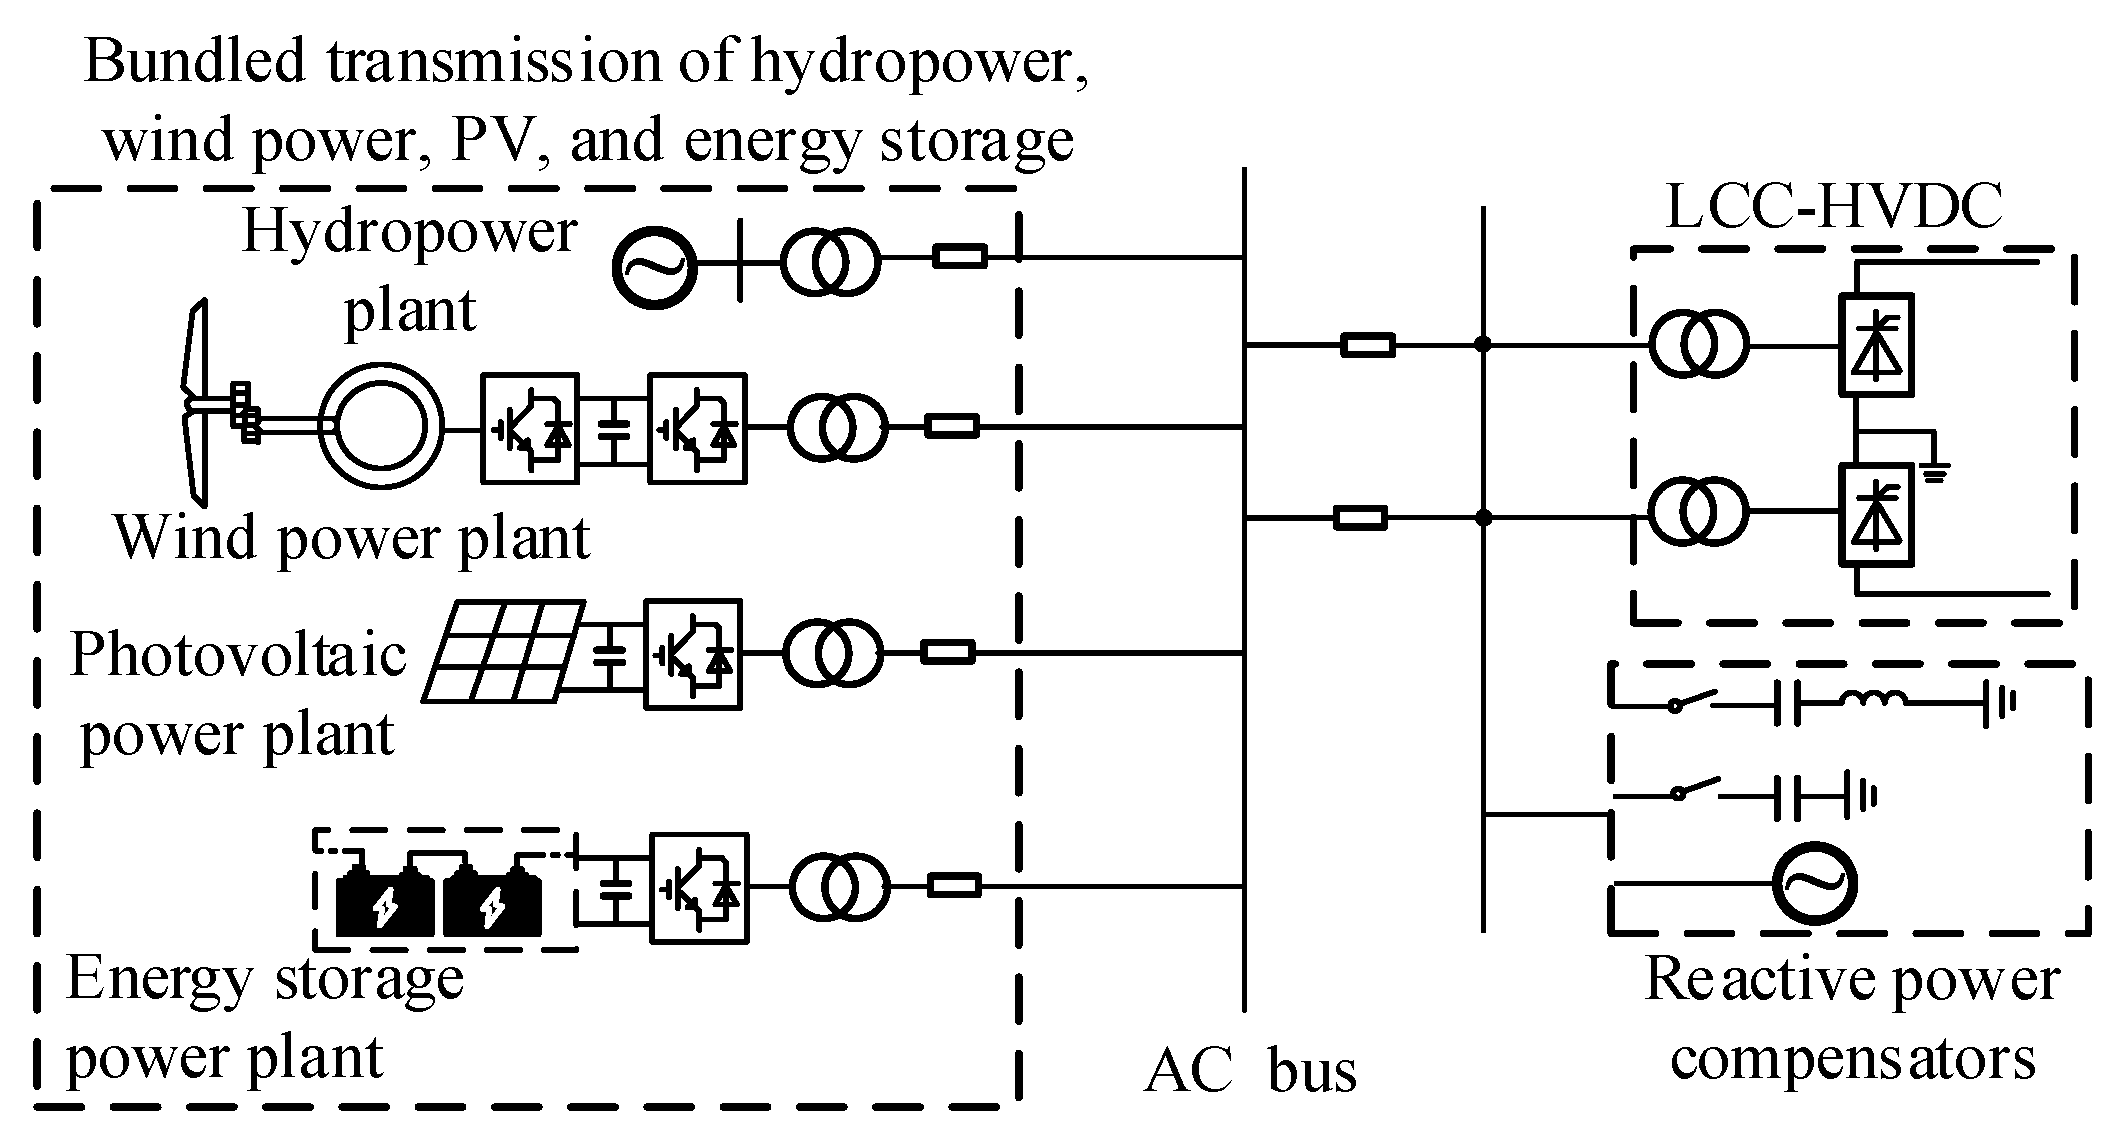
Figure 1. Structure of an islanded LCC-HVDC transmission system.
Electronics 14 03557 g001
Figure 2. Annual operational scenarios: (a) PV power; (b) wind power.
Electronics 14 03557 g002
Figure 3. Typical power generation scenarios obtained via K-medoids clustering: (a) PV power; (b) wind power.
Electronics 14 03557 g003
Figure 4. Topology of hydro–wind–PV–storage DC transmission system.
Electronics 14 03557 g004
Figure 5. Flowchart of the PSO solution process.
Electronics 14 03557 g005
Figure 6. Voltage and frequency profiles under different scenarios: (a) Frequency; (b) Voltage.
Electronics 14 03557 g006
Figure 7. Output power of the virtual balancing node under different operating conditions: (a) Active power; (b) Reactive power.
Electronics 14 03557 g007
Figure 8. Variation in energy storage capacity under different scenarios.
Electronics 14 03557 g008
Figure 9. Actual output of renewable energy under different scenarios: (a) Wind power; (b) PV power.
Electronics 14 03557 g009
Figure 10. Voltage and frequency under different scenarios with secondary frequency regulation: (a) Frequency, (b) Voltage.
Electronics 14 03557 g010
Figure 11. Additional active power output of hydropower under the secondary frequency regulation mechanism.
Electronics 14 03557 g011
Figure 12. Actual renewable energy output under different scenarios with secondary frequency regulation; (a) Wind power; (b) PV power.
Electronics 14 03557 g012
Figure 13. Energy storage capacity under different scenarios with secondary frequency regulation.
Electronics 14 03557 g013
Table 1. Comparison of Different Methods under Various Research Objectives, Storage Configurations, and Operational Constraints.
Study/
Method
Research
Objective
Storage Sizing
Approach
Constraint Handling
This study (proposed)Maximizing renewable utilization and stable power sharing in an islanded DC systemJoint sizing of wind, photovoltaic, and energy storage using PSO; droop and voltage optimization reduce storage burdenFrequency (49.5–50.5 Hz), DC voltage (0.95–1.05 p.u.), virtual-node Q = 0, converter active/reactive/apparent power limits, Energy Storage System (ESS) State of Charge (SOC) and power bounds
Reference [18]Photovoltaic integration and storage lifetime optimization in urban rail systemsCo-planning of photovoltaic and hybrid ESS, considering battery Depth of Discharge (DoD) and cycle lifePower balance, SOC/DoD limits, equipment capacity boundaries, does not involve frequency stability constraints of islanded DC systems.
Reference [20]Economic optimization of renewable capacity configurationEconomic optimization to minimize cost of renewable capacity configurationEnergy balance, SOC and power limits, cost and reliability indicators, does not involve frequency stability constraints of islanded DC systems.
Reference [21]Photovoltaic power dispatch and storage cost minimizationBattery–supercapacitor hybrid scheduling; PSO-optimized low-pass filter (LPF) parameters; SOC fuzzy controlESS power/voltage/current limits, SOC and temperature constraints; objective includes investment and operating cost
Table 2. Annual occurrence probability and mean squared error (MSE) of representative operating scenarios.
Representative ScenarioProbabilityMSE
PV 10.220.198
PV 20.300.057
PV 30.290.321
PV 40.190.242
WT 10.152.539
WT 20.201.777
WT 30.410.296
WT 40.241.321
Table 3. Main System Parameters.
ParameterValue
Upper limit of rated power for PV and wind/MVA1500
Lower limit of rated power for PV and wind/MVA100
Range of energy storage output coefficient (α)[0.1, 0.2]
Energy storage capacity range[0.1, 0.9]
Charging/discharging efficiency of energy storage0.96
Energy storage maximum capacity (Ees,max)/MWh2.5 h × Pes,N
Initial energy storage capacity0.5Ees,max
Range of DC output coefficient (γ)[0, 1]
Rated power of hydropower (Ph,N)/MW500
System rated power/MVA4000
System frequency range/Hz[49.5, 50.5]
Node frequency range/p.u.[0.95, 10.5]
Hydropower droop coefficient (m1)/(MW/Hz)100
Wind power droop coefficient (m2)/(MW/Hz)0.1Pwt,N/0.5 Hz
PV droop coefficient (m3)/(MW/Hz)0.1Ppv,N/0.5 Hz
DC droop coefficient (m4)/(MW/Hz)0.2Pdc,N/1 Hz
number of particles30
Maximum iterations100
Inertia weight0.7
Individual learning factor2
Global learning factor2
Table 4. Optimal capacity configuration of renewable energy integration.
Wind Power/MWPV Power
/MW
Energy Storage Output
Coefficient
α
DC Output Coefficient
γ
1003040.10.23
Table 5. Maximum renewable energy capacity configuration under hydropower secondary frequency regulation.
Wind Power/MWPV Power
/MW
Energy Storage Output
Coefficient
α
DC Output Coefficient
γ
1005400.10.31
Table 6. Maximum renewable energy capacity configuration under different participation conditions.
ScenarioWind Power/MWPV Power/MWEnergy Storage
Output Coefficient (α)
DC Output
Coefficient (γ)
Grid-connected116510910.10.5
Wind-only355/0.20.22
PV-only/4160.10.26
Disclaimer/Publisher’s Note: The statements, opinions and data contained in all publications are solely those of the individual author(s) and contributor(s) and not of MDPI and/or the editor(s). MDPI and/or the editor(s) disclaim responsibility for any injury to people or property resulting from any ideas, methods, instructions or products referred to in the content.