1. Introduction
The urinary bladder’s normal function is to store and expel urine in a coordinated and controlled manner. This activity is regulated by both the central and peripheral nervous systems. Neurogenic bladder (NB) refers to bladder dysfunction resulting from neurological disorders or injuries—whether due to internal or external trauma, disease, or congenital conditions—leading to symptoms such as urinary incontinence, retention, and recurrent urinary tract infections (UTIs) [
1]. Common underlying causes include spinal cord injury, multiple sclerosis, and spina bifida. The standard management approach, intermittent catheterisation (IC), is effective but invasive, often uncomfortable, and associated with an increased risk of UTIs, all of which can significantly impact patients’ quality of life [
2].
The incidence of NB dysfunction varies depending on the underlying condition. Bladder disorders are reported in 40% to 90% of patients with multiple sclerosis, with 50% to 90% of cases involving detrusor overactivity and 20% to 30% involving detrusor areflexia [
3]. In idiopathic Parkinson’s disease, studies have shown that urinary storage symptoms—such as frequency, urgency, and urinary incontinence—are present in 57% to 83% of patients, while voiding symptoms—such as weak urinary stream, hesitancy, and incomplete emptying—occur in 17% to 27%. Additionally, NB is observed in approximately 15% of patients following a stroke [
3].
Treatment of NB aims to maintain continence, prevent high-pressure detrusor activity that could damage the upper urinary tract, minimise UTIs, and avoid bladder overdistension [
4]. Additional complications may include renal deterioration, urolithiasis, and increased risk of urinary tract neoplasia. Management strategies vary with symptom type and include behavioural modifications, clean intermittent catheterisation (CIC), pharmacotherapy, intradetrusor injections, and, in refractory cases, surgical interventions.
CIC remains a cornerstone of care but is invasive and associated with UTIs, urethral trauma, and patient discomfort. Its scheduling is typically based on urodynamic studies, fluid intake, and estimated bladder volume. Accurate bladder monitoring is therefore essential to optimise catheterisation timing and reduce unnecessary interventions [
5].
While hospital-based ultrasound devices enable bladder volume monitoring, they are impractical for continuous use in daily life. Near-infrared spectroscopy (NIRS) emerges as a promising non-invasive optical technology. NIRS allows for the estimation of changes in the concentration of tissue chromophores (such as water and haemoglobin) by analysing the absorption of light emitted between 700 and 1000 nm [
6]. This technique, when applied to the suprapubic region, has the potential to monitor bladder filling continuously and discreetly.
Recent work underscores the challenges and opportunities of wearable optical sensing [
7]. In particular, advanced designs have explored strategies to mitigate or even exploit ambient light, such as adaptive power-harvesting systems that dynamically adjust LED emissions and store light energy for continuous operation [
8]. At the same time, multimodal approaches are gaining traction, with sensor fusion frameworks combining ambient light sensors, inertial units, or hybrid biophysical/biochemical modalities to enhance robustness and accuracy [
9,
10]. Bibliometric analyses further highlight multimodal sensor fusion as a rapidly emerging research priority in wearable health for elderly populations [
11]. These developments frame the present work, which employs NIRS technology in a deliberately dark ambient—beneath clothing—to avoid light interference while exploring the use of machine-learning models for bladder volume estimation.
This article details the development of the SafeBladder project, from the prototype’s conception and its electronic components to its experimental validation and the development of artificial intelligence models for bladder volume estimation.
2. Materials and Methods
2.1. Prototype Development
The device was developed using an Arduino Uno microcontroller board. The optical system comprises multiple pairs of infrared light-emitting diodes (LEDs) with wavelengths of 850 nm and 940 nm, along with photodiode receivers. Infrared LEDs were chosen due to their compact size, low weight, and cost-effectiveness. While the water absorption peak is at 975 nm, suitable commercial LEDs at that wavelength are limited, so nearby wavelengths were used. Photodiodes with a large active area, wide viewing angle, and sensitivity to the selected wavelengths were chosen to optimise light detection from tissue. Photodiode currents were converted to voltage using TLV333 zero-drift op-amps configured as transimpedance amplifiers (one per channel), then digitised by an ADS1115 analogue-to-digital converter (ADC).
Table 1 summarises the key specifications of the optical front-end.
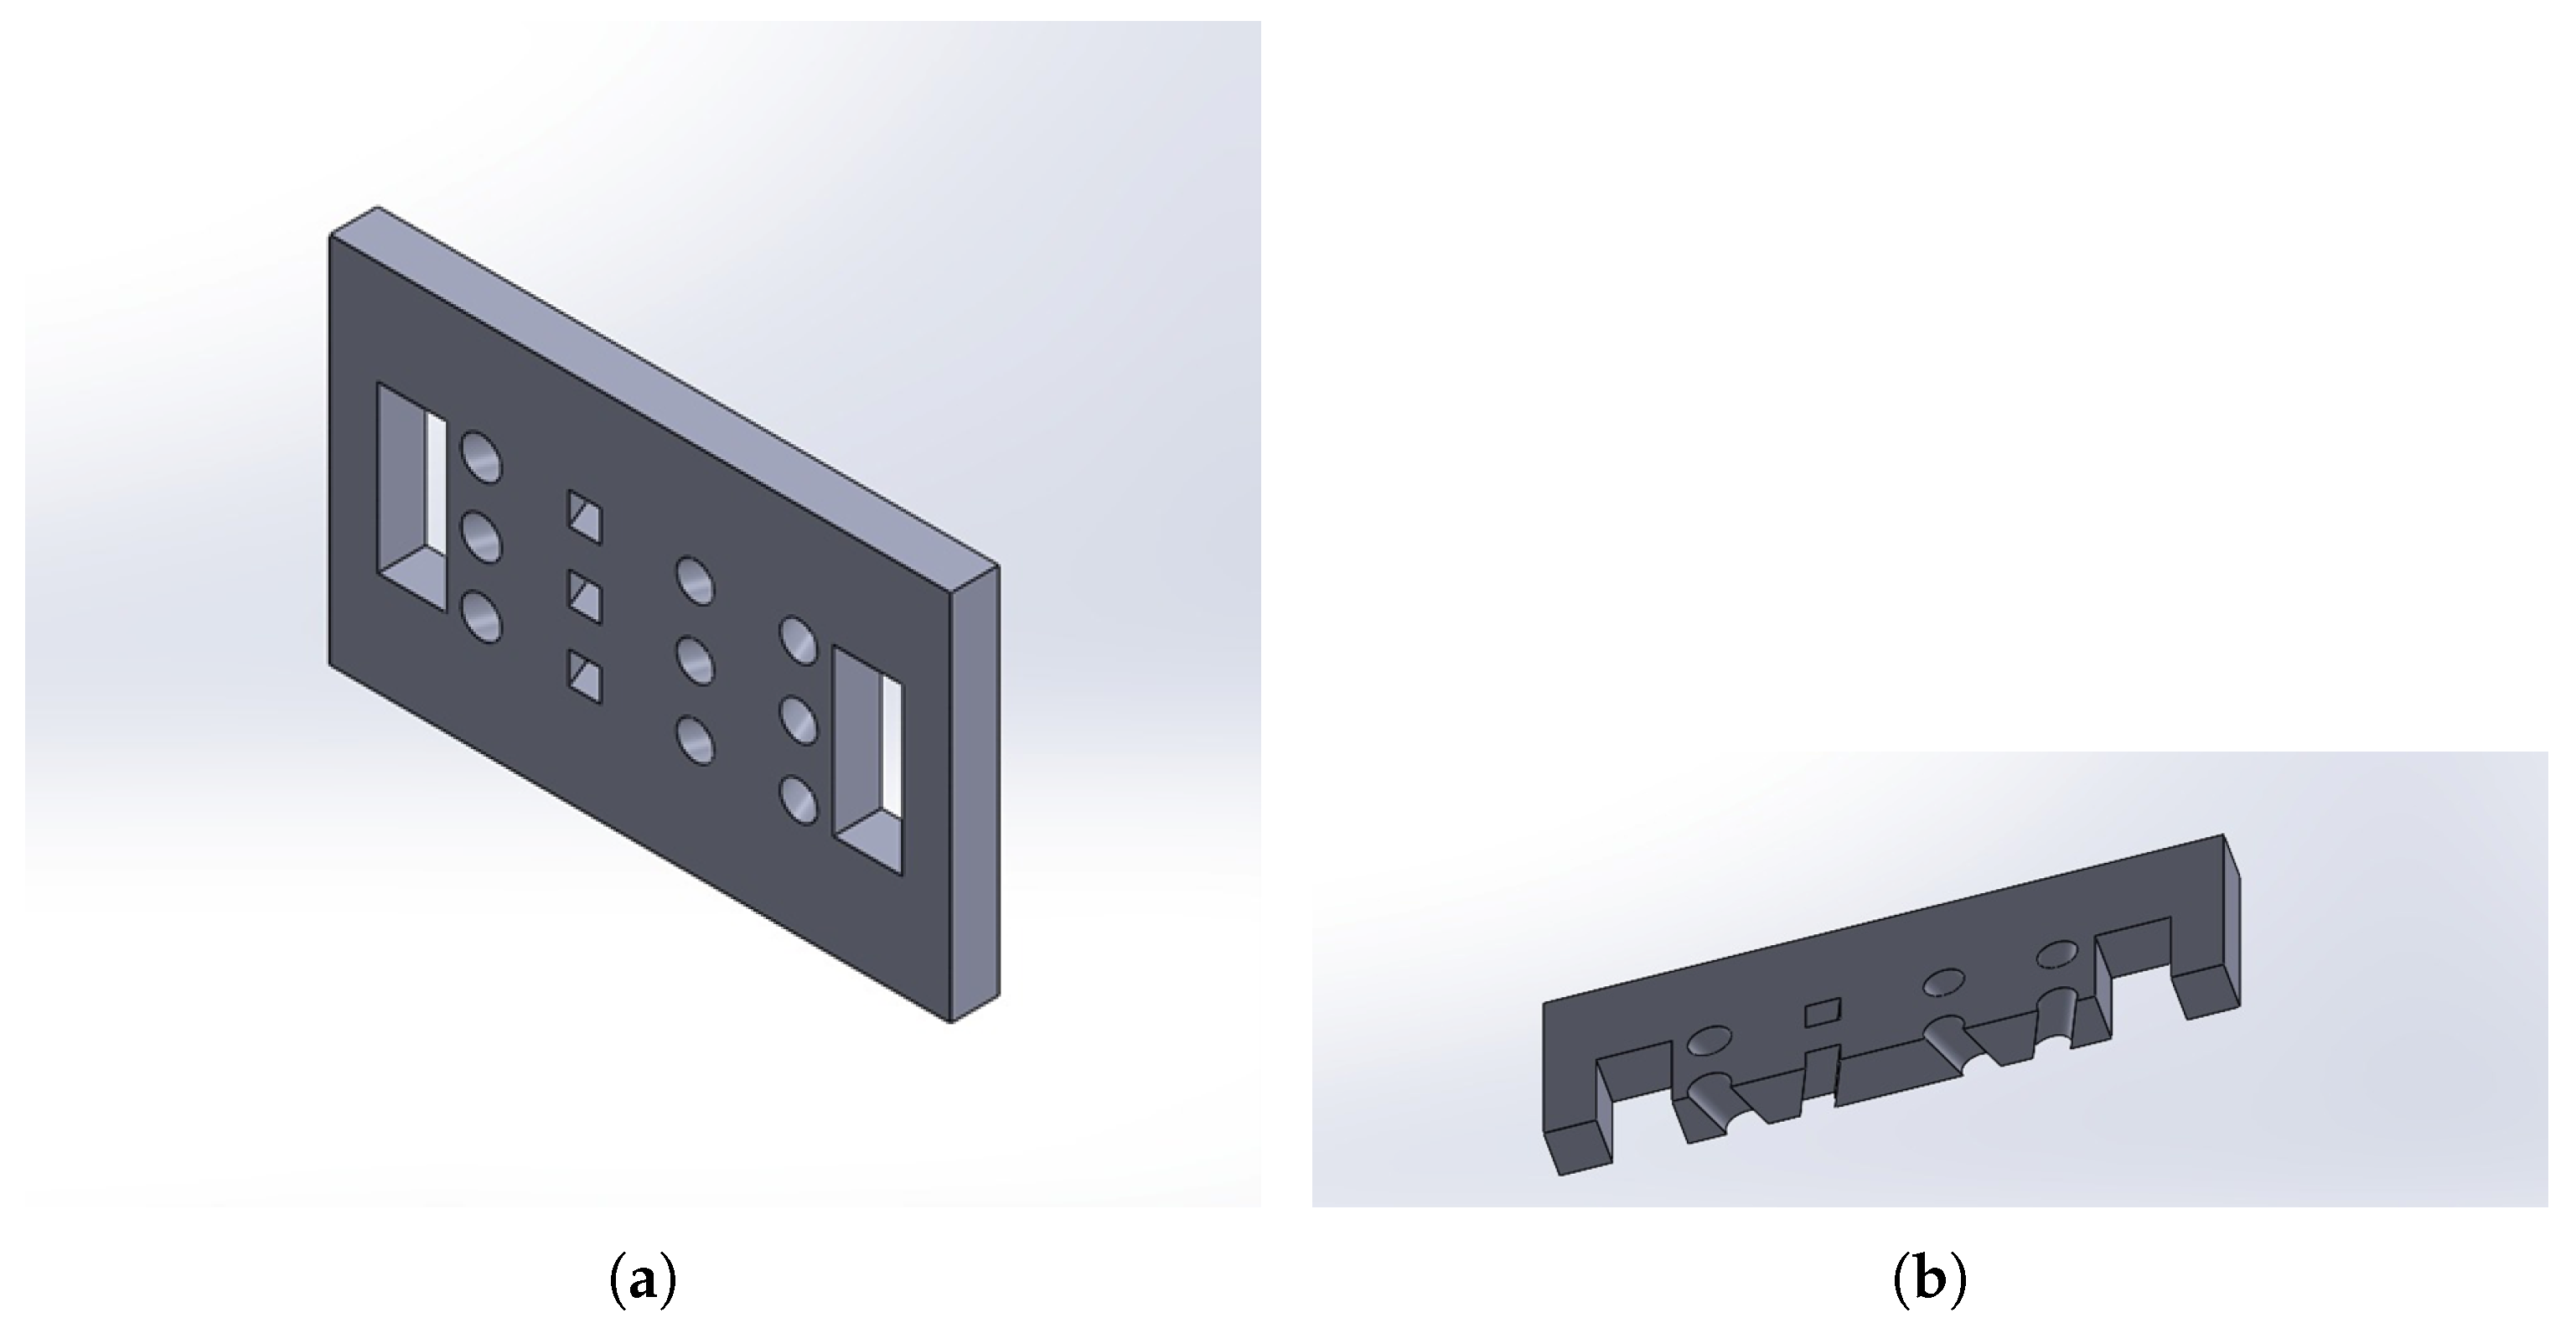
The sensor housing was modelled in SolidWorks 2024 (
Figure 1) and fabricated via 3D printing using polylactic acid (PLA). The design evolved to incorporate inclinations in the sensor slots, optimising the light emission and reception angle to maximise the interception of the signal reflected by the target volume.
2.2. Circuit Assembly and Channel Mapping
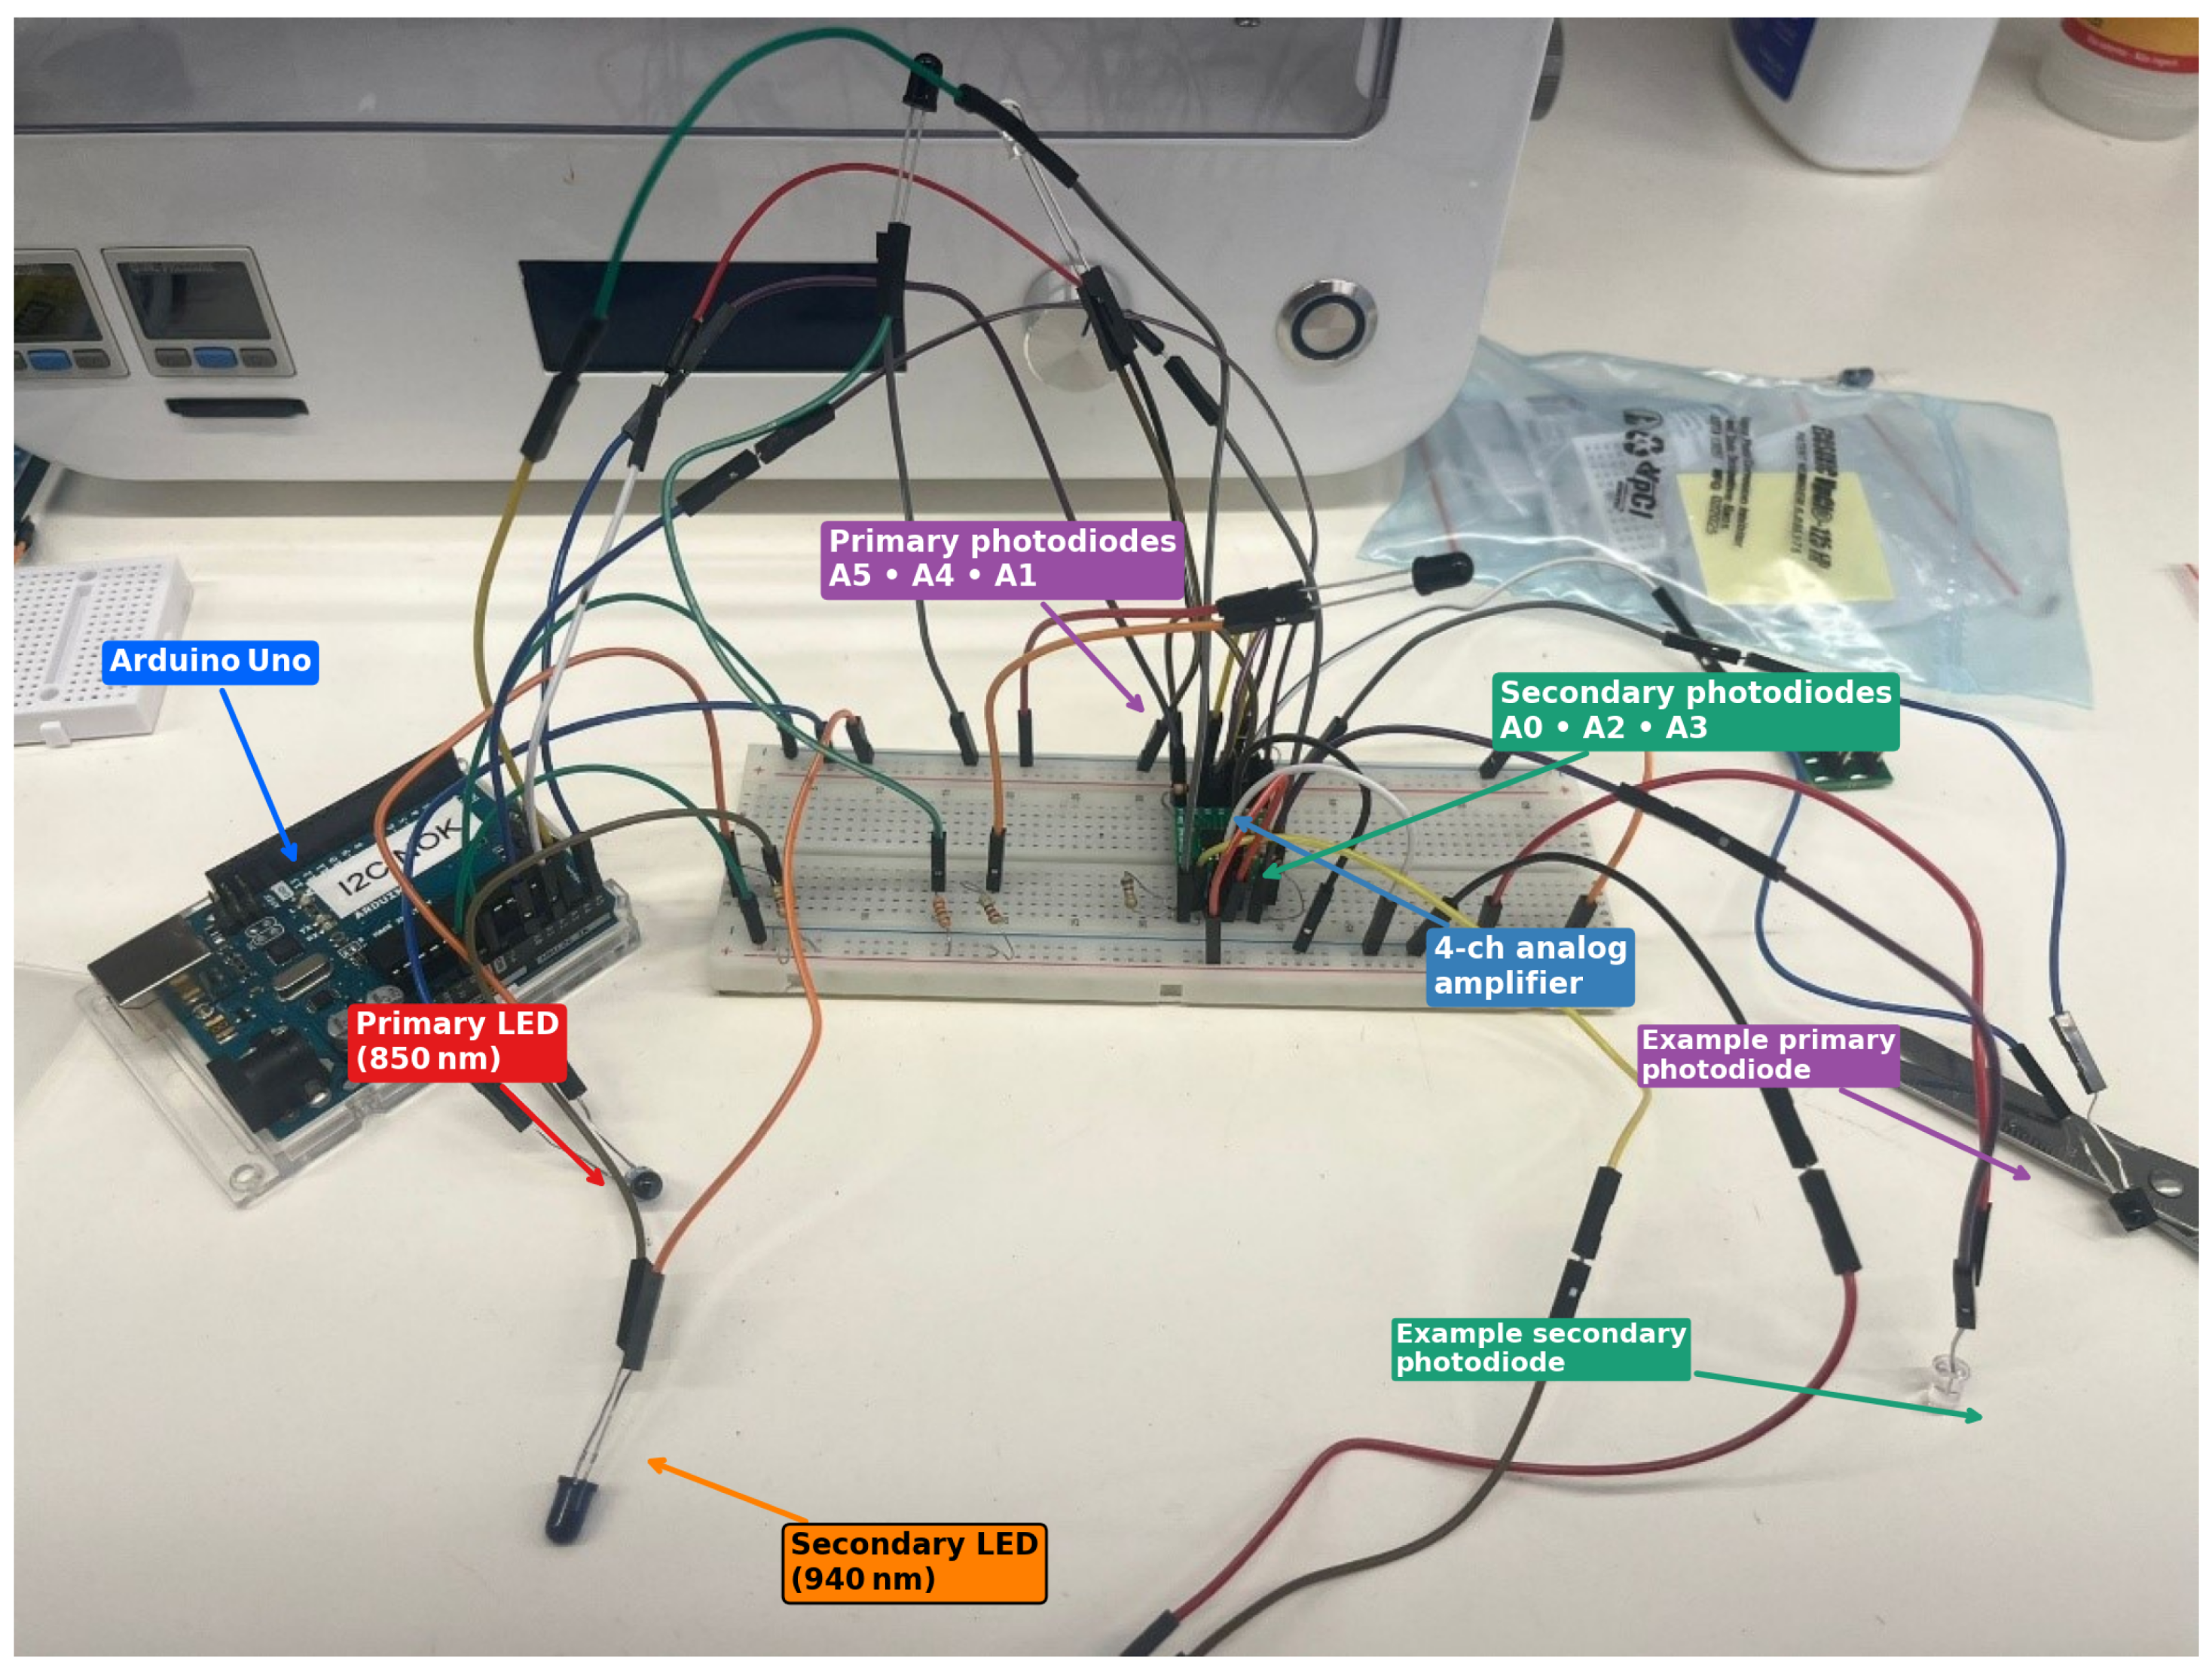
The final breadboard assembly (
Figure 2) contains six infrared emitters and six photodiodes wired to the Arduino’s analogue inputs A0–A5.
Primary LEDs (850 nm) and primary photodiodes (A5, A4, A1) define one spectral channel.
Secondary LEDs (940 nm) and secondary photodiodes (A0, A2, A3) define a complementary channel; scattering decreases with wavelength (favouring deeper reach) while water absorption rises toward ∼970 nm, so the pair provides useful spectral contrast within the NIR window.
Photodiode currents are converted to voltage by TLV333 zero-drift op-amps in transimpedance configuration (one per photodiode) before digitisation.
All wiring is colour-coded (
Figure 2) so that each sensor can be traced back to its corresponding data channel in the plots presented in
Section 3. This explicit mapping enabled direct comparison between optical signals and volume labels during model training.
2.3. Optical Response During Filling
Figure 3 depicts the
matrix of emitters and detectors. Each row corresponds to an incremental water height of approximately 12 mm. As the liquid column rises (blue overlay and arrow) the optical path between each LED/photodiode pair changes in a predictable, layer-by-layer fashion:
Stage 0—empty (air).
All sixteen channels register their baseline (highest) intensity because the optical path is almost loss-free.
Stage 1—first row submerged.
Only the bottom emitters and detectors are covered.
Stage 2—two rows submerged.
The middle--lower row now sits at the air–water interface.
Stage 3—three rows submerged.
Only the top row remains in air; the gradient compresses as attenuation grows non-linearly with depth.
Stage 4—fully submerged.
All channels plateau at their minimum.
Figure 3.
Emitter—detector matrix and expected water-level progression. Red = primary LEDs; orange = secondary LEDs; purple = square primary photodiodes; blue = secondary photodiodes. Dashed lines mark the four discrete height thresholds used for calibration.
Figure 3.
Emitter—detector matrix and expected water-level progression. Red = primary LEDs; orange = secondary LEDs; purple = square primary photodiodes; blue = secondary photodiodes. Dashed lines mark the four discrete height thresholds used for calibration.
Channel map: A0, A1, A2, A3, A4, and A5 (total 6). Primary receivers: A5, A4, and A1. Secondary receivers: A0, A2, and A3.
2.4. Experimental Setup
To validate the prototype, tests were performed under controlled conditions, meaning that all in vitro trials were performed in a laboratory at 22 ± 1 °C and typical relative humidity of 45–60%. Two lighting regimes were used: “dark” (<2 lux; lights off, blackout curtains) and “light” (300–600 lux ambient). The sensor face was kept in full contact with the phantom/container (no gaps), and the belt tension was kept constant by using the same notch across steps. These controls isolate optical effects (absorption/scattering) from confounding factors such as stray NIR, placement drift, and temperature-dependent electronics. In vivo variability (e.g., tissue thickness, perfusion, hydration) is greater than in these phantoms; the aim in this study is to demonstrate feasibility and to characterise domain shifts that can inform per-user calibration in future clinical applications.
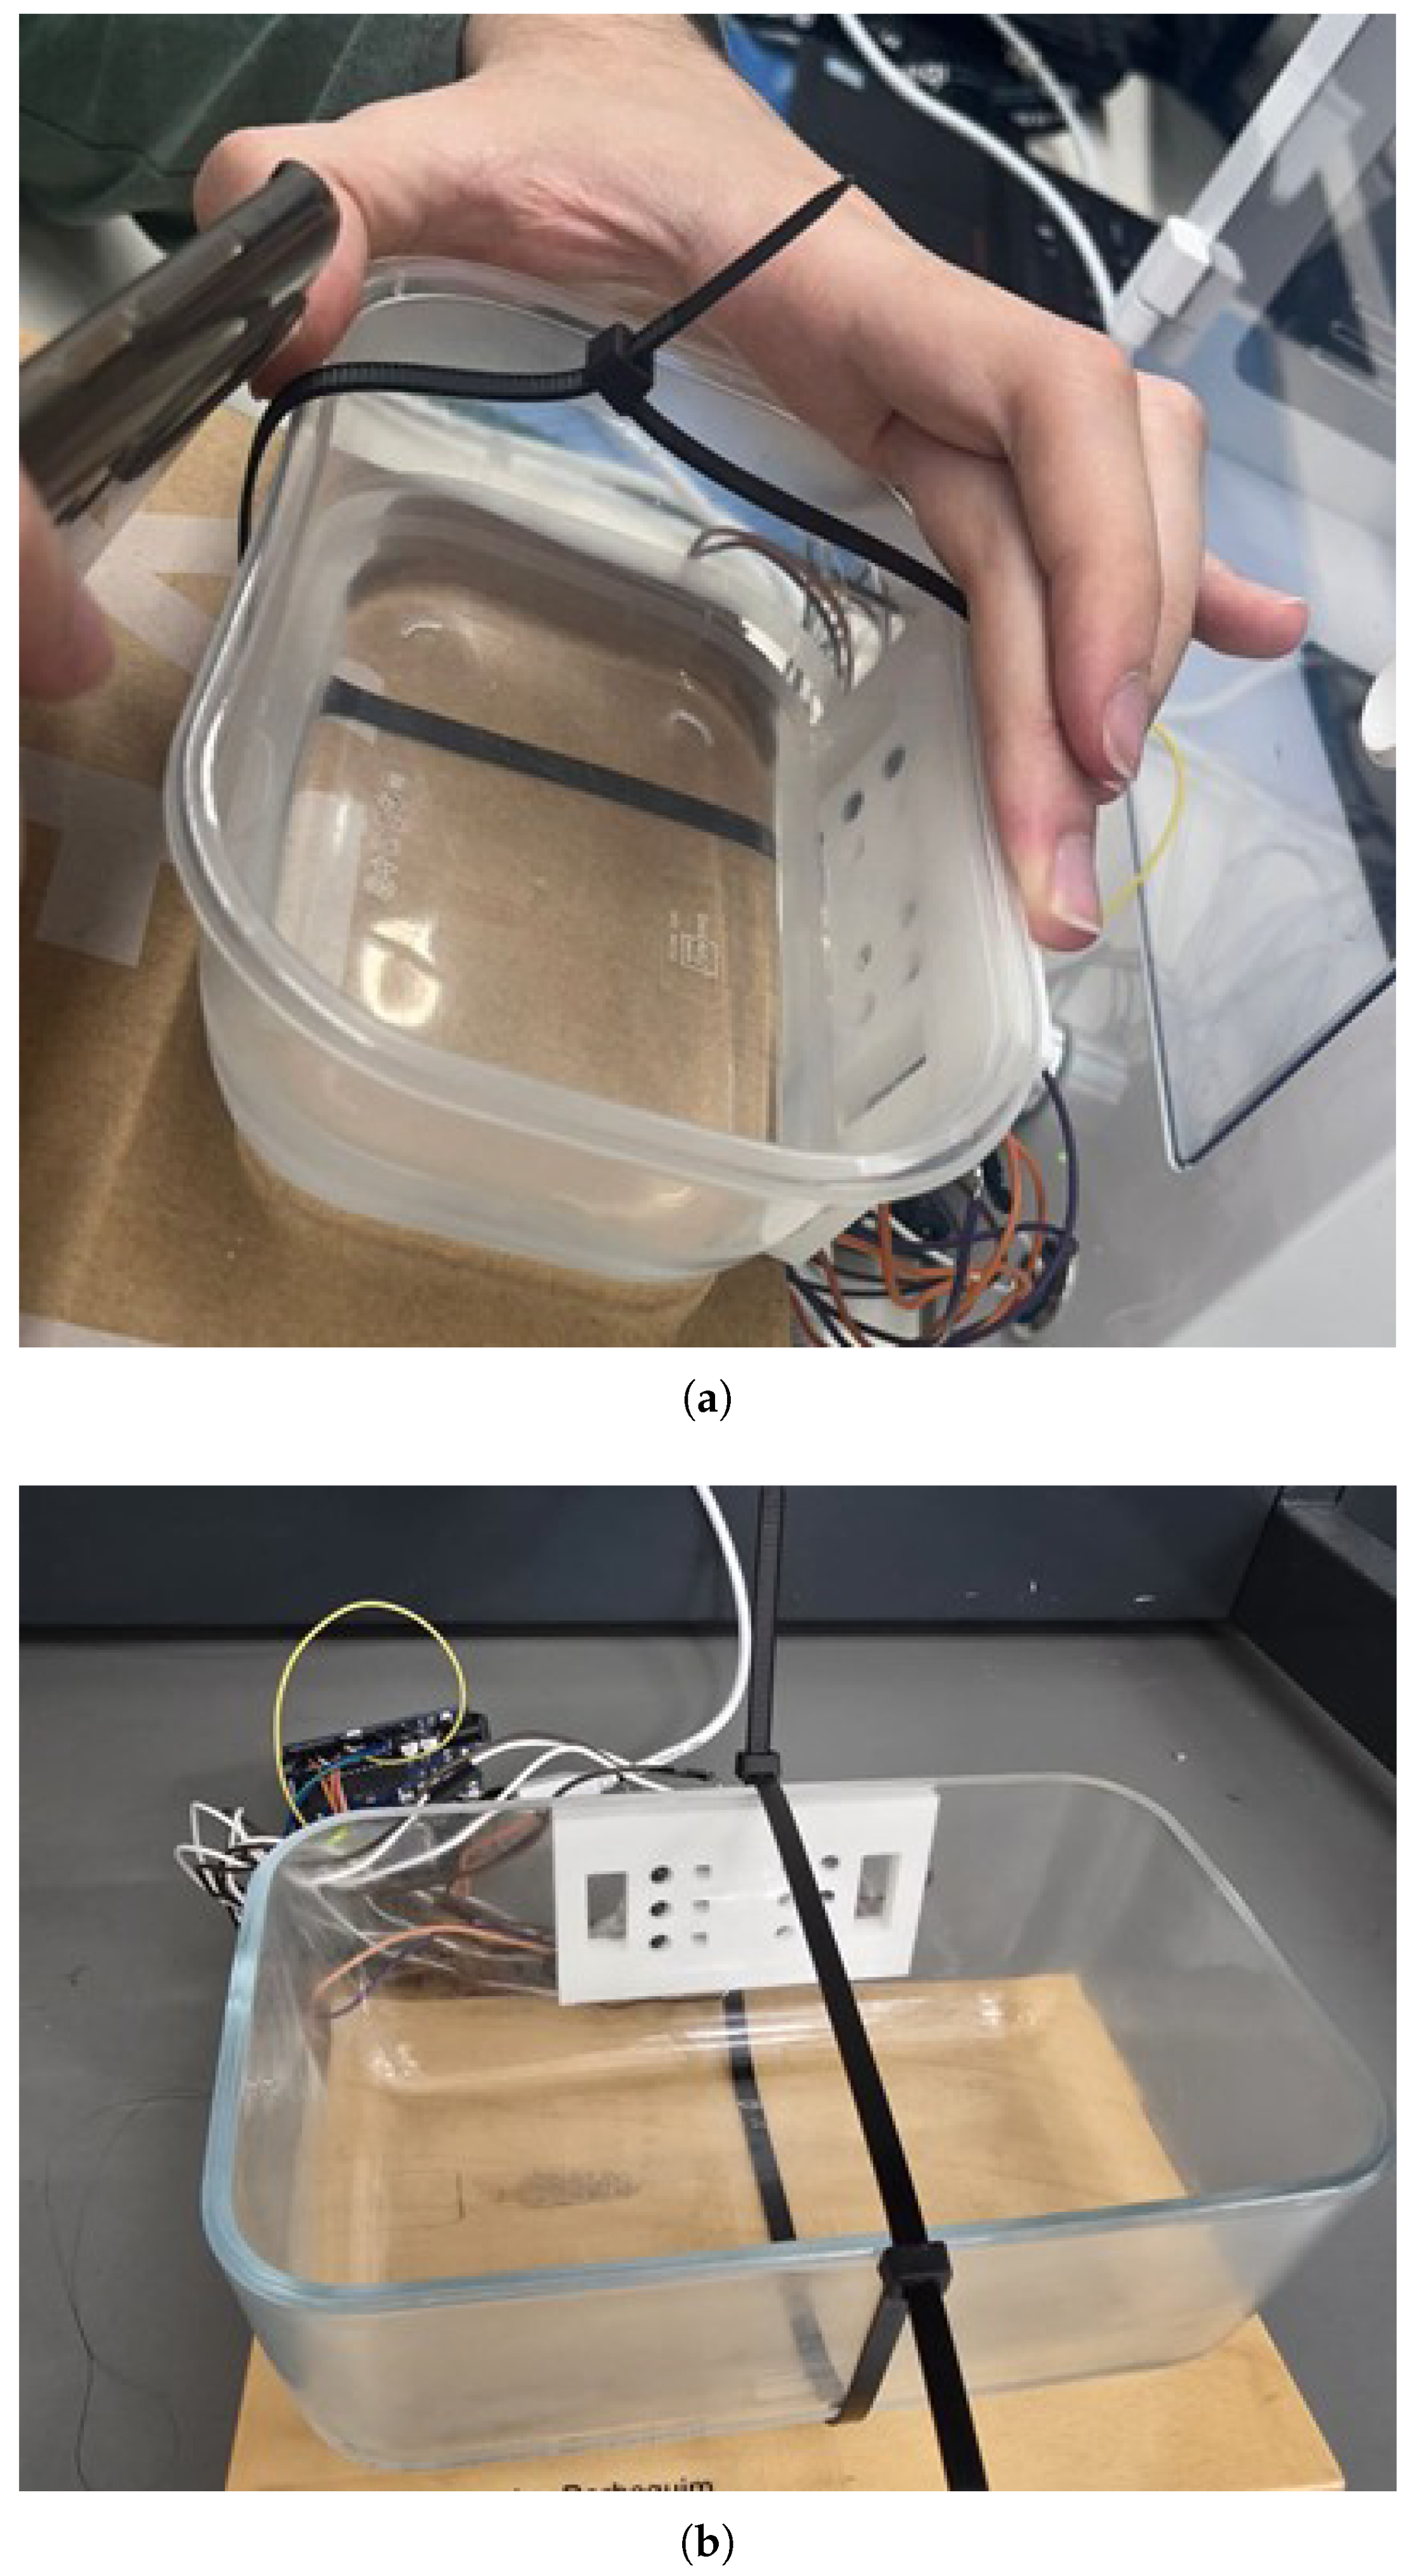
Bladder filling was simulated by incrementally adding water (in 50 mL to 200 mL intervals) to plastic and glass containers (
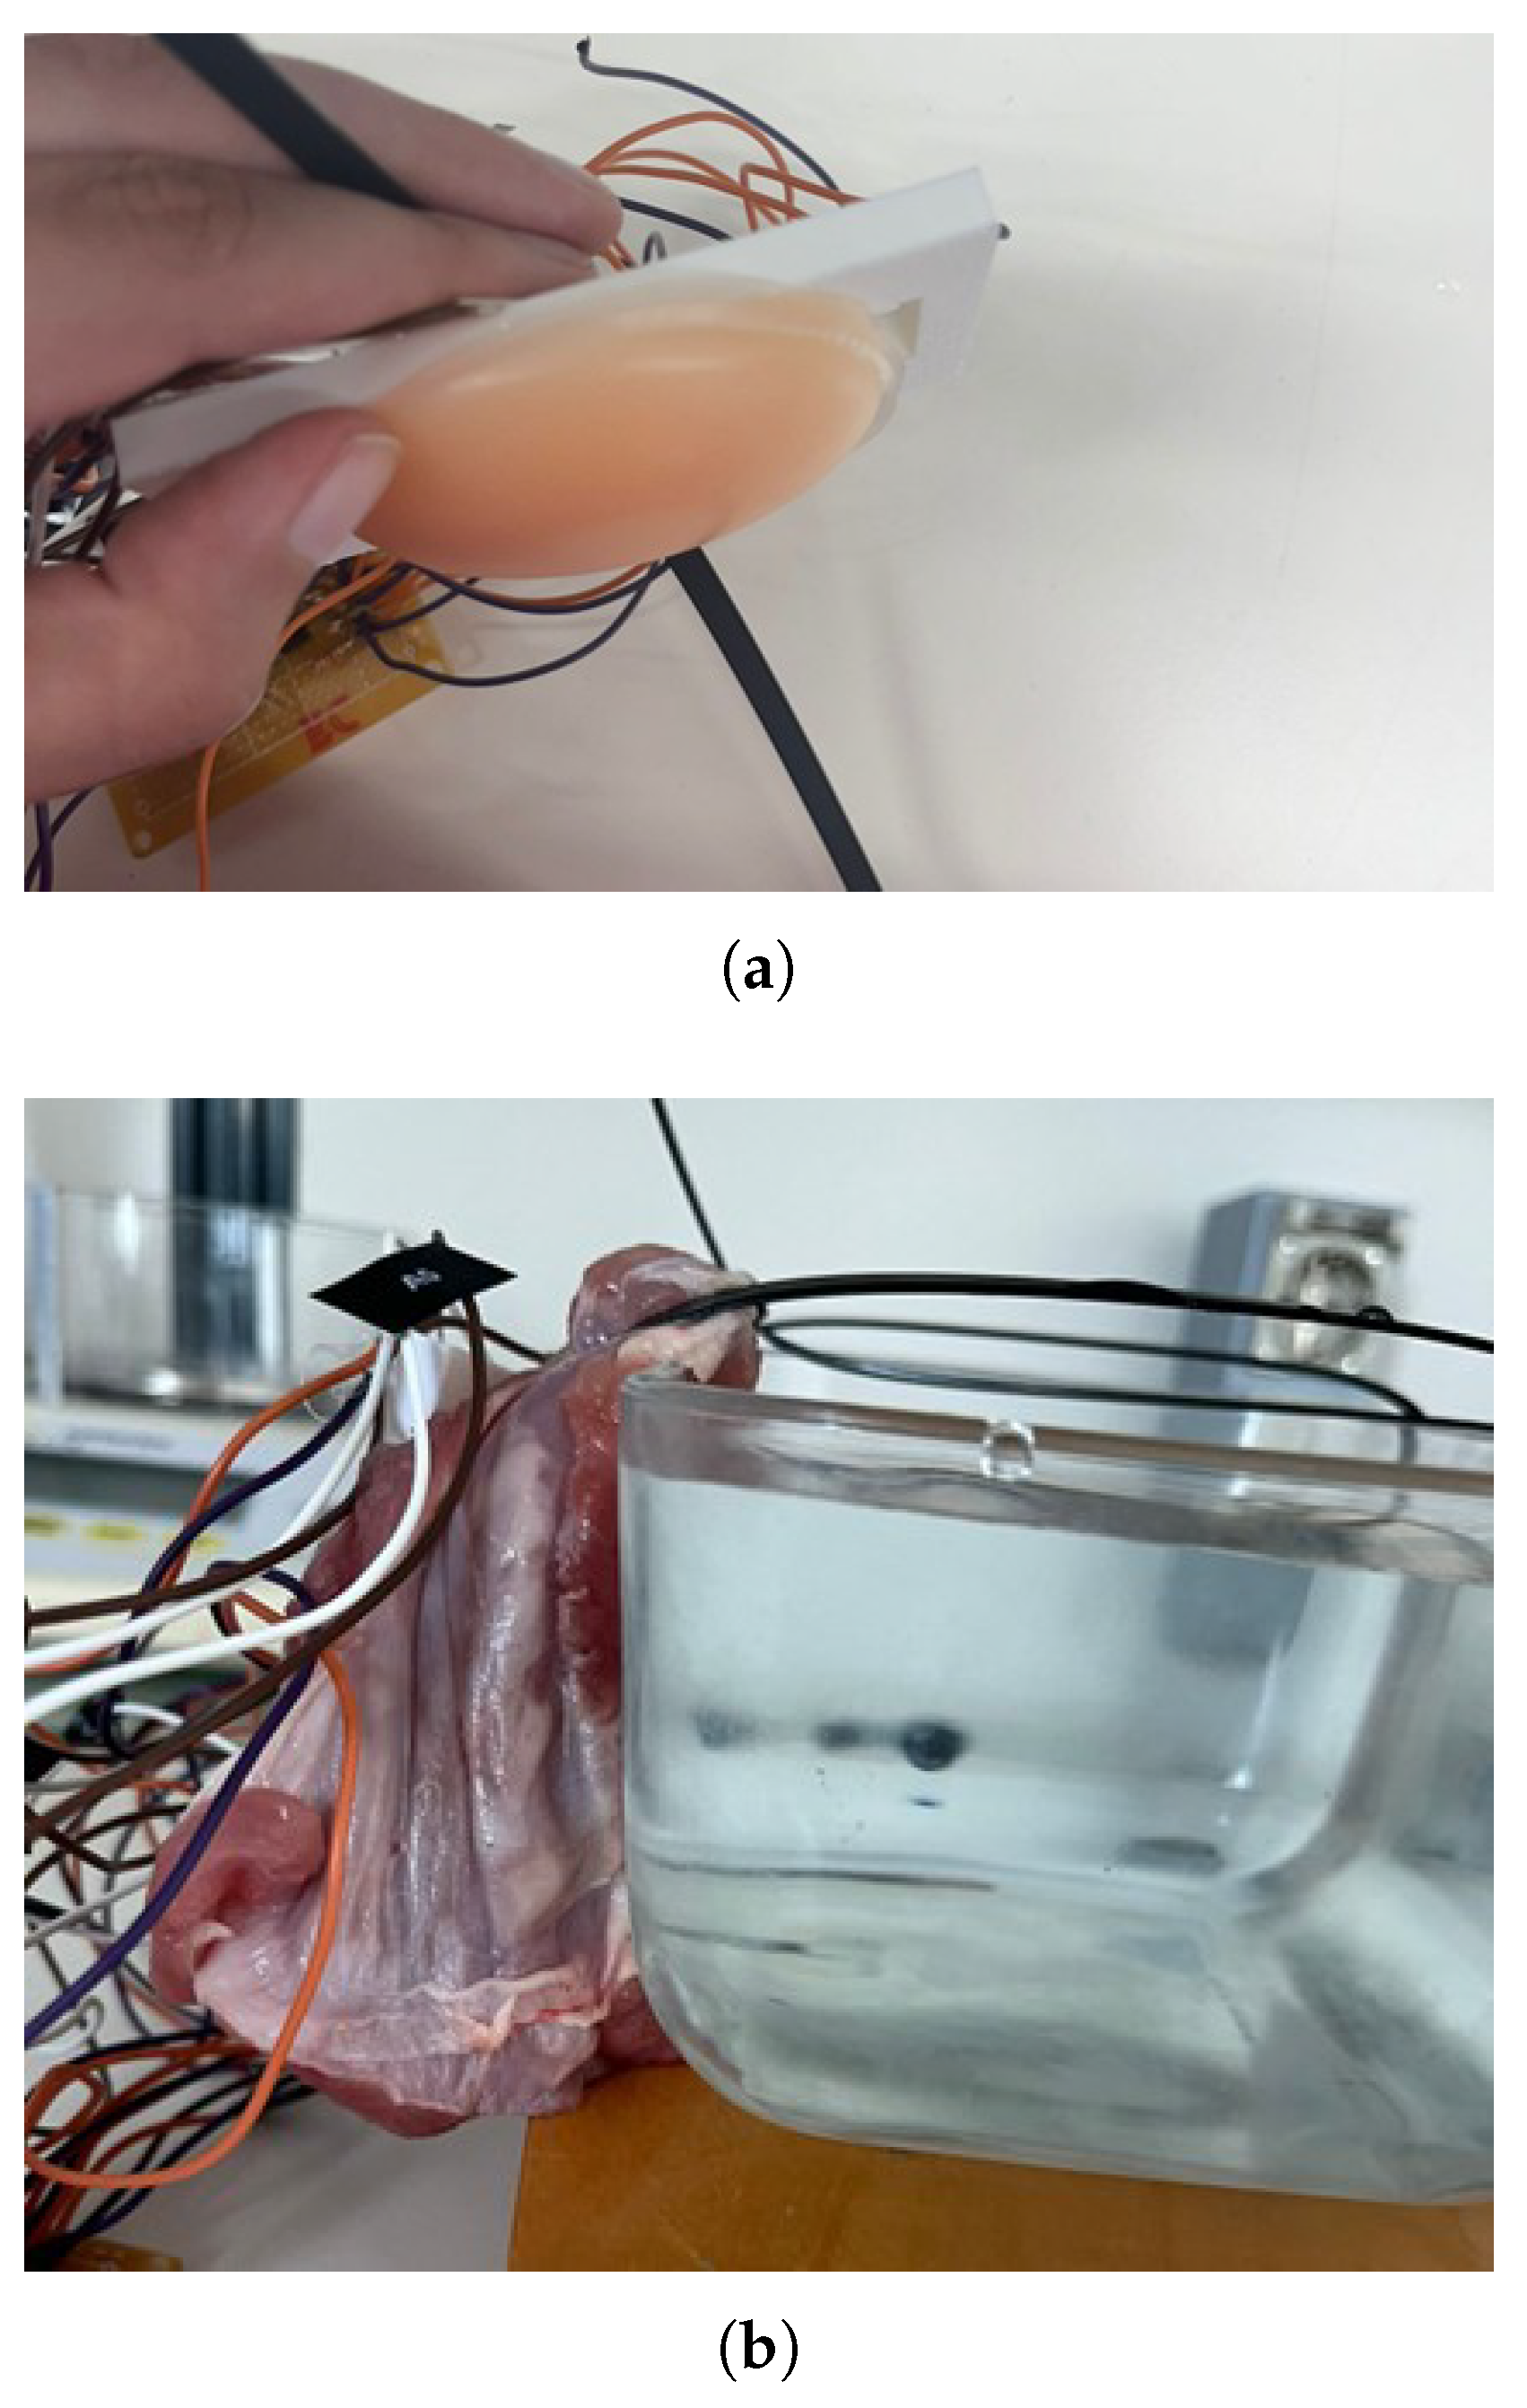
Figure 4). To mimic the attenuation of near-infrared light by biological tissues, different materials were placed between the sensor and the container. A 1 cm thick silicone layer was used to simulate a homogeneous tissue structure (
Figure 5a). In addition, a 2 cm thick piece of raw pork belly was employed to replicate the complexity and stratification of human abdominal tissues, including skin, subcutaneous fat, and muscle (
Figure 5b). This thickness was selected based on anatomical data indicating that, for individuals with a normal Body Mass Index (BMI 18.5–24.9), the average distance from the skin surface to the interior of the bladder is approximately 2.4 cm in both men and women [
12,
13]. Tests were conducted in a dark environment to eliminate interference from ambient light. Data were acquired continuously via the Arduino IDE’s serial monitor. In the 850–940 nm range, water is the dominant absorber and was therefore selected as the fill liquid. Urine chromophores that impart colour absorb mainly in the visible band, while turbidity (e.g., cells) may nonetheless increase scattering. A follow-up bench test with a urine simulant (saline + urea) and low-concentration dye is planned to quantify any residual effects.
Raw ADC readings were transformed point-wise as with and . To level channel magnitudes, a post-gain of 1.0 was applied to primary photodiodes (A5, A4, A1) and 0.5 to secondary photodiodes (A0, A2, A3), matching the acquisition sketch used for data collection.
A staged NIRS validation was implemented: (i) containers (plastic/glass) to isolate interface and refractive-index effects; (ii) homogeneous silicone (1 cm) to approximate a simple attenuating slab; and (iii) layered pork belly (∼2 cm) to introduce realistic heterogeneity. This progression is consistent with biomedical optics phantom practice and reduces risk for subsequent in vitro studies by quantifying domain shifts at each step [
14].
2.5. Acquisition Protocol, Sampling, and Reproducibility
At each volume point, signals from all 6 analogue inputs (A0–A5) were sampled with a fixed inter-sample delay of 10 ms, yielding an effective sampling frequency of 100 Hz per channel. For each channel, 500 consecutive samples were collected, resulting in a 5 s acquisition window per volume point. The arithmetic mean of these 500 samples (serial output at 9600 bps) was used for subsequent modelling. This protocol was applied consistently across all container and phantom conditions described in
Section 2.4. Total ADC throughput (≈600 samples/s across six channels) remained below the ADS1115’s 860 samples/s limit.
For each condition (container and/or phantom), the acquisition protocol was performed once, with careful device repositioning between volume steps (NREPS = 1). The number of discrete volume points per condition was: plastic (dark), 9; glass (dark), 7; silicone (1 cm, plastic), 9; pork belly (2 cm, glass), 7; pork belly (2 cm, plastic), 9; baseline light and baseline dark sets, 3 each. At each volume point, the mean of 500 consecutive samples per channel was stored, yielding one value per channel per volume.
Table 2 provides a complete acquisition summary, indicating the number of volume points and per-channel raw reads for each condition.
2.6. Modelling Pipeline and Hyperparameters
Channel means (A0–A5) were standardised using only the training-set mean () and standard deviation (). The primary feature set consisted of the six standardised channel means. In a sensitivity analysis, engineered features, such as pairwise ratios between primary/secondary channels and first differences across volume steps, were evaluated, but they did not materially improve performance, so the simpler feature set was retained.
The models tested included Linear Regression, Support Vector Regression (SVR) with a radial basis function (RBF) kernel, and Random Forest Regressor (RF). SVR was intended to capture non-linear relationships while tolerating noise and outliers, whereas RF, as an ensemble of decision trees, offered robustness to non-linear patterns and reduced overfitting. Hyperparameters were optimised via grid search combined with five-fold cross-validation, stratified by phantom type, container, and volume step, using a random seed of 42. The SVR grid explored , , and , while RF grid tested , , and .
Data were split at the window level into 70/15/15 for train/validation/test sets, stratified as above, with no subject data included. To assess domain shift, models were trained on non-tissue scenarios and tested on held-out tissue scenarios only. Final models were refit on the combined training and validation sets and evaluated on the held-out test set. Model performance was quantified using the Mean Absolute Error (MAE) and Coefficient of Determination (), reported as the mean ± standard deviation across cross-validation folds and for the independent test set.
2.7. Agreement Analysis and Error Metrics
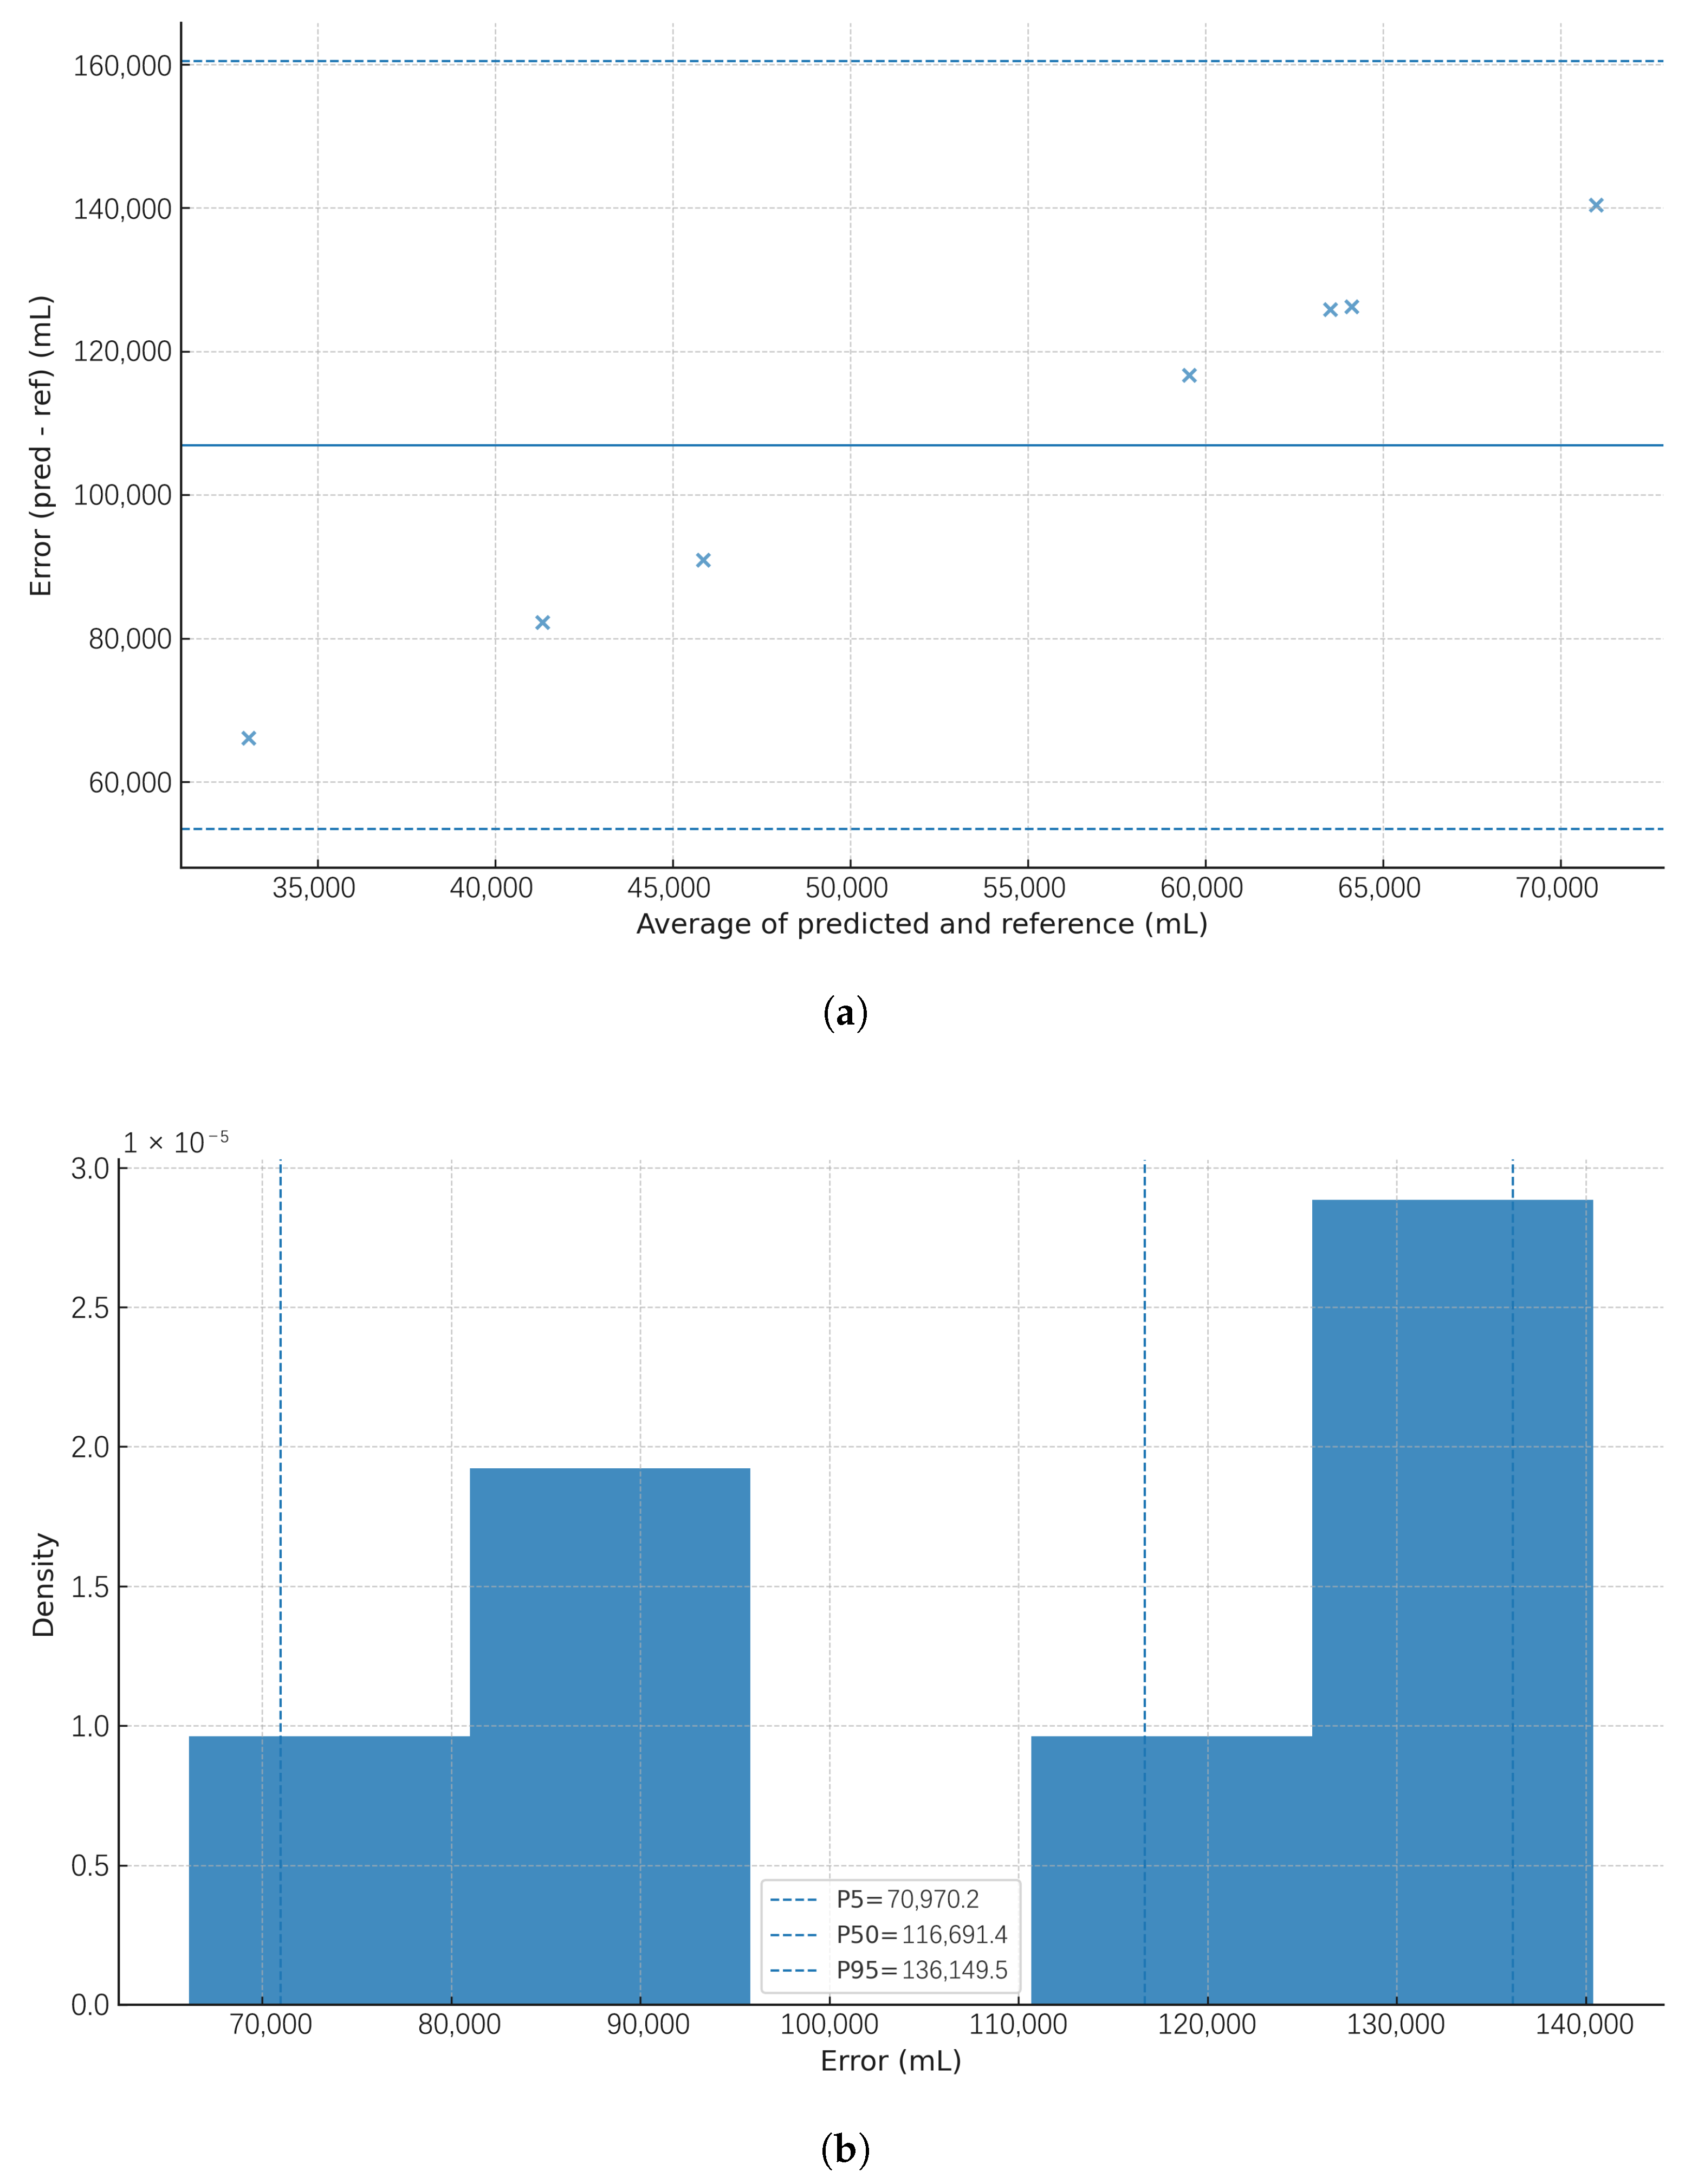
Agreement between predicted and reference bladder volumes was visualised using two approaches: (i) Bland–Altman plots, with the error defined as , plotted against the average , showing the mean bias (solid line) and 95% limits of agreement (LoA; dashed lines), and (ii) empirical error distributions (histograms) with P5, P50, and P95 markers.
For the agreement figures in
Section 3.4, prediction pairs
were generated using a transparent baseline pipeline: channel signals (A0–A5) were standardised using training-set statistics and a multivariate least-squares model was trained on non-tissue conditions (dark/light baselines, plastic, glass, and silicone). Predictions were then generated on held-out tissue scenarios (plastic + pork belly and glass + pork belly). This approach avoids data leakage across scenarios and ensures that figure generation is fully reproducible from the recorded sensor tables. These agreement visualisations illustrate scenario-shift effects using the transparent least-squares baseline, while RF performance is summarised in
Table 3.
4. Discussion
The results demonstrate the feasibility and potential of the SafeBladder concept. The “under clothing” recommendation arises directly from the light versus dark comparison (
Figure 6), as garments form a low-lux cavity over the sensor, suppressing stray NIR and stabilising the DC baseline. The system’s sensitivity to ambient light confirms that its optimal operation is achieved when worn under clothing, creating a darkened environment that significantly enhances measurement accuracy. This aligns with known challenges in NIRS, where ambient light—including NIR content from sunlight and indoor sources—can degrade signal quality [
15]. Tests performed in both lighted and dark environments elucidated the significant impact of external light interference on signal quality. Under dark conditions, especially for the main sensors A4 and A5, signals were higher, more consistent, and followed a linear, predictable decrease with increasing water volume. This linear relationship was particularly evident within the 0–400 mL range, where signal intensity varied proportionally with filling. Conversely, ambient light exposure drastically reduced signal amplitude and increased noise and dispersion, thus compromising volume detection reliability. This phenomenon results from optical interference, as ambient visible light disrupts the path of emitted infrared beams, diminishing the radiation received by photodiodes [
6,
15]. The system’s wearable design inherently mitigates this limitation, as its placement beneath clothing provides a naturally low-light environment that ensures optimal performance without additional hardware. In the literature, alternative strategies have been proposed to actively address ambient light interference [
7]. For example, Park et al. (2025) [
8] developed a wearable system that dynamically compensates for external illumination using photovoltaic, photoluminescent, and photometric modules, while Ray et al. (2025) [
9] demonstrated how ambient light sensors can be fused with inertial signals to enhance robustness in real-world scenarios. Similarly, Mahato et al. (2024) [
10] reviewed hybrid multimodal wearable platforms that integrate diverse biosignals for comprehensive health monitoring. In contrast to these approaches, the dark-environment placement naturally shields the sensors, simplifying the sensing pathway while maintaining consistent signal quality.
Comparative tests using plastic and glass containers in dark conditions revealed a distinct difference in signal amplitude and consistency. Plastic containers produced higher and more reliable readings, with steeper slopes in the sensor response curves, while glass containers resulted in lower-intensity signals, especially in main sensors. These differences can be attributed to the optical properties of the materials: glass, having a higher refractive index, induces internal reflections and disperses infrared signals, thereby reducing the effective signal strength reaching the sensors [
16]. Moreover, variations in thickness and transparency further affect light transmission through the container walls. These findings underscore the critical importance of material selection in device and container design. Materials with minimal optical interference, such as specific translucent plastics, enhance signal transmission and reception, significantly improving system sensitivity. The data confirms that even subtle differences in material properties can markedly influence device performance.
Experiments employing a 1 cm silicone layer to simulate human skin demonstrated the system’s capacity to maintain sensitive, coherent responses to volume changes, despite signal attenuation caused by silicone’s absorptive properties. The generated sensor response curves remained well-defined and proportional to volume changes. This agrees with prior research on tissue phantoms used in NIRS validation, which emphasise the importance of optical properties and tissue-mimicking materials in system calibration and testing [
17].
Testing with pork belly tissue—approximately 2 cm thick and compositionally more complex—posed a more realistic challenge. Despite this, clear signal variations were observed, especially in sensors A2 and A3, which maintained high absolute values and consistent trends up to 800 mL. Interestingly, some tests exhibited atypical responses, where signals increased with volume rather than decreased. This counterintuitive behaviour likely stems from complex light–tissue interactions. Multilayered biological tissues possess heterogeneous absorption and scattering coefficients, and increasing fluid volume may enhance internal reflection toward the receiver [
6,
17]. Furthermore, changes in the refractive index at the interface between tissue and liquid can alter optical paths, boosting detected signals. Variations in sensor positioning and tissue thickness may also contribute to more favourable light paths for signal reception. Although unexpected, this phenomenon highlights the intricacies of optical interactions in biological tissues and emphasises the necessity for further testing with real tissues or advanced anatomical simulators.
The robustness of the device’s response in the presence of biological tissue strongly supports its applicability in clinical scenarios. Additionally, modifications to the original prototype—specifically, the angular adjustment of LEDs and photodiodes—were instrumental in improving light interception. This sensor inclination increased the capture of reflected beams, resulting in smoother sensor response curves and more stable values across volume variations.
The system’s demonstrated sensitivity through biological tissue validates the concept of a non-invasive, wearable bladder monitoring device. It operates effectively without direct bladder contact or invasive procedures, offering a promising tool for clinical use. The application of machine learning techniques, particularly the superior performance of the Random Forest model in capturing complex, nonlinear relationships between NIRS signals and bladder volume, further enhances the system’s accuracy and robustness [
18]. This type of model is particularly effective at capturing intricate interactions between variables and is more robust to noise than simple linear models.
Bland–Altman plots for the tissue scenarios (
Figure 9 and
Figure 10) illustrate the error structure under realistic, multilayer optical paths. They highlight the expected domain shift from non-tissue to tissue conditions, reinforcing the need for per-user calibration, improved optical coupling, and model training that explicitly includes tissue data. These agreement views complement the phantom-stage accuracy reported earlier by revealing bias and dispersion across the working range, as recommended for volumetric monitoring tools.
The main limitations of this study were the use of phantoms instead of human participants in the model training phase and the controlled laboratory conditions. Inter-individual anatomical variability (e.g., thickness of the adipose tissue layer) will be a challenge to address in future iterations, as this is essential for clinical translation. Since only one run per condition was performed (NREPS = 1), future work will incorporate repeated trials with a randomised step order, controlled strap pressure, and small re-positioning jitters to quantify repeatability and robustness.
Prior NIRS studies in urology have largely focused on hemodynamic changes during filling/voiding and on diagnostic classification, with fewer works targeting absolute volume estimation. A notable exception is Molavi et al., who demonstrated the use of wireless suprapubic NIRS to track bladder filling to capacity [
19]. Recent reviews also summarise wearable bladder-volume sensing devices, highlighting optical/NIRS as promising yet sensitive to coupling and ambient light [
20]. SafeBladder differs by combining a low-cost, angled dual-wavelength (850/940 nm) array with supervised ensemble modelling, yielding phantom-stage MAE ≈ 25 mL and
, and by explicitly quantifying ambient-light and container-material effects.
5. Conclusions and Future Work
This work demonstrated a proof-of-concept for SafeBladder, a wearable near-infrared spectroscopy device designed for non-invasive bladder volume monitoring. Under controlled laboratory conditions, the system reliably detected volume changes, and the application of machine learning algorithms, particularly Random Forest, enabled accurate volume estimation with promising phantom-stage results (MAE∼25 mL; ). These findings establish the feasibility of continuous, non-invasive monitoring and lay the groundwork for future clinical translation. Several engineering challenges remain to be addressed before deployment, including optimising power consumption through duty-cycling strategies and low-power modes, balancing wireless transmission trade-offs between BLE and Wi-Fi, ensuring real-time performance with efficient on-device feature extraction and inference, and improving ergonomics to guarantee robust skin–sensor coupling, belt comfort, and consistent placement. Addressing these factors will be critical for reliable operation in everyday environments. Looking ahead, SafeBladder holds significant potential for improving the autonomy and quality of life of patients with neurogenic bladder, while also having broader applications, such as monitoring urinary incontinence in the elderly, supporting postoperative recovery, guiding inpatient diuretic management, and enabling paediatric follow-up in conditions like spina bifida or cerebral palsy. The next phase of development will focus on ergonomic redesign, user-specific calibration, multi-centre clinical validation, and integration with the mobile application to provide real-time feedback to users and caregivers.

