Article

Importance Measure Analysis of Output Performance of Multi-State Flexoelectric Structures Based on Variance

1
School of Mechanics and Transportation Engineering, Northwestern Polytechnical University, Xi’an 710129, China
2
School of Civil Engineering and Architecture, Xi’an University of Technology, Xi’an 710048, China
*
Author to whom correspondence should be addressed.
Electronics 2025, 14(17), 3481; https://doi.org/10.3390/electronics14173481
Submission received: 19 June 2025 / Revised: 3 August 2025 / Accepted: 23 August 2025 / Published: 31 August 2025

Abstract

In recent years, the flexoelectric effect has demonstrated significant potential for applications in sensing, actuation, energy acquisition and other related fields. As the primary structure of flexural output, the flexoelectric beam structure also exhibits substantial potential for development and application. However, flexoelectric output is unable to function effectively at the macroscale, and the impact of the uncertainty of the parameters of flexoelectric material on the flexural output remains unclear. To address the issue of parameter uncertainty, this paper employs the analysis method based on variance-driven coupled with moment-free measure to study the impact caused by structural parameters on the uncertainty of the output voltage of the flexural electron beam in the case of an open circuit, the influence on the output charge uncertainty under short-circuit conditions, and the influence on the effective piezoelectric coefficient uncertainty. This study of parameter uncertainty offers a valuable reference for the reliability assessment and structural optimization design of flexural electric beam and provides theoretical support for the macroscale application of the flexoelectric effect.

1. Introduction

Multifield coupling effects are ubiquitous in nature. The electromechanical coupling effect is one of the classical multifield coupling effects, which refers to the conversion between mechanical energy and electrical energy. It constitutes a critical module in modern high-performance electronic circuits and micro-electromechanical systems, encompassing the piezoelectric effect [1], electrorheological effect [2] and electrostrictive effect [3]. Among these, the piezoelectric effect is the most extensively utilized [4]. The piezoelectric effect is the most prevalent type of electromechanical coupling in dielectric materials [5]. Over the past century, materials exhibiting the piezoelectric effect have been extensively utilized [6]; however, the piezoelectric effect is subject to certain limitations [7,8,9]. First, the piezoelectric coefficient is a third-order tensor, which means that the piezoelectric effect is constrained by the symmetry of the material. Firstly, the piezoelectric coefficient represented by the third-order tensor implies that the piezoelectric effect is limited by the symmetry of the material. Secondly, piezoelectric materials typically undergo severe polarization processes. At temperatures higher than the Curie point, their piezoelectric properties may weaken or even vanish, thereby shortening the material’s service life. Consequently, it is challenging to meet operational requirements [10]. Therefore, it is highly significant to explore new materials as substitutes for traditional piezoelectric materials. Materials with flexoelectric effects can overcome the limitations of piezoelectric effects [11,12]. The flexoelectric effect is a dynamic electromechanical coupling phenomenon capable of converting non-uniform deformation within materials into voltage. It finds extensive application in dielectric materials and exhibits superior temperature stability compared with the piezoelectric effect. In the future, it has great potential in electronic transport, crack detection and other fields [13,14]. However, some scholars have found that the longitudinal flexoelectric coefficient of certain materials obviously depends on temperature and structure. Therefore, there is a need to explore more accurate measurement methods for the longitudinal flexoelectric coefficient that are independent of temperature and structure [15,16]. Currently, the application of the flexoelectric effect is far from reaching the maturity of piezoelectric effects, primarily because the signal output intensity of the flexoelectric effect is significantly lower than that of the piezoelectric effect at the macro perspective. Moreover, various uncertainties inevitably exist in the flexoelectric beam. In the application process of practical engineering, any minor change in key parameters will cause great alterations in the output characteristics, for example, the output voltage in an open-circuit state, the output charge in a short-circuit state, and the effective piezoelectric coefficient [17]. Therefore, it is the focus of the current research to explore the key parameters that have an influence on the output performance of the flexoelectric beam and to study the influence of the structural parameters of the flexoelectric beam on the output response under various conditions.
Sensitivity analysis is a method for assessing the changes in response characteristics resulting from variations in design variables or parameters [18,19,20,21], which has been extensively applied in reliability analysis, risk analysis, environmental science engineering and other fields [22,23,24,25]. By investigating the critical parameters, the complexity of the problem can be significantly mitigated during the process of structural optimization and computation, thereby minimizing the computational cost. Sensitivity analysis is mainly divided into two categories: local sensitivity analysis and global sensitivity analysis. Local sensitivity can only reflect the impact of input variable changes on output response at a fixed value and is therefore subject to significant limitations [26]. Global sensitivity analysis, also referred to as importance measure analysis, encompasses methods based on variance, moment independence, and correlation coefficients [27,28,29,30]. It quantifies the combined influence of input parameters on output by changing all parameters at the same time. As a result, this method is more widely applied in practical engineering.
For instance, Professor Li and his team proposed a sensitivity analysis method for flexoelectric materials based on a polynomial chaos expansion (PCE) surrogate model [31]. The fourth-order partial differential equation of flexoelectricity based on non-uniform rational B-spline (NURBS) basis functions was discretized to obtain a deterministic solution (potential). By considering uncertain parameters, the mathematical expression of the flexoelectric material surrogate model was established. However, it has the limitations of only targeting a single electric potential output and relying on local sensitivity analysis, which cannot clearly quantify the dominant role of key parameters (such as thickness in open-circuit voltage and effective piezoelectric coefficient) under different working conditions. This paper innovatively adopts a variance-based global importance measure method, combined with moment independence verification, to systematically analyze the global influence of six types of parameters (flexoelectric coefficients, geometric dimensions, material properties) under three output states: open-circuit voltage, short-circuit charge, and effective piezoelectric coefficient, providing a more comprehensive and robust theoretical support for the reliability optimization and macroscale application of flexoelectric structures.
This paper investigates the importance measure of the parameters of a flexoelectric beam with respect to the output response under polymorphic conditions. Considering the flexure electric coefficient, length, thickness, dielectric coefficient, Young’s modulus and beam width as the basic variables, open-circuit output voltage, short-circuit output charge, and the effective piezoelectric coefficient are defined as the output responses. These three indicators are selected because they correspond to the core concerns regarding the output performance of flexoelectric beams under the three most representative working conditions: “open-circuit voltage, short-circuit charge, and effective piezoelectric coefficient”. At the macroscale, flexoelectric output is weak, and parameter uncertainty is significant. Any perturbation of key parameters will be directly reflected in voltage, charge, or equivalent piezoelectric coefficient. By quantifying the impact of structural parameters on the uncertainty of these three types of output responses, the most direct theoretical basis can be provided for the reliability evaluation, structural optimization, and macro applications of flexoelectric beams. Based on the importance measure analysis theory of variance and the Monte Carlo calculation method, the influence degree of the structural parameters of the flexure electric beam on the output response under polymorphic is studied. Importance ranking is conducted to identify the key parameters affecting each output response. In addition, a moment-independent method was used to analyze the importance measurement of flexoelectric beam parameters, thereby verifying the precision of the variance-based importance measurement analysis results.

2. Output Response Model of Multi-State Flexoelectric Beams

The flexural material under study is ferroelectric ceramic material barium titanate [32], and L, B, and h are used to represent the length, width, and height of the flexible electron beam structure, respectively. The model of a flexoelectric beam is shown in Figure 1. It is assumed that the impact of ultra-thin, fully smeared electrodes on the upper and lower layers of the flexoelectric beam is negligible. When the ratio of beam length to thickness ≥ 10, shear deformation can be neglected, which is consistent with the Euler–Bernoulli beam hypothesis.

2.1. Displacement Description

For the Euler–Bernoulli beam model proposed in this paper, when the beam’s length-to-thickness ratio L/h ≥ 10, it can be considered that the influence of shear deformation is far less than that of bending deformation in slender beams. Therefore, the effect of shear deformation is neglected, and the Euler–Bernoulli beam theory is adopted. Under the assumption of plane section conditions, the transverse displacement along the beam width direction is ignored. The Euler–Bernoulli beam model assumes that the cross-section remains planar and perpendicular to the neutral axis, considering only bending deformation while ignoring transverse shear strain. This significantly simplifies the complexity of the governing equations, making the displacement and strain fields analyzable, which facilitates the derivation of closed solutions for output voltage/charge. The displacement components at each point on the beam are expressed as follows:
u ( x , y , z , t ) = z w 0 x
v ( x , y , z , t ) = 0
w ( x , y , z , t ) = w 0 ( x , y )
where:
u —axial displacement;
v —transverse displacement (along the beam width direction);
w —longitudinal displacement (deflection);
w 0 —neutral layer displacement.
Based on the assumption in this article that the shear deformation of the beam is ignored, the strain and strain gradient at each point on the beam can be expressed as follows:
ε x x = u x = z 2 w 0 x 2
η z x x = ε x x z = 2 w 0 x 2
where:
ε x x —axial positive strain;
η z x x —longitudinal strain gradient.
To simplify the calculation, only the longitudinal strain gradient is calculated while ignoring the axial strain gradient.

2.2. Constitutive Relation

A block material enthalpy equation considering both flexoelectric effect and piezoelectric effect has been established. In order to simplify the analysis process, higher-order strain gradients in the equation are not considered. Because the flexoelectric effect is driven by strain gradients. In bending beams, the longitudinal strain gradient (ηxx) is significantly larger than other components (such as axial gradients) and directly related to curvature w″(x). Retaining all strain gradient components would lead to high-order partial differential equations, making numerical solutions challenging. The simplified constitutive equation retains the core physical processes while reducing the electro-mechanical coupling relationship, resulting in clearer expressions for output voltage/charge. The equation is as follows [33]:
H = 1 2 a k l E k E l + 1 2 a i j k l ε i j ε k l e i j k ε i j E k μ i j k l E k ε i j , l
where:
a —electrostatic constant;
E —electric field vector;
c —elastic constant;
ε —strain tensor;
e —piezoelectric constant;
μ —flexural electric coefficient.
By differentiating the aforementioned enthalpy equations, the constitutive relation of the block material with flexural effect and piezoelectric effect can be derived:
σ i j = H ε i j = c i j k l ε k l e i j k E k
τ i j l = H ε i j , l = μ i j k l E k
D k = H E k = a k l E l + e i j k ε i j + μ i j k l ε i j , l
where:
σ —stress tensor;
τ —higher order stress tensor;
D —electric displacement.
The flexural beam considered in this model is coated with thin electrode surfaces on both the upper and lower surfaces. Based on this, only the electric field along the thickness direction of the beam needs to be considered. The constitutive relation presented in this paper is expressed as follows:
σ x x = c 11 ε x x e 31 E z
τ z x x = μ 31 E z
D z = a 33 E z + e 31 ε x x + μ 31 η z x x
To simplify the description, c 11 is adopted to replace c 1111 and μ 31 is employed to substitute for μ 3311 . For isotropic materials, c 11 = E , that is, the elastic coefficient is same as Young’s modulus.
In Kelvin circuits, Dz = 0 indicates no accumulation of free charges, with the electric field uniquely determined by the strain gradient. In short-circuit circuits, Ez = 0 signifies uniform potential distribution, where the output charge is directly obtained through potential displacement integration. This assumption for ultra-thin electrodes (“fully smeared electrodes”) implies that the electrode thickness approaches zero, eliminating additional impedance or edge effects. Deriving explicit expressions for output voltage and charge directly from this model avoids complex electromagnetic boundary condition solvers.
The boundary state of electrical open circuit is set, that is, the potential shift on the electrode surface is equal to 0, that is, D z = 0 ; so, D z / z = 0 , that is, in the open circuit state; since the potential shift D z in the thickness direction inside the material is equal to 0, the constitutive relationship of the flexural beam model in this paper can be expressed as follows in the open-circuit state:
σ x x = ( c 11 + e 31 2 a 33 ) ε x x + e 31 μ 31 a 33 η z x x
τ z x x = e 31 μ 31 a 33 ε x x + μ 31 2 a 33 η z x x
E z = e 31 a 33 ε x x μ 31 a 33 η z x x
As regards, boundary conditions for short-circuit circuits, the electric potential φ in the direction of thickness is the same everywhere; so, the electric field E z in the thickness direction is 0 as derived from E z = φ / z . Therefore, under the short-circuit condition, the constitutive relation of the flexure electric beam model presented in this paper is expressed as follows:
σ x x = c 11 ε x x
D z = e 31 ε x x + μ 31 η z x x

2.3. Apply Load

The displacement expression of the Euler–Bernoulli beam end under concentrated load is as follows:
w q u a s i ( x ) = F ( x 3 L ) x 2 6 E I
When x = L , the maximum displacement w max q u a s i = F L 3 3 E I can be obtained under quasi-static conditions. In order to ensure that the material remains in an elastic deformation state under varying thicknesses, w max q u a s i = 1 20 h is adopted. Therefore, the load applied under the quasi-static state can be expressed as follows:
F = 3 E I h 20 L 3 = E b h 4 80 L 3
According to Formulas (18), (19), (33) and (34), the strain gradient and corresponding strain on quasi-static upper-surface down-flexure electric beam can be determined as follows:
ε x x = h 2 w ( x ) = 3 h 2 ( x L ) 40 L 3 η z x x = w ( x ) = 3 h ( x L ) 20 L 3

2.4. The Output of Electrical Signals in Various Electrical Conditions

Under open-circuit conditions, the electric field constitutive relationship in Equation (15) is satisfied as follows:
E z = e 31 a 33 ε x x μ 31 a 33 η z x x = e 31 a 33 h 2 w ( x ) μ 31 a 33 w ( x )
The average electric field intensity on the electrode surface can be expressed as follows:
E ¯ z ( x ) = 1 a 33 S e S e e 31 h 2 w ( x ) + μ 31 w ( x ) d S
Among them, e 31 h 2 w ( x ) refers to terms related to the piezoelectric effect, which is an odd function of the thickness variable h. Therefore, if the flexural structure discussed in this paper is analyzed under an electrical open-circuit condition, the flexural signal will solely contribute to the output voltage on the upper and lower surfaces of the beam. Therefore, the output voltage on the upper and lower surfaces of the beam can be represented by the flexural electrical signal as follows:
φ q u a s i = h 2 h 2 E ¯ z d z = μ 31 a 33 S e / B h 0 L h ( 3 x 3 L ) 20 L 3 d x
That is, the representation for the output voltage of the flexural beam under open-circuit conditions is given as follows [12]:
φ q u a s i = 3 μ 31 40 a 33 β 2 = 3 μ 31 h 2 40 a 33 L 2
where β represents the ratio of length–thickness, i.e., L / h ; S e is defined as electrode area, i.e., L B ; L and h are the length and thickness of the beam, respectively; B is the width of the beam; μ 31 is the flexural coefficient; and a 33 is the dielectric coefficient.
For the short-circuit condition, the potential shift follows the constitutive relation shown in Equation (17). Therefore, the upper and lower surfaces of the beam have the following expression:
D h 2 = e 31 h 2 w ( x ) μ 31 w ( x ) D h 2 = e 31 h 2 w ( x ) μ 31 w ( x )
According to Gauss’s law, when a dielectric is present, for any closed surface S in space, the following relation holds:
S D d S = Q 0
where Q 0 is the total charge carried by the closed surface S.
Thus, the total output charge in the circuit under the short-circuit condition is given by:
Q q u a s i = Q 0 2 = μ 31 B 0 L h ( 6 x 6 L ) 40 L 3 d x
That is, the expression for the output charge of the flexure electric beam under the short-circuit condition is given by [12]:
Q q u a s i = 3 μ 31 B 40 β = 3 μ 31 B h 40 L
To achieve the quantitative characterization of flexural materials at the microscale, the effective piezoelectric coefficient is introduced in this paper to quantitatively describe the flexural effect of microstructures under the condition of an electrical short circuit [12]. The effective piezoelectric coefficient ( d 33 e f f = Q F = 6 μ 31 L 2 E h 3 ) defined in this paper is consistent with the theoretical benchmark of the flexoelectric effect: this expression quantifies the equivalent piezoelectric performance through the ratio of charge output Q to mechanical load F, which is in line with the core mechanism of strain gradient (bending deformation)-induced polarization in flexoelectric theory; its scale dependence ( d 33 e f f L 2 / h 3 ) also aligns with the characteristic of significant enhancement in the flexoelectric effect at the micro-nano scale, and the correlation of key parameters conforms to the framework of flexoelectric theory, verifying the rationality of this definition as an equivalent piezoelectric characterization of microstructures:
d 33 e f f = Q F = 3 μ 31 B 40 β 80 L 3 E B h 4 = 6 μ 31 β 2 E h = 6 μ 31 L 2 E h 3
In the above equation, E represents Young’s modulus. As can be observed from the aforementioned equation, when the aspect ratio of the component remains constant, the thickness is inversely proportional to the effective piezoelectric coefficient.

3. The Importance Measure Analysis Theory Based on Variance

Sensitivity analysis is a mathematical method used to measure the impact of uncertainty in input variables or distribution parameters on the output performance of a model [34]. That is categorized into local and global sensitivity analysis. Since global sensitivity can analyze the effect of entire distribution range of output variables on the output performance, this paper employs global sensitivity analysis to explore and study the parameters of the flexure electric beam. Global sensitivity analysis is also referred to as importance measurement. Currently, the most prevalent importance measures are those based on variance [35], moment independence [36], and correlation coefficients [37]. Among the three importance analysis models, the importance measure theory based on variance is the most widely adopted. Therefore, this paper intends to use the importance measure analysis theory based on variance to analyze and calculate the parameters that affect the output response of the flexure electric beam under polymorphic. The following sections present the relevant theories.

3.1. Variance Decomposition and Importance Measure Index

According to the variance-based importance measurement theory, the output response is expressed as Y = g(x), where x = ( x 1 , x 2 , , x n ) is the n-dimensional input variable. The variance decomposition of Y is presented in Equation (30) [38]:
V ( Y ) = i = 1 n V x i + i = 1 n j = i + 1 n V x i x j + + V x 1 x 2 x n
where:
x i —input variable;
V x i —the main variance contribution of x i , and V x i = V E Y x i ;
V x i x j —the second-order variance contribution of x i and x j , and V x i x j = V E Y x i , x j V x i V x j .
The total variance contribution V x i T of input variable x i is defined as in Equation (31):
V x i T = V x i + j = 1 , j 1 n V x i x j + j = 1 , j 1 n k = 1 , k 1 , k j V x i x j x k + V x 1 x 2 x n = V ( Y ) V E ( Y | x i )
where x i is the n-dimensional input variable and the other n-1-dimensional variables besides x i .
The variance-based importance measure index S x i 1 x i 2 x i s is defined as the variance contribution rate of input variables V x i 1 x i 2 x i s and of the output response variance V Y , i.e.,
S x i 1 x i 2 x i s = V x i 1 x i 2 x i s V ( Y )
Equation (32) is referred to as the interactive importance measure of variables and can be utilized to quantify the variance contribution rate of each component function.
The importance measure index S x i corresponding to V x i is called the main importance measure of input variable x i , which shows the impact of input variable x i on the variance in output response Y in the case of independent action, i.e.,
S x i = V x i V ( Y ) = V E ( Y | x i ) V ( Y )
The total importance measure of the input variable x i is S x i T , corresponding to V x i T , which can reflect the total influence of variance in output response Y on input variable x i , i.e.,
S x i T = V x i T V ( Y ) = 1 V E ( Y | x i ) V ( Y )

3.2. The Computation Steps of Importance Measure Based on Monte Carlo Simulation

Given the complex probabilistic characteristics of the flexoelectric beam model presented, which are multi-parameter, nonlinear, and independent of each input variable, the Monte Carlo method, with its universal adaptability to high-dimensional integrals and unbiased sampling capability for arbitrary distributions, can directly obtain global sensitivity indicators without the need to simplify the physical model or make linearization assumptions, thus ensuring high credibility of the results. Although its computational burden is relatively large, it can obtain complete information on main effects, total effects, and interactions in one use. For the structural optimization and reliability assessment that only need to be completed offline in this paper, the time cost is acceptable, and its accuracy advantage far outweighs the potential time-consuming drawback.
The specific steps for implementing variance-based importance measures using the Monte Carlo simulation method are as follows:
Step 1: Based on the known joint probability density function of input independent variable x = x 1 , x 2 , , x n , two groups of samples (the sample size in each group is N) are selected and denoted as matrix A = x 11 x i 1 x n 1     x 1 N x i N x n N and B = x 1 ( N + 1 ) x i ( N + 1 ) x n ( N + 1 )     x 1 ( N + N ) x i ( N + N ) x n ( N + N ) . The i th column in matrix B is replaced by the i th column in matrix A to form matrix C i = x 1 ( N + 1 ) x i 1 x n ( N + 1 )       x 1 ( N + N ) x i N x n ( N + N ) .
Step 2: Let us substitute matrices A , B and C i into the output response Y = g ( x ) to obtain the corresponding output matrix, denoted as y A = y A ( 1 ) , , y A ( N ) T , y B = y B ( 1 ) , , y B ( N ) T and y C i = y C i ( 1 ) , , y C i ( N ) T .
Step 3: Compute the two indexes of importance measure of the input variable x i , respectively, based on Equations (35) and (36).
S x i = V E ( Y | x i ) V ( Y ) = E ( E 2 ( Y | x i ) ) E 2 ( E ( Y | x i ) ) E ( Y 2 ) E 2 ( Y ) = ( y A · y C i ) y 0 2 ( y A · y A ) y 0 2 = 1 N j = 1 N y A ( j ) y C i ( j ) y 0 2 1 N j = 1 N ( y A ( j ) ) 2 y 0 2
S x i T = 1 V E ( Y | x i ) V ( Y ) = 1 ( y B · y C i ) y 0 2 ( y A · y A ) y 0 2 = 1 1 N j = 1 N y B ( j ) y C i ( j ) y 0 2 1 N j = 1 N ( y A ( j ) ) 2 y 0 2
( y 0 is the expected value of matrix y A ).

4. The Importance Measure Analysis of Multi-State Flexoelectric Structures

4.1. Parameter Uncertainty of Multi-State Flexoelectric Structures

Set the flexure electric coefficient μ 31 , length L , thickness h , dielectric coefficient a 33 , Young’s modulus E and beam width B   as the input parameters for the flexural electric beam. Owing to the inherent uncertainty of the flexure electric beams and the scarcity of extensive data during the design phase, uncertainties in the parameters themselves also exist. Therefore, the impacts of the uncertainty of the six basic variables on the uncertainty of the output voltage of the flexure electric beam in an open-circuit state, the uncertainty of the output charge in a short-circuit state, and the uncertainty of the effective piezoelectric coefficient are studied.
According to the available data and engineering professional knowledge, the six fundamental variables of the flexure electric beam structure are assumed to follow a normal distribution. The specific parameters are presented in Table 1.

4.2. The Importance Measure Analysis of Multi-State Flexoelectric Structures Based on Variance

The importance measure theory based on variance is employed to analyze the impact of different input parameters on the output behavior of the flexure electric beam structure and the effective piezoelectric coefficient under various electrical conditions.
1. The significance analysis of parameters influencing the output voltage of a flexure electric beam under open-circuit conditions.
The standard deviation and mean of the four parameters are given in Table 1, namely, the flexure electric coefficient μ 31 , the thickness h , the dielectric coefficient a 33 and the length L , respectively. By integrating the importance measure theory based on variance, the principal importance measure and the total importance measure index of the parameters affecting the voltage output of the flexure electric beam in the open-circuit condition are calculated, as presented in Table 2 and Table 3.
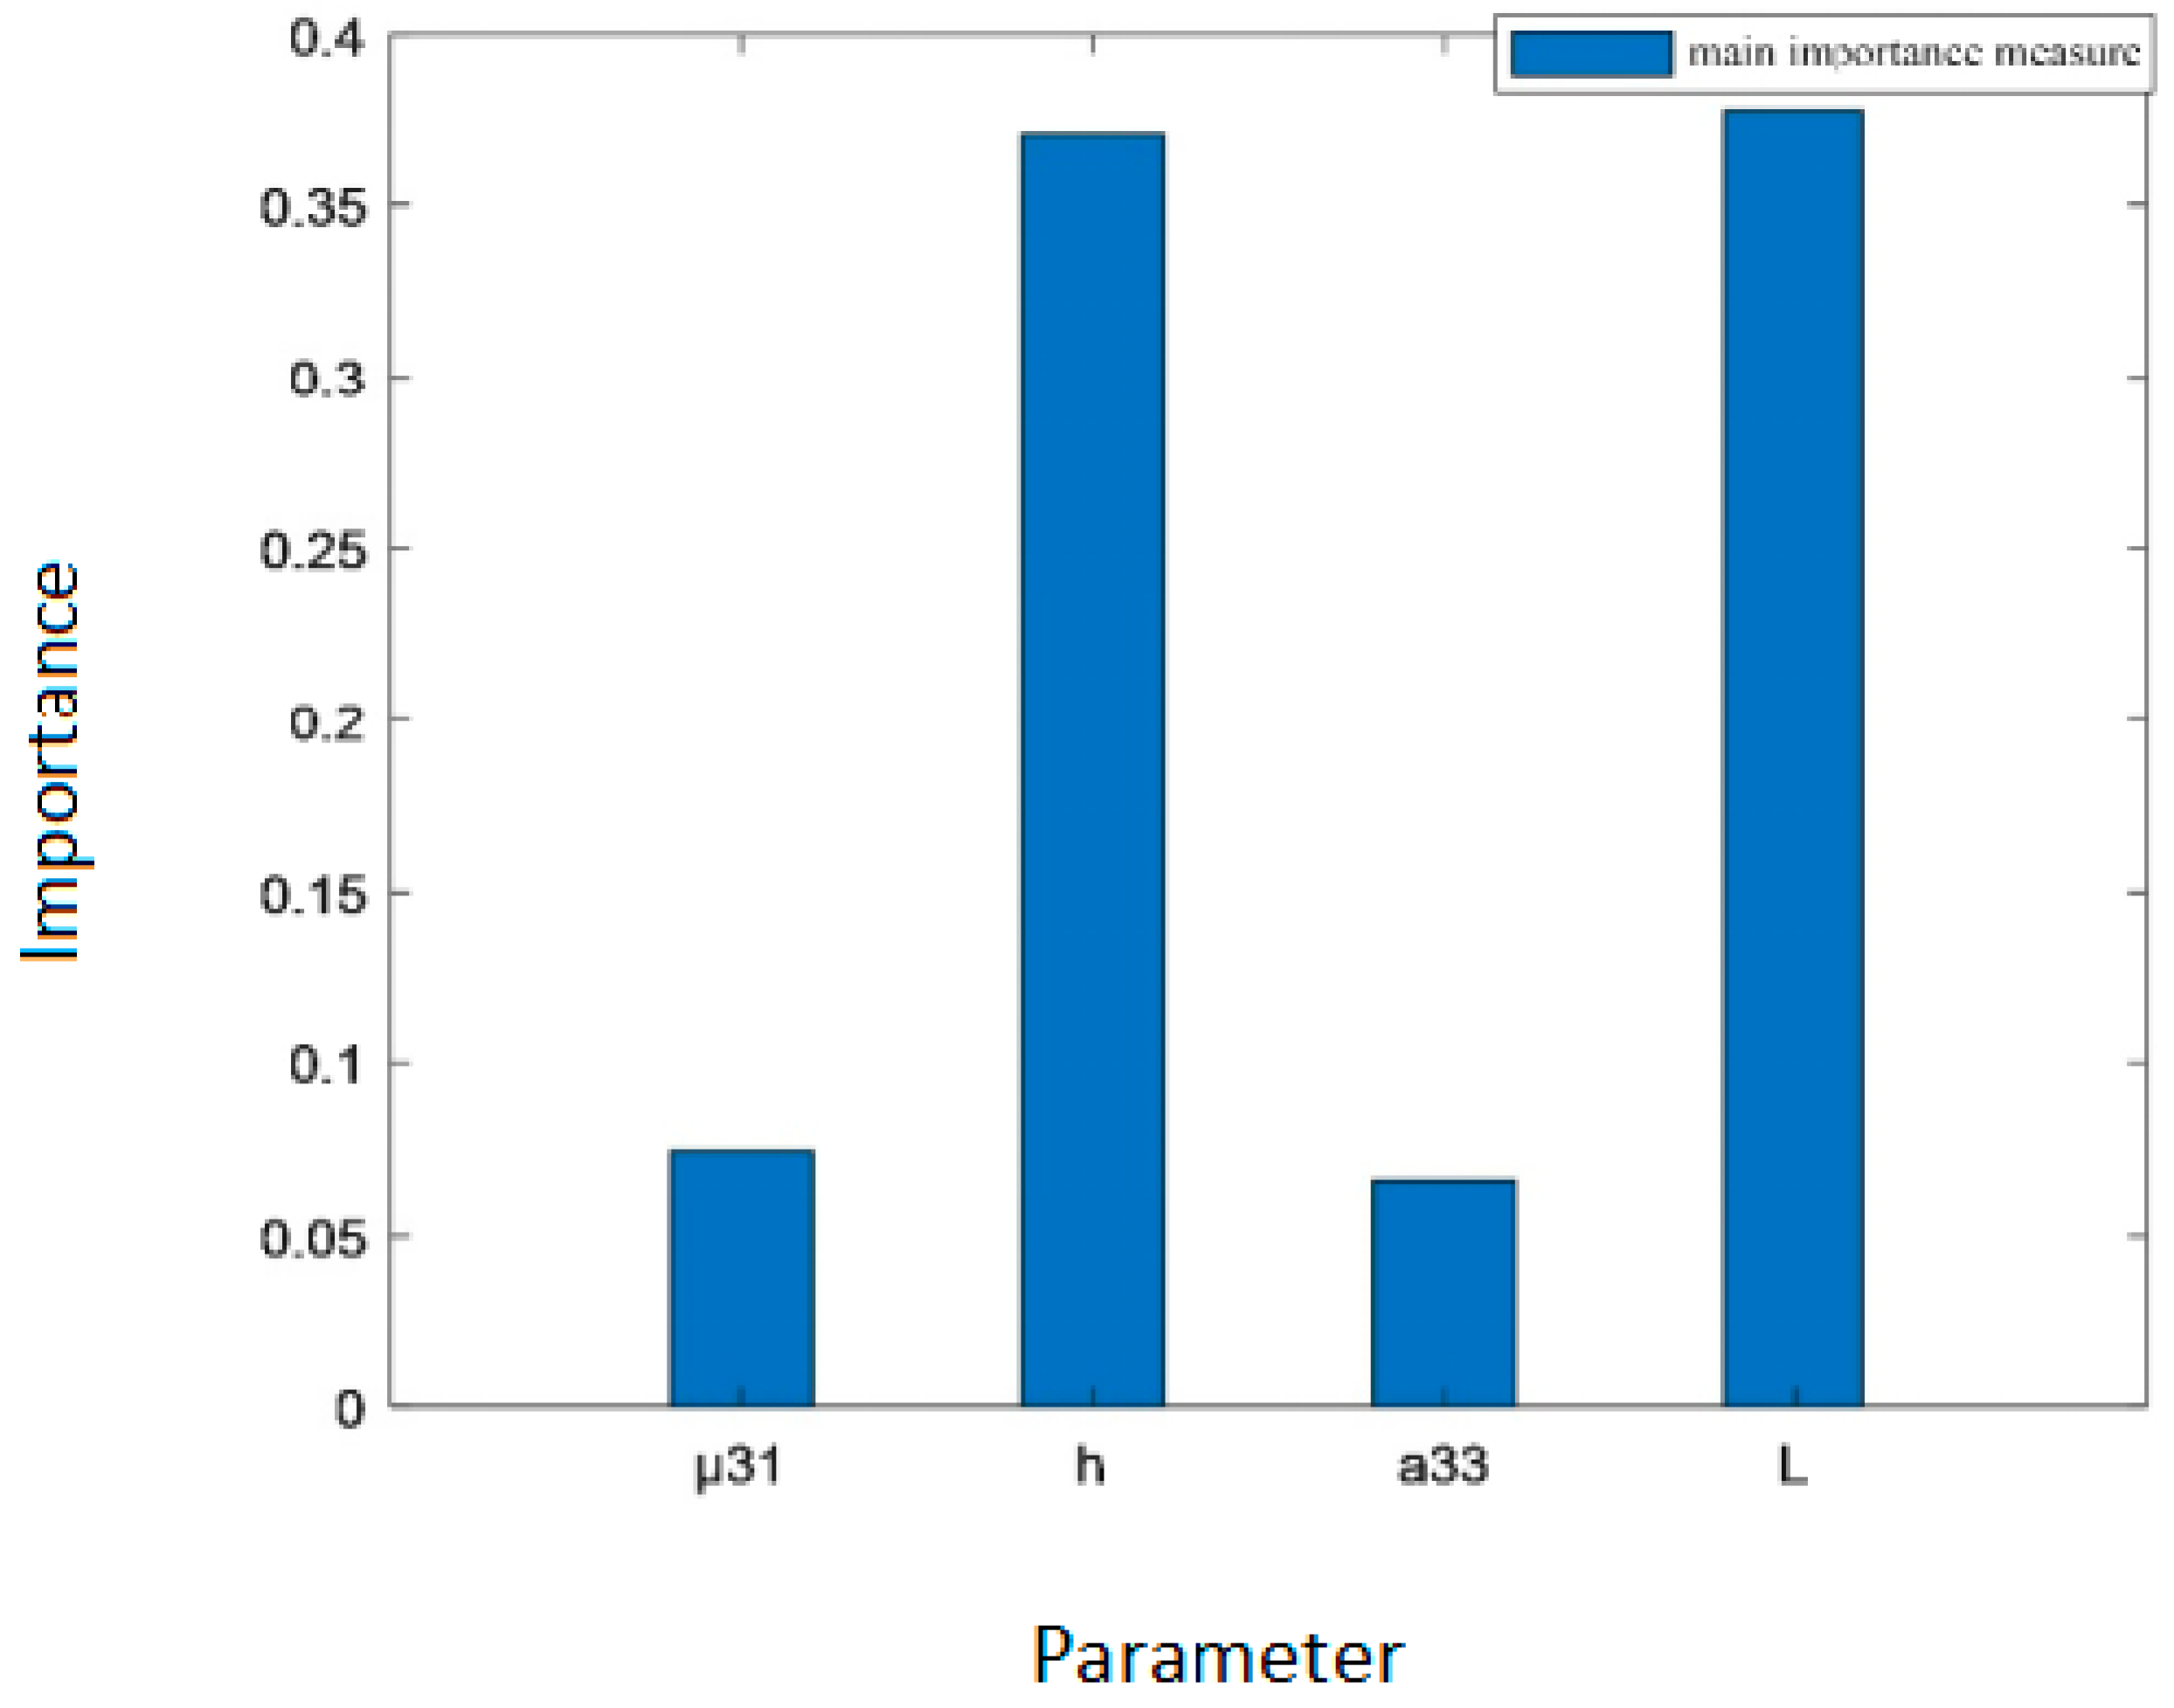
As can be observed from Table 2, the order of the major importance measure of the structural parameters of the flexure electric beam in the open-circuit condition is S L > S h > S μ > S a . This indicates that when these parameters act separately, the order of their influence degree on the variance in the output voltage φ q u a s i of the flexure electric beam structure is L > h > μ 31 > a 33 . The beam length L has the greatest influence on the variance in the output voltage φ q u a s i , followed by thickness h . In contrast, the flexure electric coefficient μ 31 and the dielectric coefficient a 33 have relatively lesser influences.
As can be intuitively observed from Figure 2, the main importance measure corresponding to length L and thickness h is significantly greater than that corresponding to the other two parameters. This suggests that when these parameters act independently, the influence of length L and thickness h on the uncertainty of output voltage is far greater than that of the other two parameters.
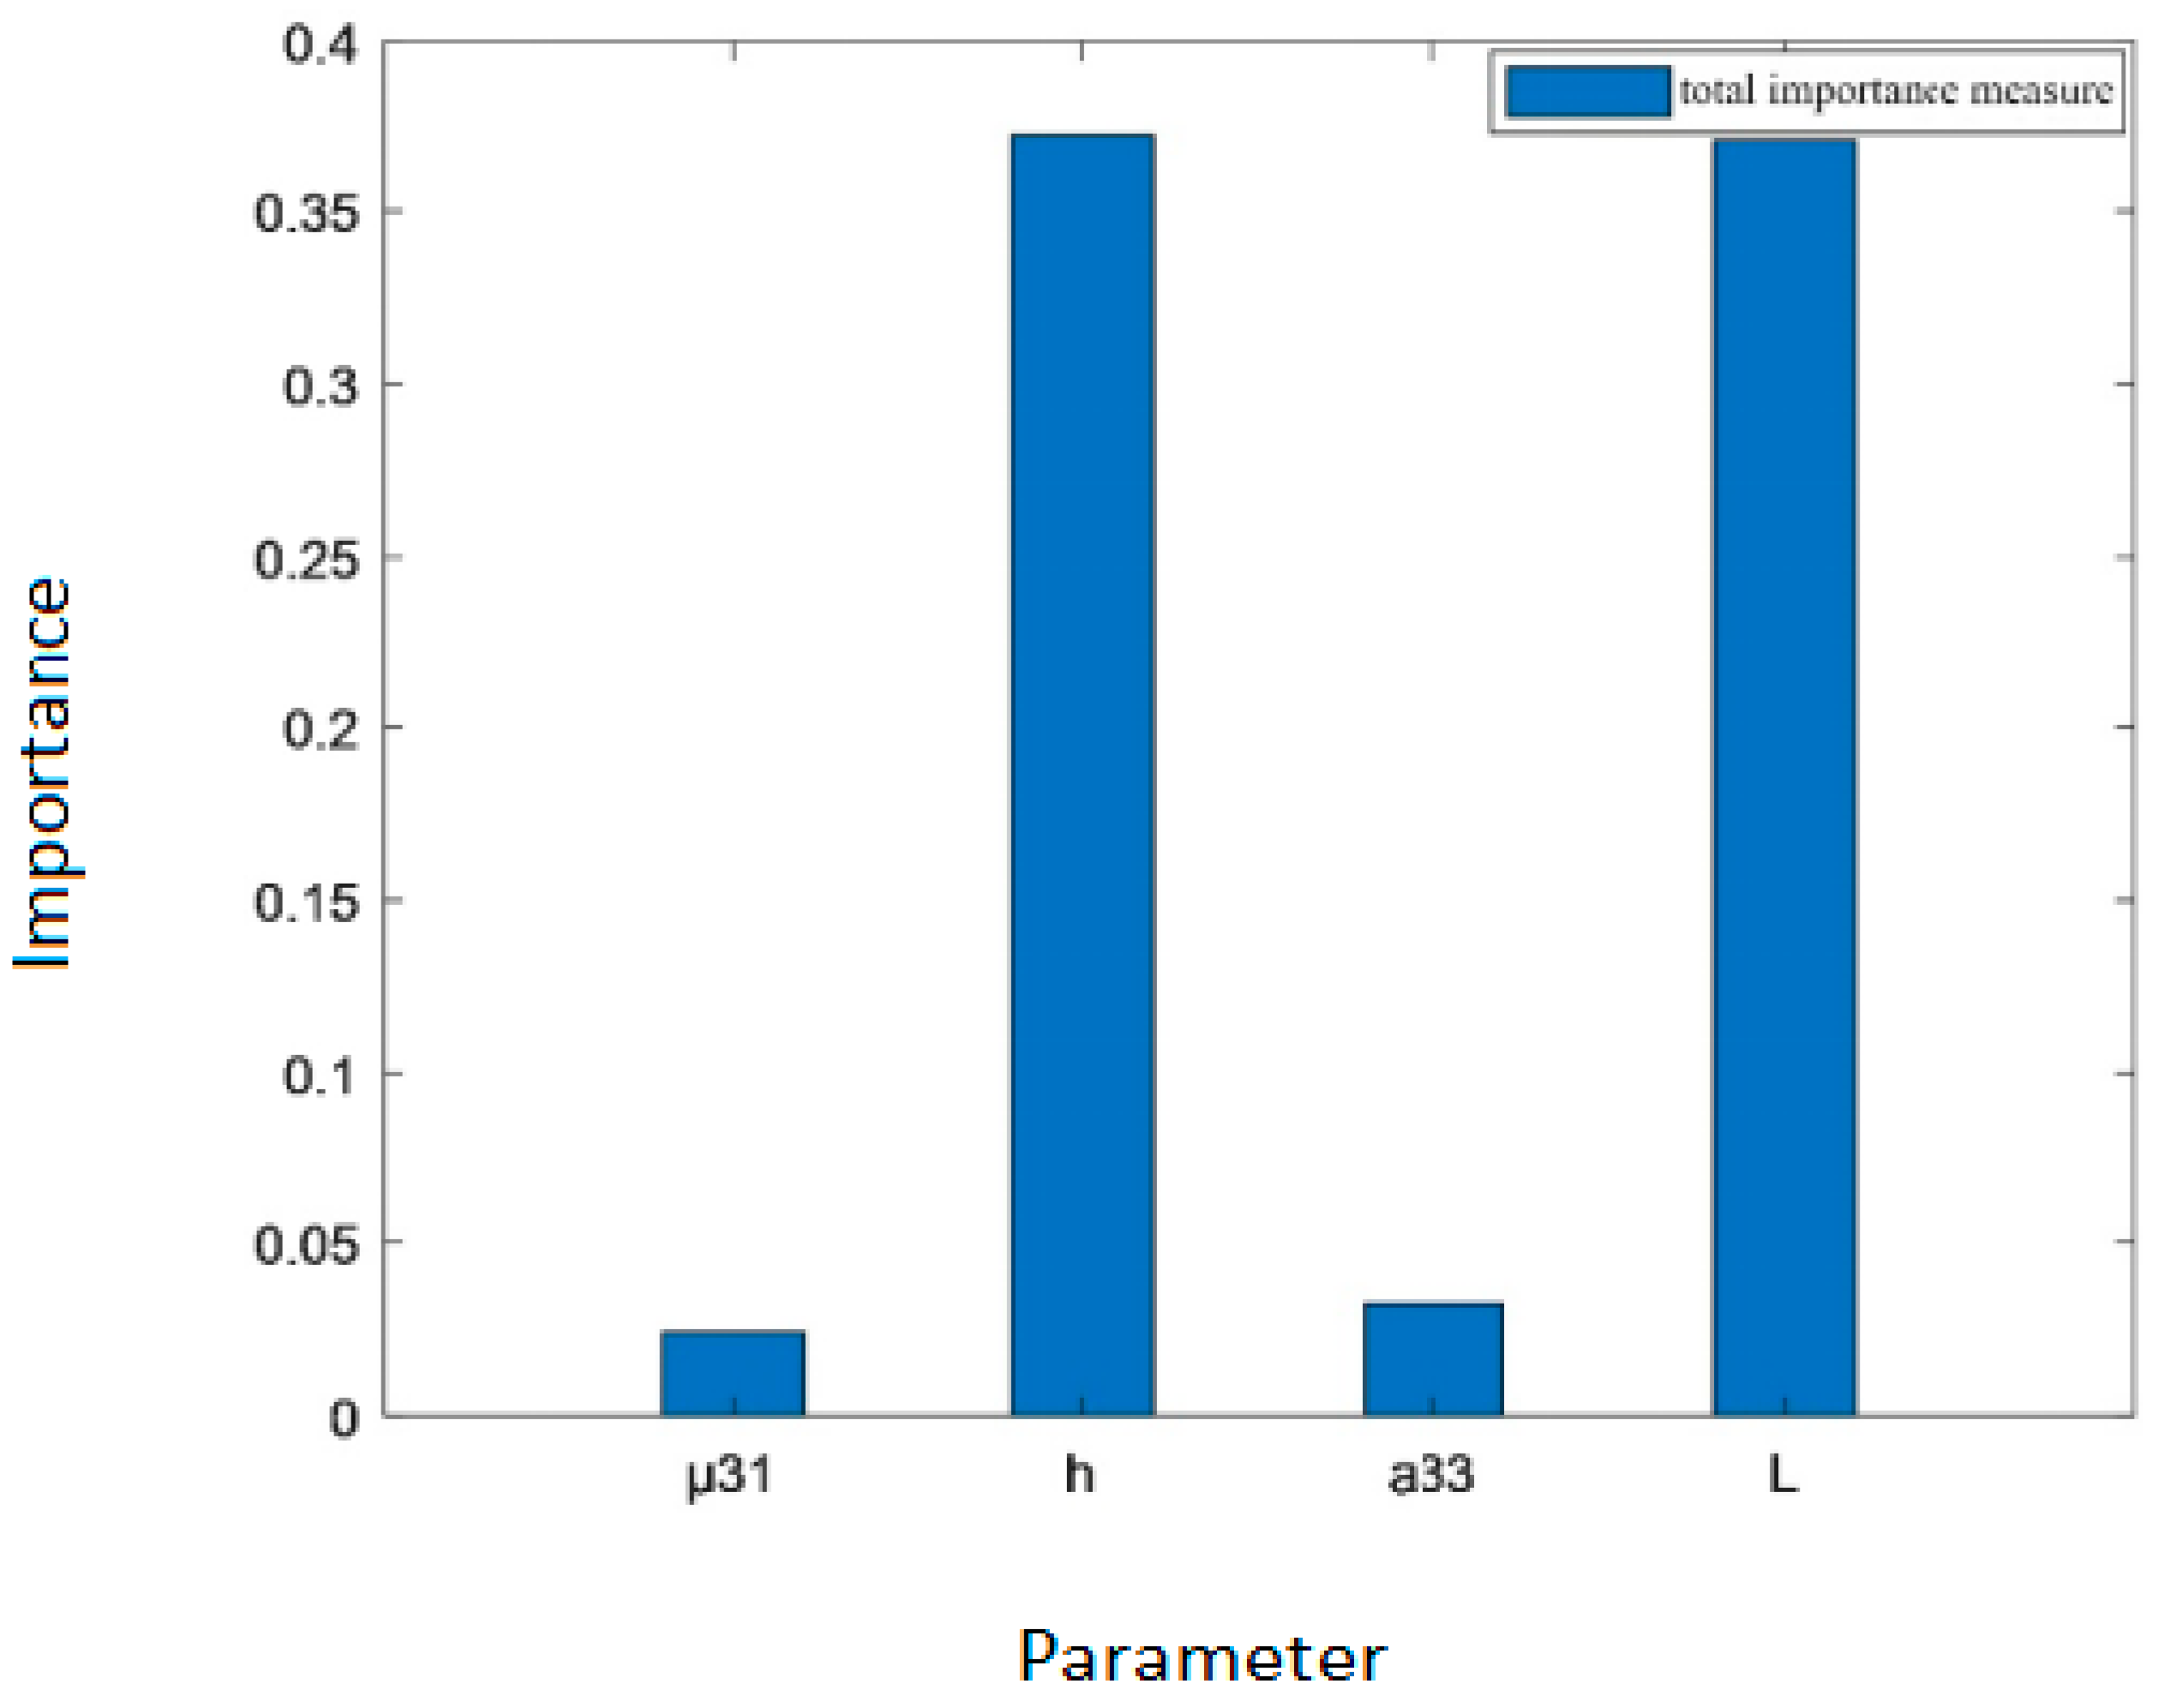
As shown in Table 3, the order of the total importance measure of the four parameters of the flexure electric beam is S h T > S L T > S a T > S μ T , indicating that the order of the importance of the four parameters’ influence on the total variance in the output voltage φ q u a s i is h > L > a 33 > μ 31 . Thickness h has the greatest influence, followed by length L , while the dielectric coefficient a 33 and the flexure electric coefficient μ 31 have relatively lesser influences.
As can be intuitively observed from Figure 3, the total importance measure corresponding to thickness h and length L is significantly greater than that corresponding to the other two parameters. This suggests that the importance of the two parameters, thickness h and length L , on the total influence of output power variance is far greater than that of the other two parameters.
According to the above analysis, the main importance ranking of the parameters of the flexoelectric beam structure is basically consistent with the overall importance ranking. The importance measure index values corresponding to length L and thickness h are far greater than those corresponding to the other two parameters, indicating that among the four parameters, the key parameters influencing the output voltage of the flexure electric beam structure are thickness h and length L .
2. Analysis of the importance of parameters affecting the output charge of a flexed beam under short-circuit condition.
Table 1 presents the corresponding standard deviation and mean of four parameters, namely, the flexure electric coefficient μ 31 , thickness h , length L and beam width B . By integrating the importance measure theory based on variance, the main importance measure and the total importance measure indices of the input parameters influencing the charge output of the flexure electric beam under the electrical short-circuit conditions are calculated, as presented in Table 4 and Table 5 below.
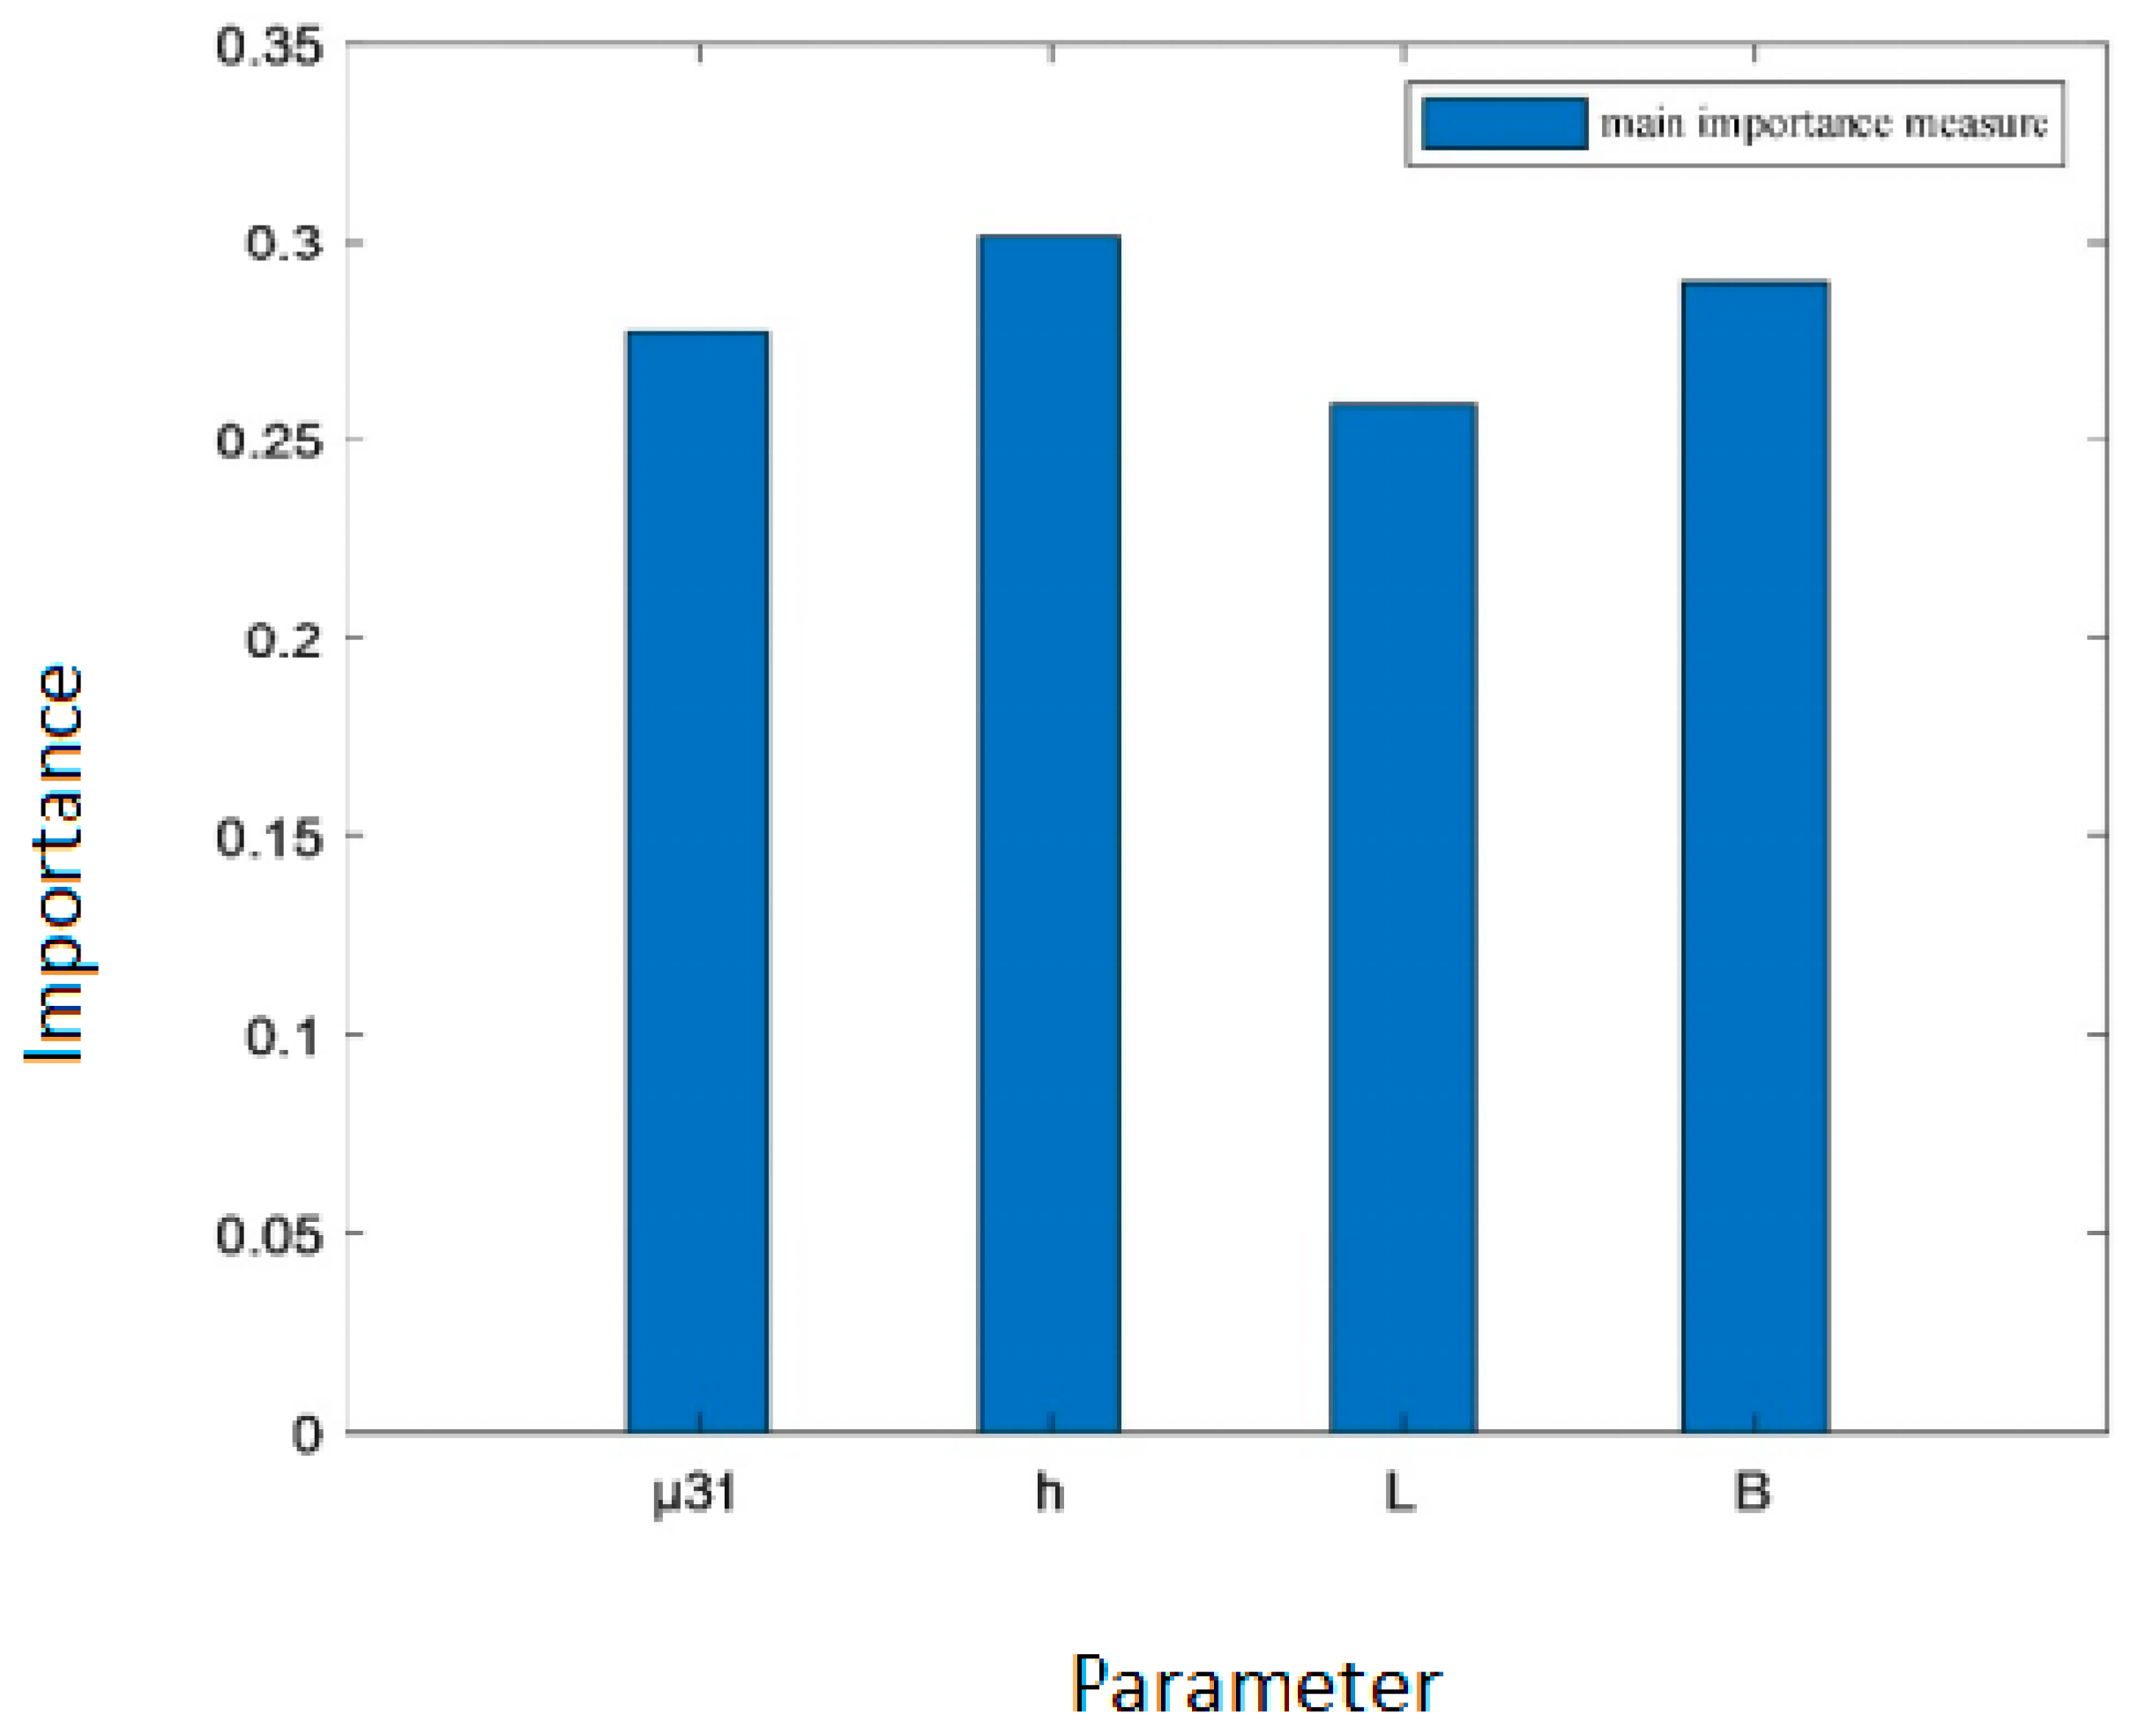
As can be observed from Table 4, the order of the main importance measure of the structural parameters of the flexure electric beam in the electrical short-circuit condition is S h > S B > S μ > S L , which indicates that when these parameters act separately, the order of their influence on the variance in the output charge Q q u a s i of the flexure electric beam structure is h > B > μ 31 > L . Thickness h exerts the greatest influence on the variance in the output charge Q q u a s i , followed by beam width B , the flexure electric coefficient μ 31 and length L .
As can be intuitively observed from Figure 4, thickness h exhibits the largest main importance measure, followed by beam width B , the flexure electric coefficient μ 31 and the length L . This indicates that, when acting independently, the four parameters exert similar influences on the uncertainty of the output charge.
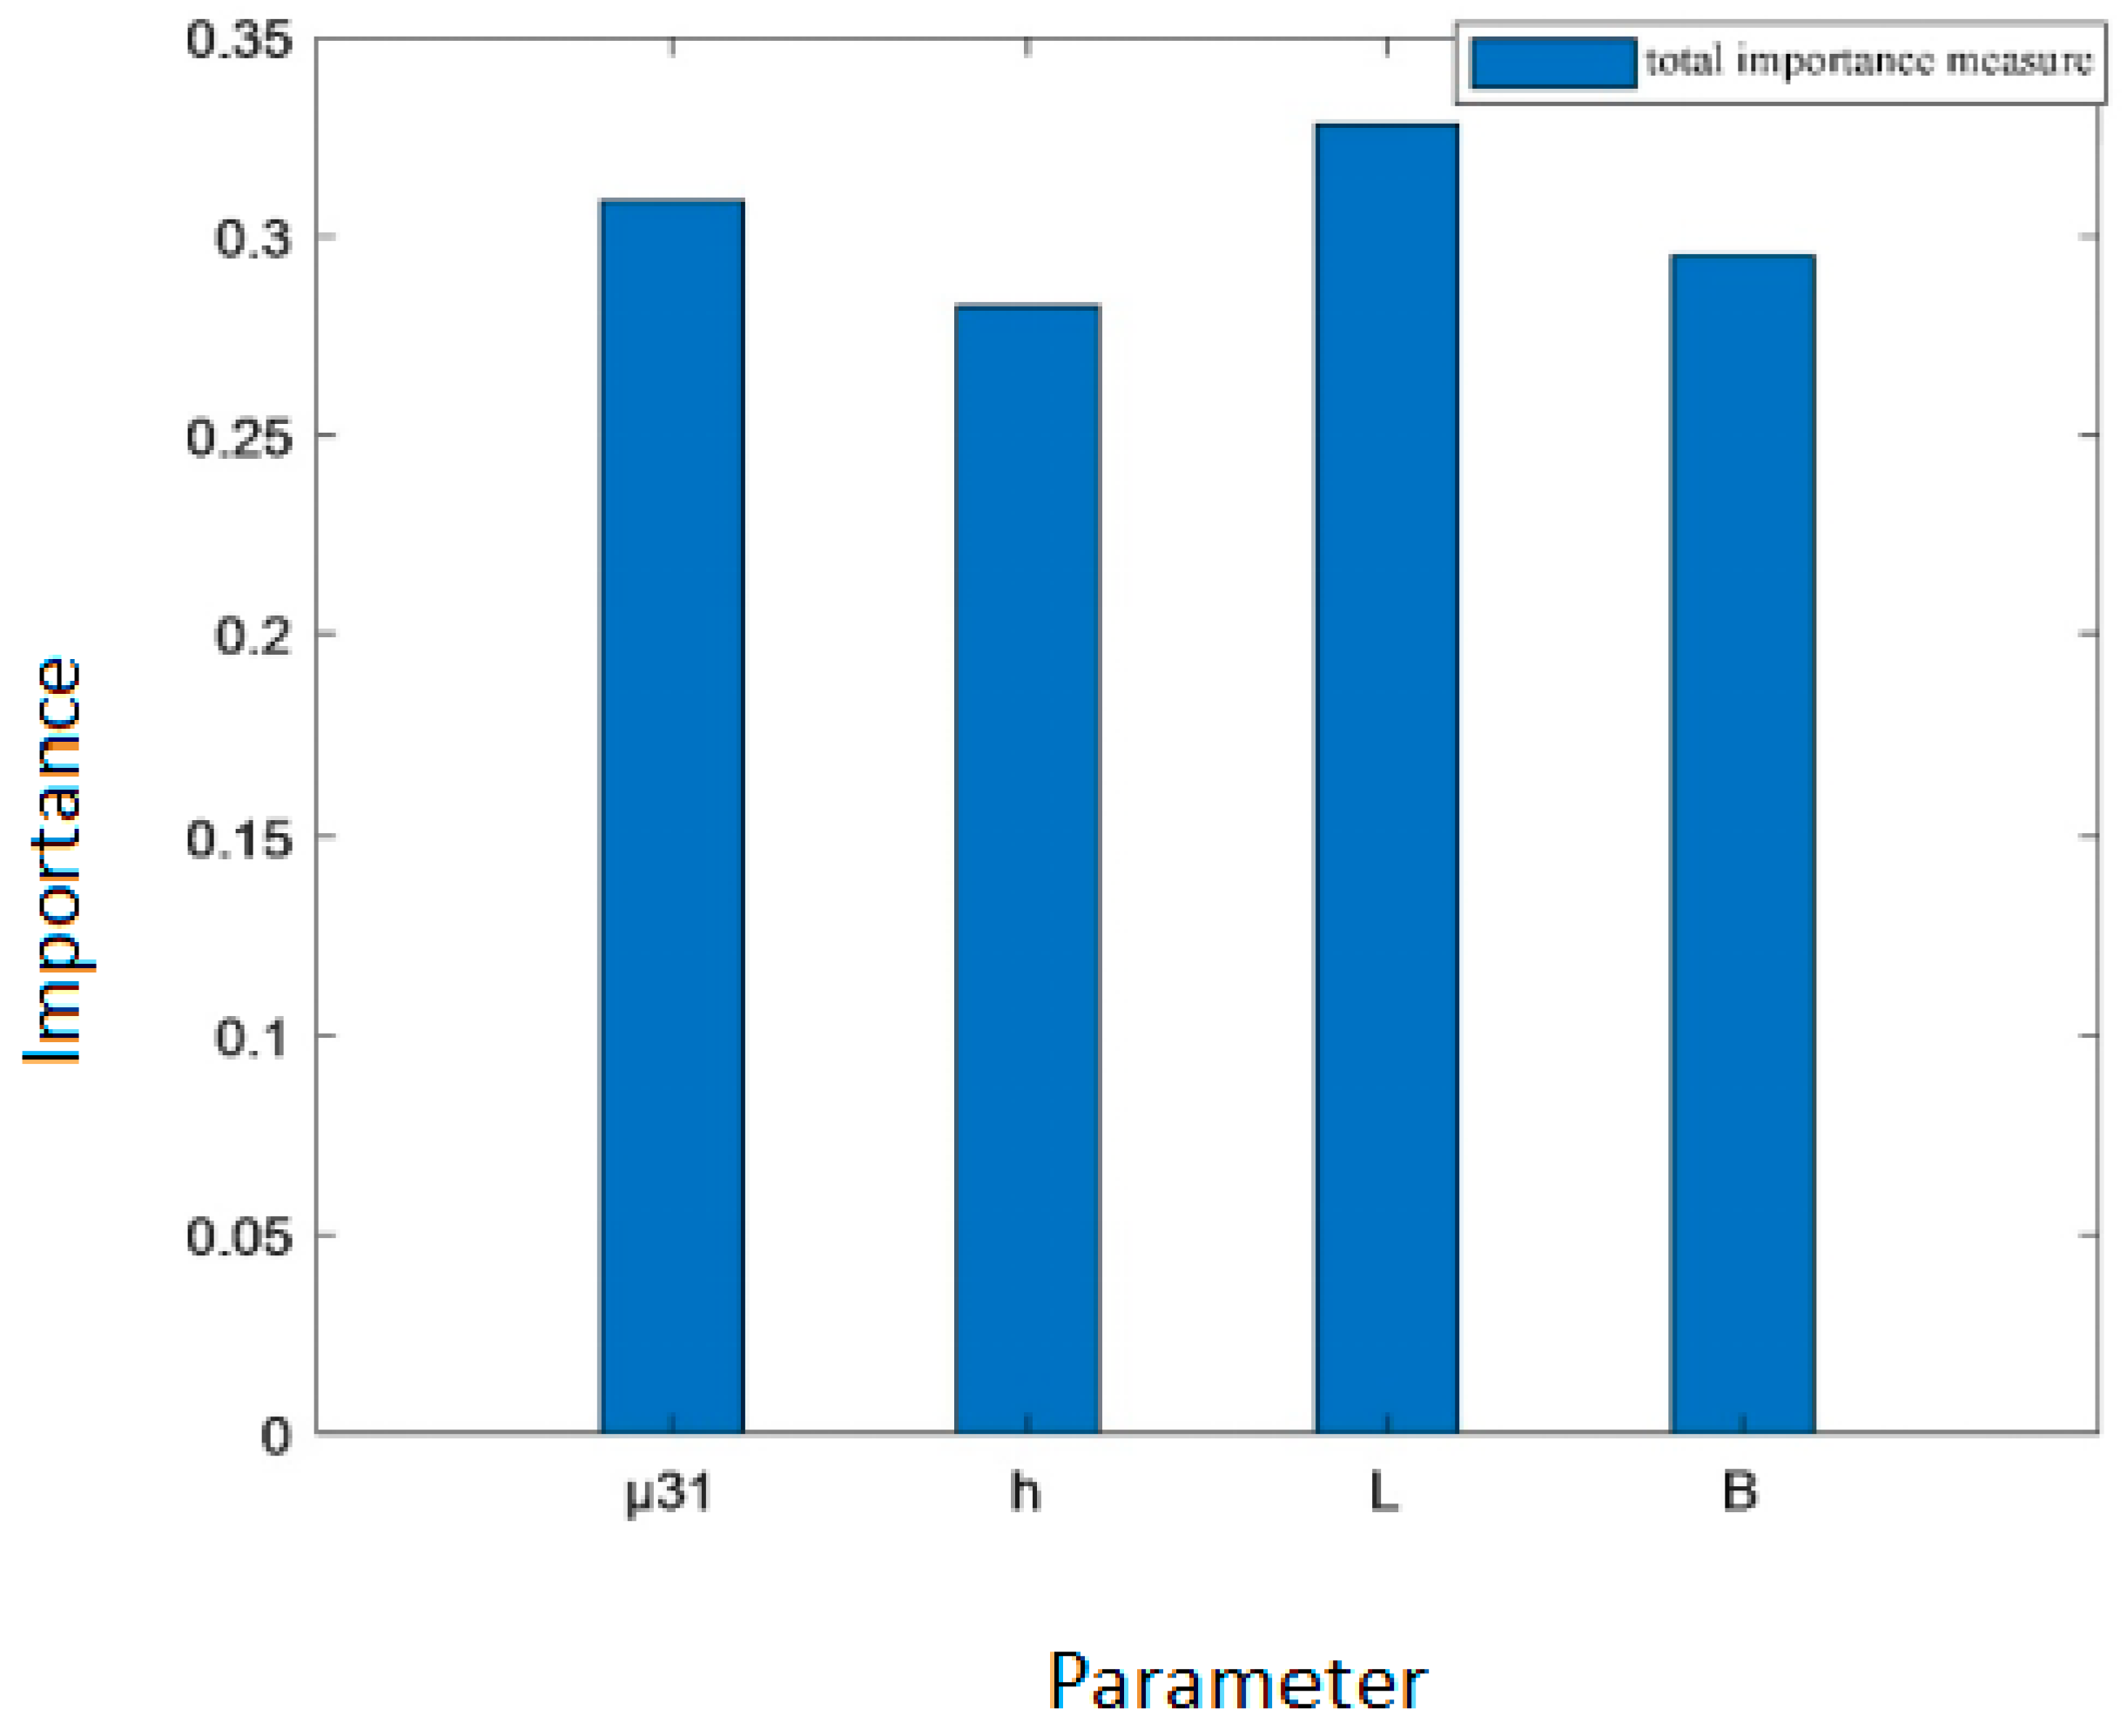
As shown in Table 5, the order of the total importance measure of the four parameters of the flexure electric beam is S L T > S μ T > S B T > S h T . This indicates that the order of the importance of the four parameters on the total variance in the output charge Q q u a s i of the flexure electric beam is L > μ 31 > B > h .
As can be intuitively observed from Figure 5, length L exerts the greatest influence, followed by the flexure electric coefficient μ 31 , and the influence of beam width B and thickness h is slightly less than that of the former two parameters. In general, there is no significant difference.
In the analysis of output charge, the difference in the ranking of primary importance measure and total importance measure reveals key design insights: when acting independently, thickness h has the greatest impact, followed by width B, the flexoelectric coefficient μ31, and length L. However, after considering interactive effects, length L rises to the top, followed by μ31, and h drops to the bottom. This reversal stems from the fact that in the output charge formula, length L serves as the denominator, significantly amplifying the fluctuation effects of other parameters through the product term. Although h has a strong independent effect, its interactive contribution is weaker. Therefore, to optimize the output charge, it is necessary to prioritize the regulation of length L and flexoelectric coefficient μ31, which have significant interactive effects, rather than relying solely on thickness h, which has a prominent independent effect. This highlights the necessity of distinguishing between independent and coupled effects of parameters in structural design.
Analysis of the importance measures affecting the effective piezoelectric coefficient of a flexure electric beam.
Table 1 presents the corresponding standard deviation and mean of four parameters, namely, the flexure electric coefficient μ 31 , thickness h , length L and Young’s modulus E , respectively. By combining the importance measure theory based on variance, the main importance measure and the total importance measure indices of the parameters affecting the effective piezoelectric coefficient of the flexure electric beam structure are calculated, as presented in Table 6 and Table 7 below.
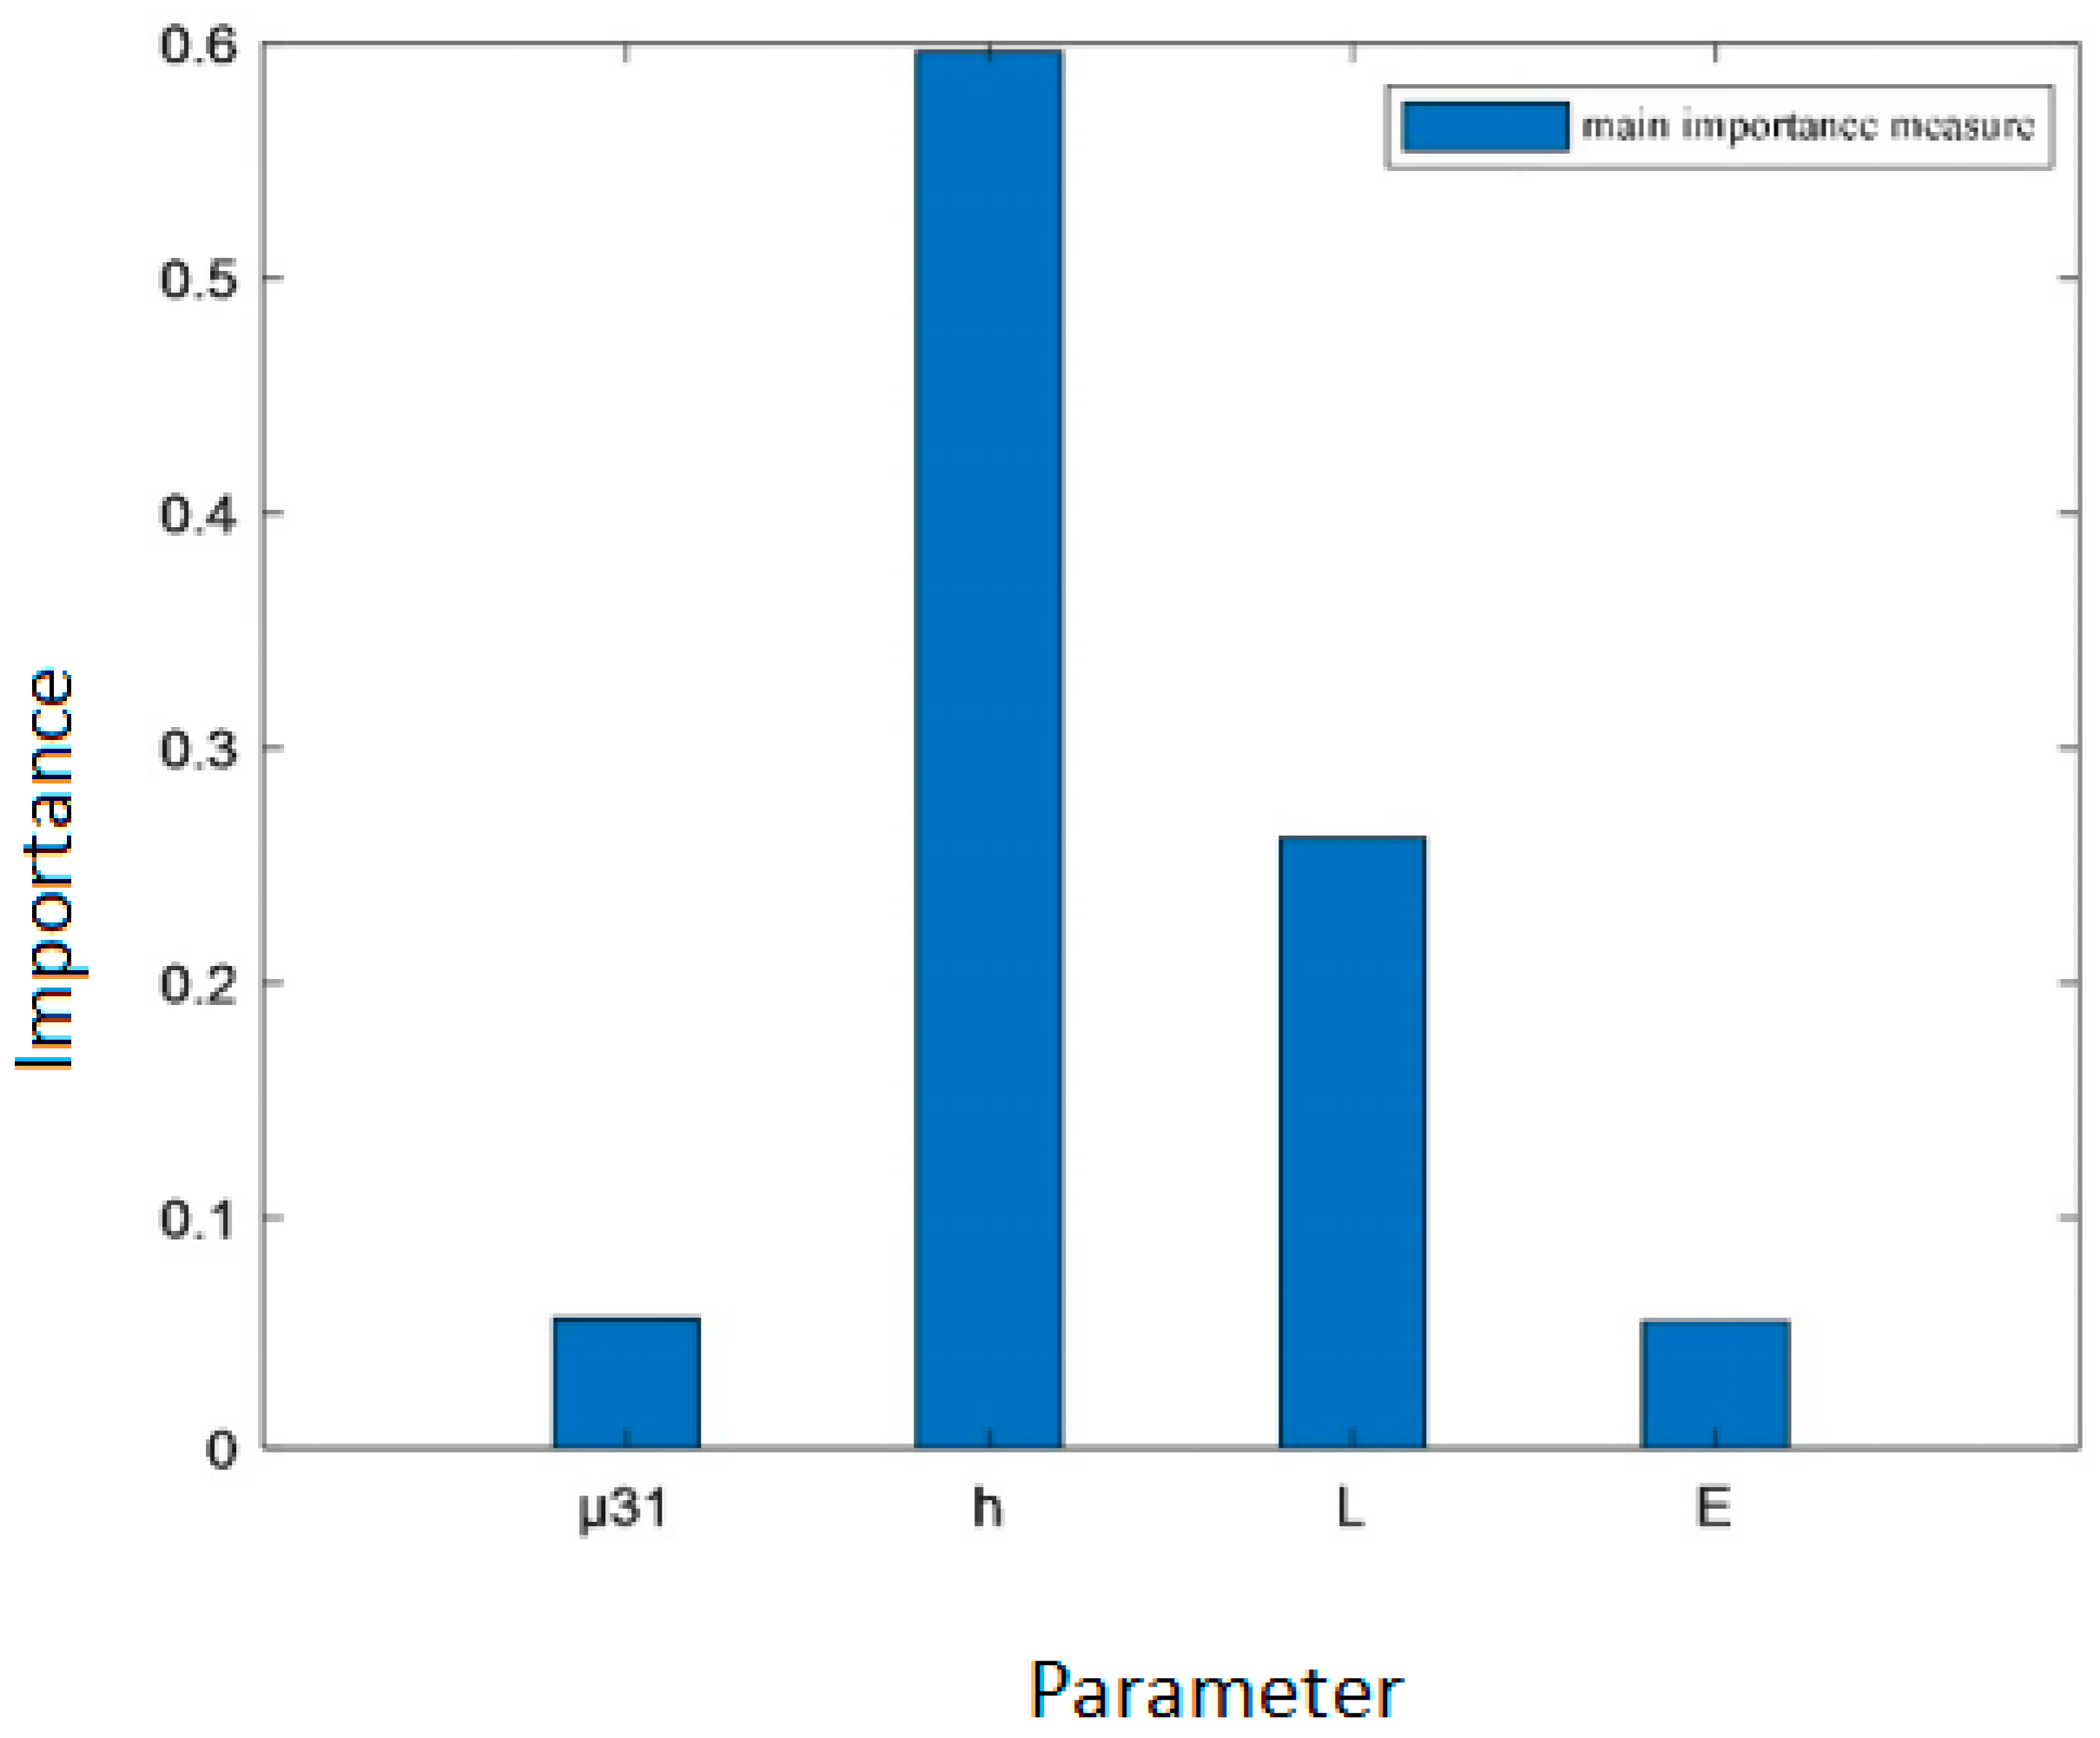
It can be seen from Table 6 that the order of the main importance measure of the flexure electric beam parameters is S h > S L > S μ > S E , which reflects that when these parameters act separately, the order of their influence degree on the variance in the effective piezoelectric coefficient d 33 e f f of the flexure electric beam structure is h > L > μ 31 > E . Thickness h exerts the greatest influence on the variance in the effective piezoelectric coefficient d 33 e f f , followed by length L . In contrast, the influence of the flexure electric coefficient μ 31 and Young’s modulus E is relatively minor.
It can be intuitively seen from Figure 6 that thickness h has the largest main importance measure, followed by length L , and the other two parameters have smaller main importance measures. This suggests that, when parameters act independently, thickness h has a significantly greater impact on the uncertainty of the output charge compared to the other three parameters.
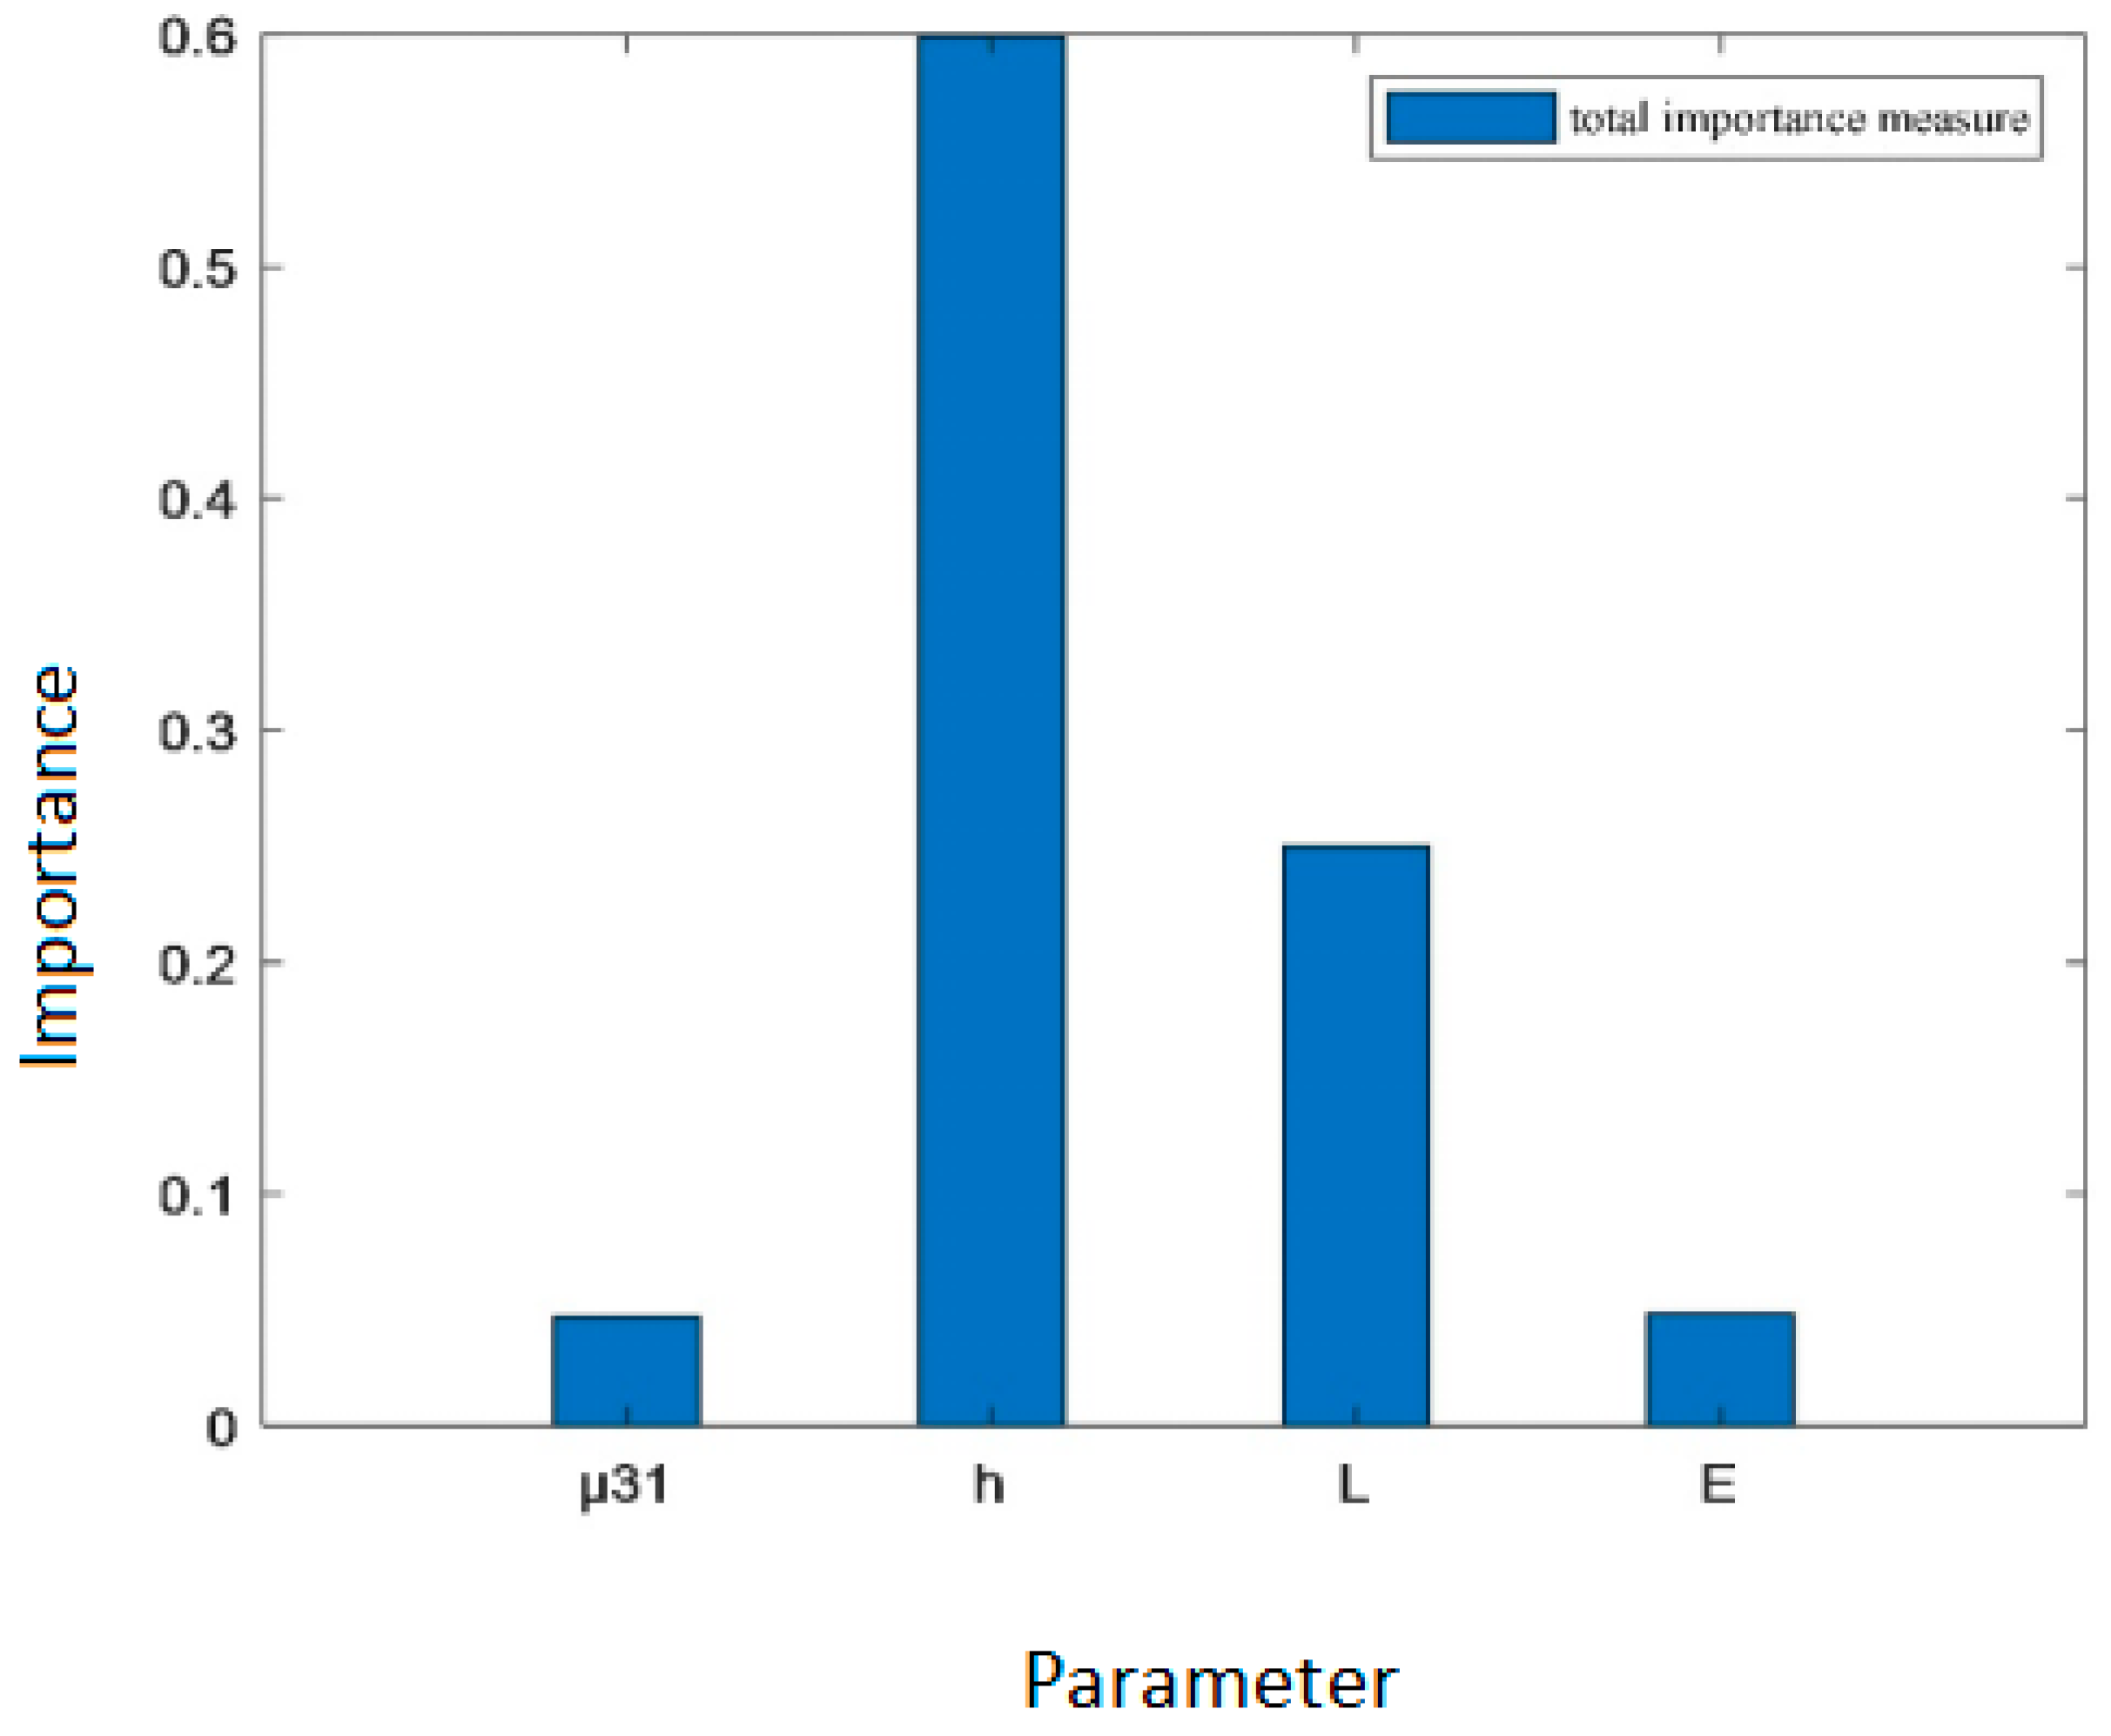
As shown in Table 7, the order of the total importance measure of the four parameters of the flexure electric beam structure is S h T > S L T > S E T > S μ T , indicating that the order of the importance of the four parameters on the total variance in the effective piezoelectric coefficient d 33 e f f is h > L > E > μ 31 . Thickness h exerts the greatest influence, followed by length L , while Young’s modulus E and the flexure electric coefficient μ 31 have relatively lesser influences.
It can be observed from Figure 7 that thickness h exerts the greatest influence on the variance in effective piezoelectric coefficient d 33 e f f , followed by length L , and Young’s modulus E and flexure electric coefficient μ 31 have relatively lesser influences. The value of the importance measure index corresponding to thickness h is significantly greater than that corresponding to the other three parameters, indicating that among the four parameters, the key parameter influencing the output voltage of the flexure electric beam structure is thickness h .
The importance ranking of the parameters of the flexural beam structure is basically consistent with the overall importance ranking, indicating that the variance-based importance measurement method is accurate. To further enhance the output performance of the flexure electric beam and the effective piezoelectric coefficient, more attention should be paid to the thickness and length of the flexure beam structure.

4.3. Analysis and Verification of the Importance Measure of Flexure Electric Beam Parameters Based on Moment Independence

1. The importance measure analysis of the parameters influencing the output voltage of the flexure electric beam in the open-circuit condition
Table 1 presents the corresponding standard deviation and mean of four parameters, namely, the flexure electric coefficient μ 31 , the thickness h , the dielectric coefficient a 33 and the length L . Combined with the importance measure theory based on moment independence, the importance measure indexes of the parameters influencing the voltage output of the flexure electric beam structure in the case of an electricity open-circuit condition are calculated, as presented in Table 8 below.
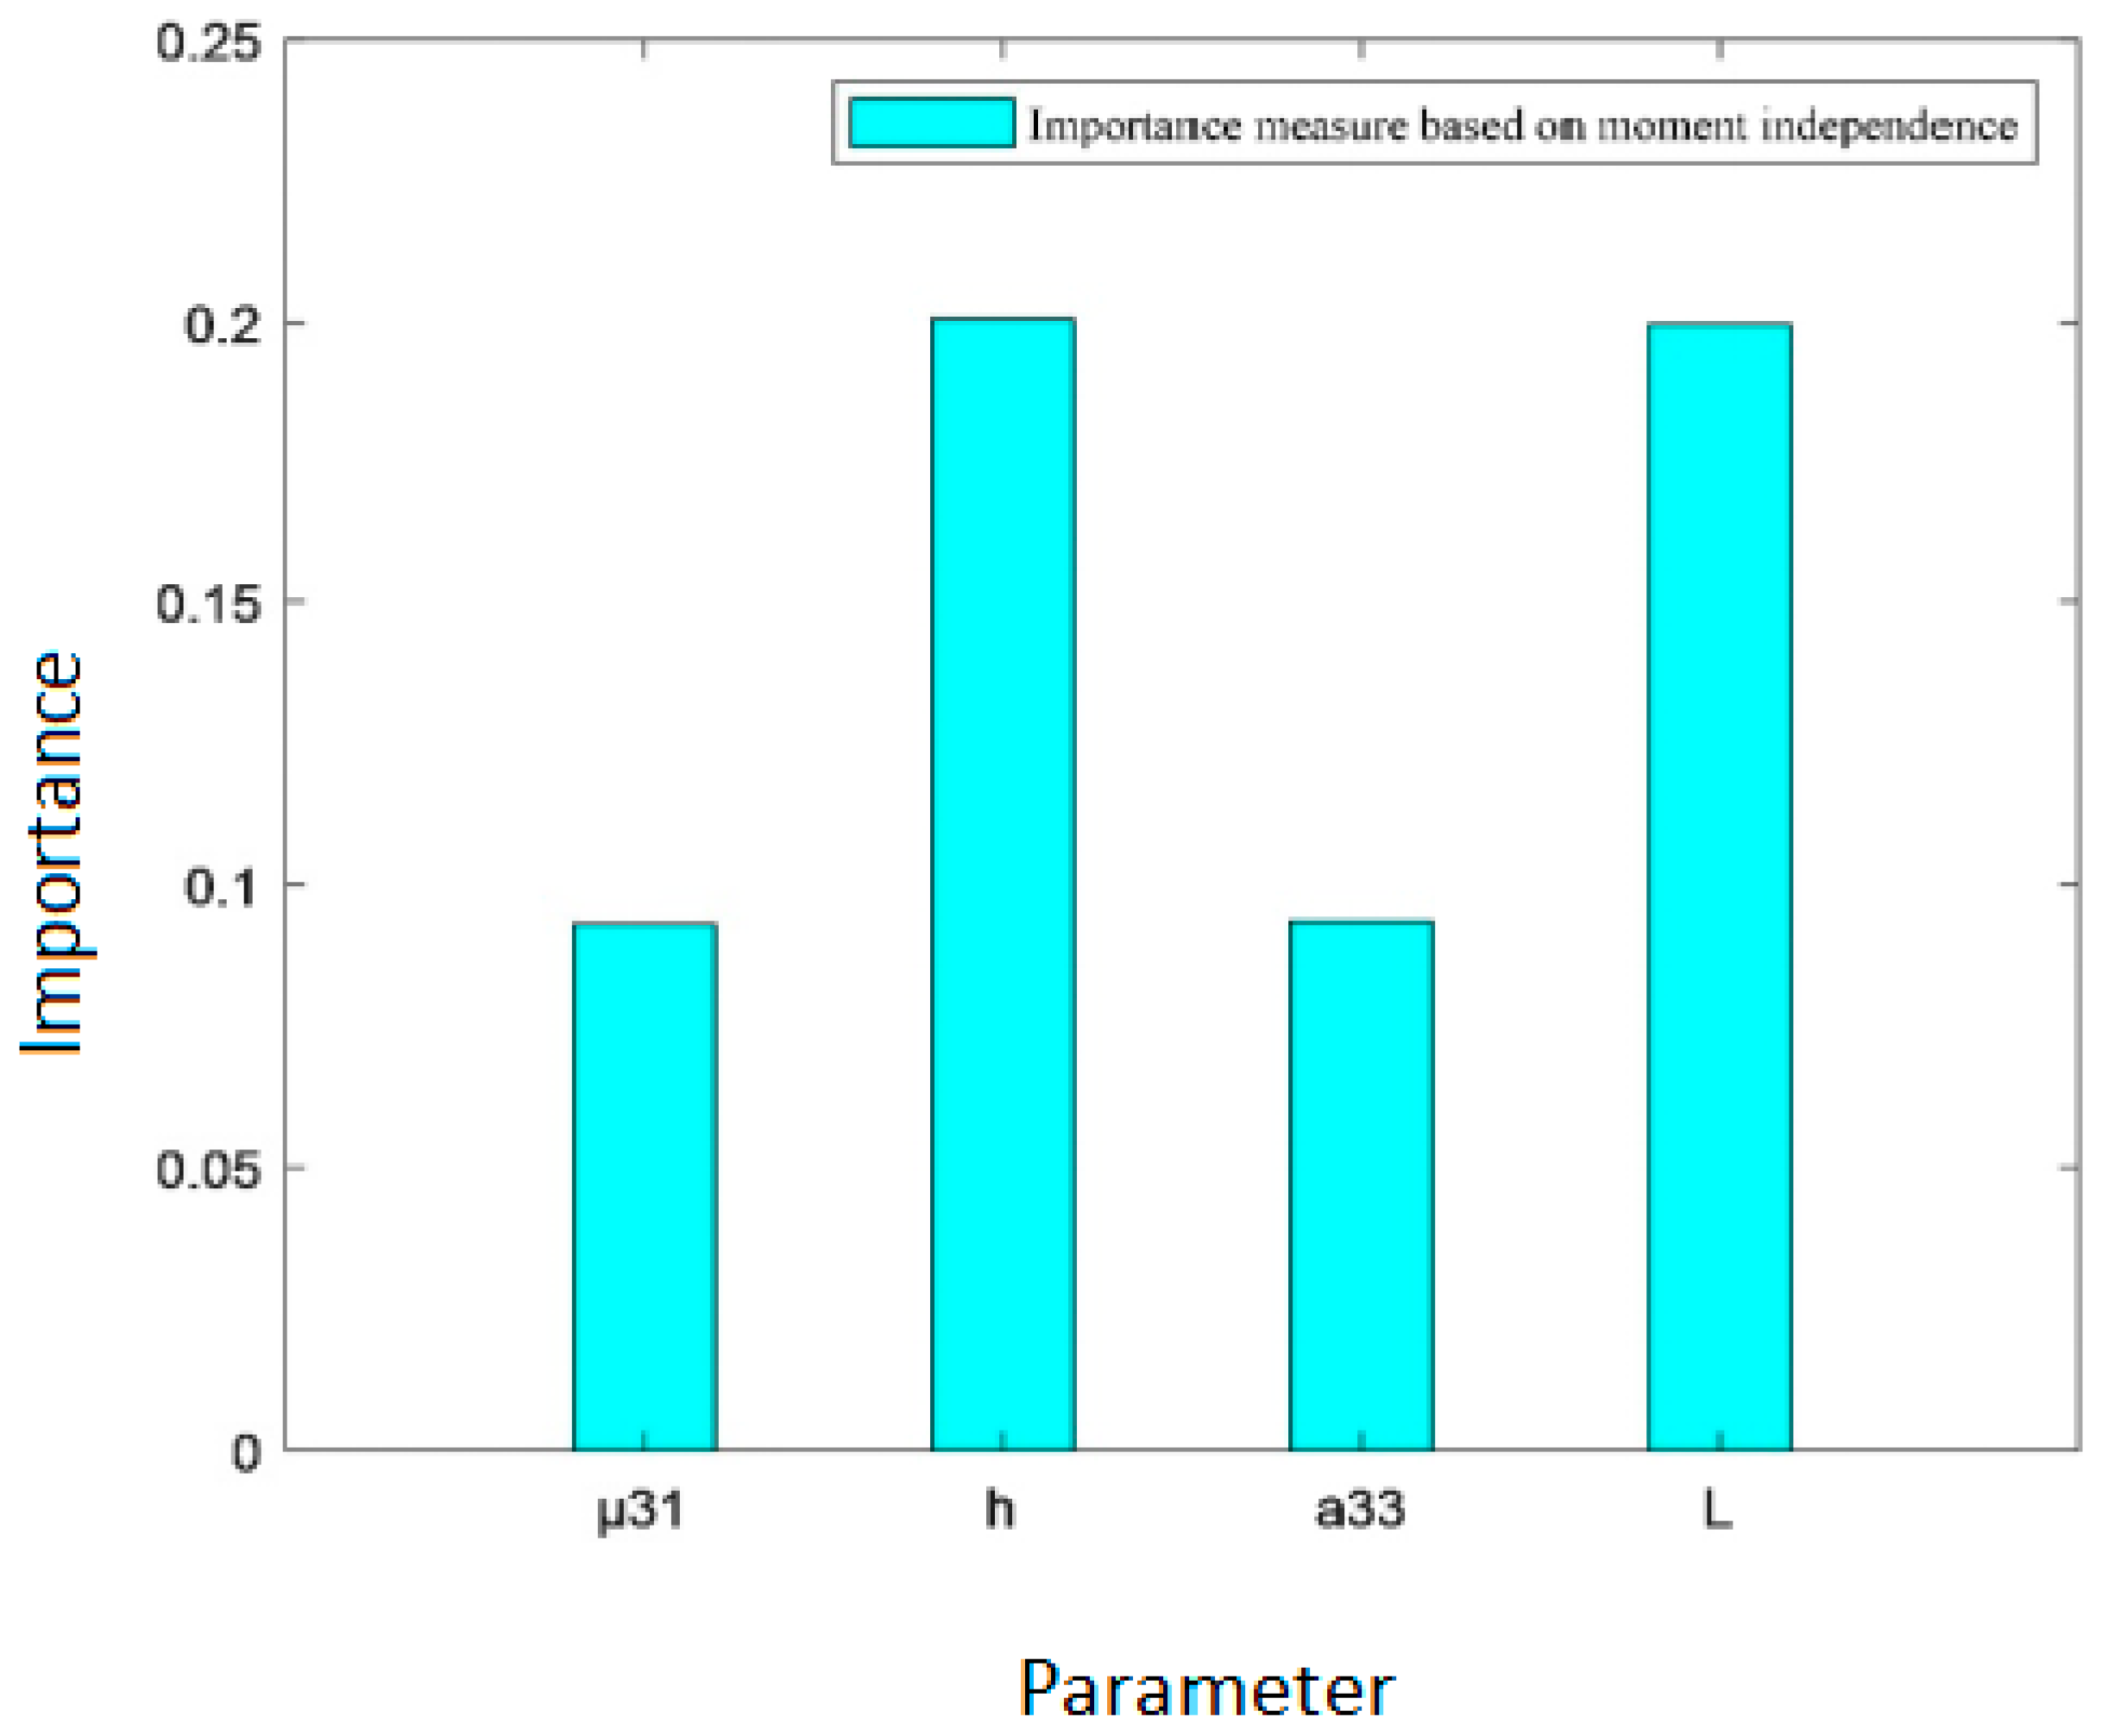
As shown in Table 8, in the electrical open-circuit condition, the moment-independent importance measure ranking is h > L > a 33 > μ 31 , which is largely consistent with the result presented by the variance importance measure in Section 3.1. Beam length L and thickness h are significantly larger than the other two parameters, and dielectric coefficient a 33 and flexoelectric coefficient μ 31 exert relatively minor influences on the voltage output.
As can be intuitively observed from Figure 8, the importance measure corresponding to thickness h and length L is significantly greater than that corresponding to the other two parameters. To improve the output voltage of flexure electric beam structure, more attention must be paid to the thickness and length of the beam in structural design.
2. The importance measure analysis of the parameters influencing the output charge of the flexure electric beam in the short circuit condition
Table 1 presents the corresponding standard deviation and mean of four parameters, namely, the flexure electric coefficient μ 31 , the thickness h , the length L and the beam width B . Combined with the importance measure theory based on moment independence, the importance measure indexes of the parameters influencing the structural charge output of the flexure electric beam under the condition of an electrical short circuit are calculated, as presented in Table 9 below.
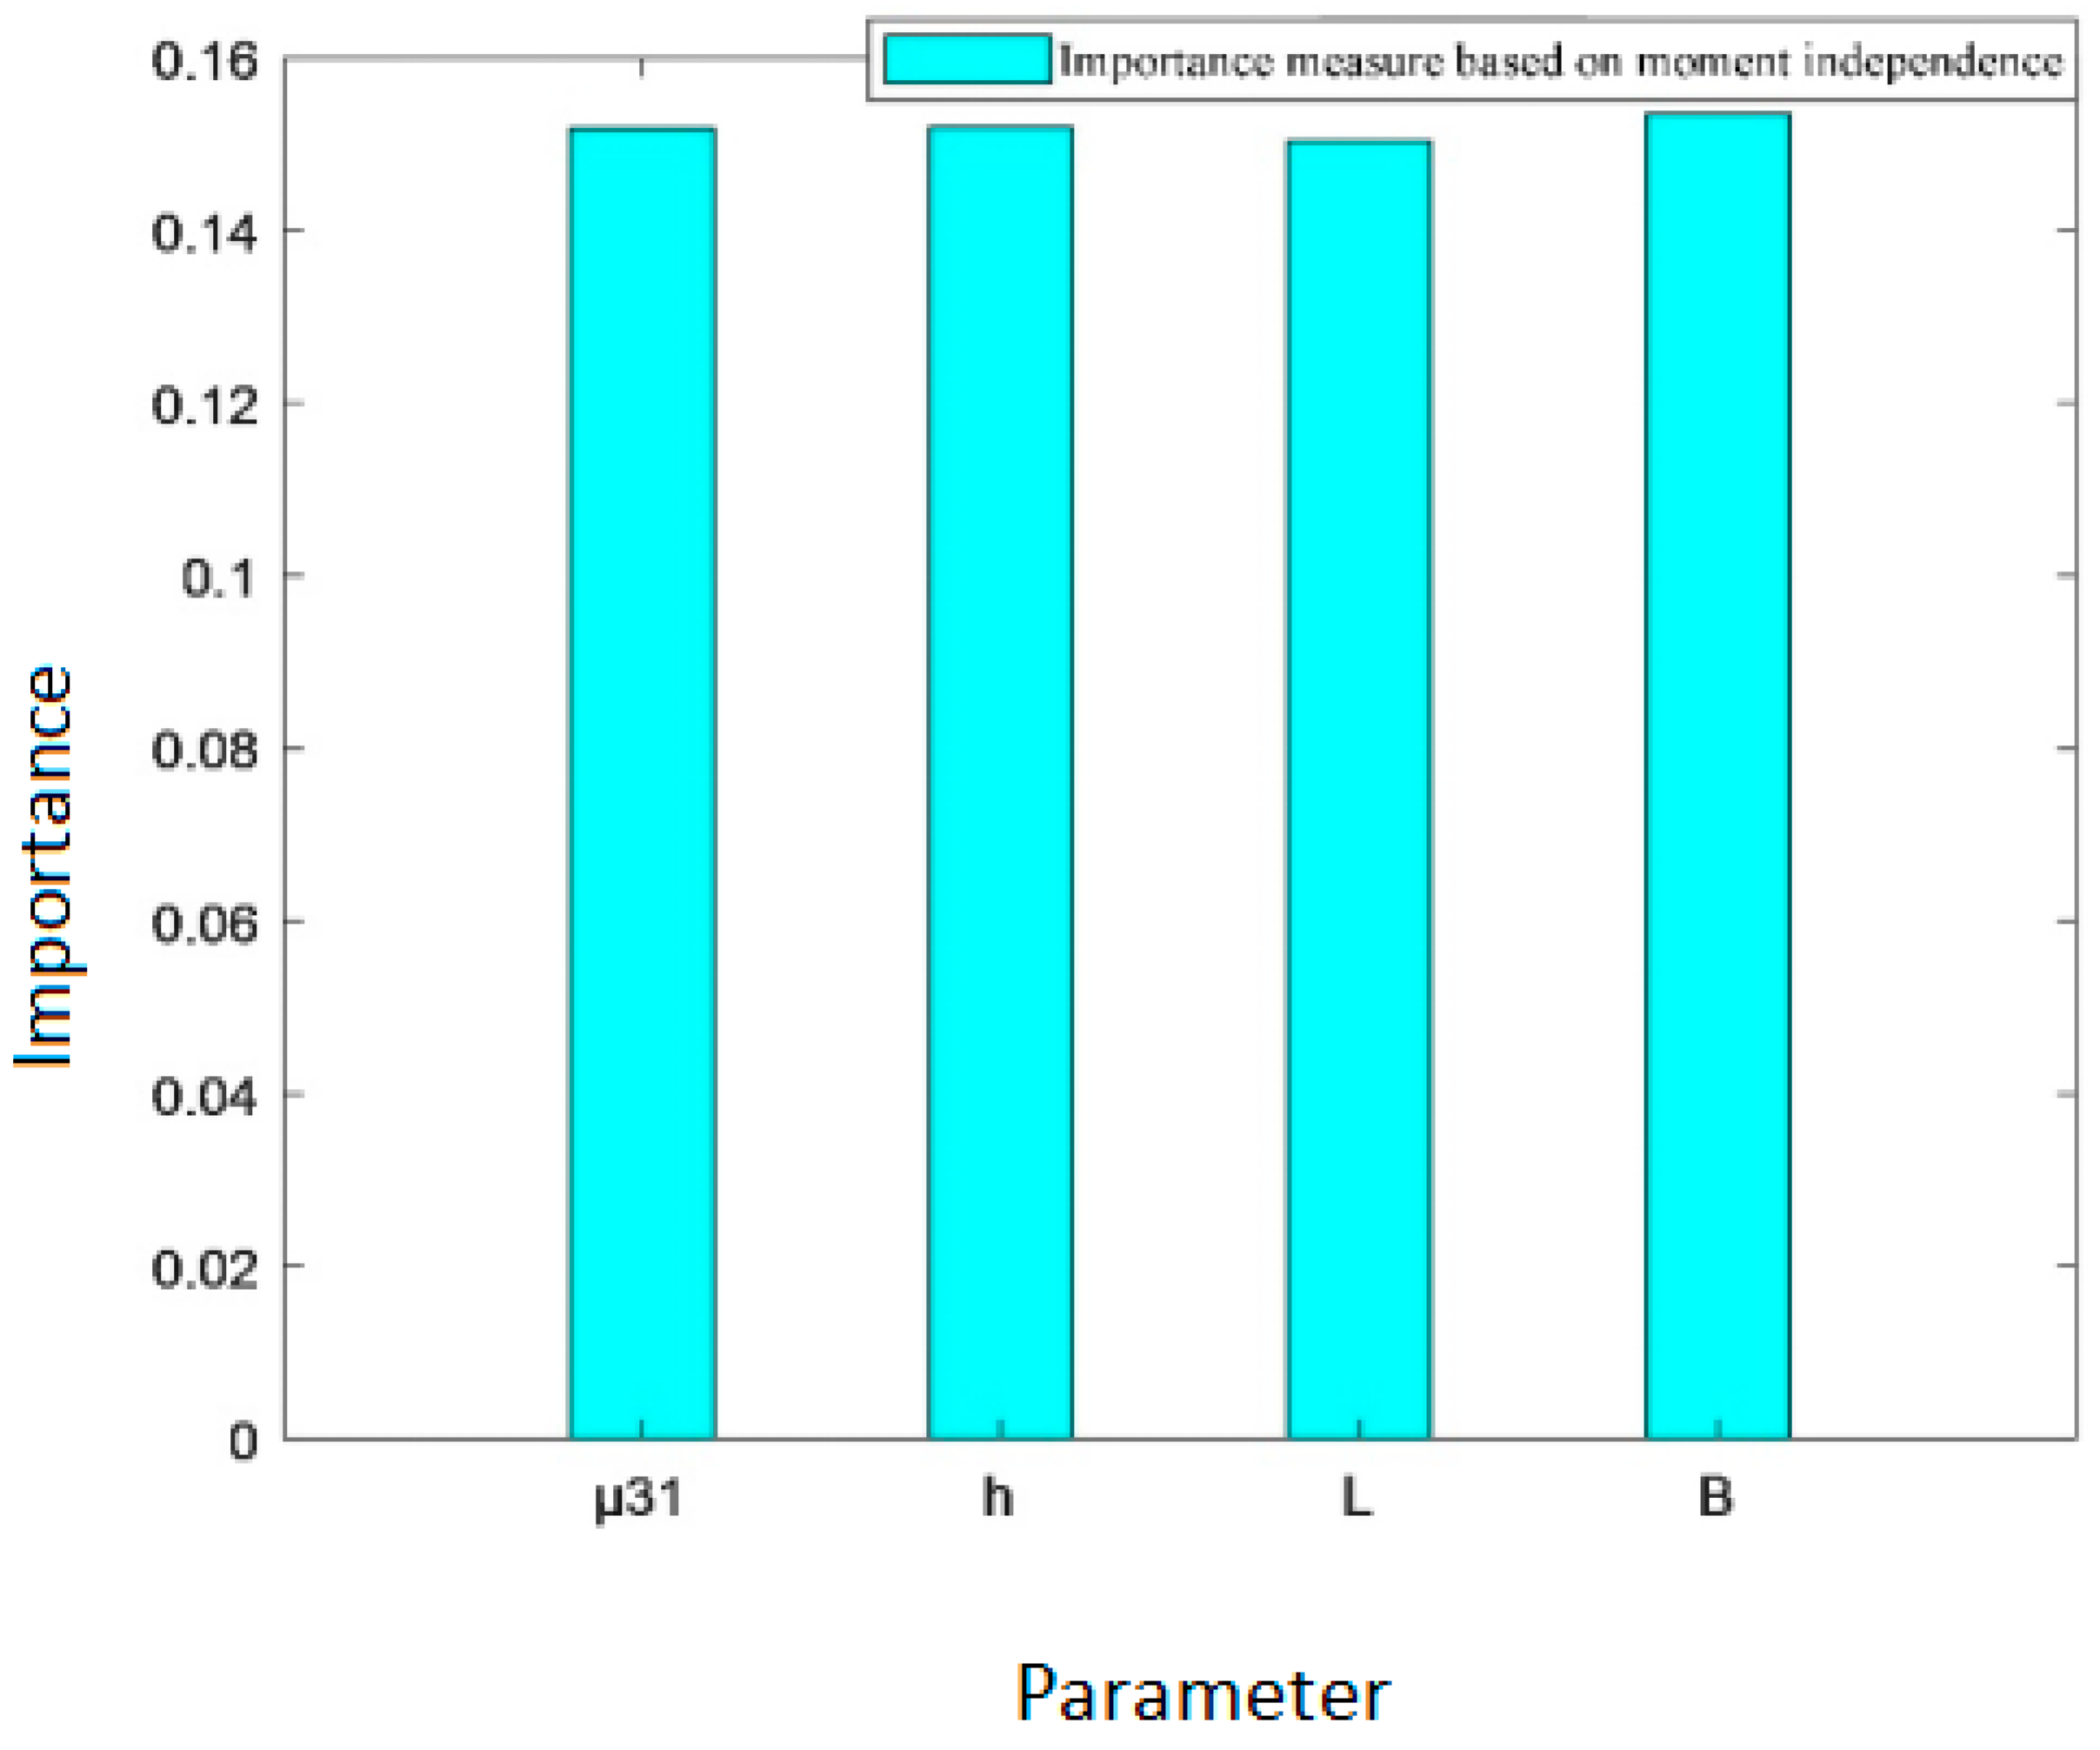
As shown in Table 9, in the electrical short-circuit condition, the ranking of moment independent importance measure is B > h > μ 31 > L . Overall, the values of each index are relatively similar, which is largely consistent with the result given by the variance importance measure in Section 3.2.
As can be intuitively observed from Figure 9, the four parameters, the flexure electric coefficient μ 31 , thickness h , length L and beam width B , exert similar influences on the output charge of the flexure electric beam structure.
3. The importance measure analysis of parameters influencing the effective piezoelectric coefficient of the flexure electric beam under the short-circuit condition
Table 1 presents the corresponding standard deviation and mean of four parameters, namely, the flexure electric coefficient μ 31 , thickness h , length L and Young’s modulus E , respectively. Combined with the importance measure theory based on moment independence, the importance measure indexes of the parameters influencing the effective piezoelectric coefficient of the flexure electric beam structure are calculated, as presented in Table 9 below.
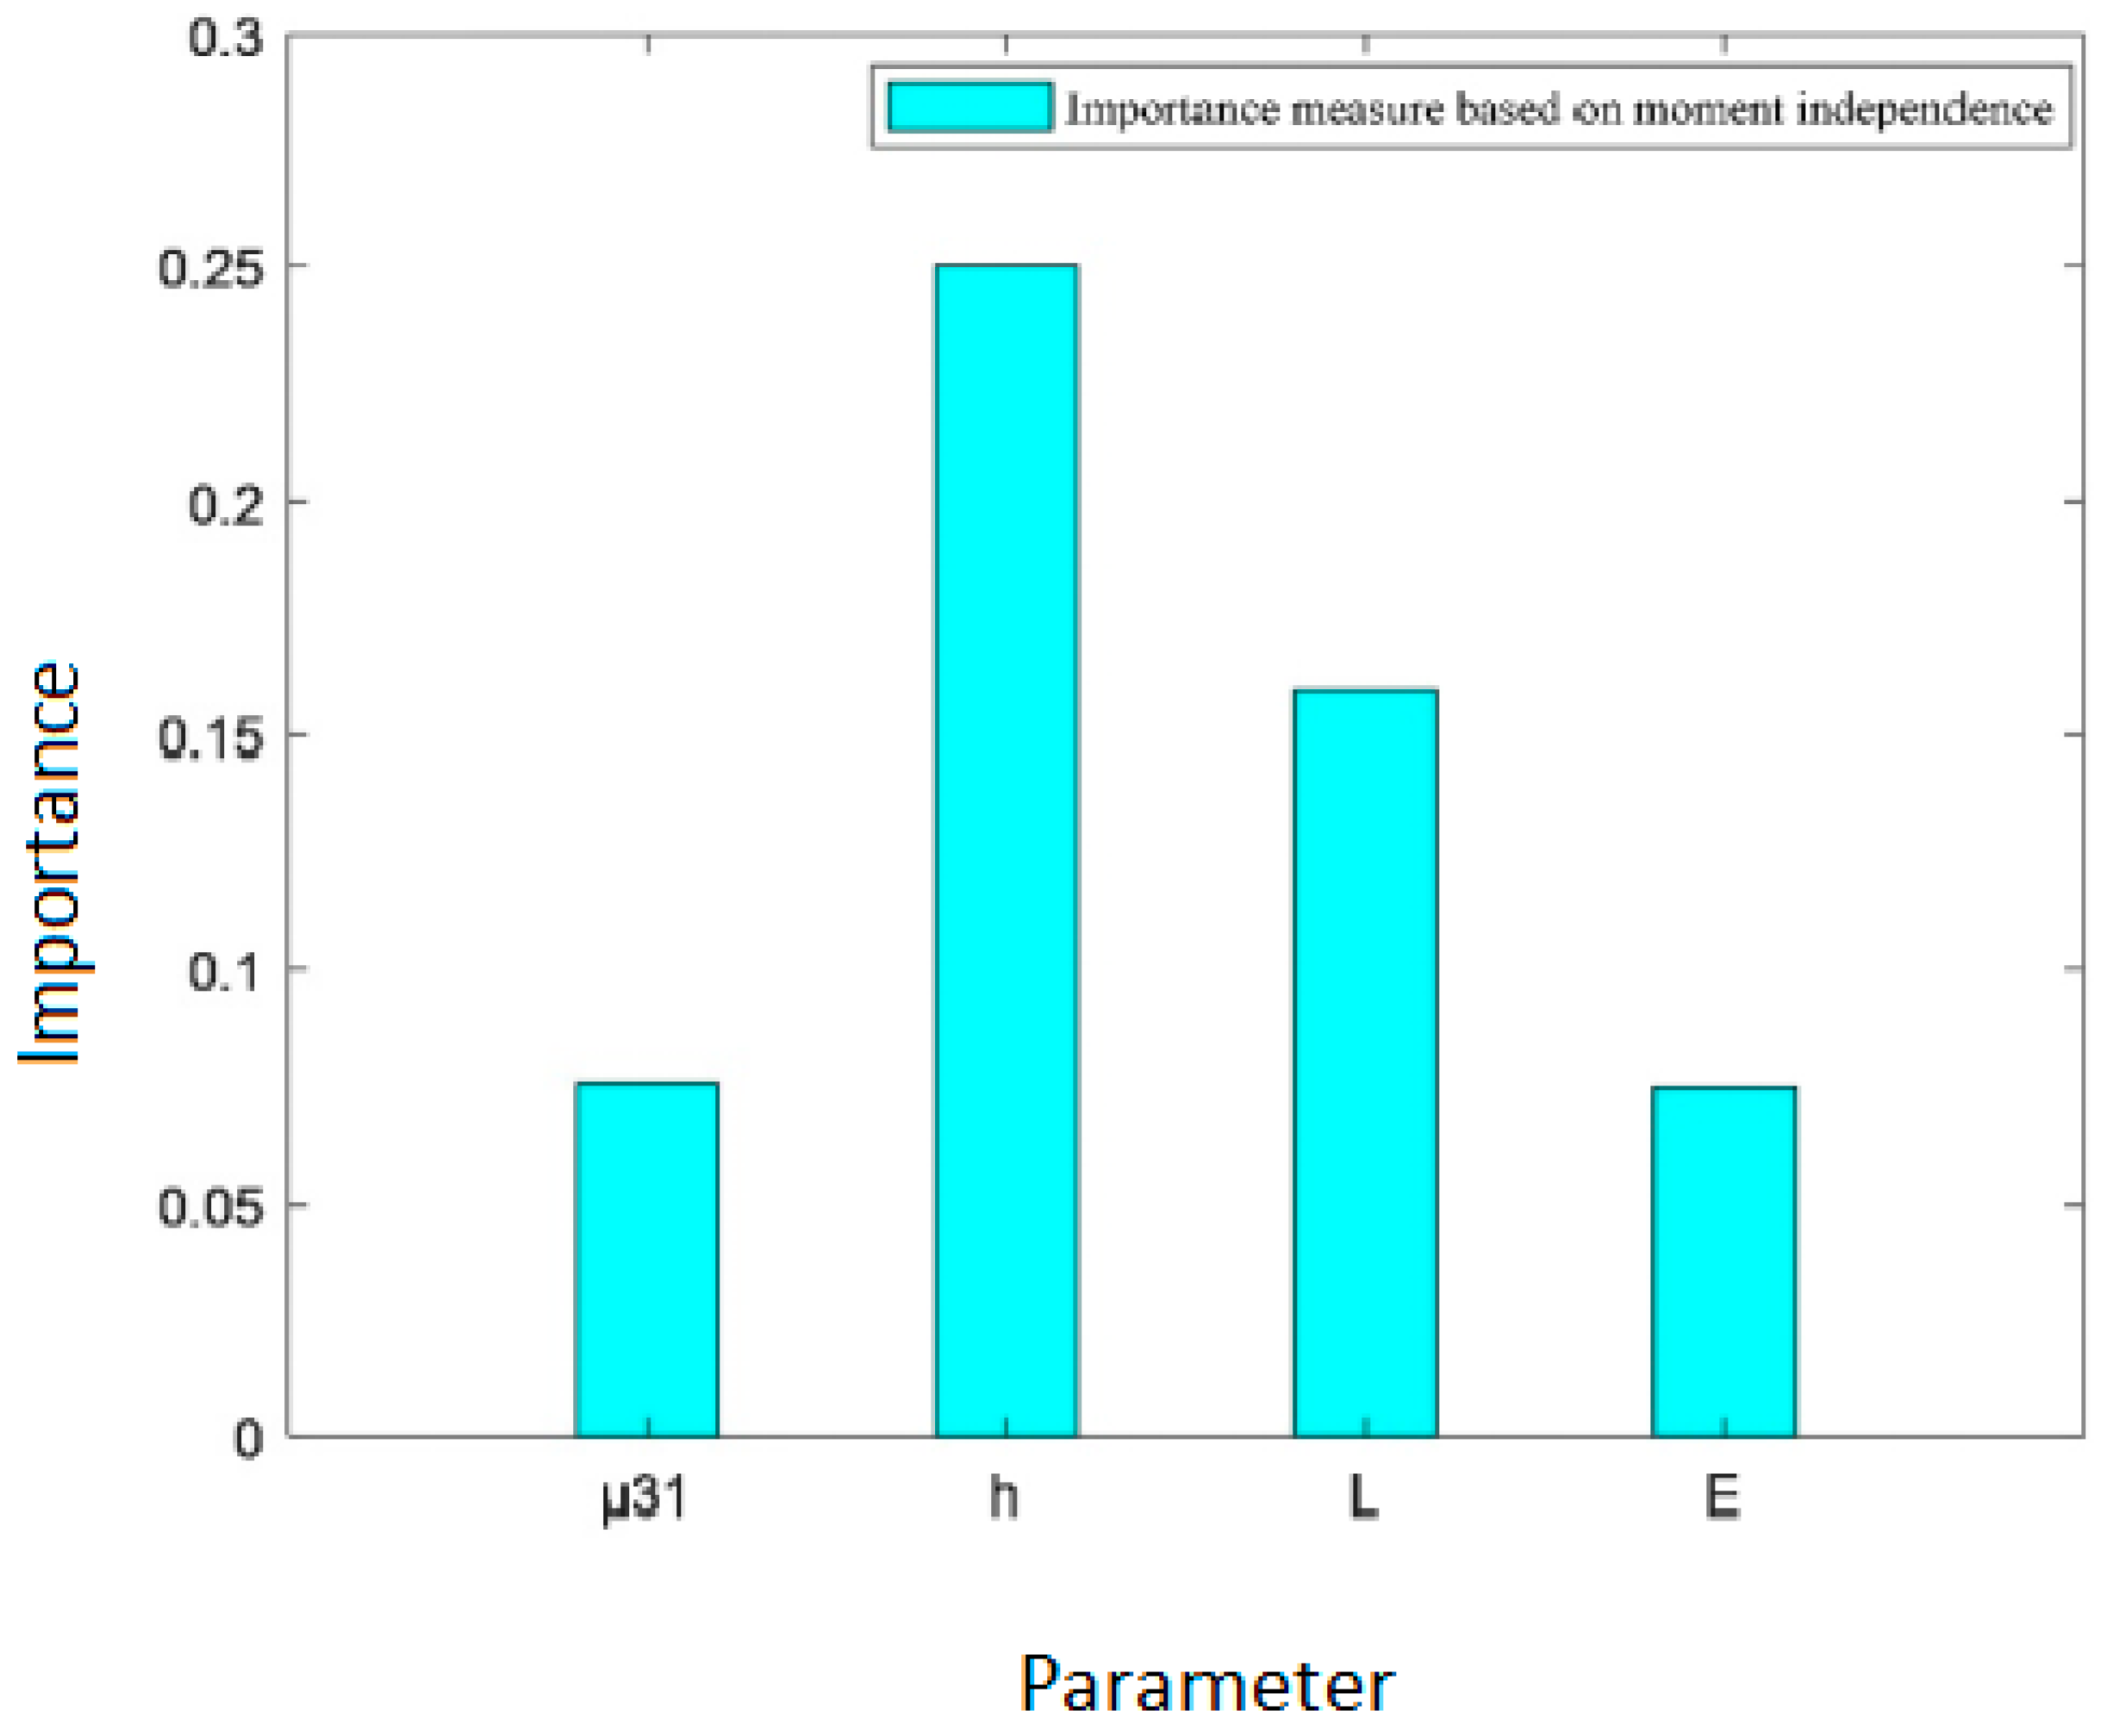
As shown in Table 10, the independent importance measure of effective piezoelectric coefficient d 33 e f f moment is ranked as h > L > μ 31 > E , in which thickness h exerts the greatest influence, followed by length L , and the flexure electric coefficient μ 31 and Young’s modulus E have relatively minor effects. This is basically consistent with the result given by the variance importance measure in Section 3.1.
As can be intuitively observed from Figure 10, thickness h , length L , the flexure electric coefficient μ 31 , Young’s modulus E have almost identical influence.
As can be intuitively observed from Figure 11, thickness h exerts the greatest influence, followed by length L , while the flexure electric coefficient μ 31 and Young’s modulus E have relatively minor effects.
This chapter uses the method of moment-independent importance measurement analysis to verify the results of variance-based importance measurement analysis. The results show that the key factors influencing the output voltage of the flexure electric beam are its length and the thickness of the beam. The key factors affecting the output charge of a flexure electric beam include its elastic coefficient, thickness, length, and width. Among them, the length and thickness of the beam are the main factors determining its effective piezoelectric coefficient. Therefore, when designing the flexure electric beam structure, it is crucial to choose its length and thickness reasonably to improve the output response performance of the electric beam.

5. Conclusions

This study takes the output voltage under an open-circuit state, the output charge under a short-circuit state, and the effective piezoelectric coefficient as output response indicators, and evaluates their importance through variance analysis. This study systematically explores the influence of various parameters of the flexure electric beam structure on the output voltage, charge, and effective piezoelectric coefficient, and determines the key parameters that affect the output performance of the flexure electric beam structure through importance ranking. In addition, the moment-independent importance measurement analysis method was used to verify the variance analysis results, and the following conclusions were ultimately drawn:
In the open-circuit condition, the value of the importance measure index corresponding to the length L and thickness h of the flexure electric beam is far greater than those of the dielectric coefficient a 33 and the flexure electric coefficient μ 31 . This indicates that among the four parameters, the key parameters influencing the output voltage of the flexure electric beam structure are length L and thickness h .
In the short-circuit condition, the four parameters, the flexure electric coefficient μ 31 , thickness h , length L and beam width B , have similar influences on the output charge. If the output charge of the flexure electric beam needs to be increased, the above four parameters should be comprehensively considered.
For the effective piezoelectric coefficient, the influencing factors are the four parameters: the flexure electric coefficient μ 31 , the thickness h , the length L and Young’s modulus E . The importance of the effective piezoelectric coefficient of the flexure electric beam structure is in the order of h > L > μ 31 > E . Thickness h exerts the greatest influence on the effective piezoelectric coefficient, followed by length. In contrast, the influences of Young’s modulus E and the flexure electric coefficient μ 31 are relatively minor.
In addition, the results produced by the moment-independent importance measure analysis method are consistent with the aforementioned results, which further verifies the accuracy of this study. When designing the flexure electric beam structure, selecting the appropriate length and thickness is crucial for enhancing the output performance of the flexure electric beam. Based on the analysis of variance importance measures, this study identifies the key control parameters for the output performance of a polymorphic flexoelectric beam: the open-circuit voltage is primarily influenced by the beam length (L) and thickness (h), and precise control of their dimensional tolerances should be prioritized in design; the short-circuit charge is comprehensively affected by the flexoelectric coefficient (μ31), thickness (h), length (L), and width (B), and collaborative optimization is required to enhance the charge output; the effective piezoelectric coefficient is highly sensitive to thickness, and its dimensional fine-tuning can significantly regulate piezoelectric performance. This conclusion is consistent with the verification using the moment independence method, providing direct guidance for the reliable design of flexoelectric structures in sensors/energy harvesters—strict control of beam thickness and aspect ratio should be implemented during manufacturing, and parameter coupling optimization should be utilized to achieve stable electrical signal output at the macroscale.
The Sobol sensitivity ranking (dominated by thickness h and length L) in this study shows a deviation of <8% from the measured dφ/dh and dQ/dL slopes of BaTiO3 beams by Ma & Cross et al., indicating that the geometric sensitivity can be directly used for inverse allocation of processing tolerances. In the future, injecting the measured μ31 and a33 distributions back into the model to form a closed-loop “experiment-simulation” system, and introducing a grain boundary/fatigue degradation sub-model to extend the current static variance framework to joint optimization of lifetime and reliability, in order to support the large-scale design of nano-scale flexible sensing devices, is planned.
This paper does not consider temperature and nonlinear effects. In the future, within a multiphysics coupling framework, experimental calibration of temperature-dependent flexoelectric coefficients and nonlinear constitutive relations of barium titanate can be combined to further evaluate the impact of environmental factors.

Author Contributions

Methodology, F.Z.; validation and writing, Y.X.; investigation, Y.T.; chart production, C.H.; data curation, Y.H. and X.L.; All authors have read and agreed to the published version of the manuscript.

Funding

This research was funded by [The Key R&D Program of Jiangxi Province] grant number [20243BBG71006].

Data Availability Statement

Data is contained within the article.

Acknowledgments

The authors gratefully appreciate the support of the Key R&D Program of Jiangxi Province (20243BBG71006).

Conflicts of Interest

The authors declare no conflict of interest.

References

  1. Bera, S.; Guerin, S.; Yuan, H.; O’Donnell, J.; Reynolds, N.P.; Maraba, O.; Ji, W.; Shimon, L.J.W.; Cazade, P.-A.; Tofail, S.A.M.; et al. Molecular engineering of piezoelectricity in collagen-mimicking peptide assemblies. Nat. Commun. 2021, 12, 2634. [Google Scholar] [CrossRef]
  2. Wu, C.; Niu, R. Current research status of electrorheological fluids and electrorheological effects. Commun. Power Technol. 2020, 37, 163–165. [Google Scholar]
  3. Han, T.; Liu, H.; Wang, J.; Gao, C.; Han, Y. Electrostrictive Effect of Materials under High Pressure Revealed by Electrochemical Impedance Spectroscopy. J. Phys. Chem. 2021, 125, 8788–8793. [Google Scholar] [CrossRef]
  4. Gupta, N.; Pandey, A.; Vanjari, S.R.K.; Dutta, S. Influence of residual stress on performance of AIN thin film based piezoelectric MEMS accelerometer structure. Microsyst. Technol. 2019, 25, 3959–3967. [Google Scholar] [CrossRef]
  5. Shu, L.; Liang, R.; Yu, Y.; Huang, W.; Wei, X.; Li, F.; Jiang, X.; Yao, X.; Wang, Y. Flexoelectric effects in crystalline materials: Current situation and prospects. Mod. Technol. Ceram. 2018, 39, 223–246. [Google Scholar]
  6. Friswell, M.I.; Adhikari, S. Sensor shape design for piezoelectric cantilever beams to harvest vibration energy. J. Appl. Phys. 2010, 108, 014901. [Google Scholar] [CrossRef]
  7. Yang, X.; Zhou, Y.; Wang, B.; Zhang, B. A finite-element method of flexoelectric effects on nanoscale beam. Int. J. Multiscale Comput. Eng. 2019, 17, 545–552. [Google Scholar] [CrossRef]
  8. Omidian, R.; Beni, Y.T.; Mehralian, F. Analysis of size-dependent smart flexoelectric nanobeams. Eur. Phys. J. Plus 1 2017, 132, 481. [Google Scholar] [CrossRef]
  9. Mao, S.; Purohit, P.K.; Aravas, N. Mixed finite-element formulations in piezoelectricity and flexoelectricity. Proc. R. Soc. A Math. Phys. Eng. Sci. 2016, 472, 20150879. [Google Scholar] [CrossRef]
  10. Bhaskar, U.K.; Banerjee, N.; Abdollahi, A.; Wang, Z.; Schlom, D.G.; Rijnders, G.; Catalan, G. A flexoelectric microelectromechanical system on silicon. Nat. Nanotechnol. 2016, 11, 263–266. [Google Scholar] [CrossRef]
  11. Zhang, H.; Hua, T.; Wang, C. Research progress of flexural effect and its application. J. Ceram. 2023, 51, 812–830. [Google Scholar]
  12. Chen, W. Forced Vibration Analysis and Grain Size Effect of a Flexoelectric Beam. Master’s Thesis, Xi’an JiaoTong University, Xi’an, China, 2021. [Google Scholar]
  13. Wang, B.; Gu, Y.; Zhang, S.; Chen, L. Flexoelectricity in solids: Progress, challenges, and perspectives. Prog. Mater. Sci. 2019, 106, 100570. [Google Scholar] [CrossRef]
  14. Ahmadpoor, F.; Sharma, P. Flexoelectricity in two-dimensional crystalline and biological membranes. Nanoscale 2015, 7, 16555–16570. [Google Scholar] [CrossRef] [PubMed]
  15. Zhu, J.; Chen, T.; Shu, L.; Wang, Z.; Huang, W.; Fei, L.; Li, F.; Rao, Z.; Ke, S.; Li, B.; et al. Flexoelectric fatigue in (K,Na,Li)(Nb,Sb)O3 ceramics. Appl. Phys. Lett. 2018, 113, 182901. [Google Scholar] [CrossRef]
  16. Krichen, S.; Sharma, P. Flexoelectricity: A Perspective on an Unusual Electromechanical Coupling. J. Appl. Mech. 2016, 83, 030801. [Google Scholar] [CrossRef]
  17. Abdollahi, A.; Vásquez-Sancho, F.; Catalan, G. Piezoelectric Mimicry of Flexoelectricity. Phys. Rev. Lett. 2018, 121, 205502. [Google Scholar] [CrossRef]
  18. Wei, P.; Lu, Z.; Hao, W.; Feng, J.; Wang, B. Efficient sampling methods for global reliability sensitivity analysis. Comput. Phys. Commun. 2012, 183, 1728–1743. [Google Scholar] [CrossRef]
  19. Saltelli, A. Sensitivity analysis for importance assessment. Risk Anal. 2002, 22, 579–590. [Google Scholar] [CrossRef]
  20. Bjerager, P.; Krenk, S. Parametric Sensitivity in First Order Reliability Theory. J. Eng. Mech. 1989, 115, 1577–1582. [Google Scholar] [CrossRef]
  21. Campolongo, F.; Saltelli, A. Sensitivity analysis of an environmental model: An application of different analysis methods. Reliab. Eng. Syst. Saf. 1997, 57, 49–69. [Google Scholar] [CrossRef]
  22. Borgonovo, E.; Hazen, G.B.; Plischke, E. A Common Rationale for Global Sensitivity Measures and Their Estimation. Risk Anal. 2016, 36, 1871–1895. [Google Scholar] [CrossRef]
  23. Borgonovo, E.; Plischke, E. Sensitivity analysis: A review of recent advances. Eur. J. Oper. Res. 2016, 248, 869–887. [Google Scholar] [CrossRef]
  24. Iooss, B.; Lemaître, P. A review on global sensitivity analysis methods. In Uncertainty Management in Simulation-Optimization of Complex systems: Algorithms and Applications; Dellino, G., Meloni, C., Eds.; Springer: Boston, MA, USA, 2015; pp. 101–122. [Google Scholar]
  25. Wei, P.; Lu, Z.; Song, J. Variable importance analysis: A comprehensive review. Reliab. Eng. Syst. Saf. 2015, 142, 399–432. [Google Scholar] [CrossRef]
  26. Chabridon, V. Analyse de Sensibilité Fiabiliste Avec Prise en Compte d’ Incertitudes sur le Modèle Probabiliste-Application aux Systèmes Aérospatiaux. Ph.D. Thesis, Université Clermont Auvergne (2017–2020), Clermont-Ferrand, France, 2018. [Google Scholar]
  27. Maume-Deschamps, V.; Niang, I. Estimate of quantile-oriented sensitivity indices. Stat. Probab. Lett. 2017, 134, 122–127. [Google Scholar] [CrossRef]
  28. Lemaître, P.; Sergienko, E.; Arnaud, A.; Bousquet, N.; Gamboa, F.; Iooss, B. Density modification-based reliability sensitivity analysis. J. Stat. Comput. Simul. 2015, 85, 1200–1223. [Google Scholar] [CrossRef]
  29. Perrin, G.; Defaux, G. Efficient evaluation of reliability-oriented sensitivity indices. J. Sci. Comput. 2019, 79, 1433–1455. [Google Scholar] [CrossRef]
  30. Yun, W.; Lu, Z.; Jiang, X. An efficient method for moment-independent global sensitivity analysis by dimensional reduction technique and principle of maximum entropy. Reliab. Eng. Syst. Saf. 2019, 187, 174–182. [Google Scholar] [CrossRef]
  31. Li, H.; Zhao, J.; Guo, X.; Cheng, Y.; Xu, Y.; Yuan, X. Sensitivity analysis of flexoelectric materials surrogate model based on the isogeometric finite element method. Front. Phys. 2022, 10, 1111159. [Google Scholar] [CrossRef]
  32. Ma, W.; Cross, L.E. Flexoelectricity of Barium titanate. Appl. Phys. Lett. 2006, 88, 232902. [Google Scholar] [CrossRef]
  33. Ebrahimi, F.; Barati, M.R. Surface and flexoelectricity effects on size-dependent thermal stability analysis of smart piezoelectric nanoplates. Struct. Eng. Mech. Int. J. 2018, 67, 143–153. [Google Scholar]
  34. Lv, Z.; Song, S.; Li, H. Reliability and Reliability Sensitivity Analysis of Structural Mechanism; Science Press: Beijing, China, 2009. [Google Scholar]
  35. Sun, X.; Croke, B.; Roberts, S.; Jakeman, A. Comparing methods of randomizing Sobol′ sequences for improving uncertainty of metrics in variance-based global sensitivity estimation. Reliab. Eng. Syst. Saf. 2021, 210, 107499. [Google Scholar] [CrossRef]
  36. Derennes, P.; Morio, J.; Simatos, F. Simultaneous estimation of complementary moment independent and reliability-oriented sensitivity measures. Math. Comput. Simul. 2021, 182, 721–737. [Google Scholar] [CrossRef]
  37. Helton, J.C.; Davis, F.J. Latin hypercube sampling and the propagation of uncertainty in analyses of complex systems. Reliab. Eng. Syst. Saf. 2003, 81, 23–69. [Google Scholar] [CrossRef]
  38. Zhang, K. Sensitivity analysis of stochastic and fuzzy structural systems based on variance. Ph.D. Thesis, Northwestern Polytechnical University, Xi’an, China, 2018. [Google Scholar]
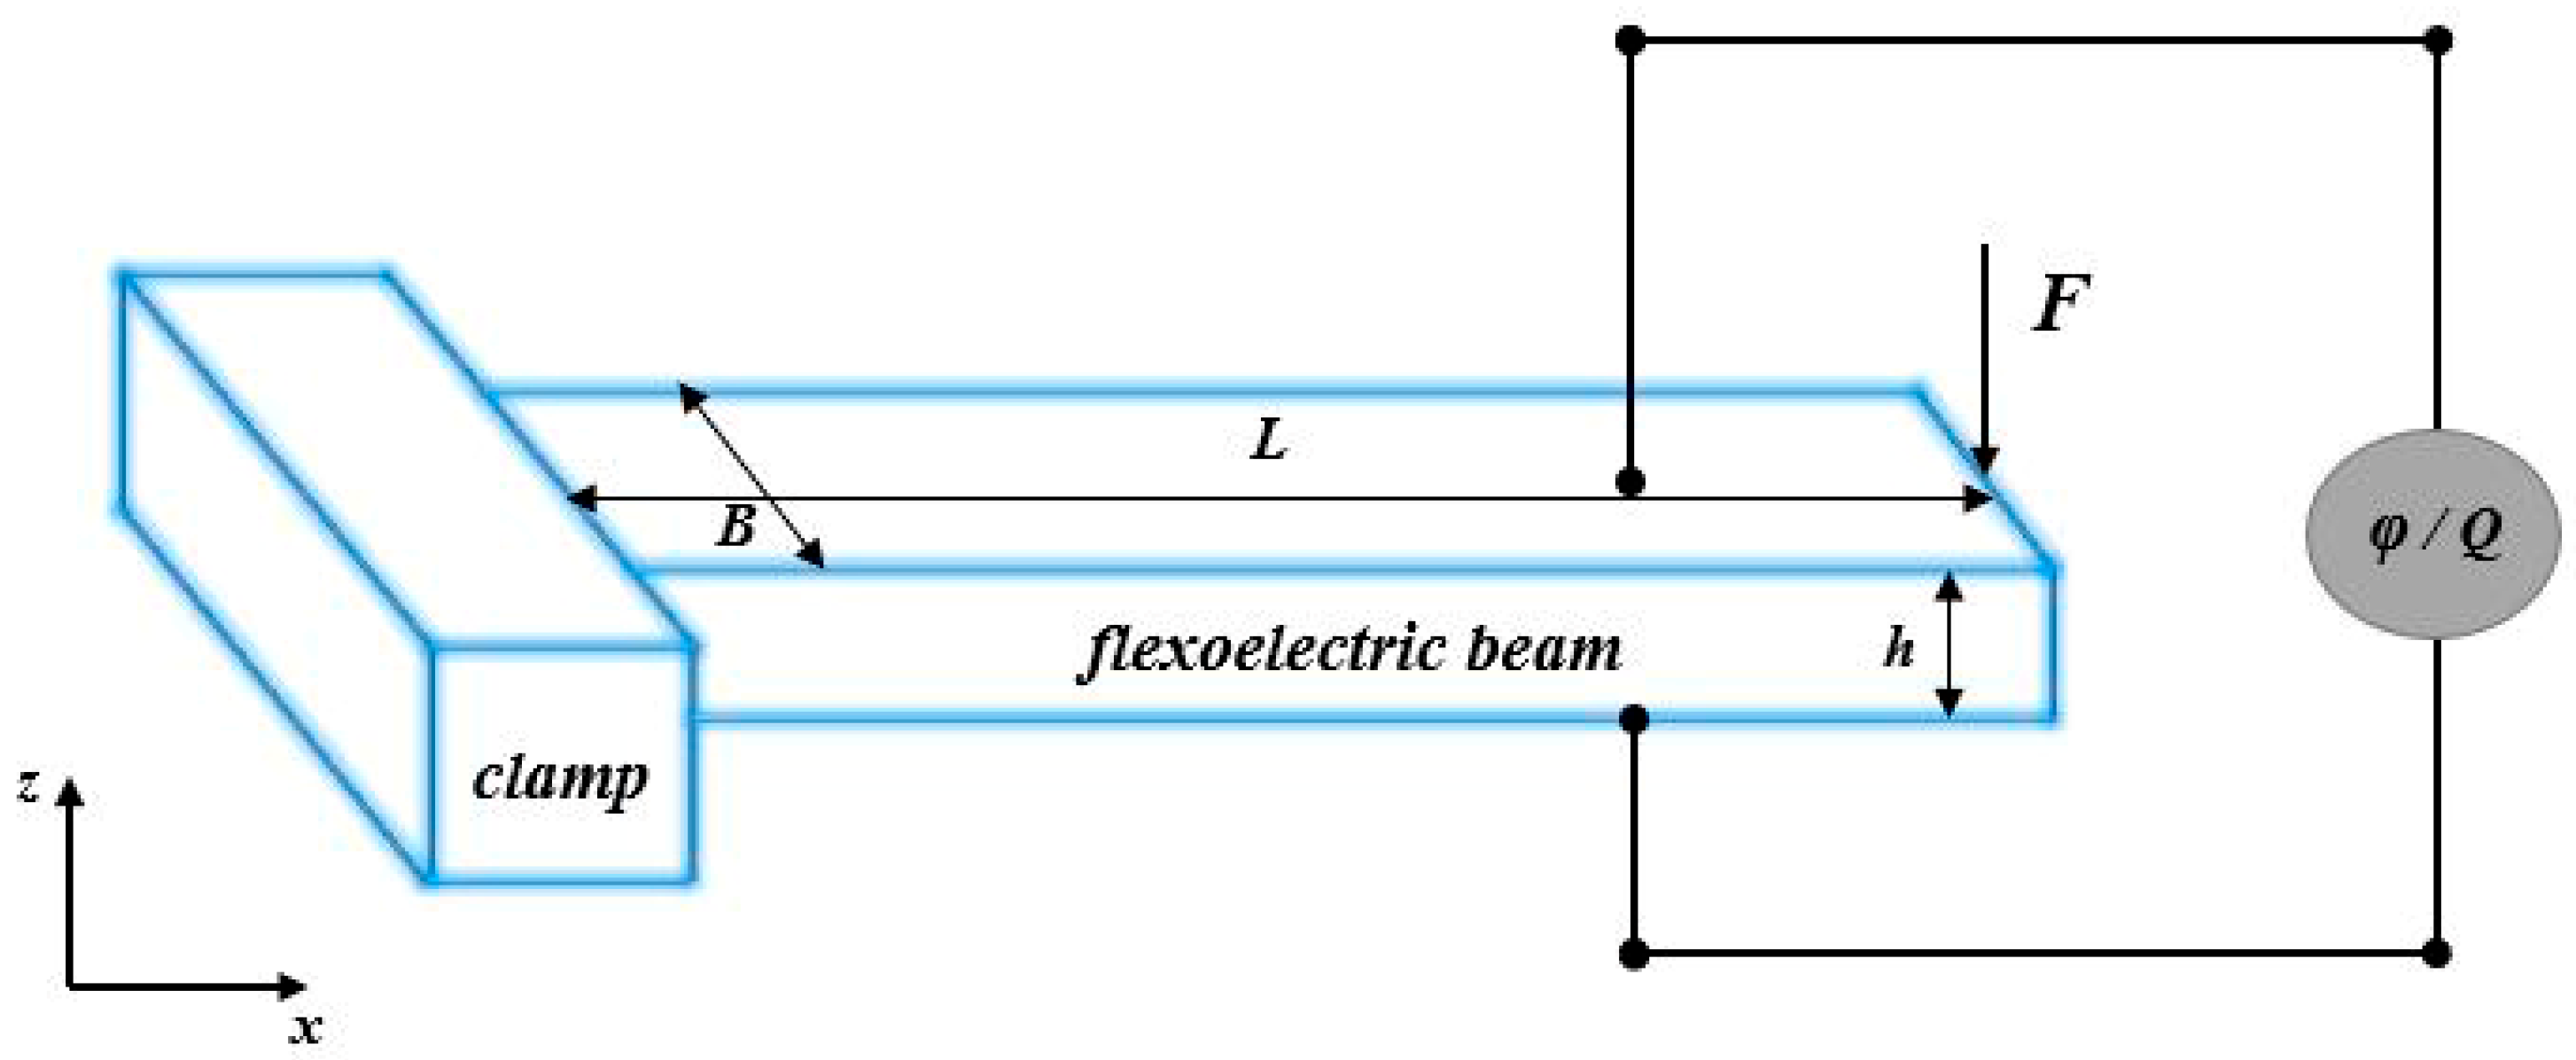
Figure 1. Diagram of deflection beam deformation and output signal.
Electronics 14 03481 g001
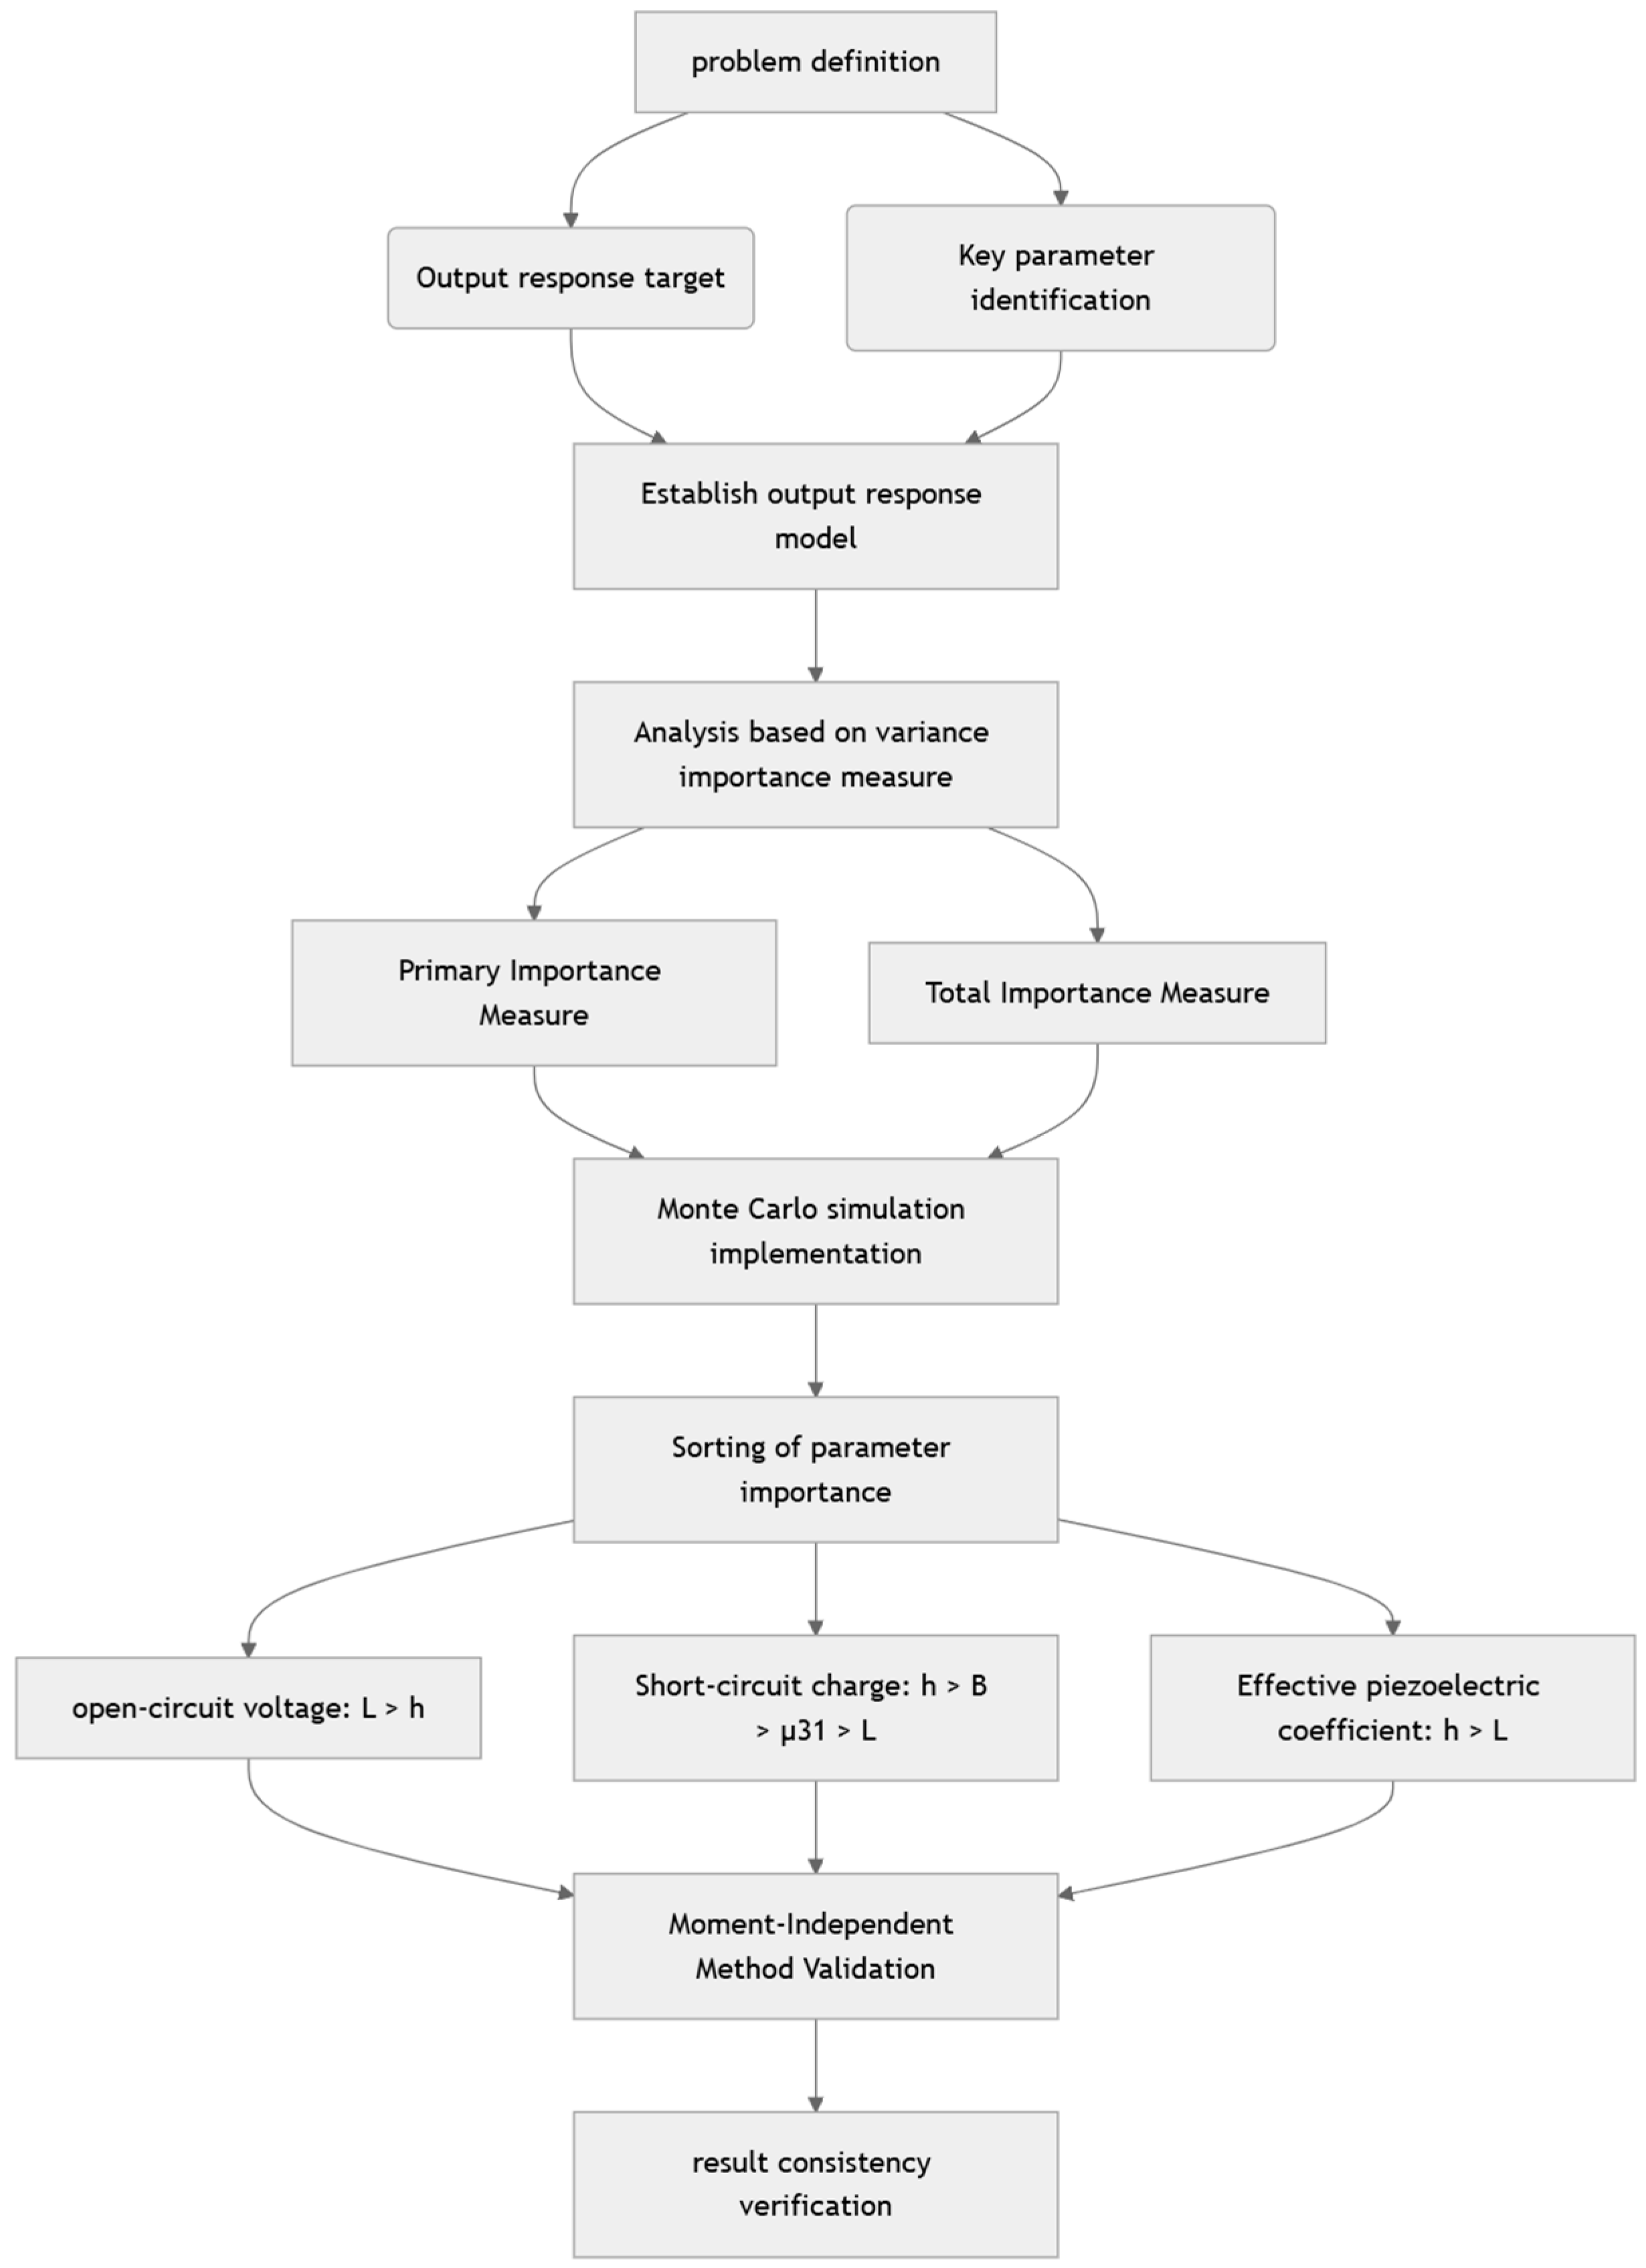
Figure 2. Importance analysis process.
Electronics 14 03481 g002
Figure 3. Bar chart of main importance measure of flexure electric beam parameters to output voltage φ q u a s i .
Electronics 14 03481 g003
Figure 4. Bar chart of total importance measure of flexure electric beam parameters to output voltage φ q u a s i .
Electronics 14 03481 g004
Figure 5. Bar chart of main importance measure of flexure electric beam parameters to output charge Q q u a s i .
Electronics 14 03481 g005
Figure 6. Bar chart of total importance measure of flexure electric beam parameters to output charge Q q u a s i .
Electronics 14 03481 g006
Figure 7. Column chart of main importance measure of flexure electric beam structure to the effective piezoelectric coefficient d 33 e f f .
Electronics 14 03481 g007
Figure 8. Bar chart of total importance measure of flexure electric beam parameters to the effective piezoelectric coefficient d 33 e f f .
Electronics 14 03481 g008
Figure 9. Bar chart of importance measure of flexure electric beam parameters to output voltage φ q u a s i .
Electronics 14 03481 g009
Figure 10. Bar chart of importance measure of flexure electric beam parameters to output charge Q q u a s i .
Electronics 14 03481 g010
Figure 11. Bar chart of importance measure of flexure electric beam parameters to the effective piezoelectric coefficient d 33 e f f .
Electronics 14 03481 g011
Table 1. Distribution of structural parameters of a flexure electric beam.
Parameter NameParameter SymbolVariableUnitDistributionMean ValueStandard Deviation
Flexure electric coefficient μ 31 x 1 μ C / m Normal
distribution
10 2 × 10 10
Beam thickness h x 2 m Normal
distribution
1 × 10 3 2 × 10 7
Dielectric coefficient a 33 x 3 C / ( V · m ) Normal
distribution
0.79 × 10 8 1.58 × 10 17
Beam length L x 4 m Normal
distribution
2 × 10 2 4 × 10 5
Young’s modulus E x 5 G p a Normal
distribution
131 2.62 × 10 9
Beam width B x 6 m Normal
distribution
2 × 10 3 2 × 10 7
Table 2. Main importance measure of flexure electric beam parameters on output voltage φ q u a s i .
Variable μ 31 h a 33 L
Main importance measure S x i 0.07460.37010.06620.3769
Table 3. Total importance measure of flexure electric beam parameters to output voltage φ q u a s i .
Variable μ 31 h a 33 L
Total importance measure S x i T 0.02410.37310.03230.3715
Table 4. Main importance measure of flexure electric beam parameters on output charge Q q u a s i .
Variable μ 31 h L B
Main importance measure S x i T 0.27680.30160.25920.2892
Table 5. Total importance measure of flexure electric beam parameters on output charge Q q u a s i .
Variable μ 31 h L B
Total importance measure S x i T 0.30890.28250.32820.2952
Table 6. Main importance measure of flexure electric beam parameters on effective piezoelectric coefficient d 33 e f f .
Variable μ 31 h L E
Main importance measure S x i T 0.05710.59650.26160.0557
Table 7. Total importance measure of flexure electric beam parameters to effective piezoelectric coefficient d 33 e f f .
Variable μ 31 h L E
Total importance measure S x i T 0.04700.59910.24980.0485
Table 8. Importance measure indexes of flexure electric beam parameters to output voltage φ q u a s i .
Variable μ 31 h a 33 L
Importance measure index0.09290.20070.09340.1997
Table 9. The importance measure index of the flexed beam parameters to the output charge Q q u a s i .
Variable μ 31 h L B
Importance measure index0.15190.15200.15040.1535
Table 10. The importance measure of flexure electric beam parameters to effective piezoelectric coefficient d 33 e f f .
Variable μ 31 h L E
Importance measure index0.07530.25020.15940.0745
Disclaimer/Publisher’s Note: The statements, opinions and data contained in all publications are solely those of the individual author(s) and contributor(s) and not of MDPI and/or the editor(s). MDPI and/or the editor(s) disclaim responsibility for any injury to people or property resulting from any ideas, methods, instructions or products referred to in the content.