Article

Temperature Compensation for Chromatic Stability of RGBW LEDs in Automotive Interior Lighting

1
DII—Dipartimento di Ingegneria dell’Informazione, Università Politecnica delle Marche, Via Brecce Bianche 12, 60131 Ancona, Italy
2
Automotive Smart Power, Infineon Technologies Italia Srl, Via Niccolo Tommaseo 65/B, 35131 Padova, Italy
*
Author to whom correspondence should be addressed.
Electronics 2025, 14(17), 3451; https://doi.org/10.3390/electronics14173451
Submission received: 31 July 2025 / Revised: 23 August 2025 / Accepted: 27 August 2025 / Published: 29 August 2025

Abstract

Automotive interior lighting has progressed from basic functional illumination to sophisticated aesthetic systems emphasizing chromatic stability under thermal variations. This study enhances an RGB temperature compensation algorithm for LEDs, extending it to an RGBW solution. While several approaches for LED temperature compensation have been proposed in the literature, none have addressed a complete RGBW solution where the white channel is derived and actively adjusted on thermal variations. This research aims to fill this gap by extending an RGB algorithm to RGBW and validating it under realistic automotive conditions. While the proposed compensation strategies are general and may be applied to other LED systems, the automotive interior lighting domain has been selected as a representative case study because it combines stringent chromatic stability requirements ( Δ u v 0.01 ) and high industrial relevance. Leveraging Infineon’s LITIX™ LED drivers, experimental results show that the algorithm maintains chromatic stability with deviations below Δ u v = 0.00562 in RGB mode and Δ u v = 0.0067 in RGBW mode across the tested temperature range. The addition of the white channel improves the color rendering index (CRI) by up to 58.9 points (from 19.7 to 78.6) while preserving color quality. Compared to previous works limited to RGB systems, our approach provides the first practical RGBW compensation algorithm experimentally validated under realistic automotive conditions.

1. Introduction

In modern times, interior automotive lighting has experienced a significant transformation, evolving from an exclusively functional component to an essential contributor to the overall driving experience. No longer limited to providing visibility only, interior lighting now plays an essential role in defining the vehicle’s aesthetic, enhancing perceived comfort, and reinforcing brand identity. Once exclusive to high-end vehicles, ambient lighting has steadily permeated the mid- and low-range market segments, demonstrating itself as a new industry standard.
Today, interior lighting has become a true interface between humans and the vehicle. It no longer consists of static or isolated light sources but has evolved into a more complex integrated system that contributes to what is now called the lighting experience. This includes advanced functionalities such as multicolor ambient lighting, animated welcome and goodbye scenarios, driving-mode-based color shifts, and even high-resolution projections on interior surfaces. These elements improve the vehicle’s perceived quality, reinforce its brand identity, and most importantly, can contribute to both driver alertness and passenger comfort [1].
A key technical challenge in this evolution is maintaining color stability under wide temperature variations. In automotive interior systems, LEDs are expected to operate reliably across a broad thermal range (–20 °C to +85 °C) or more. Within this range, chromatic deviations must remain below Δ u v = 0.01 to avoid perceivable color shifts. Furthermore, a high color rendering index (CRI) is typically required to ensure both visual comfort and compliance with industry standards. As Light Emitting Diode (LED) technology has evolved, so too has the demand for precision and consistency in light quality, especially in the face of thermal shifts that are typical in automotive environments. Color stability becomes a critical parameter when ensuring that the lighting remains visually appealing and uniform under all operating conditions and temperatures. To address this, temperature compensation algorithms have been developed to mitigate the effects of thermal drifts in RGB and RGBW (Red, Green, Blue, White) LEDs, the latter of which incorporate an additional white channel to enhance the CRI and the overall quality of the emitted light.
The current literature offers a variety of approaches to LED temperature compensation, each targeting specific systems or use cases [2,3,4,5,6,7,8]; recently, also for the specific automotive case [3,9,10,11]. However, none of the reviewed studies provides a complete solution for RGBW systems where the white channel must be actively derived and regulated to maintain color stability under temperature variation.
This work addresses this gap by improving and validating an RGBW temperature compensation algorithm, starting from the implementation of an RGB algorithm and introducing enhancements to support RGBW while maintaining color stability across a wide temperature range. Moreover, the algorithms were optimized to be integrated into the LITIX™ Interior family of LED drivers. Extensive testing and calibration processes were conducted to validate the proposed approach. Therefore, the novelty of this work lies in extending a temperature compensation strategy from RGB to RGBW systems with active regulation of the white channel. Unlike previous studies, the proposed method is experimentally validated under realistic automotive operating conditions, demonstrating chromatic stability ( Δ u v < 0.01 ) and improved CRI performance while meeting the stringent requirements of automotive interior lighting.
Although the proposed temperature compensation algorithms are general and can be applied to a wide range of LED-based lighting systems, this work explicitly focuses on automotive interior lighting. The reason is twofold: first, the automotive domain represents a particularly demanding use case, where wide operating temperature ranges, strict requirements on chromatic stability ( Δ u v 0.01 ), and high CRI are mandatory for both comfort and safety. Second, this sector is currently experiencing rapid adoption of advanced ambient lighting solutions, making it an industrially relevant and timely context in which to validate the proposed methods. By presenting the approach within this specific application domain, the study provides not only a proof of concept under realistic conditions but also a contribution directly aligned with current industrial needs.
This paper is structured as follows: Section 2 begins by introducing some recent works related to the state-of-the-art. Section 3 starts from an overview on the theoretical background related to colorimetry and temperature dependence of LEDs (Section 3.1). Specifically, Section 3.1.1 provides a general overview of color theory. The colorimetry section first introduces color representation through chromaticity diagrams, followed by a focus on the white color, explaining blackbody radiation and the Planckian locus. Part of the chapter is dedicated to color mixing, where a mathematical procedure to obtain a color from a set of primaries (in this case, LEDs) is illustrated. Finally, the topic of color rendering is briefly addressed, with a focus on the CRI. Section 3.1.2 provides a brief explanation on how the LEDs are influenced by temperature, from both electrical and optical points of view.
After the theoretical hints, Section 3 focuses on the RGB temperature compensation algorithm, described in Section 3.2.1. It illustrates the characterization and calibration of the LED used and then details the functioning of the algorithm, both from a theoretical and logical point of view. Section 3.2.2 explains the motivations that led to the evolution toward the improved RGBW version. Finally, Section 3.3 describes the hardware, software and instruments for the implementation, the measurements and the validation of the algorithm.
In Section 4, the results obtained from the temperature validation of both the RGB and RGBW algorithms are presented. Section 5 discusses the obtained results and outlines possible future improvements. Section 6 draws conclusions.

2. Related Works

Recent literature offers a range of approaches to temperature compensation in LED systems. Tao and Liu [2] propose a temperature prediction model (PT-model) and a compensation algorithm on RGB LEDs. Their model uses physical laws such as Fourier’s law of heat conduction and thermal resistance equations to estimate the junction temperature of the LEDs, taking into account multiple factors, including self-heating of the LED and other electronic components, heat transfer through the PCB, and input power to the system. In this way, the temperature is not measured directly on the LED chip, but the internal sensor of the MCU is used. The compensation is then performed by adjusting the final PWM, taking into account variations in luminous flux and chromaticity caused by temperature and aging. Aging has been modeled through an accelerated test.
Hong and Liu [3] likely present an evolution of the previous work by introducing an improved model tailored for low-cost automotive LED chips. Their approach refines the earlier model by optimizing it for deployment on microcontrollers, replacing floating-point arithmetic with a 16.16 fixed-point format to significantly reduce computational overhead. The improved model achieves temperature prediction errors within ±5 °C. Furthermore, a new chromaticity compensation strategy is introduced, where PWM duty cycles are further compensated for correcting a chromaticity shift at low brightness due to the reduced T o n time.
Both works present interesting alternative approaches to temperature estimation that are not based on forward voltage measurements and implement compensation strategies that yielded good results in their respective validation tests. However, these methods are limited to RGB LEDs only and are therefore not directly applicable to systems with RGBW LEDs, where the white channel plays a crucial role in overall luminous output and color rendering.
Among the few studies explicitly addressing RGBW systems, Liu et al. [7] offer an interesting solution based on spectral modeling and multi-objective optimization. Their method relies on experimentally derived spectral power distribution of the four LEDs across temperature points, from which a model is constructed. The authors then use a non-dominated sorting genetic algorithm (NSGA-II) to optimize color output based on correlated color temperature (CCT), color fidelity index (Rf), and color gamut index (Rg). During the real-time operation, the temperature is measured via a sensor on the LED board, and compensation is applied by querying a precomputed lookup table stored in the microcontroller. This compensation method proves to be highly accurate, with deviations of less than 10 K in CCT and less than 4% in Rf and Rg within the (2000–7000) K range. However, their solution assumes complete knowledge of spectral behavior and does not specify how the RGB and white channels should be derived in real time from a known color point.
In [4], Ren et al. present a new RGBW color mixing method for LED stage lighting. The method integrates white LED with traditional RGB to better emulate natural light by aligning with the blackbody radiation curve (Planckian locus). Using MATLAB® simulations and field testing, the authors optimize mixing coefficients to achieve better CRI and continuous color temperature (CT) adjustment (from 2500 K to 8875 K). An optimization algorithm (Fmincon) is used to fit chromaticity coordinates to the blackbody curve while maximizing CRI. The proposed RGBW method represents a significant improvement in LED stage lighting, especially for high-CRI, adjustable white light generation. It is particularly well-suited for theatrical and performance environments demanding accurate color rendering, but its effectiveness drops at lower CTs and demands careful calibration and component choice.
A complementary line of research is emerging from the use of machine learning techniques to predict and control LED behavior under thermal stress. Merenda et al. [5] demonstrate that neural networks can be employed directly on embedded systems to predict junction temperature using only voltage, current and device aging data. Their approach is based on a dataset built from extensive measurements collected over many hours of LED operation, enabling the model to capture both thermal and degradation effects. However, the study presents limitations: the inference was performed on relatively capable microcontrollers; additionally, the authors do not address how the predicted temperature could be used in a compensation algorithm, nor do they propose a strategy for adjusting the LED output accordingly.
A unique contribution in this context, that is, using temperature estimation, is the work of Qu et al. [6], which stands out as the only known study that performs temperature compensation using LED forward voltage readings. Their approach is arguably the most similar to the one adopted in this work, although it is limited to RGB LEDs. They use the approximately linear relationship between the forward voltage of each LED ( V f ) and its tristimulus values ( X , Y , Z ) , which is determined through optical spectrometric measurements. The derived coefficients allow real-time compensation of color drift due to thermal variation. The temperature is indirectly inferred from the V f during the PWM on-time. The compensation is based on mappings between junction temperature and chromatic response, obtained during an earlier characterization phase, which are stored and used to adjust PWM duty cycles. Experimental validation shows that chromatic deviations remain within Δ u v = 0.0041 over a 50 °C temperature variation.
In summary, although diverse approaches have been proposed for LED temperature compensation, none has addressed a complete RGBW solution where the white channel is actively derived and regulated under thermal variation. This research fills that gap by extending an RGB algorithm to RGBW and validating it under realistic automotive conditions.
For a comprehensive comparison with the state-of-the-art, Table 1 summarized the main features of some relevant temperature compensation algorithms for RGB LEDs, highlighting the positive and negative characteristics of each and, at the same time, making a comparison with the proposed algorithm.
Recent works have explored more advanced spectral modeling and optimization methods. Han et al. [14] proposed a user-age and scenario-aware spectral optimization for trichromatic white LEDs, striking a balance between color rendering and non-visual effects. A 2024 study by Li et al. [15] introduced a self-adaptive spectrum-tunable LED light source using a differential evolution algorithm, achieving high irradiance uniformity in a simplified physical setup. The use of differential evolution for multi-channel LED spectral design was also demonstrated in earlier work by Zhang et al. [16], achieving fine control of CCT and CRI. While advanced spectral modeling approaches, such as scenario-specific optimization or adaptive spectrum tuning via differential evolution, can enhance RGBW mixing fidelity, they entail considerable computational complexity. Our simplified model prioritizes robustness and real-time implementability in automotive embedded systems, as the main objective of this work is to provide a compensation algorithm that can be efficiently implemented in automotive-grade microcontrollers with limited computational resources. More sophisticated spectral modeling approaches can indeed provide higher accuracy in RGBW mixing, but they typically involve heavier computational loads and memory requirements.

3. Materials and Methods

3.1. Theoretical Background

3.1.1. Colorimetry

Given a light source with power spectral density P ( λ ) , the degree of stimulation required to match its color can be expressed through the, so called, tristimulus values [17],
X = 380 nm 780 nm x ¯ ( λ ) P ( λ ) d λ , Y = 380 nm 780 nm y ¯ ( λ ) P ( λ ) d λ , Z = 380 nm 780 nm z ¯ ( λ ) P ( λ ) d λ ,
where the functions x ¯ ( λ ) , y ¯ ( λ ) and z ¯ ( λ ) are spectral matching functions (SMFs) representing the eye’s sensitivity to different wavelengths for the three CIE 1931 primaries: red, green and blue. Here, X, Y, and Z represent the effective power required for each of the three primaries needed to match the spectrum of P ( λ ) . A relatively large value of X, Y, or Z indicates that the spectrum has a strong red, green, or blue component, respectively.
Using the tristimulus values it is possible to obtain the CIE 1931 chromaticity coordinates x and y.
x = X X + Y + Z y = Y X + Y + Z .
These coordinates represent the proportion of total stimulation contributed by the red and green components, respectively. The third coordinate z is defined as follows:
z = Z X + Y + Z = 1 x y .
Since z is fully determined by x and y, it is redundant and typically omitted.
Until now, only chromaticity has been considered. However, color perception is also characterized by brightness.
Specifically in the CIE 1931 ( x , y ) chromaticity diagram, when one wishes to describe a full color, a third coordinate is introduced: the Y tristimulus value. Therefore, the color is represented as a triplet ( x , y , Y ) , where Y corresponds to the luminance of the color, which also provides a quantitative measure of its brightness.

CIE Chromaticity Diagram

The CIE 1976 ( u , v ) uniform chromaticity coordinates are derived from the tristimulus values ( X , Y , Z ) as follows:
u = 4 X X + 15 Y + 3 Z v = 9 Y X + 15 Y + 3 Z .
From these, considering the relationship between the tristimulus values and the chromaticity coordinates (2), it is possible to write the following:
u = 4 x 2 x + 12 y + 3 v = 9 y 2 x + 12 y + 3 , x = 9 u 6 u 16 v + 12 y = 2 v 3 u 8 v + 6 .
Light emitted by a heated object follows the principle of blackbody radiation, which depends on the object’s temperature by Planck’s law [18]. From this law, the spectral radiance L λ , measured in Wsr 1 m 3 , can be expressed as follows:
L λ ( λ , T ) = 2 h c 2 λ 5 e h c λ k B T 1 .
From a chromatic perspective, black-body radiation and hence its peak wavelength λ max correspond to a perceived color shift as the temperature of the emitter changes. It is possible to plot this sequence of chromaticities on the CIE 1931 ( x , y ) diagram, resulting in the so-called Planckian locus, depicted in Figure 1.
A white color can be represented by the CT, that is, the temperature of a Planckian black-body radiator whose chromaticity matches that of the considered white light source.
Since a real white light source may not lie exactly on the Planckian locus, the concept of CCT is instead used. The CCT of a white light source is the temperature of the black-body radiator with the closest chromaticity to that of the source. According to the CIE, the CCT is considered valid only when the chromaticity of the light source lies within a distance of 0.05 from the Planckian locus.

Color Mixing

While subtractive color mixing applies to paints, inks and dyes, additive color mixing is used when combining two or more sources of light. This is the principle behind RGB LEDs or display technologies, where mixing these three colors at appropriate intensities, ideally, results in the perception of white light.
When multiple colors are mixed additively, as in the case of this work, where three R, G, and B LEDs are used, it is possible to generate any desired color by appropriately mixing these three primaries. Depending on the individual intensities of the three primaries, different resulting colors are obtained. In the case of LEDs, the intensities are controlled by their respective duty cycles, which regulate their brightness. It is possible to compute the required intensities (more precisely, the luminances, later scaled linearly to obtain duty cycles) necessary to produce a target light. This target light is specified by a chromaticity and luminance triplet ( x T , y T , Y T ) . Given the chromaticity coordinates of the three primaries, corresponding to the R, G, and B LEDs, it is then possible to calculate the individual luminances ( Y R , Y G , Y B ) of the three LEDs that must be used to reproduce the desired target color.
To compute the required LED luminances, it is not possible to directly use chromaticity coordinates, since they are derived non-linearly from the tristimulus values, as shown in Equation (2). Therefore, the first step is to convert the chromaticity coordinates into tristimulus values, knowing that X = Y y x . Since tristimulus values are additive, the target color can be expressed as a linear combination of the tristimuli of the three primaries.
X T = X R + X G + X B = Y R x R y R + Y G x G y G + Y B x B y B Y T = Y R + Y G + Y B = X R y R x R + X G y G x G + X B y B x B .
And consequently, the following system of equations is obtained:
x T = Y R x R y R + Y G x G y G + Y B x B y B Y R y R + Y G y G + Y B y B y T = Y R + Y G + Y B Y R y R + Y G y G + Y B y B Y T = Y R + Y G + Y B Y R x R x T y R + Y G x G x T y G + Y B x B x T y B = 0 Y R 1 y T y R + Y G 1 y T y G + Y B 1 y T y B = 0 Y R + Y G + Y B = Y T .
Writing the system in matrix form A x = b , yields
x R x T y R x G x T y G x B x T y B 1 y T y R 1 y T y G 1 y T y B 1 1 1 Y R Y G Y B = 0 0 Y T .
At this point, the system can be solved symbolically for Y R , Y G , and Y B using various methods. Noting that A is invertible, its inverse can be calculated to symbolically obtain all the coefficients ( x = A 1 b ).
By solving it, one finally obtains the system of equations that allows one to derive the intensities of the three primaries (and thus the duty cycles) starting from the chromaticity coordinates of the three LEDs and the chromaticity coordinates ( x T , y T , Y T ) of the target.
Y B = Y T · x G y B y R x G y B y T x R y B y G + x R y B y T + x T y B y G x T y B y R x B y G y T x B y R y T x G y B y T + x G y R y T + x R y B y T x R y G y T Y G = Y T · x B y G y R + x B y G y T + x R y B y G x R y G y T x T y B y G + x T y G y R x B y G y T x B y R y T x G y B y T + x G y R y T + x R y B y T x R y G y T Y R = Y T · x B y G y R x B y R y T x G y B y R + x G y R y T + x T y B y R x T y G y R x B y G y T x B y R y T x G y B y T + x G y R y T + x R y B y T x R y G y T .
In the equations above, the symbol Y is used to denote luminance derived from the Y tristimulus value, following standard colorimetry conventions. In later sections (and so for RGB and RGBW algorithms implementation), the symbol L is used instead to refer to relative luminance, defined as luminance values scaled with respect to the maximum achievable output of the given LED configuration and expressed in the range [0, 10,000].

Color Rendering Index

One of the most important characteristics of a white light source is its ability to reproduce the true colors of physical objects (whether these are fruits, plants, or artwork) illuminated by the source. This property is quantified by the color-rendering index (CRI), which measures how accurately the colors of objects appear under a test light source compared to a reference source. A high CRI indicates that colors appear fuller and more vivid, which is particularly relevant in environments like museums, art galleries, homes, retail spaces and automotive interior lighting, whereas it is less critical in street lighting or signage applications.
Figure 2 shows an example of a physical object (here peaches) under illumination with a high-CRI source and with a low-CRI source.
The CRI is calculated by comparing the color rendering of a test source with that of a reference source. The reference source is conventionally assigned a perfect CRI of 100, reflecting its ideal color rendering. with incandescent lamps that typically have the highest CRI due to their emitted spectra, very similar to Planckian radiators.
The CRI calculation employs a standard set of fourteen test-color samples; for each, the tristimulus values under both the test and reference illuminants are computed, and a chromatic adaptation transform, typically von Kries’ model, is then applied to simulate the observer’s visual adaptation. The color difference Δ E i between the sample’s appearance under test and reference sources is then calculated in a perceptually uniform space such as CIE 1976. The special CRI for each sample is given by
R i = 100 4.6 · Δ E i ,
where R i = 100 represents perfect color match. The general CRI R a is the average of the eight special CRIs.
R a = 1 8 i = 1 8 R i .
The factor 4.6 was chosen historically to set a baseline CRI of 60 for standard warm-white fluorescent lamps compared to a black-body radiator reference. Modern fluorescent sources typically exhibit CRIs between 50 and 95.
A CRI value between 85 and 100 is generally good for almost all practical applications, providing a color rendering that meets the expectations of both professional and consumer environments. On the contrary, light sources with a CRI around 70 are typically considered to be of lower quality [21,22].

3.1.2. Temperature Dependence of LEDs

The performance of light-emitting diodes (LEDs) is notably influenced by temperature, both in terms of emission intensity and spectral characteristics. As temperature increases, the emission intensity of LEDs generally decreases, a phenomenon attributed to several temperature-dependent mechanisms, including non-radiative recombination via deep levels, surface recombination, and carrier leakage over heterostructure barriers. Near room temperature, the drop in optical power P emitted by the LED due to temperature variations is described by the following expression:
P = P 300 K · e T 300 T i ,
where P 300 K is the optical power (in W) at the reference temperature of 300 K and T i denotes the characteristic temperature in kelvin. Higher T i values indicate weaker temperature dependence and thus better thermal stability. The characteristic temperature T i of an LED can vary widely depending on the material and its structure. Lower values are typically observed for red LEDs, such as AlGaInP, which can have T i even lower than 95 K. In contrast, GaInN blue LEDs can exhibit very high T i values, often exceeding 1600 K [21].
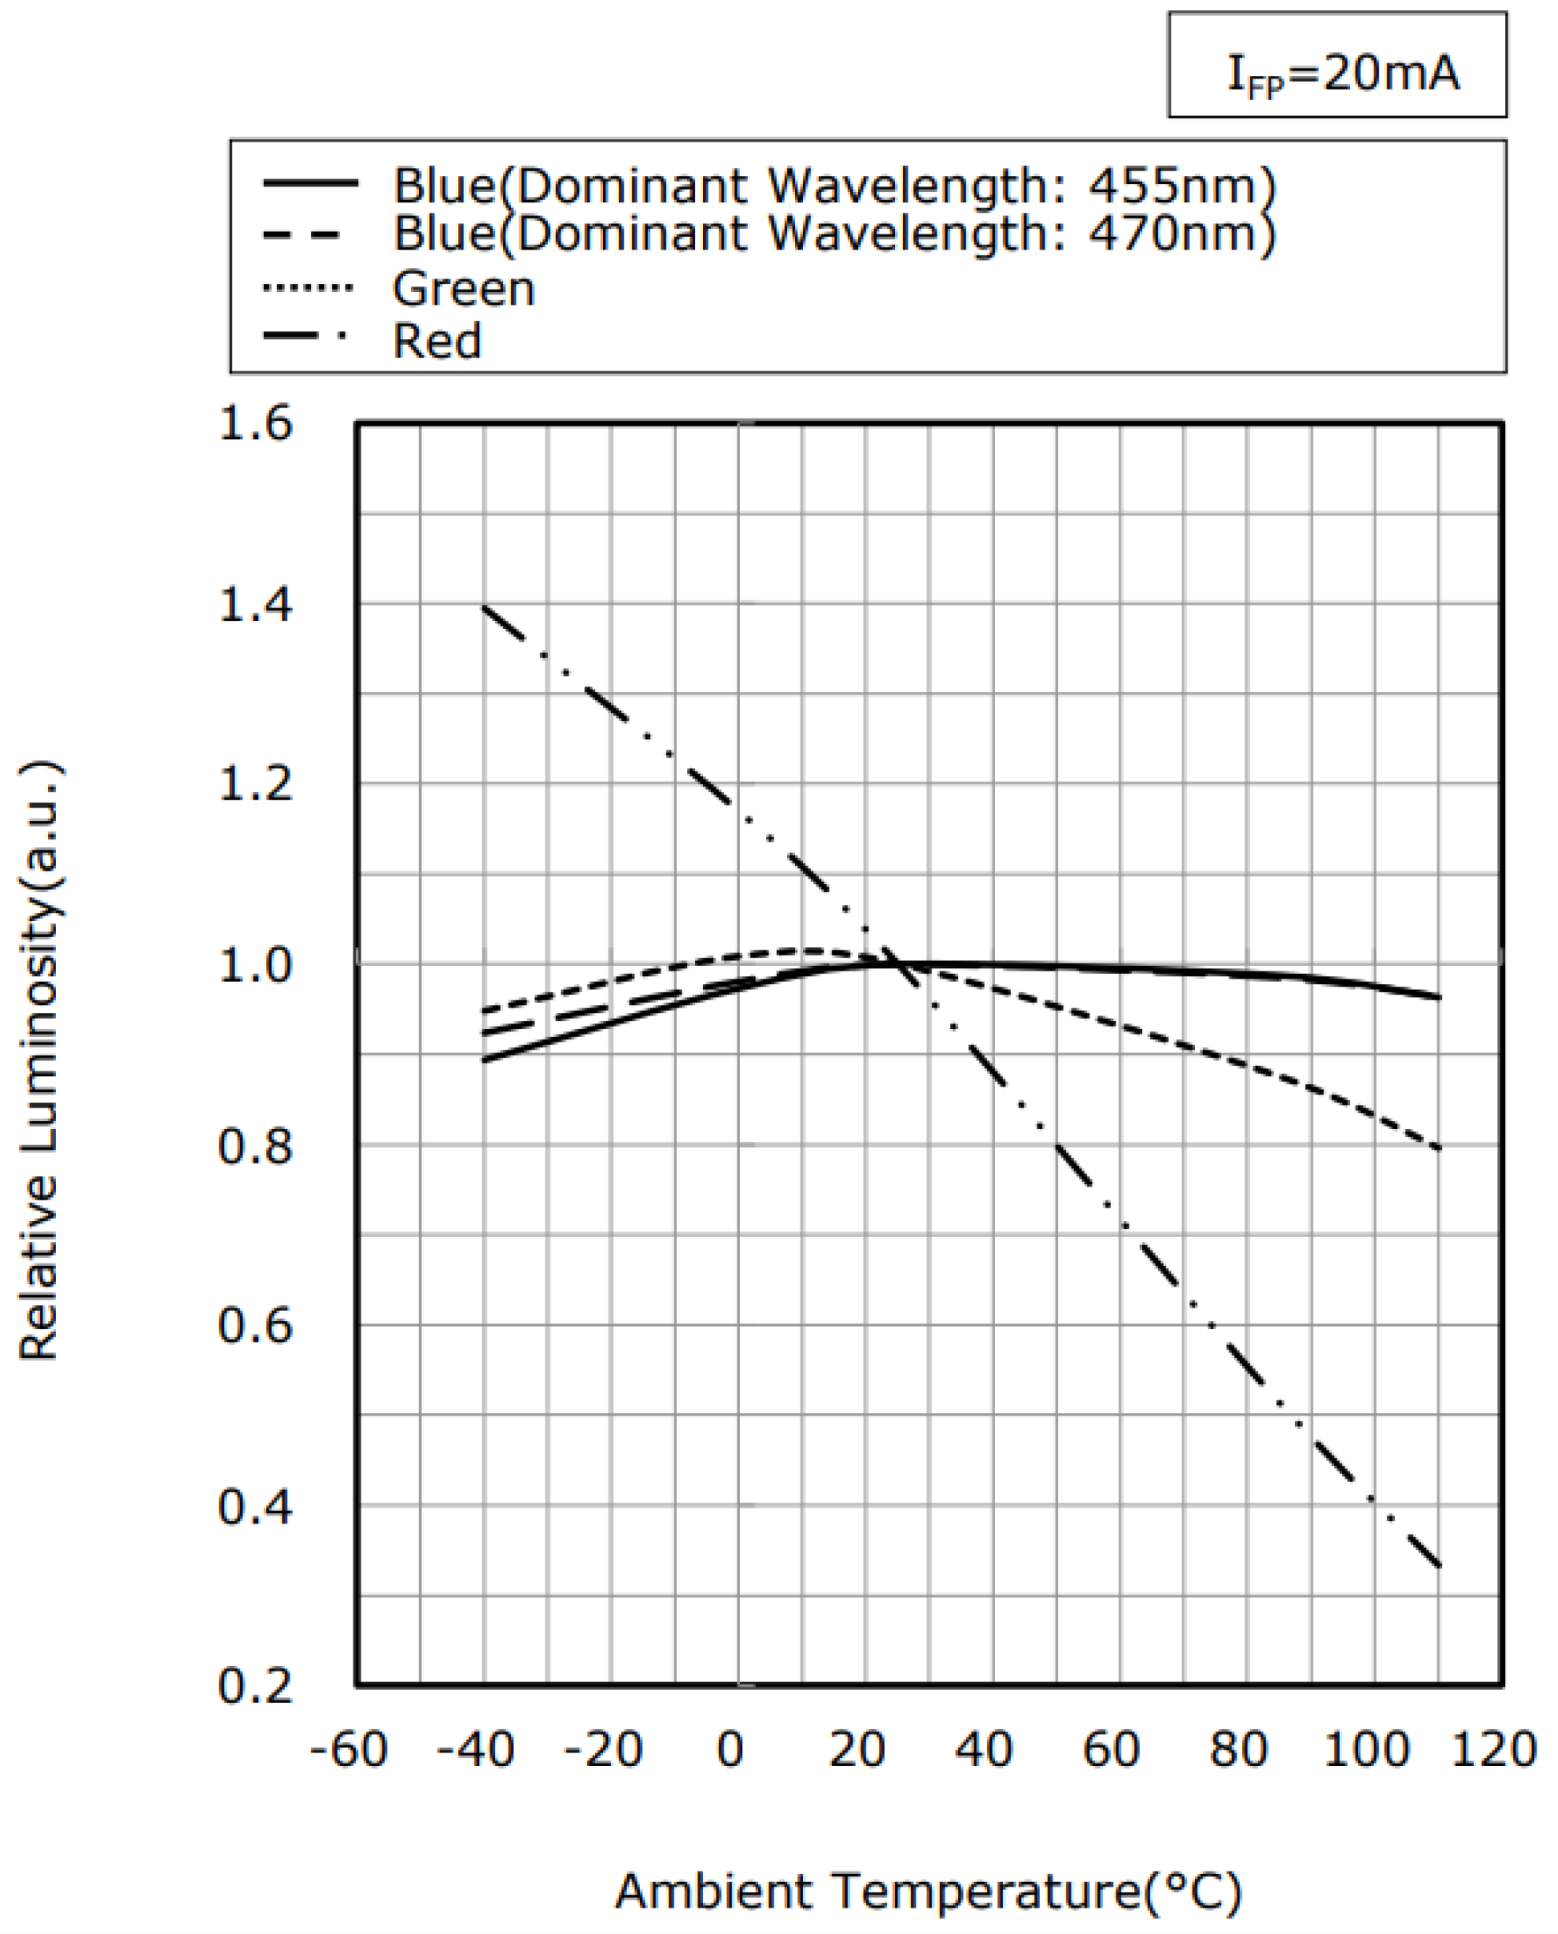
Experimental data from a commercial Nichia RGB LED [23], the same used in the experimental part of this work, shown in Figure 3, clearly demonstrates the temperature dependence of relative luminosity for RGB LEDs. As observed, the blue LED maintains a higher relative output across increasing temperatures, suggesting a higher characteristic temperature T i when compared to red and green.
Beyond emission intensity, the spectral properties of LEDs also vary with temperature. The emission peak wavelength shifts to longer wavelengths as temperature increases, primarily due to the narrowing of the bandgap ( E g ) with temperature. This temperature-induced bandgap variation is typically described by the Varshni equation,
E g ( T ) = E g 0 A T 2 B + T ,
where E g 0 is the bandgap energy at 0 K (in eV), A is a material-specific constant (in eV/K) and B is also a material-specific constant (in K). For instance, in the literature, values of A = 7.5 × 10 4 eV/K and B = 1300 K have been reported for InGaN/GaN [25], while for GaAs, typical values include A = 8.871 × 10 4 eV/K and B = 572 K [26]. As the bandgap narrows, not only does the peak emission wavelength redshift, but the emission linewidth also broadens, and electrons are thermally excited further into the conduction band, resulting in a wider distribution of emitted photon energies upon electron-hole pair recombination.
Figure 4 shows an example of this wavelength shift using data from the blue channel of the same Nichia RGB LED, where the dominant wavelength increases steadily with temperature, a clear manifestation of the Varshni effect [21,27,28].

3.2. Algorithm Description

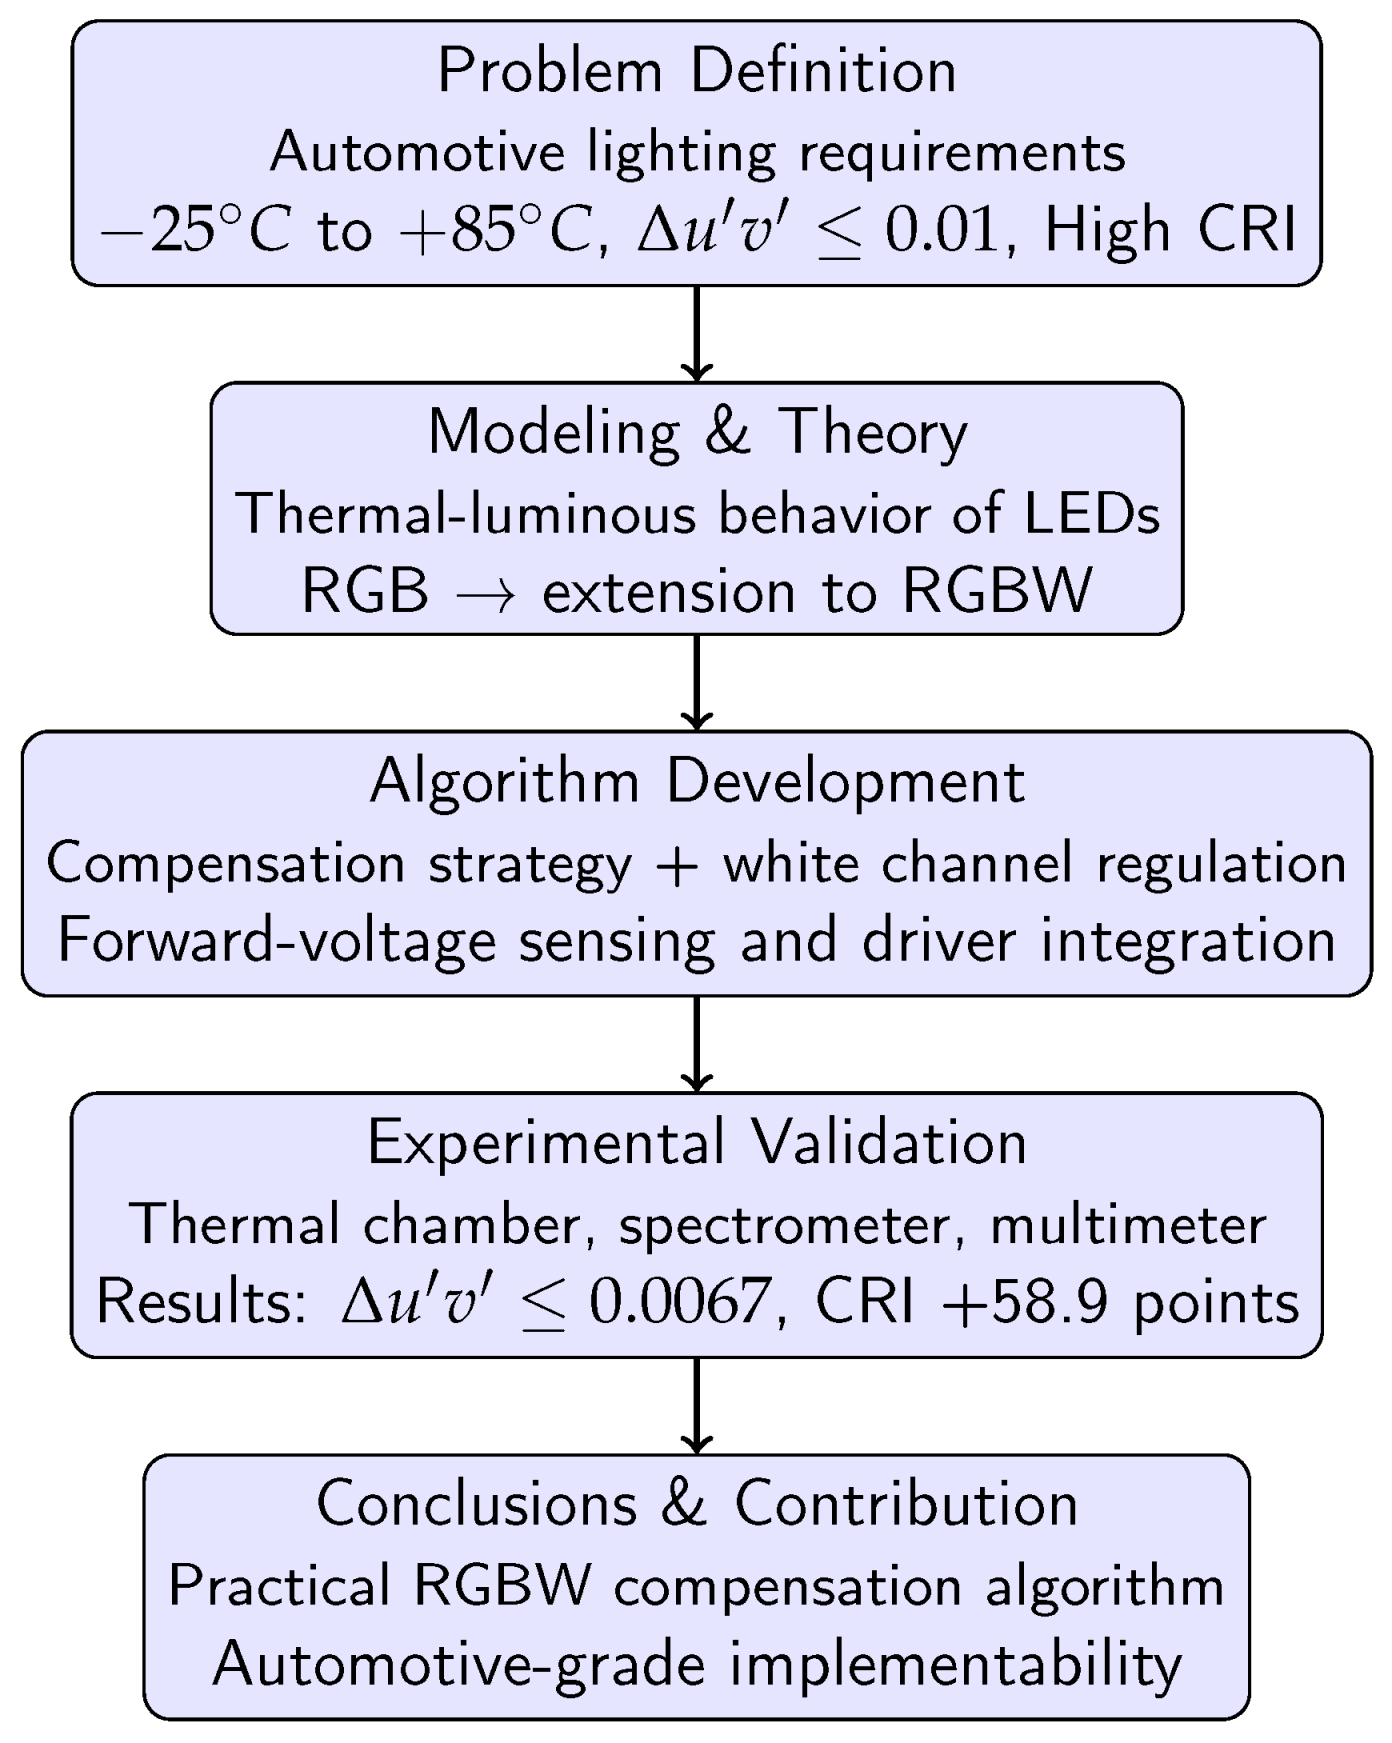
Figure 5 depicts a concise flow diagram that summarizes the entire research. Details are described in the following sections.

3.2.1. RGB Temperature Compensation Algorithm

In Section 3.1.2, it was discussed how temperature exerts a non-negligible and indeed significant influence on both the luminous output and the emission wavelength, and thus on the perceived color, of a light-emitting diode. In automotive applications, particularly in the domain of interior lighting, devices are often required to operate reliably across a broad temperature range. Within such contexts, especially when employing a color mixing involving three or four LEDs driven at varying intensities, even a slight spectral shift in one LED, resulting from temperature variation, can substantially alter the resultant mixed color.
This observation naturally leads to the necessity of implementing a compensation algorithm capable of correcting for temperature-induced spectral shifts in the LEDs. In practice, it is specified as a requirement on the chromatic accuracy of the output color ( u o u t , v o u t ) with respect to the intended target ( u t , v t ) , often defined as a maximum permissible deviation of ± 0.01 in the u , v chromaticity coordinates over the entire specified temperature range, calculated as the Euclidean distance between the output and target coordinates.
Δ u v = u o u t u t 2 + v o u t v t 2 0.01 .
The principal objective of the algorithm is to maintain both the luminous flux and chromaticity coordinates of the emitted radiation from an RGB LED stable across the full range of operating temperatures. To accomplish this, it is first necessary to know the junction temperature of the LED. Given the strong dependence of LED optical and electrical characteristics on temperature, the solution proposed involves estimating the junction temperature indirectly from the forward voltage.
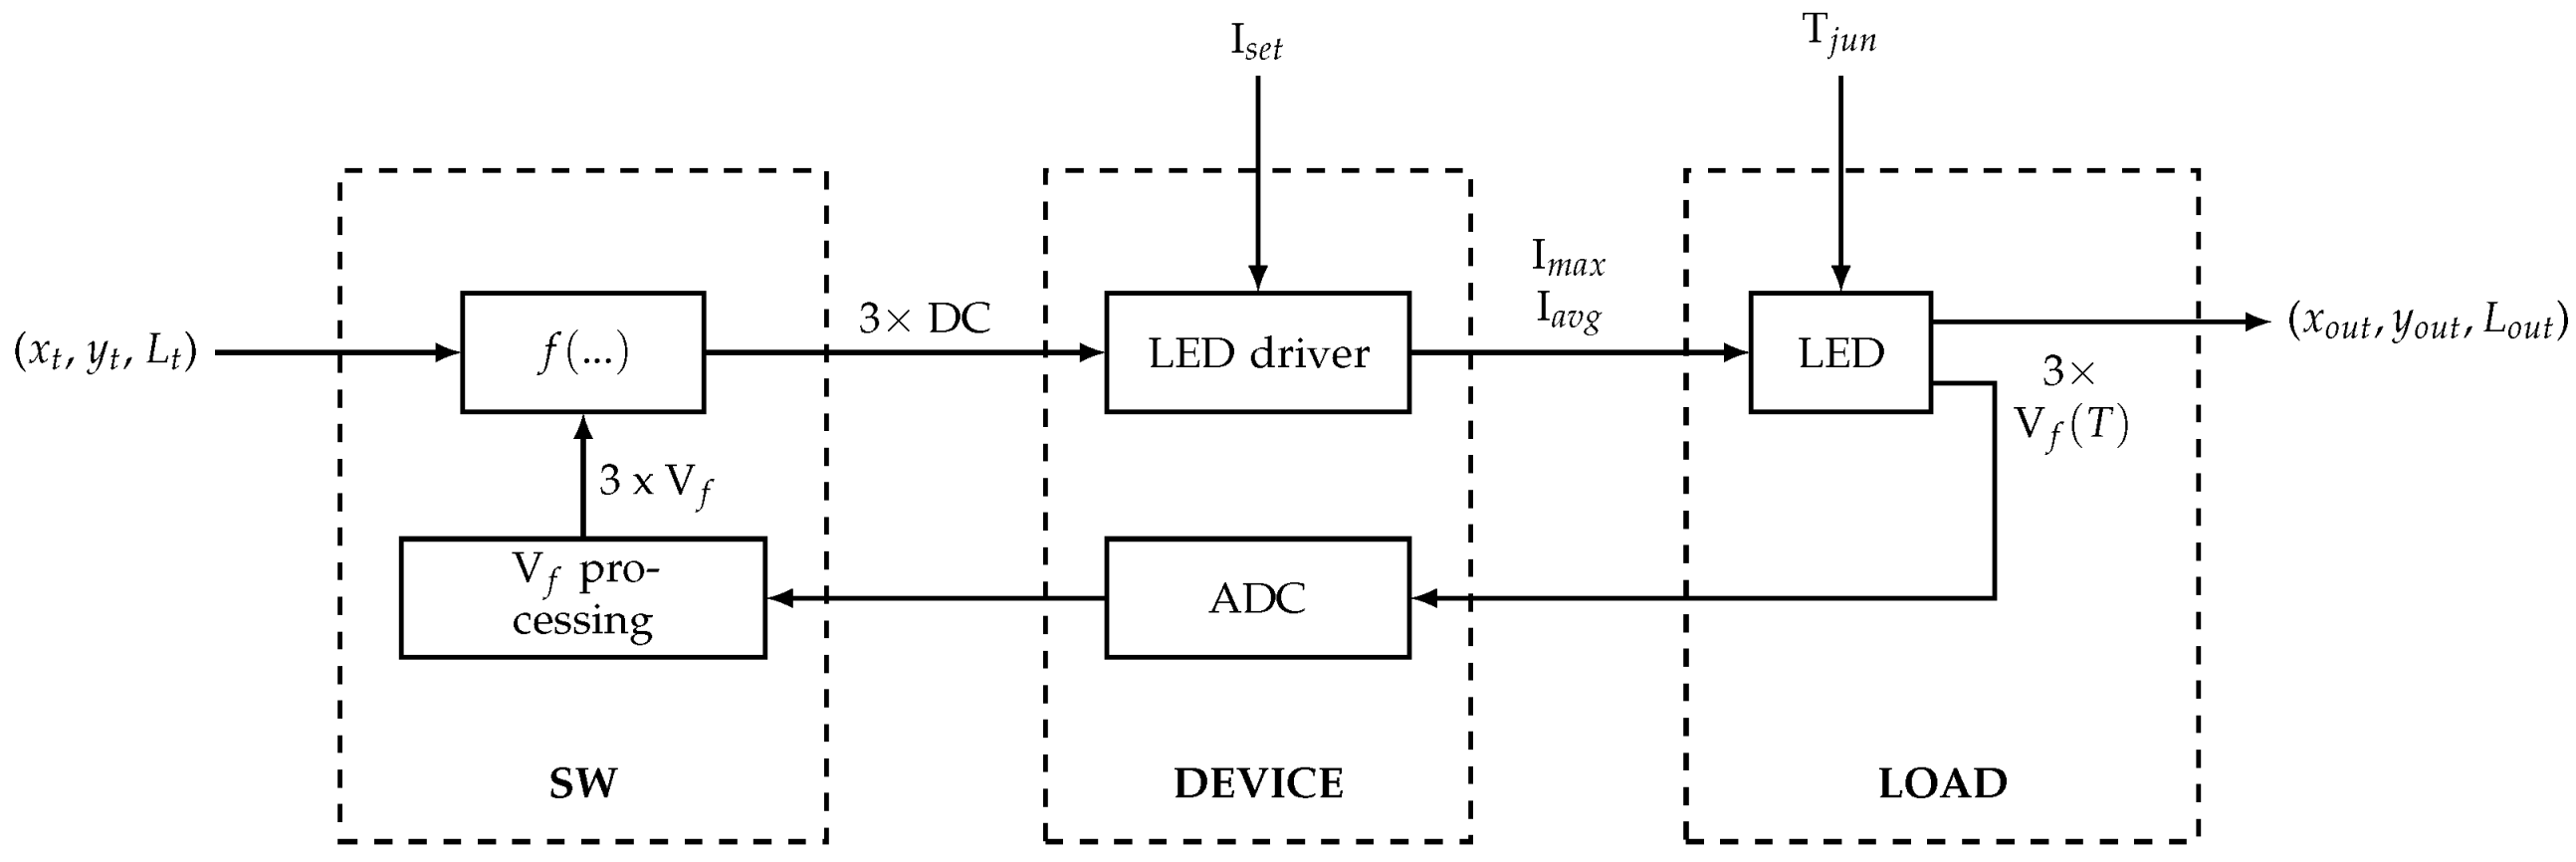
As a preliminary step, before getting into the detailed description of the algorithm’s internal operations, it is useful to provide a general overview of the components involved in the system. Figure 6 presents a high-level functional block diagram illustrating the overall structure.
From the left, one observes the system inputs, which are the chromaticity coordinates of the target color to be emitted by the RGB LED. These coordinates are specified in the CIE 1931 color space and represented as a triplet ( x t , y t , L t ) .
Within the dashed “SW” block, the target color coordinates are processed in conjunction with forward voltage readings ( V f ) acquired from the device’s ADC, which monitors the voltage drops across the LED terminals. These forward voltage readings, which are temperature-dependent, are processed by the microcontroller, where the entire algorithm is stored and executed. Since the forward voltage of the LED varies with temperature, these readings are used to estimate the junction temperature ( T j ) of the LED. The estimated temperature is then used to compensate for the temperature effects on the LED-emitted color. The voltages are converted from raw digital values to physical units (V) with gain and offset compensation using data that was collected during the device’s production and testing. The output of this last stage consists of temperature-compensated duty cycle values, one for each LED channel, calculated to achieve the desired chromatic output.
These duty cycle values serve as input to the LED driver, which drives the LEDs using a pulse-width modulation (PWM). The modulation is performed at a peak current level I set , defined as an application design input to the driver. Thus the output of this block is the drive currents for powering the LEDs.
The final block represents the load, namely the RGB LED to be driven and subject to thermal variation. As clearly indicated in Figure 6, temperature constitutes an implicit input variable to the LED system. The final output, consequently, is the emitted color, expressed in chromaticity coordinates, either in x , y or in u , v . As required by the specification, this output must remain within a deviation of ± 0.01 in u v space relative to the target input coordinates, across the entire operating temperature range.
The target color is defined in the CIE 1931 x y space, as it is more intuitive for users and easier to process within the algorithm. In contrast, the accuracy requirement is verified in the CIE 1976 u v space, which offers perceptual uniformity and allows deviations to be evaluated consistently across the color space.

LEDs Characterization

The characterization process consists of experimentally determining the LEDs’ characteristic curves related to temperature shifts. This is accomplished through a series of measurements conducted across the entire operating temperature range (from −25 °C to 85 °C). For each temperature point, the electrical or optical quantity under investigation is measured using various fixed current values ( I s e t ).
The resulting data comprise a series of characteristic curves, including current vs. voltage (I-V), forward voltage vs. temperature ( V f -T), peak wavelength vs. temperature ( λ -T), luminous flux vs. temperature ( Φ -T), and chromaticity coordinates vs. temperature (x-T and y-T, in CIE 1931 color space). These measurements are performed independently for each of the three channels of the RGB LED.
Once the extensive characterization process has been completed, a polynomial regression is used to fit the experimental data, with the polynomial order selected according to how the measured variable behaves with temperature. For example, regarding the V f T relation, a third-order polynomial fit is performed, from which the coefficients of the polynomial are extracted. These polynomial coefficients are valid within the temperature range over which the characterization was performed. Figure 7 shows the result of the red LED fitted characterization curve, superimposed on the corresponding plots extracted from the LED manufacturer’s datasheet. The fitted curve, obtained from the measurements, is shown in red.

LEDs Calibration

Due to the intrinsic nature of LED manufacturing, it is important to implement a dedicated calibration procedure to account for variations introduced by binning and manufacturing spreads. Without such calibration, non-negligible errors would arise in the estimation of junction temperature, chromaticity coordinates and luminous flux.
The procedure consists of precisely measuring the chromaticity coordinates, specifically the x and y values, of the RGB LED at a known reference temperature T r e f (e.g., 25 °C), employing an optical instrument such as a spectrometer. For this measurement, a fixed drive current and duty cycle are applied; in the present work, a current of 20 mA and a duty cycle of 50% were used.
Therefore, a temperature-controlled environment, such as a thermal chamber, is required to ensure the accuracy of the reference temperature during measurement.
For analogous reasons earlier, the exact luminous flux values of individual LEDs are not specified in the datasheet, owing to binning variations and manufacturing spreads.
In order to carry out the flux calibration, it is necessary to measure the luminous fluxes (absolutes, expressed in lumens) of the three LEDs at a known reference temperature (e.g., 25 °C), with the use of the calibrated spectrometer.
The driving current and duty cycle employed are the same as those used in the chromaticity calibration, so much so that in practice, both calibrations may be performed simultaneously, as they are derived from the acquisition of a single optical spectrum.
These absolute flux values at 25 °C are then used to define a set of per-channel calibration coefficients ( k calL , R , k calL , G , k calL , B ), in order to compensate for the inherent imbalance in luminous output between the RGB emitters. For example, when driven with the same conditions, the red LED often exhibits a lower luminous flux than the green LED. This is addressed by the computation of the coefficient k c a l L , which accounts for both the radiometric power and photometric flux differences between channels and is given by
k calL , R = L x y 25 , G L x y 25 , R · Φ cal 25 , R Φ cal 25 , G k calL , G = 1 k calL , B = L x y 25 , G L x y 25 , B · Φ cal 25 , B Φ cal 25 , G .
Here, L x y 25 and L x y 25 are the optical powers (in watts) for the channel under consideration, measured during the characterization process at 25 °C. Φ cal 25 instead, denote their corresponding luminous fluxes (in lumens), obtained through calibration using the spectrometer. It is important to note that, looking at the formula of the coefficient, it is referenced to the green channel, which is used as a fixed reference. Consequently, k calL , G = 1 by definition. Despite the mixing of radiometric (W) and photometric (lm) quantities, this formulation is justified because it ultimately serves to preserve chromatic balance rather than physical energy conservation.
The result of the calibration is a triple of calibrated intensity values L x y , which are proportionally matched for subsequent use in the temperature compensation algorithm. They are calculated by multiplying the optical powers (in watts) for the channel under consideration, measured during the characterization process at 25 °C by the coefficient k c a l L .
L x y , R = L x y 25 , R · k calL , R L x y , G = L x y 25 , G · k calL , G L x y , B = L x y 25 , B · k calL , B .
The final calibration to be addressed applies to the forward voltage. As illustrated in the manufacturer datasheet [24], the red LED has a wide range of possible V f values due to manufacturing spreads. This variability, again a consequence of production binning, requires a dedicated calibration to obtain a reliable voltage reference at a known temperature for each specific LED.
It should be recalled that the forward voltage V f is the quantity used to estimate the junction temperature; thus, precision in its calibration is fundamental.
Unlike the previous two calibrations, this one is not optical; it does not require the use of a spectrometer, as it merely involves a voltage measurement. The calibration is performed directly via the device’s onboard ADC, in that way allowing for correction not only of the V f T relationship but also of any inherent ADC offset errors.
The purpose of the calibration is to correct the offset of the fitting curve. This correction is computed by measuring the V f of each LED at the reference temperature (typically 25 °C) using the device’s ADC ( V f w d 25 , c a l i b ), under identical duty cycles across all LEDs, and comparing it to the corresponding value V f w d 25 , c h a r obtained during characterization using a calibrated precision instrument (e.g., a benchtop digital multimeter). The offset is defined as
offset = V f w d 25 , calib V f w d 25 , char .
The offset is then added to the measured forward voltage in the fitting equation
T ( V f ) = m 3 t ( V f + offset ) 3 + m 2 t ( V f + offset ) 2 + m 1 t ( V f + offset ) + b t ,
where m 3 t , m 2 t , m 1 t , and b t denote the polynomial coefficients obtained from the fitting procedure.
Since this calibration step requires no external instrumentation, it can be performed automatically by the device itself, embedded directly within the algorithm, as it simply involves sequentially powering each LED and sampling its forward voltage. The measured values are then internally applied as corrective offsets in the temperature estimation derived from V f . As a direct consequence, since the calibration voltage serves as a reference, during algorithm execution, if the same forward voltage measured during calibration is read, then the estimated temperature will correspond to 25 °C.

Core LEDs Compensation Algorithm

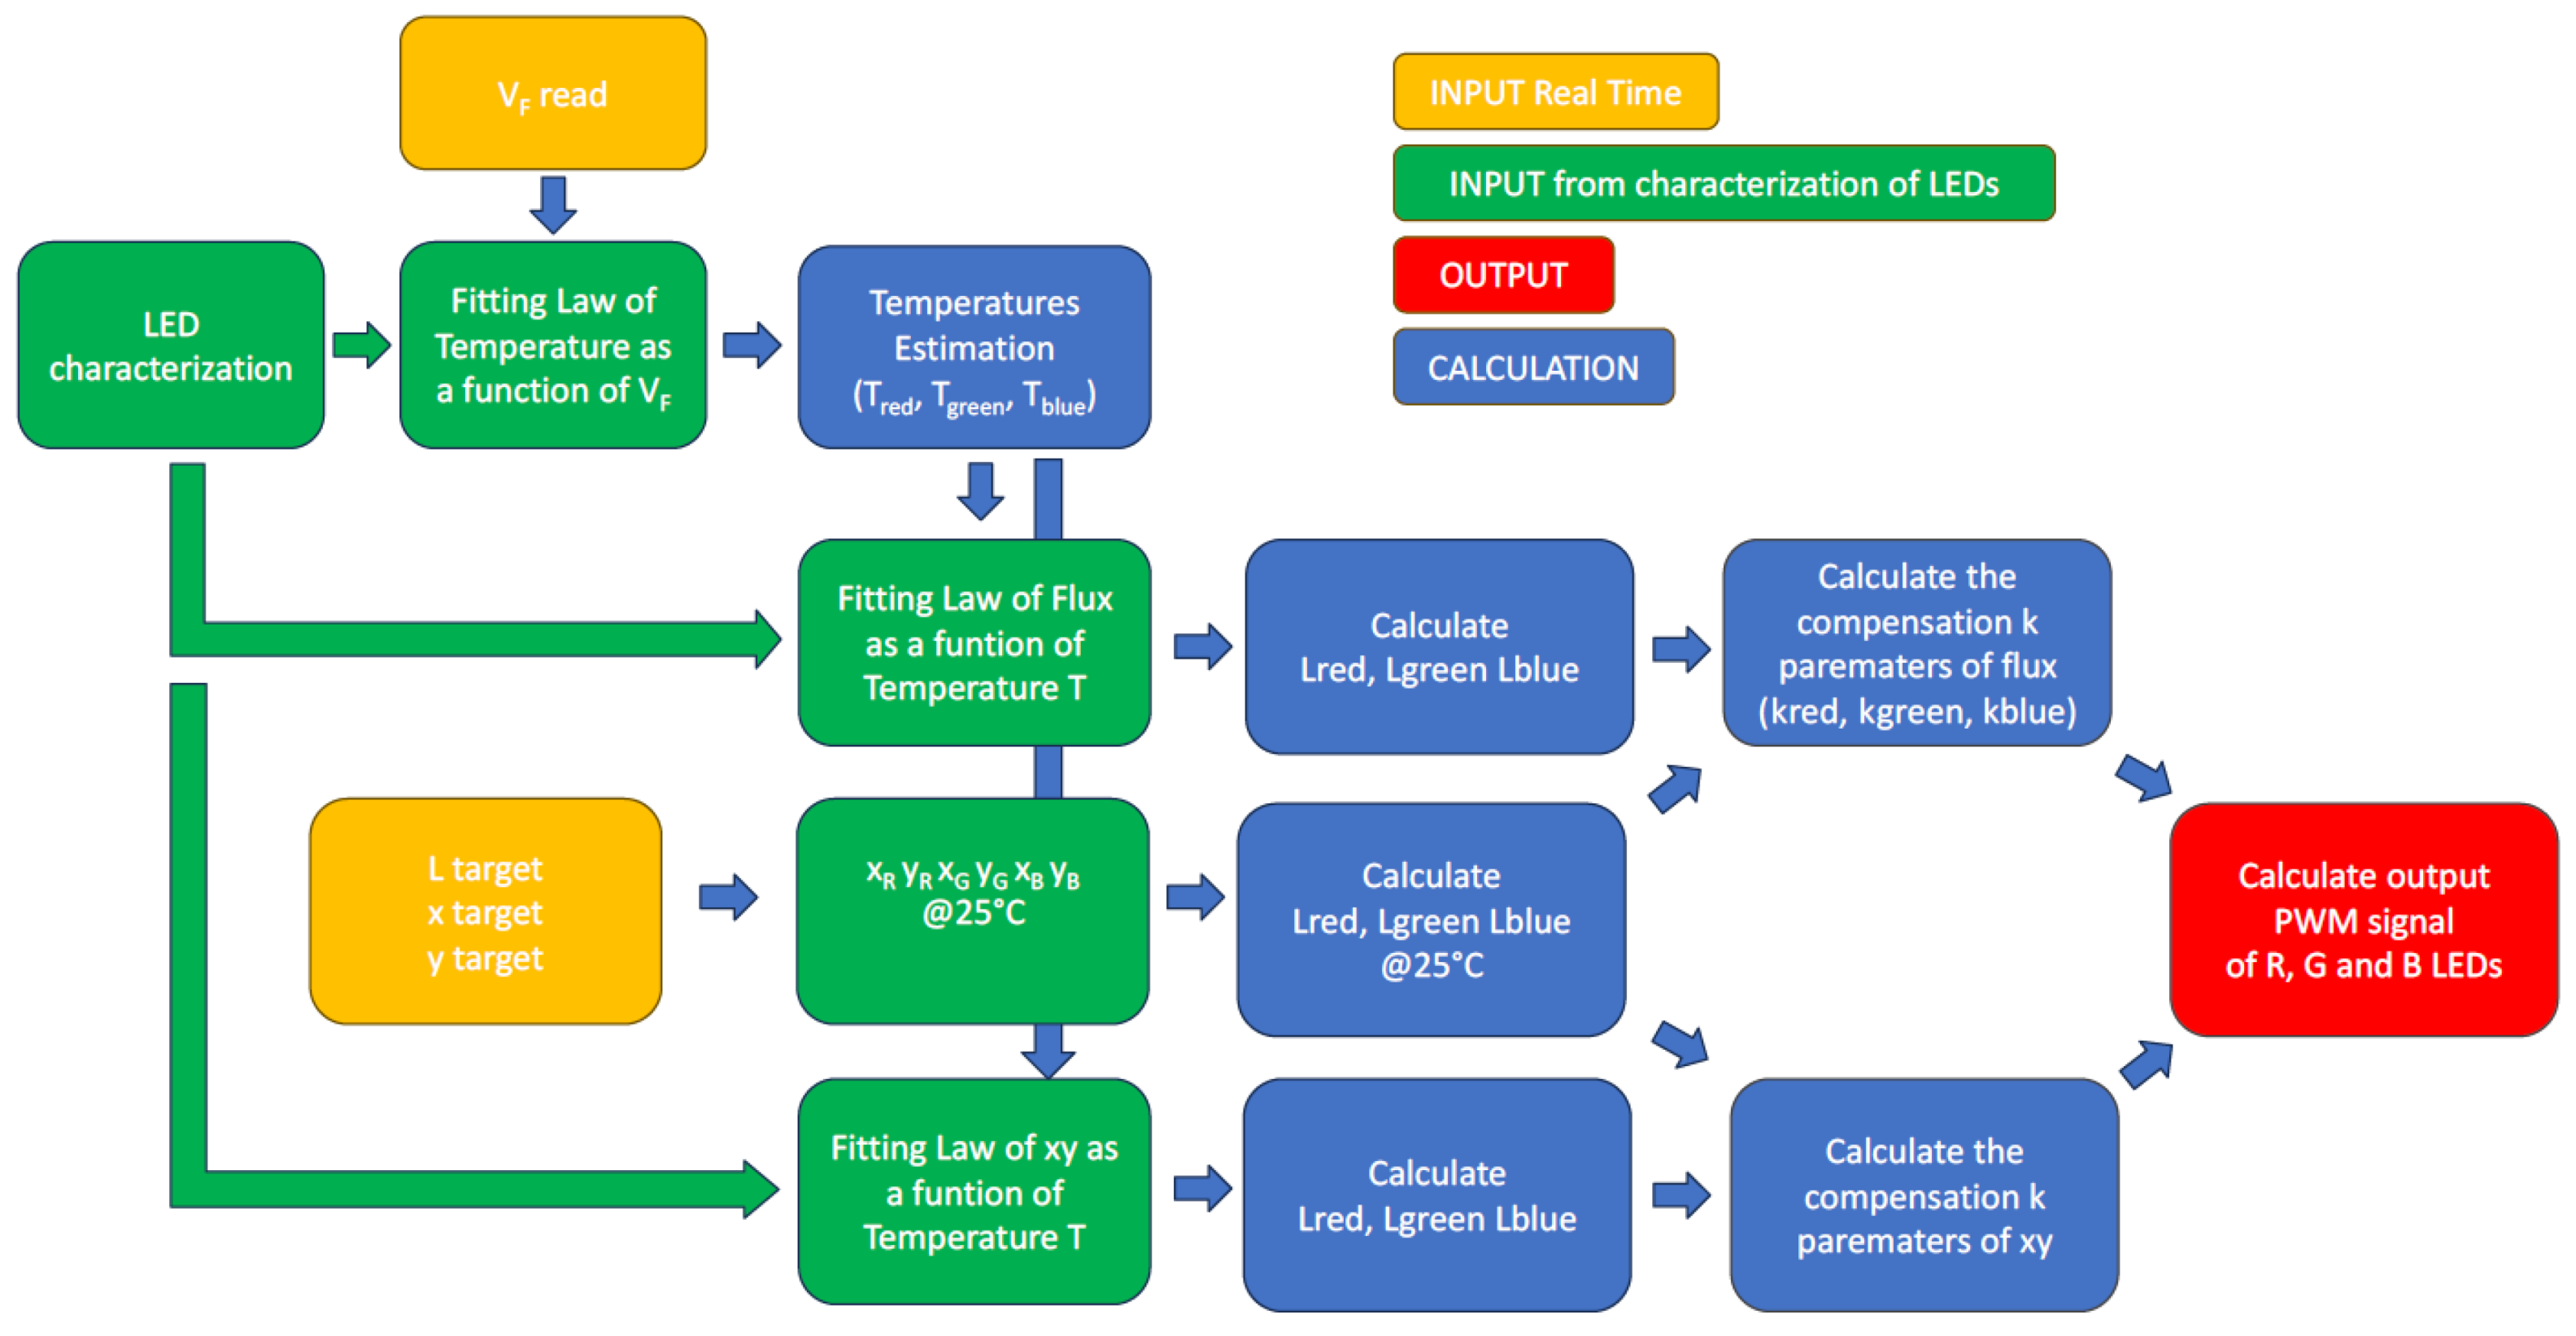
Looking inside the core of the algorithm, a more detailed functional block diagram is presented in Figure 8.
As discussed above, the primary goal of the algorithm is to maintain constant chromaticity coordinates and luminous flux emitted by the LED across the range of operating temperatures. Importantly, temperature is not measured directly, e.g., via a temperature sensor, but rather estimated from the forward voltage ( V f ) measured across each individual LED by using the fitting equation.
Static inputs to the algorithm, denoted in green, represent parameters derived from the characterization and calibration phases of the LEDs. These inputs remain fixed during the runtime of the algorithm. Dynamic inputs, shown in yellow, are those controlling the color emission, namely, the target chromaticity coordinates ( x t , y t , L t ) and the forward voltage V f (from which the temperature is inferred).
From the estimated temperature and the known temperature dependence of flux and chromaticity, the algorithm computes the required drive intensities for each of the three LEDs. Focusing first on luminous flux and using the calibrated intensity ratios L x y , the initial step consists of computing a further coefficient for each channel, denoted as k eff . This coefficient is defined as the reciprocal of the relative luminous flux fitting function evaluated at the current estimated temperature T curr ,
k eff = 1 Φ rel ( T curr ) = m 3 f T curr 3 + m 2 f T curr 2 + m 1 f T curr + b f 1 ,
where m 3 f , m 2 f , m 1 f , and b f denote the polynomial coefficients obtained from the fitting procedure. As for the chromaticity coordinates, the algorithm begins by calculating the expected ( x , y ) values for each LED, corresponding to the current estimated temperature. This computation is carried out by using the relation, obtained during the fitting process, which links chromaticity coordinates to temperature. This produces a pair of LED color coordinates, one for each channel.
x ( T curr ) = m x T curr + b x y ( T curr ) = m y T curr + b y .
Here, m x and b x denote the polynomial coefficients obtained from the fitting procedure for the x coordinate, while m y and b y correspond to those for the y coordinate. The obtained coordinate pair represents the expected chromaticity of the LEDs at the current temperature, including, therefore, the temperature-induced shift with respect to the reference temperature.
From the target chromaticity coordinates ( x t , y t , L t ) , the algorithm calculates the intensities of the individual LEDs, namely L b , containing L R , L G , and L B , by applying the relationships derived from the theory of color mixing (see Equation (10)). The compensated chromaticity coordinates of the LEDs previously determined, which reflect the temperature-dependent shift, are used in this calculation as color primaries. The resulting intensities are then appropriately scaled to match the resolution of the device’s PWM engine (i.e., 16 bits). What has been obtained are the duty cycles of the PWM signals used to drive the LEDs. These duty cycles, at this point, are taking into account only the thermal shift of the chromaticity coordinates. However, the ultimate goal is to also compensate for the variation in luminous flux. To this end, the algorithm proceeds to correct the three duty cycles by reintroducing the calibrated intensities L x y , previously adjusted for the inter-channel luminous imbalance, along with the coefficient k eff calculated above (which accounts for flux variation with temperature).
pwm R = k eff , R · L R L x y , R pwm G = k eff , G · L G L x y , G pwm B = k eff , B · L B L x y , B .
These final duty cycle values, computed at each execution cycle, are thus those written in real time to the appropriate registers of the device responsible for PWM generation and LED driving.

3.2.2. Extension to RGBW Algorithm

The algorithm represents an evolution of the earlier one and reflects ongoing efforts to improve color quality. The addition of a fourth channel (namely, a white LED) is motivated by considerations related to color quality, which are of particular interest in interior lighting applications.
Consider a given color, for the sake of simplicity, a warm white with a CCT of 2700 K, exactly the same as the white LED employed, as introduced in Section 3.3.1. According to color theory, this color, definable in terms of chromaticity coordinates ( x = 0.45986 , y = 0.41060 ), can be obtained by appropriately mixing the three primary components: red, green, and blue. The resulting spectral distribution would look like the one shown in Figure 9b.
Consider now the same color point, but obtained instead using the white LED. The spectral distribution corresponding to this case is depicted in Figure 9a.
What is interesting to note is that both spectra, despite their markedly different shapes, correspond to the same chromaticity coordinates. This should be a clear indication that chromaticity alone is not sufficient to fully characterize the light source. When illuminating an object with these two different spectra, although resulting in the same color point, the perceived color rendering can differ significantly. As discussed in the Color Rendering Index Section, this difference is well captured by the CRI. A visual representation of this effect can be appreciated in Figure 2, which compares the appearance of a bowl of peaches under a high-CRI and a low-CRI light source.
The decision to introduce a white LED is therefore motivated by fact that it is possible to achieve a tunable white with a higher CRI compared to what is achievable using RGB alone.
The addition of a fourth emitter will also require its independent characterization and calibration, carried out in the same manner as for the red, green, and blue channels.

3.3. Experimental Setup

The present section is dedicated to describing the hardware platforms on which the algorithm was executed, namely the LED driver and its corresponding evaluation board. In addition, the two LED part numbers employed for the implementation of the two algorithms will be presented, and their main characteristics briefly discussed.
It is important to note that the experimental setup employed in this study, including the use of a thermal chamber, a spectrometer, and high-precision multimeters, was intended to solely describe, calibrate and validate the proposed algorithm under controlled laboratory conditions. These instruments are not required in practical implementations. In real automotive applications, the compensation algorithm relies only on electrical quantities already accessible in the LED driver, such as forward voltage and driving current, to indirectly estimate junction temperature and correct color drift. Therefore, the method remains practical and lightweight.

3.3.1. Hardware

The Infineon TLD4020-3ET [29] is a recently developed device by Infineon and belongs to the product family known as LITIX™ Interior [30], a family segment of the broader LITIX™ [31] LED driver series, specifically dedicated to the automotive market. LITIX™ Interior, as the name itself suggests, is the family of LED driver products addressing interior lighting applications. The device is a three-channel LED driver with integrated and protected output stages. It is designed to control RGB LEDs with a current up to 51.5 mA as a linear current sink (LCS).
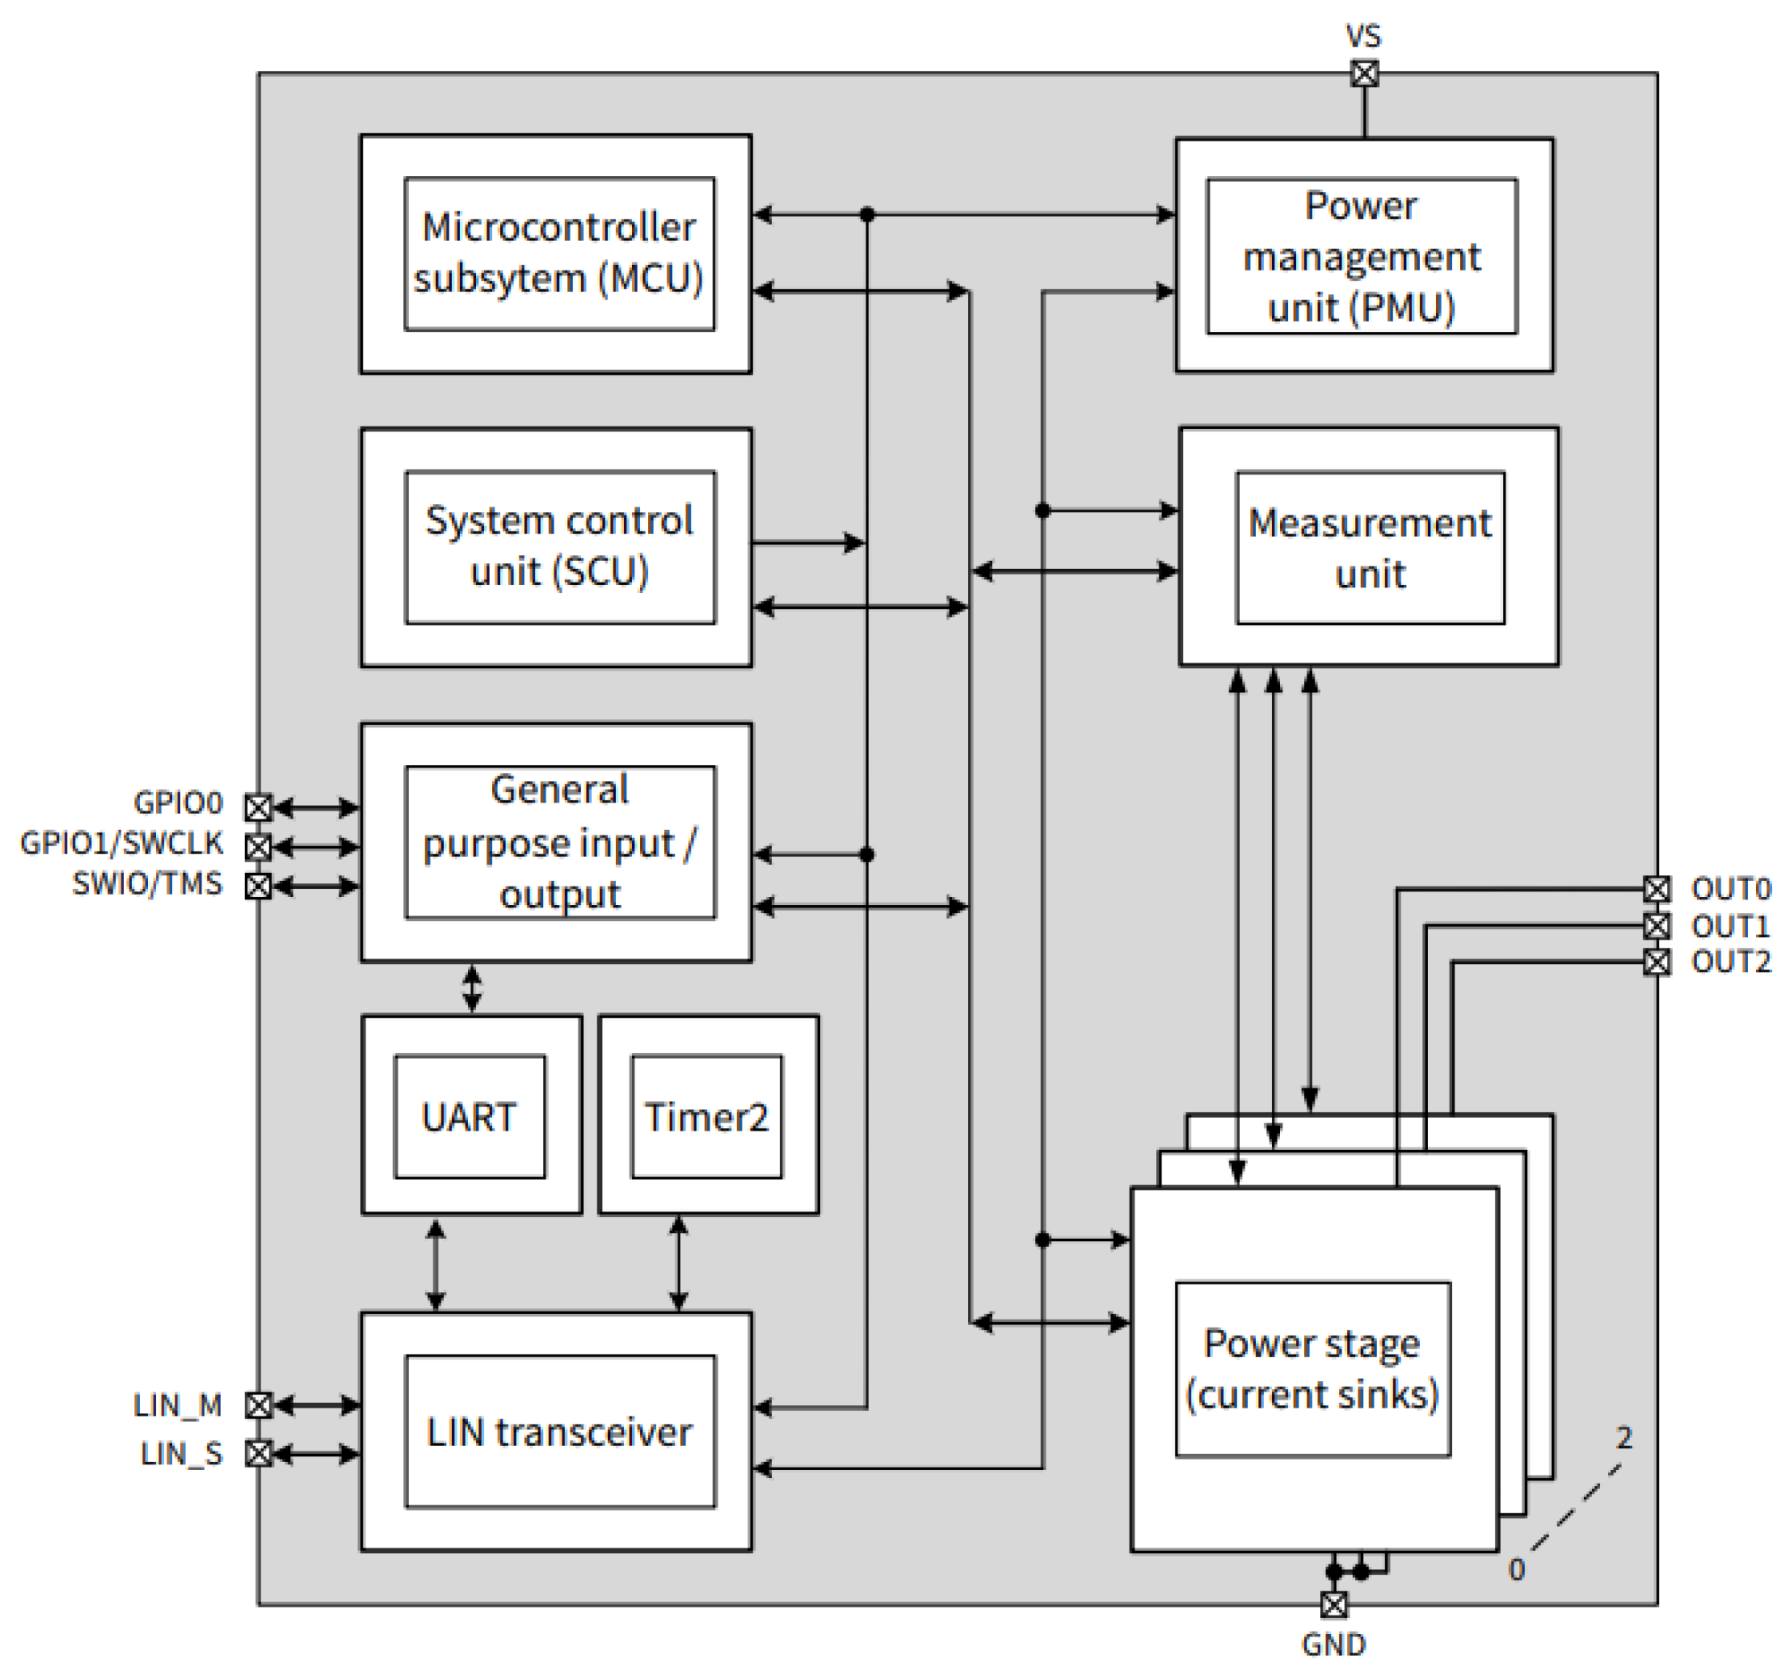
The device embeds a 32-bit ARM Cortex®-M23 core [32], accompanied by an on-chip memory configuration consisting of 32 kB of Flash (including 1000 TP memory), 576 bytes of 1000 TP memory, and 3 kB of SRAM. The block diagram of the TLD4020-3ET is shown in Figure 10.
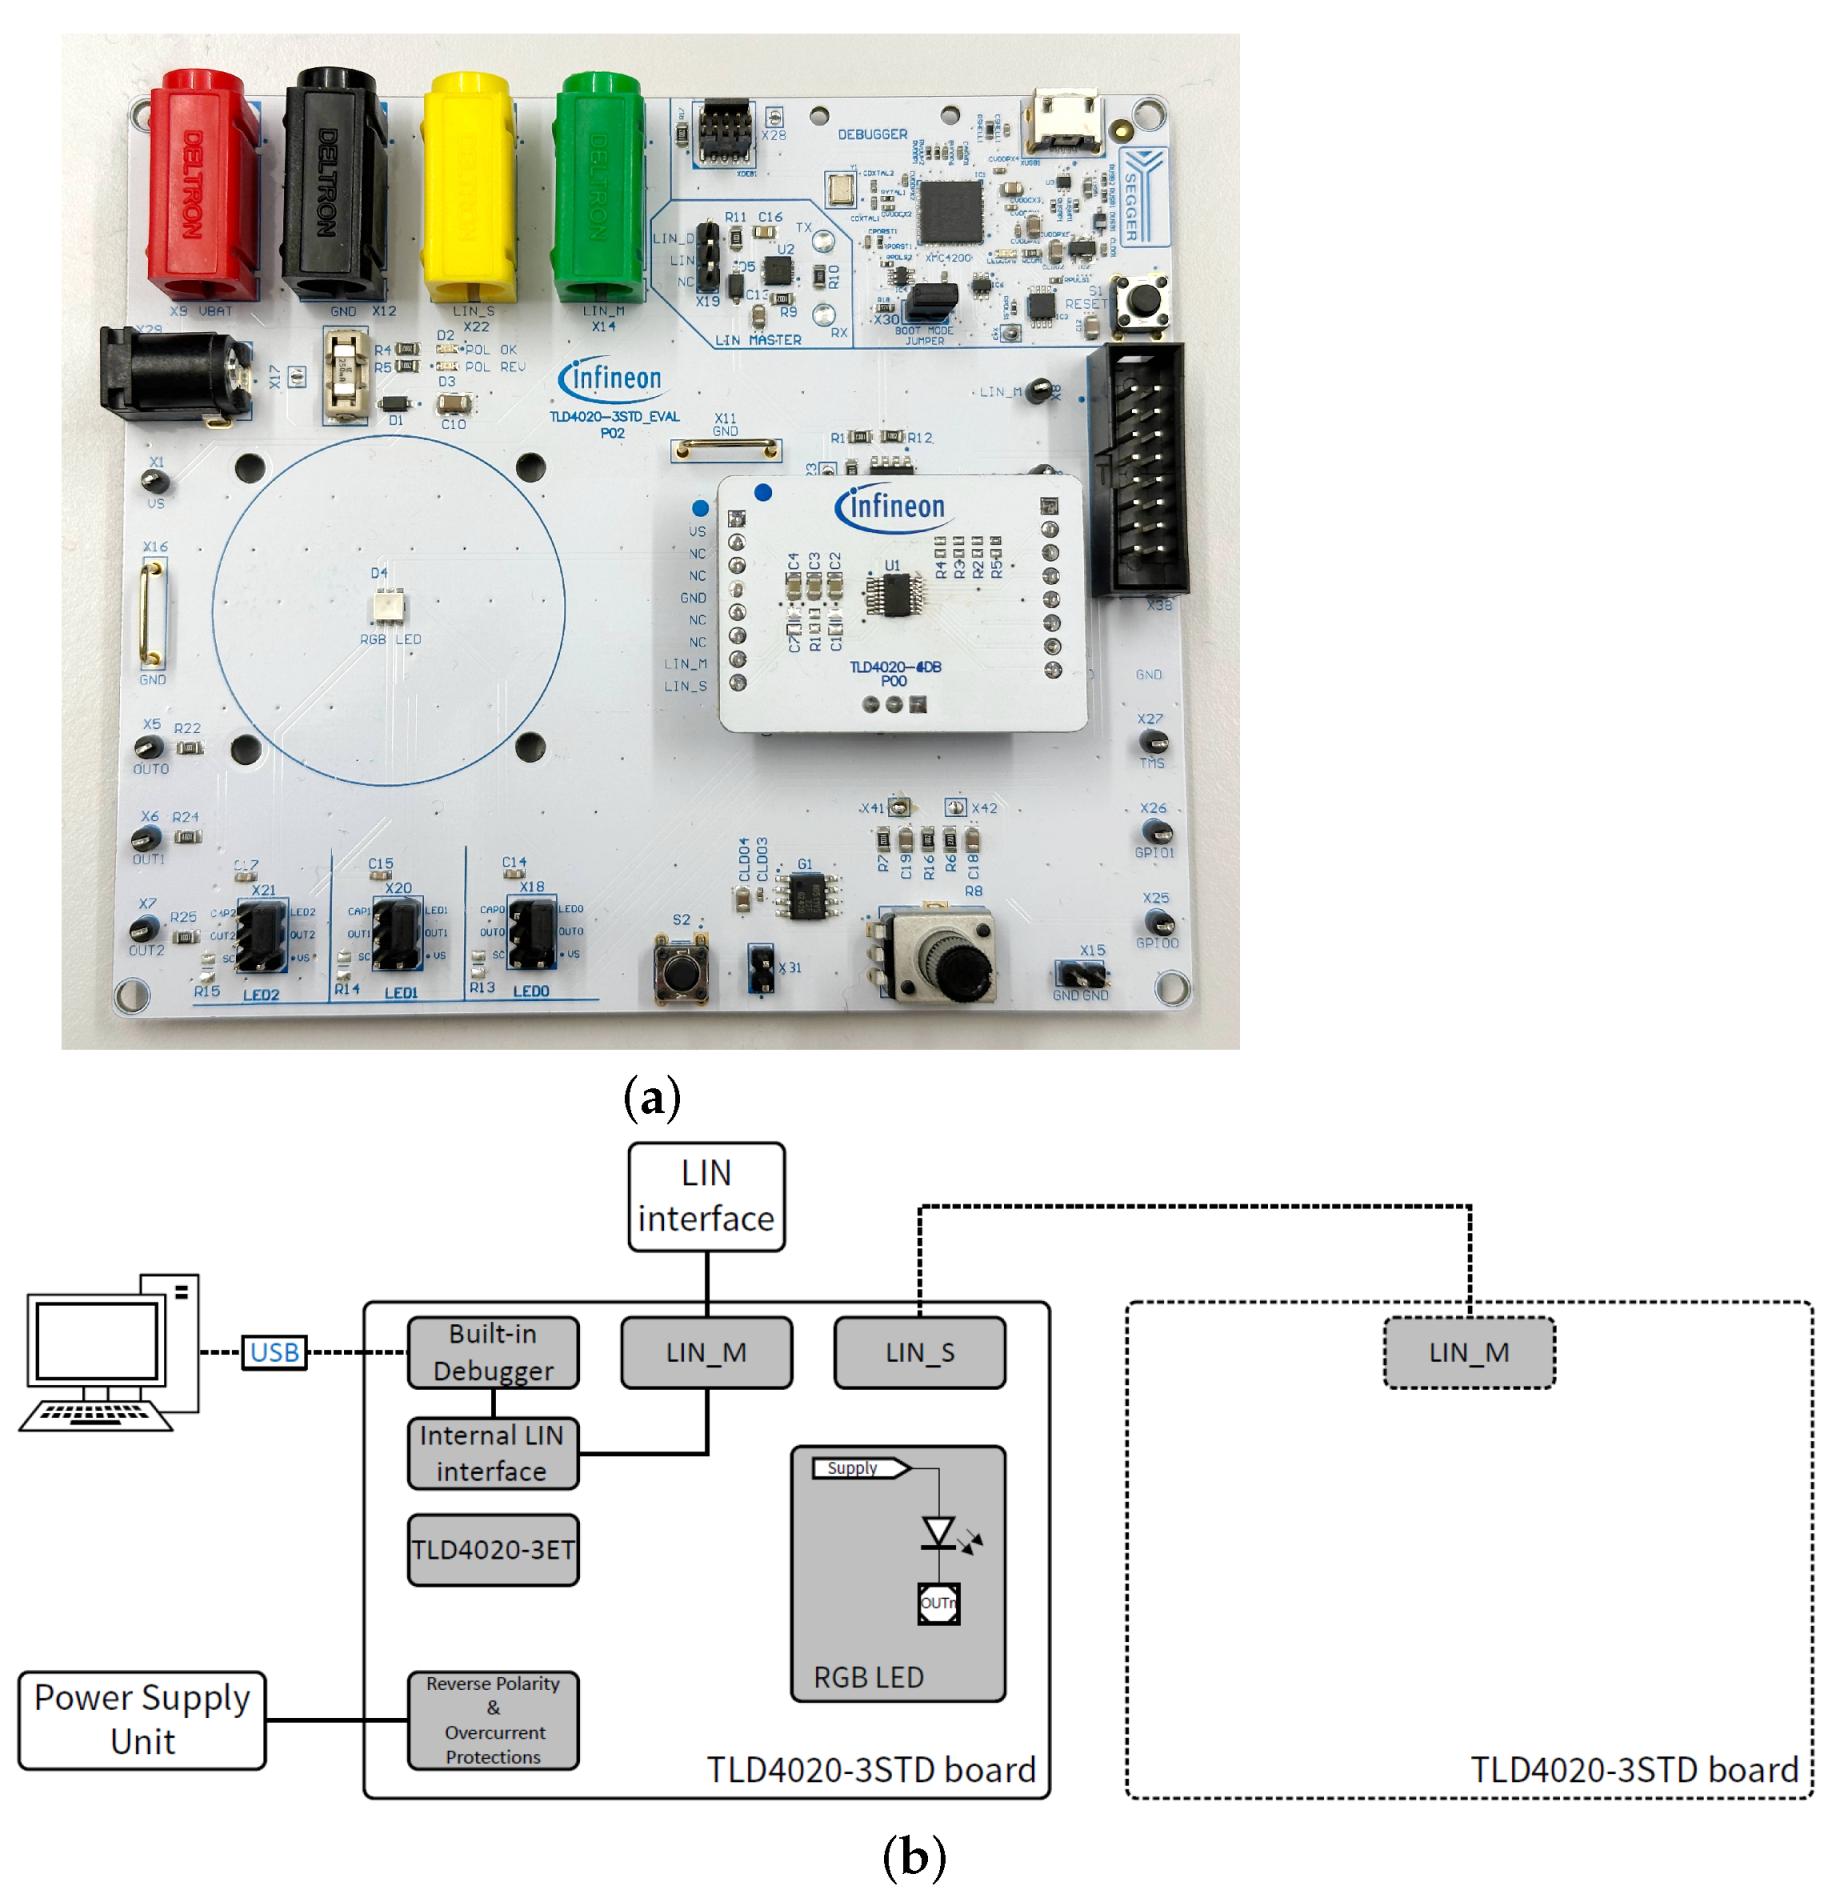
The Infineon TLD4020-3STD_EVAL in Figure 11a is an evaluation board developed by Infineon, designed to evaluate TLD4020-3ET LED driver functionalities. The board itself integrates the Nichia NSSM313AT-V1 RGB LED, as well as the TLD4020-3ET incorporated in a removable daughterboard.
In addition to the power supply connectors, equipped with both reverse polarity protection and overcurrent protection, the board incorporates an on-board LIN master and a transceiver. This component facilitates communication with other LIN modules, a particularly useful feature in applications involving multiple RGB LED drivers distributed throughout the vehicle. An example is illustrated in the simplified schematic of the evaluation board in Figure 11b. The LIN interface may be accessed either through dedicated hardware connectors or, alternatively, via a virtual serial port when the board is interfaced with a PC through the micro-USB port.
The device Nichia NSSM313AT-V1 [23] is an RGB LED manufactured by the Japanese company Nichia [34], a recognized leader and specialist in the field of LED technology. This LED has been specifically designed for interior automotive applications, such as interior ambient, instrument panels, etc., making it a reasonable option for specifications of interest to this work.
The device Nichia NFSW123F [35] is a white LED used in the RGBW setup.
The chromaticity rank selected for this work (sw27) corresponds to a nominal CCT of 2700 K, a value representative of a warm white tone. This specific CCT was selected to ensure a high CRI across the CCT range (2200 K to 6500 K) when mixed with RGB. The evaluation considered various white LEDs (2200 K to 6500 K, CRI > 90) under worst-case thermal conditions, with flux constraints from the RGB channels. The selected LED (CCT = 2700 K) offers a high CRI across a large portion of the target CCT range.

3.3.2. Software

Spectral readings are managed through the OceanView v.2.0.20 proprietary software [36] developed by Ocean Optics. The results of spectral measurements are saved in a file generated by OceanView for further post-processing, while the other output parameters are retrieved by hand. The thermal chamber is controlled via a Python (v.3.12.2) script, using pySerial v.3.5 and handling serial communication with the device to set and monitor temperature. The LED driver and the algorithm, on the other hand, are developed in Keil µVision v.5.32, where register values can be directly modified via the debugger to set specific LED duty cycles, or alternatively, the full algorithm can be flashed onto the device for standalone execution.

3.3.3. Measuring Instruments and Calibration Procedures

The following measurement instrumentation has been used:
  • Vötsch VT 7004 thermal chamber: it is a compact climatic chamber, engineered for precise environmental testing, offering an internal volume of 37 L. It is capable of reaching temperatures as low as −70 °C, with a maximum of 180 °C [37].
  • Keithley 2110 digital multimeter and RS PRO RS52: the thermal chamber internal temperature may differ from that of the LED junctions, which is the quantity of true interest, as it is ultimately the one to be estimated. For this reason, an additional thermometer, namely a K-type thermocouple, is required to be positioned in close proximity to the LED to measure the junction temperature as precisely as possible.
  • Ocean Optics SR4 spectrometer: the instrument employed herein is capable of analyzing specifically the visible spectrum and a portion of the near-infrared region (NIR), as its declared range extends from 345 to 1054 nm.
The setup employed for the validation of the algorithm makes use of both the aforementioned hardware and software components. Specifically, the RGB algorithm is executed directly on the selected platform, that is, the TLD4020-3ET mounted on the TLD4020-3STD_EVAL evaluation board.
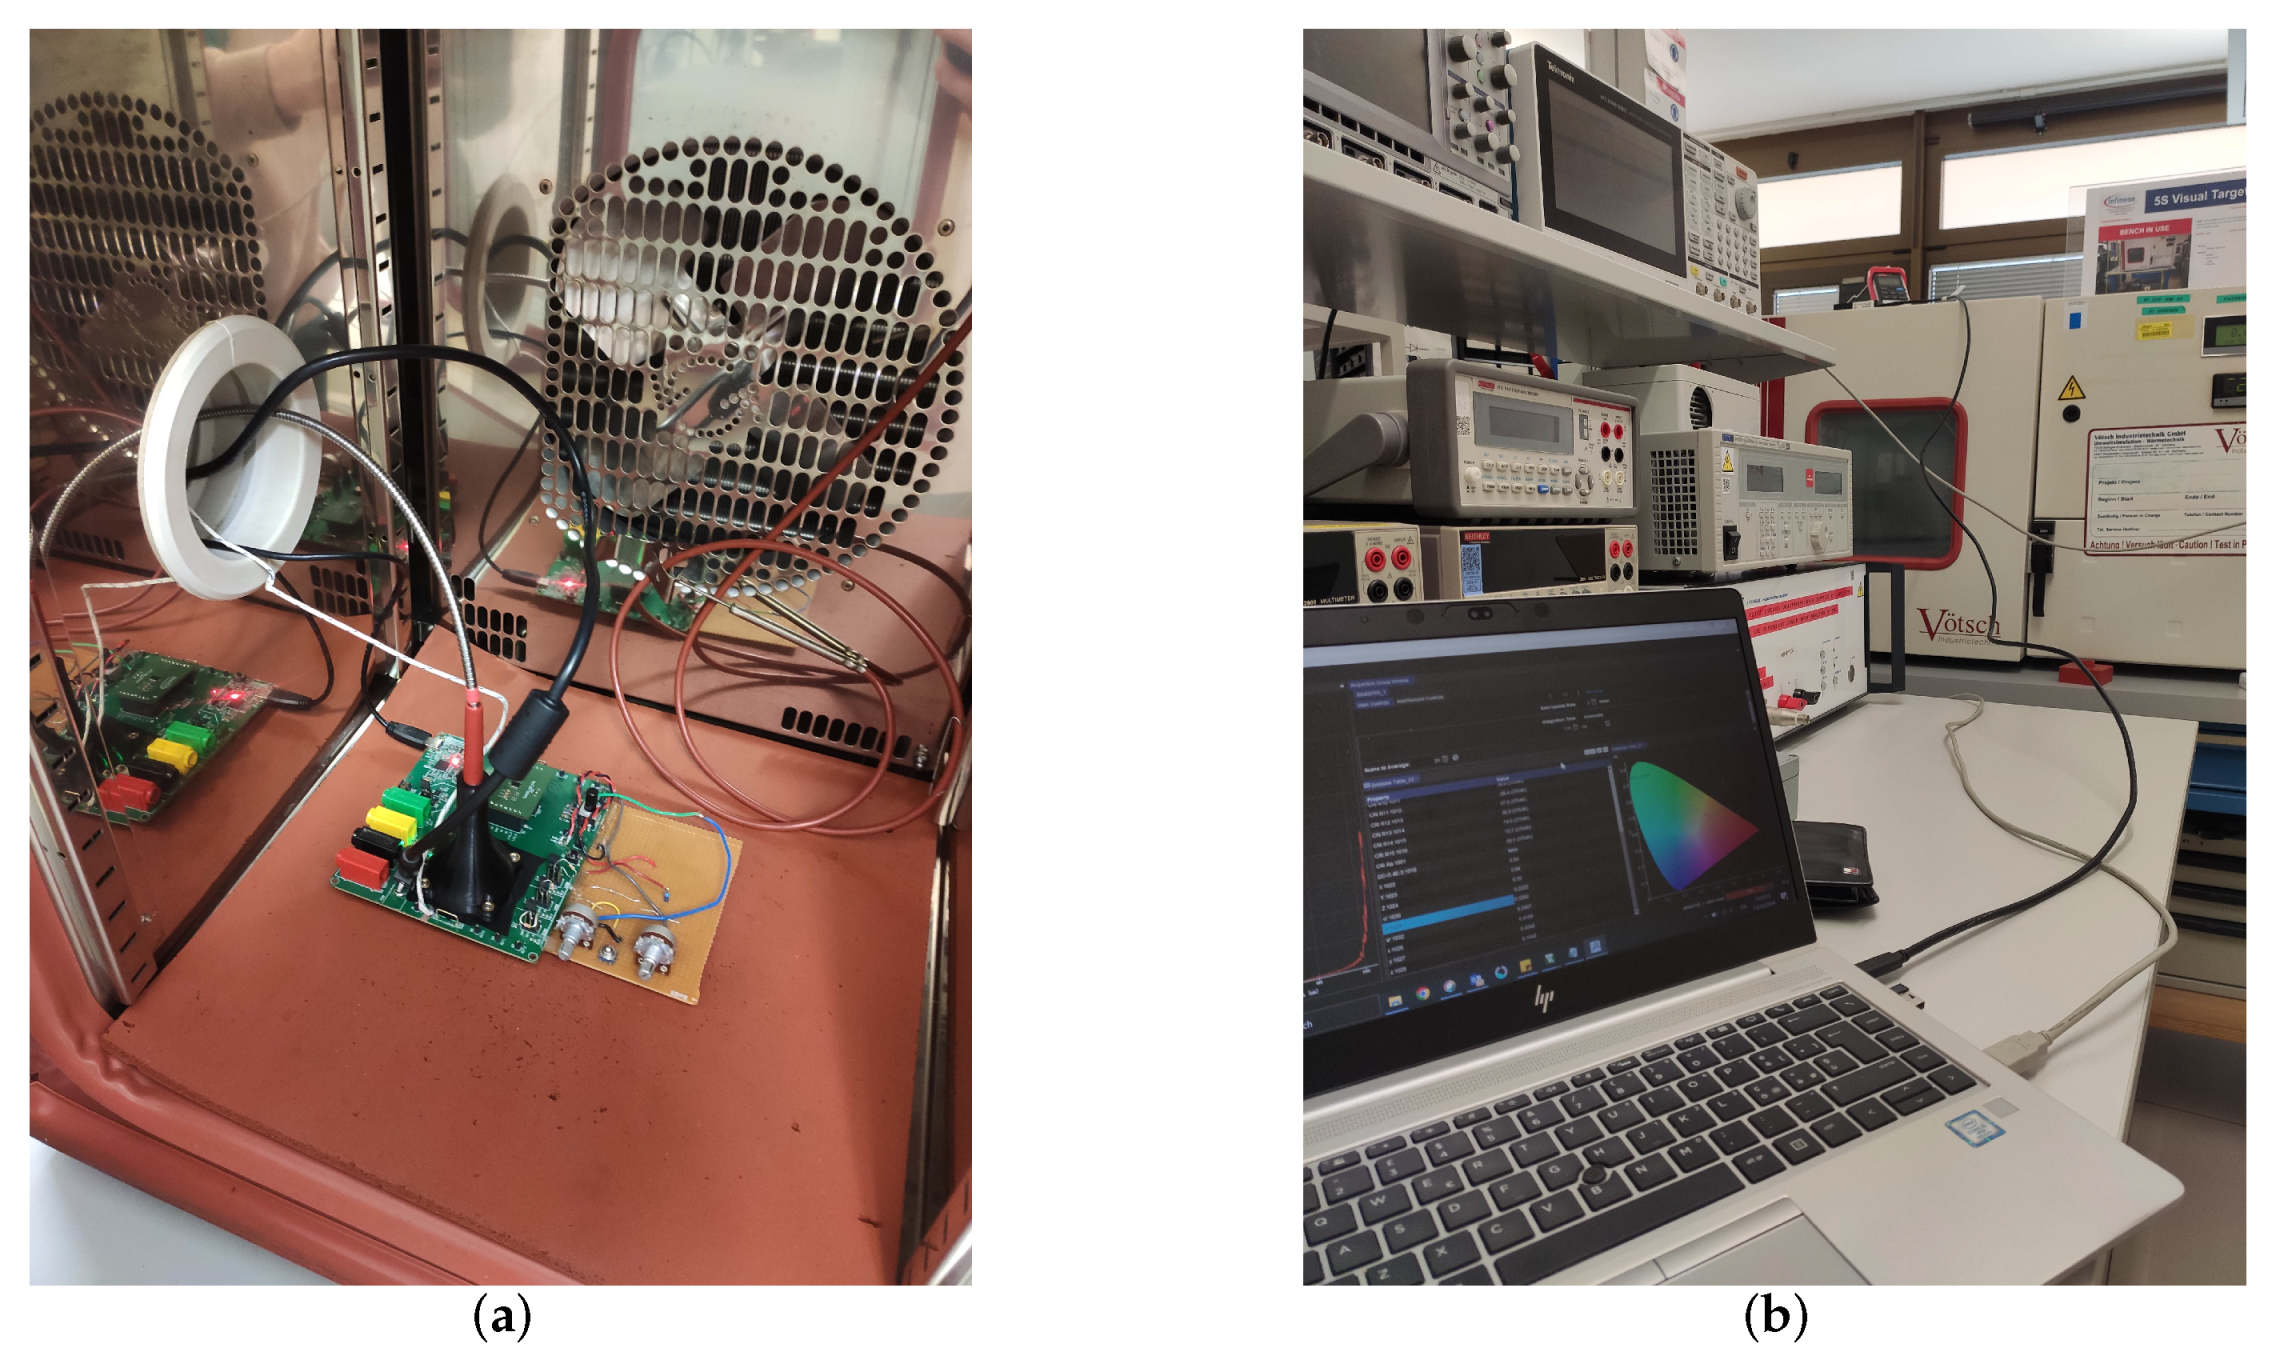
The configuration illustrated here is used for both the calibration and the testing phases of the algorithm; indeed, calibration can be thought of as a particular case of testing, performed at a single reference temperature. An example of the practical connections on the evaluation board is depicted in Figure 12a. As shown, the board is placed inside the thermal chamber, with all necessary connections, including the thermocouple, power supply cable, debugging connection, and spectrometer probe, routed through the dedicated cable opening of the chamber, which is subsequently sealed to minimize thermal leakage.
The spectrometer probe, clearly visible in the figure, is held in position by a custom-designed, 3D-printed probe holder.
Outside the thermal chamber, the board’s power supply is connected, and the thermocouple is connected to the portable thermometer. Meanwhile, the thermal chamber, the debugger of the evaluation board, and the spectrometer are all connected to the computer via USB connections. These connections are shown in Figure 12b, which captures the execution of a test.
The described setup was used for the following steps:
  • Calibration procedure: the goal of the calibration phase is to establish, for each LED, the luminous flux Φ and chromaticity coordinates ( x , y ) at a reference temperature. Additionally, the forward voltage ( V f ) calibration is performed automatically by the algorithm at startup, which requires the system to be stabilized at 25 °C. Alternatively, it is possible to hardcode a previously acquired V f calibration curve, avoiding the need to repeat this step at every power-up, since it is redundant once properly acquired.
  • Testing and validation procedure: the algorithm validation procedure is intended to verify its operation under real operating conditions, specifically with respect to its ability to maintain color constancy as the ambient and junction temperatures change. This means, in practice, ensuring that the chromaticity of the emitted light, as measured with the spectrometer, remains effectively stable over temperature. More precisely, the color output must not deviate by more than 0.01 in the u v color space from the target point across the entire thermal range being tested.

3.3.4. Variation for RGBW Setup

The RGBW setup is similar to the RGB case.The main difference is in the LED driver and the evaluation board employed, since, for RGBW, the three output channels are no longer sufficient. As a consequence, the system was extended to include an additional output channel for the white LED.
Both RGB and white LEDs were mounted on the same PCB and soldered in close proximity; they are not far enough apart to affect the visual perception of the mixed color output. Figure 13a illustrates the placement of the two LEDs on the PCB.
Since the RGB and white LEDs are not housed within the same package, the distance between them may not help proper color mixing, especially in measurements involving a spectrometer. This spatial offset can lead to issues: the light beams emitted by the individual LEDs might not be perfectly blended by the time they reach the probe, and this may result in inaccurate measurements. Even though the cosine corrector alone is designed to mitigate such angular discrepancies, it may not be sufficient.
To fix this issue, a diffuser snap was used. A diffuser snap is a white, translucent plastic cap that is mounted directly above the LEDs. The function of the snap is to diffuse the light, transforming what would otherwise be a harsh, directional beam into a softer, more homogeneously distributed glow. The diffuser scatters the light as it passes through the material, effectively “blurring” the individual emission points from the two LEDs. In Figure 13b, an example of how the diffuser placed above the two LEDs scatters the light can be seen. While it is true that the snap diffuser significantly improves visual performance as well as measured results, it is equally true that it drastically reduces the luminous flux. This trade-off was considered acceptable in the experimental validation phase, since achieving spatial color uniformity, and so repeatable measurements, was prioritized over preserving absolute brightness. It is worth noting that, in automotive applications, the emitted light is typically mixed by means of light pipes or light guides. Consequently, the experimental setup employed in this work more closely reflects the actual operating conditions than the unrealistic scenario of completely exposed RGB and white LEDs.

4. Experimental Results

4.1. RGB Algorithm

In order to verify the actual correctness of the mathematical calculations and the real behavior of the temperature compensation algorithm for RGB LEDs, a validation, i.e., testing under temperature conditions, is required. This testing should simulate a realistic scenario where the algorithm could realistically be applied: the interior of a car.
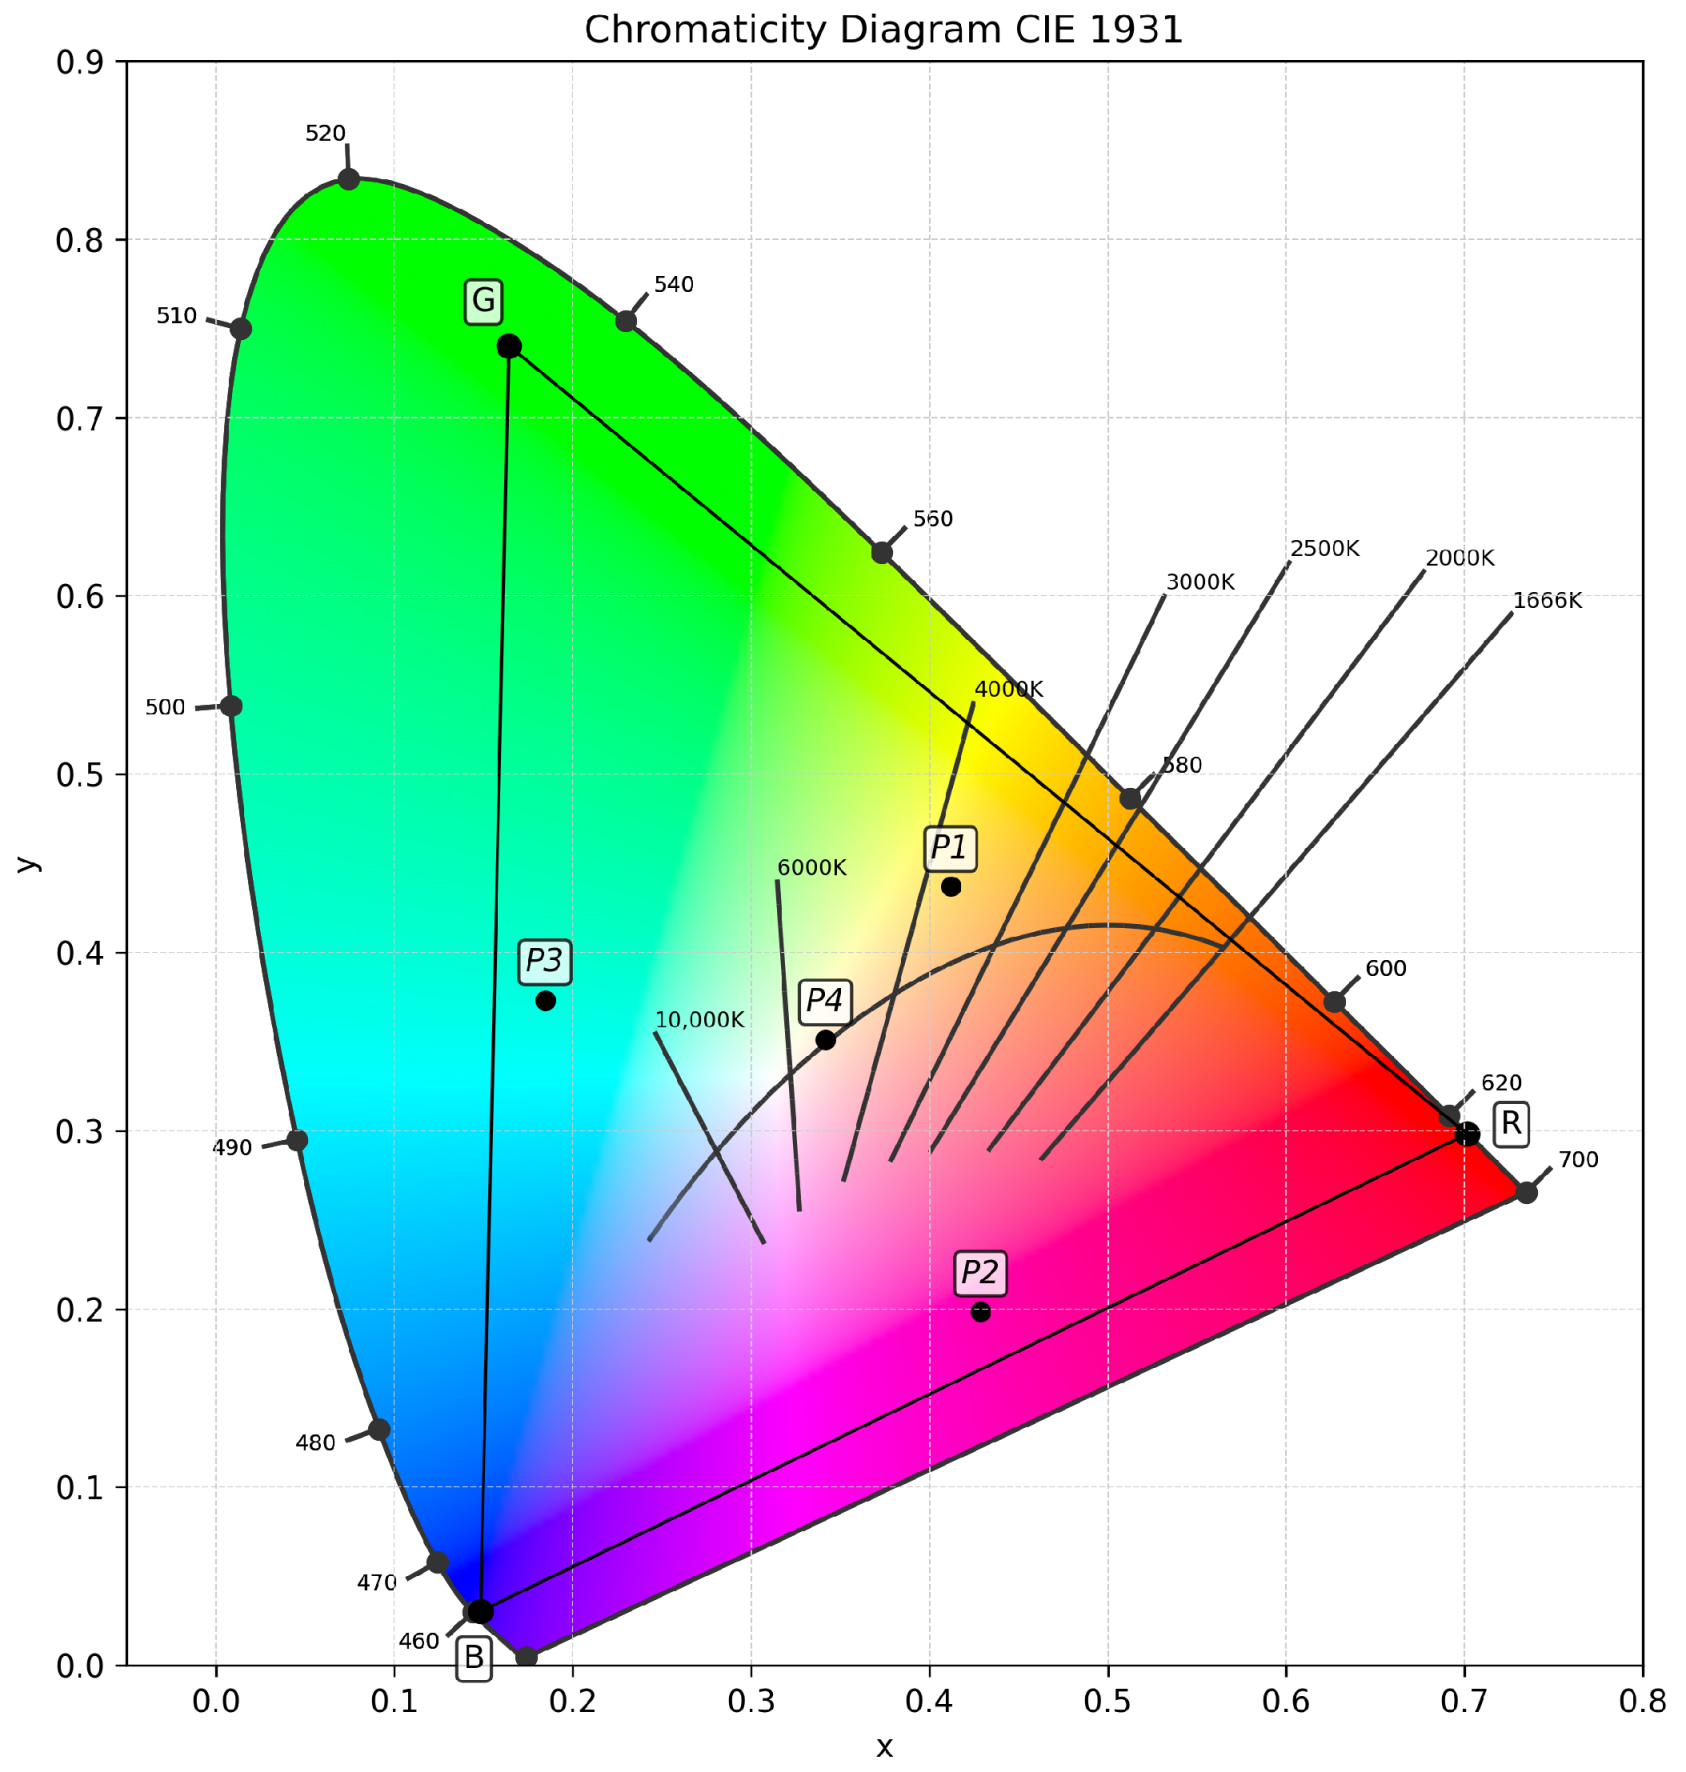
In order to test the RGB compensation algorithm, a series of target color points were selected, each chosen according to its specific position within the chromaticity diagram. More precisely, four distinct color points were considered, whose chromaticity coordinates are listed in Table 2 and shown in the CIE 1931 diagram of Figure 14. All four test colors were evaluated at the maximum achievable relative luminance, that is, L t = 10,000.
The selection of these particular chromaticities was on purpose, since prior measurements suggested which color combinations are most susceptible to temperature drift in the absence of compensation.
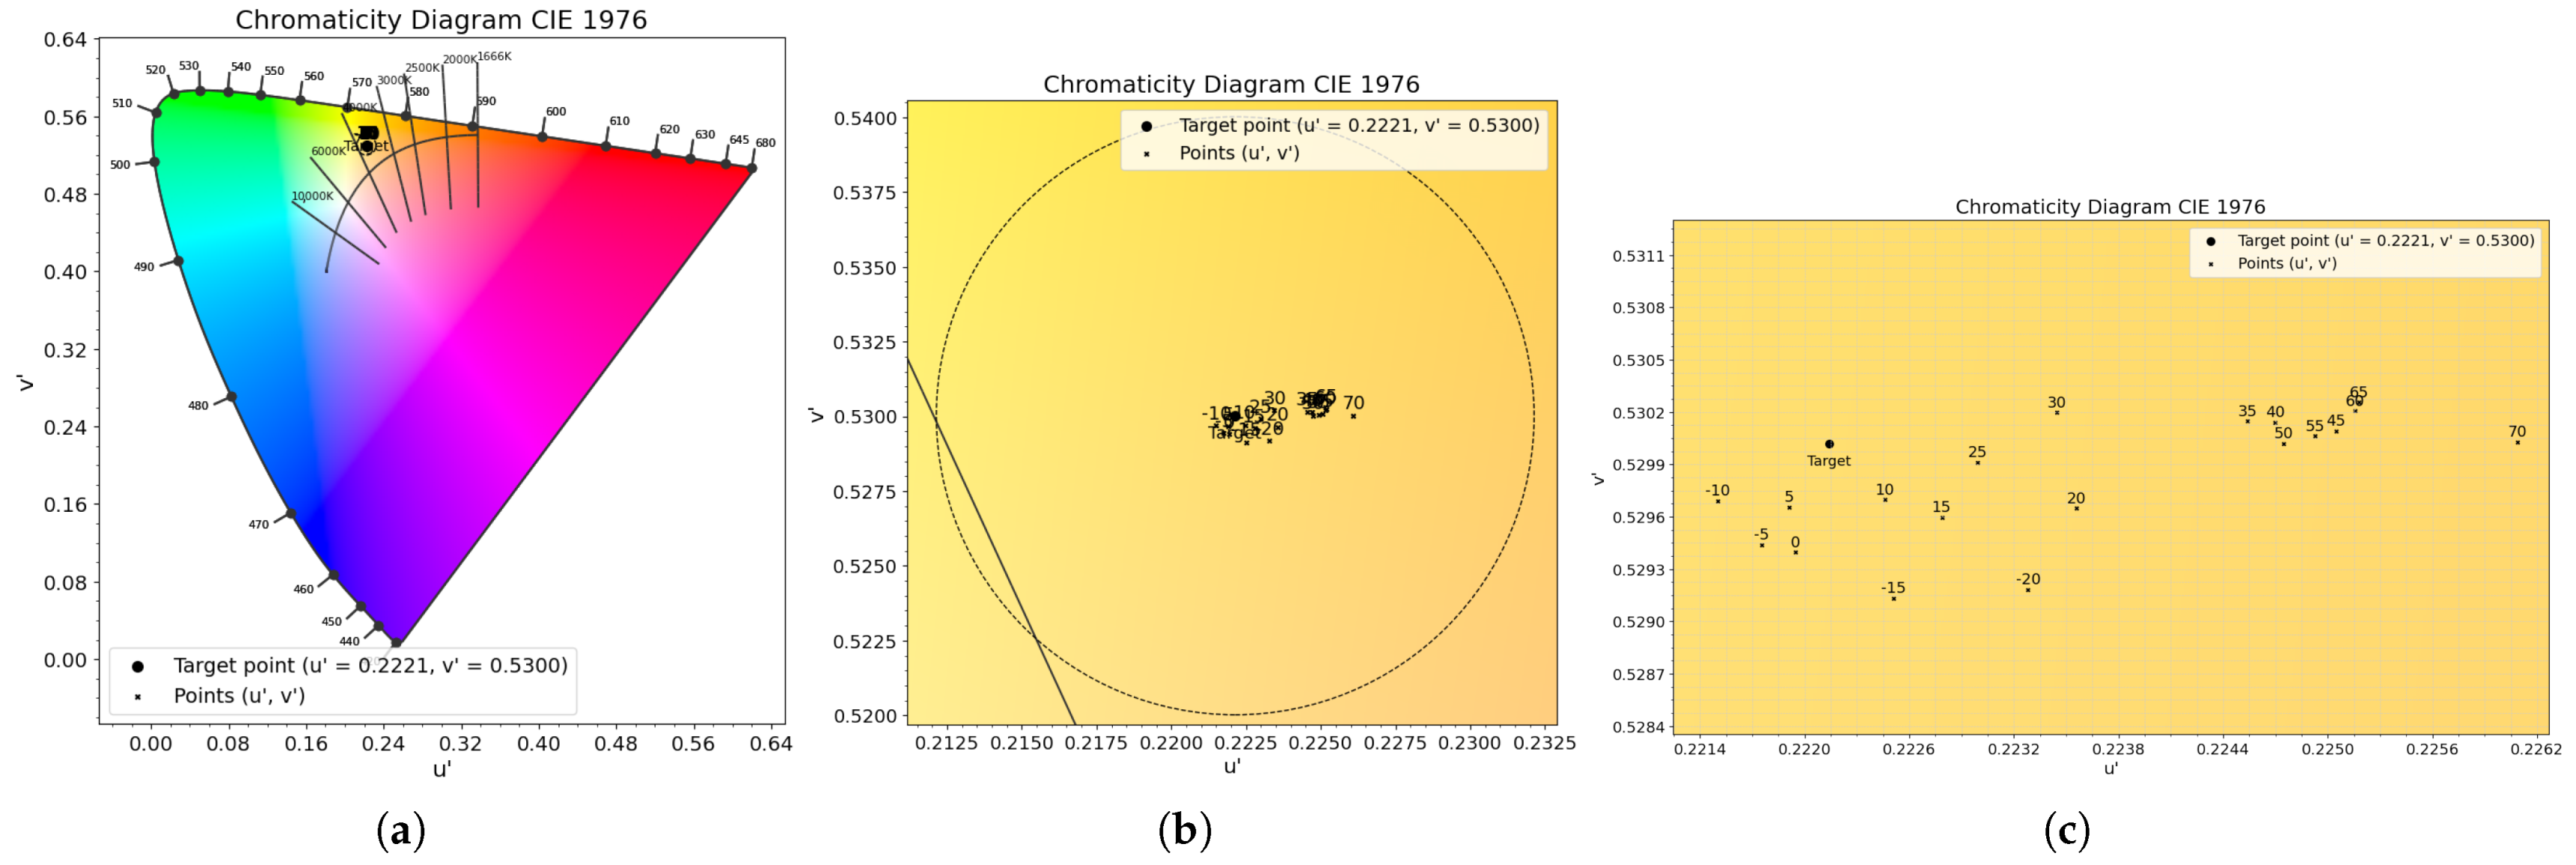
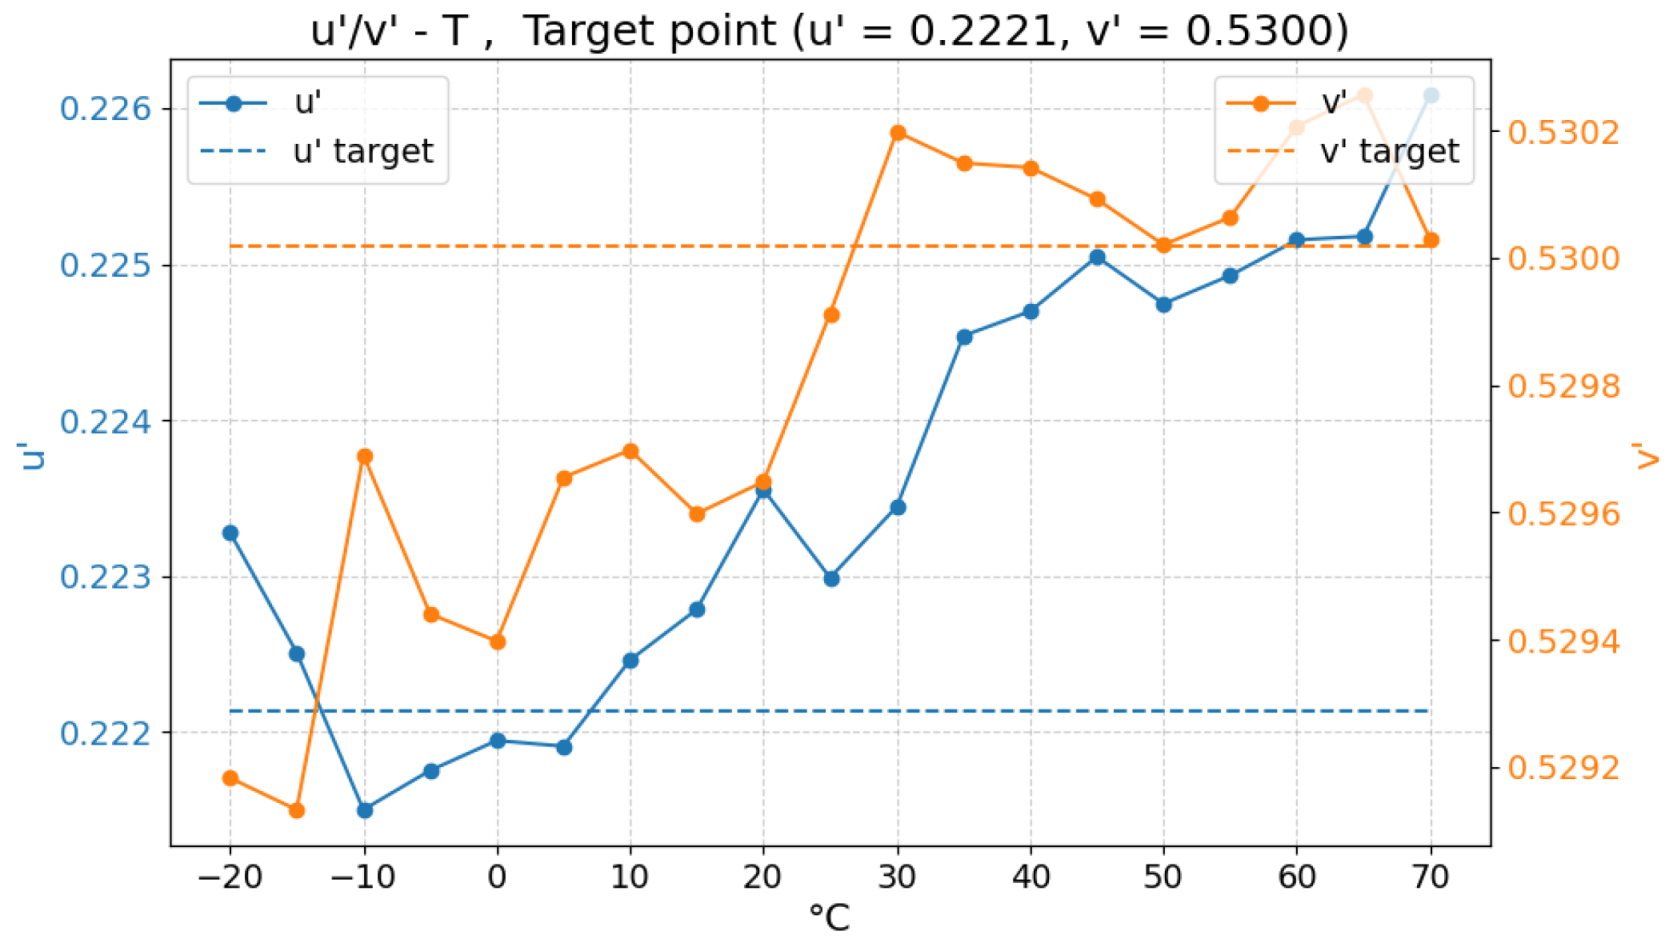
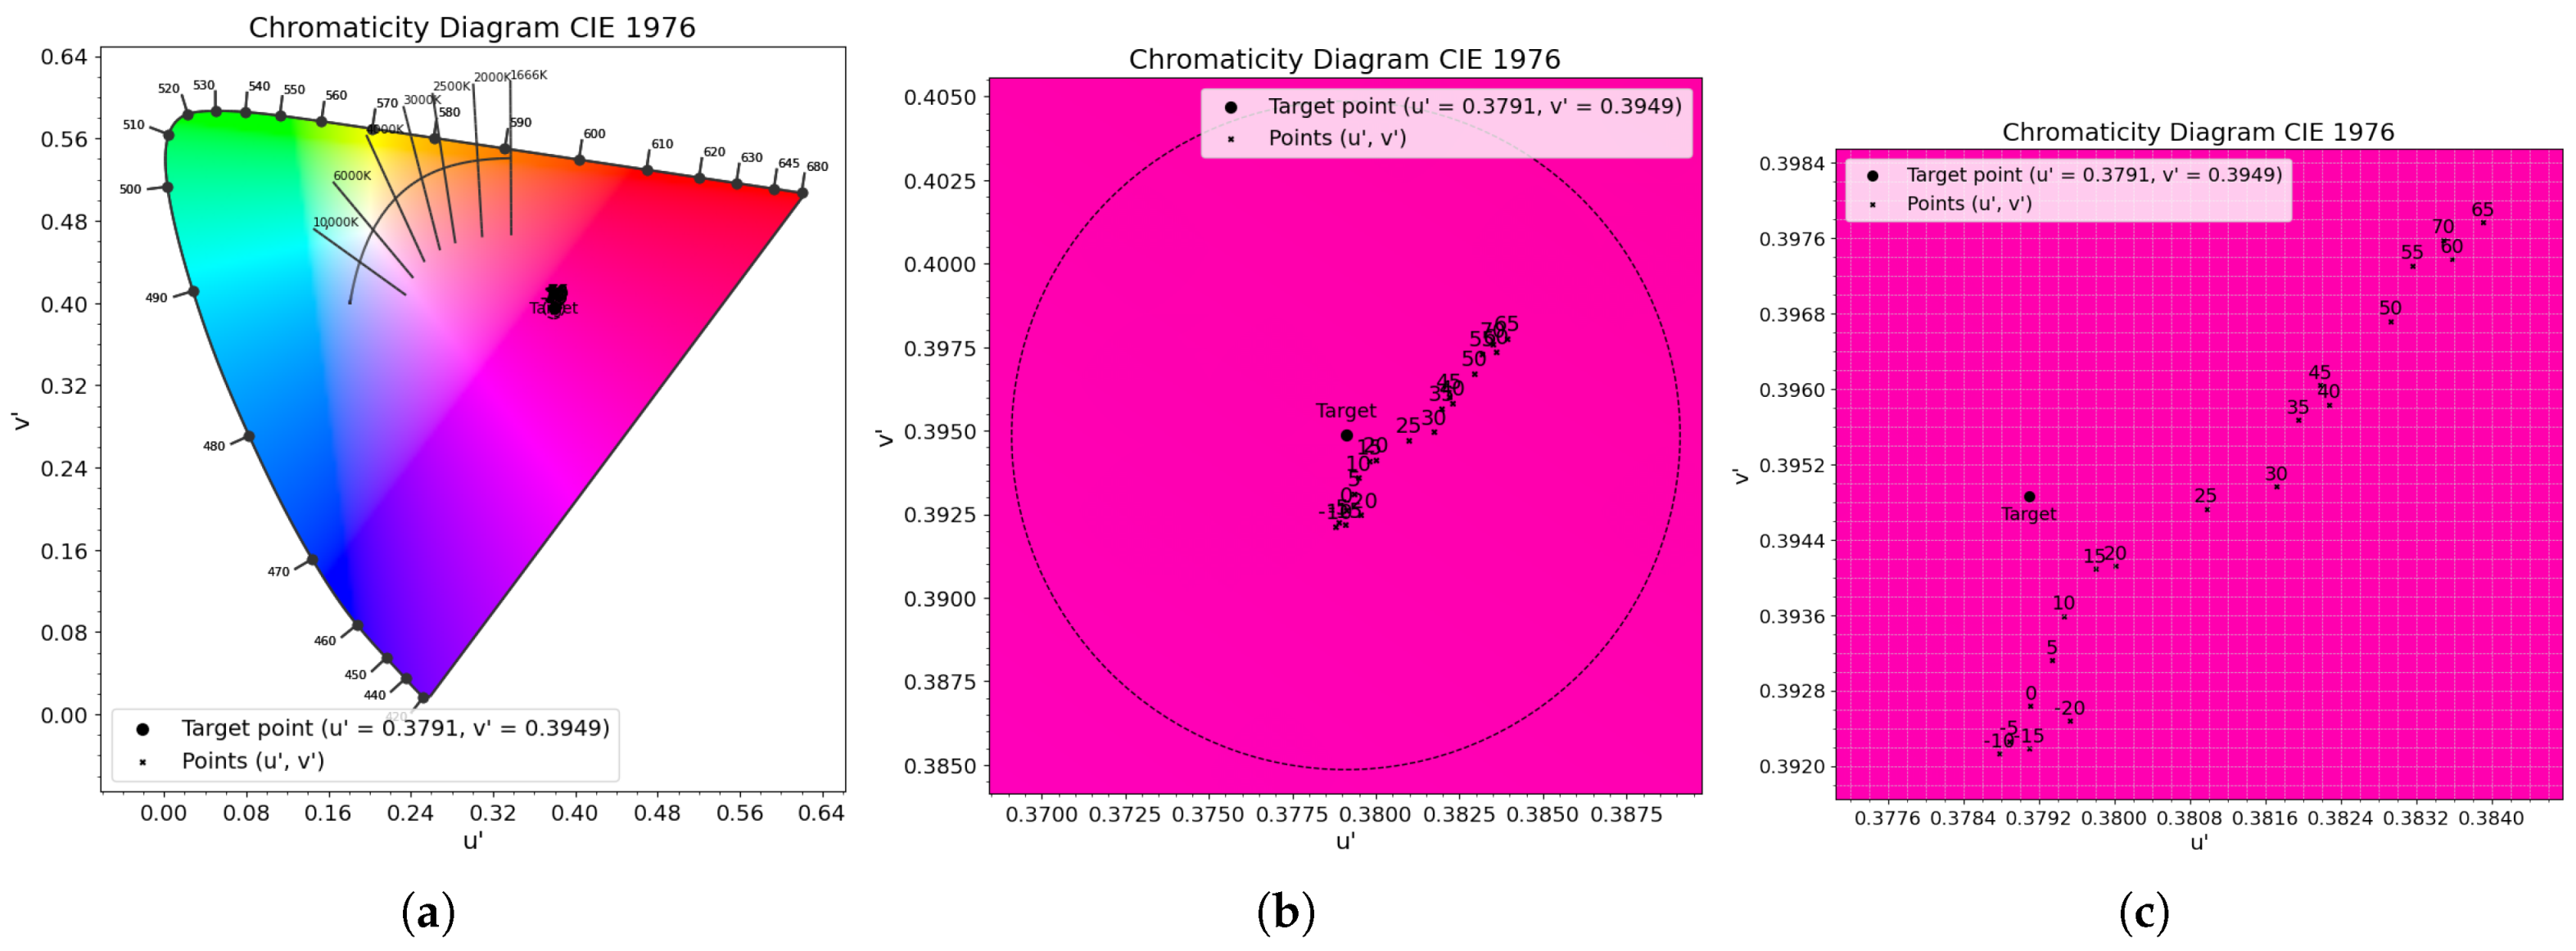
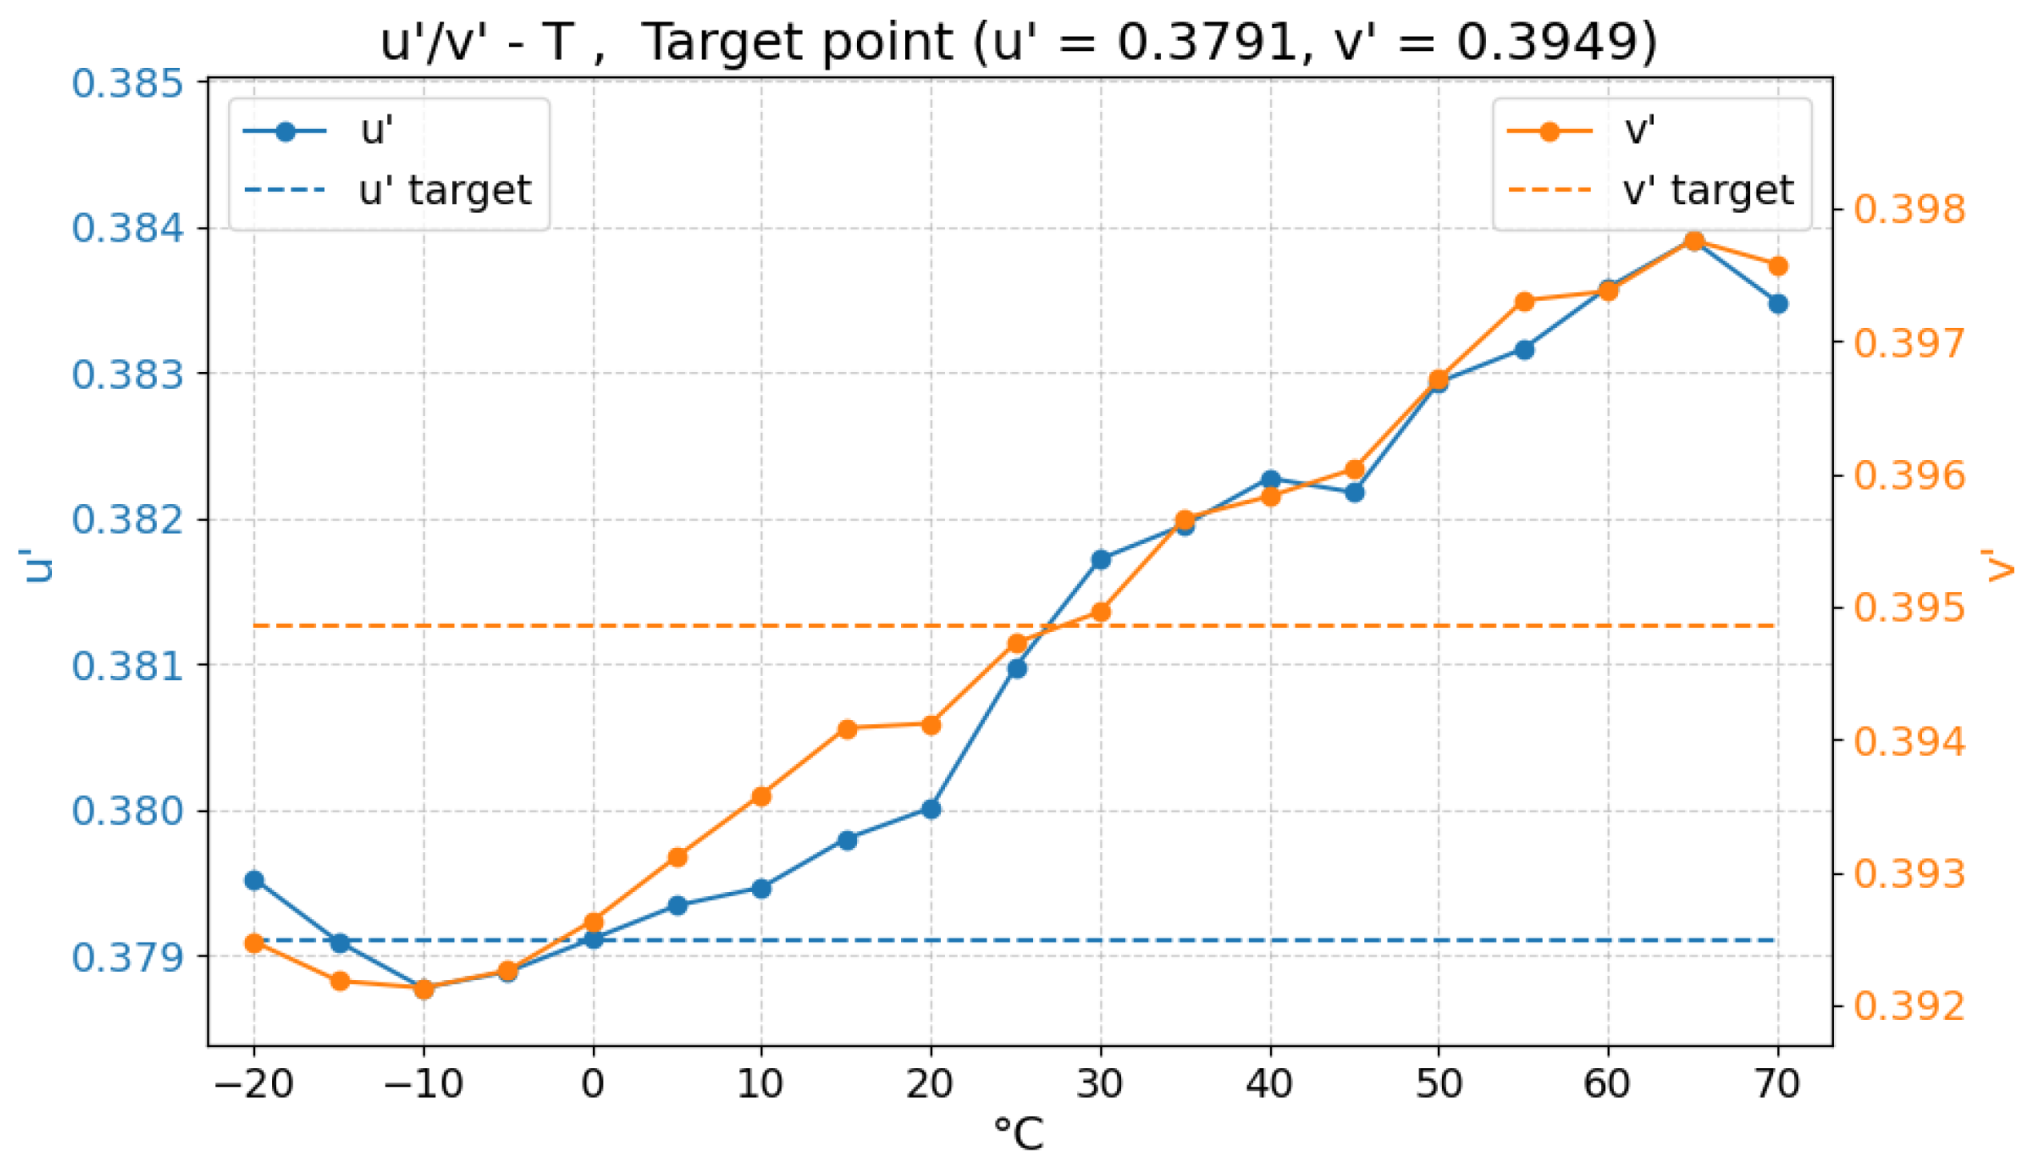
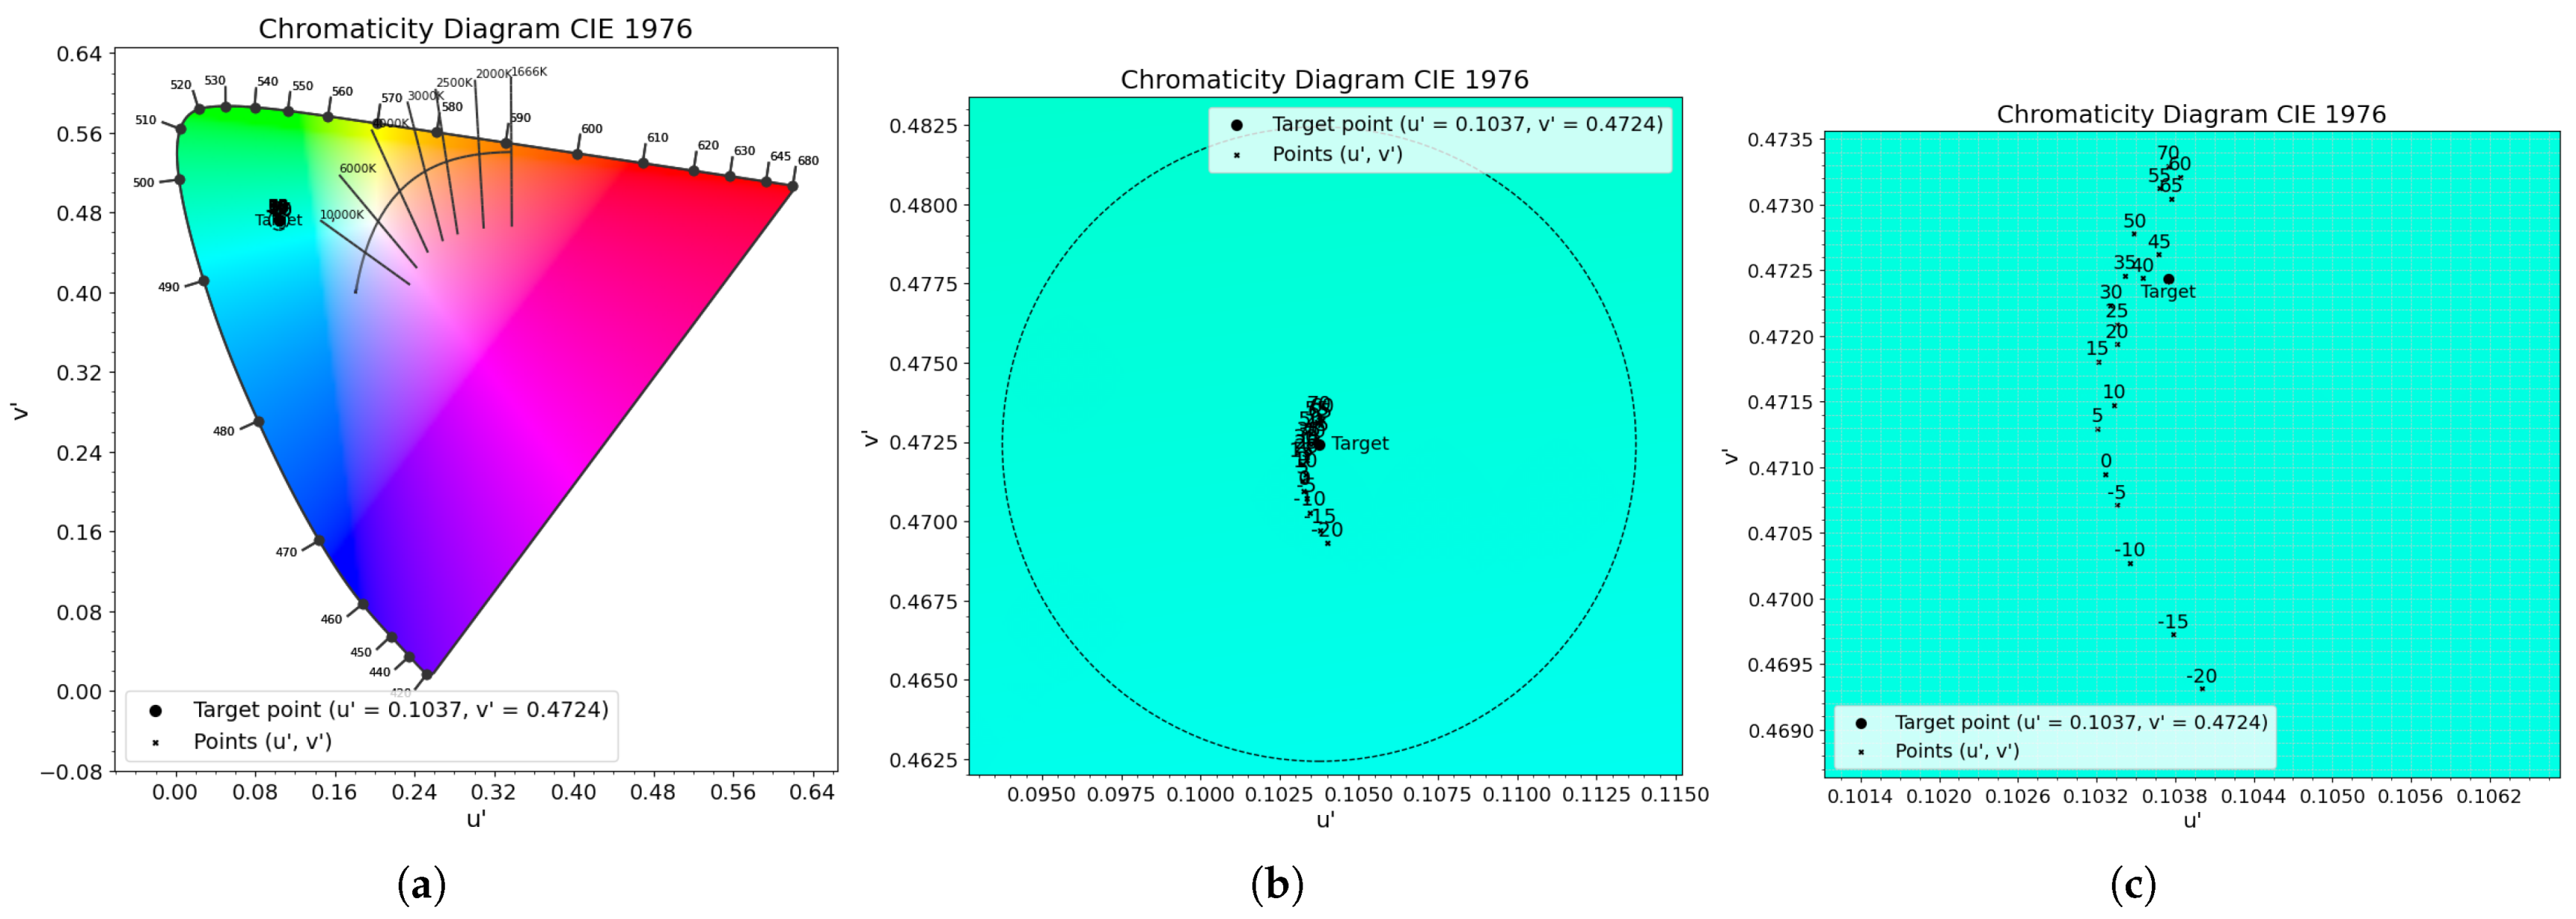
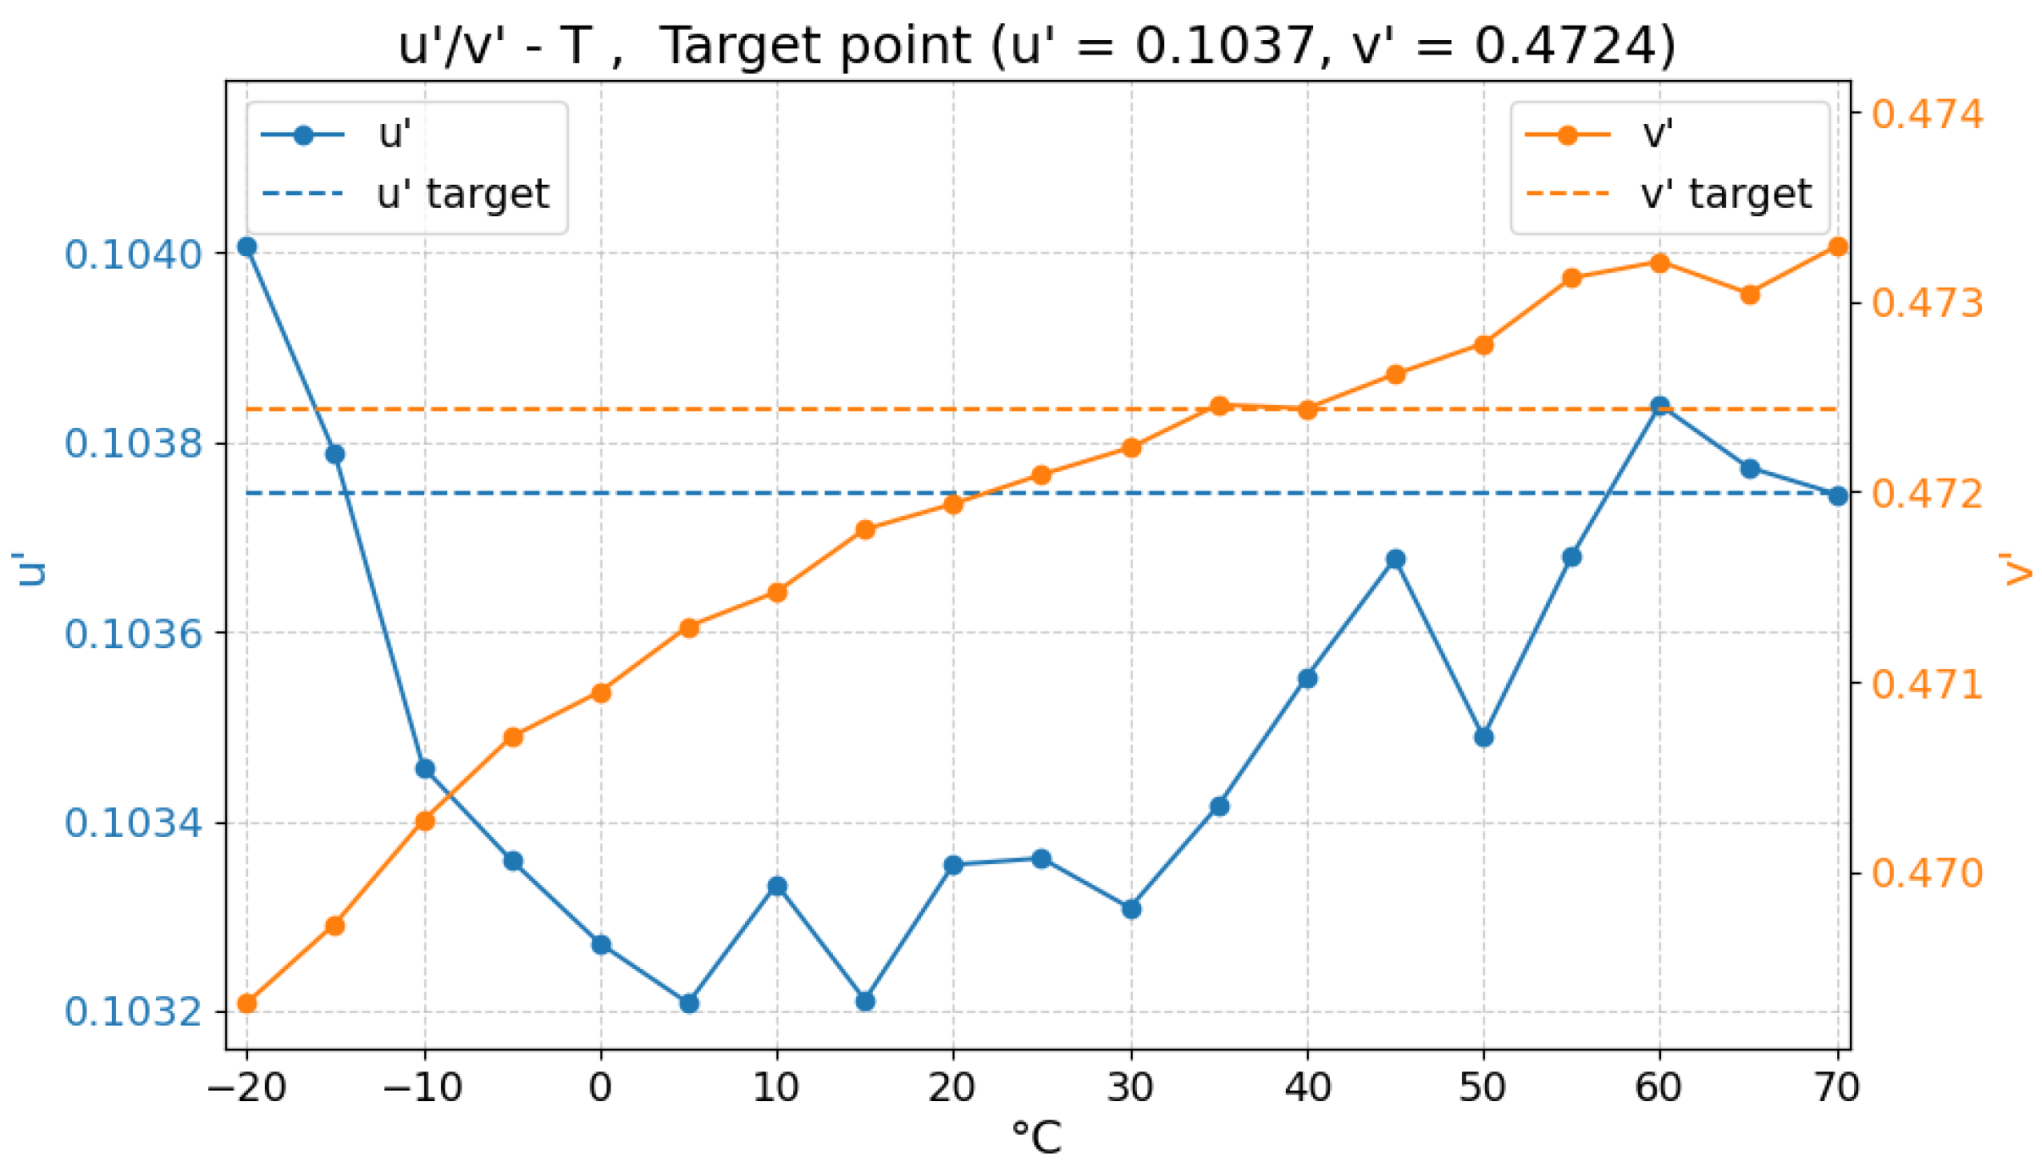
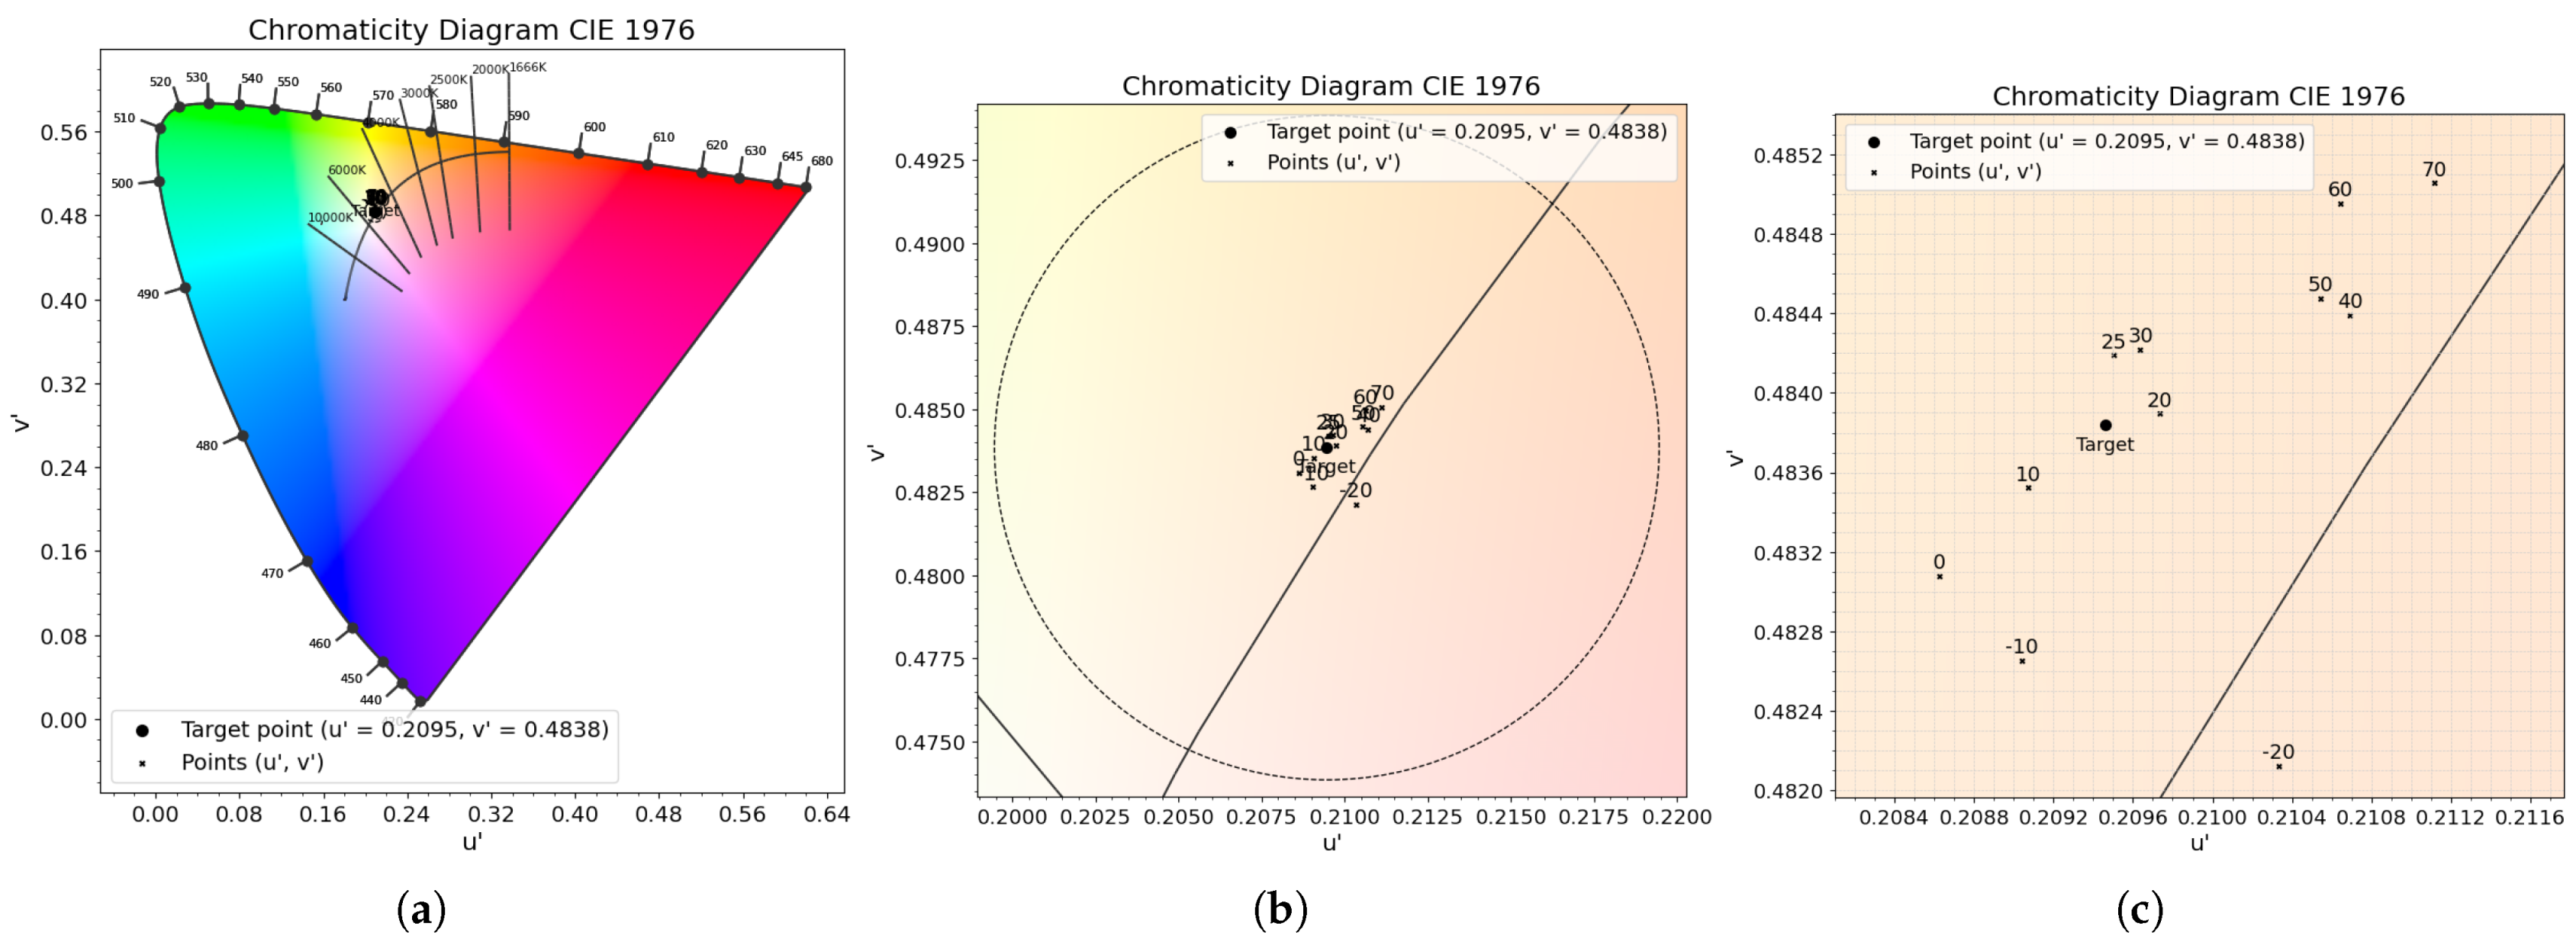
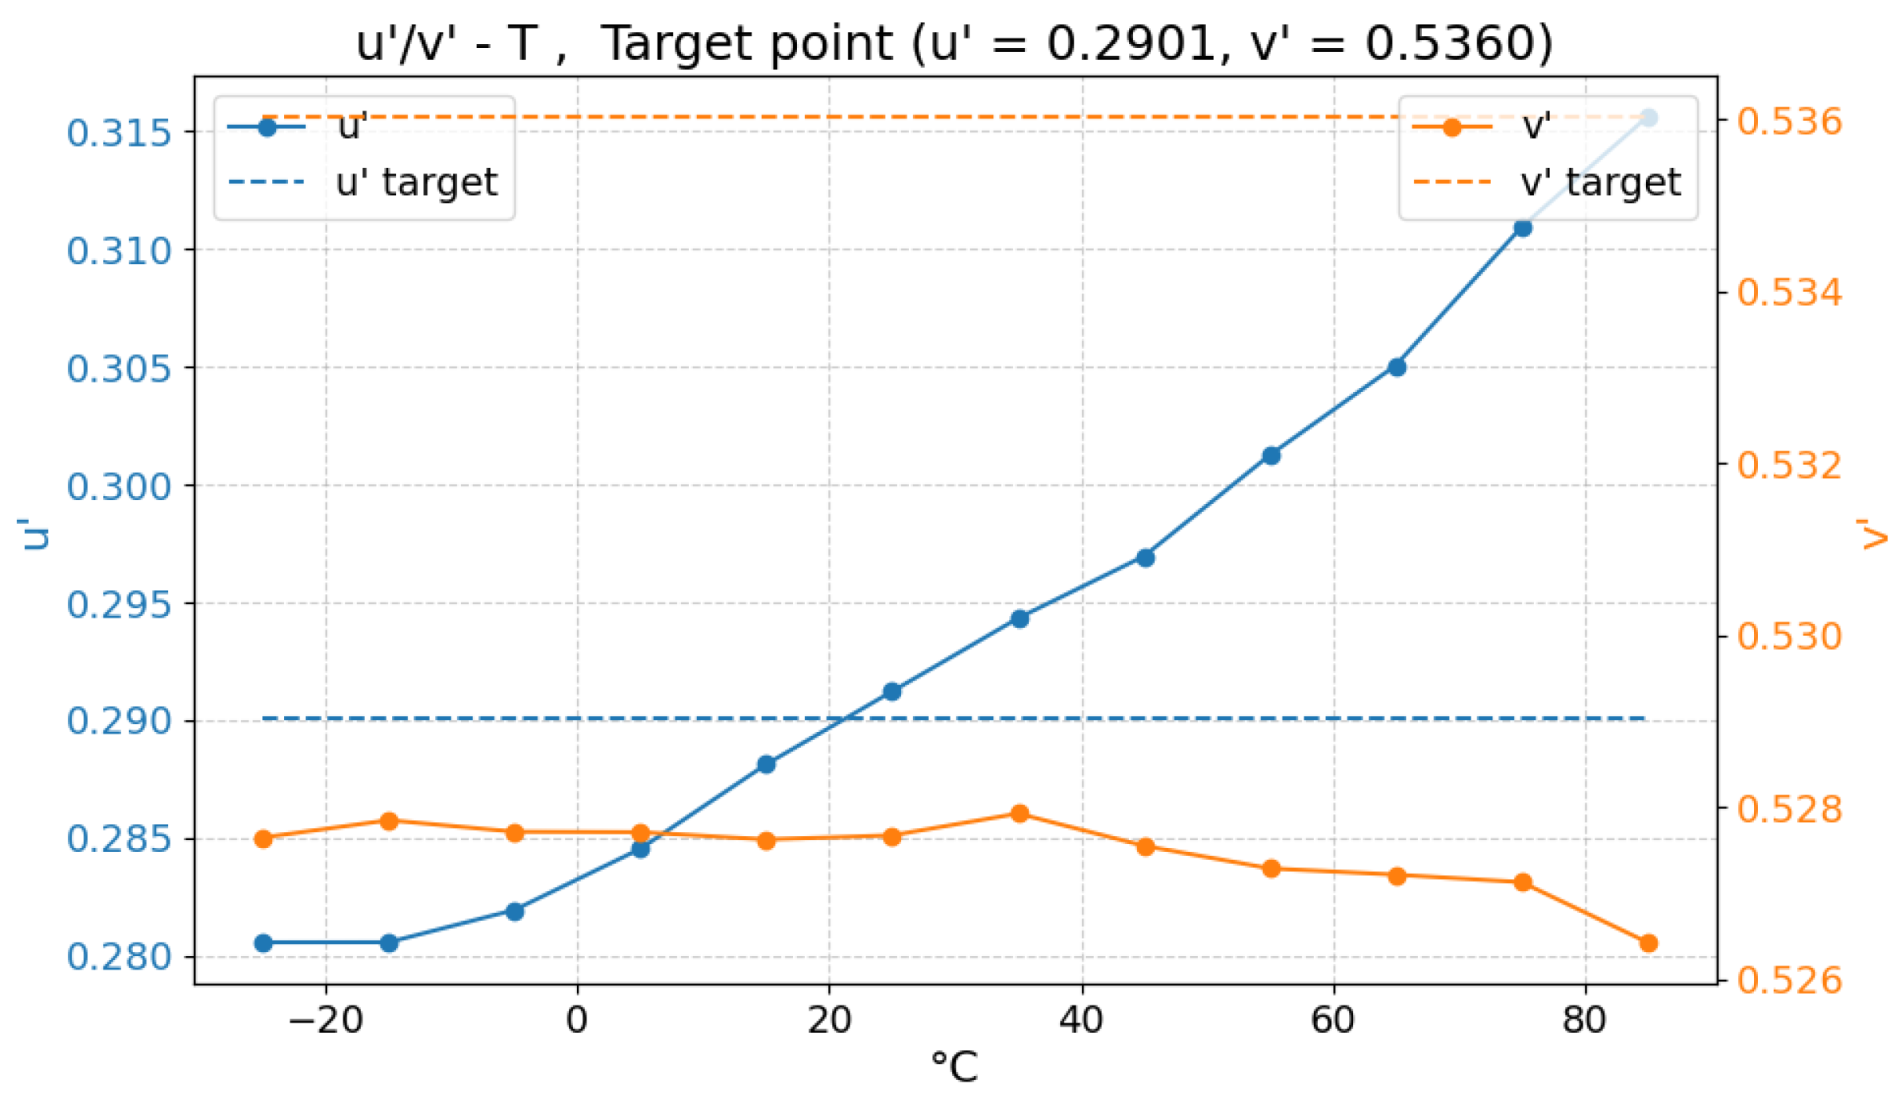
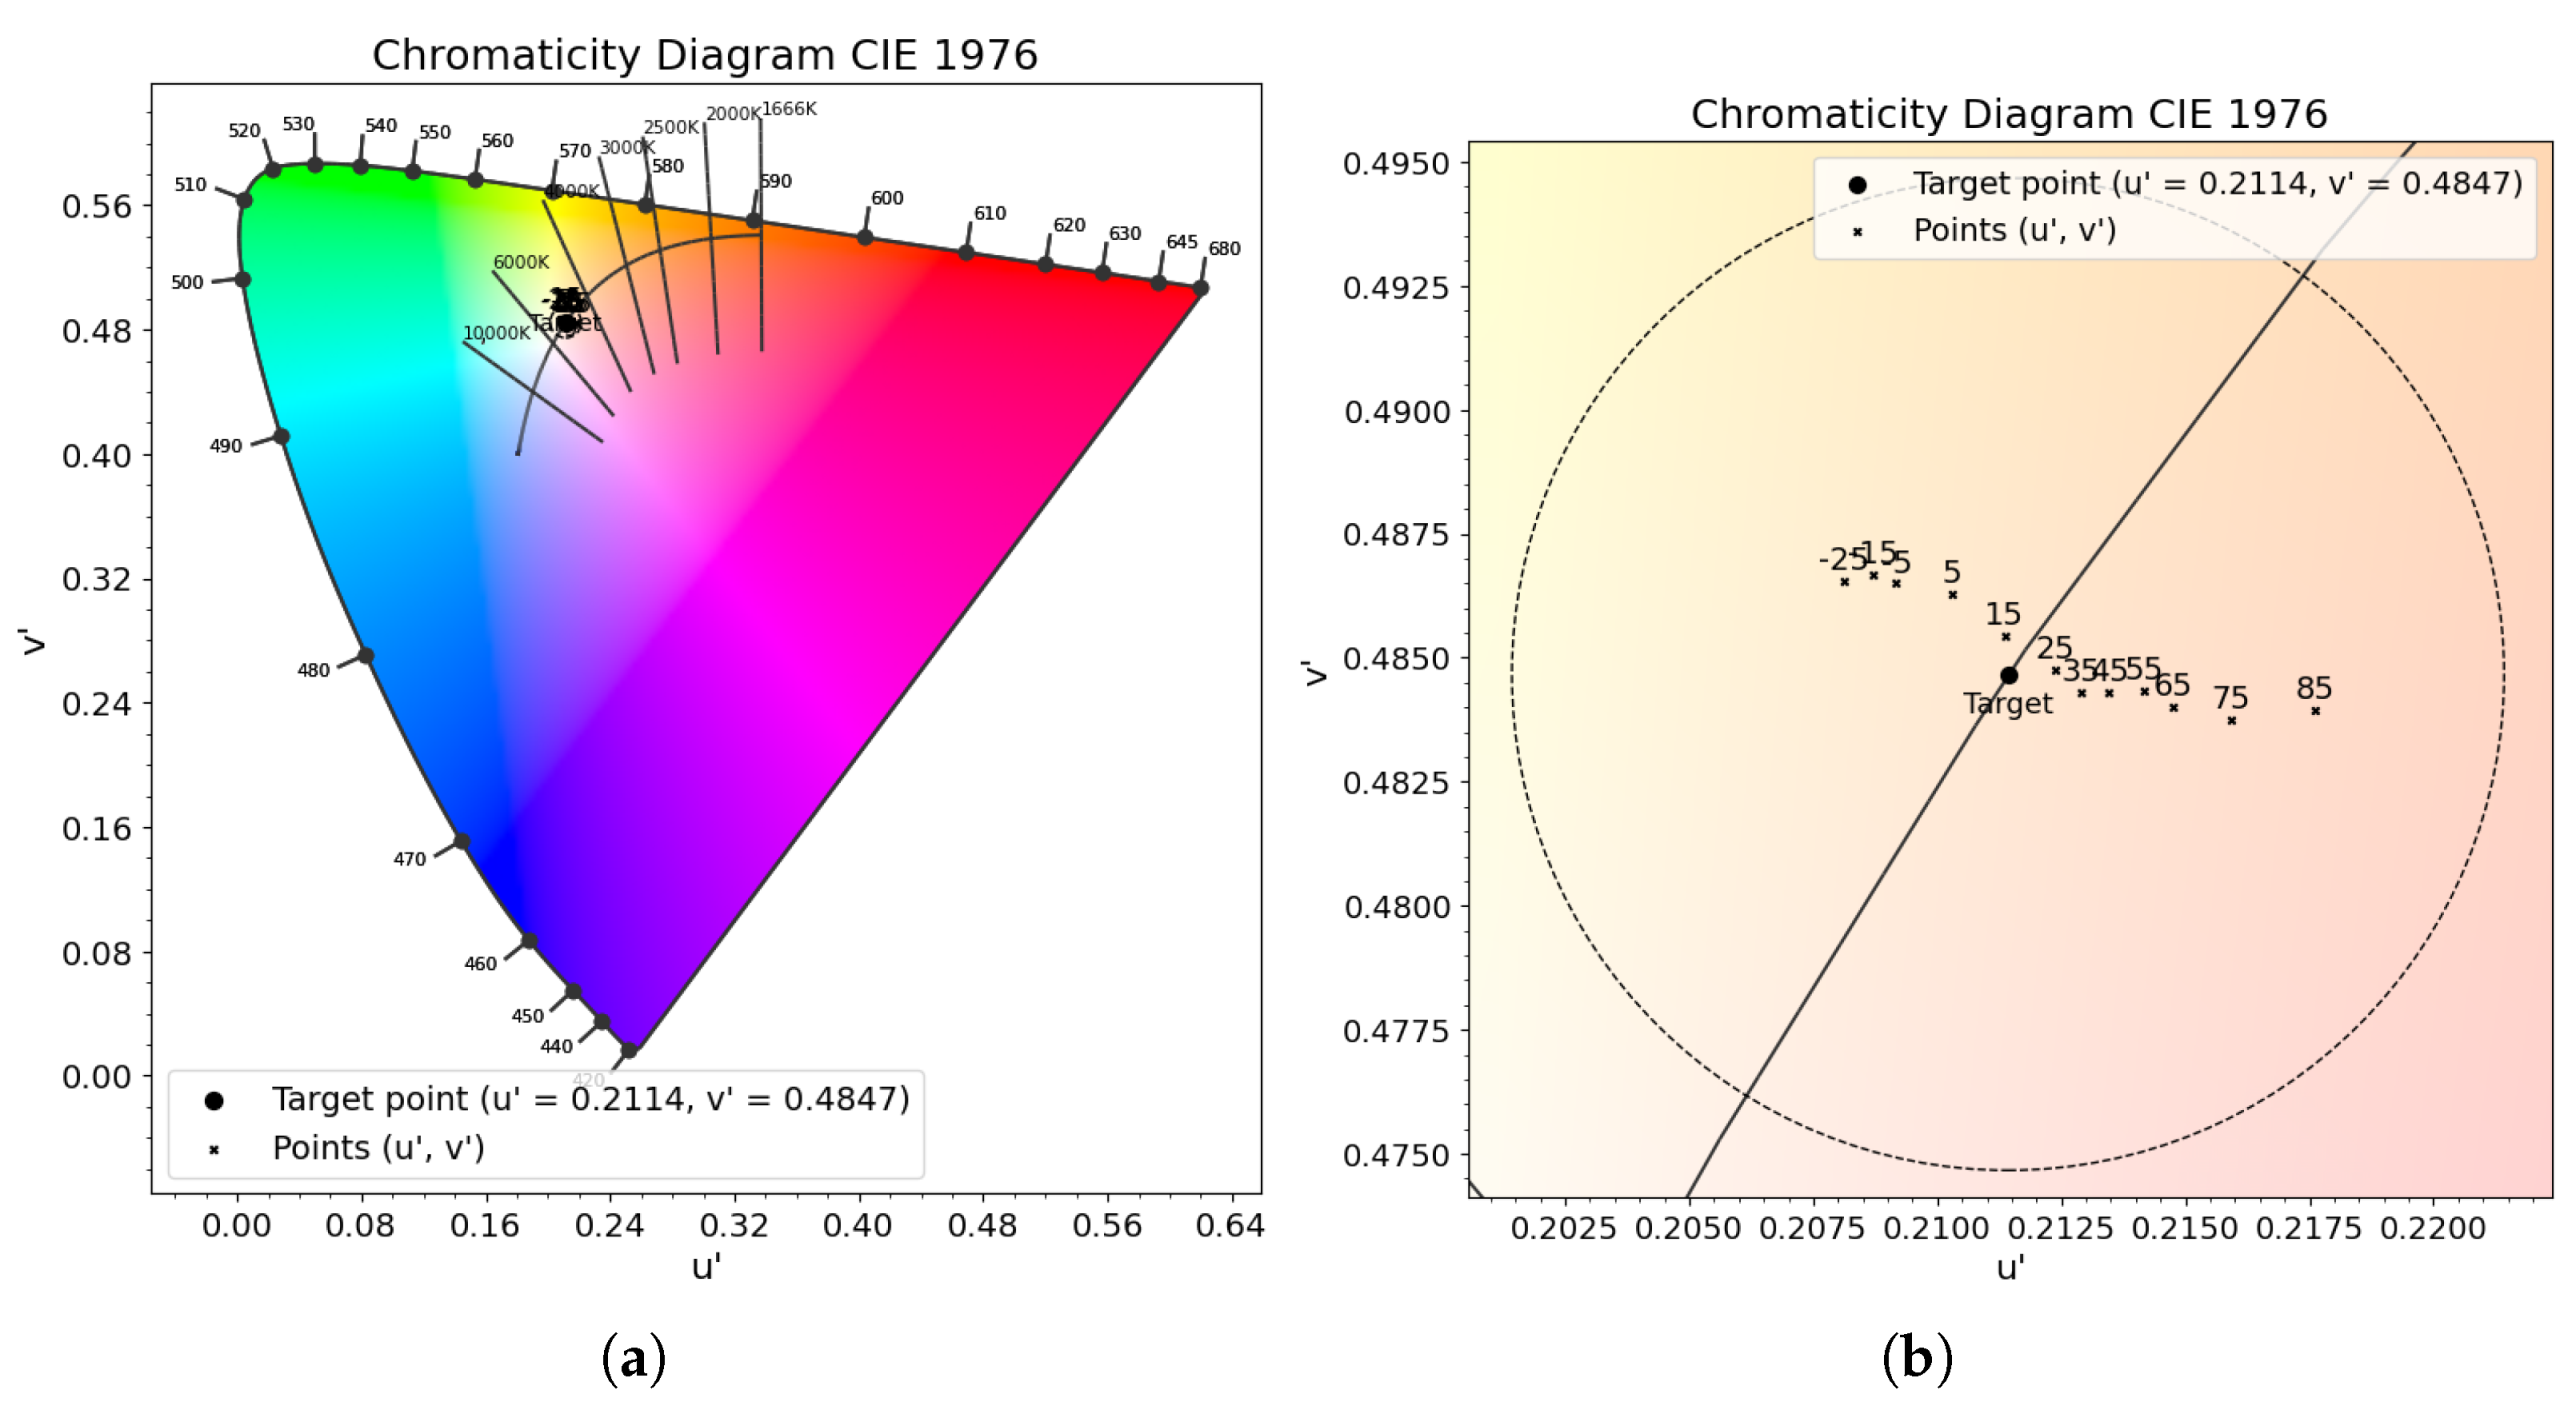
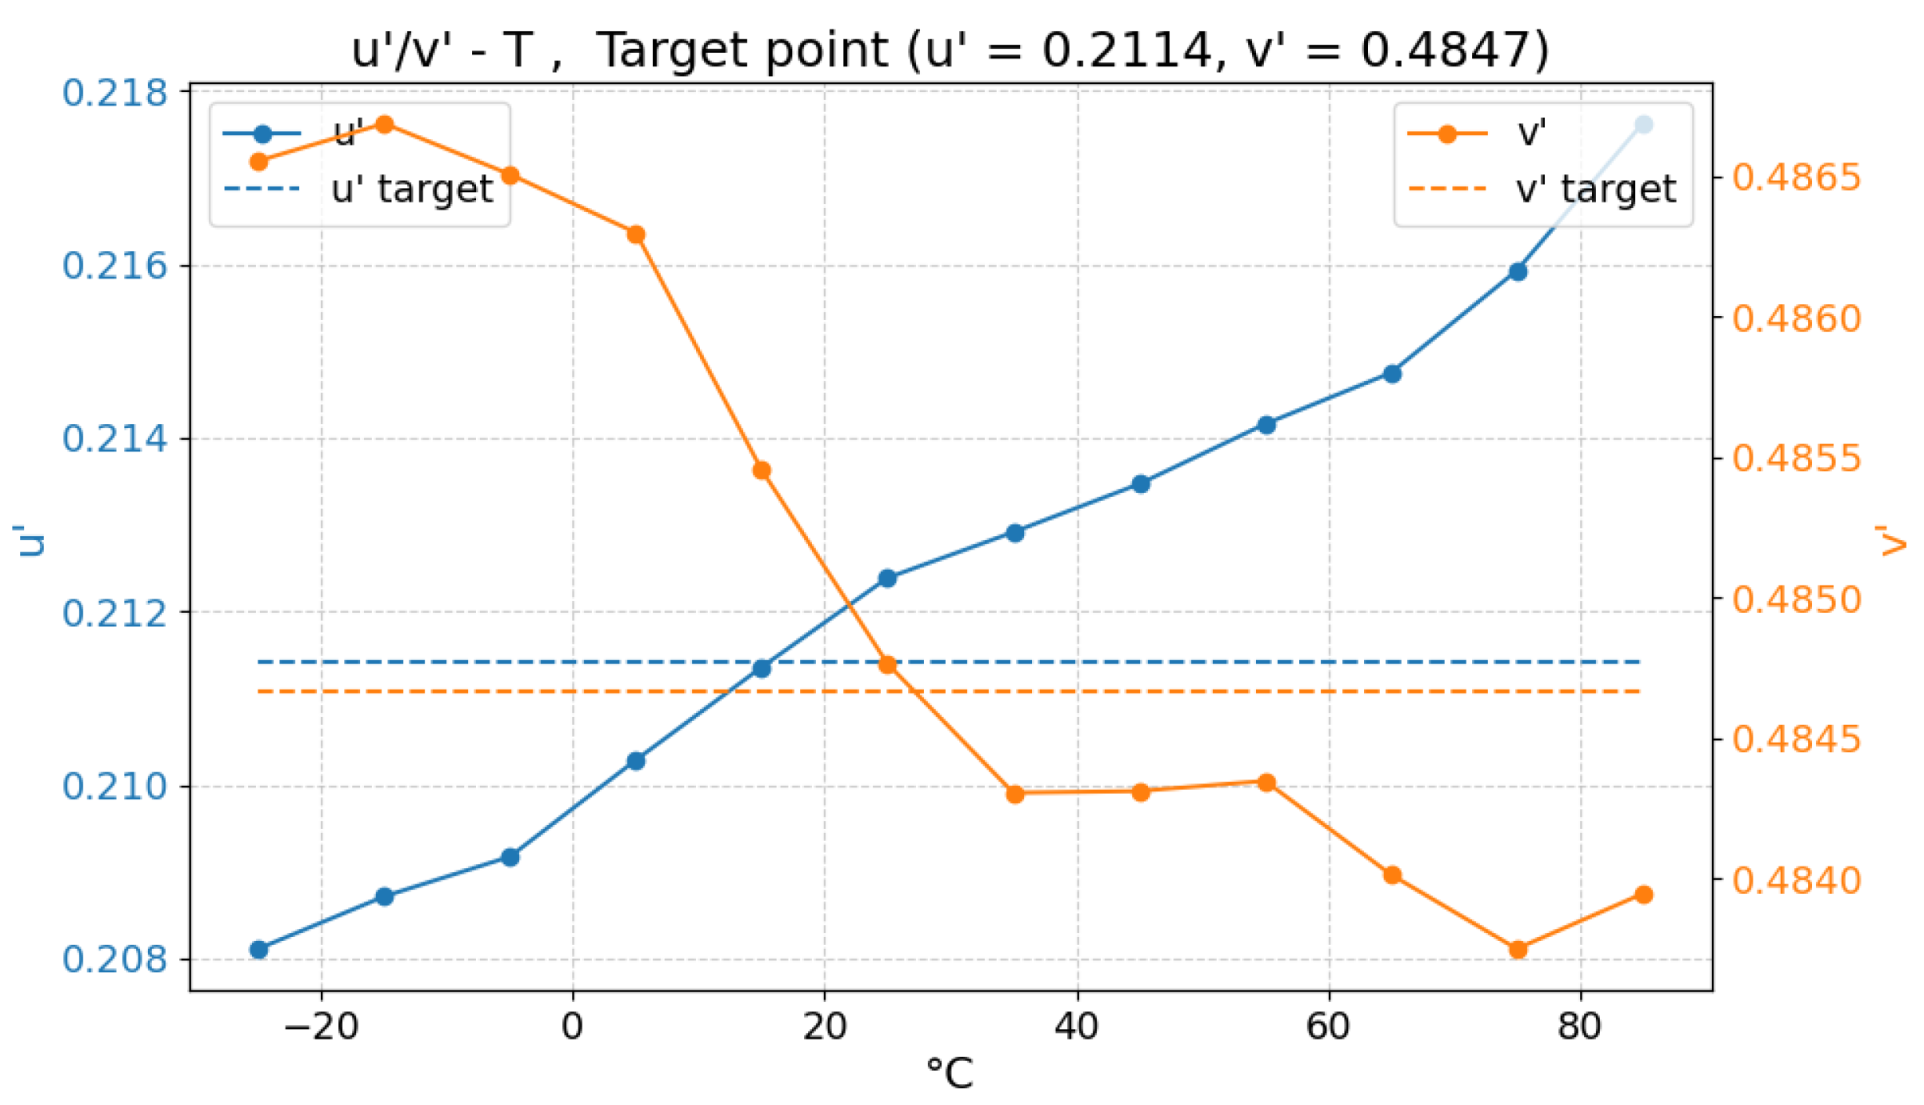
The results obtained from the temperature measurements are presented in graphical form, both on the CIE 1976 chromaticity diagram ( u v ) and in a diagram representing the chromaticity coordinates as a function of temperature. The dashed circle surrounding each target point represents a boundary with a radius of 0.01, corresponding to the maximum allowable shift requirement over the entire temperature range. For each point (P1, P2, P3, P4) are provided both the results in the form of CIE 1976 chromaticity diagram ( u v ) and the evolution of the u’ and v’ chromaticity coordinates as a function of temperature for each target point. Respectively, Figure 15 and Figure 16 for point P1; Figure 17 and Figure 18 for point P2; Figure 19 and Figure 20 for point P3; Figure 21 and Figure 22 for point P4. The temperature corresponding to each measurement is annotated above the points in the diagrams. In particular, Figure 15a–c, Figure 17a–c, Figure 19a–c and Figure 21a–c represent progressive zooms of the four measured points from a full diagram view to a detailed close-up focusing on the admissible region defined by the constraint Δ u v 0.01 .
Looking at the results presented, it is immediately evident that all four color points lie well within the requested specification limits. It should also be noted that, in principle, the measured values at the reference temperature of 25 °C should coincide precisely with the nominal target coordinates. In practice, however, such correspondence is not observed for all cases. For example, in Figure 17, the entire trend of the measured points appears to be uniformly shifted with respect to the target, as a similar phenomenon was observed, albeit less noticeable, for the other color points as well.
Such a deviation most plausibly comes from a non-perfect initial calibration, whether of the chromaticity coordinates ( x , y ) or of the luminous flux imbalance, resulting in an intrinsic offset in chromaticity space.
Among the four color points that were examined, the color point P2 had the largest total chromatic shift in the u v space across temperature, defined as the difference between its maximum and minimum values, with a displacement of ( u m a x u m i n ) = 0.0051 and ( v m a x v m i n ) = 0.0056 . Instead, when expressed in terms of the classical CIE 1931 x y coordinates, the greatest total chromatic shift in x is observed for point P1 ( x m a x x m i n = 0.0066 ), while the most important variation in y is observed for point P3 ( y m a x y m i n = 0.0079 ).
In addition, regarding the chromatic shift relative to the target, point P2 is again the one showing the largest deviation, with a displacement of Δ u v = 0.00562 .
This discrepancy between these two coordinate systems is a direct consequence of the nonlinear transformation that relates the ( x , y ) and ( u v ) chromaticities, purposely designed to produce a perceptually uniform color space. Thus, although the variations in x y may numerically appear more pronounced in P1 and P3, the shift experienced by point P2 would be, in theory, more easily perceived by the human eye. This distinction, however, remains theoretical, as all the shifts fall within the requirement bound and are, substantially, imperceptible to an human eye.

4.2. RGBW Algorithm

The RGBW algorithm was also subjected to a testing phase, aimed at verifying its behavior with respect to temperature variations. This testing allowed for the validation of the algorithm’s color consistency and stability across all the operating temperature ranges.
The RGBW algorithm was tested on three color points, all selected along the Planckian locus and so characterized by a specific CCT. The tested colors are listed in Table 3, along with their corresponding chromaticity coordinates in both the CIE 1931 x y and CIE 1976 u v color spaces. As in the previous case, the maximum relative luminance value ( L t = 10,000) was used for all the targets. For all the selected points, the white amount was set to a constant value of W = 0.8 .
These points were specifically selected along the Planckian locus to evaluate the performance of the algorithm on such chromaticities with an associated large white light component. In combination with a relatively high white coefficient W = 0.8 , this selection enables the generation of colors in which the white LED plays a dominant role.
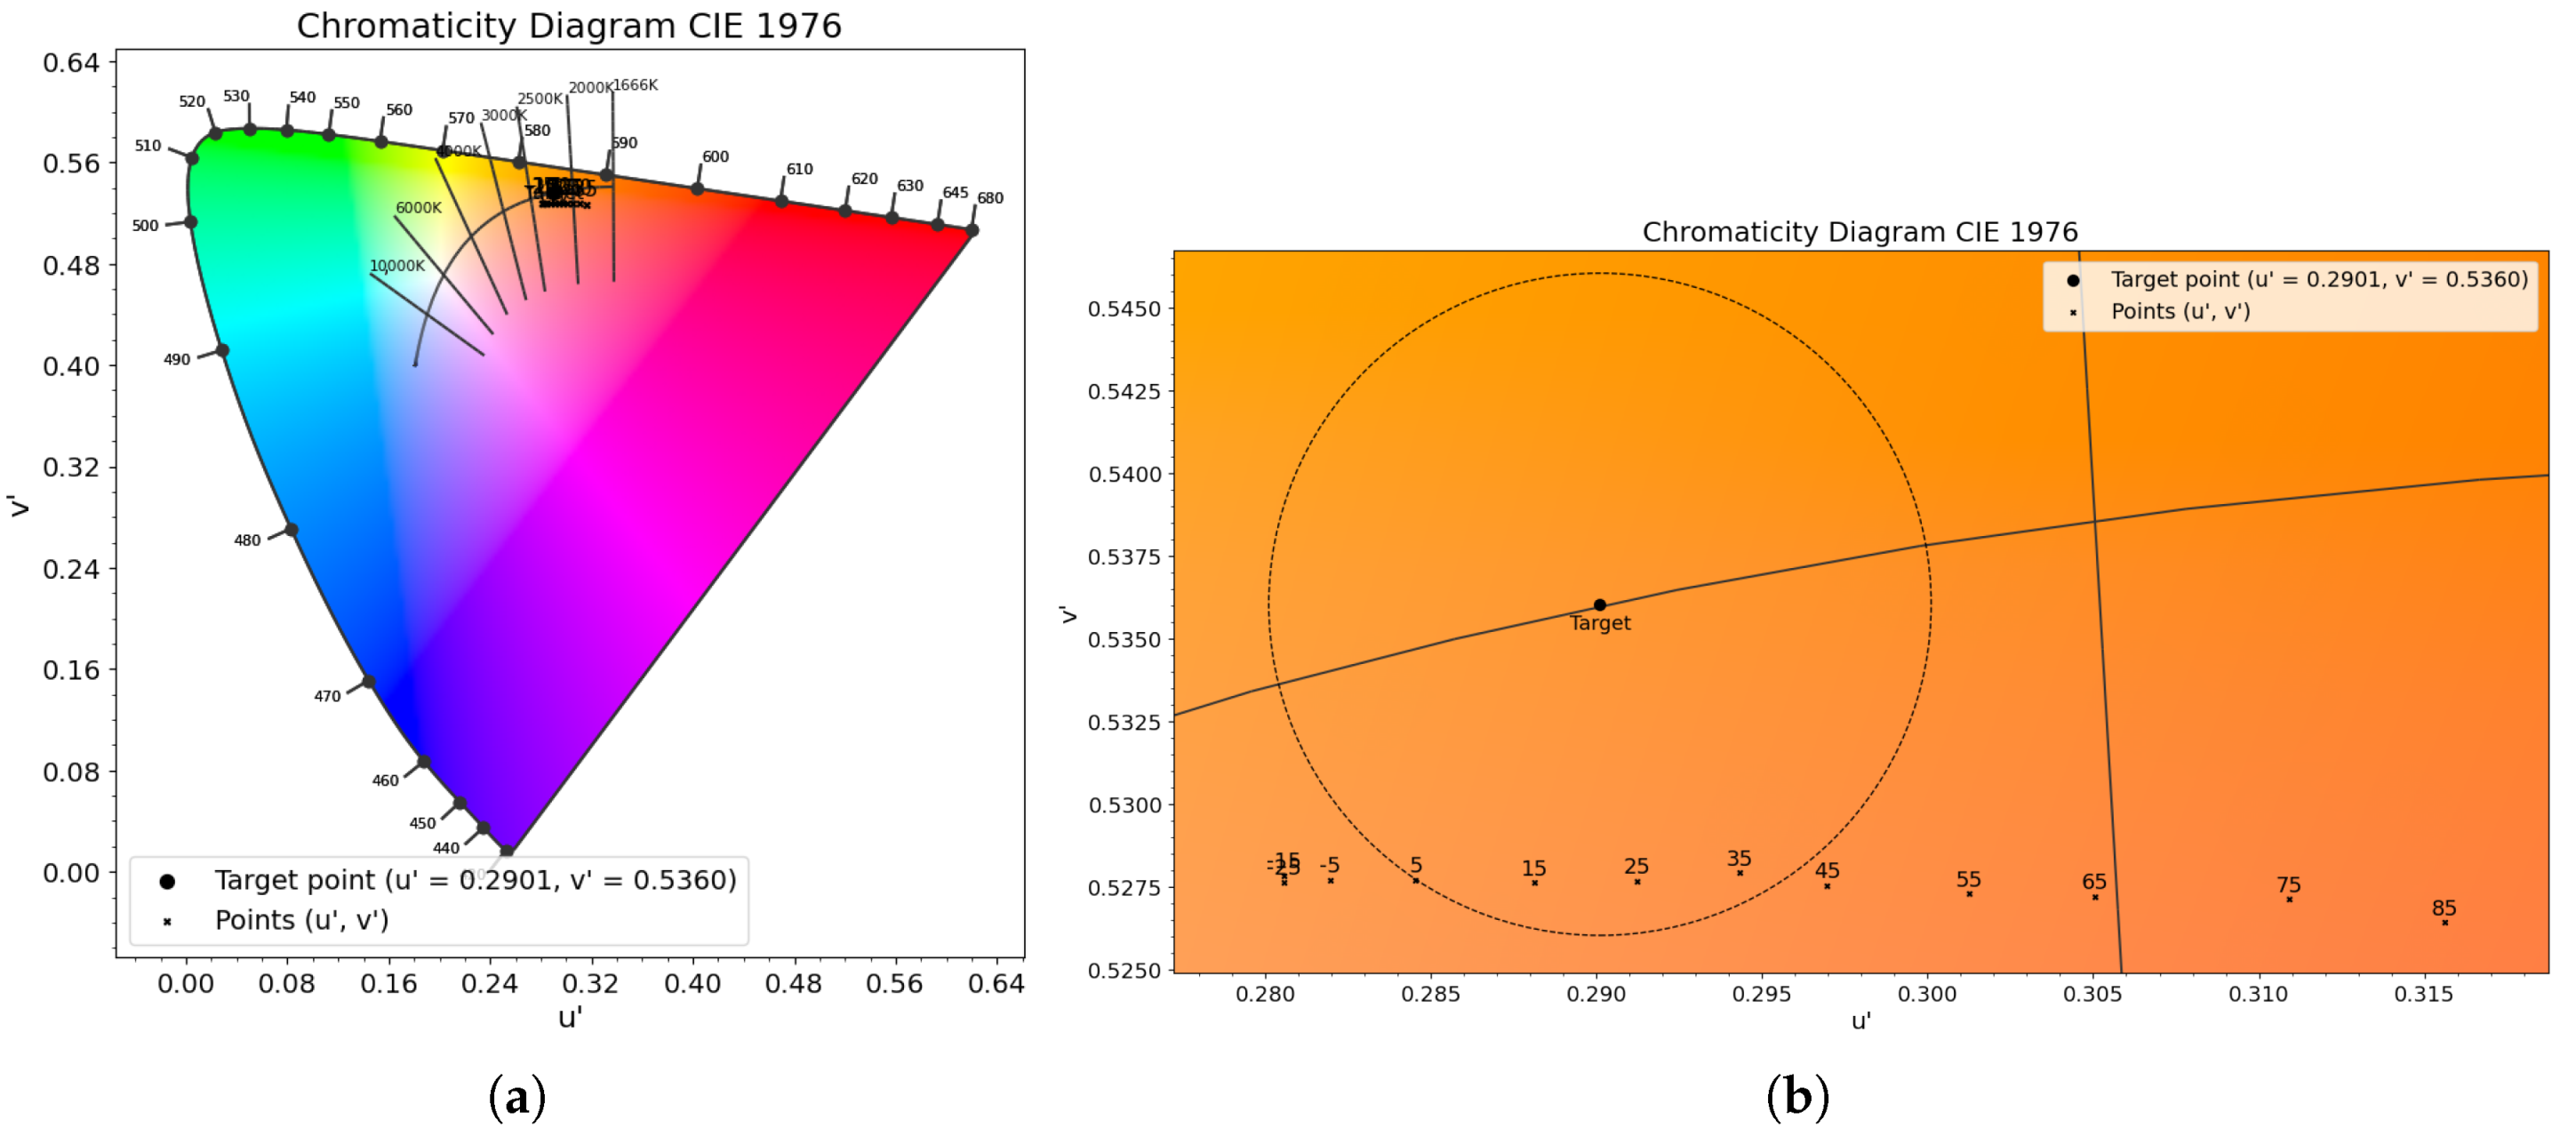
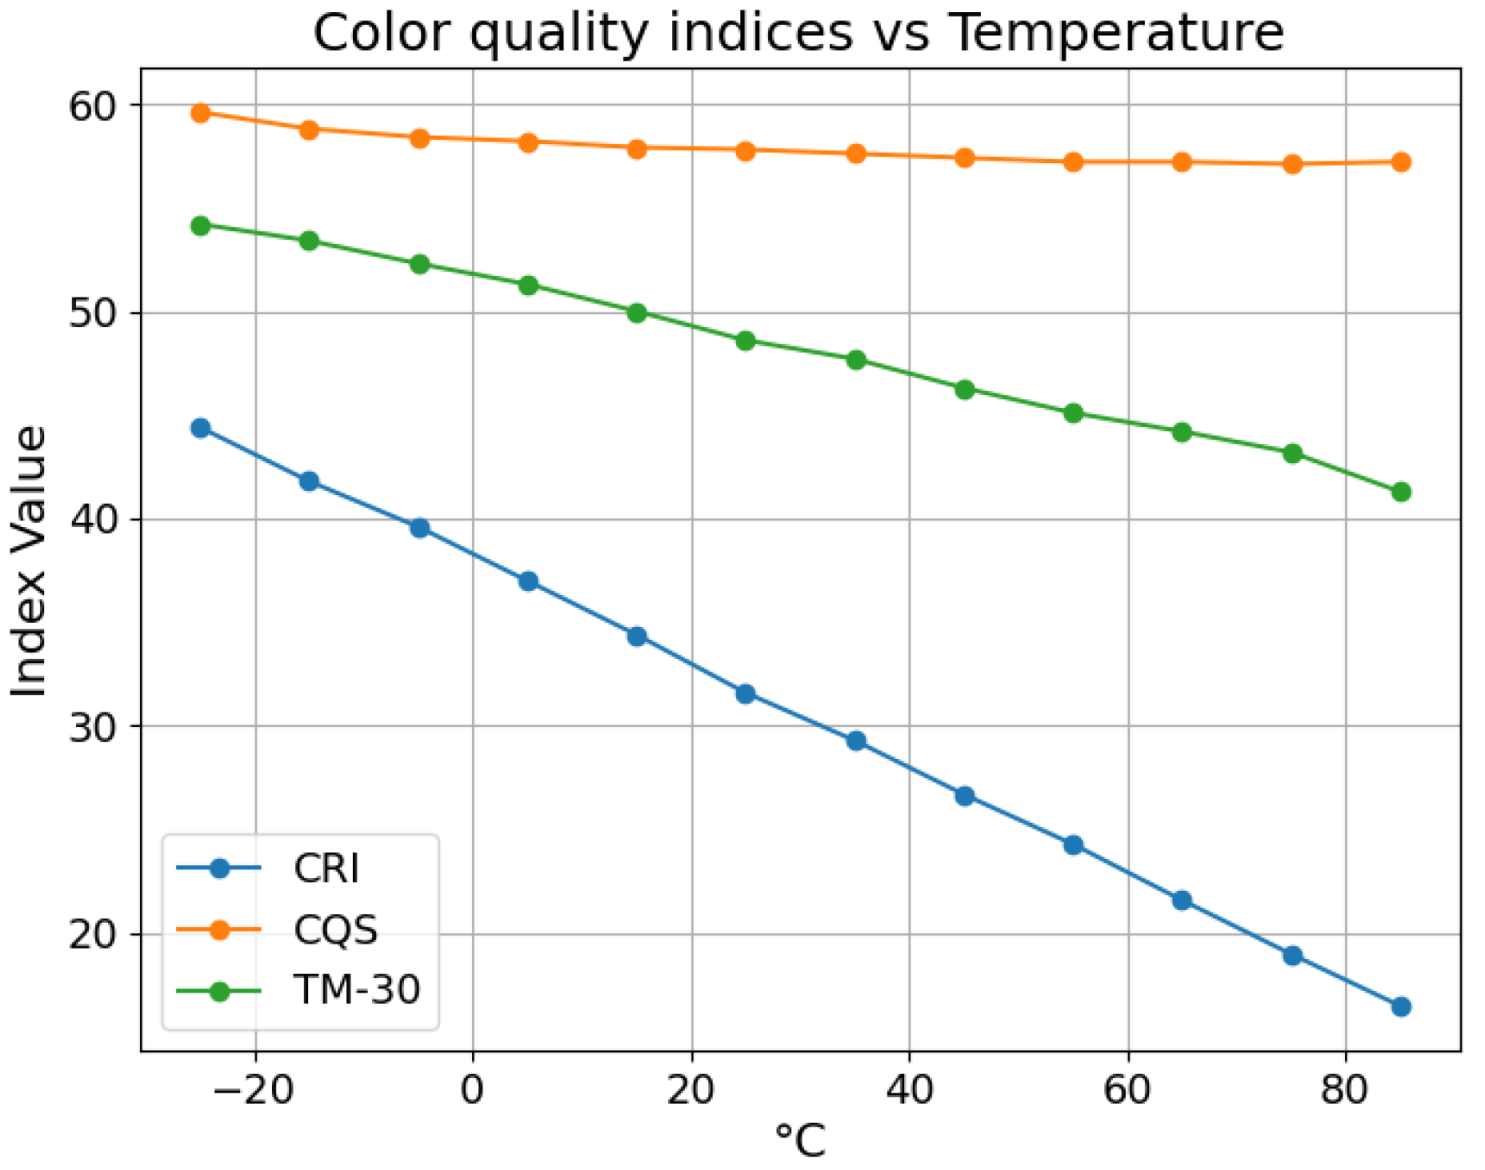
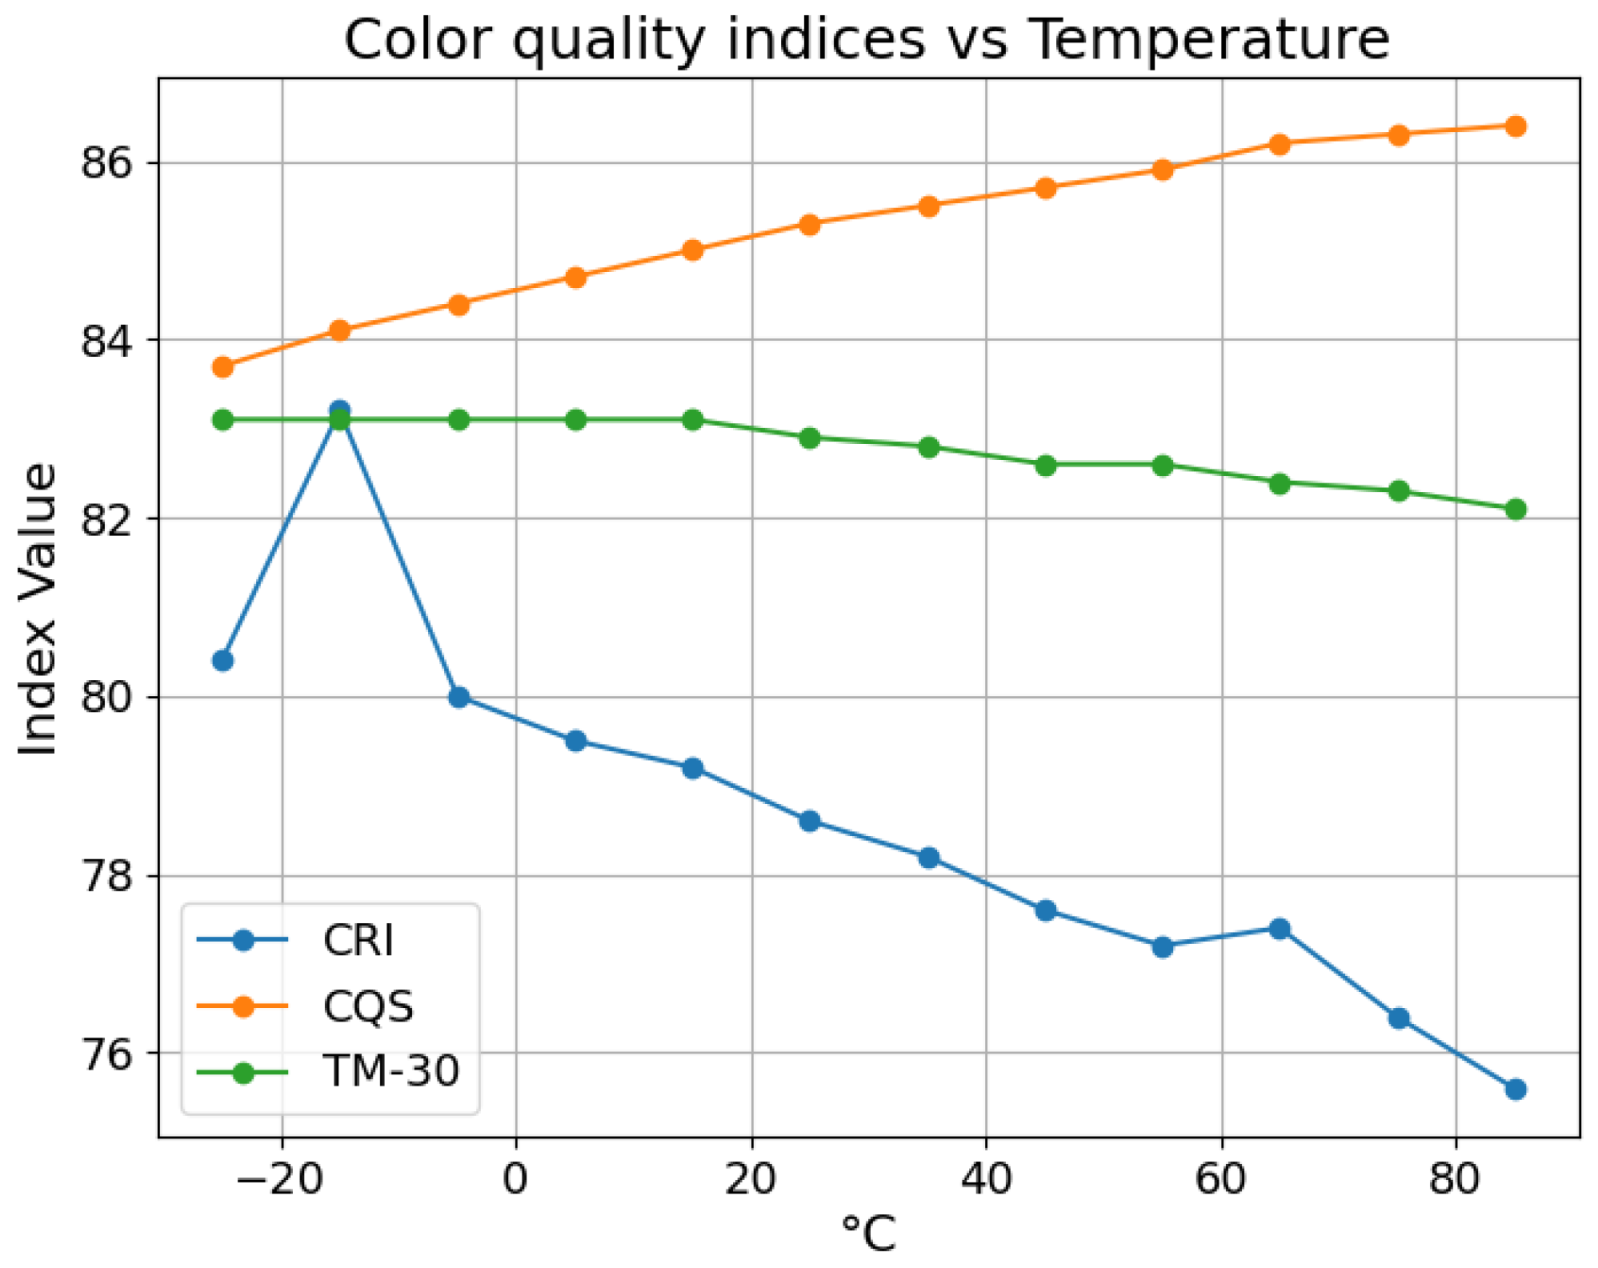
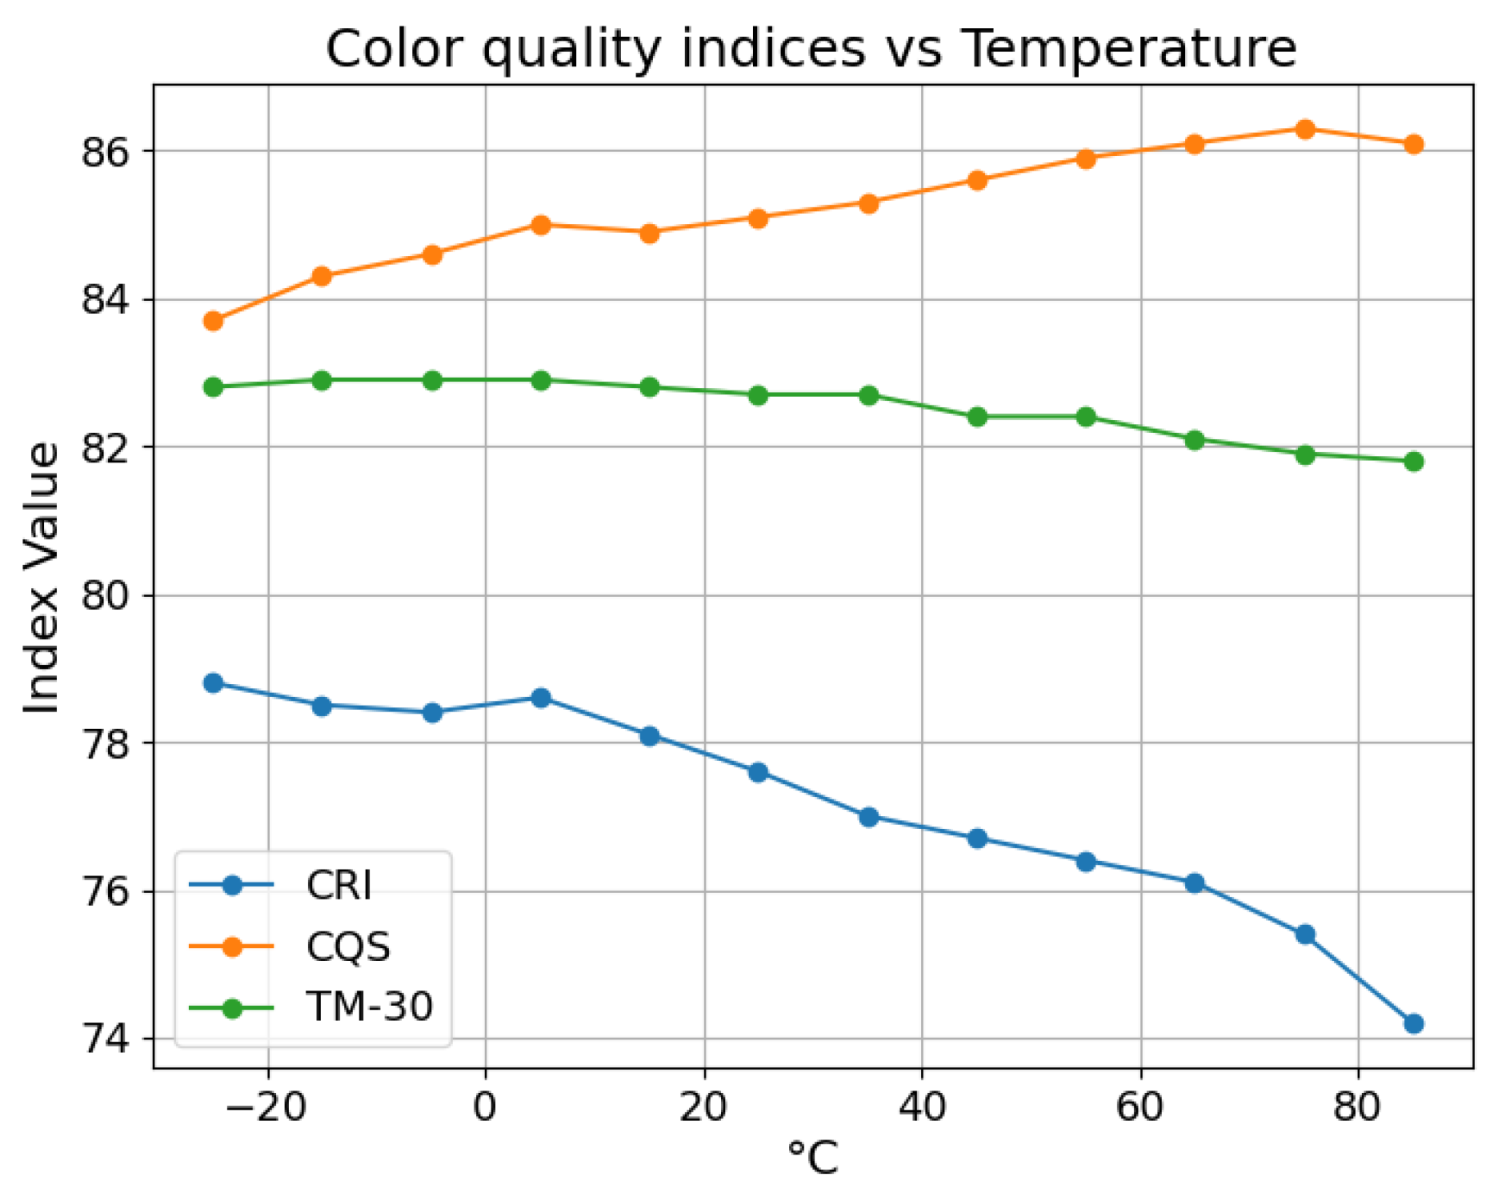
Similarly to those presented for the RGB algorithm, the results for the temperature measurements for the RGBW algorithm are presented here in graphical form. In particular, for each chosen target point (2200 K, 4000 K and 5000 K), two levels of zoom on the CIE 1976 u’v’ chromaticity diagram are provided, together with the evolution of the u’v’ chromaticity coordinates as a function of temperature, and the variation of three different color rendering metrics with temperature These indices include the CRI, the Color Quality Scale (CQS), and the TM-30 fidelity index. Respectively, Figure 23, Figure 24 and Figure 25 for 2200 K; Figure 26, Figure 27 and Figure 28 for 4000 K and Figure 29, Figure 30 and Figure 31 for 5000 K. In the RGBW algorithm, the constraint of a maximum deviation of 0.01 u v of the chromaticity from the target is maintained. Therefore, a reference circle with a radius of 0.01 is drawn around each target point in the CIE 1976 chromaticity diagram.
It is immediately evident that the 2200 K point was the most critical case, as it did not satisfy the chromaticity distance requirement. The maximum shift from the target occurred at 85 °C, with a Euclidean distance of 0.0272 in the u v space, more than twice the allowed maximum deviation. What is particularly noteworthy is that even the measured value at 25 °C was significantly distant from the target. The primary cause of this large discrepancy was identified after the testing had been performed: the algorithm used for this test did not correctly handle the calibration offset of the forward voltage ( V f ). Specifically, the offset was interpreted (erroneously) as a temperature offset rather than a voltage offset. This conceptual error likely compromised the output accuracy, especially for this specific color point. In addition, the measured point was located very close to the edge of the gamut representable by the LED driver in combination with the RGB and W LEDs. The algorithm implemented in software had a saturation on the minimum duty cycle. After removing that saturation and correcting the calibration part by recalculating the offset, a qualitative test was conducted and it confirmed that the chromaticity requirement could indeed be met across the entire temperature range. For the 4000 K and 5000 K targets, the chromaticity constraint was satisfied. The largest shift from the target still occurred at 85 °C as expected. However, this deviation remained within acceptable limits and is justifiable given the important thermal stress.
It can be interesting to examine the plots provided showing the behavior of the different color quality indices as a function of temperature. For the 2200 K point, Figure 25 shows that their values are low, particularly the CRI at high temperatures, as expected. For the 4000 K and 5000 K points, respectively, in Figure 28 and Figure 31, the trend across the three metrics is substantially the same, with values settling around 80% on average, indicating a good color rendering performance. What stands out, however, is the difference in behavior among the different metrics. Although CRI remains the most widely used index, it is increasingly considered outdated and limited. The 4000 K and 5000 K plots show that while TM-30 increases with increasing temperature, CQS exhibits a slight decrease, and CRI drops by approximately 5 points across the full temperature range.

5. Discussion

The objective of this work was to improve and validate a temperature compensation algorithm for RGBW LEDs for automotive interior lighting applications.
In accordance with its application context, the algorithm must ensure compensation of the intrinsic chromatic and luminous flux shifts of LEDs as the temperature varies, typically across the range from −25 °C to 85 °C.
The work started with the study of the predecessor RGB temperature compensation algorithm. This earlier version was calibrated and validated at four color points of interest, and it was confirmed to meet requirements, maintaining chromaticity deviation from the target point within Δ u v 0.01 across all temperatures. Even though many technical challenges were encountered along the way, the RGB algorithm worked well to compensate for thermal shifts.
The requirement of Δ u v 0.01 highlights also the importance of the PWM resolution in determining the accuracy of the emitted color. Since the duty cycles are quantized to integer values, each step introduces an uncertainty in the generated RGB intensity values, which propagates to the chromaticity coordinates. Considering the set of primaries defined by the LEDs used and a fixed luminance of Y = 1 , the worst-case quantization error can be estimated by combining the PWM step size with the local sensitivity of the ( u v ) coordinates to changes in the RGB duty cycles. For a 16-bit resolution PWM engine, adopted in this work, the resulting bound is on the order of 10 5 in Δ u v . The maximum sensitivity is found near the green primary. In this region, the predicted worst-case error reaches approximately 4.7 × 10 5 . For all the color points considered in this work, indeed, the estimated error remains below this limit, with values of 3.6 × 10 5 at 2200 K, 2.6 × 10 5 at 4000 K, and 2.9 × 10 5 at 5000 K. Therefore, the chromaticity error induced by the 16-bit quantization of the PWM is well below the accuracy requirement. The worst case quantization error would increase to approximately 0.0135 in Δ u v using an 8-bit PWM engine, exceeding the target accuracy requirement.
A preliminary evaluation of the algorithm’s computational requirements was carried out. The implementation currently relies on floating-point arithmetic, leading to a total code footprint of approximately 12.2 kB of Flash and 1.8 kB of RAM. The execution time of one compensation cycle (including voltage measurements, temperature estimation, and duty cycle computation) was measured at 4.21 ms on the Cortex-M23 target.
The work then focused on extending the algorithm to an RGBW configuration, adding a white LED to the system, in order to achieve a better color rendering. The RGBW algorithm was studied in depth and validated at three color points located on the Planckian locus. This algorithm also met the requirement across the full temperature range.
Table 4 provides a quantitative summary of the results obtained from the validation of the RGBW algorithm. The maximum deviations in the u v coordinates with respect to the target color point are reported. In addition, the table includes the resulting CRI measured using both the RGB and the RGBW algorithms. The significant increase in CRI (ΔCRI) observed with the addition of the white channel demonstrates the effectiveness of the proposed algorithm.
Although the test results for both algorithms were satisfactory, some aspects could be further considered. For example, no evaluation has yet been made of the RGBW algorithm’s performance in terms of computational resource usage. In this context, a fixed-point implementation of the algorithm is certainly a worthwhile option to consider. The testing phase exclusively considered chromaticity as a variable parameter, even though the algorithm is also designed to compensate for luminous flux. Therefore, integrating measurements of luminous output, along with the variation of the CRI or other color quality indexes as a function of temperature, would offer a more complete evaluation of the algorithm’s performance.
An additional perspective to consider is the aging of LEDs, given the long lifetime required in automotive applications. Aging in LEDs typically shows as a progressive reduction of luminous flux, shifts in chromaticity due to changes of emission spectrum, and an increase of the forward voltage V f [38]. One possible strategy would be to incorporate accelerated aging tests into the LEDs’ characterization phase. Alternatively, a priori models of LED aging could be employed to estimate and compensate for such effects. Moreover, the LEDs used in this work comply with the AEC-Q102 qualification, as reported in their datasheets, which provides additional assurance regarding their robustness and suitability for long-term automotive applications.
The experimental validation in this study was performed on an evaluation board, which does not reflect the constraints of an actual in-vehicle module. In real automotive applications, both the LED driver and the LEDs are mounted on a compact PCB (typically on the order of 10 × 15 mm) enclosed in a small plastic housing. In such conditions, thermal management becomes a critical design aspect that strongly influences the maximum achievable luminous flux. Although thermal management has not been addressed here, it is worth noting that the selected LED driver device provides built-in support for temperature monitoring. In particular, the driver’s internal sensor can monitor its own temperature, while the LED temperature can be estimated via the ADC. These features allow the microcontroller to be programmed to implement thermal derating strategies. For instance, by dynamically scaling the duty cycles, the system can ensure that the target chromaticity is preserved while gradually reducing luminous output when thermal limits are reached.
Lastly, defining an efficient procedure for LED characterization could be a valuable step toward expanding the internal component library, supporting the integration of a wider range of LEDs available on the market. Currently, a full characterization is required for each individual LED part number: every time a different LED is selected, the entire process must be repeated. Given the vast array of LED options on the market, restricting the algorithm to a limited set of pre-characterized models could be limiting. One possible solution could be developing an AI-based tool, whether a deep learning model or another technique, trained to perform a form of semi-automatic LED characterization based on a smaller dataset. This would significantly reduce the amount of data required compared to a full characterization process.

6. Conclusions

The aim of this work was to improve and validate a temperature compensation algorithm for RGBW LEDs for automotive interior lighting applications. The algorithm was designed to run on an Infineon LED driver with an integrated microcontroller, specifically belonging to the LITIX™ Interior family, which targets the interior lighting segment in the automotive industry.
Due to the need for achieving better color rendering, we evolved from an RGB algorithm to an RGBW configuration, adding a white LED to the system. The RGBW algorithm was analyzed in depth and validated at three color points located on the Planckian locus. This algorithm also met the requirement across the full temperature range.
Extensive experimentation confirms that this evolution does not compromise color quality, with the stability requirement ( Δ u v 0.01 ) maintained even over an extended temperature range. The maximum chromatic shift observed was Δ u v = 0.00562 for RGB and Δ u v = 0.0067 for RGBW. Furthermore, the evolution from RGB to RGBW resulted in a significant improvement in color rendering, achieving an increase of up to 58.9 CRI points at 25 °C. In addition, the algorithm was evaluated with the aim of implementing it on a microcontroller. The current floating-point version occupies roughly 12.2 kB of Flash and 1.8 kB of RAM. A single compensation cycle, including voltage measurements, temperature estimation, and duty cycle computation, executes in 4.21 ms on a Cortex-M23 target.
In conclusion, this work, unlike previous RGB-only approaches, delivers the first practical RGBW compensation algorithm validated under realistic automotive conditions and suitable for microcontroller deployment.

Author Contributions

Conceptualization, S.L. and A.M.; methodology, S.L. and A.M.; software, D.R. and S.L.; validation, D.R., L.F. and S.L.; formal analysis, D.R., S.L. and A.M.; investigation, D.R. and S.L.; resources, A.M.; data curation, D.R.; writing—original draft preparation, D.R. and L.F.; writing—review and editing, D.R., L.F., S.L., M.C., S.O. and A.M.; visualization, D.R., L.F. and S.L.; supervision, L.F., S.L. and A.M.; project administration, A.M. All authors have read and agreed to the published version of the manuscript.

Funding

This research received no external funding.

Institutional Review Board Statement

Not applicable.

Informed Consent Statement

Not applicable.

Data Availability Statement

The raw data supporting the conclusions of this article will be made available by the authors on request.

Conflicts of Interest

The authors declare no conflicts of interest.

References

  1. Valeo. Automotive Interior Lighting: From Static to On-Surface Projection. Available online: https://www.valeo.com/en/automotive-interior-lighting-from-static-to-on-surface-projection/ (accessed on 20 August 2025).
  2. Tao, L.; Liu, M. Biomechanical optimization of RGB LED systems: Temperature prediction model and optical compensation algorithm based on built-in constant current source chip. Mol. Cell. Biomech. 2025, 22, 800. [Google Scholar] [CrossRef]
  3. Hong, L.; Liu, M. An Improved sRGB Optical Algorithm Considering Thermal Effects and Adaptability for Low-Cost Automotive-Grade Dedicated LED Chips. World Electr. Veh. J. 2025, 16, 235. [Google Scholar] [CrossRef]
  4. Ren, H.; Li, S.; Sun, R.; Su, Z. Study on LED Color Mixing for Stage Lighting Based on Locus Fitting of Blackbody. In Proceedings of the 2018 IEEE 3rd International Conference on Cloud Computing and Internet of Things (CCIOT), Dalian, China, 20–21 October 2018; pp. 177–181. [Google Scholar] [CrossRef]
  5. Merenda, M.; Porcaro, C.; Della Corte, F.G. LED junction temperature prediction using machine learning techniques. In Proceedings of the 2020 IEEE 20th Mediterranean Electrotechnical Conference (MELECON), Palermo, Italy, 16–18 June 2020; pp. 207–211. [Google Scholar] [CrossRef]
  6. Qu, X.; Wong, S.C.; Tse, C.K. Color Control System for RGB LED Light Sources Using Junction Temperature Measurement. In Proceedings of the IECON 2007—33rd Annual Conference of the IEEE Industrial Electronics Society, Taipei, Taiwan, 5–8 November 2007. [Google Scholar] [CrossRef]
  7. Liu, X.; Jiang, C.; Liu, X.; Liu, Z.; Min, H.; Zhuang, Z. RGBW LED mixing temperature compensation method with high output consistency. Opt. Laser Technol. 2024, 171, 110440. [Google Scholar] [CrossRef]
  8. Kalustova, D.; Kornaga, V.; Rybalochka, A.; Yu, Y.; Valyukh, S. Color temperature tunable RGBW cluster with optimize color rendering and efficacy. Opt. Eng. 2023, 62, 045102. [Google Scholar] [CrossRef]
  9. Blankenbach, K.; Hertlein, F.; Hoffmann, S. Advances in automotive interior lighting concerning new LED approach and optical performance. J. Soc. Inf. Disp. 2020, 28, 655–667. [Google Scholar] [CrossRef]
  10. Kim, T.; Choi, K.; Suk, H.J. Affective responses to chromatic ambient light in a vehicle. arXiv 2022, arXiv:2209.10761. [Google Scholar] [CrossRef]
  11. Martínez-Pérez, J.; Martínez-Olmos, A.; Santaella, J.; Escobedo, P.; López-Ruiz, N.; Carvajal, M. LED biasing scheme with thermal compensation for automotive industry applications. Results Eng. 2024, 21, 101699. [Google Scholar] [CrossRef]
  12. Qu, X.; Wong, S.C.; Tse, C.K. Temperature Measurement Technique for Stabilizing the Light Output of RGB LED Lamps. IEEE Trans. Instrum. Meas. 2010, 59, 661–670. [Google Scholar] [CrossRef]
  13. Shahila, N.A.; Abbasi, M.I.; Khang, A.W.Y.; Poh, C.C.K.; Yeow, L.T. Preliminary Study on using Advanced PWM Control Techniques for Automotive LED Drivers - Temperature Compensation. J. Phys. Conf. Ser. 2025, 3020, 012003. [Google Scholar] [CrossRef]
  14. Han, Z.; Zhang, Z.; Liu, K.; Li, Y.; Xiao, W.; Liu, J.; Zhu, X.; Zheng, C.; Wu, Q. Spectral optimization of trichromatic white LEDs based on age of lighting user and application scene. Opt. Express 2023, 31, 11624–11632. [Google Scholar] [CrossRef] [PubMed]
  15. Li, Z.; Liu, J.; Pan, Y.; Cheng, Z.; Si, G.; Fang, Y. Self-adaptive LED spectrum-tunable light source with high output irradiance and uniformity. Opt. Commun. 2024, 569, 130835. [Google Scholar] [CrossRef]
  16. Zhang, F.; Xu, H.; Wang, Z. Spectral design methods for multi-channel LED light sources based on differential evolution. Appl. Opt. 2016, 55, 7771–7781. [Google Scholar] [CrossRef] [PubMed]
  17. Yoshi, O. CIE Fundamentals for Color Measurements. In Proceedings of the 2000 International Conference on Digital Printing Technologies (IIS&Ts NIP16), Vancouver, BC, Canada, 15–20 October 2020; pp. 541–545. [Google Scholar]
  18. Planck, M. The theory of heat radiation. Entropie 1900, 144, 164. [Google Scholar]
  19. Wikipedia. Planckian Locus—Wikipedia. Available online: https://en.wikipedia.org/wiki/Planckian_locus (accessed on 20 August 2025).
  20. Luna, R. Round White Plate of Peaches. Unsplash. 2018. Available online: https://unsplash.com/photos/round-white-plate-of-peaches-upqRGMhPUC0 (accessed on 20 August 2025).
  21. Schubert, E.F. Light-Emitting Diodes, 2nd ed.; Cambridge University: Cambridge, UK, 2006. [Google Scholar]
  22. Wyszecki, G.; Stiles, W.S. Color Science: Concepts and Methods, Quantitative Data and Formulae; John Wiley & Sons: Hoboken, NJ, USA, 2000. [Google Scholar]
  23. Nichia. Nichia Products Website: NSSM313A-V1. Available online: https://led-ld.nichia.co.jp/en/product/led_product_data.html?type=NSSM313A-V1&kbn=0 (accessed on 20 August 2025).
  24. Nichia. NSSM313AT-V1 RGB LED Datasheet. 2022. Available online: https://led-ld.nichia.co.jp/api/data/spec/led/NSSM313AT-V1-E(6501G).pdf (accessed on 20 August 2025).
  25. Xu, H.; Hou, X.; Chen, L.; Mei, Y.; Zhang, B. Optical Properties of InGaN/GaN QW with the Same Well-Plus-Barrier Thickness. Crystals 2022, 12, 114. [Google Scholar] [CrossRef]
  26. Vainshtein, I.; Zatsepin, A.; Kortov, V. Applicability of the empirical Varshni relation for the temperature dependence of the width of the band gap. Phys. Solid State 1999, 41, 905–908. [Google Scholar] [CrossRef]
  27. Varshni, Y. Temperature dependence of the energy gap in semiconductors. Physica 1967, 34, 149–154. [Google Scholar] [CrossRef]
  28. Kasap, S.O. Optoelectronics and Photonics; Pearson Education: London, UK, 2013; Volume 218. [Google Scholar]
  29. Infineon Technologies AG. TLD4020-3ET—Programmable 3-ch LIN RGB Driver. 2025. Available online: https://www.infineon.com/part/TLD4020-3ET (accessed on 20 August 2025).
  30. Infineon Technologies AG. LITIX™ Interior—LITIX™ Interior LED Drivers for Automotive Ambient Lighting. 2025. Available online: https://www.infineon.com/products/power/led-driver-ics/litix-automotive/litix-interior (accessed on 20 August 2025).
  31. Infineon Technologies AG. LITIX™—Automotive LED Driver IC. 2025. Available online: https://www.infineon.com/products/power/led-driver-ics/litix-automotive (accessed on 20 August 2025).
  32. ARM Cortex-M23. 2025. Available online: https://developer.arm.com/Processors/Cortex-M23 (accessed on 20 August 2025).
  33. Infineon. TLD4020-3ET Product Overview. Infineon Technologies AG. 2025. Available online: https://www.infineon.com/assets/row/public/documents/10/41/infineon-infineon-tld4020-3et-product-overview-v1-00-e-productoverview-en.pdf (accessed on 20 August 2025).
  34. Nichia. Nichia Website. Available online: https://www.nichia.co.jp/en/ (accessed on 20 August 2025).
  35. Nichia. Nichia Products Website: NFSW123F. Available online: https://led-ld.nichia.co.jp/en/product/led_product_data.html?type=NFSW123F&kbn=0 (accessed on 20 August 2025).
  36. Ocean Optics Inc. OceanView 2.0 Software. Available online: https://www.oceanoptics.com/software/oceanview/ (accessed on 20 August 2025).
  37. Vötsch. Vötsch VT 7004 Operating Instructions. Vötsch Industrietechnik GmbH. 1996. Available online: https://lampz.tugraz.at/~hadley/semi/ch9/instruments/VT4002/VT4002_climate_chamber.pdf (accessed on 20 August 2025).
  38. Hegedüs, J.; Hantos, G.; Poppe, A. Lifetime Modelling Issues of Power Light Emitting Diodes. Energies 2020, 13, 3370. [Google Scholar] [CrossRef]
Figure 1. CIE 1931 chromaticity diagram showing the Planckian locus [19]. The background colors illustrate the approximate perceived hue within the cromaticity space, while the black curve indicates the Planckian locus, which traces the cromaticities of an ideal black-radiator at different color temperatures.
Electronics 14 03451 g001
Figure 2. A bowl of peaches illuminated with a high-CRI light source (a) and a low-CRI light source (b) [20].
Electronics 14 03451 g002
Figure 3. Relative luminosity vs. ambient temperature characteristic of a commercial Nichia NSSM313AT-V1 RGB LED [24].
Electronics 14 03451 g003
Figure 4. Dominant wavelength vs. ambient temperature characteristic for the blue channel of a commercial Nichia NSSM313AT-V1 RGB LED [24].
Electronics 14 03451 g004
Figure 5. Concise flow diagram summarizing the research procedure from theoretical modeling to algorithm development and experimental validation.
Electronics 14 03451 g005
Figure 6. High-level functional block diagram of the RGB algorithm and system.
Electronics 14 03451 g006
Figure 7. Fitted characterization curve for the red LED, superimposed on the LED manufacturer’s datasheet plot.
Electronics 14 03451 g007
Figure 8. Block diagram of the RGB temperature compensation algorithm.
Electronics 14 03451 g008
Figure 9. Example of a spectral distribution for a warm white (2700 K) generated using (a) white LED (high CRI) and (b) RGB mixing (low CRI).
Electronics 14 03451 g009
Figure 10. Block diagram of TLD4020-3ET [33].
Electronics 14 03451 g010
Figure 11. TLD4020-3STD EVAL evaluation board (a) and its simplified schematic (b).
Electronics 14 03451 g011
Figure 12. Setup connections on the evaluation board inside the thermal chamber (a) and to the computer during the execution of a test (b).
Electronics 14 03451 g012
Figure 13. Visualization of the two RGB and white LEDs placement on the same PCB: (a) without diffuser snap, (b) with diffuser snap, that is a white, translucent plastic cap mounted directly above the LEDs.
Electronics 14 03451 g013
Figure 14. Representation of the four target points on the CIE 1931 chromaticity diagram, along with the three primaries of the LEDs.
Electronics 14 03451 g014
Figure 15. Measured CIE 1976 u’v’ chromaticity of point P1 at different temperatures (labels on markers). The dashed circle (radius = 0.01) represents the stability requirement. All measured points remain inside the circle; thus, the algorithm satisfies Δ u v 0.01 across the full range of temperatures. Panels: (a) full view, (b) zoomed view, (c) close-up on admissible region.
Electronics 14 03451 g015
Figure 16. Variation of u (blue, left y-axis) and v (orange, right y-axis) with temperature for point P1. Dashed lines indicate the respective target coordinates.
Electronics 14 03451 g016
Figure 17. Measured CIE 1976 u’v’ chromaticity of point P2 at different temperatures (labels on markers). The dashed circle (radius = 0.01) represents the stability requirement. All measured points remain inside the circle; thus, the algorithm satisfies Δ u v 0.01 across the full range of temperatures. Panels: (a) full view, (b) zoomed view, (c) close-up on admissible region.
Electronics 14 03451 g017
Figure 18. Variation of u (blue, left y-axis) and v (orange, right y-axis) with temperature for point P2. Dashed lines indicate the respective target coordinates.
Electronics 14 03451 g018
Figure 19. Measured CIE 1976 u’v’ chromaticity of point P3 at different temperatures (labels on markers). The dashed circle (radius = 0.01) represents the stability requirement. All measured points remain inside the circle; thus, the algorithm satisfies Δ u v 0.01 across the full range of temperatures. Panels: (a) full view, (b) zoomed view, (c) close-up on admissible region.
Electronics 14 03451 g019
Figure 20. Variation of u (blue, left y-axis) and v (orange, right y-axis) with temperature for point P3. Dashed lines indicate the respective target coordinates.
Electronics 14 03451 g020
Figure 21. Measured CIE 1976 u’v’ chromaticity of point P4 at different temperatures (labels on markers). The dashed circle (radius = 0.01) represents the stability requirement. All measured points remain inside the circle; thus, the algorithm satisfies Δ u v 0.01 across the full range of temperatures. Panels: (a) full view, (b) zoomed view, (c) close-up on admissible region.
Electronics 14 03451 g021
Figure 22. Variation of u (blue, left y-axis) and v (orange, right y-axis) with temperature for point P4. Dashed lines indicate the respective target coordinates.
Electronics 14 03451 g022
Figure 23. Measured CIE 1976 u’v’ chromaticity of point 2200 K at different temperatures (labels on markers). The dashed circle (radius = 0.01) represents the stability requirement. In this case, the requirement is not satisfied, with the largest deviation ( Δ u v = 0.0272 ) occurring at 85 °C, due to a calibration and saturation issue. Panels: (a) full view, (b) zoomed view.
Electronics 14 03451 g023
Figure 24. Variation of u (blue, left y-axis) and v (orange, right y-axis) with temperature for point 2200 K. Dashed lines indicate the respective target coordinates. A systematic offset is visible, leading to a deviation above the Δ u v 0.01 limit.
Electronics 14 03451 g024
Figure 25. Variation of color quality metrics for the 2200 K target with temperature: the CRI shows a marked decrease, significantly greater compared to CQS and TM-30.
Electronics 14 03451 g025
Figure 26. Measured CIE 1976 u’v’ chromaticity of point 4000 K at different temperatures (labels on markers). The dashed circle (radius = 0.01) represents the stability requirement. All measured points remain inside the circle; thus, the algorithm satisfies Δ u v 0.01 across the full range of temperatures. Panels: (a) full view, (b) zoomed view.
Electronics 14 03451 g026
Figure 27. Variation of the chromaticity coordinates u and v with temperature for color point 4000 K. The dashed lines represent the respective target values.
Electronics 14 03451 g027
Figure 28. Variation of color quality metrics for the 4000 K target with temperature: the CRI shows a stronger decrease compared to CQS and TM-30, which maintain relatively high values across the full range.
Electronics 14 03451 g028
Figure 29. Measured CIE 1976 u’v’ chromaticity of point 5000 K at different temperatures (labels on markers). The dashed circle (radius = 0.01) represents the stability requirement. All measured points remain inside the circle; thus, the algorithm satisfies Δ u v 0.01 across the full range of temperatures. Panels: (a) full view, (b) zoomed view.
Electronics 14 03451 g029
Figure 30. Variation of the chromaticity coordinates u and v with temperature for color point 5000 K. The dashed lines represent the respective target values.
Electronics 14 03451 g030
Figure 31. Variation of color quality metrics for the 5000 K target with temperature: the CRI shows a stronger decrease compared to CQS and TM-30, which maintain relatively high values across the full range.
Electronics 14 03451 g031
Table 1. Comparison of temperature compensation algorithms for RGB LEDs.
AuthorMethodProsCons
Hong and Liu [3]Thermal model based on Fourier temperature–power prediction and sRGB compensation algorithm.No external temperature sensors needed. Low chromaticity deviation ( Δ x y < 0.0052 ).Limited to RGB. Requires physical parameters ( α , β ) that must be measured for each LED type and vary with PCB layout and chip design.
Tao and Liu [2]Temperature prediction using internal current source behavior and optical compensation via precomputed LUT on chip.No external temperature sensor needed. Low chromaticity deviation ( Δ u v < 0.0067 ).Limited to RGB. Temperature estimation accuracy depends on the thermal behavior of the specific driver chip. Requires empirical calibration for each IC.
Qu et al. [12]Junction temperature estimated from forward voltage. Optical compensation via tristimulus modeling based on forward voltage measurements.No temperature sensors required. Low chromaticity deviation ( Δ u v < 0.0041 ).Limited to RGB. Linear model between temperature and optical response.
Shahila et al. [13]Adaptive real-time temperature-compensated PWM control, using adaptive frequency and phase adjustment.Reduced thermal stress and prolonged LED lifespan.Limited to RGB. Requires an on-board temperature sensor. Phase control adds system complexity.
Proposed methodForward-voltage-based junction temperature estimation. LED characterization-based correction. RGBW compensation.No temperature sensors needed. Supports RGBW (higher CRI). Low chromaticity deviation for RGB ( Δ u < 0.0051 , Δ v < 0.0056 ).Requires characterization and calibration for each different LED.
Table 2. Chromaticity coordinates ( x , y and u v ) of the four target color points tested.
Pointxyu’v’
P10.41200.43690.22210.5300
P20.42880.19850.37910.3949
P30.18440.37320.10370.4724
P40.34180.35090.20950.4838
Table 3. Chromaticity coordinates (CCT, x , y and u v ) of the four target color points tested.
CCTxyu’v’
2220 K0.50560.41520.29010.5360
4000 K0.38040.37670.22510.5015
5000 K0.34510.35160.21140.4847
Table 4. Validation results of the RGBW algorithm at different CCTs, showing the maximum chromaticity deviation from the target ( Δ u v ), the CRI for RGBW and RGB configurations at 25 °C, and the resulting CRI improvement.
CCTMax Δ u v CRI RGBW (25 °C)CRI RGB (25 °C)ΔCRI
2200 K0.027231.63.7+27.9
4000 K0.006778.619.7+58.9
5000 K0.006277.623.5+54.1
Disclaimer/Publisher’s Note: The statements, opinions and data contained in all publications are solely those of the individual author(s) and contributor(s) and not of MDPI and/or the editor(s). MDPI and/or the editor(s) disclaim responsibility for any injury to people or property resulting from any ideas, methods, instructions or products referred to in the content.