Abstract
Predicting driver injury severity is critical for enhancing road safety, but it is complicated because fatal accidents inherently create class imbalance within datasets. This study conducts a comparative analysis of machine-learning (ML) and deep-learning (DL) models for multi-class driver injury severity prediction using a comprehensive dataset of 107,195 traffic accidents from the Adana, Mersin, and Antalya provinces in Turkey (2018–2023). To address the significant imbalance between fatal, injury, and non-injury classes, the hybrid SMOTE-ENN algorithm was employed for data balancing. Subsequently, feature selection techniques, including Relief-F, Extra Trees, and Recursive Feature Elimination (RFE), were utilized to identify the most influential predictors. Various ML models (K-Nearest Neighbors (KNN), XGBoost, Random Forest) and DL architectures (Convolutional Neural Network (CNN), Long Short-Term Memory (LSTM), Recurrent Neural Network (RNN)) were developed and rigorously evaluated. The findings demonstrate that traditional ML models, particularly KNN (0.95 accuracy, 0.95 F1-macro) and XGBoost (0.92 accuracy, 0.92 F1-macro), significantly outperformed DL models. The SMOTE-ENN technique proved effective in managing class imbalance, and RFE identified a critical 25-feature subset including driver fault, speed limit, and road conditions. This research highlights the efficacy of well-preprocessed ML approaches for tabular crash data, offering valuable insights for developing robust predictive tools to improve traffic safety outcomes.
1. Introduction
Traffic accidents are an important problem for society worldwide since they cause many material and moral losses. Studies indicate that around 90% of global traffic accidents are primarily caused by driver-related errors. Although it is difficult to detect infrastructure problems that cause accidents and responsibility is generally attributed to drivers, it is known that drivers are the main factor in these accidents [1]. In this context, excessive speed is the most common driver error, while drunk driving, not using a helmet or seat belt, and careless driving behaviors also play an important role in accidents resulting in injury or death [2]. Such risky driving behaviors significantly increase both the probability and severity of an accident. Traffic safety is one of the most important social and economic problems in Türkiye (Turkey), which has a population of over 85 million. Approximately 1.4 million traffic accidents occurred in 2024; 6352 people lost their lives, and 385,117 people were injured in these accidents. In road traffic accidents in 2024, an average of 731.1 fatal and injury accidents, 17.4 deaths, and 1055 injuries occurred per day [3]. One of the main goals of transportation policies in Türkiye is to reduce traffic accidents and the material and moral losses experienced by these accidents by improving traffic safety. For this purpose, it is necessary to determine the factors contributing to traffic accidents and to implement effective measures accordingly [4].
In this study, a comprehensive dataset obtained from the General Directorate of Security (GDS) was utilized to estimate the severity of driver injuries. The dataset comprises traffic accident records involving fatalities and/or injuries that occurred between 2018 and 2023 in the Adana, Mersin, and Antalya provinces of Türkiye, encompassing 38 features. These variables include occupant characteristics such as age, gender, and injury severity; crash characteristics like vehicle type and collision type; road characteristics such as road type and horizontal and vertical geometry; driving behavior factors including alcohol influence and speeding; and temporal/environmental conditions. Among the 107,176 recorded accidents, 1427 drivers were killed, 76,276 were injured, and 29,473 were alive. Traffic accidents exhibit a data distribution characterized by a low frequency of fatal incidents, contrasted with a comparatively higher prevalence of cases involving injuries and property damage. Therefore, in the first step, we aimed to address the imbalance in the dataset. The SMOTE-ENN (Synthetic Minority Oversampling Technique-Edited Nearest Neighbor) algorithm was employed, combining both oversampling and undersampling techniques. Subsequently, feature selection (FS) techniques such as Relief-F, Extra Trees (ET), and Recursive Feature Elimination (RFE) were applied to identify the most relevant features. These methods help eliminate unnecessary or less important features from the dataset, leading to more accurate predictions. In the final step, various machine-learning (ML) and deep-learning (DL) algorithms were utilized to develop models for predicting driver injury severity. Following this, the best-performing model and the most significant predictor features were selected based on evaluation metrics such as accuracy and F1-score.
The contributions of this study can be listed as follows:
- Although the dataset was collected from a specific region, it enables a comprehensive analysis of accident attributes and the severity of driver injuries.
- The primary aim and originality of this study lie in addressing the challenges of processing imbalanced and multi-class data, particularly in the context of traffic accidents, by leveraging well-known data augmentation and FS algorithms. This approach ensures the effective handling of complex datasets, enhancing the accuracy and reliability of predictive models.
- The study conducts a comparative analysis of various FS methods and evaluates the performance of both ML and DL models. This comparative analysis provides a crucial understanding to identify the most effective strategies for predicting driver injury severity. Additionally, the study examines the performance of different DL models, highlighting their strengths and limitations.
The remainder of this paper is organized as follows: Section 2 reviews existing literature on traffic accident analysis and driver injury severity estimation. Section 3 describes the dataset, including FS and preprocessing, and outlines the multi-class prediction methodologies employed. Section 4 details the experimental design, including model training, validation, and performance metrics. Section 5 presents the results, evaluates model performance across severity classes, and discusses implications for traffic safety policy.
2. Related Work
As traffic accidents continue to increase, traffic safety remains a major focus for researchers. This has also become a source of concern for policymakers. To address this challenge, a variety of approaches—ranging from traditional statistical methods to advanced ML and DL techniques—have been employed to analyze the factors contributing to accidents and forecast their outcomes.
Tang et al. [5] developed a two-layer stacking model to predict crash injury severity using 5538 crash data points from 326 highway detours in Florida, USA, between 2004 and 2006. In the first layer, they used Random Forest (RF), Adaptive Boosting, Gradient Boosting (GB), and Decision Tree (DT) models, whereas in the second layer, they used Logistic Regression (LR) to calculate the classification results of crash injury severity. Similarly, Lee et al. [6] predicted accident severity using 518 traffic accident data, road geometry, and precipitation data that occurred during rainy seasons in Seoul, Korea, between 2015 and 2017. They compared the superiority of RF, ANN, and DT models used to evaluate accident severity. The attributes most strongly associated with injury severity were road geometry, wetness, and male drivers. In another study, Mokhtarimousavi et al. [7] determined the time zone that affected the injury severity of 10,146 pedestrian-vehicle accidents involving pedestrians in California between 2010 and 2014. In addition to statistical methods such as the Ordered Probit (OP) model with random parameters and the Ordered Logit (OL) model with random parameters, they developed an ANN in which the Whale Optimization Algorithm was defined as the learning algorithm. Their model achieved 72.41% accuracy, outperforming the OL and OP models. According to the dataset, they concluded that age, alcohol consumption, pedestrian location, time, light, and surface condition attributes had a significant effect on injury severity. Fiorentini and Losa [8] developed injury severity classification models using random trees, K-Nearest Neighbors (KNN), LR, and RF models on a dataset of 6515 samples of accidents occurring on roads and intersections in the city of York from 2005 to 2018. Because the data containing injury severity classes had an unbalanced distribution, they used a random subsampling method to reduce the number of dominant samples to the number of samples of the minority class. Gan and Weng [9] developed driver injury severity prediction using Multinomial Logit (MNL) and RF models with a dataset of 4841 highway accidents that occurred in the Hubei, Guizhou, Chongqing, and Guangdong provinces of China between January 2017 and April 2019. They observed that RF predicts driver injury severity better than the MNL model, and the most important attributes affecting driver injury severity are the time of day and vehicle type. Aldhari et al. [10] proposed three ML models to predict injury severity using traffic accident data from Qassim Province, Saudi Arabia, spanning from January 2017 to December 2019. They utilized RF, Extreme Gradient Boosting (XGBoost), and LR algorithms, incorporating resampling techniques to mitigate data imbalance challenges. The study applied SHapley Additive exPlanations analysis to identify and prioritize factors influencing crash injury severity. Both multi-class and binary classification methods were implemented, with XGBoost emerging as the top-performing model, achieving 71% accuracy, 70% precision, 71% recall, and a 70% F1-score. In Greece, Sarigiannis et al. [11] employed RF, GB, and ET to identify high-risk crash locations based on road indicators using 5383 data points collected between 2012 and 2015 as part of the Greek National Road Safety Project. Their goal was to classify areas with elevated crash risks using ML techniques. While all three models demonstrated comparable performance, the ET model outperformed the others in terms of the F1-score metric.
The study by Çeven and Albayrak [12] aligns with this domain by investigating traffic accident severity in Kayseri, Turkey, using decision tree-based ensemble learning methods: RF, AdaBoost, and Multilayer Perceptron (MLP). Their dataset, comprising urban accidents, was preprocessed to handle categorical data through pseudo-coding, resulting in 15 key variables for model input. The authors highlight that “driver fault” emerged as the most significant predictor of accident severity. Their findings indicate strong performance for RF (91.72% F1-score) and AdaBoost (91.27% F1-score), particularly in identifying non-injury accidents. The research contributes by focusing on accidents in crowded urban areas, specifically at intersections, and underscores the efficacy of ensemble methods for categorical crash data. Azhar et al. [13] used a dataset obtained from the MIROS Road Accident Analysis and Database System (M-ROADS) to measure injury severity among heavy vehicle drivers in Malaysia in crashes involving heavy vehicles. They used Classification and Regression Tree (CART) and Random Forest (RF) models to identify and classify variables associated with driver injury severity in a dataset of heavy vehicle crashes from 2014. When comparing the performance of the models, they achieved slightly higher accuracy than RF, although both produced similar outcomes. Sorum and Pal [14] conducted driver injury severity analyses using 12 different ML models and crash data from the Shillong police department in India between 2011 and 2020. By comparing the models’ performance across standard performance metrics, such as precision, recall, accuracy, F1-score, and area under the curve (AUC), they determined that the Light Gradient-Boosting Machine (LightGBM) model was the most successful algorithm for predicting injury severity in driver-involved crashes.
Zhang et al. [15] presented a hybrid feature selection-based classification approach for identifying significant features and predicting injury severity in single- and multi-vehicle crashes using accident data between 2015 and 2019 in Torkham, Pakistan. The obtained significant features were then fed to Naive Bayes, K-Nearest Neighbor (KNN), Binary Logistic Regression (BLR), and Extreme Gradient Boosting (XGBoost) models. In the classifier performance metrics, XGBoost was determined to be the classifier that made the best prediction. Finally, Wei et al. [16] used data from the China In-Depth Accident Investigation Database (CIDAS) for accidents involving a motor vehicle and a two-wheeled motorcycle between 2014 and 2018. They compared six different ML methods to classify and predict motorcycle rider injury severity using performance evaluation metrics such as accuracy, precision, sensitivity, F1-score, and AUC. Among these methods, the highest-performing LightGBM algorithm was selected.
The prediction of traffic crash severity has been studied using various datasets, modeling techniques, and preprocessing strategies. Table 1 summarizes key studies in the literature, including the characteristics of the dataset, modeling approaches, target classes, and reported performance.

Table 1.
Summary of related studies on traffic accident severity prediction.
Although many studies in the literature address fatal crash prediction, they typically focus on specific crash types or regional datasets and lack a unified framework that combines rigorous imbalance management, systematic feature selection, and comparative evaluation across both ML and DL models. In contrast, our approach explicitly models fatal crashes as a discrete severity class within a multi-class setup, applies advanced balancing (SMOTE-ENN) and feature selection techniques, and compares various algorithms, including KNN, CNN, and XGBoost, on the same preprocessed dataset, thus ensuring both methodological consistency and broader applicability of the findings.
From the above, it is evident that while many studies achieve high performance using ML models, most lack systematic handling of class imbalance or feature selection. Moreover, comparative evaluations between ML and DL architectures on the same preprocessed dataset are rare.
Our contribution compared to existing work is that we use SMOTE-ENN to address the severe class imbalance in multi-class collision severity prediction. We applied three different feature selection techniques (Relief-F, Extra Trees, and RFE) and evaluated their effects. We also performed a fair comparison of multiple ML and DL models using the same dataset, feature subset, and balancing method.
KNN is effective on high-dimensional tabular data when combined with appropriate feature selection, but it is sensitive to local patterns, which are useful after SMOTE-ENN balancing. XGBoost models handle mixed data types well, include regularization to prevent overfitting, and have shown superior results in the traffic safety prediction literature. Although tabular datasets are generally more successful in ML methods, DL models have been tested to explore the potential advantages of automatic feature learning. The inclusion of DL architectures enables objective performance comparisons. This allowed us to compare multiple ML and DL models on the same dataset using feature subsets and balancing methods.
3. Material and Methods
3.1. Data Description
The dataset, obtained with legal permission from the GDS, covers 107,176 traffic accidents involving fatalities and/or injuries between 2018 and 2023 in Mersin, Adana, and Antalya, Türkiye (Turkey). It includes 2720 fatal accidents and 104,456 injury accidents. The data collected for each affected driver, as detailed in [17], include demographic information, road and accident characteristics, temporal and environmental factors, and geographic coordinates.
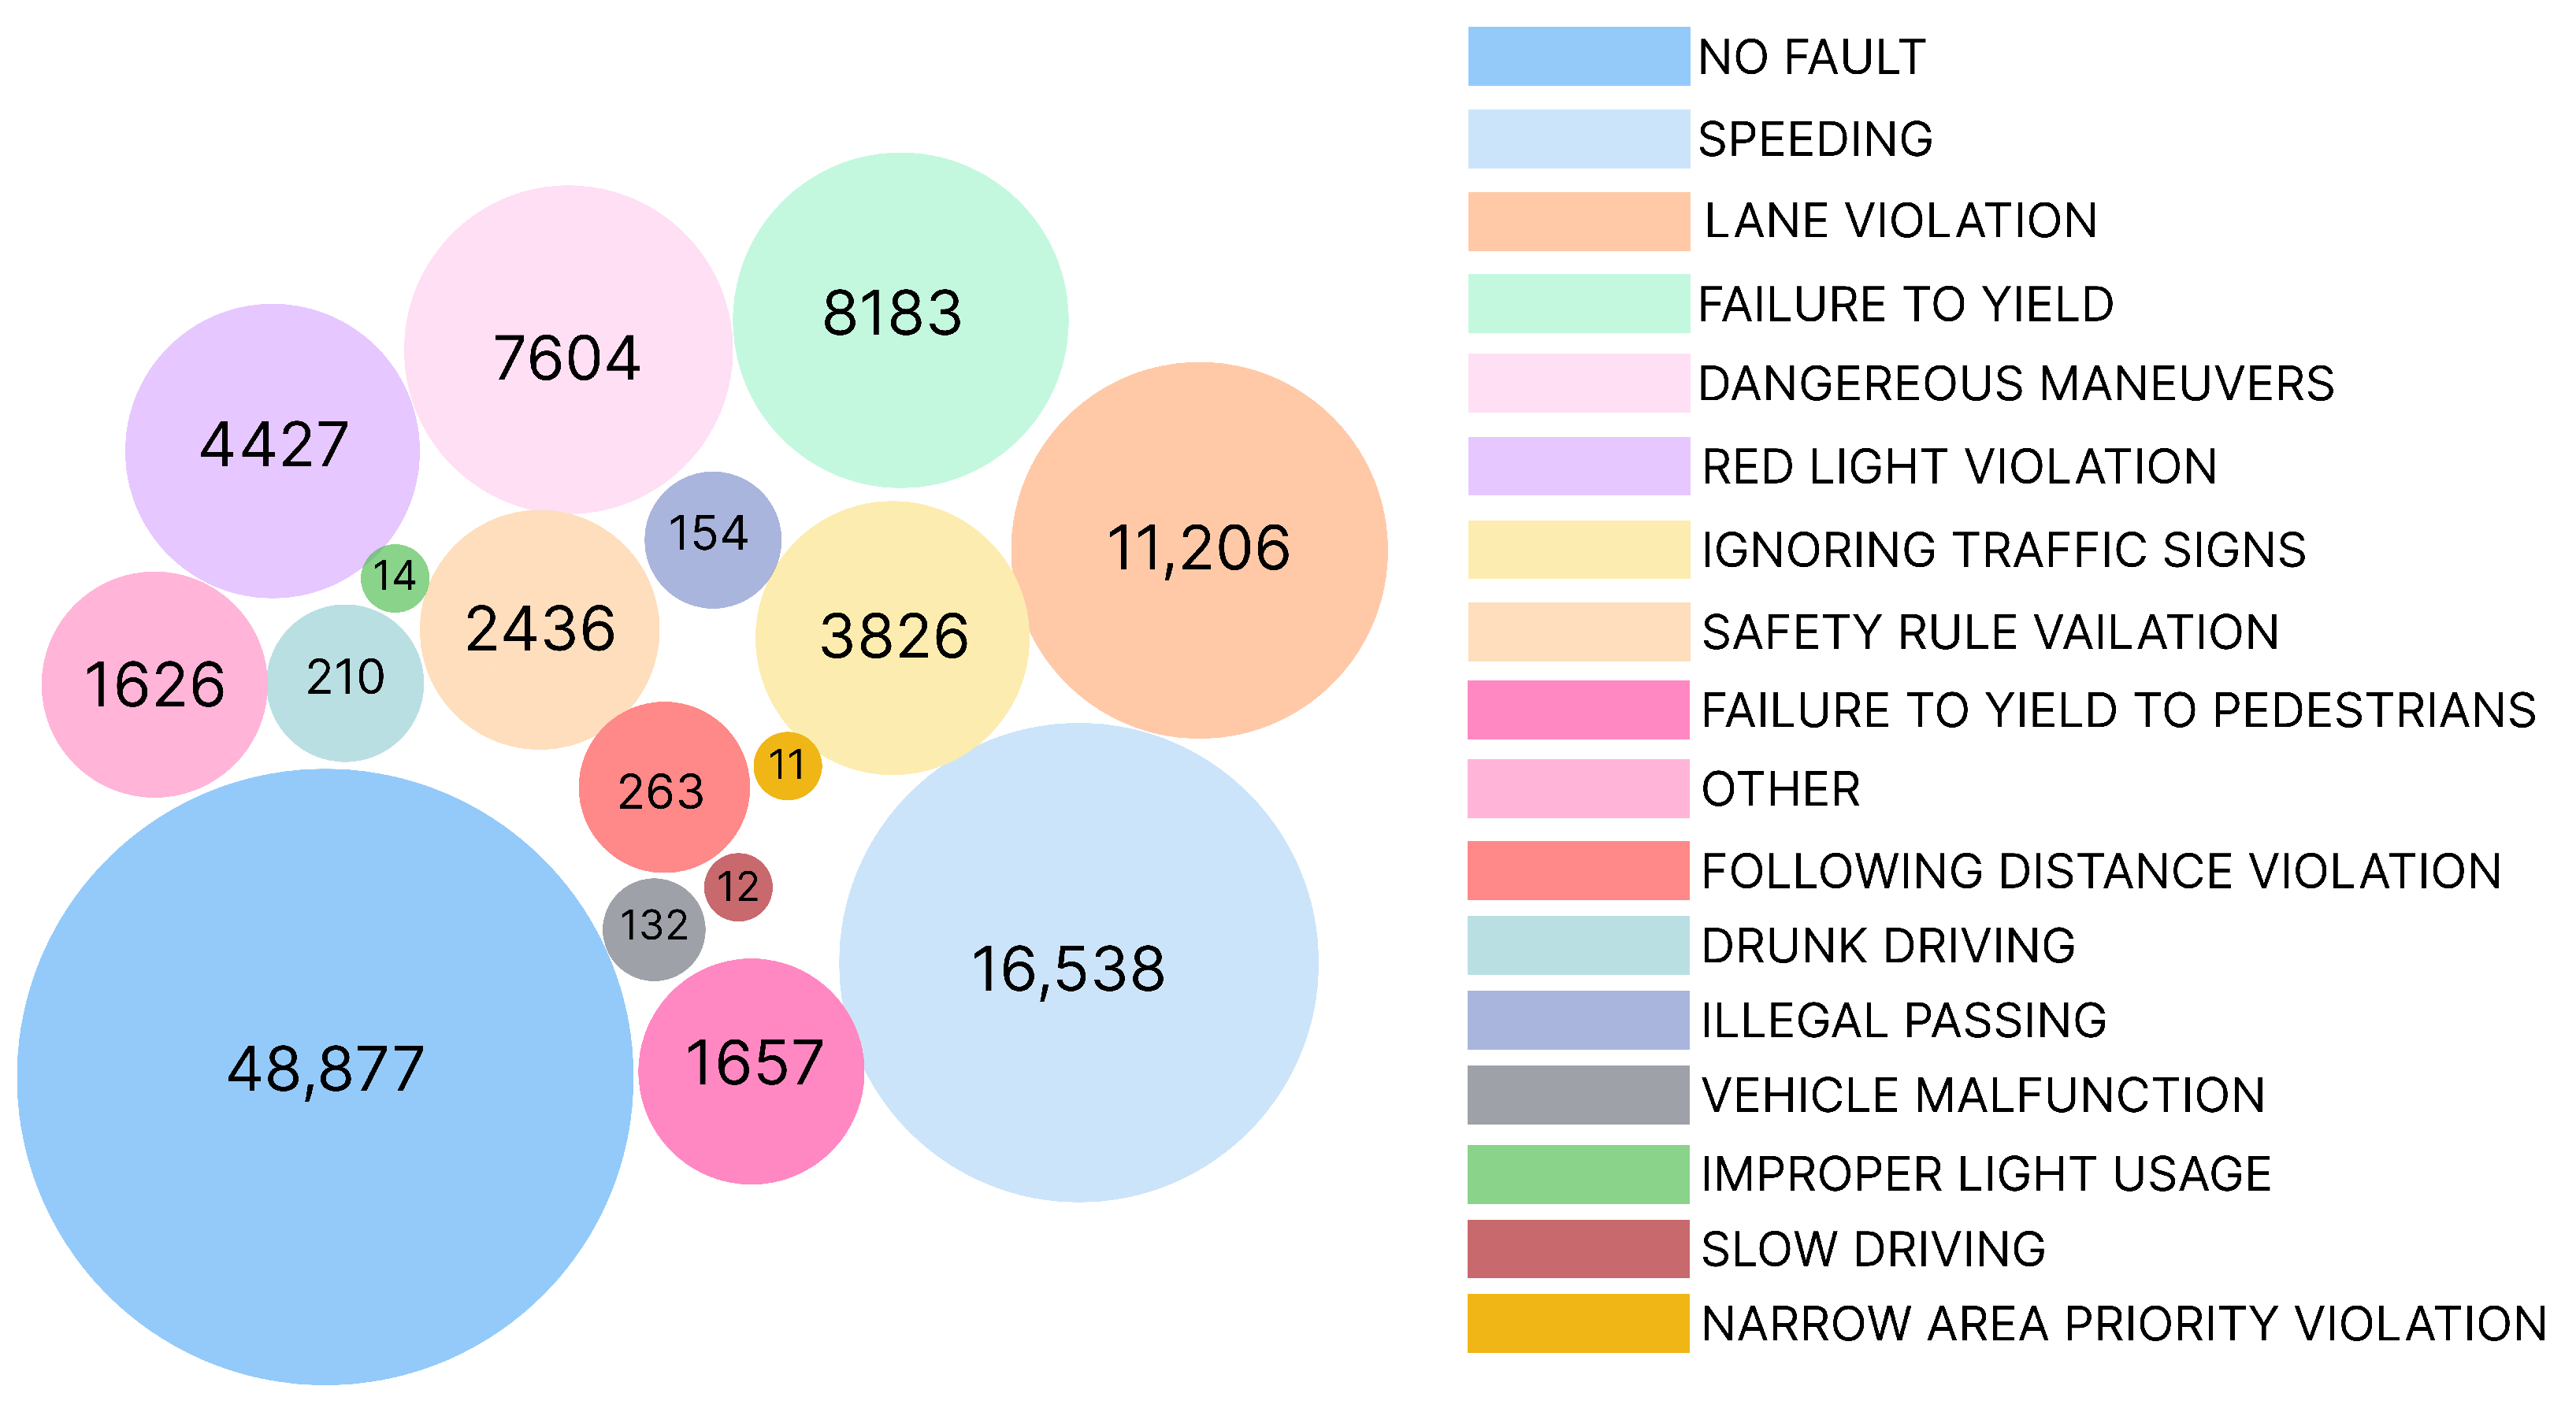
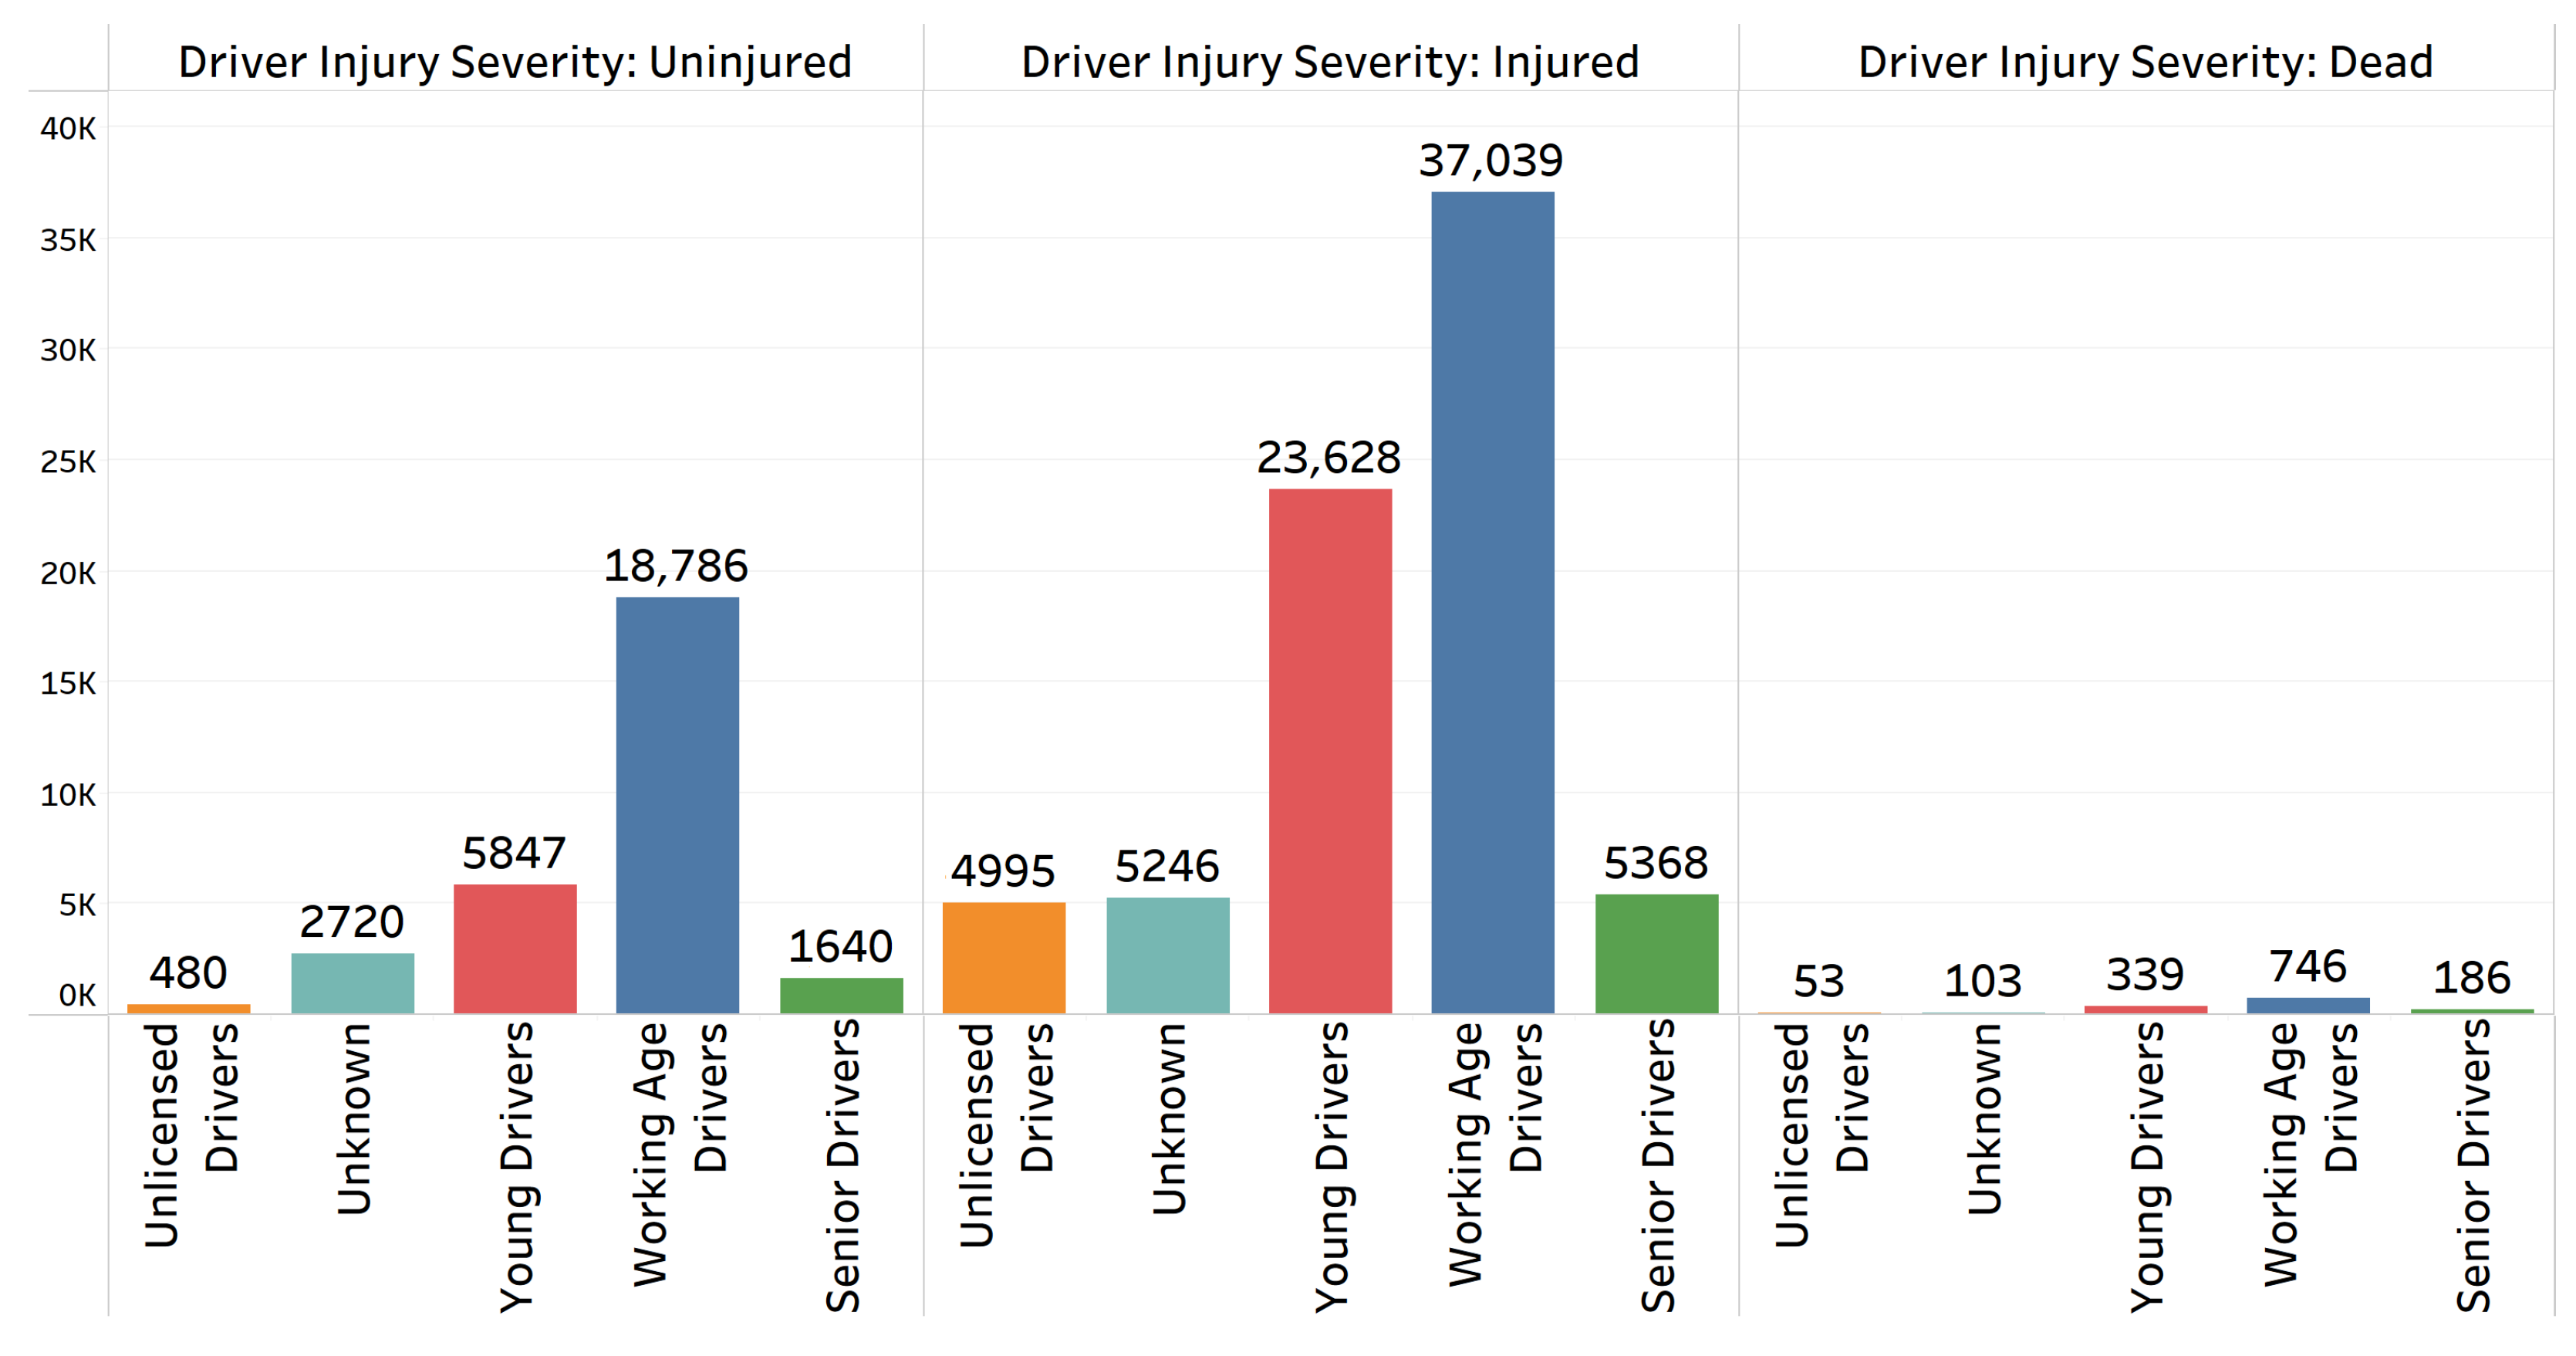
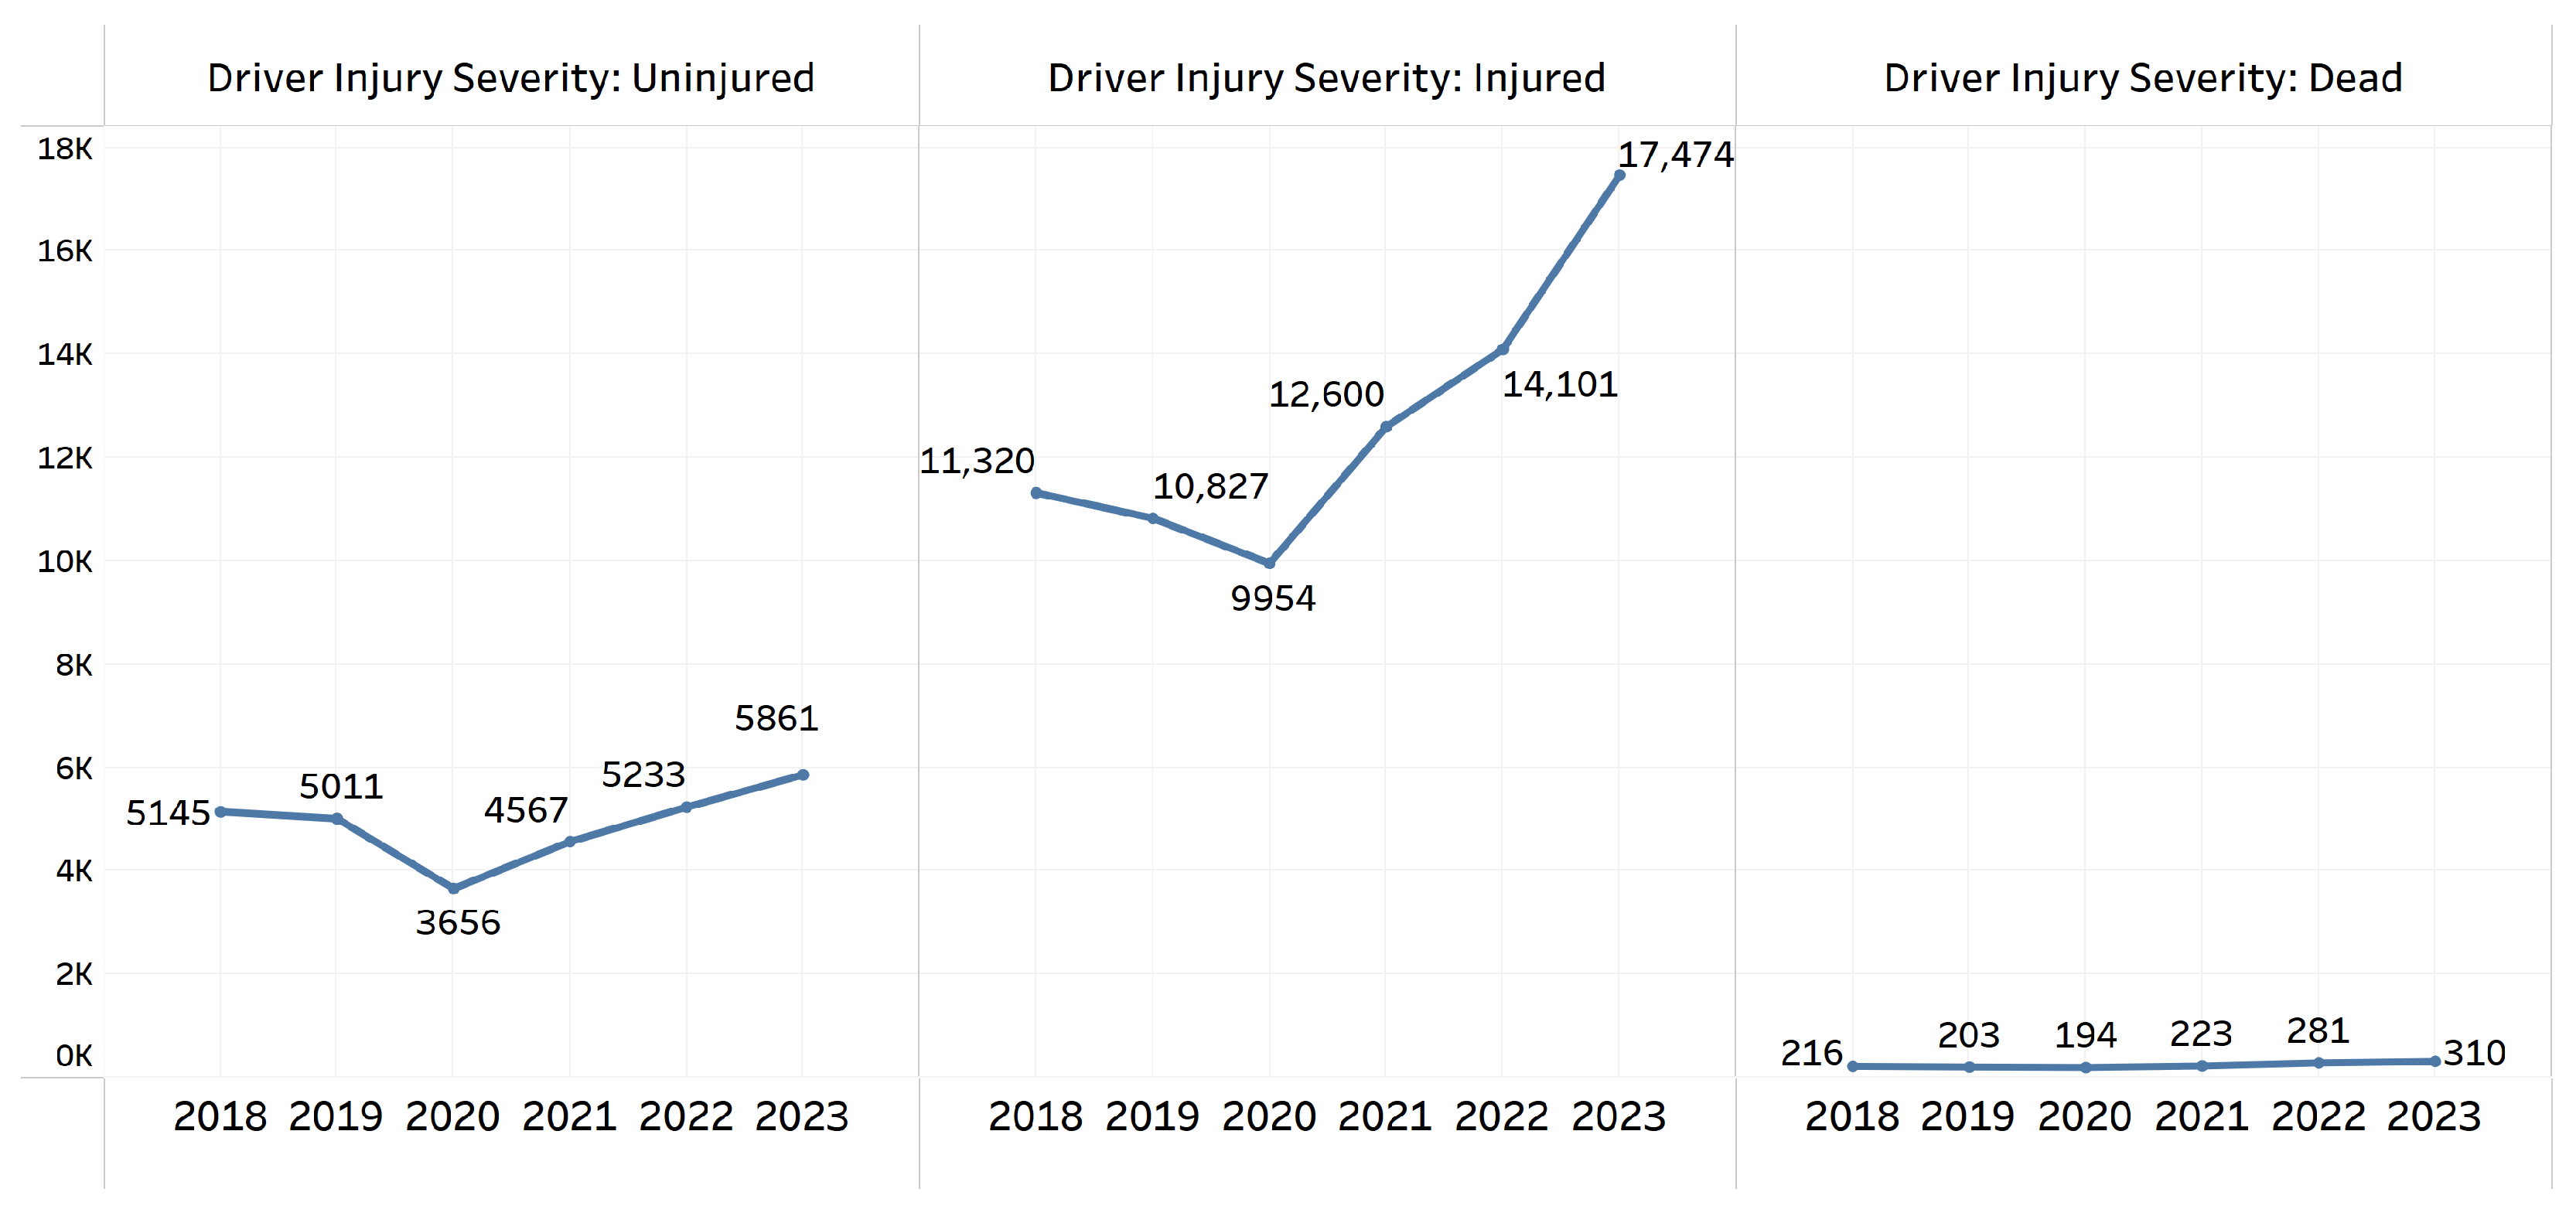
Injury severity was recorded at the time of the accident and 30 days later. Drivers were categorized by age: Unlicensed (0–17), Young Drivers (18–24), Working Age (25–64), and Old Drivers (65+), while those with unknown ages were labeled as Unknown. In the distribution of the driver faults in Figure 1, the most dominant faults are shown in large circles with the fault names and frequencies in the dataset. Figure 2 and Figure 3 show the distribution of driver injury severity by year and age group, respectively. The number of accidents increased over the years, with 23,645 cases recorded in 2023, the highest in the dataset. This upward trend may reflect growing traffic volumes or increased reporting. Accidents were more frequent during certain months, particularly in July (10,481 cases) and August (10,303 cases), possibly due to higher traffic during summer holidays. Additionally, accidents peaked during the afternoon hours (14:00–17:59), with 15,606 cases occurring between 16:00–17:59, likely due to rush-hour traffic.
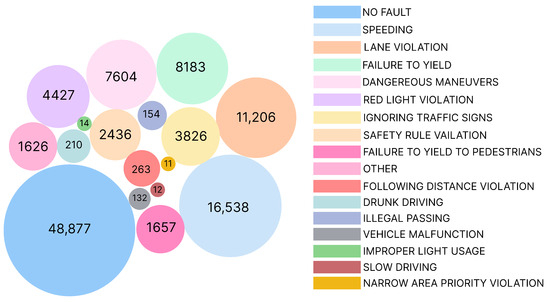
Figure 1.
Distribution of driver faults.
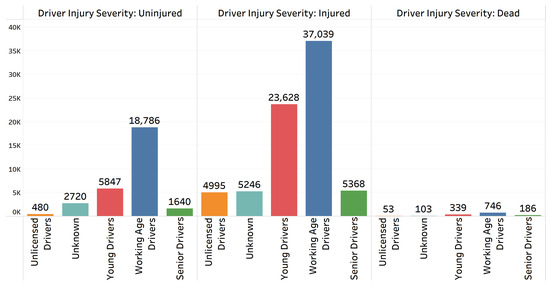
Figure 2.
Distribution of driver injury severity by age group.
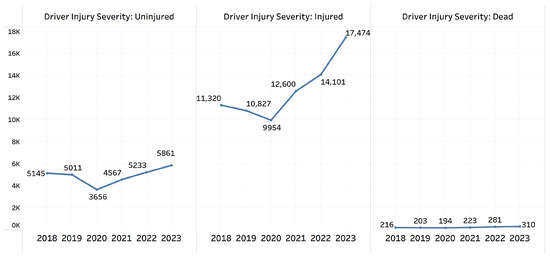
Figure 3.
Distribution of driver injury severity by year.
Antalya accounted for the highest number of incidents (45,354), followed by Mersin (34,874) and Adana (26,948). Fatalities represented 2.54% of total cases, while injuries comprised 97.46%. The majority of crashes occurred at four-leg intersections (24,111) and T-intersections (16,009), with most vehicles traveling “in the right direction” (69,617) under “dry road conditions” (97,931). Notably, 50 km/h speed limits were most common (69,025 cases), and alcohol involvement was reported in 2377 incidents. The data highlights Antalya as the most accident-prone city, with injuries dominating the severity distribution.
The dataset also highlights common crash types, such as side impacts (47,118 cases) and rear impacts (12,850 cases), and identifies speeding (16,538 cases) and lane violations (11,206 cases) as significant contributing factors. Additionally, the dataset provides information about vehicle types involved in accidents, with automobiles (61,127 cases) and motorcycles/scooters (15,044 cases) being the most common. The data further categorize accidents by road type, weather conditions, and driver demographics, offering a detailed analysis of factors influencing traffic accidents in these regions.
3.2. Machine-Learning (ML) and Deep-Learning (DL) Methods
In this study, we utilized ML and DL techniques to predict driver injury severity in traffic accidents. The methods used include KNN, XGBoost, and RF for ML-based approaches, and Convolutional Neural Networks (CNN), Long Short-Term Memory networks (LSTM), and Recurrent Neural Networks (RNN) for DL-based approaches. The accident dataset analyzed in this study presents several challenges, including severe class imbalance, a mixture of categorical and numerical features, and high dimensionality relative to the size of the minority class. These features guided the selection of both the ML and DL models. For ML, KNN was selected because of its effectiveness in capturing local neighborhood patterns in balanced feature spaces and its suitability after oversampling with methods such as SMOTE-ENN. Random Forest (RF) was selected because of its robustness to noise, ability to model nonlinear interactions, and capacity to estimate feature importance. XGBoost was included because of its strong performance in tabular prediction tasks and its ability to address class imbalance through parameter tuning. CNNs, although typically applied to image data, were used due to their ability to capture local feature interactions in tabular datasets. LSTM networks were used to investigate whether sequential modeling could capture latent dependencies between features, whereas RNNs were added to ensure comprehensive coverage of sequence-based architectures for tabular accident data. Below are brief descriptions of each method, along with relevant equations.
3.2.1. K-Nearest Neighbors (KNN)
KNN is a non-parametric, instance-based learning algorithm used for classification and regression tasks. It predicts the output for a data point by identifying the k nearest neighbors in the feature space and assigning the most common class (for classification) or the average value (for regression) among them. The distance metric, typically Euclidean distance given in Equation (1), is used to determine the nearest neighbors [18].
where x and y are two data points in an n-dimensional space.
3.2.2. XGBoost (Extreme Gradient Boosting)
XGBoost is an optimized implementation of GB designed for speed and performance. It builds an ensemble of decision trees sequentially, where each tree corrects the errors of the previous one. The objective function given in Equation (2) consists of a loss function and a regularization term to prevent overfitting [19].
where L is the loss function, yi is the predicted value, yi is the actual value, and is the regularization term for the k-th tree.
3.2.3. Random Forest (RF)
RF is an ensemble learning method based on decision trees. It constructs a multitude of decision trees, each trained on a subset of the data, and outputs the average prediction or the majority vote from each tree to make a final prediction. The final prediction is made using Equation (3):
where T is the number of trees and is the prediction of the t-th tree [20].
3.2.4. Convolutional Neural Network (CNN)
CNNs are primarily used for image data but can also be applied to structured data. They consist of convolutional layers that extract spatial features, pooling layers for dimensionality reduction, and fully connected layers for final predictions. The convolution operation is given in Equation (4):
where f is the input and g is the kernel. CNNs are effective for capturing local patterns and hierarchical features [21].
3.2.5. Long Short-Term Memory (LSTM)
LSTM is a type of recurrent neural network designed to capture long-term dependencies in sequential data. It uses memory cells and gating mechanisms (input, forget, and output gates) to control the flow of information. The LSTM equations for cell state and hidden state are defined between Equations (5) and (9):
where , , and are the forget, input, and output gates, respectively, W are the weights, b are biases, and is the sigmoid activation function [22].
3.2.6. Recurrent Neural Network (RNN)
RNNs are designed for sequence prediction tasks, maintaining a hidden state that carries information from previous time steps. The basic RNN can be represented by the following equations:
where is the hidden state at time t, is the input at time t, and y is the output [23].
3.3. Data Balancing and Feature Selection (FS) Methods
In this study, we adopted several advanced methodologies for data balancing and FS to improve the efficiency of our predictive models. Specifically, we utilized SMOTE-ENN, a hybrid data-balancing technique. For the FS phase, we employed three distinct methods—Relief-F, ET, and RFE—to identify the most effective approach. These methods were evaluated to determine the optimal feature subset for improving model performance.
3.3.1. Synthetic Minority Over-Sampling Technique Combined with Edited Nearest Neighbors (SMOTE-ENN)
SMOTE generates synthetic samples for the minority class by interpolating between existing minority class instances. For a given minority class sample xi, a new synthetic sample xnew is created as given in Equation (12):
where is one of the KNN of from the minority class, and is a random number between 0 and 1. ENN, on the other hand, removes samples from both the majority and minority classes that are misclassified by their k-nearest neighbors, thereby cleaning the dataset. This hybrid approach helps in balancing the dataset while improving the quality of the samples [24].
3.3.2. Relief-F
Relief-F is a feature ranking method that assesses the relevance of features based on their ability to distinguish between classes. The relevance score for a feature f is computed using Equation (13):
where m is the number of instances, is the feature difference to the nearest neighbor of the same class, and is the feature difference to the nearest neighbor of a different class [25].
3.3.3. Extra Trees (ET)
ET is an ensemble-based FS method that constructs multiple decision trees using random subsets of features and data. The importance of a feature A is calculated as the normalized total reduction in the impurity criterion (e.g., Gini index or entropy) across all trees, given in Equation (14):
where N is the total number of trees, T represents a tree, t is a node in the tree, and is the impurity reduction due to feature A at node t [26].
3.3.4. Recursive Feature Elimination (RFE)
RFE iteratively evaluates the model’s performance by removing the least significant features based on their importance scores. The process is mathematically represented as given in Equation (15):
where represents the set of remaining features after the k-th iteration, and the selection of features is based on the performance of the model trained on the previous subset [27].
4. Research Design
In this section, we present the research design employed to investigate the effectiveness of various data preprocessing techniques on predictive modeling. We discuss the strategies implemented to address class imbalance in the dataset, ensuring robust and reliable model training. Furthermore, we detail the FS techniques applied to identify the most relevant features, enhancing model efficiency and interpretability.
4.1. Performance Metrics
To evaluate the performance of a classification model, a confusion matrix is utilized, which consists of four key variables: True Positive (), True Negative (), False Positive (), and False Negative (). TP represents instances that are correctly classified as positive, while denotes instances correctly classified as negative. FP refers to instances incorrectly classified as positive, and represents instances incorrectly classified as negative [28]. Accuracy is a reliable metric when the class distribution is balanced, as it reflects the proportion of correctly classified instances ( and ). It is calculated as
However, for imbalanced datasets, the F1-score is more effective, as it balances precision and recall, particularly when FP and FN are critical to the evaluation. The is the harmonic mean of precision and recall, computed as
where precision and recall are defined as:
A high recall value indicates that the model captures most positive instances but may also imply lower sensitivity, leading to a higher rate of misclassified labels. Conversely, high sensitivity with low recall suggests that the model correctly classifies most predicted labels. Achieving both high precision and recall ensures that the model produces accurate and reliable predictions with minimal misclassifications. F1-micro, F1-macro, and F1-weighted are variations in the F1-score used to evaluate multi-class classification models. Each has different ways of handling class imbalance and aggregation of precision and recall. F1-micro calculates metrics globally by counting the total TPs, FNs, and FPs across all classes. It is particularly useful for imbalanced datasets because it gives equal weight to each instance. F1-macro calculates metrics independently for each class and then takes the unweighted mean. It gives equal weight to each class, regardless of its size, making it sensitive to the performance of minority classes. F1-weighted calculates metrics for each class but takes a weighted average based on the number of true instances for each class. It is useful for imbalanced datasets where you want to account for class distribution [29].
4.2. Handling Imbalanced Data
Traffic accident datasets frequently suffer from significant class imbalance, primarily because the majority of accidents result in injuries, while fatal accidents are relatively rare. To address this imbalance, two primary strategies can be employed: subsampling techniques to reduce the volume of the majority class or oversampling methods to increase the representation of the minority class. These data processing techniques are crucial for enhancing the accuracy of predictive analyses. SMOTE-ENN, a hybrid approach, combines both oversampling and undersampling to balance datasets with uneven class distributions. It generates synthetic samples for the minority class through interpolation and subsequently removes redundant or noisy samples. This ensures that the dataset is not excessively oversampled, preventing prediction models from being biased while maintaining a balanced and representative dataset [30].
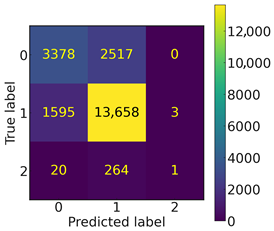
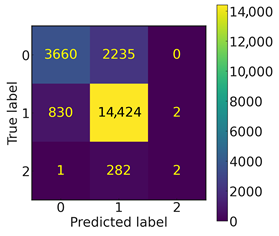
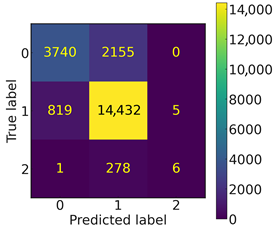
Initially, the minority class (dead class) contained 1427 samples, which proved insufficient for prediction models to predict this class, as illustrated in Table 2. The confusion matrices in Table 3 reveal that prediction models misclassified nearly all samples in the dead class as injured (FN), failing to correctly identify any instances of the dead class (TP). To address this, we experimentally increased the number of samples for the minority class from 10,000 to 70,000 in increments of 10,000 using the SMOTE-ENN data balancing algorithm, as shown in Table 4.

Table 2.
Prediction results of classification models for driver injuries before SMOTE-ENN.

Table 3.
Confusion matrices of the prediction models for driver injuries before SMOTE-ENN.

Table 4.
Classification results of prediction models for driver injuries in data balancing of the dead class.
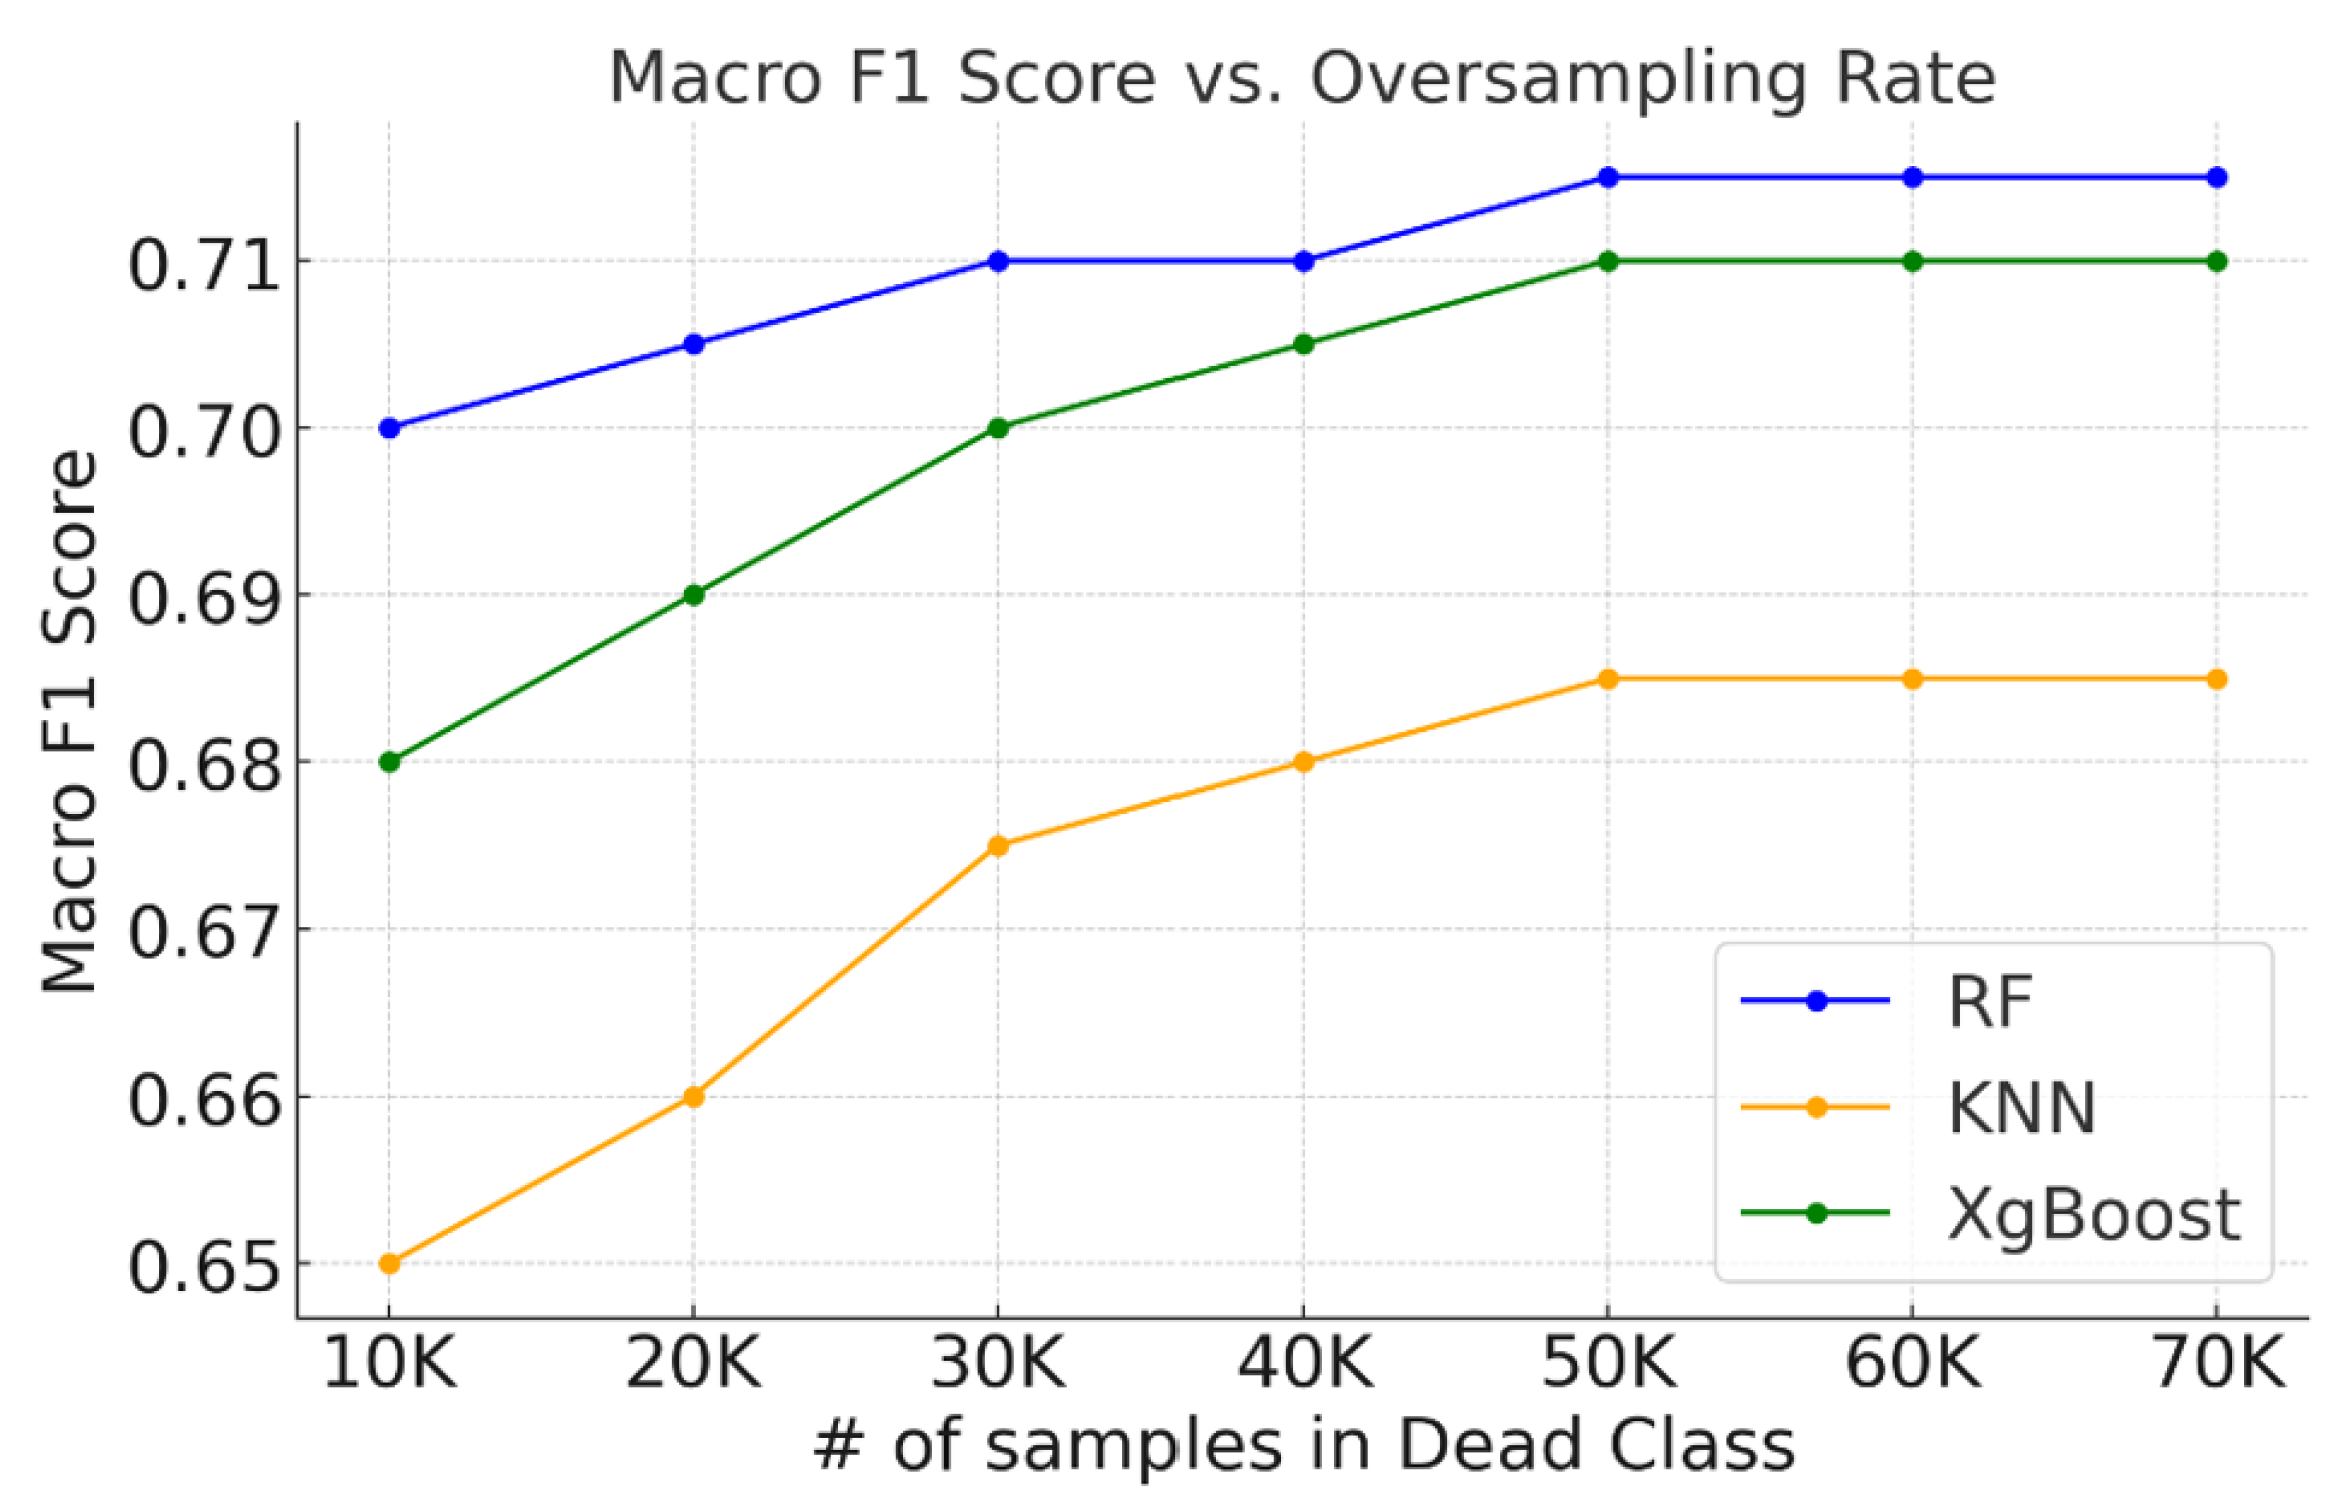
The F1-macro score graph in Figure 4 indicates a slight decline in the slope around 40,000 samples, suggesting that the additional information gained begins to diminish beyond this point. Based on this observation, we concluded that 40,000 samples for the minority class would be sufficient to achieve optimal model performance.
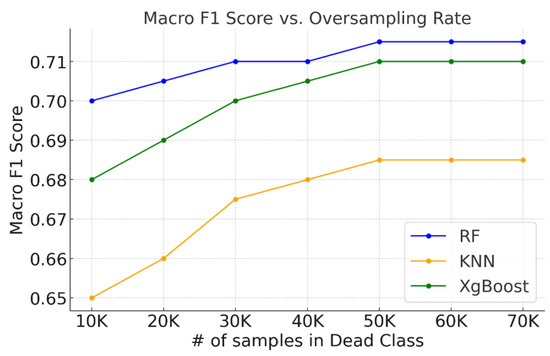
Figure 4.
Variation of F1-macro score with sample sizes of the dead class.
In the initial experiment targeting the minority class, the prediction accuracy for the “uninjured” class was notably low due to data imbalance. To address this issue, we experimentally tested the “uninjured” class using SMOTE-ENN, varying the sample size from 40,000 to 70,000, as shown in Table 5.

Table 5.
Classification results of prediction models for driver injuries in data balancing of the uninjured class.
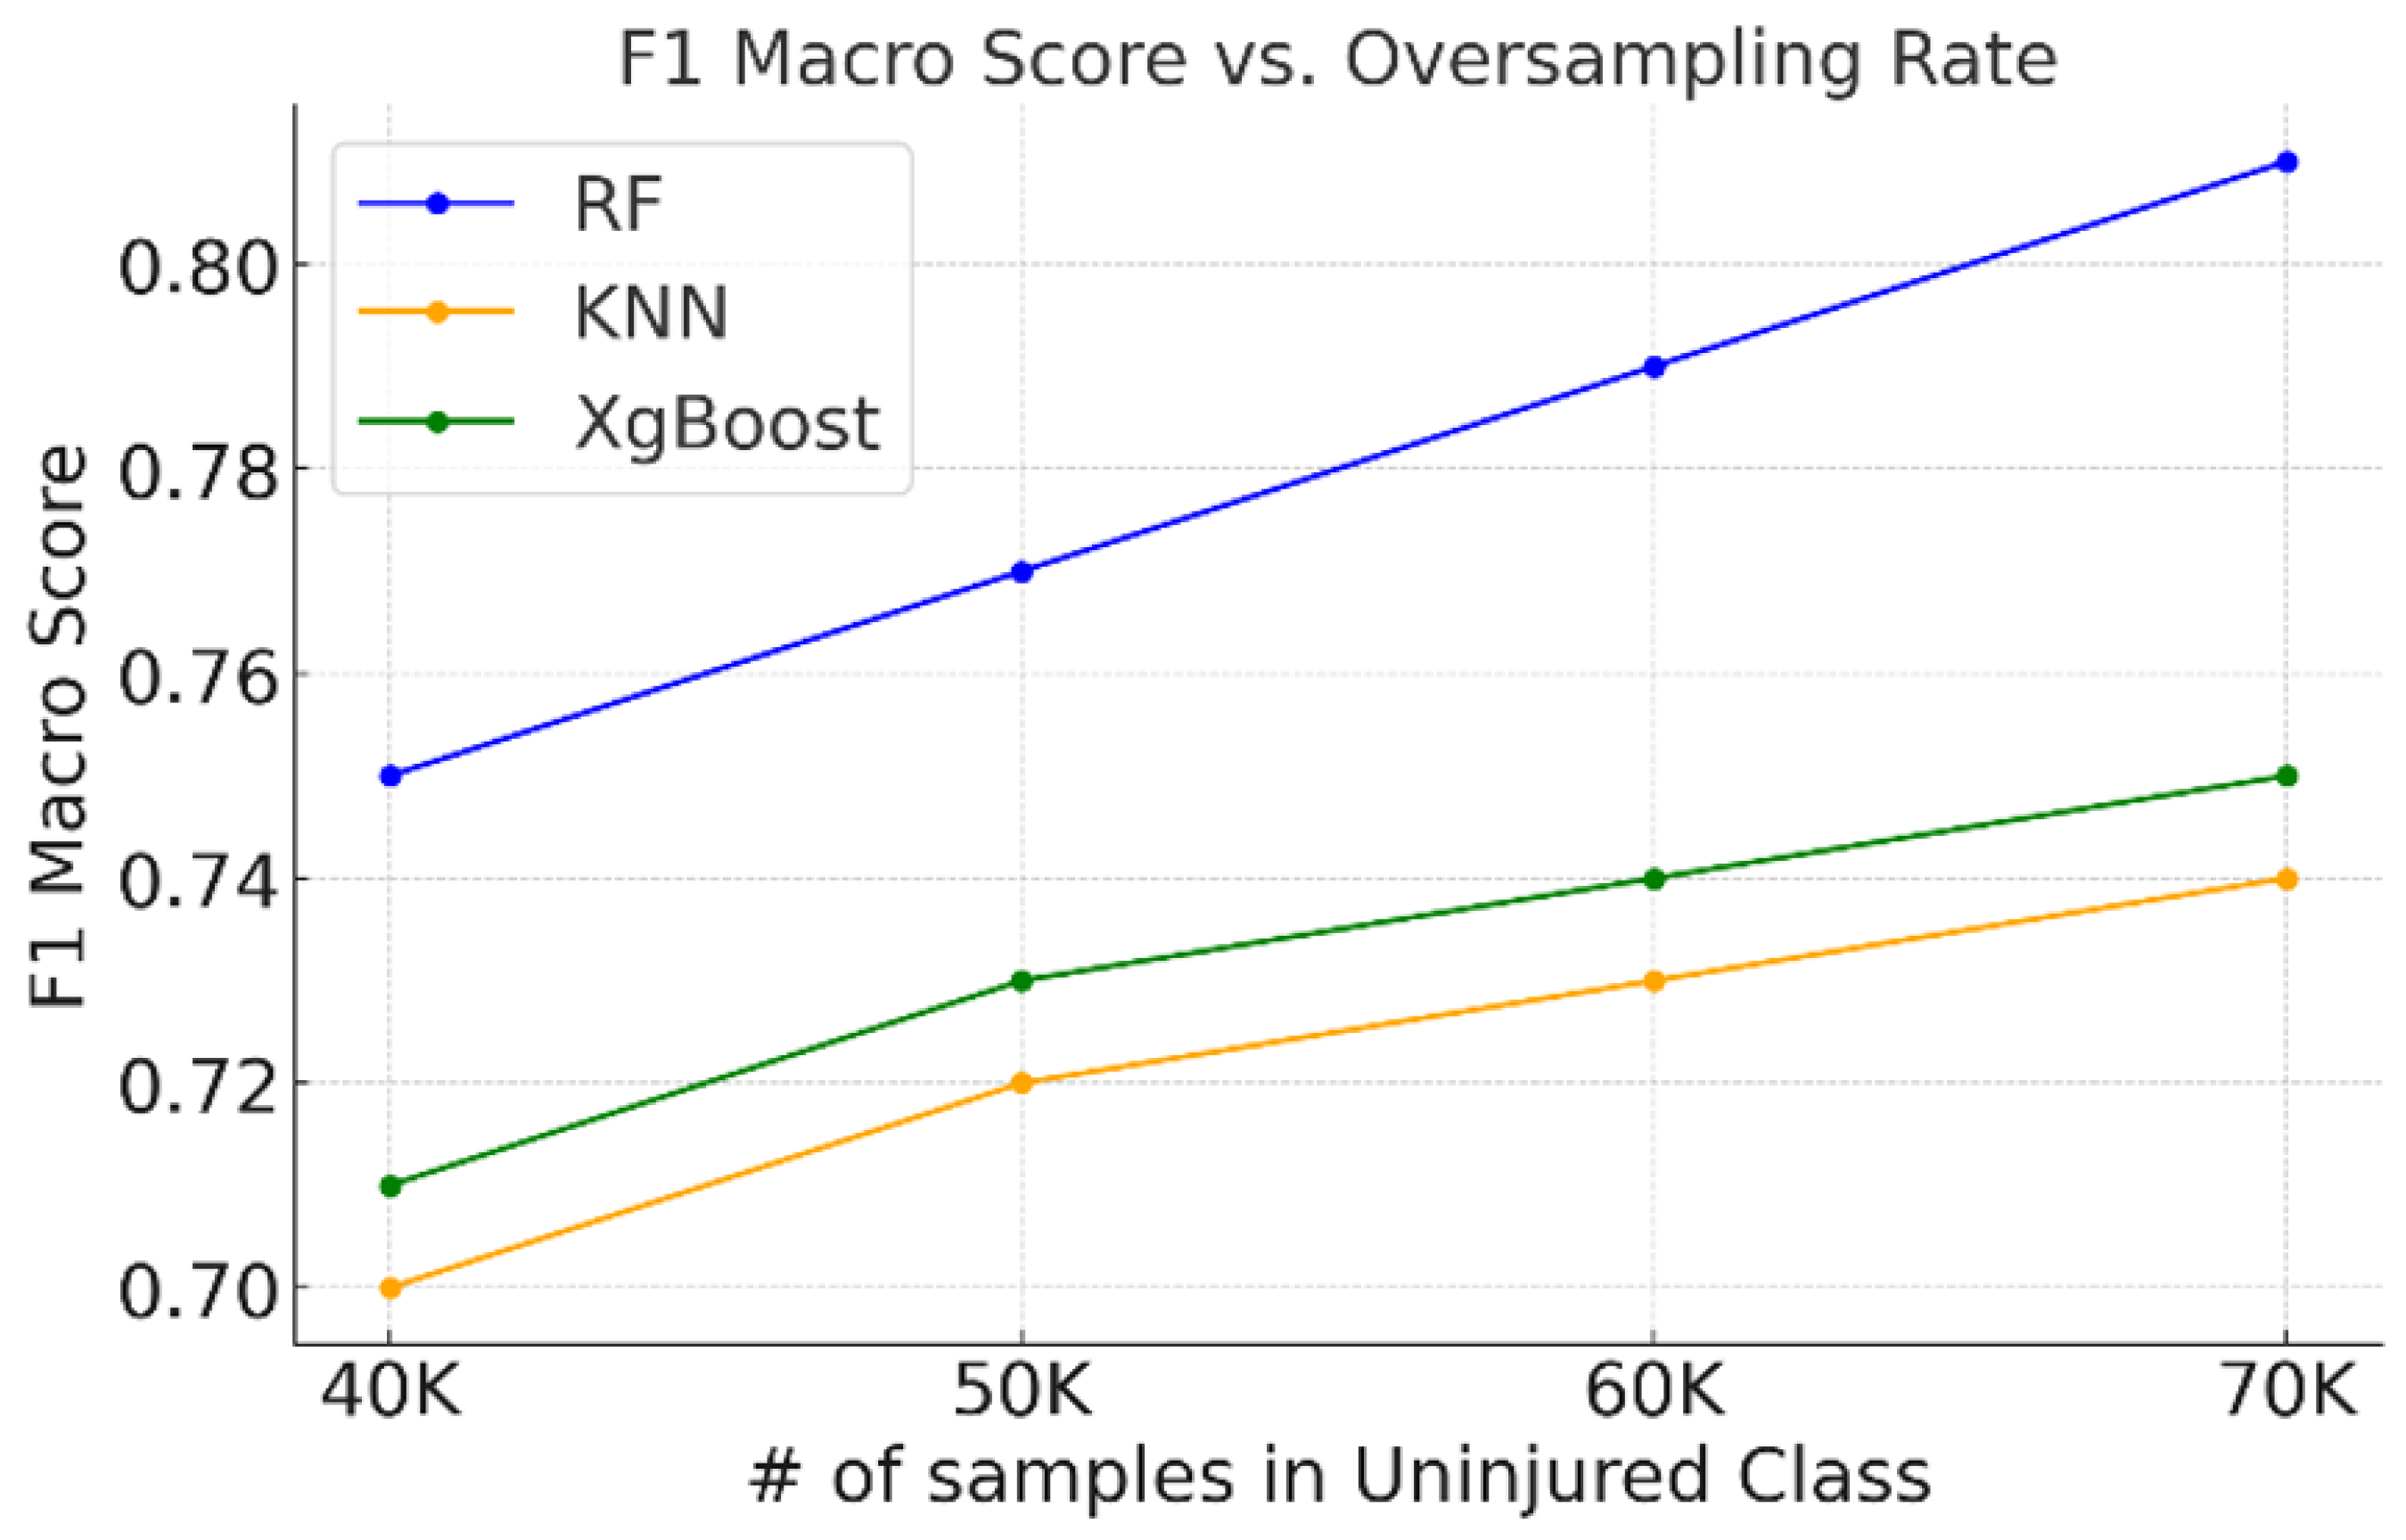
The F1-macro score plot in Figure 5 reveals a slight decline in the slope at approximately 60,000 samples, indicating that the additional information gained begins to diminish beyond this point. Consequently, we determined that oversampling the “uninjured” class to 60,000 samples would be sufficient. However, to manage the significant increase in data volume, we applied SMOTE-ENN to reduce the dataset. Specifically, the “uninjured” class was oversampled to 60,000 samples using SMOTE, while the “injured” class, initially containing 76,357 samples, was reduced using ENN. This approach not only decreased the overall data volume but also enhanced the prediction accuracy for the “uninjured” class.

Figure 5.
Variation of F1-macro score with sample sizes of the uninjured class.
Table 6 shows the performance results of prediction models on the balanced dataset achieved using SMOTE-ENN. Initially, the “uninjured” class was oversampled to 60,000 instances, while the “injured” class contained 76,357 instances. However, due to the dataset’s imbalance and large size, the computational load became excessively high. To address this, the ENN method was applied to reduce the data volume, decreasing the “uninjured” class to 42,463 instances and the “injured” class to 50,892 instances. The “not_minority” sampling strategy was employed to avoid further reduction of the minority class, as this could lead to overfitting. This approach ensured a balanced dataset while maintaining computational efficiency and model robustness.

Table 6.
Classification results of prediction models for driver injuries after data balancing.
4.3. Feature Selection (FS)
The quality of features used in the analysis is a critical factor influencing the accuracy of driver injury severity estimation. FS methods, which include filtering, wrapping, and ensemble techniques, play a vital role in identifying the most relevant features. In this study, three distinct FS methods—Relief-F, ET, and RFE—were applied to determine the optimal feature space. Relief-F, a filter-based method rooted in the KNN algorithm, evaluates feature relevance by calculating weights based on the proximity of nearest hits (correctly classified instances) and misses (incorrectly classified instances). ET, an ensemble-based FS method, constructs multiple decision trees using random subsets of features and data. It employs the Gini index to measure feature importance, ranking features based on their contribution to reducing impurity across all trees. RFE, a wrapper-based method, iteratively removes the least important features by training a model and evaluating classification accuracy, ultimately selecting the optimal feature subset. Based on the results from each FS method, prediction models were trained using subsets of 10, 20, 25, and 30 features. The outcomes of these experiments are detailed in Table 7.

Table 7.
Performance comparison of classification results generated by three different FS algorithms.
- Common features selected by all three methods: Road Class, Traffic Sign, Driver Fault, Unit Group, Road Lane Number, Accident Vehicle Number, Light, Road Lighting, Accident Occurrence Type, Safety Lane, Week Days, Legal Speed Limit, Pedestrian Way, First Crash Location, Intersection Type, Road Lane Line, Road Type.
- Features selected by RFE only: Vehicle Use Purpose.
- Features selected by Relief-F only: Pavement, Road Surface, Driver Alcohol Result, Driver’s License, Driver Gender, Vehicle Type, Vehicle Impact Part, Driver Age, and Vehicle Motion.
- Only attributes selected by RFE and Relief-F but not by ETC: Weather, Crossing Existence, Guardrails, and Vertical Alignment.
To enhance the performance of ML models for accident severity prediction, a study was conducted to identify the most impactful features from an initial dataset of 39 categorical and numerical variables. This effort aimed to improve predictive accuracy, mitigate the risk of overfitting, and increase model interpretability. Three distinct feature selection algorithms (i.e., Relief-F, ET, and RFE) were applied to KNN, RF, and XGBoost models. The performance of these models was evaluated using 5-fold cross-validation on feature subsets of varying sizes: 10, 20, 25, and 30.
The analysis of accuracy and F1-scores revealed that model performance generally improved as the number of features increased to 30 (Table 7). However, nuances in the performance metrics guided the final selection. For instance, while the Relief-F algorithm showed stable performance with 30 features, and the ET algorithm demonstrated minimal changes, the RFE algorithm showed a decline in both accuracy and F1-scores with 30 features. Considering both the dimensionality of the dataset and the associated computational load, a subset of 25 features was determined to be optimal. Although both RFE and ET yielded similar results with 25 features, the RFE-selected subset was preferred. This was because the ET method excluded critical traffic safety features, such as the presence of a crossing. The 25 features selected by RFE achieved the highest weighted F1-scores across the models (KNN 0.91, RF 0.93, and XGBoost 0.89), establishing it as the most effective attribute space for both the ML and DL models in this study.
According to the results, the best attribute space has 25 features and consists of Unit Group, Road Type, Road Class, Speed Limit, Lane Number, Crossing Existence, Light, Accident Type, Number of Vehicles Involved, Crash Location, Sidewalk, Safety Lane, Traffic Sign, Road Lane Line, Road Lighting, Driver Fault, Vehicle Type, Vehicle Motion, Vehicle Impact Part, Vehicle Damage Rating, Driver Age, Driver Gender, Driver’s License, Driver Alcohol Result. These attributes gave the best results in the comparative analysis of the prediction models with the default parameters.
5. Results and Discussion
In this section, we compare the performance of selected ML and DL models for a multi-class crash severity prediction task. To ensure a fair and reproducible comparison, all the models were trained and evaluated using the same preprocessed dataset. This dataset underwent consistent data cleaning, categorical coding, and SMOTE-ENN balancing. Importantly, we applied three feature selection techniques (Relief-F, Extra Trees, and RFE) and selected the top 25 features obtained with RFE that provided the highest F1-weighted scores during the cross-validation. This uniform subset of features was used in all the models to eliminate feature-induced bias. All classifiers in this study were designed and tuned to address the same three-class classification problem, representing different levels of driver injury severity. Experiments were conducted using the same training-validation-test splits in the same operating environment. This experimental design ensured that performance differences were solely due to model characteristics and not to differences in data, preprocessing, or the environment.
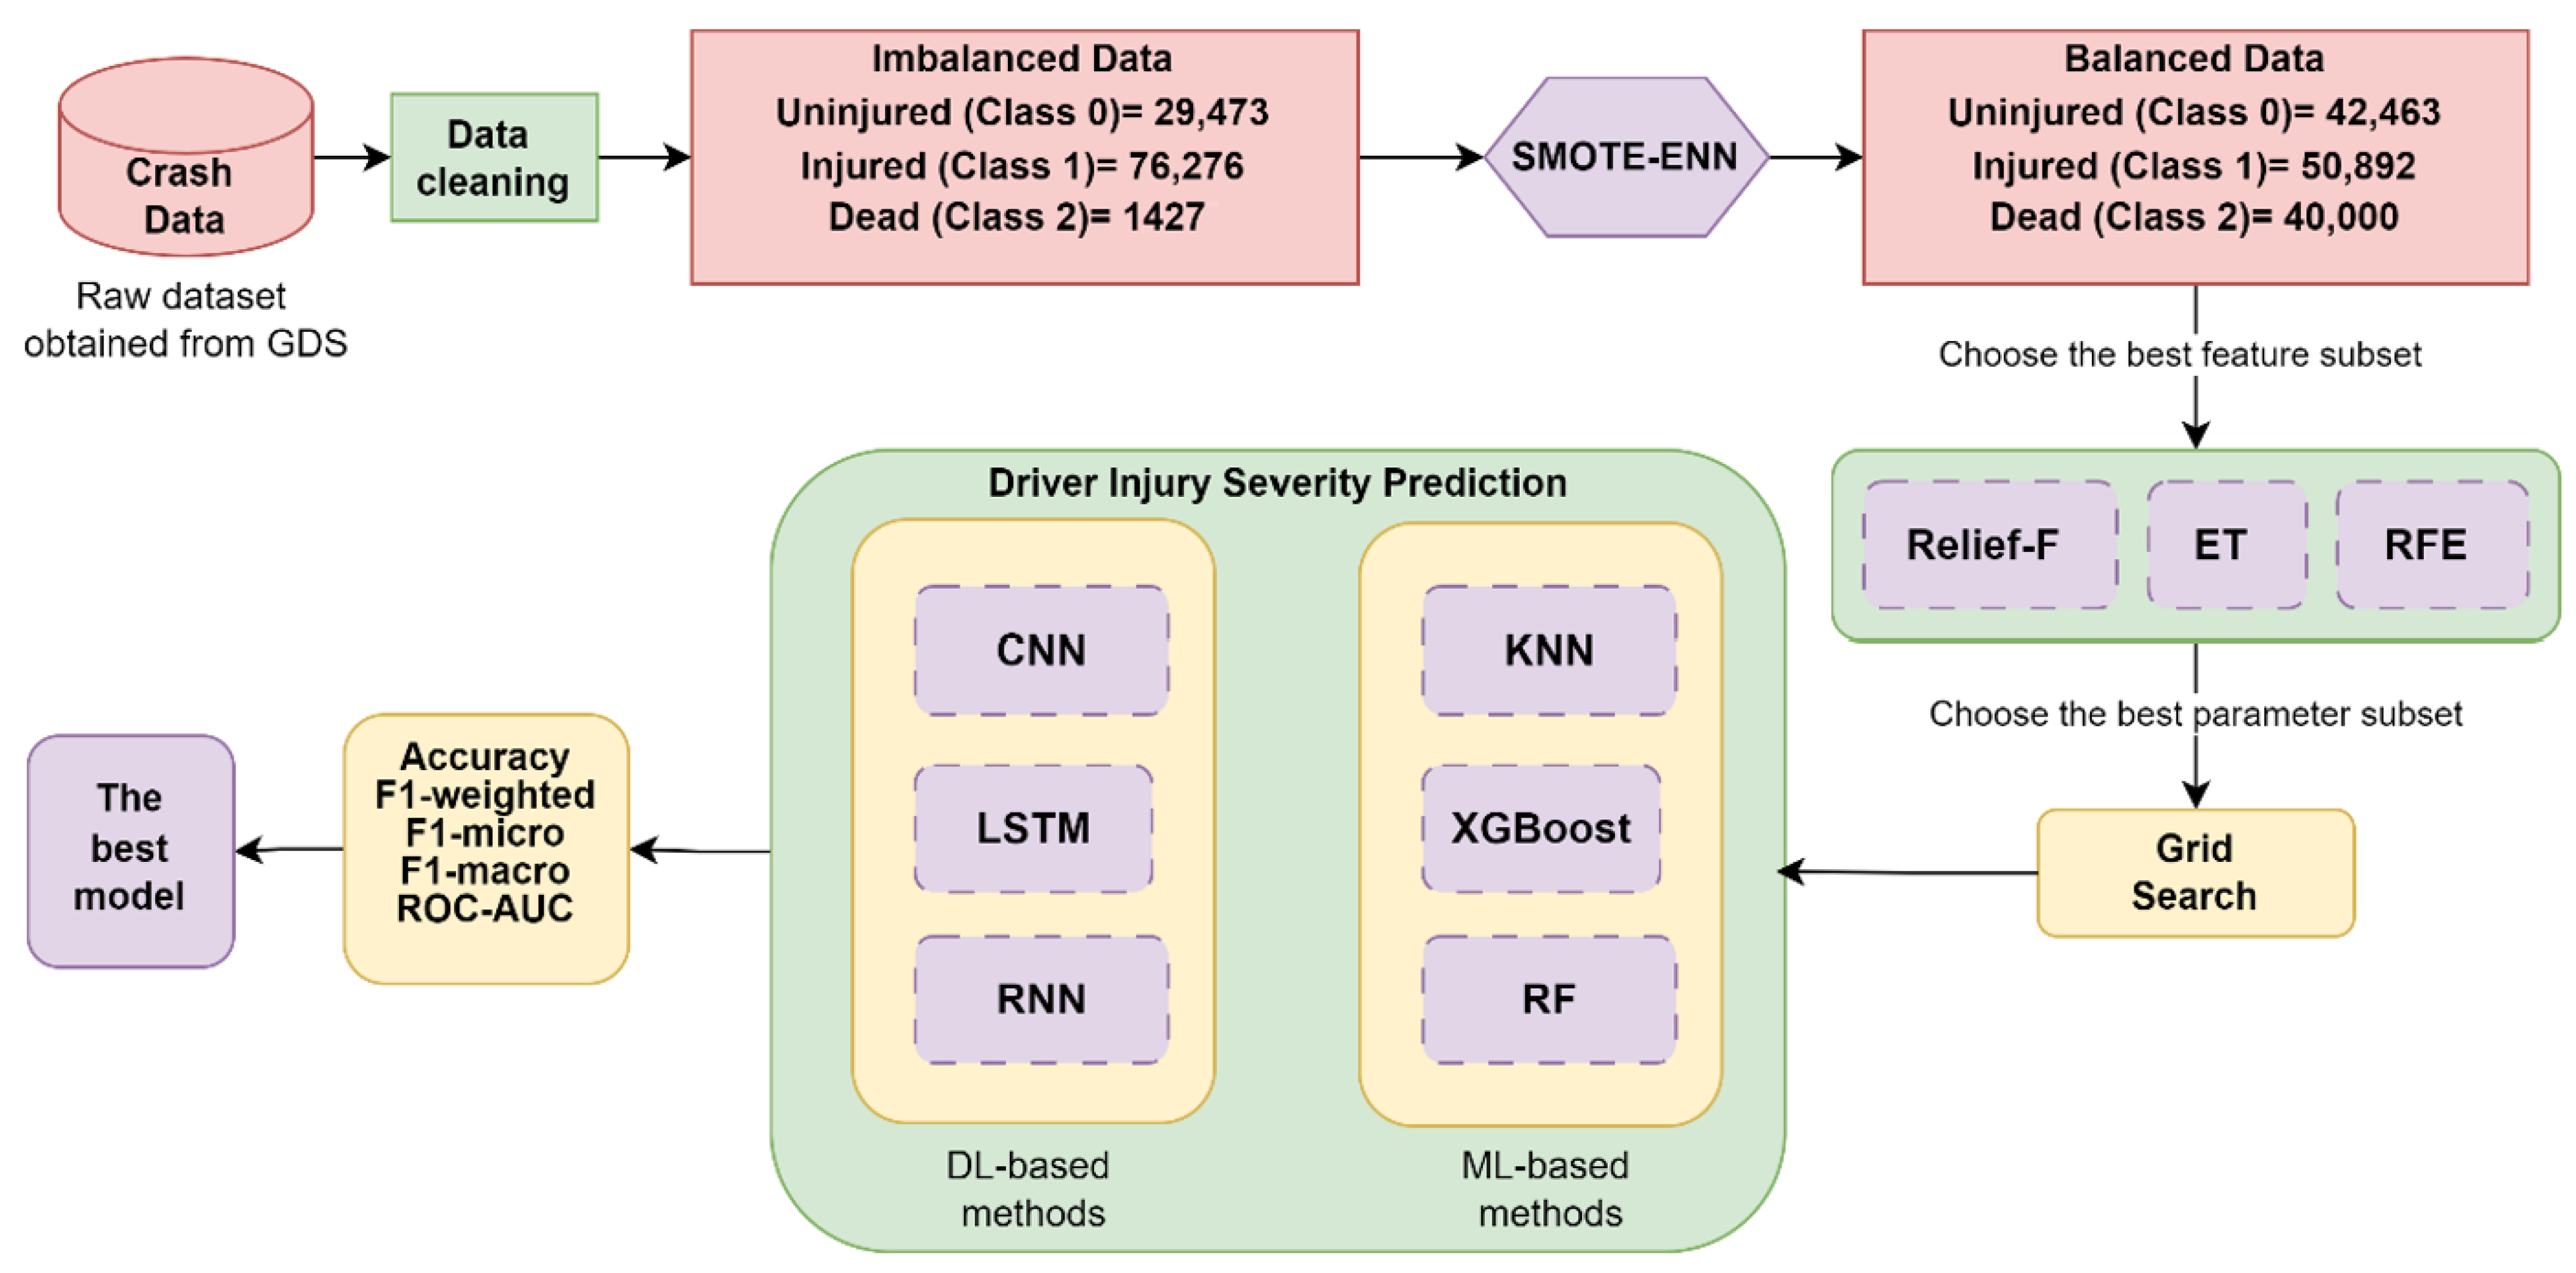
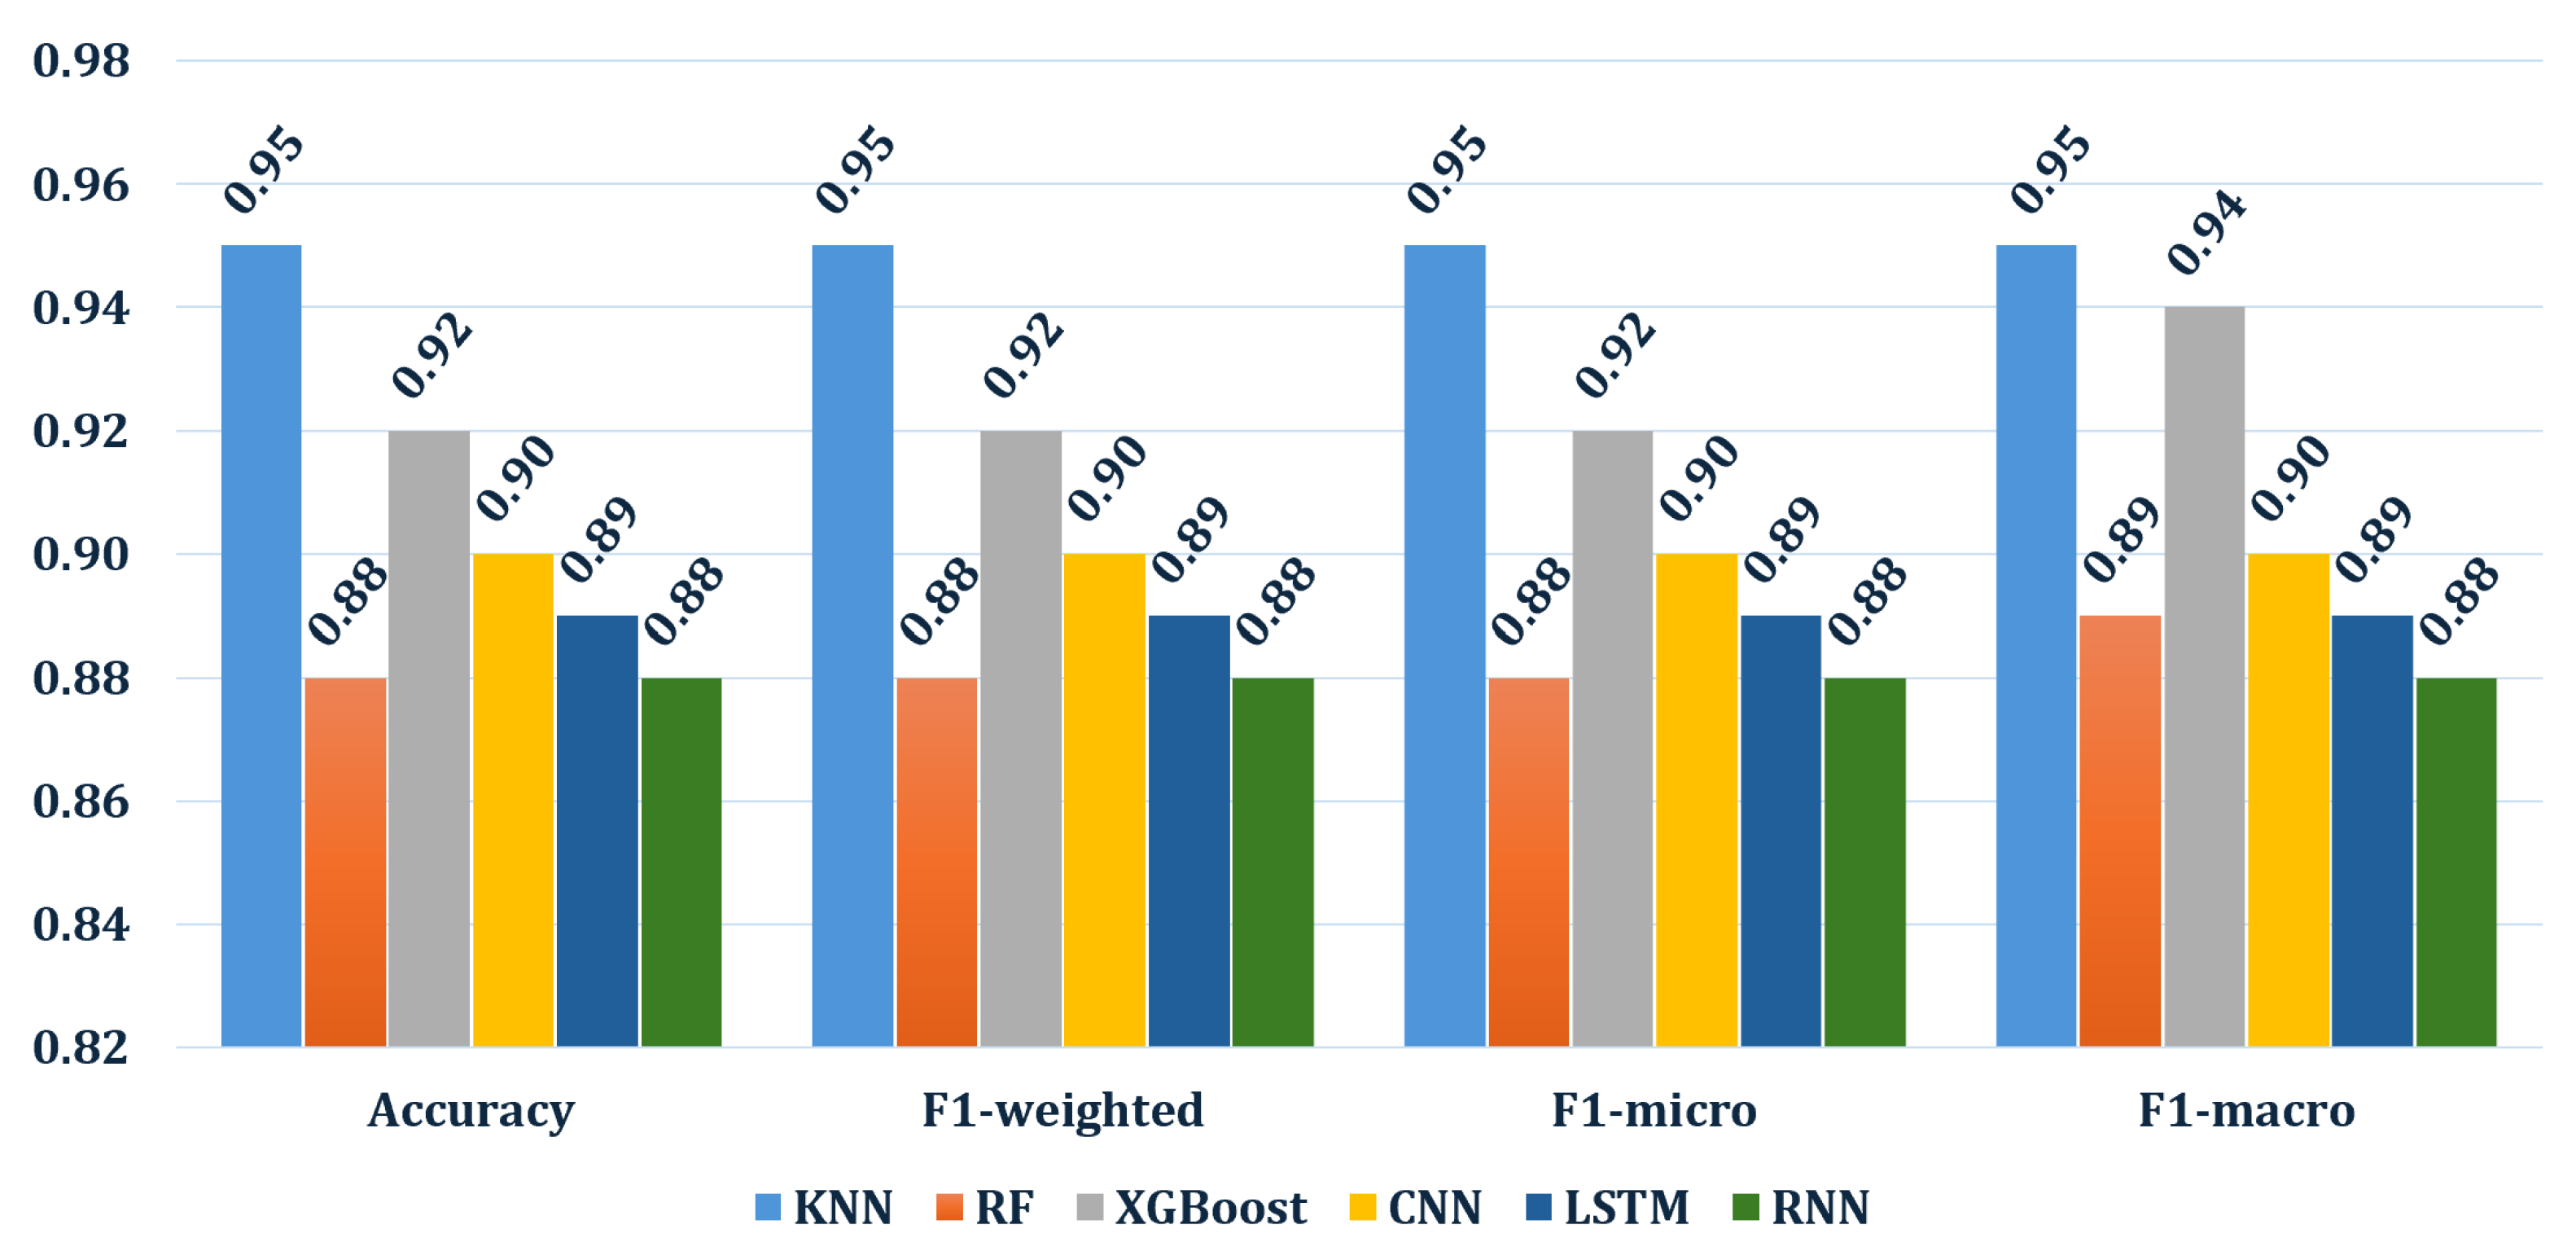
Figure 6 presents a block diagram outlining the experimental phases of the study, which include data balancing, FS, predicting driver injury severity, and evaluation. The results are presented in Figure 7 and discussed in detail.
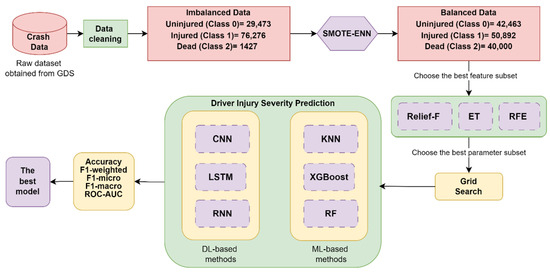
Figure 6.
The block diagram of the system.
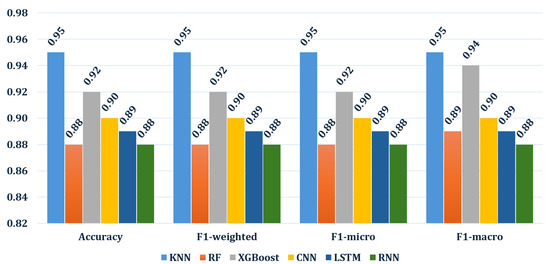
Figure 7.
Comparative performance results of the prediction models with the best parameter subset using grid search.
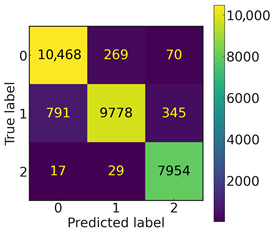
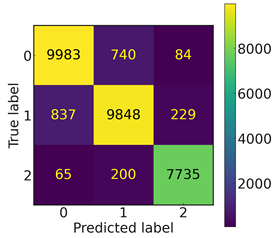
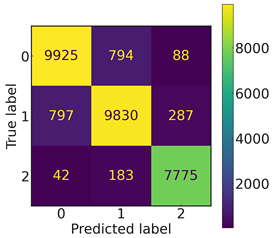
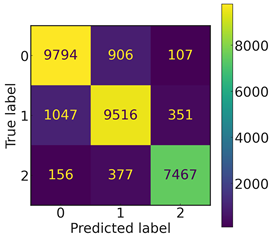
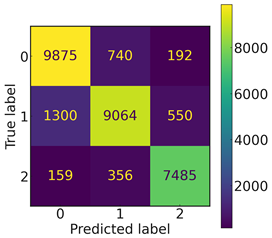
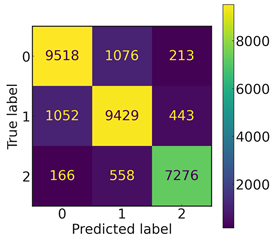
In data preparation, first, categorical missing values were replaced with “Unknown” labels, and numeric missing values were filled with median values. Label encoding was used for all categorical variables, and ordinal variables were encoded with One-Hot Encoding to prevent sorting bias. Normalization was not performed because there were no continuous variables in the dataset. The SMOTE-ENN technique was applied to address the class imbalance by oversampling the minority classes and removing noisy samples. Then, Relief-F, Extra Trees, and RFE methods were applied independently, and the 25-feature subset identified by RFE was used for the final model comparison. Once the dataset was ready for use with the models, it was split into 70% training, 15% validation, and 15% test subsets to preserve class distribution. The preprocessed data were used to classify driver injury severity using both ML and DL-based prediction methods. The grid search approach [31] was employed to explore a wide parameter space, enabling the identification of optimal sub-parameter spaces for each model. The architecture and training parameters of each DL model are listed in Table 8. All models were trained with a 10-epoch early stopping criterion based on the validation loss, and dropout layers were added to reduce the overfitting. The output layer consists of three units corresponding to the three classes in the dataset. Before model training, SMOTE-ENN balancing and RFE feature selection were applied to address the class imbalance and reduce the dimensionality. A comparative analysis was then conducted to evaluate the performance metrics of the models using these optimized sub-parameters. Figure 7 summarizes the performance results of the models, whereas Table 9 shows the confusion matrices corresponding to each model. These results are based on the optimal parameter configurations determined using the grid search method. The specific hyperparameter values selected for each model are detailed in Table A1.

Table 8.
Summary of DL architectures, input formats, and training details.

Table 9.
Confusion matrices of the models with the optimal parameter subsets identified by grid search.
Several observations can be made when comparing the performance metrics across different prediction methods. KNN consistently achieves high accuracy across all metrics, with values of 0.95 for accuracy, F1-weighted, F1-micro, and F1-macro scores. DT shows slightly lower performance with an accuracy of 0.88 across all F1 metrics, indicating balanced but not outstanding results. XGBoost demonstrates strong performance with an accuracy of 0.92, maintaining uniformity in F1-scores around 0.92–0.94, highlighting its robustness across different evaluation criteria. CNN, LSTM, and RNN exhibit comparable performance with accuracies around 0.90 and F1-scores consistently at 0.89–0.90, suggesting their reliability, but with a slightly lower macro F1-score compared to other methods. Overall, while KNN excels in consistency across all metrics, XGBoost shows strong overall performance, and DL models (CNN, LSTM, and RNN) maintain competitive accuracy and F1-scores.
The experimental results revealed that traditional ML models, particularly KNN and XGBoost, outperformed DL architectures such as CNN, LSTM, and RNN. KNN achieved the highest accuracy (0.95) and F1-scores (F1-weighted: 0.95, F1-macro: 0.95), followed closely by XGBoost (accuracy: 0.92). In contrast, DL models exhibited modest performance, with CNN (accuracy: 0.90), LSTM (0.89), and RNN (0.88) lagging behind. As seen in the confusion matrix in Table 9, the ML models demonstrated consistent performance across all injury severity levels, achieving the best classification rates in the “Uninjured” cases. The DL models exhibited higher misclassification rates in “Injured” and “Dead” classes, generally predicting “Injured”. This outcome underscores the efficacy of simpler ML models in handling structured, tabular data, especially when coupled with robust preprocessing techniques like SMOTE-ENN and FS. The superior performance of KNN may stem from its sensitivity to local patterns in the balanced feature space, where synthetic samples generated by SMOTE-ENN enhanced the distinction between minority classes (e.g., fatalities). XGBoost’s success aligns with its inherent ability to handle class imbalance through GB and regularization, which mitigates overfitting while prioritizing critical features. SMOTE-ENN was applied only to the training set, resulting in an improved class balance and minority class recall. However, the proximity of some synthetic examples to the decision boundaries and the occasional removal of informative boundary cases slightly reduced the accuracy. The risk of overfitting was mitigated in the ML models through cross-validation, stratified k-fold, and grid search, whereas the DL models employed dropout, early stopping, and compact architectures to address challenges arising from small sample sizes and sparse inputs.
To improve the DL performance, multiple configurations were tested using GridSearch, with dropout rates ranging from 0.0 to 0.7. A dropout rate of 0.0 for the CNN and RNN and a dropout rate of 0.1 for the LSTM provided the best balance between regularization and performance. ReLU for CNN, ELU for LSTM, and sigmoid activation for RNN provided positive improvements. Furthermore, adding additional dense layers improved the CNN performance by 1.2% based on F1 weighting but did not close the gap with ML models. Despite their theoretical advantages in capturing complex patterns, DL models have struggled to match the performance of ML models. The tabular structure and relatively small size of the dataset limited DL’s ability of DL to learn complex hierarchical representations. Tree-based models are naturally more capable of handling mixed data types and sparse categorical variables than other models.
This performance difference between DL and traditional ML models is mainly due to model-specific inductive biases. In particular, although DL architectures such as CNN and LSTM are designed to capture local patterns and dependencies in spatial (e.g., image) or sequential (e.g., time series) data, respectively, applying these biases to unstructured tabular data makes it difficult for the model to learn meaningful features. In contrast, tree-based ensemble models, such as XGBoost, have an inherent advantage in partitioning a tabular data space with heterogeneous (numeric and categorical) features, capturing feature interactions, and being more resistant to overlearning owing to built-in regularization mechanisms [32,33]. Therefore, tree-based models are expected to provide more robust and high-performance results for well-processed and feature-engineered tabular accident data. Furthermore, DL models often require larger volumes of data to generalize effectively, and while the dataset was substantial (107,195 samples), the inherent imbalance and high dimensionality after FS may have limited their learning capacity. Hyper-parameter optimization for DL models (e.g., CNN’s three convolutional layers, LSTM’s multi-layered architecture) did not yield significant improvements, suggesting that traditional ML frameworks remain more suitable for this problem domain. The hybrid SMOTE-ENN technique proved instrumental in addressing class imbalance, reducing bias toward the majority class (injured drivers) while refining the dataset by removing noisy samples. This approach ensured that minority classes (e.g., fatalities) were adequately represented, enabling models to learn discriminative patterns across all severity levels.
The FS process employed three algorithms—Relief-F, ETC, and RFE—to identify the most influential features affecting driver injury severity from a dataset of 39 attributes. Results indicated that 25 features yielded the optimal balance, achieving the highest performance (e.g., RF accuracy/F1-score of 0.93). Common features selected by all methods included critical factors like Road Class, Traffic Sign, Driver Fault, and Legal Speed Limit. RFE uniquely identified Vehicle Use Purpose, while Relief-F highlighted attributes such as Pavement, Driver Alcohol Result, and Vehicle Motion. The RFE-derived 25-feature subset, which included Unit Group, Road Type, and Vehicle Damage Rating, delivered the best predictive results. Notably, increasing features beyond 25 (to 30) led to slight performance declines, suggesting potential overfitting. Relief-F and RFE generally outperformed ETC, emphasizing their effectiveness in capturing relevant patterns.
Computational Cost Analysis
To evaluate the computational efficiency of the DL models used in this study, we performed a detailed floating-point operation (FLOP) analysis of the CNN1D, LSTM, and Simple RNN architectures. For comparability, all computations assumed a common input pattern of 25 time steps and features. The CNN1D model, consisting of four Conv1D layers followed by a dense layer, required approximately 214.3 million FLOPs per sample (≈13.7 GFLOPs per batch of 64 samples), primarily because of the large number of filters and channels in the second convolutional layer. The LSTM architecture with four stacked LSTM layers and a dense output layer required approximately 64.2 million FLOPs per sample (≈4.1 GFLOPs per batch), whereas the Simple RNN, also with four recurrent layers and a dense output layer, showed the lowest computational demand at 9.18 million FLOPs per sample (≈0.59 GFLOPs per batch).
As seen in the Table 10, these results indicate that CNN1D has the highest computational cost, LSTM has a moderate cost, and Simple RNN is the most efficient in terms of operations. Although the CNN1D model provides the highest prediction performance (especially in terms of the F1-score), its higher complexity may limit its applicability in resource-constrained environments. Conversely, LSTM and Simple RNN offer viable alternatives when reduced runtime or power consumption is prioritized, albeit with some trade-offs in classification performance.

Table 10.
Comparison of model architectures and computational costs.
6. Conclusions
This study aimed to predict driver injury severity using a dataset of 107,195 traffic accidents from Türkiye, addressing challenges such as class imbalance and high dimensionality. The SMOTE-ENN hybrid method effectively balanced the dataset, enhancing prediction accuracy for underrepresented classes like fatalities. Three FS techniques—Relief-F, Extra Trees, and RFE—identified critical factors influencing injury severity, with RFE’s 25-feature subset (including Road Class, Legal Speed Limit, and Driver Fault) yielding optimal performance. Traditional ML-based models, particularly KNN and XGBoost, outperformed DL architectures, achieving up to 95% accuracy, likely due to their efficiency with structured tabular data. These results underscore the importance of preprocessing and FS in improving model robustness and interpretability. Although the proposed approach demonstrated strong performance in predicting traffic crash severity, some limitations must be acknowledged. The dataset used in this study was collected from the provinces of Mersin, Adana and Antalya in Türkiye. The results may reflect geographically specific driving behaviors, road conditions and enforcement policies. Simultaneously, the relatively small size of the balanced dataset limited the ability of DL models to fully utilize their representation learning capabilities, with ML models outperforming DL models. Although SMOTE-ENN balancing improved training, real-world crash data are inherently imbalanced. This may affect the model performance when applied without balancing techniques.
Mersin, Adana, and Antalya provinces were specifically selected because their high migration rates have contributed to an increase in traffic crash frequency over the past decade, making them ideal for examining crash severity patterns. However, it is important to note that the relatively low observed fatal crash rate is a global problem that affects traffic safety research. The models developed in this study demonstrated strong generalizability and can be adapted to other regions with similar traffic environments.
These findings have important implications for traffic safety policy, highlighting the need to prioritize infrastructure improvements (e.g., road type and signs) and more stringent monitoring of driver-related factors (e.g., alcohol consumption and speed violations). By integrating the proposed methods into smart city traffic management platforms, municipal authorities can prioritize infrastructure improvements in high risk areas. Insurance companies can automate their damage-risk estimation workflows. Policymakers can implement scenarios such as urban planning, targeted interventions, and dynamic speed control. Policy-driven approaches, such as specialized training for young and elderly drivers involved in high-severity crashes or specific vehicle types, should be implemented. Future research should prioritize expanding the dataset to include real-time variables (e.g., traffic density, weather conditions) and broader geographic coverage to enhance model generalizability. Exploring hybrid FS techniques, such as combining Relief-F and RFE with DL-based feature extraction, could further refine critical predictors. Additionally, deploying these models in traffic management systems could aid policymakers in designing targeted interventions to reduce accident severity. Finally, developing simulation tools to model the impact of policy interventions, such as dynamic speed limits or automated enforcement systems, would bridge predictive analytics and actionable safety strategies.
Author Contributions
Ç.İ.A.: Conceptualization, Methodology, Software, Writing—Original Draft, Writing—Review and Editing. G.M.: Methodology, Software, Writing—Original Draft. M.O.: Conceptualization, Methodology. E.S.: Conceptualization, Methodology. V.N.K.U.: Methodology, Software. All authors have read and agreed to the published version of the manuscript.
Funding
This work was supported by the Scientific and Technological Research Council of Türkiye (TUBITAK) within the 1001-Technological Research Projects Support Program (Grant No: 123E601).
Data Availability Statement
Data will be made available on request.
Acknowledgments
We want to thank the Ministry of Internal Affairs—General Directorate of Security (Turkey) for providing the crash data used in the analysis.
Conflicts of Interest
The authors declare that they have no known competing financial interests or personal relationships that could have appeared to influence the work reported in this paper.
Abbreviations
| ANN | Artificial Neural Network |
| AUC | Area Under the Curve |
| CNN | Convolutional Neural Network |
| DL | Three letter acronym |
| DT | Decision Tree |
| ET | Extra Tree |
| FN | False Negative |
| FP | False Positive |
| FS | Feature Selection |
| GB | Gradient Boosting |
| GDS | General Directorate of Security |
| KNN | k-Nearest Neighbors |
| LR | Logistic Regression |
| LSTM | Long Short-Term Memory |
| ML | Machine Learning |
| MLP | Multilayer Perceptron |
| MNL | Multinominal Logit |
| OL | Ordered Logit |
| OP | Ordered Probit |
| RF | Random Forest |
| RFE | Recursive Feature Elimination |
| RNN | Recurrent Neural Network |
| ROC | Receiver Operating Characteristics |
| SMOTE-ENN | Synthetic Minority Over-Sampling Technique-Edited Nearest Neighbor |
| TN | True Negative |
| TP | True Positive |
| XGBOOST | Extreme Gradient Boosting |
Appendix A

Table A1.
Model hyperparameters.
Table A1.
Model hyperparameters.
| Prediction Model | The Best Hyperparameter Subset |
|---|---|
| KNN | ’k’=1 / ’algorithm’=’kd_tree’ / ’knn_metric’=’euclidean’ |
| DT | criterion=’entropy’ / max_depth=90 / max_features=16 / max_leaf_nodes=None / min_samples_leaf=1 / min_samples_split=2 / splitter=’best’ |
| XGBoost | objective=’multi:softprob’ / booster="dart" / alpha=0.42753264663430185 / subsample=0.476862049679098 / max_depth=9 / colsample_bytree=0.7641271222384038 / min_child_weight=6 / eta=0.9350864527761984 / gamma=8.361351807626473e-06 / grow_policy="lossguide" / sample_type="weighted" / normalize_type="forest" / rate_drop=0.001716835388240266 / skip_drop=1.0448659331032653e-06 |
| CNN | n_conv_layers: 4 / filters_0: 443 / kernel_size_0: 20 / activation_0: sigmoid / filters_1: 100 / kernel_size_1: 20 / activation_1: sigmoid / filters_2: 50 / kernel_size_2: 20 / activation_2: relu / optimizer: Adagrad / adagrad_lr: 0.03 / loss=’categorical_crossentropy’ / best_epoch=80 / initial_epoch=1 / batch_size=64 |
| LSTM | Input_unit:64 / N_layers: 4 / Lstm_0_units:416 / Layer_2_neurons:64 / Dropout_rate:0.1 / Epoch:50 / Dense_activation:elu / Lstm_1_units:480 / Lstm_2_units:128 / Lstm_3_units:32 / Optimizer:adam |
| RNN | input_unit: 256 / dense_activation: sigmoid / n_layers: 4 / rnn_0_units: 224 / layer_2_neurons: 160 / Dropout_rate: 0.0 / optimizer: sgd / rnn_1_units: 224 / / sgd_lr: 0.0016580818738343003 / rnn_2_units: 160 / rnn_3_units: 320 / rmsprop_lr: 0.000145358952942396 |
References
- Balasubramanian, V.; Sivasankaran, S.K. Analysis of factors associated with exceeding lawful speed traffic violations in Indian metropolitan city. J. Transp. Saf. Secur. 2021, 13, 206–222. [Google Scholar] [CrossRef]
- World Health Organization. Global Status Report on Road Safety, 2023; World Health Organization: Geneva, Switzerland, 2023; Available online: https://www.who.int/publications/i/item/9789240086517 (accessed on 12 June 2025).
- Turkish Statistical Instıtute. Road Traffic Accident Statistics, 2025. News No: 54056, Ankara, Turkey. Available online: https://data.tuik.gov.tr/Bulten/Index?p=Road-Traffic-Accident-Statistics-2024-54056 (accessed on 12 June 2025).
- Presidency of the Republic of Turkey. Presidential Circular No. 2021/2 on the Road Traffic Safety Strategy Paper (2021–2030) and Road Traffic Safety Action Plan (2021–2023); Presidency of the Republic of Turkey: Ankara, Turkey, 2021. Available online: https://en.guvenlitrafik.gov.tr/president-circular (accessed on 12 June 2025).
- Tang, J.; Liang, J.; Han, C.; Li, Z.; Huang, H. Crash injury severity analysis using a two-layer Stacking framework. Accid. Anal. Prev. 2019, 122, 226–238. [Google Scholar] [CrossRef] [PubMed]
- Lee, J.; Yoon, T.; Kwon, S.; Lee, J. Model Evaluation for Forecasting Traffic Accident Severity in Rainy Seasons Using Machine Learning Algorithms: Seoul City Study. Appl. Sci. 2020, 10, 129. [Google Scholar] [CrossRef]
- Mokhtarimousavi, S.; Anderson, J.C.; Azizinamini, A.; Hadi, M. Factors affecting injury severity in vehicle-pedestrian crashes: A day-of-week analysis using random parameter ordered response models and Artificial Neural Networks. Int. J. Transp. Sci. Technol. 2020, 9, 100–115. [Google Scholar] [CrossRef]
- Fiorentini, N.; Losa, M. Handling Imbalanced Data in Road Crash Severity Prediction by Machine Learning Algorithms. Infrastructures 2020, 5, 61. [Google Scholar] [CrossRef]
- Gan, X.; Weng, J. Predicting Crash Injury Severity for the Highways Involving Traffic Hazards and Those Involving No Traffic Hazards. In CCTP 2020: Advanced Transportation Technology and Development for Connections; American Society of Civil Engineers: Reston, VA, USA, 2020; pp. 4195–4206. [Google Scholar] [CrossRef]
- Aldhari, I.; Almoshaogeh, M.; Jamal, A.; Alharbi, F.; Alinizzi, M.; Haider, H. Severity Prediction of Highway Crashes in Saudi Arabia Using Machine Learning Techniques. Appl. Sci. 2023, 13, 233. [Google Scholar] [CrossRef]
- Sarigiannis, D.; Atzemi, M.; Oke, J.; Christofa, E.; Gerasimidis, S. Feature Engineering and Decision Trees for Predicting High Crash-Risk Locations Using Roadway Indicators. Transp. Res. Rec. J. Transp. Res. Board 2024, 2678, 535–548. [Google Scholar] [CrossRef]
- Çeven, S.; Albayrak, A. Traffic accident severity prediction with ensemble learning methods. Comput. Electr. Eng. 2024, 114, 109101. [Google Scholar] [CrossRef]
- Azhar, A.; Ariff, N.M.; Bakar, M.A.; Roslan, A. Classification of Driver Injury Severity for Accidents Involving Heavy Vehicles with Decision Tree and Random Forest. Sustainability 2021, 14, 4101. [Google Scholar] [CrossRef]
- Sorum, N.G.; Pal, D. Identification of the best machine learning model for the prediction of driver injury severity. Int. J. Inj. Control Saf. Promot. 2024, 31, 360–375. [Google Scholar] [CrossRef]
- Zhang, S.; Khattak, A.; Matara, C.M.; Hussain, A.; Farooq, A. Hybrid feature selection-based machine learning Classification system for the prediction of injury severity in single and multiple-vehicle accidents. PLoS ONE 2022, 17, e0262941. [Google Scholar] [CrossRef]
- Wei, T.; Zhu, T.; Lin, M.; Liu, H. Predicting and factor analysis of rider injury severity in two-wheeled motorcycle and vehicle crash accidents based on an interpretable machine learning framework. Traffic Inj. Prev. 2023, 25, 194–201. [Google Scholar] [CrossRef]
- Mutlu, G. Traffic Data [Folder] Google Drive. 2025. Available online: https://drive.google.com/file/d/1PMy5xvcer4XzLzhfb6Go4EFI-jTj9GjH/view?usp=drive_link (accessed on 19 August 2025).
- Zhang, Z. Introduction to machine learning: k-nearest neighbors. Ann. Transl. Med. 2016, 4, 218. [Google Scholar] [CrossRef] [PubMed]
- Friedman, J.H. Greedy Function Approximation: A Gradient Boosting Machine. Ann. Stat. 2001, 29, 1189–1232. [Google Scholar] [CrossRef]
- Breiman, L. Random forests. Mach. Learn. 2001, 45, 5–32. [Google Scholar] [CrossRef]
- Li, Z.; Liu, F.; Yang, W.; Peng, S.; Zhou, J. A Survey of Convolutional Neural Networks: Analysis, Applications, and Prospects. IEEE Trans. Neural Netw. Learn. Syst. 2022, 33, 6999–7019. [Google Scholar] [CrossRef]
- Van Houdt, G.; Mosquera, C.; Nápoles, G. A review on the long short-term memory model. Artif. Intell. Rev. 2020, 53, 5929–5955. [Google Scholar] [CrossRef]
- Sherstinsky, A. Fundamentals of Recurrent Neural Network (RNN) and Long Short-Term Memory (LSTM) network. Phys. Nonlinear Phenom. 2020, 404, 132306. [Google Scholar] [CrossRef]
- Fernández, A.; García, S.; Herrera, F.; Chawla, N.V. SMOTE for Learning from Imbalanced Data: Progress and Challenges, Marking the 15-year Anniversary. J. Artif. Intell. Res. 2018, 61, 863–905. [Google Scholar] [CrossRef]
- Robnik-Šikonja, M.; Kononenko, I. Theoretical and Empirical Analysis of ReliefF and RReliefF. Mach. Learn. 2003, 53, 23–69. [Google Scholar] [CrossRef]
- Geurts, P.; Ernst, D.; Wehenkel, L. Extremely Randomized Trees. Mach. Learn. 2006, 63, 3–42. [Google Scholar] [CrossRef]
- Guyon, I.; Elisseefl, A. An Introduction to Feature Extraction. In Studies in Fuzziness and Soft Computing; Springer: Berlin/Heidelberg, Germany, 2006; pp. 1–25. [Google Scholar] [CrossRef]
- Naidu, G.; Zuva, T.; Sibanda, E.M. A Review of Evaluation Metrics in Machine Learning Algorithms. In Artificial Intelligence Application in Networks and Systems; Lecture Notes in Networks and Systems; Springer: Cham, Switzerland, 2023; pp. 15–25. [Google Scholar] [CrossRef]
- He, H.; Garcia, E.A. Learning from imbalanced data. IEEE Trans. Knowl. Data Eng. 2009, 21, 1263–1284. [Google Scholar] [CrossRef]
- Muntasir Nishat, M.; Faisal, F.; Jahan Ratul, I.; Al-Monsur, A.; Ar-Rafi, A.M.; Nasrullah, S.M.; Reza, M.T.; Khan, M.R.H. A Comprehensive Investigation of the Performances of Different Machine Learning Classifiers with SMOTE-ENN Oversampling Technique and Hyperparameter Optimization for Imbalanced Heart Failure Dataset. Sci. Program. 2022, 2022, 3649406. [Google Scholar] [CrossRef]
- Sun, Y.; Ding, S.; Zhang, Z.; Jia, W. An improved grid search algorithm to optimize SVR for prediction. Soft Comput. 2021, 25, 5633–5644. [Google Scholar] [CrossRef]
- Yan, L.; Xu, Y. XGBoost-Enhanced Graph Neural Networks: A New Architecture for Heterogeneous Tabular Data. Appl. Sci. 2023, 14, 5826. [Google Scholar] [CrossRef]
- Hollmann, N.; Müller, S.; Purucker, L.; Krishnakumar, A.; Körfer, M.; Hoo, S.B.; Schirrmeister, R.T.; Hutter, F. Accurate predictions on small data with a tabular foundation model. Nature 2025, 637, 319–326. [Google Scholar] [CrossRef]
Disclaimer/Publisher’s Note: The statements, opinions and data contained in all publications are solely those of the individual author(s) and contributor(s) and not of MDPI and/or the editor(s). MDPI and/or the editor(s) disclaim responsibility for any injury to people or property resulting from any ideas, methods, instructions or products referred to in the content. |
© 2025 by the authors. Licensee MDPI, Basel, Switzerland. This article is an open access article distributed under the terms and conditions of the Creative Commons Attribution (CC BY) license (https://creativecommons.org/licenses/by/4.0/).

