Article

Embedded HVDC System Planning Methods for Typical Scenarios in Regional Power Grids

1
Department of Electrical Engineering, Zhejiang University, Hangzhou 310027, China
2
State Grid Jiangsu Electric Power Co., Ltd., Economic and Technological Research Institute, Nanjing 210008, China
3
State Grid Jiangsu Electric Power Co., Ltd., Nanjing 210024, China
*
Author to whom correspondence should be addressed.
Electronics 2025, 14(16), 3292; https://doi.org/10.3390/electronics14163292
Submission received: 2 June 2025 / Revised: 13 August 2025 / Accepted: 15 August 2025 / Published: 19 August 2025

Abstract

The embedded HVDC system is a form of DC power system that enhances regional power grids. This paper innovatively categorizes the typical application scenarios of embedded HVDC into three types: transmission section reinforcement, new energy delivery, and power supply zone interconnection. It further pioneers an exploration of the planning approach by breaking it down into three key aspects: identifying embedded HVDC construction demands, determining capacity, and selecting embedding points. For each scenario, specific planning steps are proposed to advance the practical application in reginal power grids. Finally, the planning methods are applied and verified through a case study in Jiangsu, China. Viable embedded HVDC schemes are obtained and compared with the AC approaches.

1. Introduction

With the development of new energy resources and growth in load level, the reginal grid is facing increasing pressure [1,2]. The embedded HVDC technology has been developed to cope with the emerging problems.
The HVDC technology has been widely applied in bulk power transmission, and research in related fields is still continuously deepening, owing to its advantages compared with AC transmission [3,4,5,6]. An embedded HVDC system is an HVDC link with at least two ends being physically connected within a synchronous AC network [7]. Compared with AC lines, embedded HVDC systems have functions such as power flow regulation, voltage control, and fault isolation, which can enhance the security, controllability, and flexibility of the regional power grid.
An embedded HVDC project has been constructed in the Jiangsu provincial power grid in China, and more similar embedded HVDC projects are likely to be built, playing an important role in reginal grid enhancement [8]. Therefore, it is of great significance to develop the planning scheme of the embedded HVDC.
Many scholars have carried out research work related to HVDC planning. The current research about HVDC planning methods can be divided into two categories: optimization-based method and index-based method.
The former method formulates an optimization model based on the planning problems, obtaining the optimal HVDC capacity and site. Hybrid models for Transmission Expansion Planning were proposed in [9,10,11], taking into account both HVAC and HVDC. In [12], a model aimed at minimizing the congestion in grids was established, in order to determine the optimal placement of HVDC link in the meshed AC grid. Ref. [13] proposed a model for offshore wind farms (OWFs) based on VSC-HVDC links and capacitors, which optimized the site selection and capacity determination of the OWFs and improved the voltage distribution. Ref. [14] formulated the frequency safety constraints under HVDC N-1 faults and embedded them into the coordinated planning model for HVDC and renewable energy generation. Ref. [15] proposed an optimized planning method for HVDC landing points and receiving-end power grid capacity, which takes into account the constraints of voltage support capability. Ref. [16] put forward a two-layer model with reliability and investment as objectives to optimize the network of the HVDC power grid. Ref. [17] proposed a multistage HVDC transmission planning model considering inter-regional flexibility and used an implicit decision method to solve the problem. Refs. [18,19] proposed a multi-stage robust Transmission Expansion Planning (TEP) model, considering the worst-case scenarios including HVDC bipolar blocking and uncertainties of Renewable Generation Units (RGUs). Stochastic optimization was used in [20] to simulate the uncertainty of demand and renewable electricity in HVDC planning. However, the application of optimization-based methods to large power systems (power grid data with more than 10,000 nodes) is difficult, typically due to the massive data and long solution time.
On the other hand, the latter method proposes a comprehensive evaluation index, reflecting the impact of different schemes on the safety, economy and reliability of the system. Refs. [21,22] considered various typical overload scenarios and designed a method based on the Comprehensive Sensitivity Factor (CSF) for the evaluation of different access point pairs. Based on three indicators, namely, the line load rate, voltage level, and the strength of the VSC access point, Ref. [23] proposed a method and process for designing a reinforcement scheme using VSC-HVDC. Ref. [24] proposed an evaluation index system to assess the adaptability of sending-end power grid expansion planning schemes containing multiple HVDC transmission lines. In [25,26,27], strategies for selecting multiple HVDC injection points based on the multi-infeed short-circuit ratio were formulated. The proposed evaluation indices are mostly based on grid strength and are only applicable to LCC or grid-following VSC. However, VSC also has good adaptability to weak grids.
In addition, most existing methods are suitable for a single scenario, but in reality, the key factors for HVDC planning vary across different scenarios. For example, when new energy is delivered via HVDC, the DC capacity should focus on the installed capacity of new energy; when using HVDC for capacity expansion and the reconstruction of an existing transmission section, it is necessary to consider minimizing the load rate of existing heavily loaded or overloaded lines as much as possible.
The main contribution of this work is to propose embedded HVDC planning methods suitable for different scenarios. This paper proposes a planning method based on the evaluation indices for embedded HVDC. The obtained embedded HVDC scheme can meet the technical requirements and is easy to be applied in practical engineering. The subsequent sections are organized as follows: Section 2 introduces three typical scenarios of embedded HVDC; Section 3 discusses the influencing factors to consider when planning embedded HVDC; Section 4 presents the planning methods for the three typical application scenarios of embedded HVDC; Section 5 validates the proposed methods by embedded HVDC planning examples in Jiangsu’s power grid; and Section 6 discusses the results and draws conclusions.

2. Application Scenarios of Embedded HVDC

As shown in Figure 1, the typical application scenarios of embedded HVDC are divided into three categories: reinforcement of transmission section, delivery of new energy, and interconnection of power supply zones.

2.1. Scenario 1: Reinforcement of Transmission Section

The transmission section refers to the cut set of the power grid composed of several transmission lines, in which the active power flow directions of all transmission lines are usually consistent [28]. Under normal or N-1 circumstances, it is necessary to ensure that no overload of the line occurs and that the section can supply power reliably.
With the demand of power transmission increasing, some transmission sections with insufficient transmission capacity are in urgent need of strengthening. Embedded HVDC can be adopted to strengthen the transmission section. The embedded HVDC system mainly plays the role of increasing the transmission capacity. Compared with AC lines, the power flow on the DC lines can be controlled and the short-circuit current can be restricted. By constructing an AC/DC hybrid transmission section, the power flow of the AC lines can be adjusted by setting to DC power to avoid the overload of the AC lines under different working conditions.

2.2. Scenario 2: Delivery of New Energy

At present, new energy sources such as wind power and photovoltaic power have been developed on a large scale. The new energy transmission scenarios, which are under consideration in this specific context, specifically refer to the integration of new energy bases within the same region.
While building new energy power stations, the relevant transmission lines should also be constructed. Embedded HVDC can be adopted for the collection and transmission of new energy. For the main grid, the newly-built DC system is equivalent to an additional power injection. However, the transmission distance of the embedded HVDC is relatively short, which is different from the long-distance cross-regional HVDC.

2.3. Scenario 3: Interconnection of Power Supply Zones

In most countries with well-developed power grids, the transmission network has been formed as a basic pattern of hierarchical and zonal structures. The power grid is divided into different voltage levels, with the high-voltage grid for long-distance transmission and the low-voltage grid for local distribution.
The embedded HVDC system plays the role of connecting two or more power supply zones without shortening the electrical distance. This is conducive to relieving the transmission burden of the main grid. Meanwhile, it will avoid forming an electromagnetic loop network.

3. Assessment Indices

At present, DC transmission technology can be divided into two major technical routes, namely, LCC (Line Commutated Converter) and VSC (Voltage Source Converter). LCC has the characteristics of mature technology, large transmission capacity, and good economy, while VSC is based on MMC (Modular Multilevel Converter), which has the advantages of low harmonic content, independent control of active and reactive power, no commutation failure problems, suitability for forming a multi-terminal structure, etc., but its cost is relatively high.
Whether it is an LCC or an VSC, when ignoring the absorption or generation of reactive power (assuming that the DC reactive power is locally balanced and providing no reactive power support), the DC system can be simplified to a pair of injection powers with equal magnitudes and opposite signs,
P i = P d c , P j = P d c
where Pi is the injected power at the sending-end embedded point, Pj is the injected power at the receiving-end embedded point, and Pdc is the DC power.
When constructing a new DC transmission system, it is necessary to consider its comprehensive benefits. Regarding the issues of construction demand, site selection, and capacity determination, this paper divides the key issues that need to be considered into four aspects, including power flow, shift factor, short-circuit current, and economy constraints.

3.1. Power Flow Constraint

Power flow security represents a fundamental requirement for power grid planning and operation. The commissioning of new DC lines alters the grid topology, thereby inducing power flow variations. When the DC power is injected into the AC grid framework, it may lead to overload problems of the lines and transformers in the original AC system. On the one hand, the DC system shall be designed to ensure adequate transmission capacity; on the other hand, the newly commissioned DC system must not induce overload in existing transmission lines or transformers.
Using the load margin to represent the load level of the transmission line and the transformer,
K l = P l max P l P l max
K t = S t max S t S t max
where Pl is the active power of line l, Plmax is the maximum active power of line l, St is the apparent power of transformer t, and Stmax is the maximum apparent power of transformer t. If Kl or Kt is less than 0, it indicates overload; if Kl or Kt is between 0 and 1, it indicates no overload, and the larger the value is, the lower the load level.

3.2. Shift Factor Constraint

Sensitivity analysis is a commonly used analytical method in the power system, which represents the incremental relationship between one variable and another. When injecting power into a busbar in the power grid, the active power transmitted by the lines will increase or decrease due to the influence of the grid structure. The shift factor (SF) is used to define this power transfer relationship.
The shift factor of line l for bus i is defined as,
S F l , i = P l P i = P l V i V i P i + P l θ i θ i P i
where Pl is the active power of line l, Pi is the injected power at bus i, Vi is the voltage amplitude of bus i, and θi is the voltage phase angle of bus i. The SF is the active power sensitivity of line l to bus i, representing the change in the active power on line l caused by injecting a unit power into bus i.
The SF of line l to bus i is defined as the change in the active power transmitted on line l when a unit of active power is injected into bus i.
S F l , d c = S F l , i + S F l , j = P l P i + P l P j
where SFl,i is the shift factor of the sending-end embedded point and SFl,j is the shift factor of the receiving-end embedded point.
Similarly, the shift factor of transformer t for bus i and the DC system (assuming the embedded points are i and j, respectively) can also be defined as,
S F t , i = P t P i
S F t , d c = S F t , i + S F t , j = P t P i + P t P j
where SFt,i is the shift factor of the sending-end embedded point, SFl,j is the shift factor of the receiving-end embedded point, Pt is the active power of transformer t, and Pi is the injected power at bus i.
SF is determined by the grid structure. For AC line l, the closer the electrical distance between bus i and l, the greater is the SF of bus i to line l. When power is directly injected into the sending-end or receiving-end bus of line l, the SF is at its maximum. Therefore, when a newly constructed HVDC system is operated in parallel with the legacy AC line (when the sending and receiving ends are the same as for the AC line), the load margin can be increased most effectively. When the objective of the DC system is to relieve the burden on a certain AC line or transformer, the SF should be as large as possible so that the HVDC system should be placed near the overloaded component.

3.3. Short-Circuit Current Constraint

Short-circuit current calculation is used to evaluate the current distribution characteristics of the system under fault conditions (such as three-phase short-circuit, single-phase grounding, etc.). Extremely large short-circuit currents can cause electrical equipment to overheat or be damaged by electrodynamic forces. When strengthening the grid with AC lines, the short-circuit current usually increases. In some regions, the grid structure is highly interconnected, and the short-circuit current is close to or exceeds the maximum interrupting current (e.g., 63 kA for 500 kV bus and 50 kA for 220 kV bus in China). When a new AC line is constructed, the electrical distance between the bus and the power source is reduced, which may lead to an increase in short-circuit current. When constructing a new DC system, if the LCC-HVDC scheme is adopted, commutation failure or blocking will occur during a short-circuit, and the short-circuit current of the connected bus will not increase. If the VSC-HVDC scheme must be used, the contribution of the VSC-HVDC to the bus short-circuit current needs to be considered.
The short-circuit current margin is used to represent the short-circuit current level of the bus,
K s c = I b max I b I b max
where Ib is the short-circuit current of the bus and Ibmax is the maximum interrupting current. If ksc is less than 0, it indicates that the short-circuit current exceeds the standard. To ensure safety, ksc is required to be greater than the critical value kscmin. kscmin is less than 1.

3.4. Economy Analysis

Apart from the above constraints, the economy is worth considering. The economy of transmission lines is determined by factors such as the transmission capacity and distance. In addition, it is also affected by environmental factors, construction difficulty, and other factors.
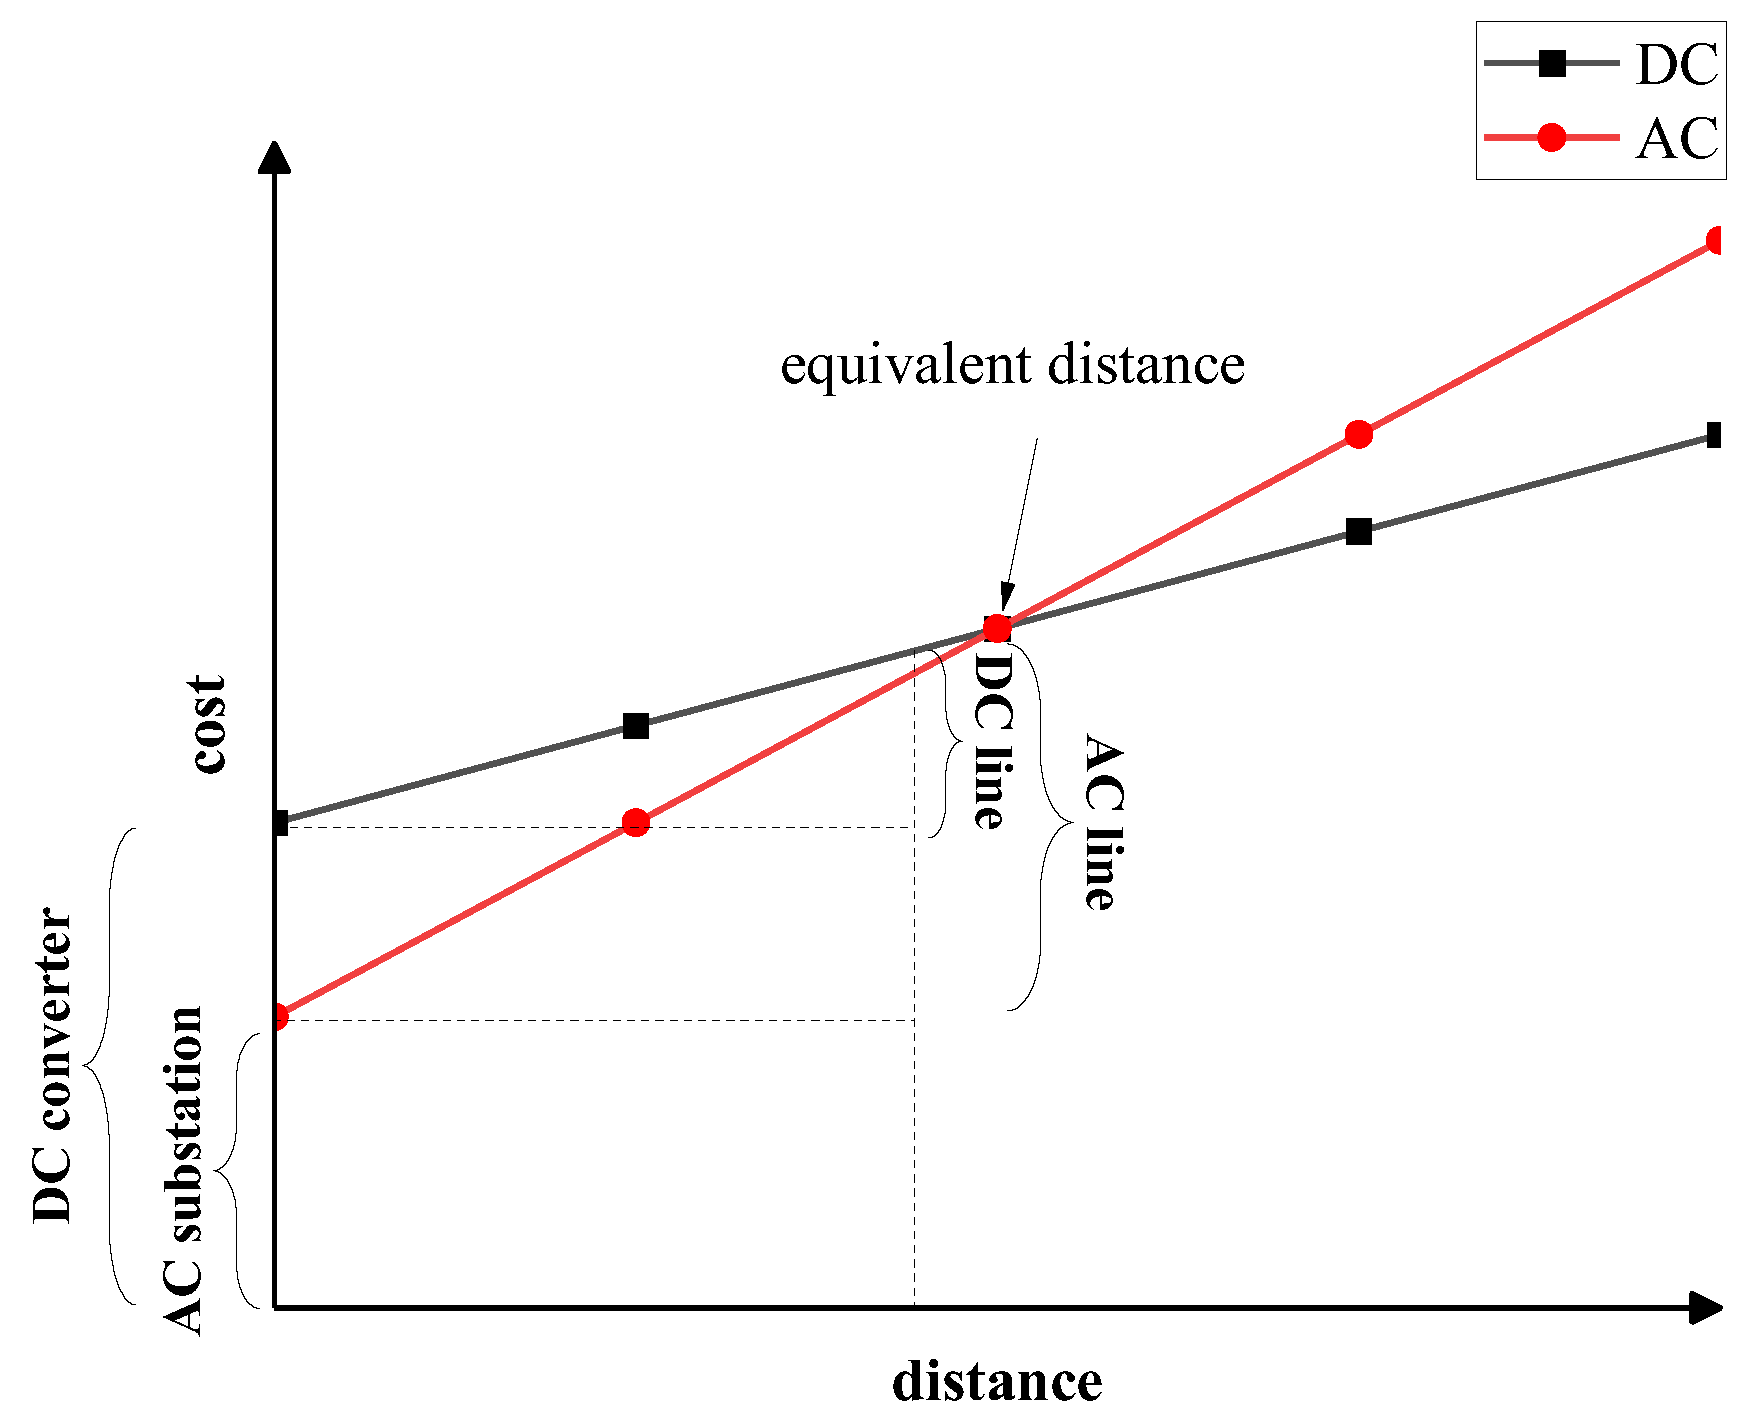
Although the precise calculation of the cost is hard at the early stage of planning, basic conclusions about the economic efficiency of AC/DC transmission can be drawn based on a large amount of engineering experience. The cost of a DC converter station is higher than that of an AC substation, while the cost per unit length of a DC transmission line is lower than that of an AC transmission line, and an economic equivalent distance exists. The relative relationship between the construction cost and transmission distance is shown in Figure 2.
Considering that the transmission distance of the regional power grid is relatively short, the cost of AC transmission is lower than that of DC transmission. Therefore, if the AC transmission line can meet the demand, the AC scheme should be preferentially selected. Otherwise, if there are certain requirements for power flow control or short-circuit current, and the AC scheme cannot meet the safety and stability constraints, the DC scheme should be adopted.

4. Planning Methods for Different Scenarios

This paper specifically divides the planning method of the embedded HVDC system into three steps: the demand for HVDC system construction, the determination of the capacity, and the selection of the embedded points.
Since the requirements vary in each scenario and the key factors are also different, the following parts will elaborate in detail on the embedded HVDC planning methods for each scenario.

4.1. Planning Method for Reinforcement of Transmission Section

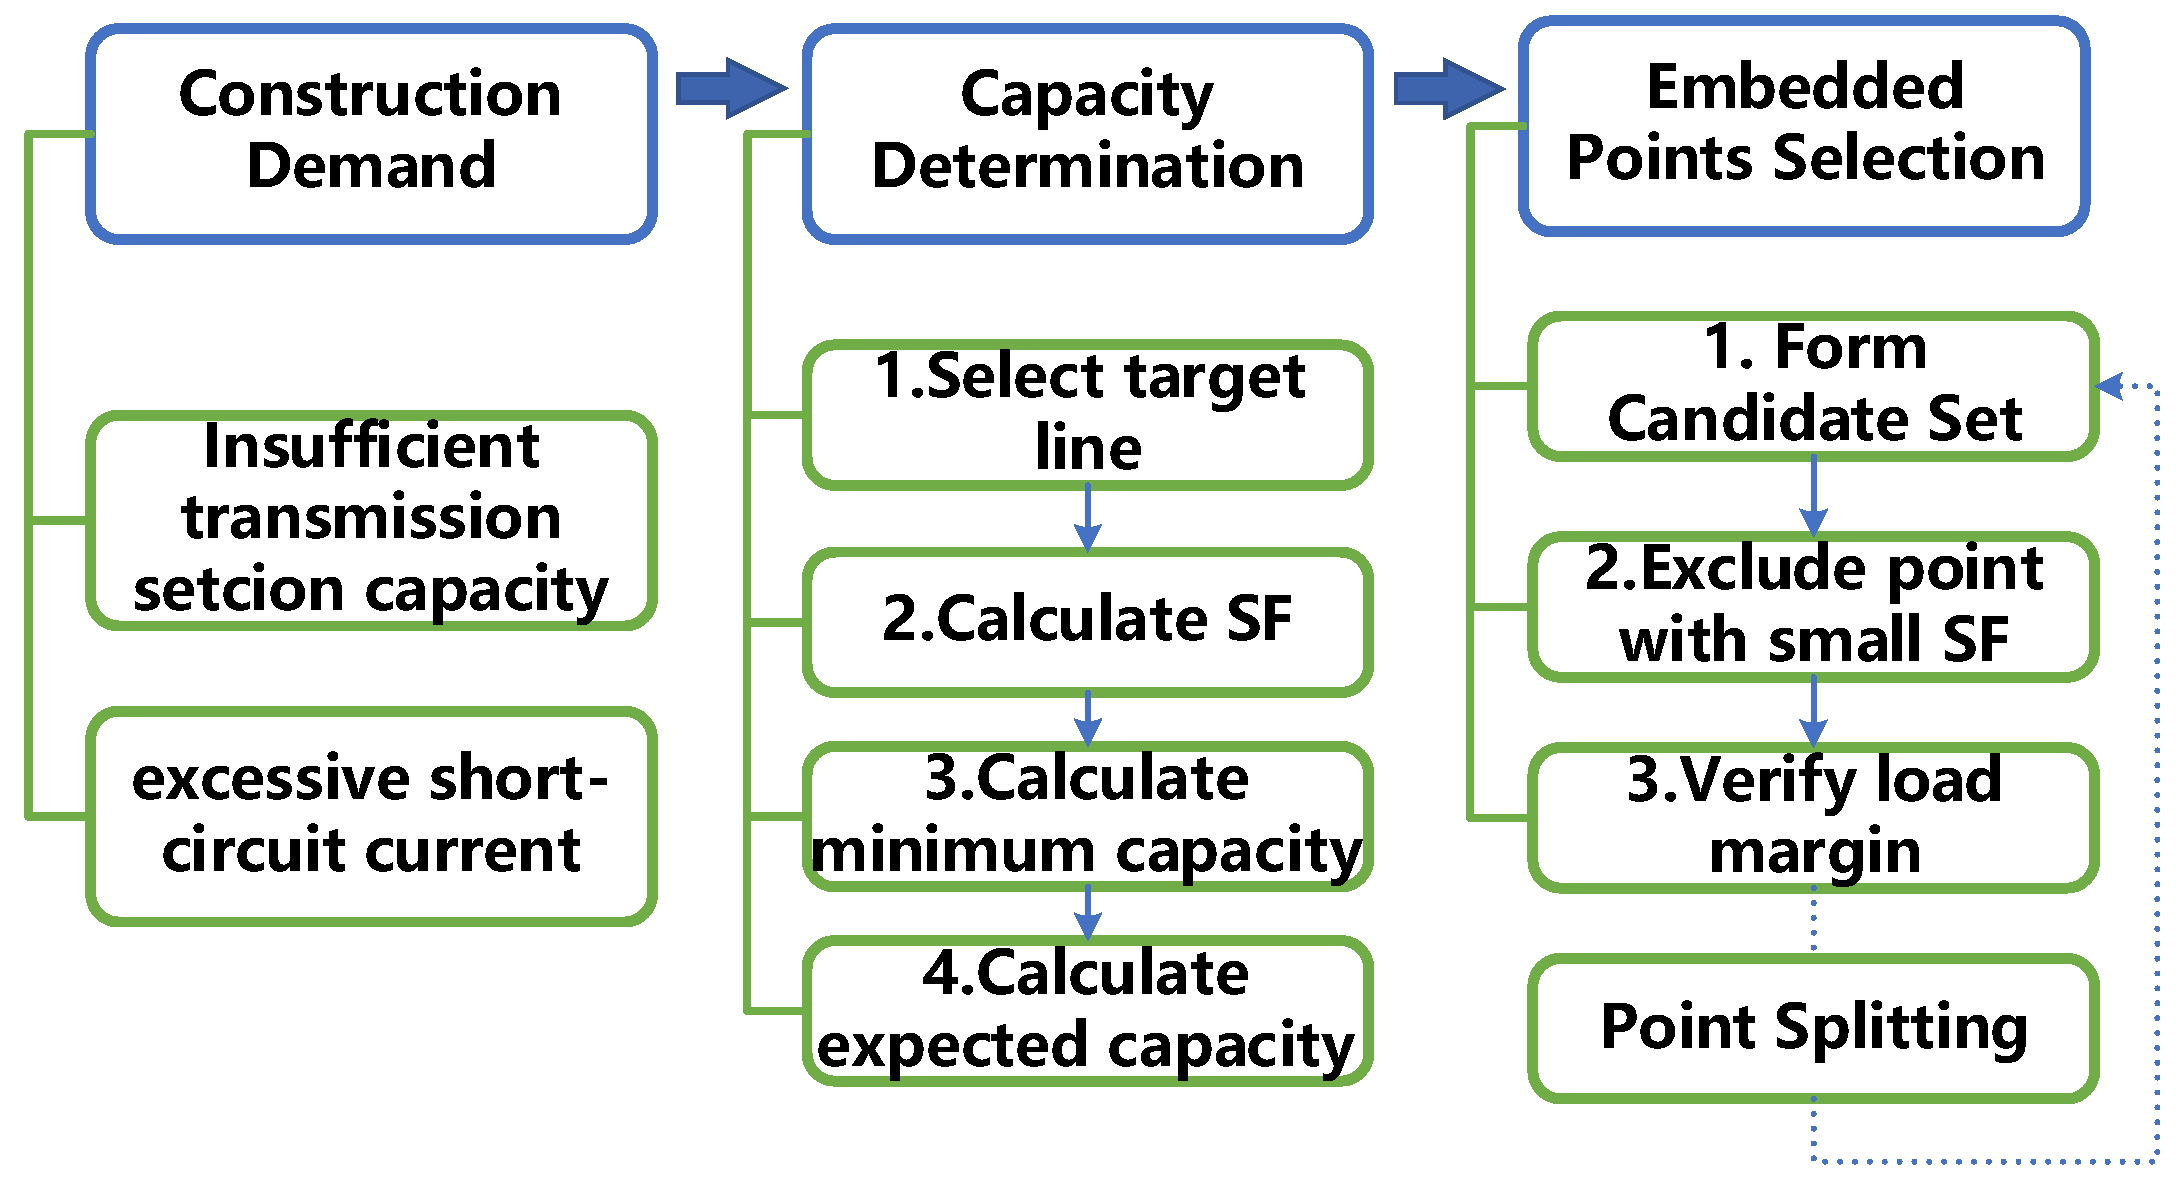
The overall planning process under the scenario of transmission section reinforcement is shown in Figure 3. A detailed description is elaborated in Section 4.1.1, Section 4.1.2, Section 4.1.3 and Section 4.1.4.

4.1.1. Demand

As described in Section 3.1, when the capacity of transmission section is insufficient, one or more lines are overloaded, and it is necessary to renovate or strengthen the existing lines.
However, the AC strengthening scheme may not be feasible, which may lead to excessive short-circuit current. Meanwhile, since the power flow of the AC line is determined by the whole grid structure, the power flow is uncontrollable so that the transmission capacity may not be fully utilized.

4.1.2. Capacity

(1) Select the line with the maximum load level as the target line and calculate the power deficit based on the difference between its transmitted power and the power limit.
Δ P = P l m a x P l
where Pl is the active power of line l and Plmax is the maximum active power of line l.
(2) Assume that the buses on both sides of the target line are selected as the embedded points for the DC sending and receiving ends and calculate the maximum shift factor of the target line.
(3) Calculate the minimum DC capacity using the shift factor and the power deficit.
P d c 0 = Δ P S F l , I J
where SFl,IJ is the shift factor when assuming the DC line and the AC line are in parallel and ΔP is the power deficit.
(4) Select a capacity safety factor kdc and calculate the expected DC capacity based on the minimum DC capacity and the capacity safety factor. The capacity safety factor represents the ratio of the shift factor of the eligible embedded point to the maximum shift factor.
P d c = k d c P d c 0
where kdc is a coefficient related to engineering experience, which represents the ratio of the expected DC capacity to the minimum DC capacity. kdc > 1 but should not be too large; otherwise, the economic efficiency of the scheme will be poor.

4.1.3. Embedded Points

(1) To ensure the improvement in the line load margin, select embedded points near the sending-end and receiving-end buses of the overloaded line to form a candidate set of embedded points and then proceed to step (2).
(2) Calculate the shift factors of the sending-end and receiving-end embedded points. The SF of the point should satisfy,
S F l , i > S F l , I k d c , S F l , j > S F l , J k d c
If the shift factor of an embedded point is too small to ensure the improvement in the load margin, exclude the embedded point scheme and proceed to step (3).
(3) Verify the load margins of the lines and transformers around the embedded point according to Equations (2) and (3).
If overloading occurs in the nearby lines or transformers after the new DC system is built at the embedded point, exclude the embedded point scheme. Finally, obtain the feasible embedded points.
(4) Optionally, split the embedded points. After the above steps, if there is no embedded point scheme left, the embedded points can be split.
Divide the expected DC capacity into n equal parts (for example, n = 2 can be taken), but it is necessary to ensure that the electrical distance between different embedded points is not too small.
Step (1)–step (3) should then be repeated.

4.1.4. Multi AC Line Overload

The above method is aimed at the situation when a single line is overloaded. When the original section contains multiple overloaded lines, if a single DC system is newly built, overloading of some lines may not be completely eliminated. In this case, multiple DC projects need to be newly built near different lines.
When planning multiple DC projects simultaneously, there is a superposition effect of the influence of different DCs on the load margin of existing AC lines. If the steps in Section 4.1.1, Section 4.1.2 and Section 4.1.3 are followed, the total capacity of the DC may be too large. In order to minimize the investment cost, it is necessary to comprehensively determine the capacities of different DCs. Therefore, the capacity determination method in Section 4.1.2 needs to be revised.
Assuming that two new DC systems are built (suppose the overload lines are line 1–2 and line 3–4 and the DC capacities are Pdc1 and Pdc2), the problem can be expressed as the following optimization problem.
min P d c 1 + P d c 2
s.t.
S F 12 , 12 P d c 1 + S F 12 , 34 P d c 2 P 12 P 12 max = Δ P 12 S F 34 , 12 P d c 1 + S F 34 , 34 P d c 2 P 34 P 34 max = Δ P 34
The above model is a linear programming model, and assuming that the shift factor satisfies:
S F 12 , 12 S F 12 , 34 S F 34 , 34 S F 34 , 12
The solution can be obtained as:
P d c 1 = S F 12 , 12 Δ P 34 S F 34 , 12 Δ P 12 S F 12 , 12 S F 34 , 34 S F 12 , 34 S F 34 , 12 P d c 2 = S F 34 , 34 Δ P 12 S F 12 , 34 Δ P 34 S F 12 , 12 S F 34 , 34 S F 12 , 34 S F 34 , 12
After obtaining the capacity of each DC system, for each embedded point, the steps in Section 4.1.3 can be used for inspection.

4.2. Planning Method for Delivery of New Energy

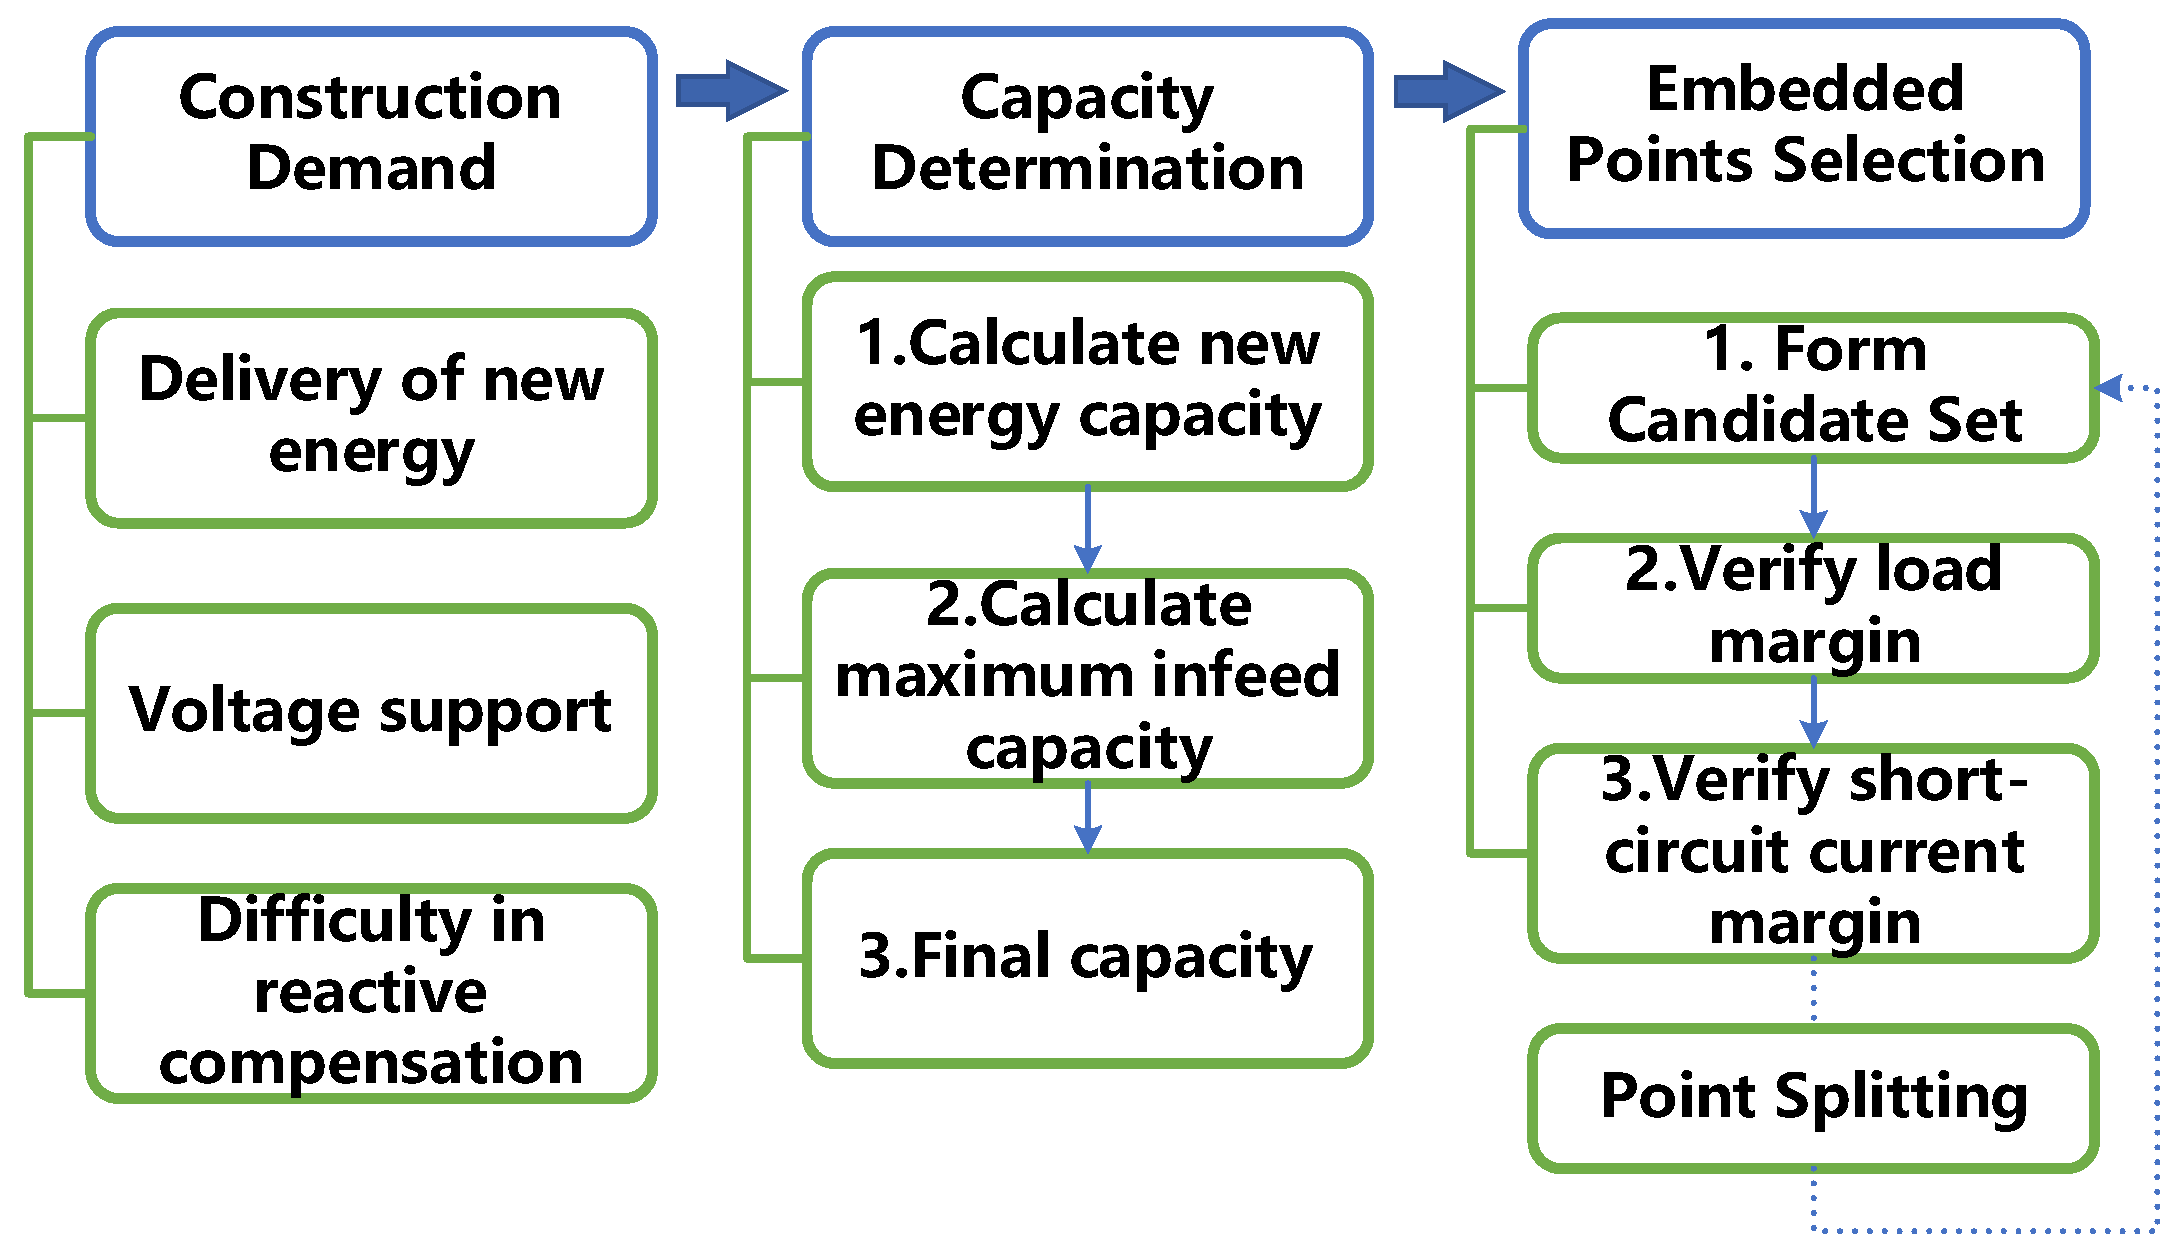
The overall planning process under the scenario of new energy delivery is shown in Figure 4. A detailed description is elaborated in Section 4.2.1, Section 4.2.2 and Section 4.2.3.

4.2.1. Demand

Newly-built renewable energy power stations need to be configured with transmission channels. For onshore new energy power plants, if there is a lack of supporting power sources or the power grid is weak, VSC-HVDC can provide voltage support. For offshore wind power transmission, there are problems such as difficulties in reactive power compensation and poor economy when using AC transmission. When it comes to medium- and long-distance transmission, the VSC-HVDC scheme has economic and technical advantages compared with the AC transmission scheme.

4.2.2. Capacity

(1) Calculate the outward transmission capacity of new energy at the sending end. It is the sum of the installed capacities of all new energy power plants at the sending end, and the outward transmission capacity is the sum of the installed capacities multiplied by the utilization rate coefficient.
P d c 1 = k d c k = 1 r P R k k = 1 n P l k
where Plk is the transmission capacity of the k-th existing line, PRk is the installed capacity of the k-th new energy power station at the sending end, n is the number of existing lines, r is the number of new energy power stations, and kdc is a coefficient related to engineering experience.
Due to the output characteristics of new energy, in order to ensure the utilization rate of the channel, the capacity of the new energy DC outward transmission system is usually smaller than the maximum installed capacity of the new energy power plants. Therefore, it is taken that kdc < 1, but it should not be too small; otherwise, new energy power generation cannot be delivered efficiently.
(2) Calculate the maximum single DC infeed capacity at the receiving end. It is obtained according to the maximum rate of change of frequency during a DC fault.
When new energy is connected to the grid through DC, the capacity of a single DC system cannot be too large; otherwise, a fault may lead to the instability of the grid frequency. Consider satisfying the constraint of the rate of change of frequency (RoCoF) under the most severe fault condition.
μ = d f d t = f N 2 π d ω d t f N P d c 2 2 π T J P s y s 0
where fN is the rated frequency of the system, TJ is the equivalent inertia time constant of the system, Pdc2 represents the total power loss of the DC system under the most severe fault, and Psys0 is the system reference power. The rate of change of the frequency is required to be less than μmax, and correspondingly, Pdc2 can be obtained.
(3) Generally, both situations in (1) and (2) above need to be satisfied, and the actual DC capacity is taken as the smaller value.
P d c = min { P d c 1 , P d c 2 }

4.2.3. Embedded Points

(1) The embedded points are discussed separately for the sending end and the receiving end.
Sending-end embedded point: It is usually relatively fixed, being selected close to the new energy collection bus at the sending end.
Receiving-end embedded point: There are two methods—grid-connection nearby or direct transmission to the load center. ① Grid-connection nearby: Select the grid-connection buses close to the new energy power plants as the embedded points to form a candidate set and then proceed to step (2). ② Direct transmission to the load center: Select the embedded points close to the load center where the power is expected to be transmitted to form a candidate set and then proceed to step (2).
(2) Verify the load margins of the lines and transformers around the embedded point according to Equations (2) and (3). If overloading occurs in the nearby lines or transformers after the new DC system is built at the embedded point, exclude the embedded point scheme and proceed to step (3).
(3) Verify the short-circuit current margin of the embedded point according to Equation (8). Exclude the embedded point schemes with an excessively small short-circuit current margin in the original power grid.
Currently, VSC-HVDC technology is adopted in offshore wind power projects both at home and abroad, which will contribute a certain amount of short-circuit current during faults. The short-circuit current is related to the system structure, control mode, etc. In the planning stage, a conservative value can be taken, such as 1.05–1.2 PU of the operating current.
(4) Optionally, split the embedded points. If there is no scheme that meets the conditions, the embedded points can be split, and step (1)–step (3) should be repeated.

4.3. Planning Methods for Interconnection of Power Supply Zone

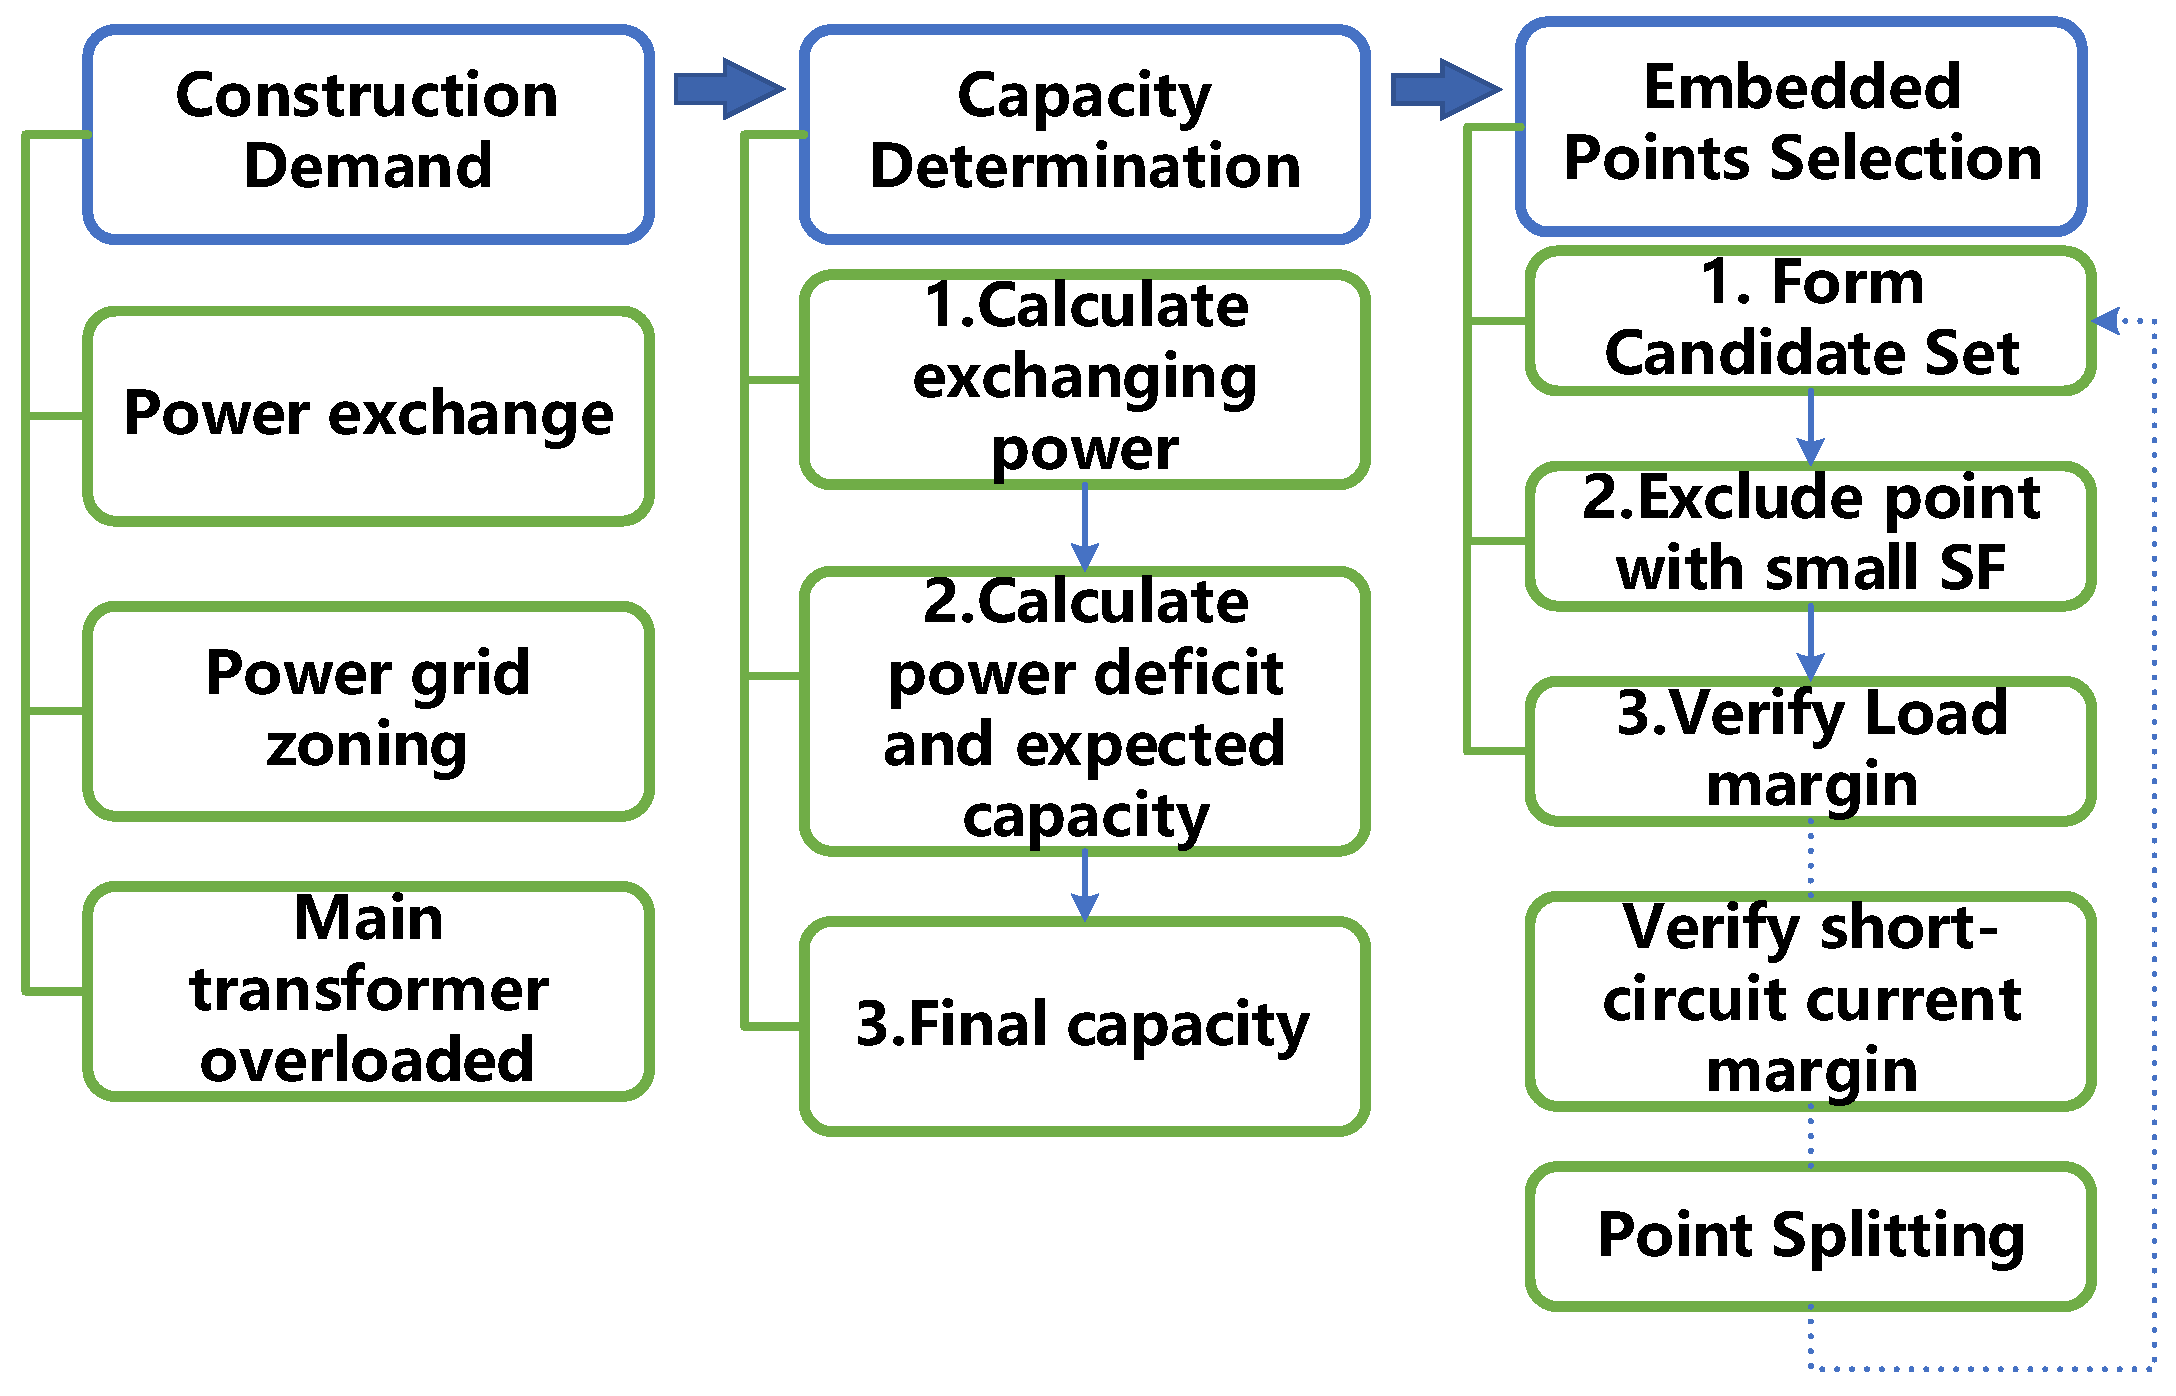
The overall planning process under the scenario of power supply zone interconnection is shown in Figure 5. A detailed description is elaborated in Section 4.3.1, Section 4.3.2, Section 4.3.3 and Section 4.3.4.

4.3.1. Demand

As mentioned in Section 2.3, generally, no new AC lines shall be built between the power supply zones of the low-voltage network. However, there may be a demand for power exchange between a power supply zone and another. The adoption of the DC scheme is a feasible way to transmit power between power grids of low-voltage levels. It does not reduce the electrical distance between the zones, and it will not cause an electromagnetic looped network. Meanwhile, it is beneficial to improve the load margin of the overloaded main transformer.

4.3.2. Capacity

(1) Calculate the maximum power mutual support demand under all operating modes,
P d c 1 = max k = 1 c   P e x k
where Pexk is the maximum exchanging power of the zones under the operation mode k and c is the number of operation modes taken into account.
(2) Calculate the power deficit of the main transformer. Then, calculate the maximum shift factor of the target main transformer. Use the shift factor and the power deficit to calculate the minimum DC capacity
Δ P = S t max S t
P d c 2 = k d c Δ P S F t , I
where SFt,I is the shift factor of the target transformer to the bus on the low-voltage side, ΔP is the power deficit, and kdc is a coefficient related to engineering experience. kdc > 1 but should not be too large; otherwise, the economic efficiency of the scheme will be poor.
(3) Generally, both situations in (1) and (2) above need to be satisfied, and the actual DC power shall take the larger value.
P d c = max { P d c 1 , P d c 2 }

4.3.3. Embedded Points

(1) Select low-voltage-level busbars near the geographical junctions between sub-areas as embedded points to form a candidate set and then proceed to step (2).
(2) Determine the sending and receiving ends according to the power flow of the main transformers. For either end, calculate the shift factors of the embedded points. The SF of the point should satisfy,
S F t , i > S F t , I k d c
If the shift factor of an embedded point is too small, exclude the embedded point scheme and proceed to step (3).
(3) Verify the load margins of the lines and transformers around the embedded point according to Equations (6) and (7). If the nearby lines or transformers are overloaded after a new DC is built at the embedded point, exclude the embedded point scheme.
(4) Optionally, verify the short-circuit current margin of the embedded point according to Equation (8). For zones with a demand for rapid power reversal, MMC needs to be adopted, and the short-circuit current margin of the embedded point needs to be checked. Exclude the embedded point schemes with too small short-circuit current margins in the original grid.
(5) Optionally, split the embedded points. If there is no scheme that meets the requirements, the embedded points can be split, and step (1)–step (4) should be repeated.

4.3.4. Multi Power Supply Zone

The above method is applicable to the connection between two power supply zones. When a newly built DC is expected to meet the demand for power exchange among multiple zones, the capacity of the converter station needs to be determined according to the sum of the power demands under different working conditions.
Taking a three-zone system as an example (assuming a three-terminal DC system, where the three terminals are 1, 2, and 3, and the exchanging powers are Pex12k, Pex13k, and Pex23k), the DC capacity in 4.3.2 should be revised as,
P 1 = max k = 1 c P e x 12 k + P e x 13 k P 2 = max k = 1 c P e x 12 k + P e x 23 k P 3 = max k = 1 c P e x 12 k P e x 23 k
For each zone, the steps in Section 4.3.3 can be used for embedded point inspection.

5. Case Study

The Jiangsu power grid in China is a typical receiving-end provincial power grid. Based on the planning data under the mode of large-scale new energy generation in winter of the Jiangsu power grid in 2030, by applying the above-mentioned planning method, embedded HVDC schemes are proposed for section reinforcement, new energy delivery, and zone interconnection. All results are obtained using PSS/E.

5.1. Embedded HVDC Scheme for the Cross–Yangtze Transmission Section in Jiangsu

5.1.1. Construction Demand

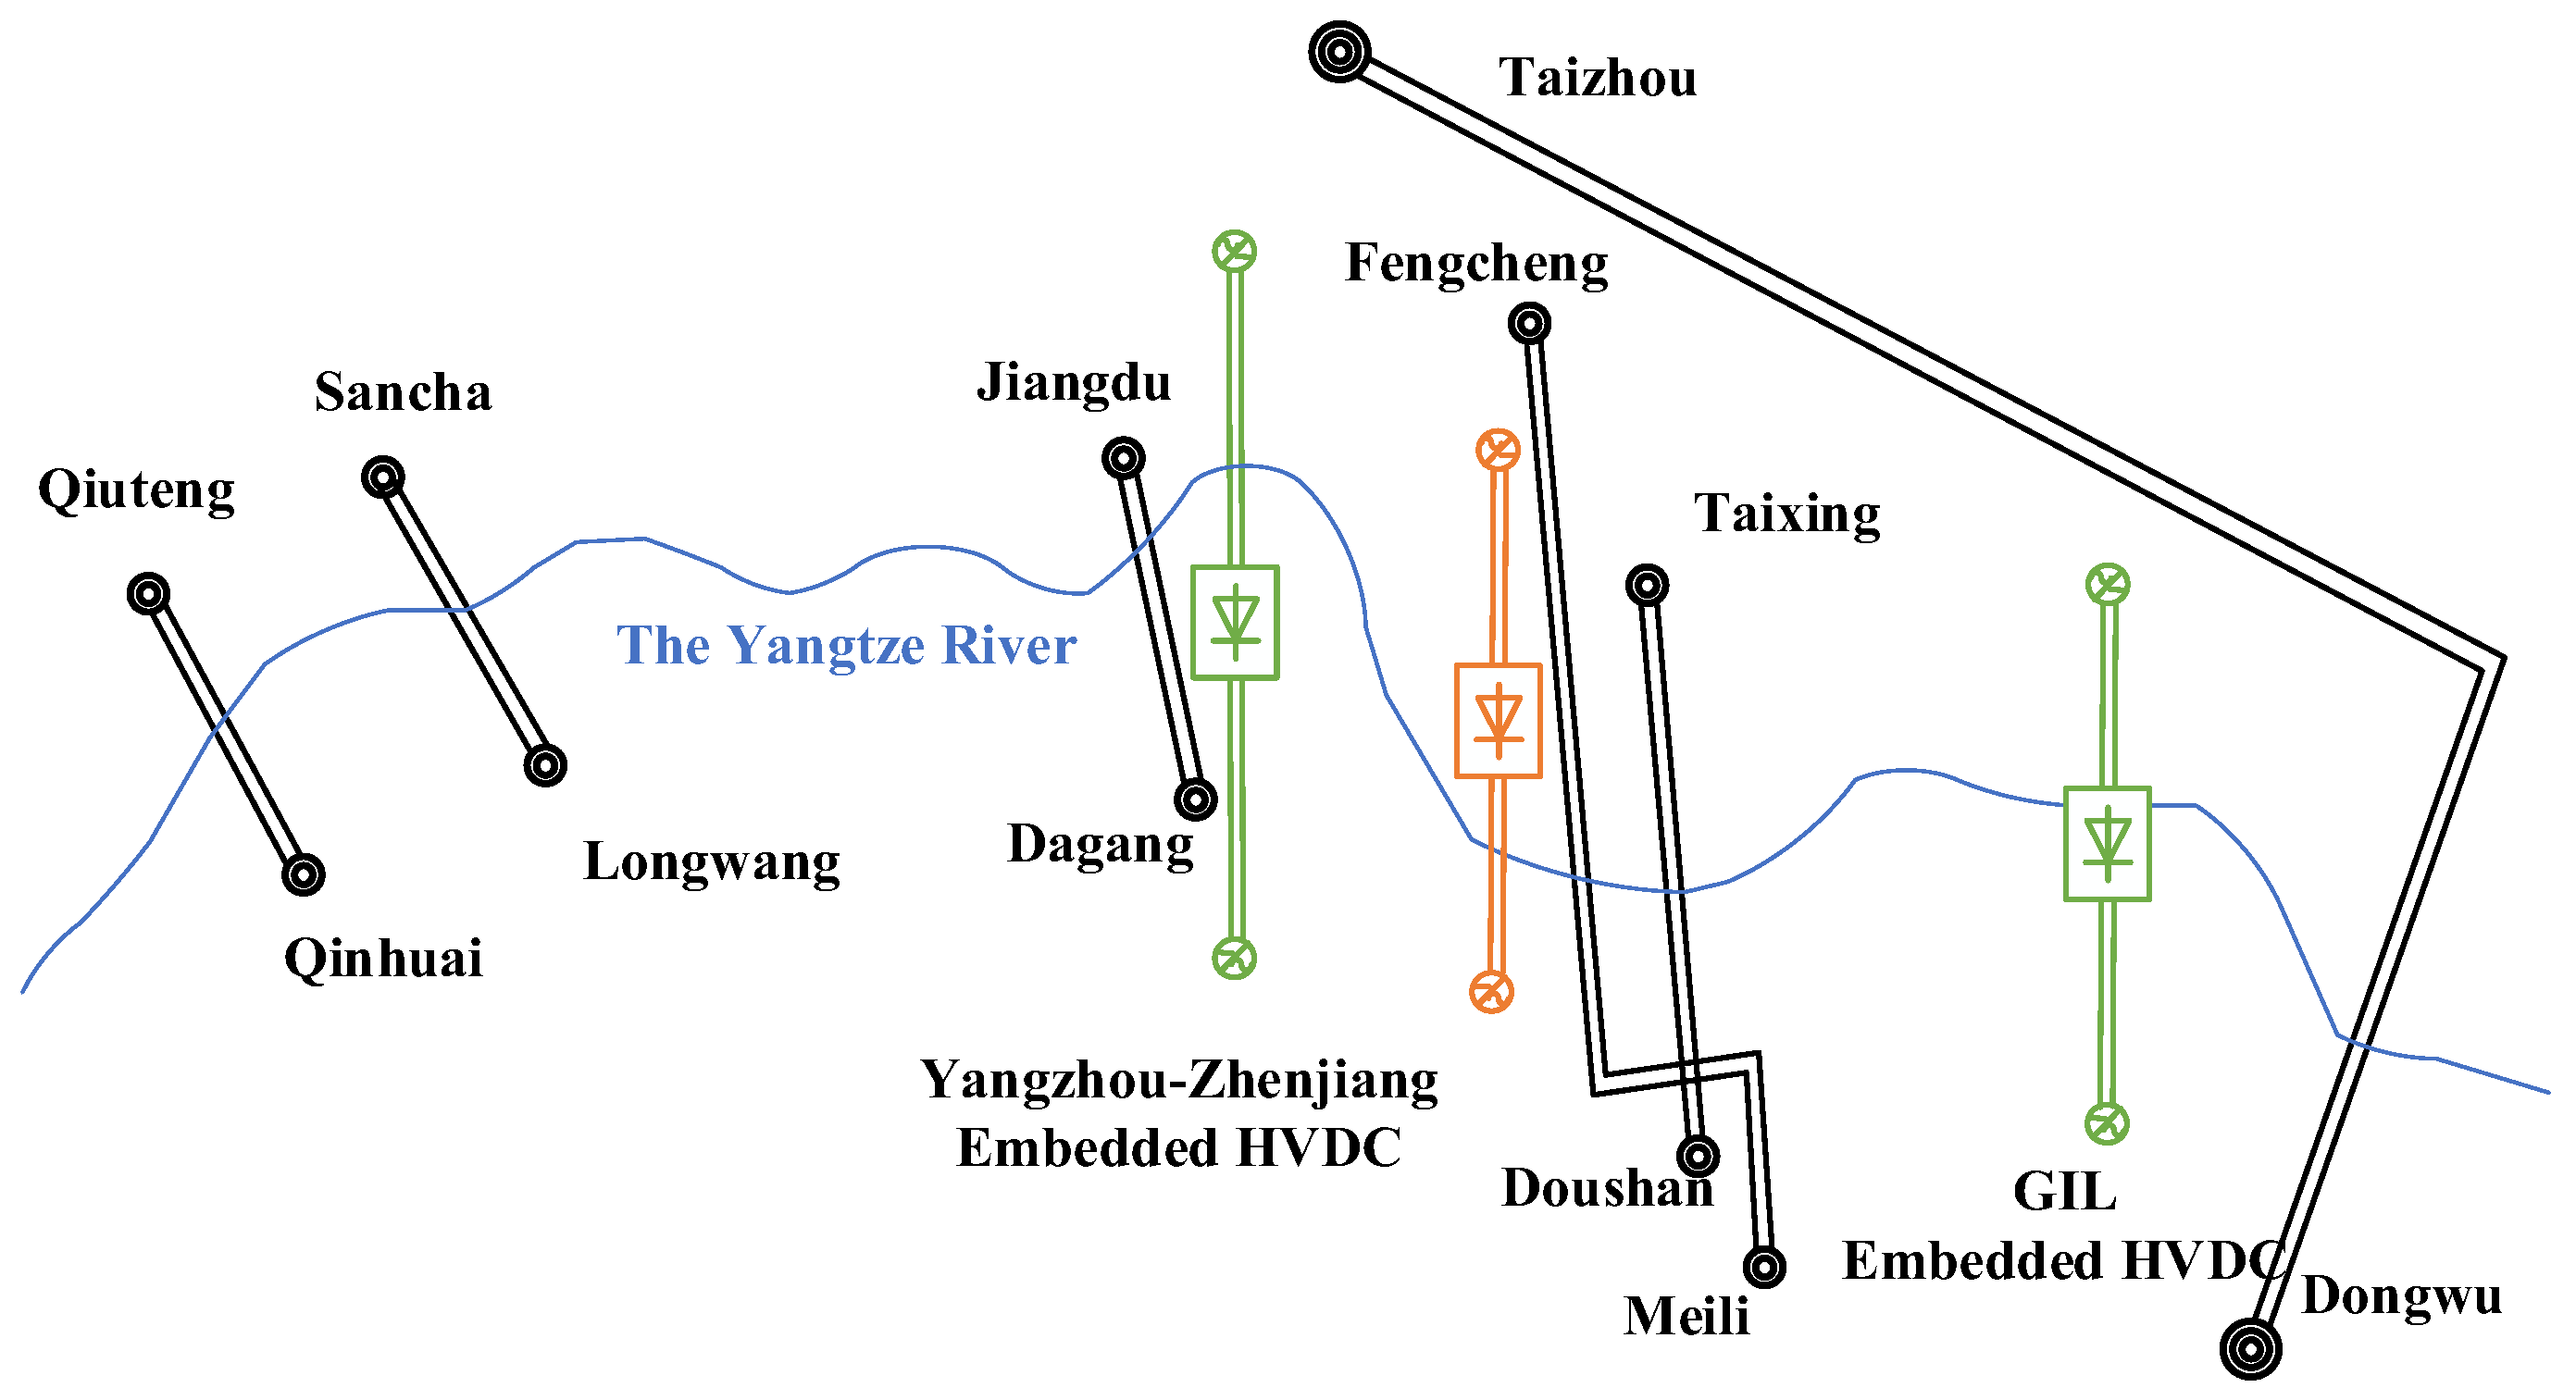
The Cross–Yangtze transmission section in Jiangsu is shown in Figure 6, where the AC lines are indicated in black and the proposed embedded DC lines are shown in green. Table 1 presents the capacity, active power, and load margin of each line within the section. According to the planning data, after the commissioning of the Yangzhou–Zhenjiang HVDC project and the GIL HVDC project, the capacity of the cross-river section has been increased to a certain extent, and the load margins of all lines have improved. However, the load margin of Line Fengcheng–Meili is still relatively small (25% under normal condition, 5% under Fengcheng–Meili N-1 condition). Considering the increase in new energy generation and load levels in the future, Line Fengcheng–Meili will face greater pressure compared with the other lines. It is necessary to further increase the load margin of Line Fengcheng–Meili. Currently, however, the short-circuit current margin of the 500 kV grid framework of Jiangsu Province is also small, and the AC solution has potential safety hazards. Building another embedded DC line alongside the heavily loaded AC line (the scheme in orange in Figure 6) may be a feasible solution.

5.1.2. Capacity Determination

Suppose it is planned to further reduce the load level of the Line Fengcheng–Meili by more than 10%. Firstly, it is calculated that the shift factor of the parallel-built DC line relative to Bus Fengcheng and Bus Meili is approximately 0.24 (the sending end is about 0.11, and the receiving end is about 0.13). Taking kdc = 1.33, the DC capacity is determined to be approximately 2000 MW.

5.1.3. Embedded Point Selection

(1) In order to ensure that the newly-built embedded DC has a sufficient alleviating effect on the load rate of Line Fengcheng–Meili, the 500 kV and 220 kV busbars in the same sub-area as Bus Fengcheng and Bus Meili are selected as the alternative points.
(2) The shift factors of the sending-end and receiving-end embedded points are further calculated, which are shown in Figure 7. The embedded points with smaller SF values are excluded, making sure the scheme effectively increases the load margin. Based on the previous value of kdc, the sending-end embedded points with SF less than 0.08 and receiving-end embedded points with SF less than 0.1 are excluded. The minimum shift factors are indicated by the red lines in Figure 7.
(3) The load margins of lines near the sending-end and receiving-end embedded points after the new DC is built are calculated. If only one sending end and one receiving end are considered for the sake of economy, then 5 sending-end embedded points and 5 receiving-end embedded points satisfy the power flow safety constraint, as shown in Table 2.

5.1.4. Discussion

If the engineering feasibility is ignored and it is assumed that a completely identical 525 kV, 3500 MW AC line is newly built beside the Line Fengcheng–Meili, the following problems exist:
(1)
Margin improvement: Similar to the effect of installing a 2000 MW embedded DC, it can relieve the power margin of the original line by about 15%. However, the line capacity is much larger than that of the DC, and the efficiency of load margin improvement using the AC solution is insufficient.
(2)
Short-circuit current: For Bus Fengcheng, the short-circuit current increases by 3.5 kA, and the short-circuit current margin is already 0. The short-circuit currents of the remaining 500 kV busbars also increase, and there is a risk of the short-circuit current exceeding the standard when using the AC solution.
By constructing a 2000 MW embedded HVDC project on the 500 kV or 220 kV grid, the load margin of the Line Fengcheng–Meili can be maximally increased by about 13.5%. Compared with the AC solution, the capacity of the newly built line is smaller, meaning the DC scheme can improve the load margin more efficiently. At the same time, the short-circuit current can be effectively controlled, which solves the problem of insufficient short-circuit current margin after adopting the AC solution.

5.2. Embedded HVDC Scheme of Offshore Wind Power in Jiangsu

5.2.1. Construction Demand

As shown in Figure 8, according to the planning data, Jiangsu intends to develop multiple offshore wind power projects. Given the large capacity of offshore wind power and its long distance from the shore, the use of DC power transmission has better technical and economic characteristics.

5.2.2. Capacity Determination

According to the planning data, the total capacity of offshore wind power fed into Bus Pandang is 2500 MW. Assuming that the capacity of the DC power transmission system is the new energy output under the condition of maximum new energy generation, that is, kdc = 0.65, the rated power of the embedded HVDC system is determined to be 1625 MW.

5.2.3. Embedded Point Selection

(1) For the embedded points, two schemes can be considered: nearby landing on the coast and directly transmitting to the load center.
In the former case (the scheme in black in Figure 8), the wind power is fed into Bus Pandang nearby.
In the latter case (the scheme in orange in Figure 8), suppose it is desired to directly transmit the wind power to Suzhou. Here, the 500 kV busbars in Suzhou are selected as alternative embedded points.
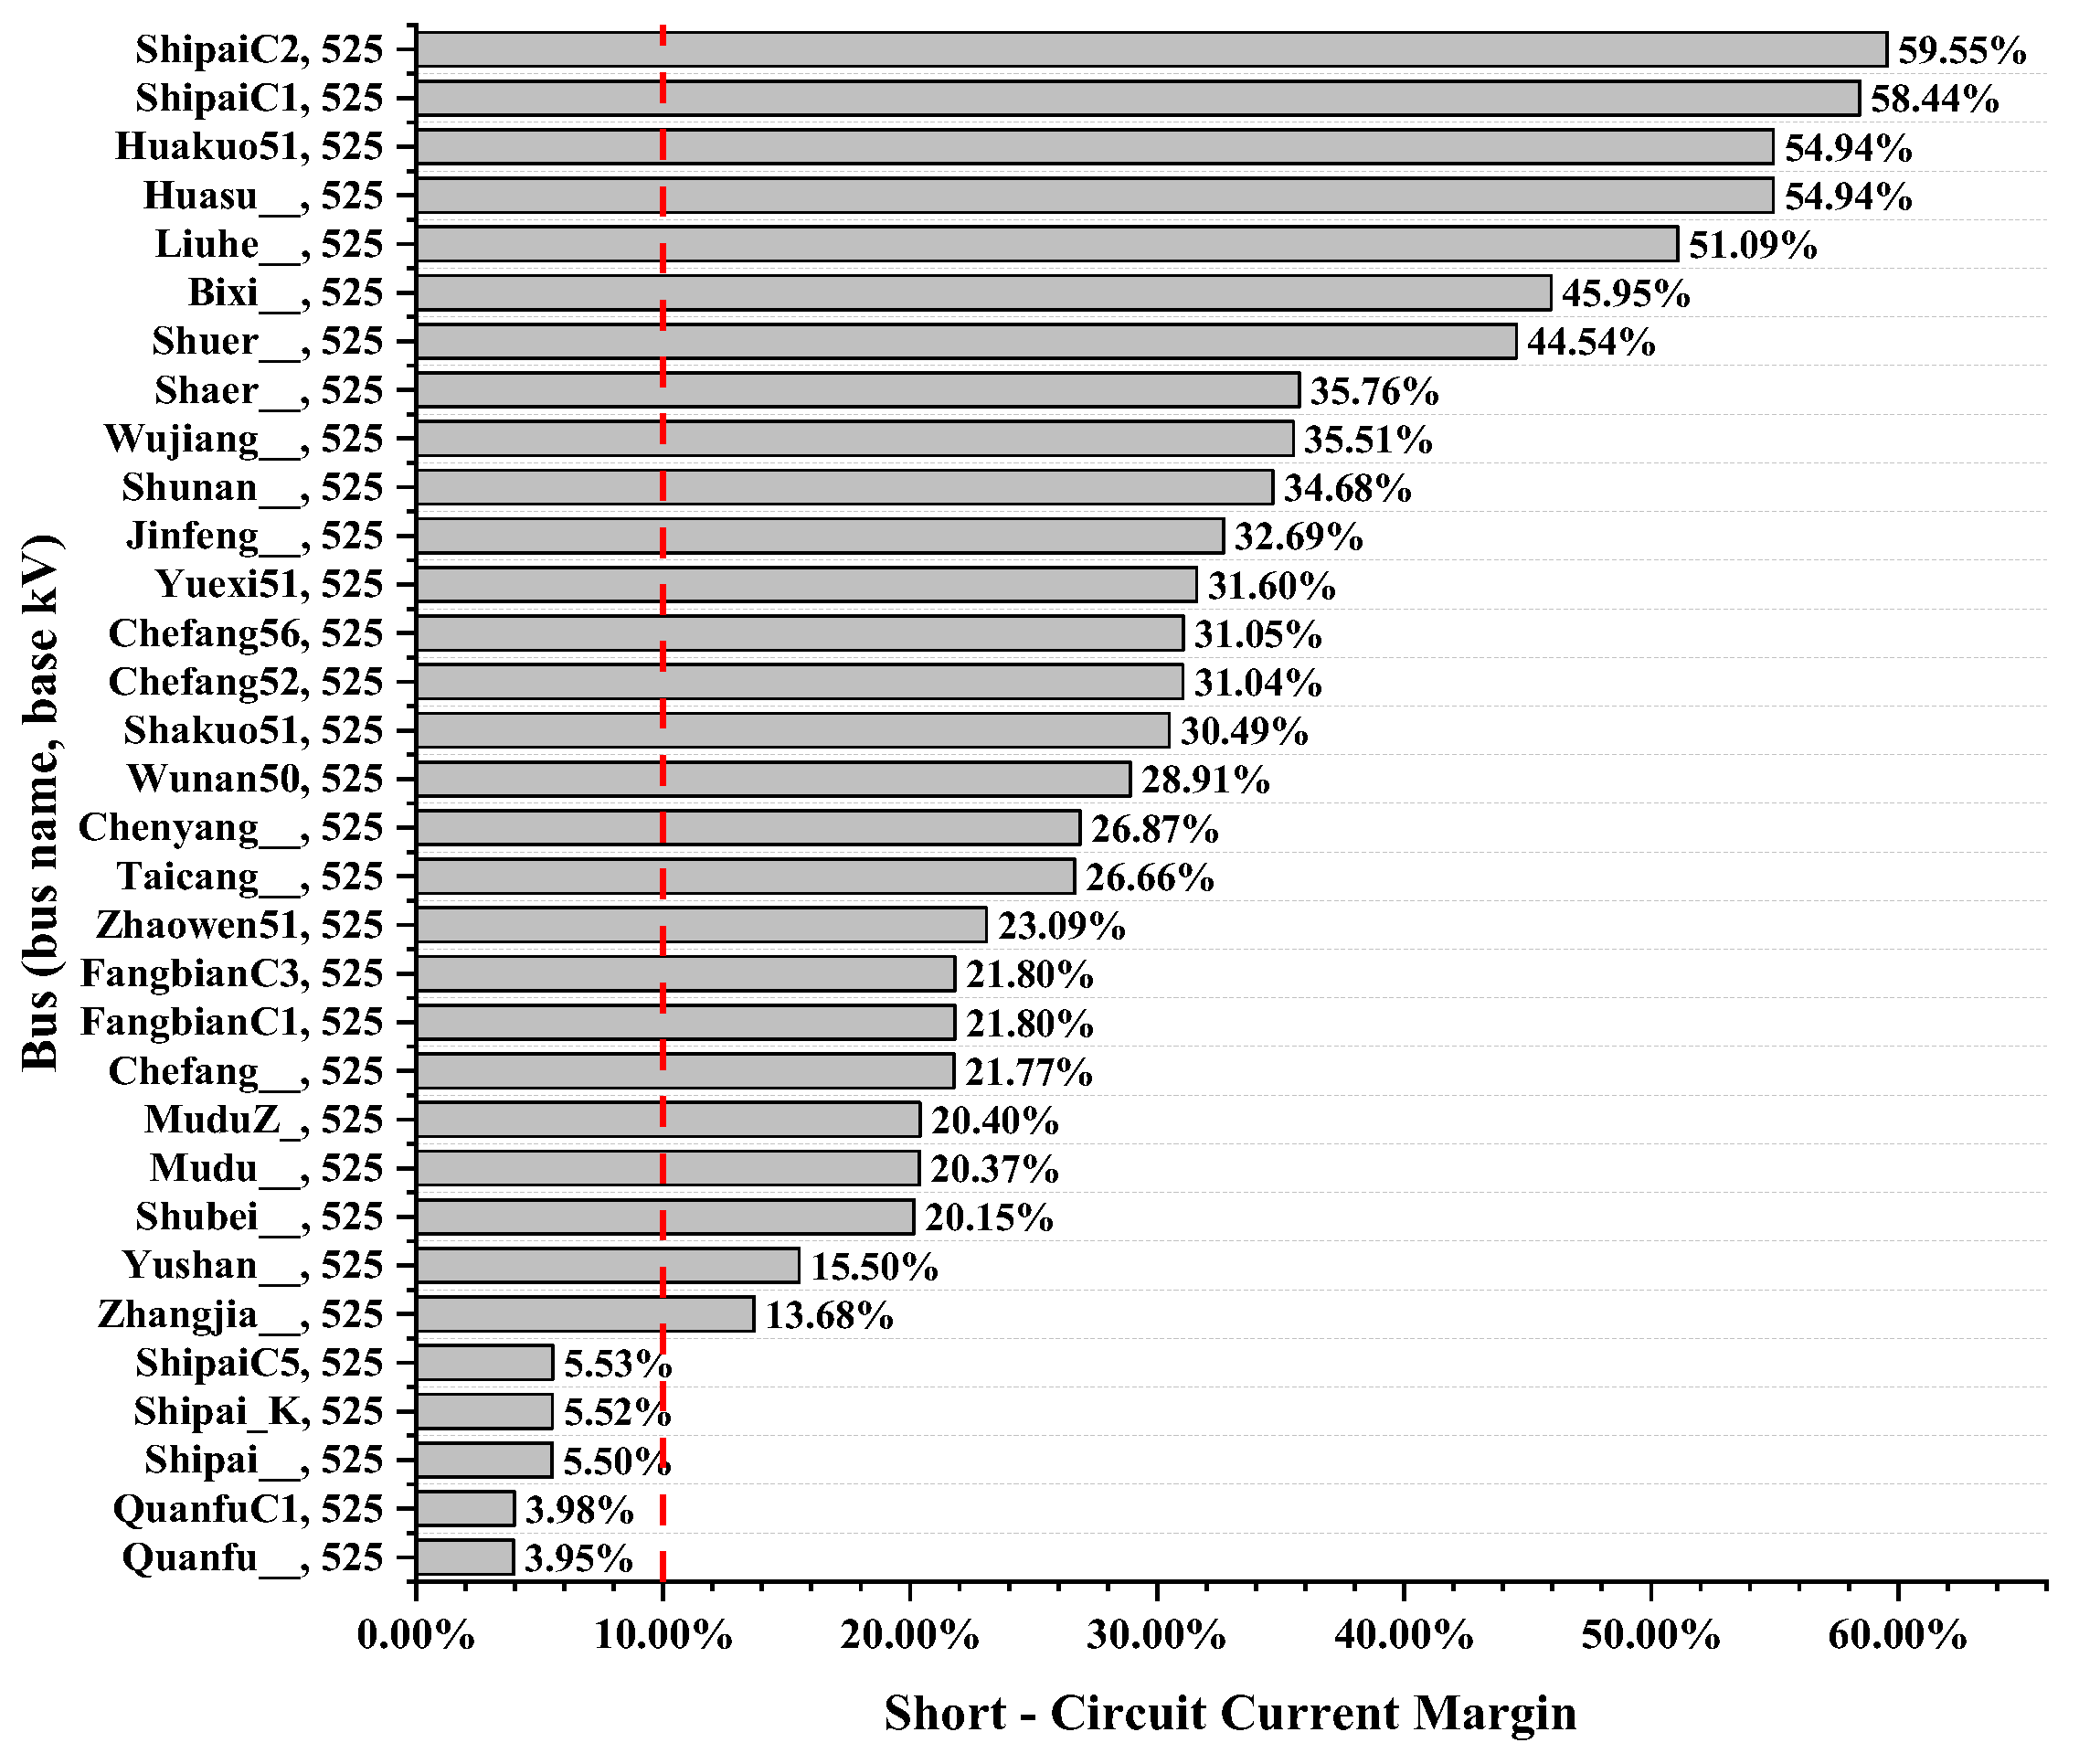
(2) Considering that VSC-HVDC transmission is used for offshore wind power, it may contribute a certain short-circuit current. Calculate the three-phase short-circuit current margin of the embedded points, as shown in Figure 9. Exclude the busbars with insufficient short-circuit current margins. Here, the busbars with a short-circuit current margin of less than 10% are excluded. The minimum margin is indicated by the red line in Figure 9.
(3) Calculate the load margin of lines near the embedded points after the embedded HVDC is added to the network. A total of 11 receiving-end embedded points are obtained, as shown in Table 3. The lines around the obtained receiving-end embedded points can safely evacuate the power fed in.

5.2.4. Discussion

For far-offshore wind power, the AC power transmission scheme has difficulties in reactive power compensation and poor economic performance, making it infeasible. By constructing a 1625 MW HVDC project, the far-offshore wind farms can be connected to the Pandang busbar nearby or directly transmit power to Suzhou. Both embedded HVDC schemes are more economical than the AC scheme.
The nearby-landing scheme selects the nearest 500 kV busbar for grid connection. Compared with the nearby-landing scheme, the direct-transmission scheme can transmit all the power in a targeted manner. At the same time, it will reduce the load level of the east–west-direction line (Line Pandang–Qijie) by 10% according to the result of power flow calculation, but the cost will increase accordingly.

5.3. Embedded HVDC Scheme for Interconnection of Power Supply Zones in Nanjing, Jiangsu

5.3.1. Construction Demand

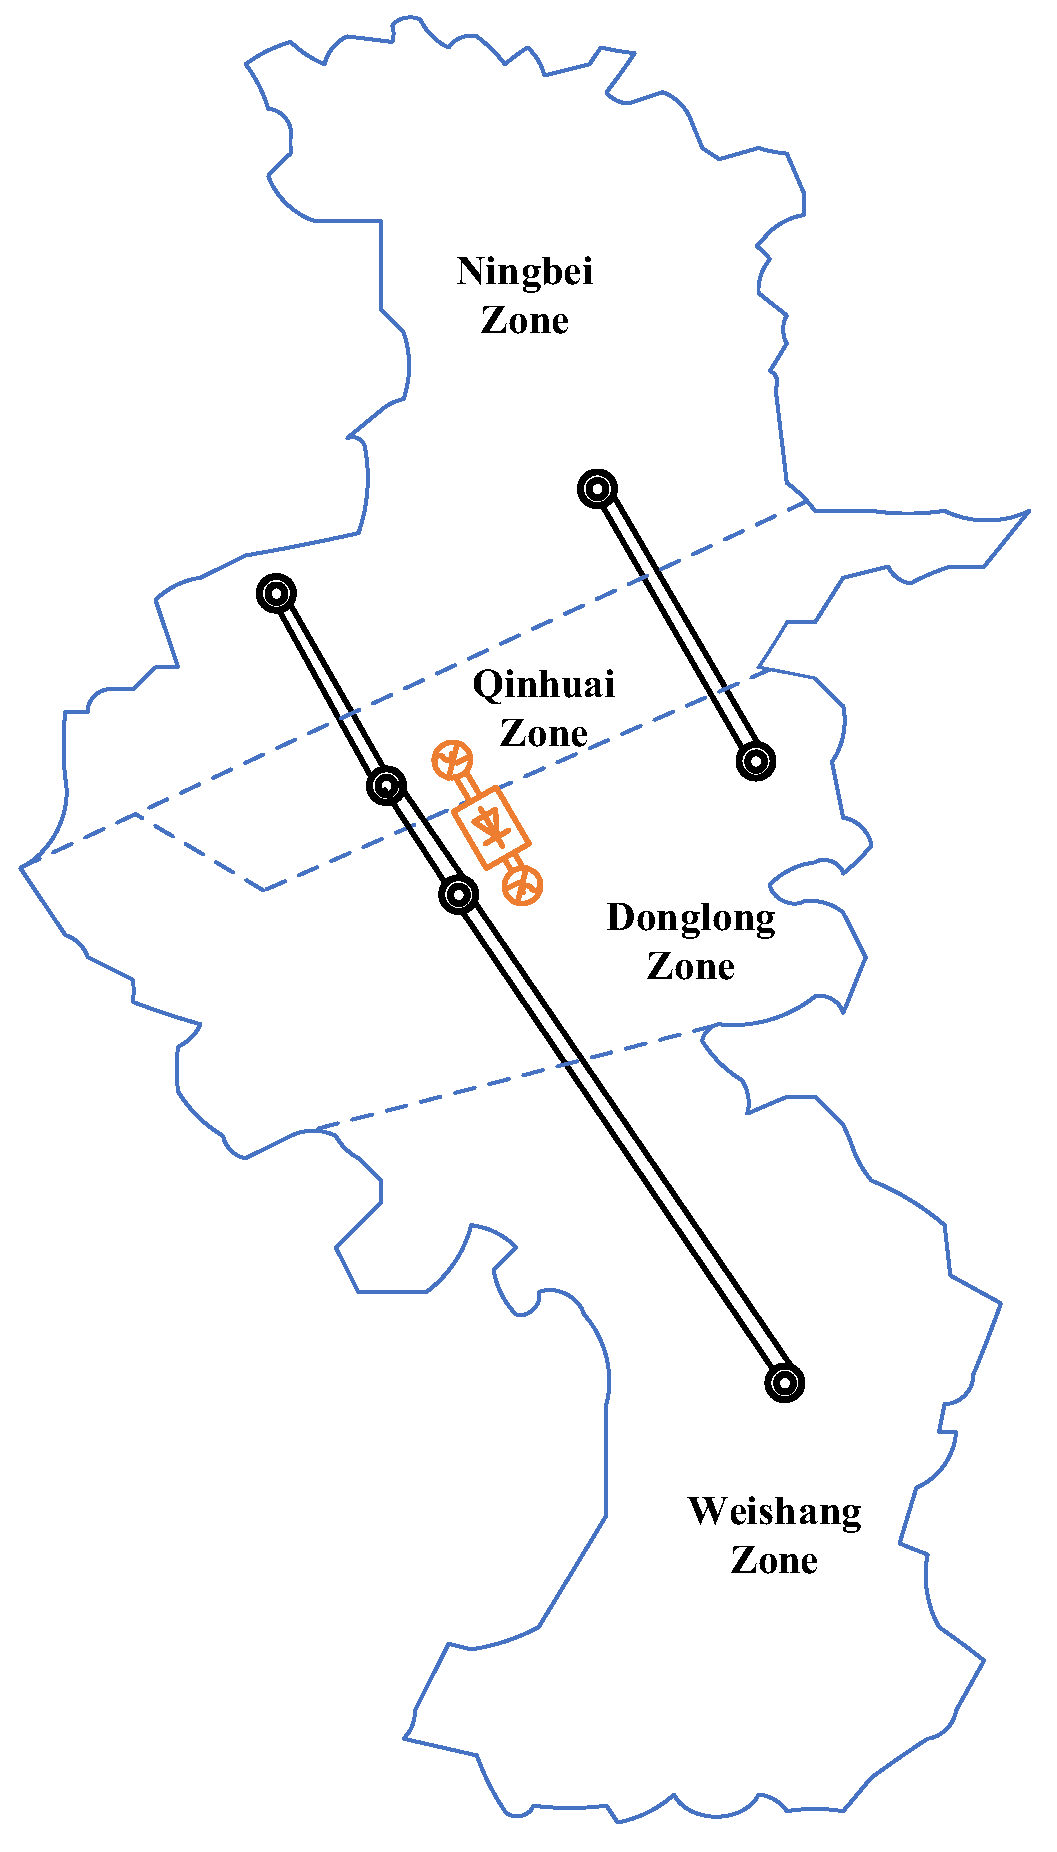
The distribution of Nanjing power supply zones is shown in Figure 10. The Nanjing power grid operates in four zones, including the Ningbei Zone, Qinhuai Zone, Donglong Zone, and Huishang Zone. Among them, the Qinhuai Zone and Donglong Zone are connected on the 500 kV grid through Line Qinhuai–Dongshan and the Longwangshan Substation. The Qinhuai Zone has a dense load and a high demand for power supply reliability.
According to the data, the 500 kV Transformer Qinhuai is overloaded by 8% after N-1. It is hoped to improve the load margin of Transformer Qinhuai by building embedded HVDC on the 220 kV grid of the Qinhuai Zone and Donglong Zone (the scheme in orange in Figure 10). At the same time, it enables controllable power exchange for the two zones.

5.3.2. Capacity Determination

It is assumed that the load margin of Transformer Qinhuai is expected to be increased by more than 15%. Firstly, the SF of Transformer Qinhuai to 220 kV Bus Qinhuai is calculated to be 0.268. Taking kdc as 1.33, the DC capacity is determined as approximately 750 MW.

5.3.3. Embedded Point Selection

(1) Select all 220 kV busbars in the Qinhuai Zone and the Donglong Zone as alternative embedded points. The Qinhuai Zone serves as the receiving end, and the Donglong Zone serves as the sending end.
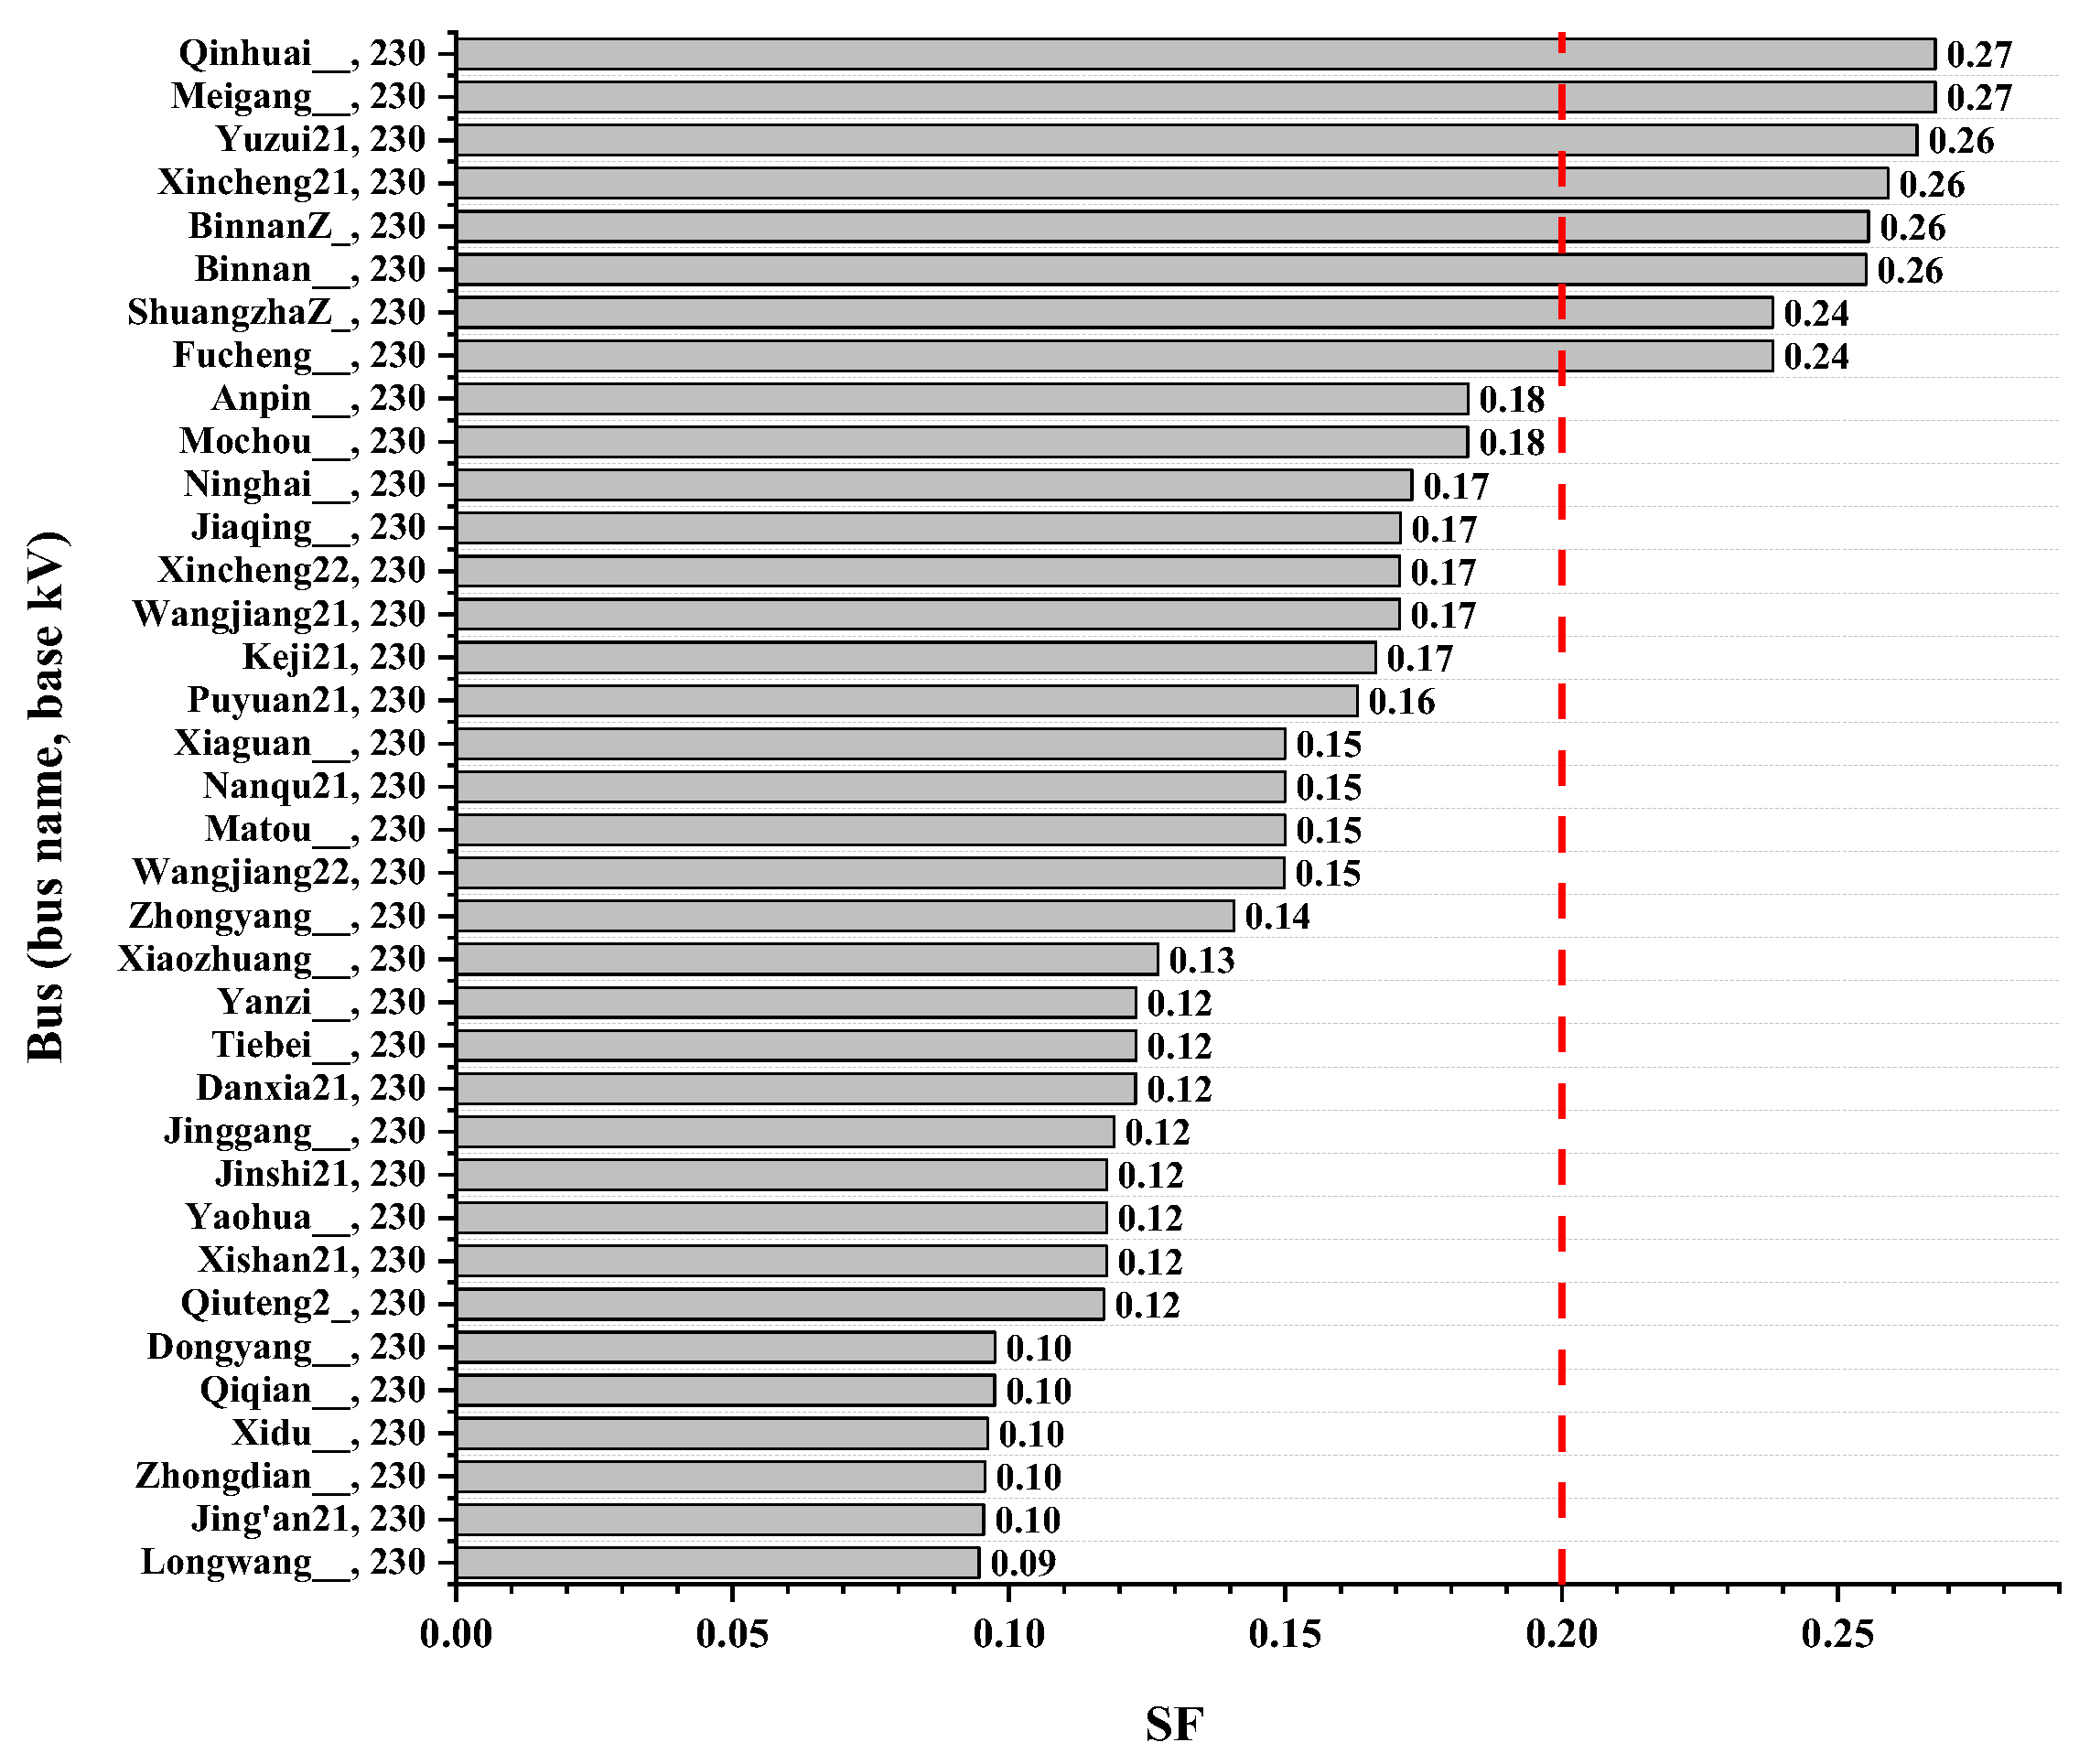
(2) Calculate the shift factors of the receiving-end embedded points. The SF values of the sending-end embedded points are all small (less than 0.01), having little impact on Transformer Qinhuai, while the selection of receiving-end embedded points making a big difference. So, calculate the SF values of the receiving-end embedded points and exclude the small candidate points. As shown in Figure 11, exclude the receiving-end embedded points with small SF values. Based on the previous value of kdc, the schemes with SF < 0.2 are excluded. The minimum shift factor is indicated by the red line in Figure 11.
(3) Calculate the load margin of nearby lines after embedding the DC system. There are 6 receiving end and 20 sending end feasible embedded points, which are shown in Table 4. The embedding points can be further screened according to the actual geographical distribution.

5.3.4. Discussion

The embedded HVDC scheme is a more feasible way to connect different power supply zones compared with building AC lines.
A 750 MW embedded HVDC is constructed between the Qinhuai zone and the Donglong zone, enabling the two power supply areas to engage in power exchange at the 220 kV network. It can maximally increase the load margin of the main transformer of Qinhuai by 25% under the N-1 condition, thus solving the problem of the main transformer being overloaded under the N-1 condition without forming an electromagnetic loop network.

6. Conclusions

This paper studies the planning method of the embedded HVDC system. Based on practical deployment, this study pioneers a three-category framework for typical applications of embedded HVDC: reinforcement of transmission sections, integration of new energy, and interconnection of power supply zones. Further, the research innovatively dissects the planning approach into three dimensions: identifying construction demands, determining capacity, and selecting embedding points. Compared to conventional methodologies, this study offers a systematic perspective and feasible approach to be applied in actual power grid data.
The following conclusions can be drawn under the three proposed scenarios:
(1)
In the scenario of transmission section reinforcement, the embedded HVDC scheme is more feasible compared with the AC scheme. It can meet the requirements of power transmission and control, effectively relieve the load of the current lines, and the short-circuit current does not exceed the limit.
(2)
In the scenario of offshore new power delivery, the embedded HVDC scheme is more efficient compared with the AC scheme. Both the nearby-landing scheme and the direct-transmission scheme can be adopted. The former scheme is more economical, while the latter scheme can reduce the load on coastal lines.
(3)
In the scenario of power supply zone interconnection, the embedded HVDC scheme enables the direct power exchange capability for low-voltage-level power supply and improves the load margin of the main transformers, which cannot be achieved with the AC scheme.
However, the method in this paper still has certain imperfections. The proposed method aims to determine the DC capacity and screen feasible embedding points from the perspective of safety and stability. For the final determination of the embedding scheme, other factors such as the occupied area and construction difficulty in specific projects should be considered further. In the determination of DC capacity, only the demand for active power transmission is considered, while the influence of reactive power is ignored. In fact, if VSC-HVDC is adopted, it can also provide a certain amount of reactive power support for the system. How to comprehensively consider the selection of different DC types is an issue that needs to be considered in future research.

Author Contributions

Conceptualization, Q.X., Y.H. and G.W.; methodology, Q.X.; software, Q.X.; validation, Q.X.; formal analysis, Q.X.; investigation, H.C., F.D. and W.S.; resources, H.C.; writing—original draft preparation, Q.X.; writing—review and editing, Y.H. and G.W.; visualization, Q.X.; supervision, H.C.; funding acquisition, H.C. and F.D. All authors have read and agreed to the published version of the manuscript.

Funding

This research was funded by Technology Project of State Grid Corporation of China “Research on Planning and Application Technology of Embedded DC in Provincial AC/DC Hybrid Power Grid” (5100-202418018A-1-1-ZN).

Data Availability Statement

Data are contained within the article.

Conflicts of Interest

Authors Hui Cai and Wentao Sun were employed by the company State Grid Jiangsu Electric Power Co., Ltd., Economic and Technological Research Institute. Author Fei Dou was employed by the company State Grid Jiangsu Electric Power Co., Ltd. The remaining authors declare that the research was conducted in the absence of any commercial or financial relationships that could be construed as a potential conflict of interest. The authors declare that this study received funding from State Grid Corporation. The funder was not involved in the study design, collection, analysis, interpretation of data, the writing of this article or the decision to submit it for publication.

References

  1. Zhang, Z.; Kang, C. Challenges and Prospects of Building a New Power System under the Carbon Neutrality Goal. Proc. CSEE 2022, 42, 2806–2819. [Google Scholar] [CrossRef]
  2. Chen, X.; MCELROY, M.B.; Wu, Q.; Shu, Y.; Xue, Y. Transition towards Higher Penetration of Renewables: An Overview of Interlinked Technical, Environmental and Socio-Economic Challenges. J. Mod. Power Syst. Clean Energy 2019, 7, 1–8. [Google Scholar] [CrossRef]
  3. Wang, M.; An, T.; Ergun, H.; Lan, Y.; Andersen, B.; Szechtman, M.; Leterme, W.; Beerten, J.; Van Hertem, D. Review and Outlook of HVDC Grids as Backbone of Transmission System. CSEE J. Power Energy Syst. 2021, 7, 797–810. [Google Scholar] [CrossRef]
  4. Wang, W.; Li, G.; Guo, J. Large-Scale Renewable Energy Transmission by HVDC: Challenges and Proposals. Engineering 2022, 19, 252–267. [Google Scholar] [CrossRef]
  5. Xiao, H.; Gan, H.; Yang, P.; Li, L.; Li, D.; Hao, Q.; Huang, Y.; Dai, L.; Liu, Y. Robust Submodule Fault Management in Modular Multilevel Converters with Nearest Level Modulation for Uninterrupted Power Transmission. IEEE Trans. Power Deliv. 2024, 39, 931–946. [Google Scholar] [CrossRef]
  6. Huang, Y.; Zhang, J.; Wang, G.; Xu, Z. Transient Stability Analysis and Improvement of Isolated Renewable Energy Bases with VSC-DC Transmission. CSEE J. Power Energy Syst. 2025, in press. [CrossRef]
  7. CIGRE Joint Working Group C4/B4/C1-604. Influence of Embedded HVDC Transmission on System Security and AC Network Performance; CIGRE Brochure: Paris, France, 2013; p. 5. [Google Scholar]
  8. Wang, Z.; Huang, J.; Cheng, L.; Hu, W.; Cai, H.; Han, X. Planning and Application of “Embedded” DC Technology in Provincial Power Transmission Networks. Electr. Power Eng. Technol. 2022, 41, 65–74. [Google Scholar]
  9. Moradi-Sepahvand, M.; Amraee, T. Hybrid AC/DC Transmission Expansion Planning Considering HVAC to HVDC Con-version Under Renewable Penetration. IEEE Trans. Power Syst. 2021, 36, 579–591. [Google Scholar] [CrossRef]
  10. Lotfjou, A.; Fu, Y.; Shahidehpour, M. Hybrid AC/DC Transmission Expansion Planning. IEEE Trans. Power Deliv. 2012, 27, 1620–1628. [Google Scholar] [CrossRef]
  11. Akbari, E.; Naghibi, A.F.; Veisi, M.; Pirouzi, S.; Safaee, S. High Voltage Direct Current System-Based Generation and Transmission Expansion Planning Considering Reactive Power Management of AC and DC Stations. Sci. Rep. 2025, 15, 15537. [Google Scholar] [CrossRef] [PubMed]
  12. Franken, M.; Barrios, H.; Schrief, A.B.; Puffer, R. Identification of Suitable Locations for HVDC Links within Meshed AC Networks. In Proceedings of the 2019 IEEE PES Innovative Smart Grid Technologies Europe (ISGT-Europe), Bucharest, Romania, 29 September–2 October 2019; pp. 1–5. [Google Scholar]
  13. Li, Y.; Qiao, X.; Chen, C.; Tan, Y.; Tian, W.; Xia, Q.; Cao, Y.; Lee, K.Y. Integrated Optimal Siting and Sizing for VSC-HVDC-Link-Based Offshore Wind Farms and Shunt Capacitors. J. Mod. Power Syst. Clean Energy 2021, 9, 274–284. [Google Scholar] [CrossRef]
  14. He, Y.; Zhong, H.; Ruan, G.; Zhou, B.; Fu, C.; Zhuo, Y. Frequency-Constrained Coordinated Planning of HVDC and Generation. In Proceedings of the 2024 IEEE PES Innovative Smart Grid Technologies Europe (ISGT EUROPE), Dubrovnik, Croatia, 14–17 October 2024; pp. 1–5. [Google Scholar]
  15. Li, Z.; Jin, B.; Zou, Y. HVDC Terminal Locations Optimization Considering Grid Support Capacity Constraints. In Proceedings of the 2024 IEEE 6th International Conference on Power, Intelligent Computing and Systems (ICPICS), Shenyang, China, 26–28 July 2024; pp. 1620–1625. [Google Scholar]
  16. Xie, H.; Bie, Z.; Li, G. Reliability-Oriented Networking Planning for Meshed VSC-HVDC Grids. IEEE Trans. Power Syst. 2019, 34, 1342–1351. [Google Scholar] [CrossRef]
  17. Zhang, L.; Ye, H.; Zhai, Q.; Wei, N.; Liu, S.; Chen, W. Multi-Stage Optimization of Inter-Regional Flexibility with HVDC Tie-Line. In Proceedings of the 2023 5th Asia Energy and Electrical Engineering Symposium (AEEES), Chengdu, China, 23–26 March 2023; pp. 904–909. [Google Scholar]
  18. Wang, R.; Tang, Q.; Lu, Y.; Gou, J.; Liu, F.; Wen, Y. Robust Transmission Expansion Planning of Hybrid Ultra-HVAC and Ultra-HVDC Grid. In Proceedings of the 2021 IEEE/IAS Industrial and Commercial Power System Asia (I&CPS Asia), Chengdu, China, 18–21 July 2021; pp. 747–751. [Google Scholar]
  19. Wen, Y.; Lu, Y.; Gou, J.; Liu, F.; Tang, Q.; Wang, R. Robust Transmission Expansion Planning of Ultrahigh-Voltage AC–DC Hybrid Grids. IEEE Trans. Ind. Appl. 2022, 58, 3294–3302. [Google Scholar] [CrossRef]
  20. Emdadi, K.; Pirouzi, S. Benders Decomposition-Based Power Network Expansion Planning According to Eco-Sizing of High-Voltage Direct-Current System, Power Transmission Cables and Renewable/Non-Renewable Generation Units. IET Renew. Power Gener. 2025, 19, e70025. [Google Scholar] [CrossRef]
  21. Zhou, Y.; Rehtanz, C.; Dalhues, S.; Luo, P.; Liu, J.; Li, Y.; Chen, H. A Strategy for Access Points Selection and Capacity Configuration for the VSC-HVDC System Considering Overload Scenarios Alleviation. Int. J. Electr. Power Energy Syst. 2021, 124, 106329. [Google Scholar] [CrossRef]
  22. Li, X.; Zhou, Y.; Zhang, D.; Li, Y.; Li, Y. Location Selection of VSC-HVDC Line Access Points and Capacity Optimization Configuration Method. Electr. Power Autom. Equip. 2020, 40, 113–118, 119–120, 126. [Google Scholar] [CrossRef]
  23. You, G.; Xiao, L.; Li, L.; Zhu, X.; Yang, J.; Wu, X.; Wang, G.; Xu, Z. Scheme Design Method for Strengthening Power Grids in Typical High-Proportion New Energy Areas Using Flexible DC Technology. Power Capac. React. Power Compens. 2020, 41, 142–150+157. [Google Scholar] [CrossRef]
  24. Xu, W.; Wang, R.; Zhen, Y.; Li, T.; Wang, Y.; Wen, Y. Adaptability Evaluation of Multi-Send HVDC Power Grid Planning Schemes. In Proceedings of the 2021 4th International Conference on Energy, Electrical and Power Engineering (CEEPE), Chongqing, China, 23–25 April 2021; pp. 235–239. [Google Scholar]
  25. Guo, X.; Guo, J.; Ma, S.; Wang, C.; Zhang, Y. Multi-DC Landing Point Selection Method Based on Multi-Infeed Short Circuit Ratio. Proc. CSEE 2013, 33, 36–42+21. [Google Scholar] [CrossRef]
  26. Zhou, Q.; Liu, Y.; Tang, Y. Multi-DC Infeed Landing Point Selection Method Considering DC Weight. Power Syst. Technol. 2013, 37, 3336–3341. [Google Scholar] [CrossRef]
  27. Xiao, H.; Zhang, Y.; Duan, X.; Li, Y. Evaluating Strength of Hybrid Multi-Infeed HVDC Systems for Planning Studies Using Hybrid Multi-Infeed Interactive Effective Short-Circuit Ratio. IEEE Trans. Power Deliv. 2021, 36, 2129–2144. [Google Scholar] [CrossRef]
  28. Luo, G.; Shi, D.; Chen, J.; Duan, X. Automatic Identification of Transmission Sections Based on Complex Network Theory. IET Gener. Transm. Distrib. 2014, 8, 1203–1210. [Google Scholar] [CrossRef]
Figure 1. Application scenarios of embedded HVDC: (a) reinforcement of transmission section; (b) delivery of new energy; (c) interconnection of power supply zones.
Electronics 14 03292 g001
Figure 2. Economic comparison between AC and DC.
Electronics 14 03292 g002
Figure 3. Planning process of transmission section reinforcement.
Electronics 14 03292 g003
Figure 4. Planning process of new energy delivery.
Electronics 14 03292 g004
Figure 5. Planning process of power supply zone interconnection.
Electronics 14 03292 g005
Figure 6. The Cross–Yangtze transmission section in Jiangsu.
Electronics 14 03292 g006
Figure 7. Shift factor of embedded points: (a) sending end; (b) receiving end.
Electronics 14 03292 g007
Figure 8. Offshore wind power delivery scheme.
Electronics 14 03292 g008
Figure 9. Short-circuit current margin of the embedded points.
Electronics 14 03292 g009
Figure 10. Power supply zones of Nanjing.
Electronics 14 03292 g010
Figure 11. Shift factors of the receiving-end embedded points.
Electronics 14 03292 g011
Table 1. Load margin of lines within the Cross–Yangtze transmission section.
Bus 1Bus 2Line IDCapacityActive PowerLoad Margin
QiutengQinhuai14541.3523.688.5%
24541.3523.688.5%
Sancha Longwang13496.81615.553.8%
23496.81649.952.8%
JiangduDagang13633.01085.470.1%
23633.01035.571.5%
TaixingDoushan12815.61392.450.5%
22815.61376.851.1%
FengchengMeili13500.82627.125.0%
23500.82635.124.7%
TaizhouDongwu19081.63287.763.8%
29081.63287.763.8%
Table 2. Feasible embedded points.
Sending-End Bus (Bus Name, Base kV)Receiving-End Bus (Bus Name, Base kV)
Dasi21, 230Jishi21, 230
Fengcheng_K, 230Taiwen21,230
Fengcheng__, 230Xinan51, 525
Fengcheng__, 525Meili__, 230
Meiduo21, 230Meili__, 525
Table 3. Feasible embedded points.
Receiving-End Bus (Bus Name, Base kV)
Shu’er__, 525Liuhe__, 525
Shunan__, 525ShipaiC1, 525
Zhaowen51, 525ShipaiC2, 525
Sha’er__, 525Huakuo51, 525
Huasu__, 525Bixi__, 525
Taicang__, 525
Table 4. Feasible embedded points.
Sending-End Bus (Bus Name, Base kV)Receiving-End Bus (Bus Name, Base kV)
Tushan21, 230 Qinglong22, 230BinnanZ_, 230
Guanghua__, 230Fengcun21, 230Fucheng__, 230
Aitao21, 230LongwangZ_, 230Meigang__, 230
Aitao22, 230Songgang21, 230Qinhuai__, 230
Dongshan21, 230Xianhe__, 230Xincheng21, 230
Dongshan22, 230Shidai21, 230Yuzui21, 230
GaoqiaoF_, 230Houxiang__, 230
Jiaochang21, 230Suzhuang__, 230
Gaoqiao__, 230Raocheng21, 230
Kexue21, 230Raocheng22, 230
Disclaimer/Publisher’s Note: The statements, opinions and data contained in all publications are solely those of the individual author(s) and contributor(s) and not of MDPI and/or the editor(s). MDPI and/or the editor(s) disclaim responsibility for any injury to people or property resulting from any ideas, methods, instructions or products referred to in the content.