Abstract
Bypass diode faults are among the most hard-to-detect but impactful anomalies in photovoltaic (PV) systems, especially under partial shading conditions, where their electrical signatures often resemble those caused by non-critical irradiance variations. This study presents a systematic simulation-based investigation into how different bypass diode fault types—short-circuited, open-circuited, and healthy—affect the electrical behavior of PV strings under diverse irradiance profiles. A high-resolution MATLAB/Simulink model is developed to simulate 27 unique diode fault configurations across multiple shading scenarios, enabling the extraction of key features from resulting I–V curves. These features include global and local maximum power point parameters, open-circuit voltage, and short-circuit current. To address the challenge of feature redundancy and classification ambiguity, a preprocessing step is applied to remove near-duplicate instances and improve model generalization. An artificial neural network (ANN) model is then trained to classify the number of faulty bypass diodes based on these features. Comparative evaluations are conducted with support vector machines and random forests. The results indicate that the ANN achieves the highest test accuracy (93.57%) and average AUC (0.9925), outperforming other classifiers in both robustness and discriminative power. These findings highlight the importance of feature-informed, data-driven approaches for fault detection in PV systems and demonstrate the feasibility of diode fault classification without precise fault localization.
1. Introduction
Ensuring robust and timely fault diagnosis in photovoltaic (PV) systems is critical for maintaining power efficiency, operational safety, and long-term reliability. The presence of partial shading poses substantial challenges to the operation and maintenance of PV systems and continues to be a central focus of research due to its widespread impact and complexity [1,2]. To this end, a wide range of diagnostic strategies have been proposed, spanning signal transformation, thermal analysis, IoT-based monitoring, and machine learning techniques. A particularly novel direction involves converting electrical signals into visual representations. Wang et al. introduced the Symmetrized Dot Pattern (SDP) technique, which transforms PV module signals into polar coordinate images, allowing convolutional neural networks (CNNs) to accurately classify fault types [3]. The SDP method is further utilized for the fault diagnosis of PV modules by integrating it with the AlexNet deep learning architecture in another study [4].
Complementing visual methods, thermal analysis plays a vital role in fault detection. Hrach Ayunts et al. developed SlantNet, a lightweight neural network capable of classifying thermal faults in PV modules, even with low-resolution infrared imagery under constrained conditions [5]. Similarly, Sahbi Boubaker et al. proposed a deep learning-based framework using infrared thermography to detect faults such as shading, soiling, short circuits, and bypass diode failures [6]. In parallel, Ramírez et al. suggested a low-cost, non-invasive approach based on radiometric image analysis to identify thermal anomalies linked to electrical issues [7].
Meanwhile, machine learning and IoT technologies have enabled real-time, data-driven fault diagnosis. Mellit et al. proposed an IoT-based system that uses I–V curve features and ensemble classifiers—specifically, decision trees and random forests (RFs)—to detect and classify faults online with high accuracy [8]. Addressing partial shading and electrical mismatches, Raeisi et al. introduced a method combining PSO-based MPPT and intermodule data comparison via wireless communication to identify such conditions in residential PV setups [9]. Additionally, He et al. proposed a fault detection approach for distributed PV systems based on data mining and operational state analysis, enabling the identification of early-stage anomalies through both historical and real-time data [10]. To enhance hardware-integrated detection, Ko et al. combined thermoelectric devices with bypass diodes, allowing their system to distinguish between partial shading and diode failures based on heat-induced power generation, independent of external power sources [11].
Bypass diode faults, often subtle and undetected by conventional monitoring, have also been the subject of extensive study. Dhakshinamoorthy et al. experimentally investigated their operational impacts in a 1.5 kW PV system, revealing measurable power losses and behavioral changes [12]. Hamada et al. examined the failure mechanisms of Schottky and PN junction diodes under surge conditions and further explored how repeated lightning-induced stresses and variations in fault resistance degrade diode integrity, elevate thermal stress, and increase fire risk [13]. Similarly, another study investigated the impact of repetitive lightning surges on Schottky barrier diodes used as bypass diodes in PV modules, revealing that repeated surges significantly reduce fault resistance and may lead to thermal runaway and fire hazards [14]. Complementing this, Shin et al. conducted controlled reverse bias experiments to demonstrate how junction temperature and leakage current accelerate thermal runaway in bypass diodes [15]. Furthermore, it has been shown that bypass diode failures with fault resistance values ranging between 0.1 and 10 Ω can result in substantial heat generation and pose a high risk of module burnout, especially under open-circuit conditions [16].
The electrical consequences of such faults have also been modeled computationally. Ul-Haq et al. showed how diode failures distort I–V characteristics and impair MPPT performance [17], while Mahmoud Dhimish et al. developed both a string-level detection algorithm for open-circuit diode faults and an artificial neural network (ANN) that identifies subtle diode faults under varying irradiance and temperature conditions [18]. To improve classification efficiency, Toche Tchio et al. utilized the Extra Trees ensemble method, which accurately categorizes multiple fault types from electrical measurements with low computational cost [19]. Similarly, Lu et al. converted I–V curves into image formats and applied CNN-based classification to detect diverse fault types with high accuracy [20]. Finally, reflecting the trend toward supervised learning, Aljafari et al. proposed a classification framework based on labeled operational data, employing decision trees and support vector machines (SVMs) to differentiate fault categories in grid-connected PV systems [21].
Collectively, these efforts reveal a growing consensus around hybrid fault diagnosis frameworks that integrate signal transformation, thermal imaging, machine learning, and IoT-based monitoring—offering scalable and intelligent solutions for the reliable operation of PV systems in real-world environments.
To address the diagnostic ambiguity between shading-induced anomalies and bypass diode faults, this study develops a simulation-based framework that integrates detailed I–V curve modeling, targeted feature extraction, and data-driven classification. Rather than pinpointing the exact fault location, the proposed approach focuses on identifying the number of faulty bypass diodes using a reduced and informative feature set derived from extensive simulations. A multilayer ANN is trained for this task and evaluated against SVM and RF models. The structure of this paper is as follows: Section 2 presents the modeling setup and simulation scenarios, including how bypass diode faults and irradiance variations are configured in Simulink. Section 3 describes the generation of I–V curves, the feature extraction process, and the data preprocessing strategy used to enhance classification reliability. Section 4 introduces the ANN model and reports its classification performance in comparison with SVM and RF classifiers. Finally, Section 5 discusses the findings in the context of real-world PV monitoring.
2. Background and Problem Definition
Bypass diodes are essential protective components in PV modules, designed to mitigate the adverse effects of partial shading and local mismatches among solar cells [22,23]. When one or more cells in a module become shaded, their current-limiting behavior can cause significant power losses and localized heating due to mismatch with unshaded cells. Bypass diodes provide an alternate current path around shaded cells or substrings, thereby preventing reverse bias stress and enabling continued energy production from the remaining illuminated cells.
Despite their protective function, bypass diodes themselves are susceptible to various types of faults, most notably short-circuit and open-circuit failures [24,25]. A short-circuited diode becomes permanently conductive, altering the module’s I–V characteristics and potentially masking the presence of shading or further faults. Conversely, an open-circuited diode disables the protective path, leading to increased thermal stress, accelerated degradation, and even safety hazards such as hotspot formation and fire risk. These faults may remain latent and undetected, especially when combined with complex irradiance patterns. The complexity arises from the non-uniform and time-varying nature of irradiance distributions across the array, which can independently cause similar distortions in the I–V curve as those induced by faulty bypass diodes. This overlap in electrical signatures often obscures the root cause of anomalies, making it difficult to differentiate between benign shading effects and critical hardware failures without advanced diagnostic tools. To address this diagnostic ambiguity, this study systematically investigates the impact of different bypass diode fault conditions—under various irradiance distributions—on the electrical behavior of a PV string. A detailed simulation environment is developed in MATLAB/Simulink to emulate partial shading scenarios and assess the system’s behavior [26,27].
2.1. PV Array Configuration and Simulink Setup
The simulation model is developed in MATLAB/Simulink using built-in and custom Simscape blocks to represent PV modules, bypass diodes, and environmental inputs such as irradiance. Irradiance values are independently assigned to each module segment to mimic both uniform and spatially varying shading patterns. Fault conditions are injected by manipulating the switching behavior of bypass diodes, allowing for the simulation of three operational states: normal (healthy), short-circuited, and open-circuited.
The simulated PV system consists of a single string comprising 10 series-connected PV modules, each modeled after the PS-M72-405 monocrystalline solar module [26,27,28]. Each module includes 72 solar cells connected in series, typically divided into three substrings of 24 cells, as shown in Figure 1. Each substring is protected by a bypass diode, as illustrated in Module 1, which serves as the reference module for fault injections. Since each module contains three substrings, a total of 30 irradiance values must be assigned across the array to independently control the illumination conditions of all substrings. In the subsequent analysis, these bypass diodes will be systematically subjected to various fault conditions to evaluate their impact on system-level electrical behavior. For the scope of this study, it is assumed that the bypass diodes in the remaining modules remain fully operational, while a maximum of three bypass diodes—located within the reference module—are subjected to faults simultaneously in the corresponding string.
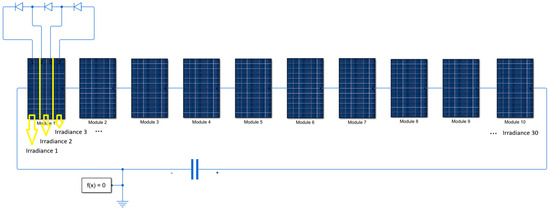
Figure 1.
Proposed Simulink setup.
Under standard test conditions, the module delivers a maximum power output of 405 W, with a maximum power point (MPP) voltage of 41.7 V and a current of 9.72 A. The open-circuit voltage (VOC) and short-circuit current (ISC) are specified as 50.32 V and 10.35 A, respectively [28]. These parameters are used to calibrate the module’s behavior within the Simscape simulation, ensuring realistic I–V responses under varying irradiance and fault conditions.
2.2. Bypass Diode Current Behavior Under Shading
To understand the interaction between irradiance variations and bypass diode faults, this section analyzes the current distribution across bypass diodes and their corresponding submodules under three representative irradiance profiles. In each case, fault conditions are selectively introduced into the bypass diodes of Module 1, while all other modules in the string remain normal. The three scenarios are chosen to reflect increasing levels of non-uniformity in irradiance:
- Scenario A: Uniform irradiance of 1000 W/m2 applied to all 30 submodules.
- Scenario B: Non-uniform irradiance with the first module receiving 400 W/m2, the next one-third of the string receiving 700 W/m2, and the remaining two-thirds receiving 600 W/m2.
- Scenario C: Non-uniform low irradiance where the first module receives 100 W/m2, followed by half of the string at 200 W/m2 and the rest at 300 W/m2.
The 27 distinct fault cases listed in Table 1 represent all possible combinations of operational states—normal, short-circuited, and open-circuited—for the three bypass diodes in Module 1. Each case is defined by a unique permutation of diode states, allowing for a comprehensive evaluation of how different fault cases influence the current behavior across the bypass paths and their associated submodules. Figure 2, Figure 3 and Figure 4 illustrate the current behavior of each bypass diode in Module 1 and its corresponding submodule under three irradiance conditions defined as Scenario A, B, and C. Each figure consists of 27 rows, corresponding to the fault cases listed in Table 1, with three columns representing the current through Diode 1, Diode 2, and Diode 3 alongside their respective submodule currents.

Table 1.
All possible fault state combinations of the three bypass diodes in Module 1.
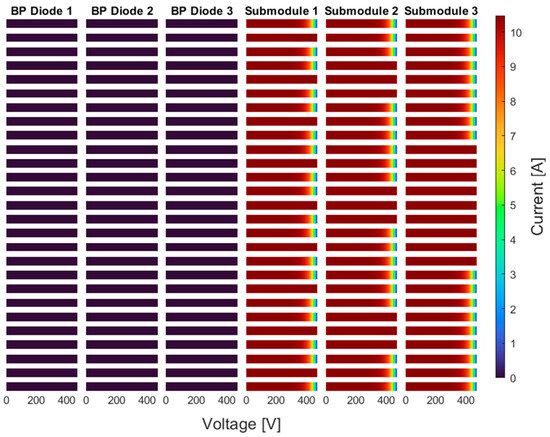
Figure 2.
Bypass diode and submodule currents of the first PV module under Scenario A.
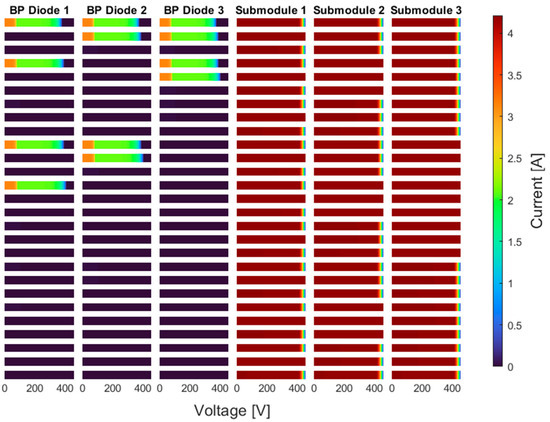
Figure 3.
Bypass diode and submodule currents of the first PV module under Scenario B.
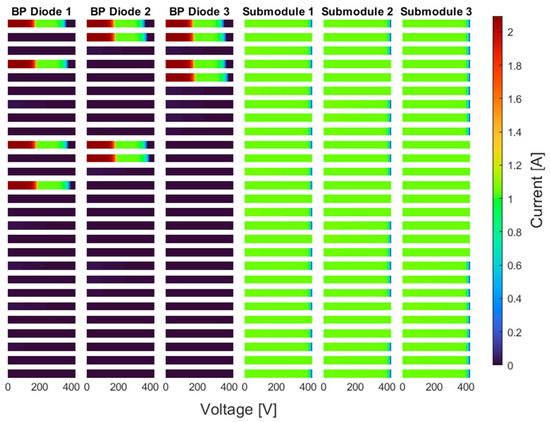
Figure 4.
Bypass diode and submodule currents of the first PV module under Scenario C.
In Scenario A, where all submodules receive a uniform irradiance of 1000 W/m2, the impact of diode faults on current profiles is isolated from any shading-related variation. Under this condition, no significant differences are observed in the bypass diode current profiles across different fault cases. The bypass diode currents remain effectively inactive, regardless of the fault state. Correspondingly, the submodule currents exhibit two distinct behaviors: in faulty cases, each submodule delivers the same current regardless of its operating voltage; in fault-free cases, the submodule currents follow the standard I–V characteristics of the PV module under uniform irradiance. As a result, under uniform irradiance, short-circuit faults prevent the associated submodule from operating properly, while open-circuit faults do not affect the overall performance of the submodule.
In Scenario B, where the first module receives 400 W/m2, the next one-third of the string receives 700 W/m2, and the remaining two-thirds receive 600 W/m2. Irradiance variation introduces measurable differences in both bypass diode and submodule currents. The current through normal bypass diodes varies depending on both the shading level and the operating voltage of the submodule; as the terminal voltage drops, a larger portion of the submodule current is diverted through the corresponding bypass diode. In contrast, short-circuited diodes exhibit no current conduction, as seen in Case 2, where the affected submodule is effectively deactivated by the fault condition.
Moreover, it is observed that if any one of the three bypass diodes in the module is open-circuited, the currents through all three diodes drop to zero, regardless of the fault states of the other two. This behavior is evident in Cases 3, 6, and 9, where an open-circuit fault in one diode disables all bypass paths within the module. These effects are clearly visible in the corresponding rows of Figure 3. Regarding submodule currents, two distinct behaviors are observed. In cases where a bypass diode is short-circuited, the current through the corresponding submodule becomes independent of the operating voltage and remains fixed. This behavior is prominent in Case 14, where all three submodules exhibit flat current profiles. In all other cases—particularly when diodes are either healthy or open-circuited—the submodule currents follow the typical nonlinear I–V characteristics of PV cells under partial shading.
In Scenario C, where the first module receives 100 W/m2, half of the string receives 200 W/m2, and the remaining receive 300 W/m2, low irradiance is assumed, as compared to the previous scenarios. This results in significantly reduced photocurrents across the submodules. Similar observations to Scenario B can be made in this scenario as well; however, the variation in irradiance distribution and the change in shading intensity directly influence the magnitude of the observed currents, as illustrated in Figure 4. In particular, the voltage threshold at which a healthy bypass diode becomes active—and the amount of current it conducts—varies depending on the shading level and submodule mismatch conditions. Although the activation behavior of each diode shifts with irradiance, the resulting current profiles often overlap across different fault conditions. As such, it becomes increasingly difficult to reliably distinguish between healthy, short-circuited, and open-circuited bypass diodes based solely on current waveforms under severe partial shading.
This complexity emphasizes the importance of analyzing complete I–V curves rather than isolated current values, as they provide more comprehensive insight into the operating state of each submodule and its associated bypass diode. Detailed I–V characteristics form the basis for reliable pattern extraction and subsequent data-driven classification, which is addressed in the following sections.
3. I-V Curve-Based Data Generation Under Partial Shading
In modern PV systems, I–V curve tracing is no longer limited to laboratory instrumentation; many commercial inverters are now equipped with built-in curve tracing functionalities that allow for the periodic acquisition of I–V characteristics during operation [29,30]. This development increases the relevance and applicability of I–V-based diagnostic approaches in real-world installations.
In this section, a comprehensive dataset is generated based on the simulated I–V characteristics of the so-called PV string subjected to partial shading and bypass diode faults. Each simulation case combines a specific irradiance profile with one of the 27 predefined fault configurations applied to the bypass diodes of Module 1. The resulting I–V curves capture the electrical behavior of the PV string under different operating conditions and serve as the foundation for supervised learning and fault classification.
3.1. I-V Curve Analysis Across Fault Conditions
To investigate the combined effects of partial shading and bypass diode faults on the electrical behavior of the PV string, six representative I–V curves are analyzed in this subsection. Each curve corresponds to a specific irradiance distribution and a defined fault configuration applied to the three bypass diodes in Module 1. These cases are selected to cover a wide range of fault scenarios, including short-circuit, open-circuit, and normal states, under varying irradiance conditions. The analyzed cases include the following:
- Three cases (Figure 5, Figure 6 and Figure 7) with all fault combinations for fixed irradiance profiles.
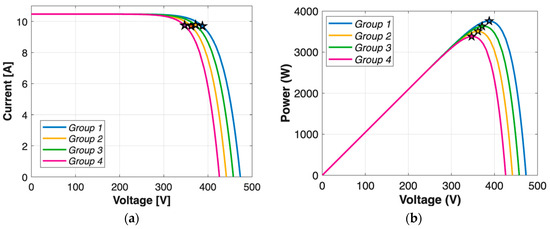 Figure 5. (a) I-V curves and (b) P-V curves of the PV string under uniform irradiance of 1000 W/m2.
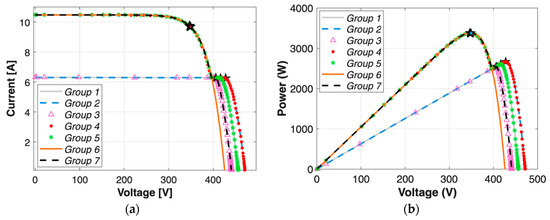 Figure 6. (a) I–V curves and (b) P-V curves of the PV string under spatially varying irradiance: 600 W/m2 on the first module and 1000 W/m2 on the remaining modules.
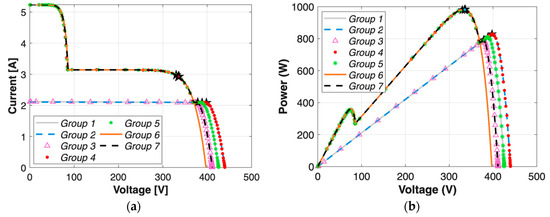 Figure 7. (a) I–V curves and (b) P-V curves of the PV string under spatially varying irradiance: 200 W/m2 on the first module, 500 W/m2 on the next one-third, and 300 W/m2 on the remaining two-thirds.
 - Three cases (Figure 8, Figure 9 and Figure 10) with a fixed fault case under different irradiance distributions.
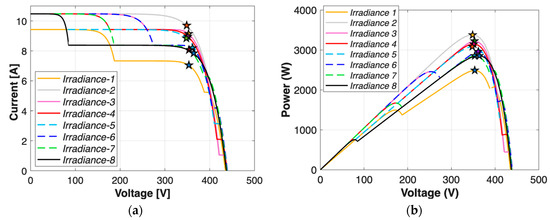 Figure 8. (a) I–V curves and (b) P-V curves of the PV string under varying irradiance conditions for the bypass diode fault case: BP Diodes 1 and 2 are short-circuited, while BP Diode 3 remains healthy.
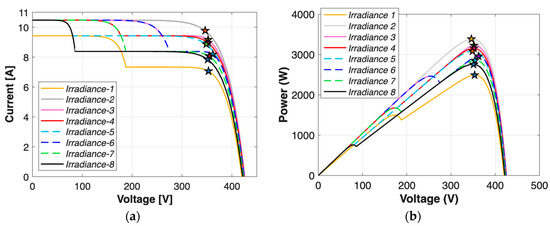 Figure 9. (a) I–V curves and (b) P-V curves of the PV string under varying irradiance conditions for the bypass diode fault case: all BP Diodes are short-circuited.
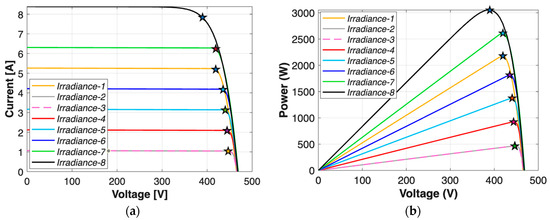 Figure 10. (a) I–V curves and (b) P-V curves of the PV string under varying irradiance conditions for the bypass diode fault case: BP Diode 2 is open-circuited, while BP Diodes 1 and 3 remain intact.
These curves collectively demonstrate the extent to which different faults and shading combinations affect the global MPP, which is the most commonly monitored parameter in commercial PV inverters. While the analysis primarily focuses on changes in the global MPP, the presence of local maximum and extreme points such as VOC and ISC will also be examined, as they may provide additional insight into the underlying fault conditions.
In Figure 5, where uniform irradiance (1000 W/m2) is applied to all submodules, the effects of bypass diode faults appear in their purest form, without interference from shading mismatch. Under this condition, the 27 fault cases lead to the emergence of only four distinct I–V curve profiles, as reflected in the four groups defined in Table 2. Notably, Group 3 alone contains 14 different cases, all resulting in an identical I–V curve and consequently sharing the same global MPP current and voltage. This overlap illustrates that even under uniform conditions, several fault combinations can produce indistinguishable electrical signatures. Although each group exhibits unique global MPP voltage and current values, the variations among them are not sufficient to clearly distinguish individual fault cases.

Table 2.
Fault case grouping of I–V and P-V curves for different irradiance scenarios.
In Figure 6, the PV string is subjected to a spatially varying irradiance profile, where the first module receives 600 W/m2, while the remaining modules operate under uniform 1000 W/m2 conditions. Compared to the uniform case in Figure 5, this partial shading condition introduces more deviations in the I–V and P–V curves, particularly in current magnitude. The 27 fault cases again form seven distinct I–V and P–V curve groups, as shown in Table 2. Notably, Group 4 (Case 1) represents the ideal case with no faults, showing the most intact curve. In contrast, Group 6 (Case 14) shows the most degraded behavior, as it corresponds to the scenario where all three bypass diodes are short-circuited, resulting in a steep voltage reduction. While the number of unique I–V and P–V curve shapes increase compared to the uniform scenario, multiple fault cases still share nearly identical profiles, such as the ten cases in Group 1, indicating that fault signature overlap remains a significant challenge.
In Figure 7, where a highly non-uniform irradiance profile is applied (200 W/m2, 500 W/m2, and 300 W/m2), the resulting I–V and P–V curves exhibit similar patterns compared to the previous scenario, except for the reduced current magnitudes and the appearance of two distinct steps in the curves, which indicate local MPPs. Accordingly, the 27 fault cases are clustered into seven distinct groups, as shown in Table 2. While the location of the global MPP voltage remains similar to the previous scenario, the current levels demonstrate notable differences. Moreover, many of these groups exhibit very close MPP voltages and currents, resulting in overlapping or visually indistinguishable curves in the global MPP region.
This analysis underscores the diagnostic limitations of relying solely on global MPP metrics—whether under uniform or non-uniform irradiance—since shading further obscures the ability to distinguish between distinct bypass fault types using only curve morphology or global MPP parameters. To further investigate this ambiguity, the next section explores how the same bypass fault configuration behaves under different irradiance profiles. Table 3 presents the irradiance scenarios applied to the 30 submodules across the PV string. To realistically emulate field conditions, the irradiance levels for the nine healthy modules (i.e., the last 27 submodules) are constrained to a maximum variation of 200 W/m2, under the assumption that they are exposed to relatively similar environmental conditions. In contrast, the first module, which is designated for fault injection in each scenario, is deliberately subjected to a broader range of irradiance levels. This design enables an analysis of how bypass diode faults behave under various local shading conditions, independent of the overall string behavior. Each scenario defines a distinct spatial distribution across the string, divided into fractional segments (e.g., first module, 1/3, 2/3) to systematically control non-uniformity. Given the large number of possible combinations, it is not feasible to individually present and analyze all cases; therefore, representative scenarios are selected to illustrate key behaviors and patterns.

Table 3.
Irradiance scenarios applied to the 30 submodules.
Figure 8, Figure 9 and Figure 10 present the I–V and P–V characteristics of a PV string under different irradiance conditions for three distinct bypass diode fault scenarios—specifically, Case 5, Case 15, and Case 27. A key observation across all figures is that the global MPP voltage tends to cluster within a narrow range, regardless of irradiance variation, indicating that voltage alone is insufficient to differentiate fault types under shading conditions. However, differences in current magnitudes and the shape of the curve—particularly the number and location of local MPPs—provide additional insights. For instance, in Figure 9, where all bypass diodes are short-circuited, local maxima are less pronounced, and VOC is lower. On the other hand, Figure 10 shows that when one bypass diode is open-circuited, the resulting VOC is significantly higher, and the I–V curves are truncated due to current limitation, especially under lower irradiance. This suggests that Isc becomes a distinguishing parameter in such cases. Comparing Figure 9 and Figure 10 also highlights how even a single change in bypass diode condition can alter the number and placement of local MPPs, as well as VOC, reinforcing the importance of including local features and multiple electrical indicators in fault classification strategies. Accordingly, a total of 11 features will be used in the classification process, namely global MPP voltage, global MPP current, global MPP power, local MPP voltages, currents and powers for maximum of two peaks, open-circuit voltage, and short-circuit current.
3.2. Data Generation and Preprocessing
Given the complexity of the problem, identifying the exact location and type of fault in individual bypass diodes proves to be highly challenging—especially under varying irradiance conditions that further obscure fault signatures. Therefore, instead of attempting to classify each specific fault combination, the number of faulty bypass diodes within the string is selected as the classification target. This reformulation simplifies the problem into a multiclass classification task, where the output labels correspond to the total number of faulty diodes (0, 1, 2, or 3), regardless of their exact position or fault type. An additional advantage of this approach is that it enables the detection of up to three simultaneous diode faults without requiring knowledge of the exact module or substring location, making the model more scalable and robust for practical PV systems.
To generate a diverse and physically consistent dataset for model training and evaluation, synthetic irradiances are created for both training and test scenarios. Each simulation considered a PV string composed of ten modules, each divided into three submodules as mentioned before. Of these, only one module is designated as faulty, with the remaining nine assumed to be fully functional.
For the training dataset, irradiance profiles for the nine healthy modules are designed to model cases in which the modules receive similar irradiance levels—as is often the case when they are physically adjacent and oriented identically. Accordingly, irradiance values were selected from 100 W/m2 to 1000 W/m2 in 100 W/m2 increments, and spatial variation among the 27 submodules is limited to at most 200 W/m2. The maximum spatial variation of 200 W/m2 reflects the typical uniformity observed in physically adjacent, identically oriented modules, ensuring consistency with real-world proximity-based irradiance distributions. Controlled spatial variation is introduced by segmenting the 27 submodules (belonging to healthy modules) into different proportions, such as 1/3–2/3 and 1/2–1/2 splits, with irradiance differences not exceeding 200 W/m2. This provides representative yet bounded heterogeneity without introducing unrealistic shading patterns. The faulty module, on the other hand, is subjected to a broader range of irradiance levels—limited only by the minimum irradiance applied to the healthy modules in that scenario. In this regard, the influence of bypass diode fault modes is isolated from shading-induced effects. All three submodules of the faulty module received the same irradiance value, and this value is varied systematically to observe its interaction with different bypass fault combinations. This design ensures that the simulation space remains both physically meaningful and sufficiently diverse for robust ANN training. For each irradiance scenario, all 27 possible fault combinations of the three bypass diodes (normal, short-circuited, open-circuited) are applied, resulting in a rich and diverse simulation set. The test dataset is generated using a distinctly different irradiance scheme to ensure non-overlapping conditions between the training and evaluation phases. Here, irradiance values are selected from 150 W/m2 to 950 W/m2, in 200 W/m2 increments, maintaining the same structural distribution logic but producing an entirely different irradiance composition. This deliberate separation prevents the memorization of irradiance patterns and ensures that the ANN is evaluated under unseen, yet physically consistent, operating conditions. As a result, the final dataset comprises 8046 training samples and 2045 test samples.
Figure 11 presents the histograms of the 11 input features, combining both training and test datasets. These distributions provide insight into the role and frequency of each feature across the simulated scenarios. The dataset consists of 8046 training instances and 2045 test instances, covering a wide variety of irradiance and fault conditions. Notably, the global MPP voltage, current, and power exhibit wide and diverse distributions. This reflects the fact that the global MPP is consistently present across nearly all cases, making these features central to the model’s classification performance. In contrast, the local-1 and local-2 MPP voltages, currents, and powers are heavily concentrated at or near zero, indicating that in many scenarios, no secondary local peaks exist. This is expected in cases with uniform irradiance or minimal mismatch, where only a single global maximum dominates. However, the presence of non-zero values in these histograms shows that under certain shading and fault combinations, local MPPs do appear and may provide useful information for classification. Therefore, while sparse, these features can be critical in identifying complex fault conditions involving multiple bypass diode failures or severe irradiance gradients. VOC and ISC also show broad and structured distributions. VOC reflects the total voltage potential of the string and varies depending on fault locations and module mismatch, while ISC is directly influenced by irradiance levels and acts as a strong indicator of current-limiting conditions, especially under open-circuit fault cases.
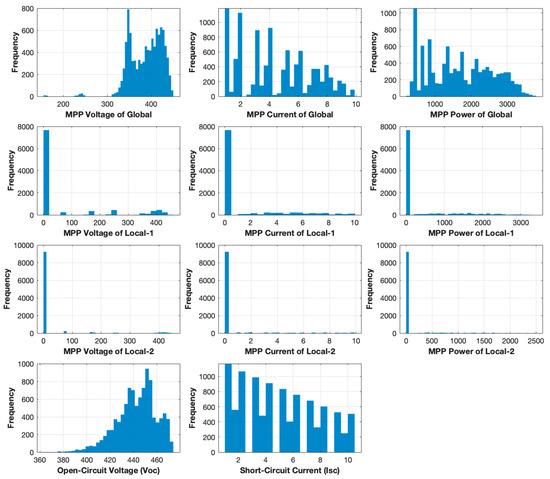
Figure 11.
Histograms of input features before data preprocessing.
Building on the insights from the feature distributions, it is important to address a key challenge associated with the dataset generated: the presence of redundant or ambiguous samples, where different input combinations may correspond to the same target output (i.e., number of faulty bypass diodes). As previously discussed, this is an inherent consequence of the physical behavior of PV strings under varying irradiance and fault conditions, where different I–V curve shapes may result in similar feature vectors—especially when local MPPs are absent or negligible.
To mitigate the impact of such redundancy and improve the generalization capability of the ANN, a preprocessing step is applied to eliminate highly similar or duplicate input instances. In this step, feature vectors that are nearly identical (based on Euclidean distance thresholding in the normalized feature space) are grouped, and only a single representative sample from each group is retained in the training set. Among the grouped instances, the minimum number of faulty bypass diodes is assigned as the target label for the retained representative. This conservative approach reduces the risk of overestimating the fault severity in ambiguous cases while preserving the diversity of meaningful patterns. This preprocessing strategy ensures that the ANN is trained on a more compact, non-redundant, and physically consistent dataset, enhancing both training efficiency and fault classification reliability. After preprocessing, the training set was reduced from 8046 to 3151 samples and the test set from 2045 to 840 samples. Figure 12 shows the histograms of the ANN inputs after applying the described preprocessing step. Compared to Figure 11, it is evident that the essential diversity of the dataset is preserved, while redundant and highly similar instances are removed. The global MPP features retain their broad and informative distributions, whereas the concentration at zero for local MPP features is slightly reduced due to the elimination of uninformative duplicates. This confirms that the refined dataset still captures the full range of physically meaningful scenarios while improving learning efficiency and reducing classification bias.
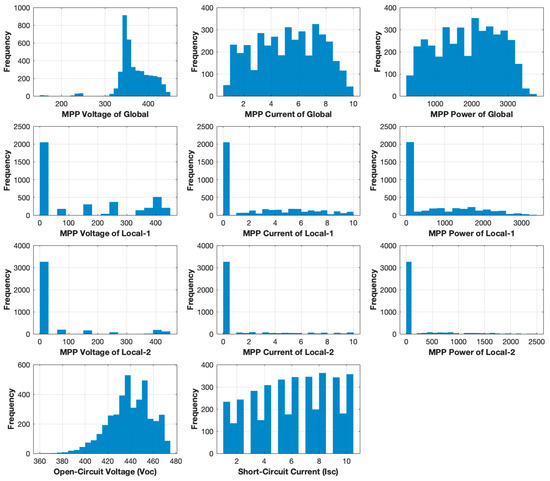
Figure 12.
Histograms of input features after data preprocessing.
4. Proposed ANN-Based Classification Model
An ANN-based classification model is developed to accurately identify the operational categories of PV strings under partial shading conditions. The ANN is selected primarily due to its strong capability to learn complex, nonlinear relationships between inputs and outputs without requiring explicit physical modeling [31]. In PV fault detection and classification tasks, the mapping between electrical measurements (e.g., I–V curve features) and fault categories is inherently nonlinear and can be influenced by multiple interacting variables, such as irradiance, temperature, and fault mode. ANNs have been widely demonstrated to excel in such contexts, offering the following:
- High adaptability to different operating conditions without the need for rule-based reconfiguration.
- Superior generalization when trained with sufficiently diverse datasets, enabling robust performance under unseen scenarios.
- Tolerance to noisy or partially redundant features, which is particularly beneficial when working with real-world PV data.
Compared with other AI approaches such as SVMs or decision tree ensembles, ANNs can more effectively capture subtle multi-dimensional boundaries between classes when the dataset contains overlapping feature distributions. Moreover, their architecture can be scaled to match problem complexity, which is advantageous for the multiclass classification of various bypass diode fault combinations. These advantages have been consistently reported in the literature, where ANNs have been successfully applied to PV fault detection, classification, and performance modeling [32,33,34,35,36].
The architecture of the proposed ANN is specifically designed to capture nonlinear relationships in the input features, while the training process is optimized to ensure fast convergence and generalization capability. To assess the model’s effectiveness, its learning behavior and classification performance are first analyzed in detail. Then, a comparative evaluation is conducted against two established machine learning classifiers—SVM and RF—using test data. Key performance indicators such as classification accuracy, confusion matrices, and the area under the receiver operating characteristic (ROC) curve (AUC) are used to benchmark the methods. This analysis aims to demonstrate the relative advantages of the ANN approach in terms of both predictive power and model robustness.
4.1. Network Structure and Training Performance
The proposed classification model is built upon a multilayer ANN architecture, as illustrated in Figure 13. The network receives 11 input features and produces four output classes corresponding to distinct operating conditions of the PV system. It consists of three hidden layers, each containing 100 neurons. The hidden layers utilize the hyperbolic tangent sigmoid transfer function (tansig), while the output layer employs the softmax function to enable multiclass classification. The training process is carried out using the scaled conjugate gradient backpropagation algorithm (trainscg), which offers a favorable trade-off between speed and memory efficiency. As shown in Figure 14, the network is trained for approximately 260 epochs, with the training, validation, and test losses gradually decreasing and eventually stabilizing at low cross-entropy values. This convergence behavior indicates successful learning without significant overfitting, as also evidenced by the close proximity of the validation and test loss curves to the training curve.

Figure 13.
Proposed ANN structure.
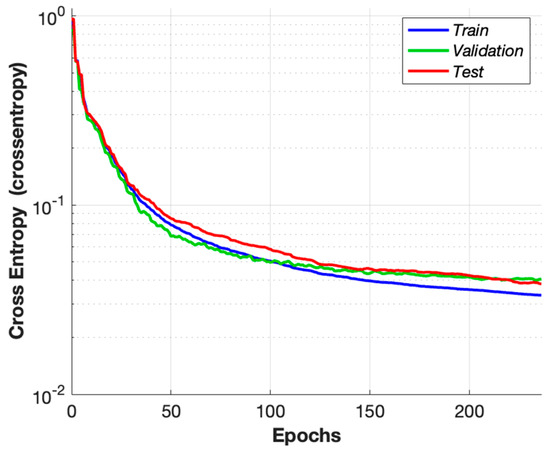
Figure 14.
The training performance of the proposed ANN.
To further investigate the error dynamics, Figure 15a presents an error histogram for all data partitions. The majority of the prediction errors cluster tightly around zero, confirming that the network outputs closely match the target values across the dataset. Additionally, the test set’s ROC curves are depicted in Figure 15b. The AUC values are remarkably high, with Class 1 achieving a perfect score of 1.00 and the remaining classes closely following at 0.99. These results demonstrate the model’s strong discriminative capability across all categories.
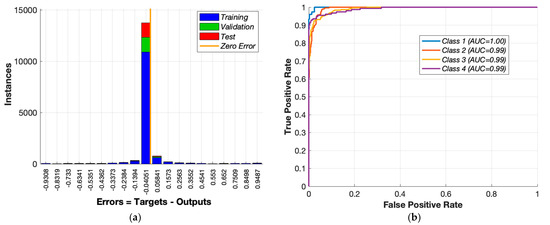
Figure 15.
(a) Error histogram and (b) ROC curves for test data of proposed ANN.
The confusion matrices in Figure 16 further support the network’s effectiveness, revealing that all four classes are learned with high precision. Although minor confusion is observed between Class 2 and Class 3 in both the training and test sets, the overall diagonal dominance confirms that class boundaries are successfully captured. This consistent behavior across both datasets indicates that the ANN model generalizes well and is robust to potential overlaps in feature space.
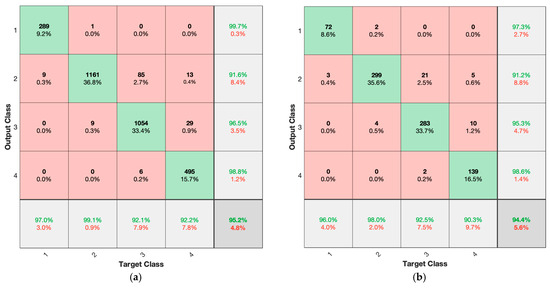
Figure 16.
Confusion matrix of (a) training data and (b) test data.
4.2. Comparative Evaluation with Other Methods
To assess the classification performance of the proposed ANN model, two commonly used machine learning methods—SVM and RF—are implemented under identical data preprocessing, feature selection, and train–test partitioning conditions. This ensures a fair and consistent basis for comparison.
The test set ROC curves of the three classifiers are shown in Figure 15b (ANN) and Figure 17 (SVM and RF). The ANN model achieved near-perfect class separability, with all four classes having AUC values of 0.99 or higher, including a perfect score of 1.00 for Class 1. The SVM classifier follows closely, with AUC scores ranging from 0.96 to 1.00. In contrast, the RF model exhibits slightly lower AUC values, particularly for Class 3 and Class 4, where the AUC drop to approximately 0.95–0.96. These results suggest that both the ANN and SVM effectively learn the class boundaries, whereas RF shows relatively weaker separation for certain classes.
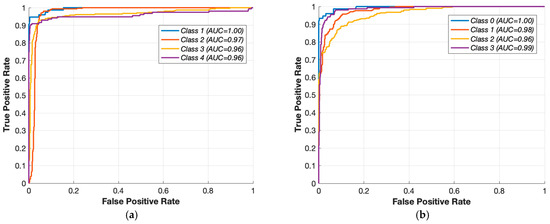
Figure 17.
ROC for test data for (a) SVM and (b) RF.
The confusion matrices presented in Figure 18 (SVM) and Figure 19 (RF) further highlight the classification behavior of each model. The ANN achieves a training accuracy of 95.18% and a test accuracy of 93.57%, indicating good generalization. The SVM classifier demonstrates consistent performance across both datasets, with 94.00% training accuracy and 92.98% on the test set. Although the RF model yields the highest training accuracy at 99.52%, its test accuracy drops significantly to 87.74%, revealing a higher risk of overfitting. This discrepancy is particularly evident in the confusion matrix of Figure 19b, where Class 4 exhibits a marked decrease in prediction accuracy compared to the training phase.
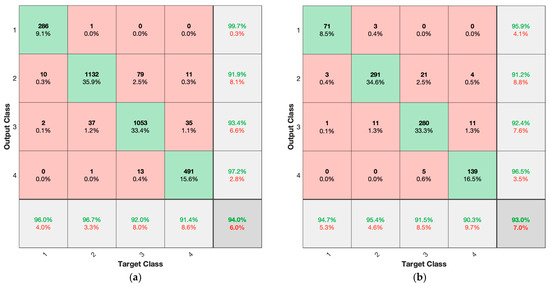
Figure 18.
Confusion matrix for (a) training and (b) test data for SVM.
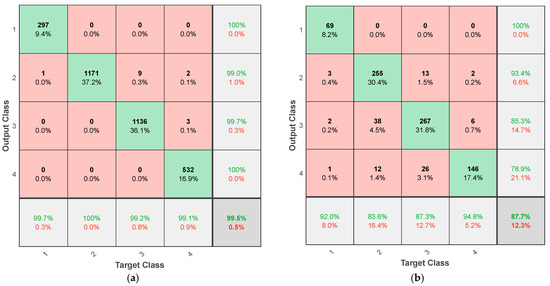
Figure 19.
Confusion matrix for (a) training and (b) test data for RF.
A summary of the performance metrics is provided in Table 4. As shown, the ANN outperforms the other methods in both test accuracy and average AUC while maintaining a balanced generalization profile. The SVM is a competitive alternative with a comparable AUC and slightly lower test accuracy. The RF, although strong in fitting training data, demonstrates limited generalization capability when exposed to unseen samples.

Table 4.
Classification performance comparison of methods.
5. Discussion and Results
This study presented a comprehensive analysis of bypass diode faults in PV systems under partial shading conditions, highlighting the diagnostic challenges posed by overlapping electrical signatures. Through extensive simulations in MATLAB/Simulink, a wide range of distinct fault cases spanning all combinations of short circuited, open-circuited, and healthy diodes are examined across multiple irradiance scenarios.
The resulting I–V curves revealed that many fault conditions yield similar electrical behaviors, especially in terms of global MPP voltage and current, complicating traditional rule-based diagnosis.
To overcome this ambiguity, a data-driven classification strategy is proposed, focusing on the total number of faulty bypass diodes rather than their specific types or locations. A rich synthetic dataset is generated, and a carefully selected set of characteristic electrical features is extracted from simulated I–V curves. After redundancy reduction through data preprocessing, a multilayer ANN is trained and tested, achieving high classification accuracy and an excellent level of discriminative performance. Comparative analysis against SVM and RF classifiers demonstrated the ANN’s superior generalization ability and robustness, particularly under partial shading conditions. As presented in Table 4, the differences between training and test accuracy for the ANN (95.18% vs. 93.57%) and SVM (94.00% vs. 92.98%) are minimal, remaining below 2%, which indicates that both models maintain their performance when evaluated on unseen data. Furthermore, the AUC values for the ANN (0.9925) and SVM (0.9800) on the independent test dataset are consistently high, confirming that their predictive performance is stable across all classes. This contrasts with the RF classifier, which shows a much larger train–test gap (99.52% vs. 87.74%) and a noticeably lower AUC (0.9725), suggesting a higher tendency toward overfitting. From a methodological perspective, SVMs inherently possess strong generalization capabilities due to the margin maximization principle [37], which reduces the risk of overfitting when proper regularization is applied. Similarly, ANNs, when trained with early stopping, suitable regularization techniques, and adequate training data, can achieve robust generalization performance [38]. In our study, early stopping is implemented based on validation loss. These strategies, combined with the small accuracy gap and high AUC values, justify the “Low” overfitting risk label for both the ANN and SVM and support their classification as models with high generalization capability in Table 4.
In terms of the performance of the proposed ANN, the validation loss remains slightly higher than the training loss after epoch 100, but this behavior is normal and expected in well-generalized ANNs and does not in itself indicate harmful overfitting. Overfitting is typically characterized by a divergence of validation loss from the training loss, degradation of validation accuracy, and poor performance on unseen data [38]. In our case, the gap between training and validation losses after epoch 100 is minimal (<0.01 in cross-entropy on a logarithmic scale), and the validation loss remains stable without upward drift. Furthermore, both the validation and test datasets are entirely independent from the training set, and the model achieved over 90% accuracy on both, demonstrating strong generalization capability. This is further supported by the confusion matrices in Figure 16, where class-wise accuracies on the training set (92.1–99.1%) and test set (90.3–98.6%) show only marginal differences, far from the large performance drops typically seen in overfitted models. In addition, no single class exhibits a collapse in recognition performance on unseen data. Taken together, the stability of the validation loss, the high and balanced classification rates across all datasets, and the small accuracy gap between the training and test sets confirm that the proposed ANN is not overfitted and generalizes well to new data.
Importantly, the approach aligns well with current technological trends, as many modern PV inverters now support integrated I–V curve tracing. This facilitates the seamless integration of the proposed classification model into real-time monitoring platforms without additional hardware. Moreover, by abstracting the diagnosis target to fault count rather than specific positions, the model remains scalable and practical for large PV arrays.
In real-world PV operation, while multiple module failures can occur over the system’s lifetime, the probability of more than three bypass diodes failing simultaneously in the same string is very low. This is because bypass diode failures often develop progressively rather than instantaneously. As reported in [39], when a bypass diode fails in the open-circuit mode, it can cause a hotspot in the substring, which over time may lead to further open-mode failures due to excessive forward current. Conversely, in the short-circuit failure mode, the module voltage drops, making simultaneous open-mode failures in other diodes highly unlikely. Furthermore, since each module typically contains only three bypass diodes, large-scale simultaneous failures would generally require severe and uncommon external stress factors (e.g., lightning strikes or extreme hotspots) [40]. Therefore, under similar irradiance conditions, the I–V characteristics resulting from three bypass diode failures in a single module are nearly equivalent to those from one bypass diode failure in each of three different modules, meaning that the simulated scenario sufficiently captures the worst-case electrical behavior expected in typical field conditions.
Future work may include field validation under dynamic conditions or integration with cloud-based diagnostic services for enhanced fault localization and predictive maintenance.
Funding
This research received no external funding.
Institutional Review Board Statement
Not applicable.
Informed Consent Statement
Not applicable.
Data Availability Statement
Data is contained within this article.
Conflicts of Interest
The authors declare that they have no known competing financial interests or personal relationships that could have appeared to influence the work reported in this paper.
Abbreviations
The following abbreviations are used in this manuscript:
| PV | Photovoltaic |
| BP | Bypass |
| I-V | Current–voltage |
| MPP | Maximum power point |
| ANN | Artificial neural network |
| SVM | Support vector machine |
| RF | Random forest |
| CNN | Convolutional neural network |
| AUC | Area under curve |
| ROC | Receiver operating characteristic |
References
- Niazi, K.A.K.; Kerekes, T.; Dolara, A.; Yang, Y.; Leva, S. Performance assessment of mismatch mitigation methodologies using field data in solar photovoltaic systems. Electronics 2022, 11, 1938. [Google Scholar] [CrossRef]
- Niazi, K.A.K.; Yang, Y.; Kerekes, T.; Sera, D. Reconfigurable distributed power electronics technique for solar PV systems. Electronics 2021, 10, 1121. [Google Scholar] [CrossRef]
- Wang, M.-H.; Lin, Z.-H.; Lu, S.-D. A fault detection method based on CNN and symmetrized dot pattern for PV modules. Energies 2022, 15, 6449. [Google Scholar] [CrossRef]
- Wang, M.-H.; Hung, C.-C.; Lu, S.-D.; Lin, Z.-H.; Kuo, C.-C. Fault diagnosis for PV modules based on AlexNet and symmetrized dot pattern. Energies 2023, 16, 7563. [Google Scholar] [CrossRef]
- Ayunts, H.; Agaian, S.; Grigoryan, A. SlantNet: A lightweight neural network for thermal fault classification in solar PV systems. Electronics 2025, 14, 1388. [Google Scholar] [CrossRef]
- Boubaker, S.; Kamel, S.; Ghazouani, N.; Mellit, A. Assessment of machine and deep learning approaches for fault diagnosis in photovoltaic systems using infrared thermography. Remote. Sens. 2023, 15, 1686. [Google Scholar] [CrossRef]
- Ramirez, I.S.; Das, B.; Marquez, F.P.G. Fault detection and diagnosis in photovoltaic panels by radiometric sensors embedded in unmanned aerial vehicles. Prog. Photovolt. Res. Appl. 2022, 30, 240–256. [Google Scholar] [CrossRef]
- Mellit, A.; Herrak, O.; Casas, C.R.; Pavan, A.M. A machine learning and internet of things-based online fault diagnosis method for photovoltaic arrays. Sustainability 2021, 13, 13203. [Google Scholar] [CrossRef]
- Raeisi, H.A.; Sadeghzadeh, S.M. A novel experimental and approach of diagnosis, partial shading, and fault detection for domestic purposes photovoltaic system using data exchange of adjacent panels. Int. J. Photoenergy 2021, 2021, 9956433. [Google Scholar] [CrossRef]
- He, W.; Yin, D.; Zhang, K.; Zhang, X.; Zheng, J. Fault detection and diagnosis method of distributed photovoltaic array based on fine-tuning naive Bayesian model. Energies 2021, 14, 4140. [Google Scholar] [CrossRef]
- Ko, J.; Kim, C.; Lee, D.; Lee, S.; Shin, W.G.; Kang, G.H.; Oh, J.; Ko, S.W.; Song, H.-J. Real-time detection and classification of bypass diode-related faults in photovoltaic modules via thermoelectric devices. Adv. Mater. Technol. 2024, 9, 2301209. [Google Scholar] [CrossRef]
- Dhakshinamoorthy, M.; Sundaram, K.; Murugesan, P.; David, P.W. Bypass diode and photovoltaic module failure analysis of 1.5 kW solar PV array. Energy Sources Part A 2022, 44, 4000–4015. [Google Scholar] [CrossRef]
- Hamada, T.; Nakamoto, K.; Nanno, I.; Fujii, M.; Oke, S.; Ishikura, N. Characteristics of failure Schottky barrier diode and PN junction diode for bypass diode using induced lightning serge test. In Proceedings of the 7th International Conference on Renewable Energy Research and Applications (ICRERA), Paris, France, 14–17 October 2018. [Google Scholar]
- Hamada, T.; Nakamoto, K.; Nanno, I.; Ishikura, N.; Oke, S.; Fujii, M. Fault characteristics of Schottky barrier diode used as bypass diode in photovoltaic module against repetitive surges. In Proceedings of the 47th IEEE Photovoltaic Specialists Conference (PVSC), Calgary, AB, Canada, 15–21 August 2020. [Google Scholar]
- Shin, W.G.; Ko, S.W.; Song, H.J.; Ju, Y.C.; Hwang, H.M.; Kang, G.H. Origin of bypass diode fault in c-Si photovoltaic modules: Leakage current under high surrounding temperature. Energies 2018, 11, 2416. [Google Scholar] [CrossRef]
- Hamada, T.; Azuma, T.; Nanno, I.; Ishikura, N.; Fujii, M.; Oke, S. Impact of bypass diode fault resistance values on burnout in bypass diode failures in simulated photovoltaic modules with various output parameters. Energies 2023, 16, 5879. [Google Scholar] [CrossRef]
- Ul-Haq, A.; Fahad, S.; Gul, S.; Bo, R. Intelligent control schemes for maximum power extraction from photovoltaic arrays under faults. Energies 2023, 16, 974. [Google Scholar] [CrossRef]
- Dhimish, M.; Chen, Z. Novel open-circuit photovoltaic bypass diode fault detection algorithm. IEEE J. Photovolt. 2019, 9, 1819–1827. [Google Scholar] [CrossRef]
- Toche Tchio, G.M.; Kenfack, J.; Voufo, J.; Mindzie, Y.A.; Njoya, B.F.; Ouro-Djobo, S.S. Diagnosing faults in a photovoltaic system using the Extra Trees ensemble algorithm. AIMS Energy 2024, 12, 727–750. [Google Scholar] [CrossRef]
- Lu, S.-D.; Wang, M.-H.; Wei, S.-E.; Liu, H.-D.; Wu, C.-C. Photovoltaic module fault detection based on a convolutional neural network. Processes 2021, 9, 1635. [Google Scholar] [CrossRef]
- Aljafari, B.; Satpathy, P.R.; Thanikanti, S.B.; Nwulu, N. Supervised classification and fault detection in grid-connected PV systems using 1D-CNN: Simulation and real-time validation. Energy Rep. 2024, 12, 2156–2178. [Google Scholar] [CrossRef]
- Fauzan, L.; Sim, Y.H.; Yun, M.J.; Choi, H.; Lee, D.Y.; Cha, S.I. Power from shaded photovoltaic modules through bypass-diode-assisted small-area high-voltage structures. Renew. Sustain. Energy Rev. 2025, 208, 115047. [Google Scholar] [CrossRef]
- Baranwal, K.; Prakash, P.; Yadav, V.K. Optimizing bypass diode performance with modified hotspot mitigation circuit. Sol. Energy Mater. Sol. Cells 2025, 280, 113281. [Google Scholar] [CrossRef]
- Lu, S.-D.; Wu, C.-C.; Sian, H.-W. A novel fault diagnosis method for PV arrays using convolutional extension neural network with symmetrized dot pattern analysis. IET Sci. Meas. Technol. 2024, 18, 49–64. [Google Scholar] [CrossRef]
- Lee, C.G.; Shin, W.G.; Lim, J.R.; Kang, G.H.; Ju, Y.C.; Hwang, H.M.; Chang, H.S.; Ko, S.W. Analysis of electrical and thermal characteristics of PV array under mismatching conditions caused by partial shading and short circuit failure of bypass diodes. Energy 2021, 218, 119480. [Google Scholar] [CrossRef]
- Sezgin-Ugranlı, H.G. Photovoltaic system performance under partial shading conditions: Insight into the roles of bypass diode numbers and inverter efficiency curve. Sustainability 2025, 17, 4626. [Google Scholar] [CrossRef]
- Sezgin-Ugranlı, H.G. To what extent the number of bypass diodes influence the performance of PV modules: Probabilistic assessment. Renew. Energy 2025, 249, 123243. [Google Scholar] [CrossRef]
- MathWorks. Solar Cell. Available online: https://www.mathworks.com/help/sps/ref/solarcell.html (accessed on 18 July 2025).[Green Version]
- Bartholomäus, M.; Morino, L.; Poulsen, P.B.; Spataru, S.V. Evaluating the accuracy of inverter-based string IV measurements. In Proceedings of the 40th European Photovoltaic Solar Energy Conference and Exhibition (EU PVSEC), Lisbon, Portugal, 18–22 April 2023. [Google Scholar][Green Version]
- Huawei. Smart I-V Curve Diagnosis on the NetEco. Available online: https://support.huawei.com/enterprise/en/doc/EDOC1100047682/f3a36f36/smart-i-v-curve-diagnosis-on-the-neteco (accessed on 18 July 2025).[Green Version]
- Nunes da Silva, I.; Spatti, D.H.; Flauzino, R.A.; Liboni, L.H.B.; dos Reis Alves, S.F. Artificial Neural Networks: A Practical Course; Springer International Publishing: Cham, Switzerland, 2017. [Google Scholar][Green Version]
- Yuan, Z.; Xiong, G.; Fu, X. Artificial neural network for fault diagnosis of solar photovoltaic systems: A Survey. Energies 2022, 15, 8693. [Google Scholar] [CrossRef]
- Chine, W.; Mellit, A.; Lughi, V.; Malek, A.; Sulligoi, G.; Massi Pavan, A. A novel fault diagnosis technique for photovoltaic systems based on artificial neural networks. Renew. Energy 2016, 90, 501–512. [Google Scholar] [CrossRef]
- Voutsinas, S.; Karolidis, D.; Voyiatzis, I.; Samarakou, M. Development of a multi-output feed-forward neural network for fault detection in photovoltaic systems. Energy Rep. 2022, 8, 33–42. [Google Scholar] [CrossRef]
- Syafaruddin; Karatepe, E.; Hiyama, T. Controlling of artificial neural network for fault diagnosis of photovoltaic array. In Proceedings of the 16th International Conference on Intelligent System Applications to Power Systems, Hersonissos, Greece, 25–28 September 2011; pp. 1–6. [Google Scholar]
- Elobaid, L.M.; Abdelsalam, A.K.; Zakzouk, E.E. Artificial neural network-based photovoltaic maximum power point tracking techniques: A survey. IET Renew. Power Gener. 2015, 9, 1043–1063. [Google Scholar] [CrossRef]
- Schölkopf, B.; Smola, A.J. Learning with Kernels: Support Vector Machines, Regularization, Optimization, and Beyond; MIT Press: Cambridge, MA, USA, 2002. [Google Scholar]
- Goodfellow, I.; Bengio, Y.; Courville, A. Deep Learning; MIT Press: Cambridge, MA, USA, 2016. [Google Scholar]
- Mehmood, A.; Sher, H.A.; Murtaza, A.F.; Al-Haddad, K. A diode-based fault detection, classification, and localization method for photovoltaic array. IEEE Trans. Instrum. Meas. 2021, 70, 3516812. [Google Scholar] [CrossRef]
- Oke, S.; Sakai, H.; Tottori, H.; Shimizu, Y.; Nanno, I.; Hamada, T.; Ishikura, N.; Fujii, M. Characteristics and risks of broken bypass diode with induced lightning. In Proceedings of the Grand Renewable Energy, Yokohama, Japan, 17–22 June 2018. [Google Scholar]
Disclaimer/Publisher’s Note: The statements, opinions and data contained in all publications are solely those of the individual author(s) and contributor(s) and not of MDPI and/or the editor(s). MDPI and/or the editor(s) disclaim responsibility for any injury to people or property resulting from any ideas, methods, instructions or products referred to in the content. |
© 2025 by the author. Licensee MDPI, Basel, Switzerland. This article is an open access article distributed under the terms and conditions of the Creative Commons Attribution (CC BY) license (https://creativecommons.org/licenses/by/4.0/).