Article

UWB Radar-Based Human Activity Recognition via EWT–Hilbert Spectral Videos and Dual-Path Deep Learning

Division of AI, Big Data and Block Chain, Daegu Gyeongbuk Institute of Science and Technology (DGIST), Daegu 42988, Republic of Korea
*
Author to whom correspondence should be addressed.
Electronics 2025, 14(16), 3264; https://doi.org/10.3390/electronics14163264 (registering DOI)
Submission received: 23 June 2025 / Revised: 5 August 2025 / Accepted: 14 August 2025 / Published: 17 August 2025

Abstract

Ultrawideband (UWB) radar has emerged as a compelling solution for noncontact human activity recognition. This study proposes a novel framework that leverages adaptive signal decomposition and video-based deep learning to classify human motions with high accuracy using a single UWB radar. The raw radar signals were processed by empirical wavelet transform (EWT) to isolate the dominant frequency components in a data-driven manner. These components were further analyzed using the Hilbert transform to produce time–frequency spectra that capture motion-specific signatures through subtle phase variations. Instead of treating each spectrum as an isolated image, the resulting sequence was organized into a temporally coherent video, capturing spatial and temporal motion dynamics. The video data were used to train the SlowFast network—a dual-path deep learning model optimized for video-based action recognition. The proposed system achieved an average classification accuracy exceeding 99% across five representative human actions. The experimental results confirmed that the EWT–Hilbert-based preprocessing enhanced feature distinctiveness, while the SlowFast architecture enabled efficient and accurate learning of motion patterns. The proposed framework is intuitive, computationally efficient, and scalable, demonstrating strong potential for deployment in real-world scenarios such as smart healthcare, ambient-assisted living, and privacy-sensitive surveillance environments.

1. Introduction

Ultrawideband (UWB) radar technology has emerged as a promising noncontact sensing solution capable of accurately capturing fine-scale motions and physiological signals from human participants [1,2,3,4,5,6,7,8,9,10]. By transmitting extremely short-duration pulses over a wide frequency range, the UWB radar achieves high spatial resolution, enabling the precise detection of even subtle movements. Notably, concerns about privacy have increasingly limited the use of vision-based sensing systems in public environments. For instance, the European Union has enforced strict data protection regulations that restrict video surveillance in public spaces [11,12]. In contrast, radar-based systems, which do not rely on visual data but instead detect motion alone, offer a privacy-preserving alternative. Furthermore, radar signals can penetrate nonmetallic obstacles, making them suitable for various deployment scenarios.
A variety of radar modalities have been explored for human activity recognition. Examples of such modalities are the continuous-wave (CW) radar, frequency-modulated continuous-wave (FMCW) radar, and UWB pulse radar. CW and FMCW radars typically utilize micro-Doppler shifts, which are minute frequency variations caused by human movement, as the primary discriminative feature. For example, a CW radar continuously emits electromagnetic waves at a constant frequency, and the frequency variations in the reflected signals are analyzed in the time–frequency domain to distinguish different types of motion [13]. In the case of the FMCW radar, motion trajectories are constructed by sequentially connecting range–Doppler maps over time, and these trajectories are combined with multidimensional feature vectors to enhance the classification performance [14]. The UWB radar provides detailed movement analysis by utilizing time-of-flight and phase-shift information [15,16,17,18,19].
Conventional studies analyze UWB radar signals through time–frequency analysis methods such as the short-time Fourier transform (STFT) [20] and the continuous wavelet transform (CWT) [21]. However, the STFT is constrained by the fixed time–frequency resolution determined by its window size, limiting its effectiveness at detecting brief or nuanced changes. The CWT, while realizing a multiresolution analysis (MRA), still relies on predefined wavelet basis functions and sampling frequencies, which may not fully adapt to the intrinsic characteristics of the measured signal.
To address these limitations, this study proposes an adaptive signal decomposition framework based on empirical mode decomposition (EMD) [22] and empirical wavelet transform (EWT) [23]. These techniques facilitate the extraction of dominant energy bands, which dynamically shift in response to human movement, within the frequency spectrum of the radar signal. The Hilbert transform [22,24] is then applied to visualize the instantaneous frequency of these dominant components to identify the subtle frequency variations induced by motion. In the experimental setup, one-dimensional (1D) UWB radar pulse signals were continuously acquired over time and decomposed by EWT to identify the dominant spectral bands. These components were then transformed by Hilbert transform to produce two-dimensional (2D) Hilbert spectrum images. A temporally ordered sequence of these images was constructed in video format, forming a dataset containing over 100 video samples for each of five representative human activities: stretching and swinging one arm forward, bending and returning the upper body, lifting and lowering one arm, standing up and sitting down, and rotating the upper body in a single direction. The resulting dataset was used to train the SlowFast network [25], a video-based deep learning architecture tailored for action recognition. Unlike commonly used models, such as three-dimensional (3D) convolutional neural networks (CNNs) [26] and Inflated 3D CNN (I3D) [27], which jointly learn spatial and temporal features but require extensive computational resources, the SlowFast model processes spatial and temporal cues through parallel pathways, thereby achieving computational efficiency and high classification accuracy.
Extensive experiments with real UWB radar data demonstrated that the proposed system could classify five distinct human actions with an average accuracy of 99.28%. The primary contributions of this work are as follows: First, an adaptive signal processing pipeline combining empirical wavelet transform and Hilbert spectral analysis is developed to capture motion-induced phase variations in UWB radar signals more effectively than conventional time–frequency analysis methods. Second, a temporal modeling framework is introduced that converts spectral representations into video sequences, enabling the application of video-based deep learning architectures to radar signal analysis. Third, comprehensive experimental validation demonstrates superior classification performance compared to existing single-sensor approaches while maintaining computational efficiency suitable for real-time implementation. Fourth, the SlowFast architecture enables accurate classification with reduced computational cost, making the system implementation practical and efficient. Fifth, the proposed method addresses privacy concerns inherent in vision-based systems while achieving state-of-the-art accuracy for radar-based human activity recognition.

2. Literature Review

We reviewed existing radar-based human activity recognition approaches, examining their signal processing techniques and machine learning methodologies to identify key advantages and limitations.

2.1. Radar Modalities for Human Activity Recognition

UWB radar technology has demonstrated significant potential in biomedical applications for non-contact physiological monitoring. Multiple studies [1,2,3,4,5,6,7,8,9,10] have employed UWB radar for vital sign detection and physiological monitoring, establishing the foundation for precision human sensing through its fine-scale motion detection capabilities. Among radar technologies for human motion detection, CW systems utilize micro-Doppler signatures for motion characterization. Wang et al. [13] analyzed frequency variations in reflected CW radar signals within the time–frequency domain to effectively distinguish different types of human motion. Kim et al. [28] demonstrated this approach using support vector machines with micro-Doppler signatures, achieving effective performance across multiple subjects despite the inherent range resolution limitations of CW radar. Zhang [29] employed CW radar for gait analysis, providing basic quantitative measurements of human walking patterns through continuous wave sensing. FMCW radar systems offer superior range-Doppler resolution compared to CW systems. Ding et al. [14] developed FMCW radar-based motion recognition by constructing motion trajectories through sequentially connecting range-Doppler maps over time, combining these trajectories with multidimensional feature vectors to enhance classification performance. Shrestha et al. [30] developed FMCW-based activity recognition using Bi-LSTM networks, achieving high classification accuracy for continuous human activity monitoring. Cao et al. [31] further enhanced FMCW performance through multi-domain feature attention fusion networks, demonstrating improved recognition capabilities for indoor activity monitoring. Zhang et al. [32] proposed asymmetric convolutional residual blocks for FMCW radar human action recognition, showing enhanced performance in complex scenarios. UWB radar technology, as demonstrated in various studies [15,16,17,18,19], provides detailed movement analysis through high spatial resolution and precise time-of-flight measurements for detecting subtle human movements.

2.2. Signal Processing Approaches

Traditional signal processing techniques for radar-based activity recognition rely primarily on time–frequency analysis methods. STFT approaches [20] provide basic time–frequency representation but suffer from fixed resolution trade-offs determined by window size selection. Abratkiewicz [33] demonstrated radar signal retrieval methods using STFT-inspired approaches, achieving improved signal detection capabilities through constant false alarm rate techniques. CWT methods [21] offer improved time–frequency localization through MRA. Song and Lee [34] compared various time–frequency transformation methods including CWT and STFT for signal classification applications, demonstrating the effectiveness of different approaches across various signal types. Various mathematical morphology techniques have been explored for enhancing time–frequency analysis of radar signals, particularly for improving weak signal detection capabilities. EMD [22] provides adaptive signal decomposition without predefined basis functions, offering advantages for nonstationary radar signals. Guo et al. [35] developed novel solutions for improved time–frequency concentration performance, addressing limitations of traditional decomposition methods. Zhang et al. [36] explored advanced decomposition techniques and LPI radar waveform recognition for radar signal analysis, demonstrating improved spectral clarity through time–frequency distribution methods. Konatham et al. [37] developed real-time analog signal processing techniques for dynamic waveform spectral analysis, enabling nanosecond-resolution processing capabilities that surpass traditional digital approaches.

2.3. Machine Learning Integration

Traditional machine learning approaches typically employ handcrafted features extracted from time–frequency representations. Kim and Moon [38] demonstrated human detection and activity classification using deep convolutional neural networks with micro-Doppler signatures, achieving robust performance across various scenarios. Li et al. [39] developed radar-based human activity recognition with adaptive thresholding approaches, specifically targeting resource-constrained platforms while maintaining high accuracy. Seyfioğlu and Gürbüz [40] addressed the challenge of limited training data through deep neural network initialization methods for micro-Doppler classification. Deep learning methodologies have shown promising results for radar-based recognition tasks. Li et al. [41] proposed Bi-LSTM networks for multimodal continuous human activity recognition and fall detection, demonstrating the effectiveness of temporal sequence modeling for radar applications. Hernangómez et al. [42] applied deep convolutional neural networks to FMCW radar data for human activity classification, achieving high performance in controlled environments. Three-dimensional CNNs [26] extend spatial processing to temporal dimensions, achieving improved performance at the cost of significantly increased computational complexity. Chen et al. [43] developed variable length sequential iterable convolutional recurrent networks specifically for UWB-IR applications, demonstrating enhanced target recognition capabilities.

2.4. Existing UWB Radar-Based Approaches

UWB radar technology provides detailed movement analysis by utilizing time-of-flight and phase-shift information, enabling precise detection of subtle human movements through high spatial resolution capabilities. We reviewed several key studies employing UWB radar for human activity recognition, focusing on methodological approaches and performance characteristics. Maitre et al. [15] proposed a practical recognition system employing three UWB radars to detect daily living activities of older individuals in a smart home environment. Their experiments focused on recognizing 15 actions using deep learning models including stacked LSTM, CNN-LSTM, and ResNet architectures. The CNN-LSTM combination demonstrated optimal performance with 94% accuracy, increasing to 95% when employing a voting system across all three radars. However, the multi-radar requirement significantly increases system complexity and deployment cost. Ding et al. [16] designed a multilevel classification system for 12 indoor activities, employing preliminary classification to distinguish in situ and non-in-situ activities followed by WRTFT and PCA for feature extraction. Traditional classifiers including subspace KNN and bagged trees achieved a peak accuracy of 95.3%, though intersubject performance variation was observed, particularly for stationary movements. Qi et al. [17] proposed a three-stage processing architecture for 12 human actions using single UWB radar data. The system employed KNN classification using range-velocity features for directional motion identification, followed by Welch- and Doppler-based power spectra generation for stationary and dynamic movements, respectively. While achieving real-time capability, the overall accuracy remained limited at approximately 85%. Pardhu et al. [18] introduced a through-the-wall recognition system combining Hilbert transform, local gradient pattern, and local optimal oriented pattern features with an RMDL structure comprising DNN, CNN, and RNN components. Hyperparameter optimization using the spotted gray wolf optimizer yielded 95.6% classification accuracy, though the approach was limited to three basic activities and through-wall scenarios only. An et al. [19] developed high-resolution motion recognition using UWB MIMO SFCW radar for through-wall sensing. Robust PCA separated motion information from DC clutter, with R-max time–frequency analysis extracting micro-Doppler features. The combination of 2D-PCA and CNN approaches achieved a maximum accuracy of 98.7%, representing the highest performance reported for UWB-based systems prior to our work, though requiring complex multi-antenna configurations. Recent advances in UWB processing include dual-mode embedded systems developed by Hung and Chang [44] for biomedical applications. Additionally, Liang et al. [45] applied impulse radar techniques for through-wall vital sign detection, demonstrating improved signal quality and classification performance under challenging environmental conditions.

2.5. Research Gaps and Limitations

Systematic analysis of existing approaches reveals several persistent limitations. Most high-performance systems require multiple radar units or complex antenna arrays, increasing hardware costs and deployment complexity. Computational requirements often limit operational efficiency, particularly for deep learning-based approaches requiring extensive preprocessing. Furthermore, temporal modeling capabilities remain limited, with most methods treating spectral frames independently rather than exploiting the temporal continuity inherent in human motion sequences. The lack of standardized evaluation protocols and datasets across studies complicates direct performance comparisons. Additionally, most approaches focus on controlled laboratory environments with limited consideration of real-world deployment challenges including environmental variations, multiple simultaneous users, and long-term system reliability. These limitations motivate the development of streamlined approaches that achieve high accuracy with simplified hardware configurations while maintaining computational efficiency suitable for real-time deployment scenarios.

3. Methodology

This section presents our complete methodology for preprocessing radar data to enhance motion-related features and employing deep learning techniques to classify human activities. We describe our approach from data acquisition through signal processing to deep learning-based classification, demonstrating how each component contributes to achieving superior recognition performance.

3.1. Overview of the Proposed Method

This section outlines the proposed methodology for accurately classifying human motions using UWB radar. As illustrated in Figure 1, our framework processes UWB radar signals through three integrated stages to achieve accurate human motion classification, integrating EWT-based signal processing with SlowFast video recognition. This integration enables automatic identification of motion-sensitive frequency bands and temporal pattern learning from radar signals.
The adaptive application of EWT to UWB radar signals addresses the fundamental limitation of fixed-resolution time–frequency analysis methods, automatically identifying motion-sensitive frequency bands without manual parameter tuning. This data-driven decomposition approach is particularly well-suited to UWB radar signals, where motion-induced phase variations manifest as subtle shifts in dominant frequency components rather than distinct spectral patterns. Furthermore, the transformation of Hilbert spectral representations into temporally coherent video sequences represents a paradigm shift in radar signal analysis, moving beyond traditional frame-by-frame processing to exploit the continuous nature of human motion. This video-based representation enables the application of state-of-the-art video recognition architectures to radar data for the first time, leveraging the extensive research advances in video understanding for a fundamentally different sensing modality. The integration of these components within a unified processing pipeline not only achieves superior classification performance but also maintains computational efficiency suitable for real-time deployment, distinguishing it from existing multi-sensor or computationally intensive approaches. We rigorously evaluated the performance of our proposed model using fivefold cross-validation. We randomly divided the entire dataset into five equally sized subsets. In each iteration, we used four subsets for training and one for testing, ensuring that we evaluated every sample exactly once. We obtained the final performance metrics by averaging results across all five iterations, thereby ensuring objective and generalizable assessment of our system.

3.2. Characteristics of UWB Radar Signals and Data Acquisition Process

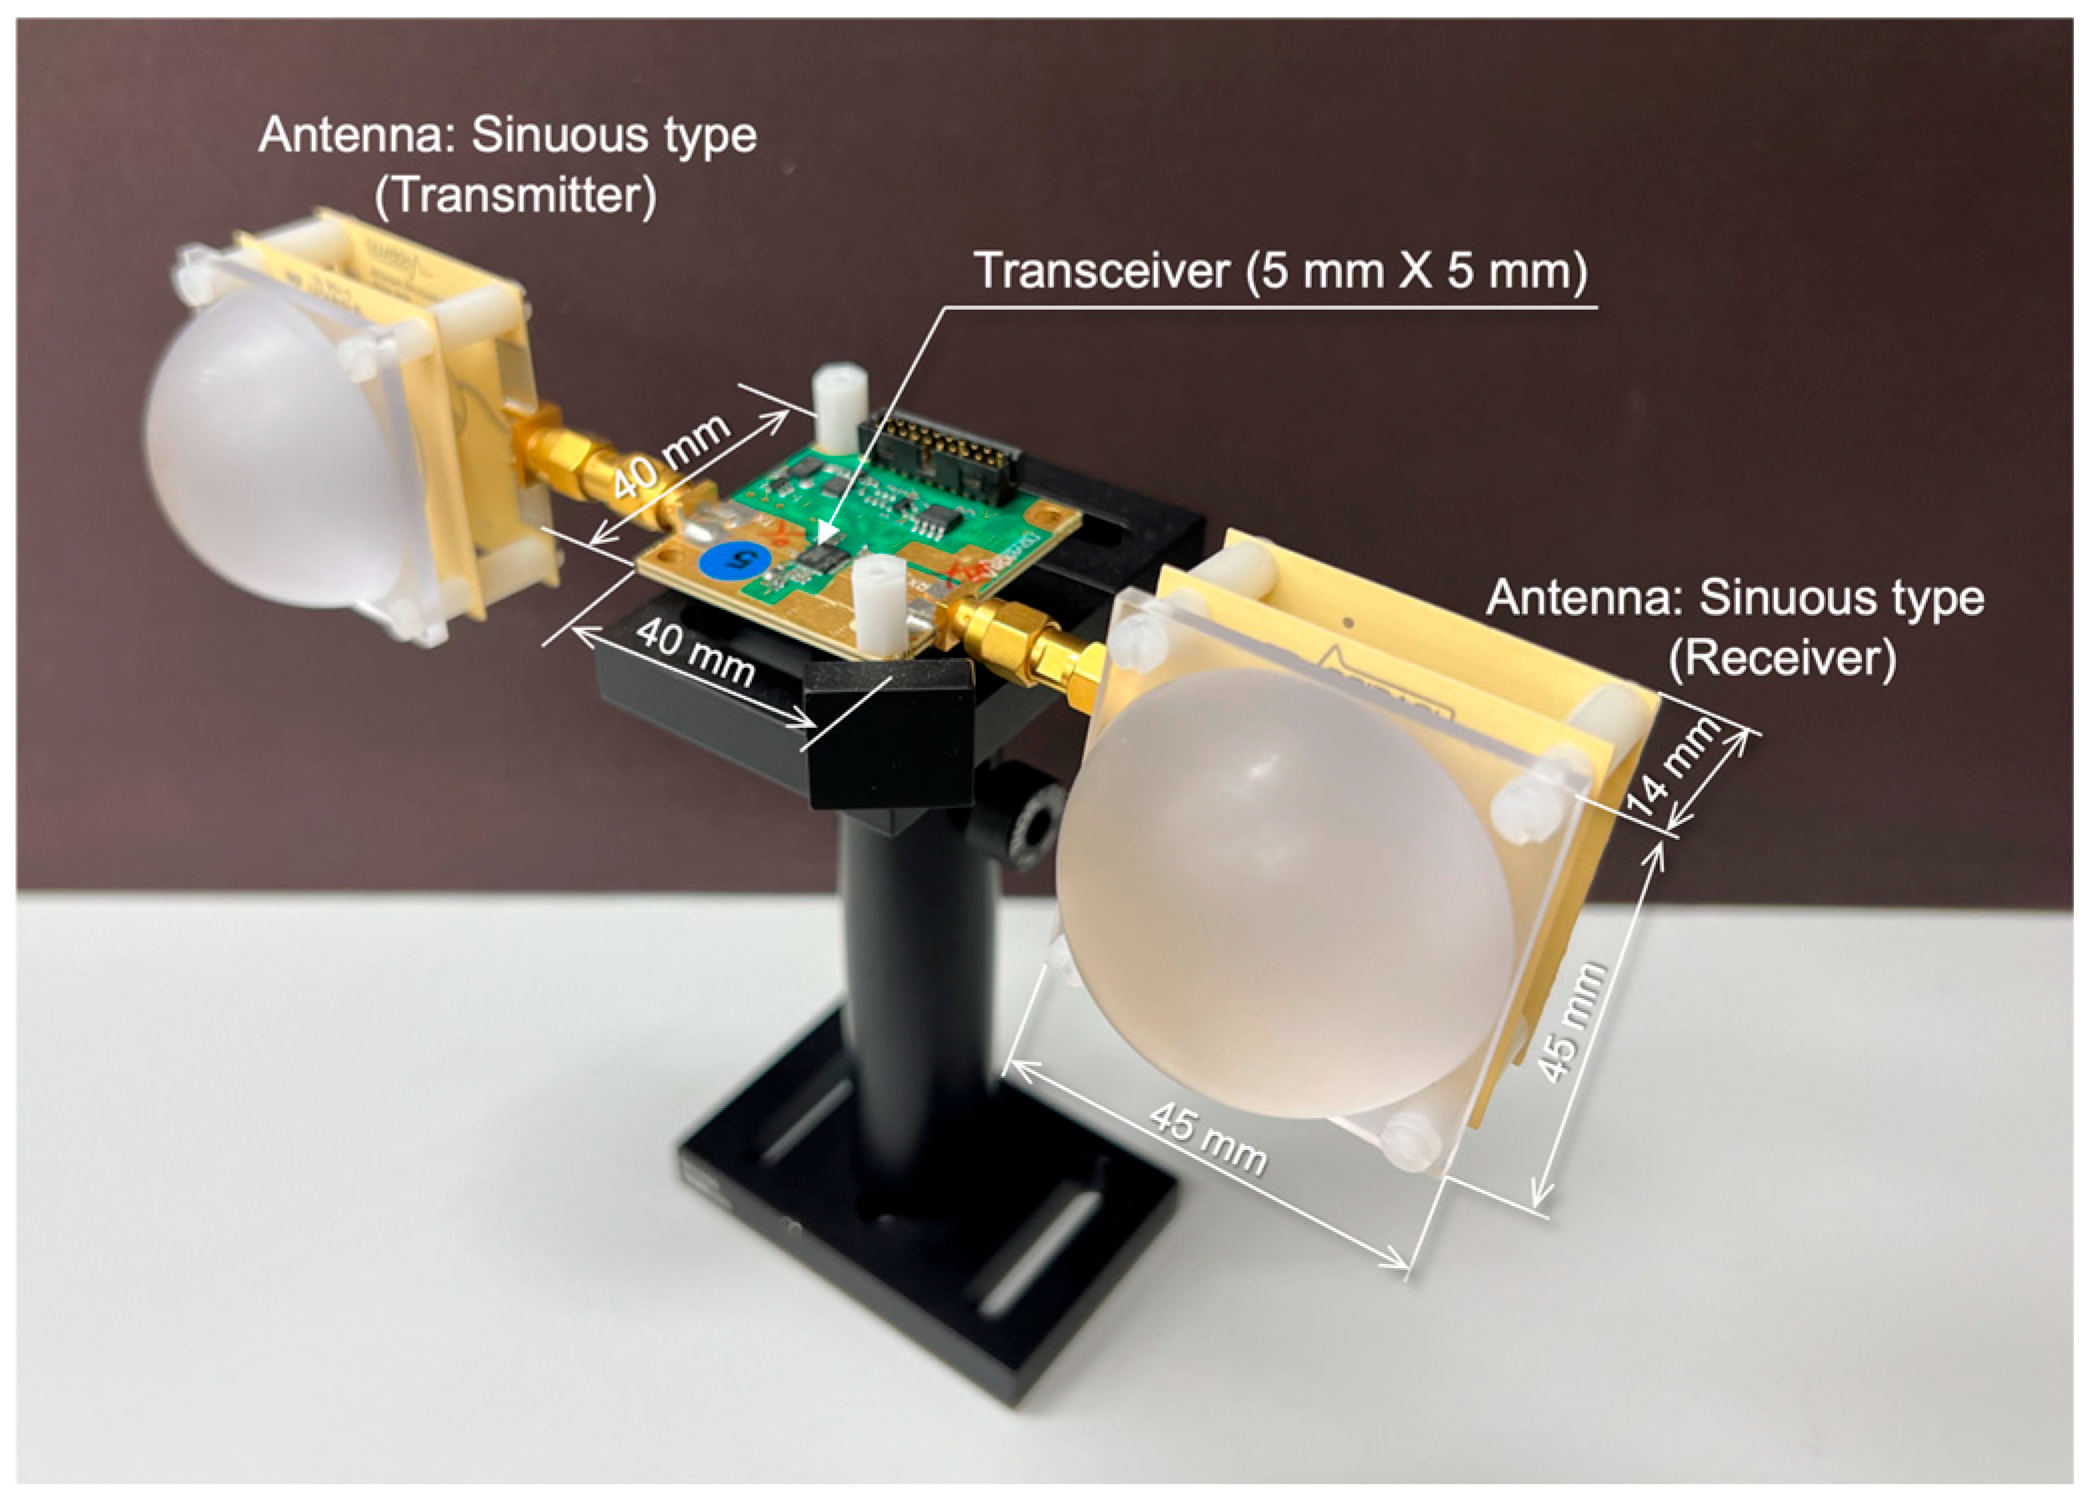
The UWB radar employed in this study emits extremely short pulse signals toward a human target and captures the reflected signals via a receiving antenna. Specifically, the data acquisition process utilizes a radar system based on the X2 UWB radar transceiver developed by Novelda, as illustrated in Figure 2 [46]. This system generates pulses in the form of damped sinusoidal waves, each with a duration shorter than 0.5 ns. In the frequency domain, the pulses are centered at 6.8 GHz and cover a wide bandwidth of approximately 2.3 GHz.
The experimental setup utilizes an X2 UWB radar transceiver with compact dimensions of 40 mm × 40 mm, incorporating a 5 mm × 5 mm transceiver IC that interfaces with the host computer via SPI communication protocol. Transmitting and receiving antennas are attached to the system through dedicated connectors, with detailed configurations and dimensions shown in Figure 2. The antennas employed are sinuous with 6.0 dBi gain. The system architecture facilitates straightforward integration into controlled laboratory environments while maintaining the measurement precision required for human motion detection applications. The X2 UWB radar transceiver employed in this study is a commercial product manufactured by Novelda AS (Oslo, Norway), specifically designed for precision sensing applications. This commercially available system was selected for its proven reliability, standardized specifications, and widespread adoption in academic research, ensuring reproducibility of our experimental results. The radar system configuration and data acquisition protocols described herein represent our original experimental design utilizing this commercial hardware platform, with custom signal processing and analysis methodologies developed specifically for human activity recognition applications.
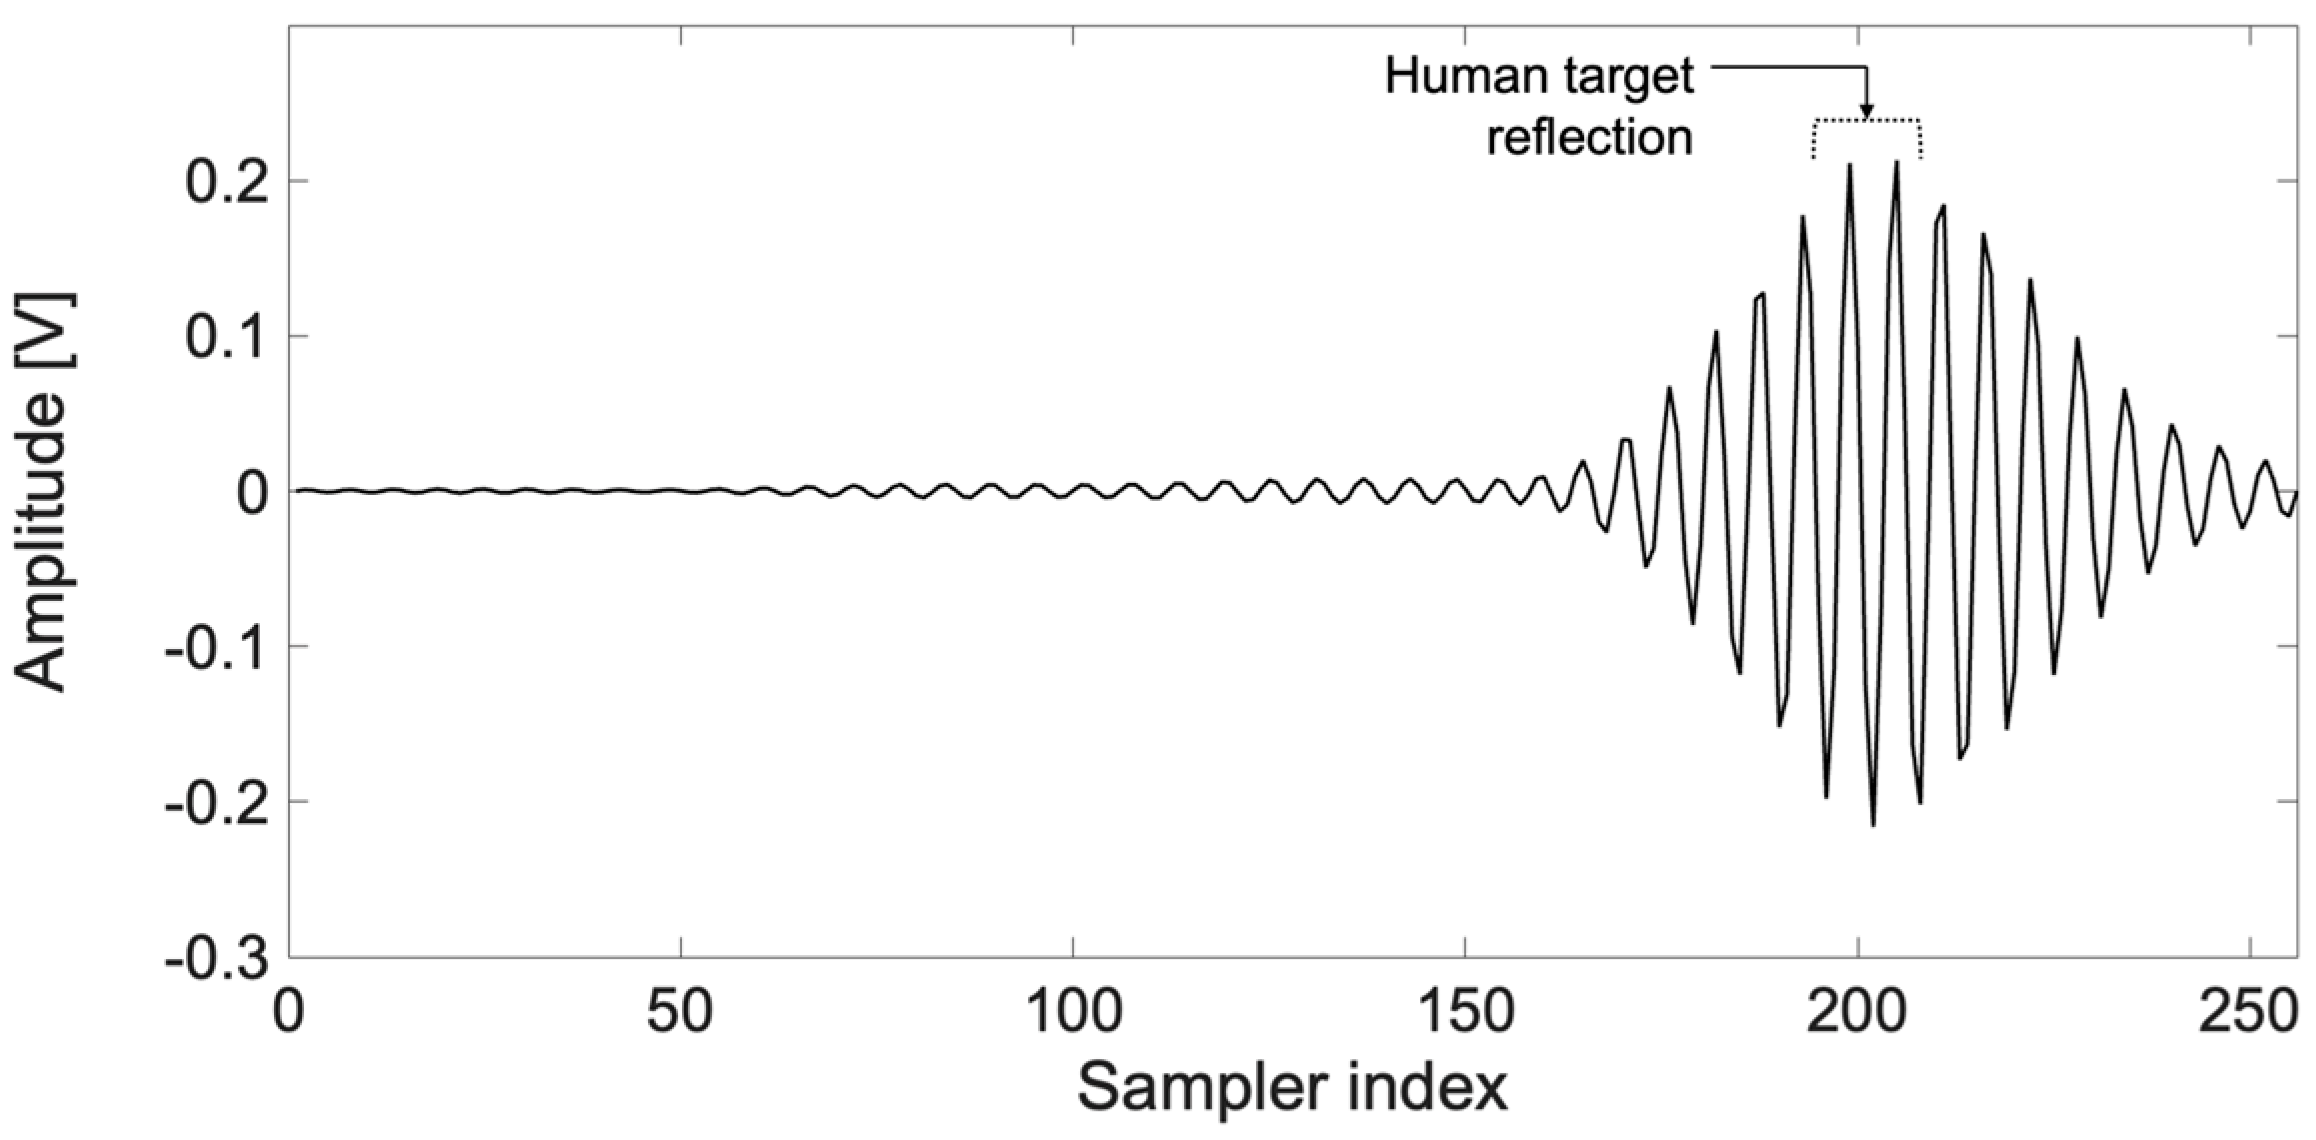
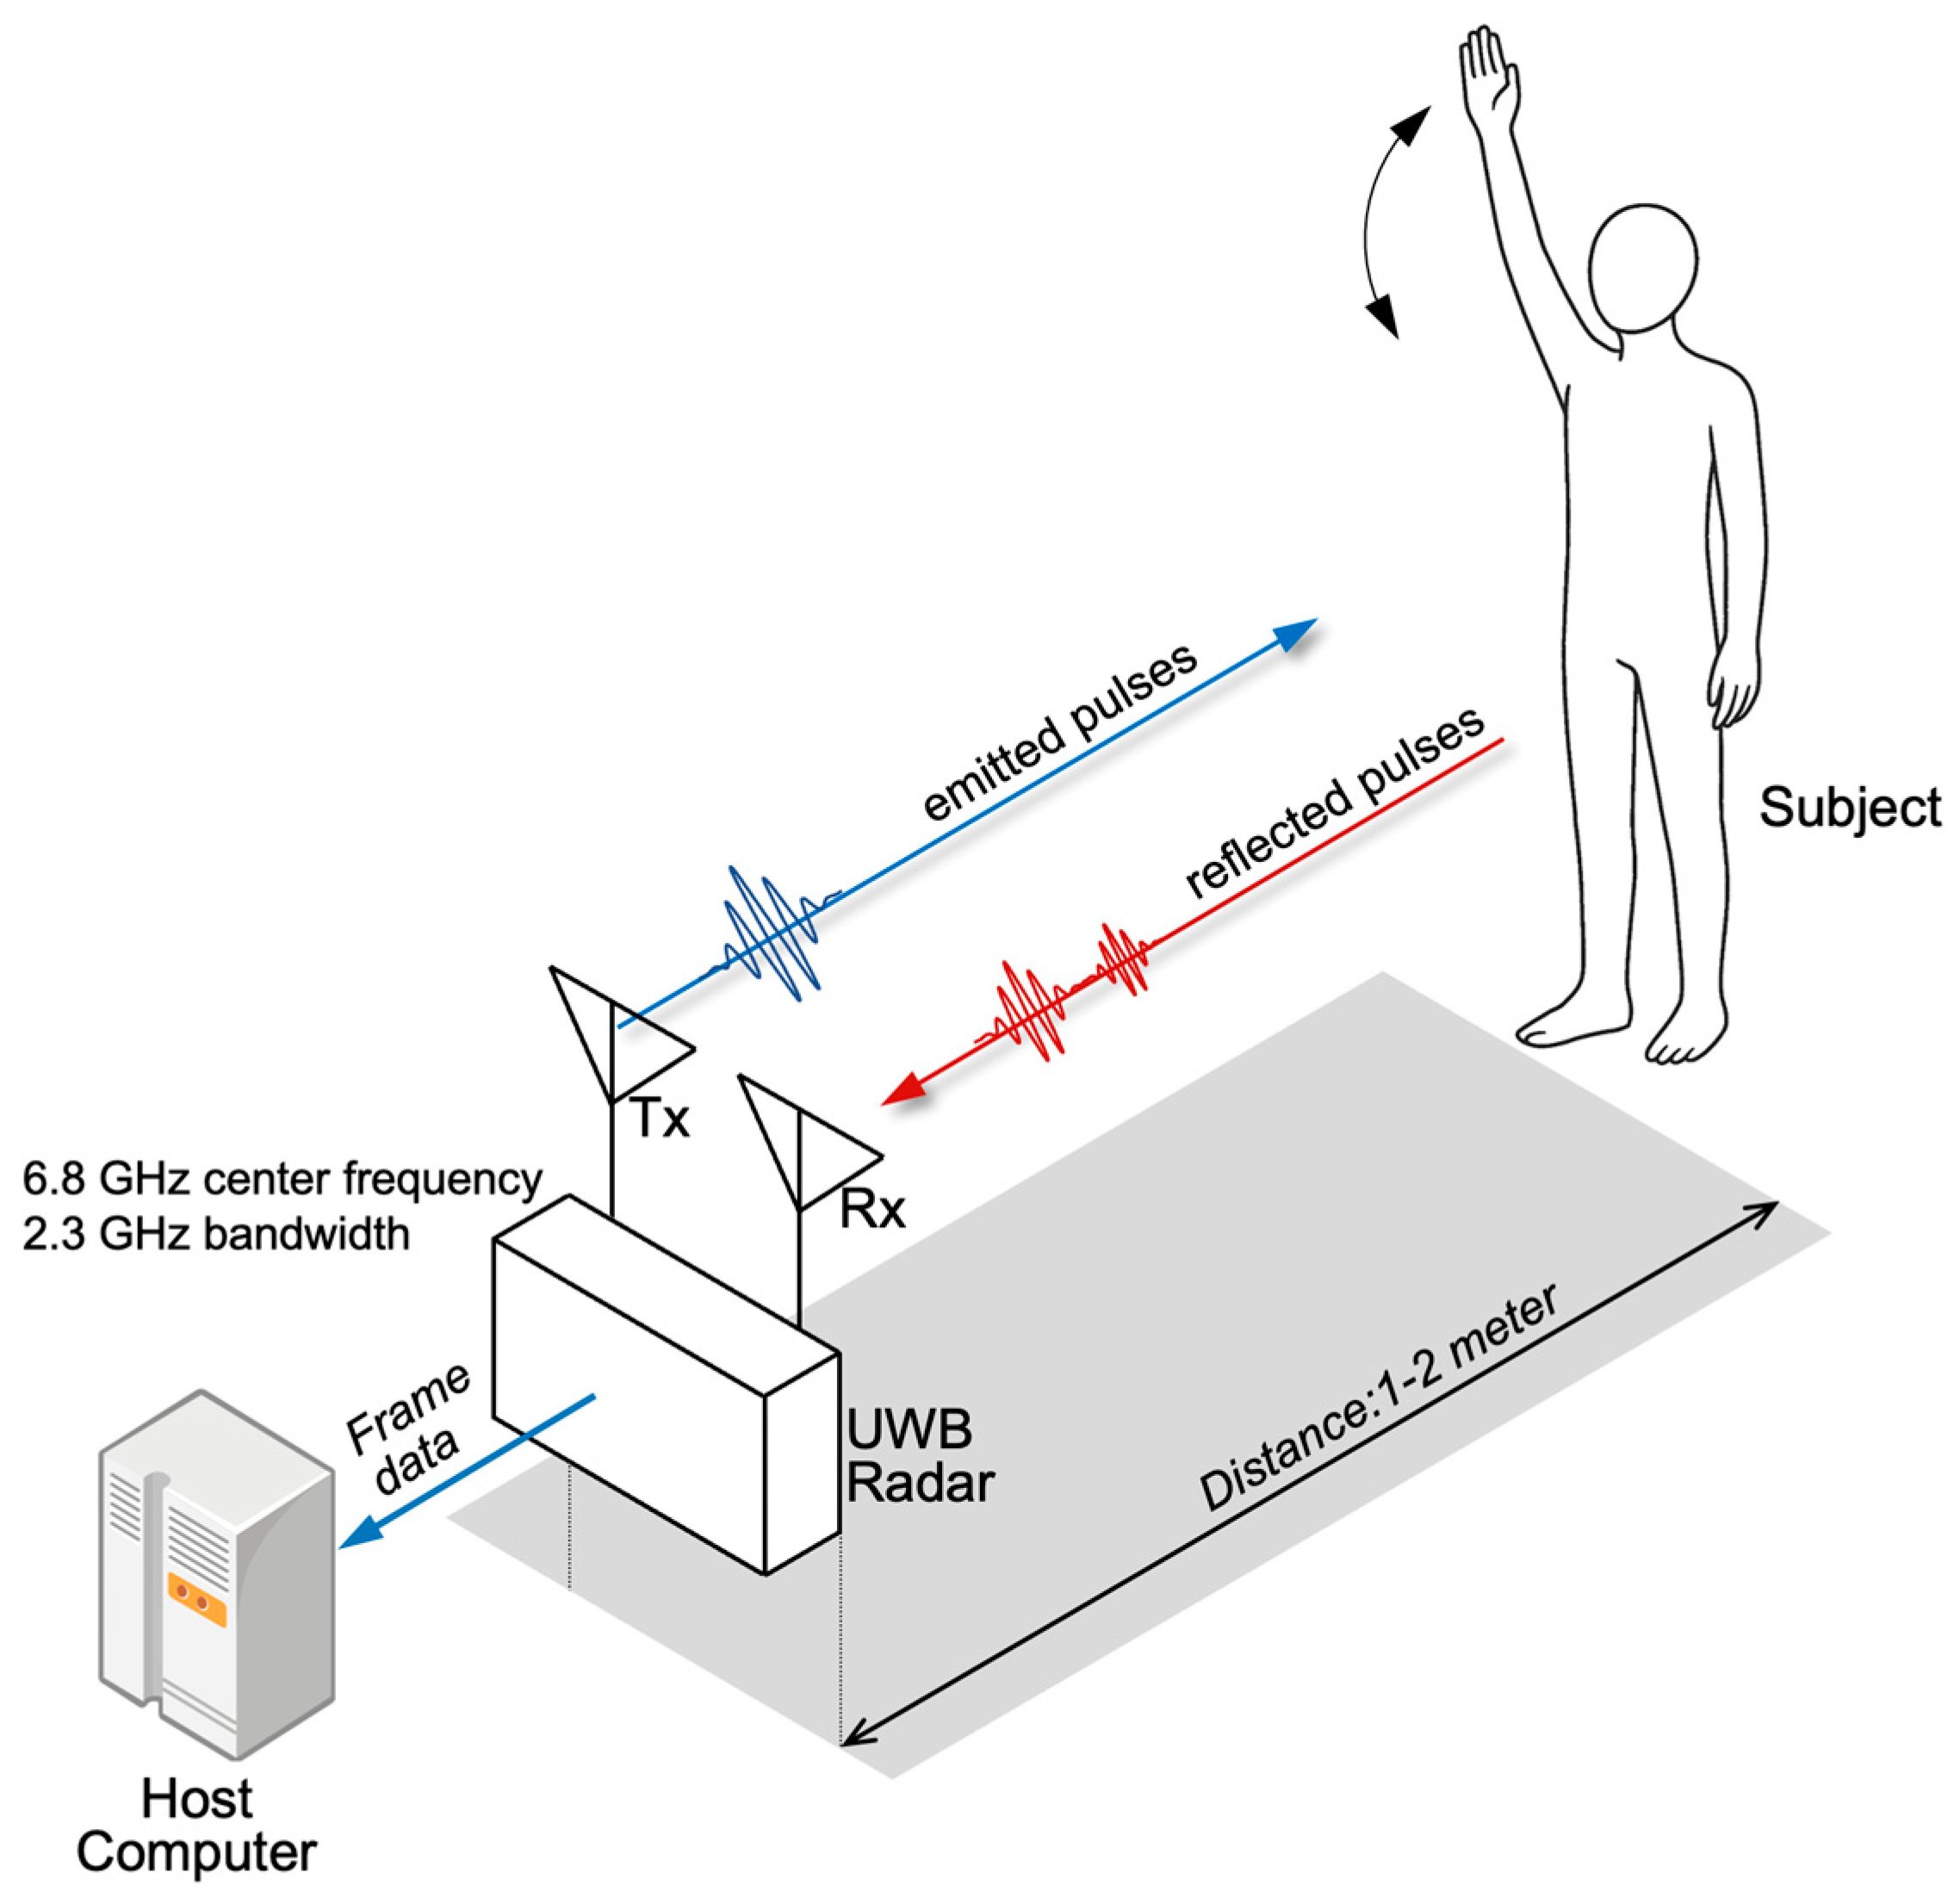
The radar emits pulses at a pulse repetition frequency of 100 MHz, while the receiver captures the incoming signals at a significantly lower rate of 30 Hz. Consequently, each received frame comprises a superimposed combination of multiple pulses reflected from the human body. These signals can be expressed as a continuous sequence of 1D frames along the time axis. Each pulse undergoes fine phase shifts because of the Doppler effect induced by body movement at the time of reflection. In this study, such subtle phase variations were analyzed to extract the characteristic features corresponding to specific human motions. To ensure safety, the effective isotropic radiated power (EIRP) of the radar pulses was evaluated against the exposure limits established by the Federal Communications Commission (FCC) [47]. When the subject was positioned at a distance of at least 35 cm from the antenna, the exposure remained below the permissible threshold. In our experiments, the human participants were located between 1 and 2 m from the antenna, thereby complying with safety regulations. The antenna has an opening angle of 65° in the vertical plane and 85° in the horizontal plane. The radar system captures pulses at a rate of 30 Hz. Each pulse is sampled by 256 internal samplers within the transceiver, resulting in 256 discrete points that constitute a single frame. An example of a frame is shown in Figure 3—in this frame, a prominent amplitude peak appears near sampler index 200, corresponding to the location of the human subject. The raw radar frames obtained from the transceiver are initially passed through a bandpass filter with a passband frequency of 5.60–8.00 GHz. This filtering process effectively removes the DC component and the low- and high-frequency noise, thereby enhancing the signal quality for subsequent analysis.
The five human motions classified in this study include (1) sitting down and then standing up, (2) raising and lowering the arms, (3) extending the arms forward and swinging them sideways, (4) twisting the torso to one side while seated, and (5) bending the upper body forward and then returning to an upright posture. As shown in Figure 4, each participant was positioned at approximately 1–2 m from the radar antenna, with an average spacing of 1.2 m. Five participants participated in the experiment, and each participant performed each of the five motions more than 20 times.
Data collection procedures incorporated rigorous quality control measures to ensure experimental validity and reproducibility. Standardized participant positioning protocols were established to maintain consistent spatial relationships between subjects and the radar sensor throughout all measurement sessions. Each participant received identical instructions regarding motion execution timing, amplitude, and directional constraints to minimize inter-subject variability while preserving natural movement characteristics.

3.3. Processing Radar Signals Using Data-Adaptive Multiresolution Analysis and Hilbert Transform

When a human participant remains stationary, the phase difference between successive radar frames is negligible. However, once motion occurs, the reflected UWB radar pulses exhibit phase variations caused by Doppler shifts. Although the UWB radar exhibits low-frequency resolution owing to its wide operational bandwidth, it has a remarkable advantage at detecting subtle human movements by observing phase changes around the central frequency of the radar signal. Analysis in the time–frequency domain is essential to effectively extract motion-related components from UWB radar signals. Conventional approaches have typically employed time–frequency analysis techniques, such as STFT and CWT. STFT applies a fixed-length window to segment the signal, followed by a Fourier transform to obtain time-varying spectral information. Although the STFT is simple and widely used, it inherently involves a trade-off between the time and frequency resolutions owing to its fixed window size, limiting its effectiveness in capturing both transient features and frequency details simultaneously [48]. CWT overcomes some of these limitations by employing a mother wavelet that is scaled and translated across the signal. The variable window length in the time domain enables higher temporal resolution at higher frequencies and improved frequency resolution at lower frequencies compared to STFT. However, CWT relies on user-defined parameters, such as the wavelet shape and scale distribution. This limits the adaptability of CWT to the actual characteristics of the input signal, possibly affecting its effectiveness in isolating distinct spectral features. In addition, overlapping information between scales and energy leakage can reduce spectral clarity and increase clutter.
To address these issues, EMD proposed by Huang et al. [22] offers a data-driven and adaptive method for analyzing nonlinear and nonstationary signals. EMD decomposes a signal into a finite set of intrinsic mode functions (IMFs), each capturing a simple oscillatory mode inherent in the original signal. Unlike the traditional methods that rely on predefined basis functions, EMD adaptively extracts IMFs based on the local extrema of the signal and envelope interpolation, enabling high-resolution and flexible time–frequency analysis. EMD has also been applied for extracting micro-Doppler features from continuous-wave radar signals [49]. EWT, another adaptive decomposition method, was introduced by Gilles [23]. Unlike EMD, which operates in the time domain, EWT functions in the Fourier domain by adaptively partitioning the signal spectrum into frequency bands based on its prominent features and constructing localized wavelet filter banks for multiresolution decomposition. This data-driven design enables effective isolation of essential frequency components tailored to the signal’s actual spectral content. However, a notable limitation of EWT is that it performs best when the signal spectrum contains multiple well-separated frequency components, which permit clear boundary definition between the frequency bands.

3.3.1. EMD Applied to Radar Frames

Unlike traditional signal analysis methods, EMD does not rely on any predefined basis functions or assumptions about the shape of the target signal. Instead, it adaptively decomposes the signal into a set of IMFs, which are data-driven components that reflect the underlying amplitude and frequency characteristics of the signal. Each IMF must satisfy two essential conditions. First, the number of extrema and the number of zero crossings within an IMF must either be equal or differ by at most one across the entire signal. Second, the local mean computed from the upper and lower envelope curves must be approximately zero over the entire time span. These conditions ensure that each IMF captures a physically meaningful frequency component and that the extracted components are distinct and interpretable, thereby enhancing the reliability and analytical validity of the decomposition process. The specific procedure of EMD is as follows. First, all local maxima and minima of the original signal are identified. Cubic spline interpolation is then performed at these extremes to construct the upper and lower envelopes of the signal. The mean of the two envelopes is computed and subtracted from the original signal. This iterative process is referred to as the sifting process, which progressively refines the signal until it satisfies the criteria for an IMF. Once the first IMF is extracted, it is subtracted from the original signal; the same process is applied to the residual signal. This procedure continues until the residual signal no longer satisfies the IMF conditions. Ultimately, the original signal x t can be represented as the sum of the extracted IMFs and final residual component r N t , as expressed below [22]:
x t   =   i   =   1 N I M F i t   +   r N t
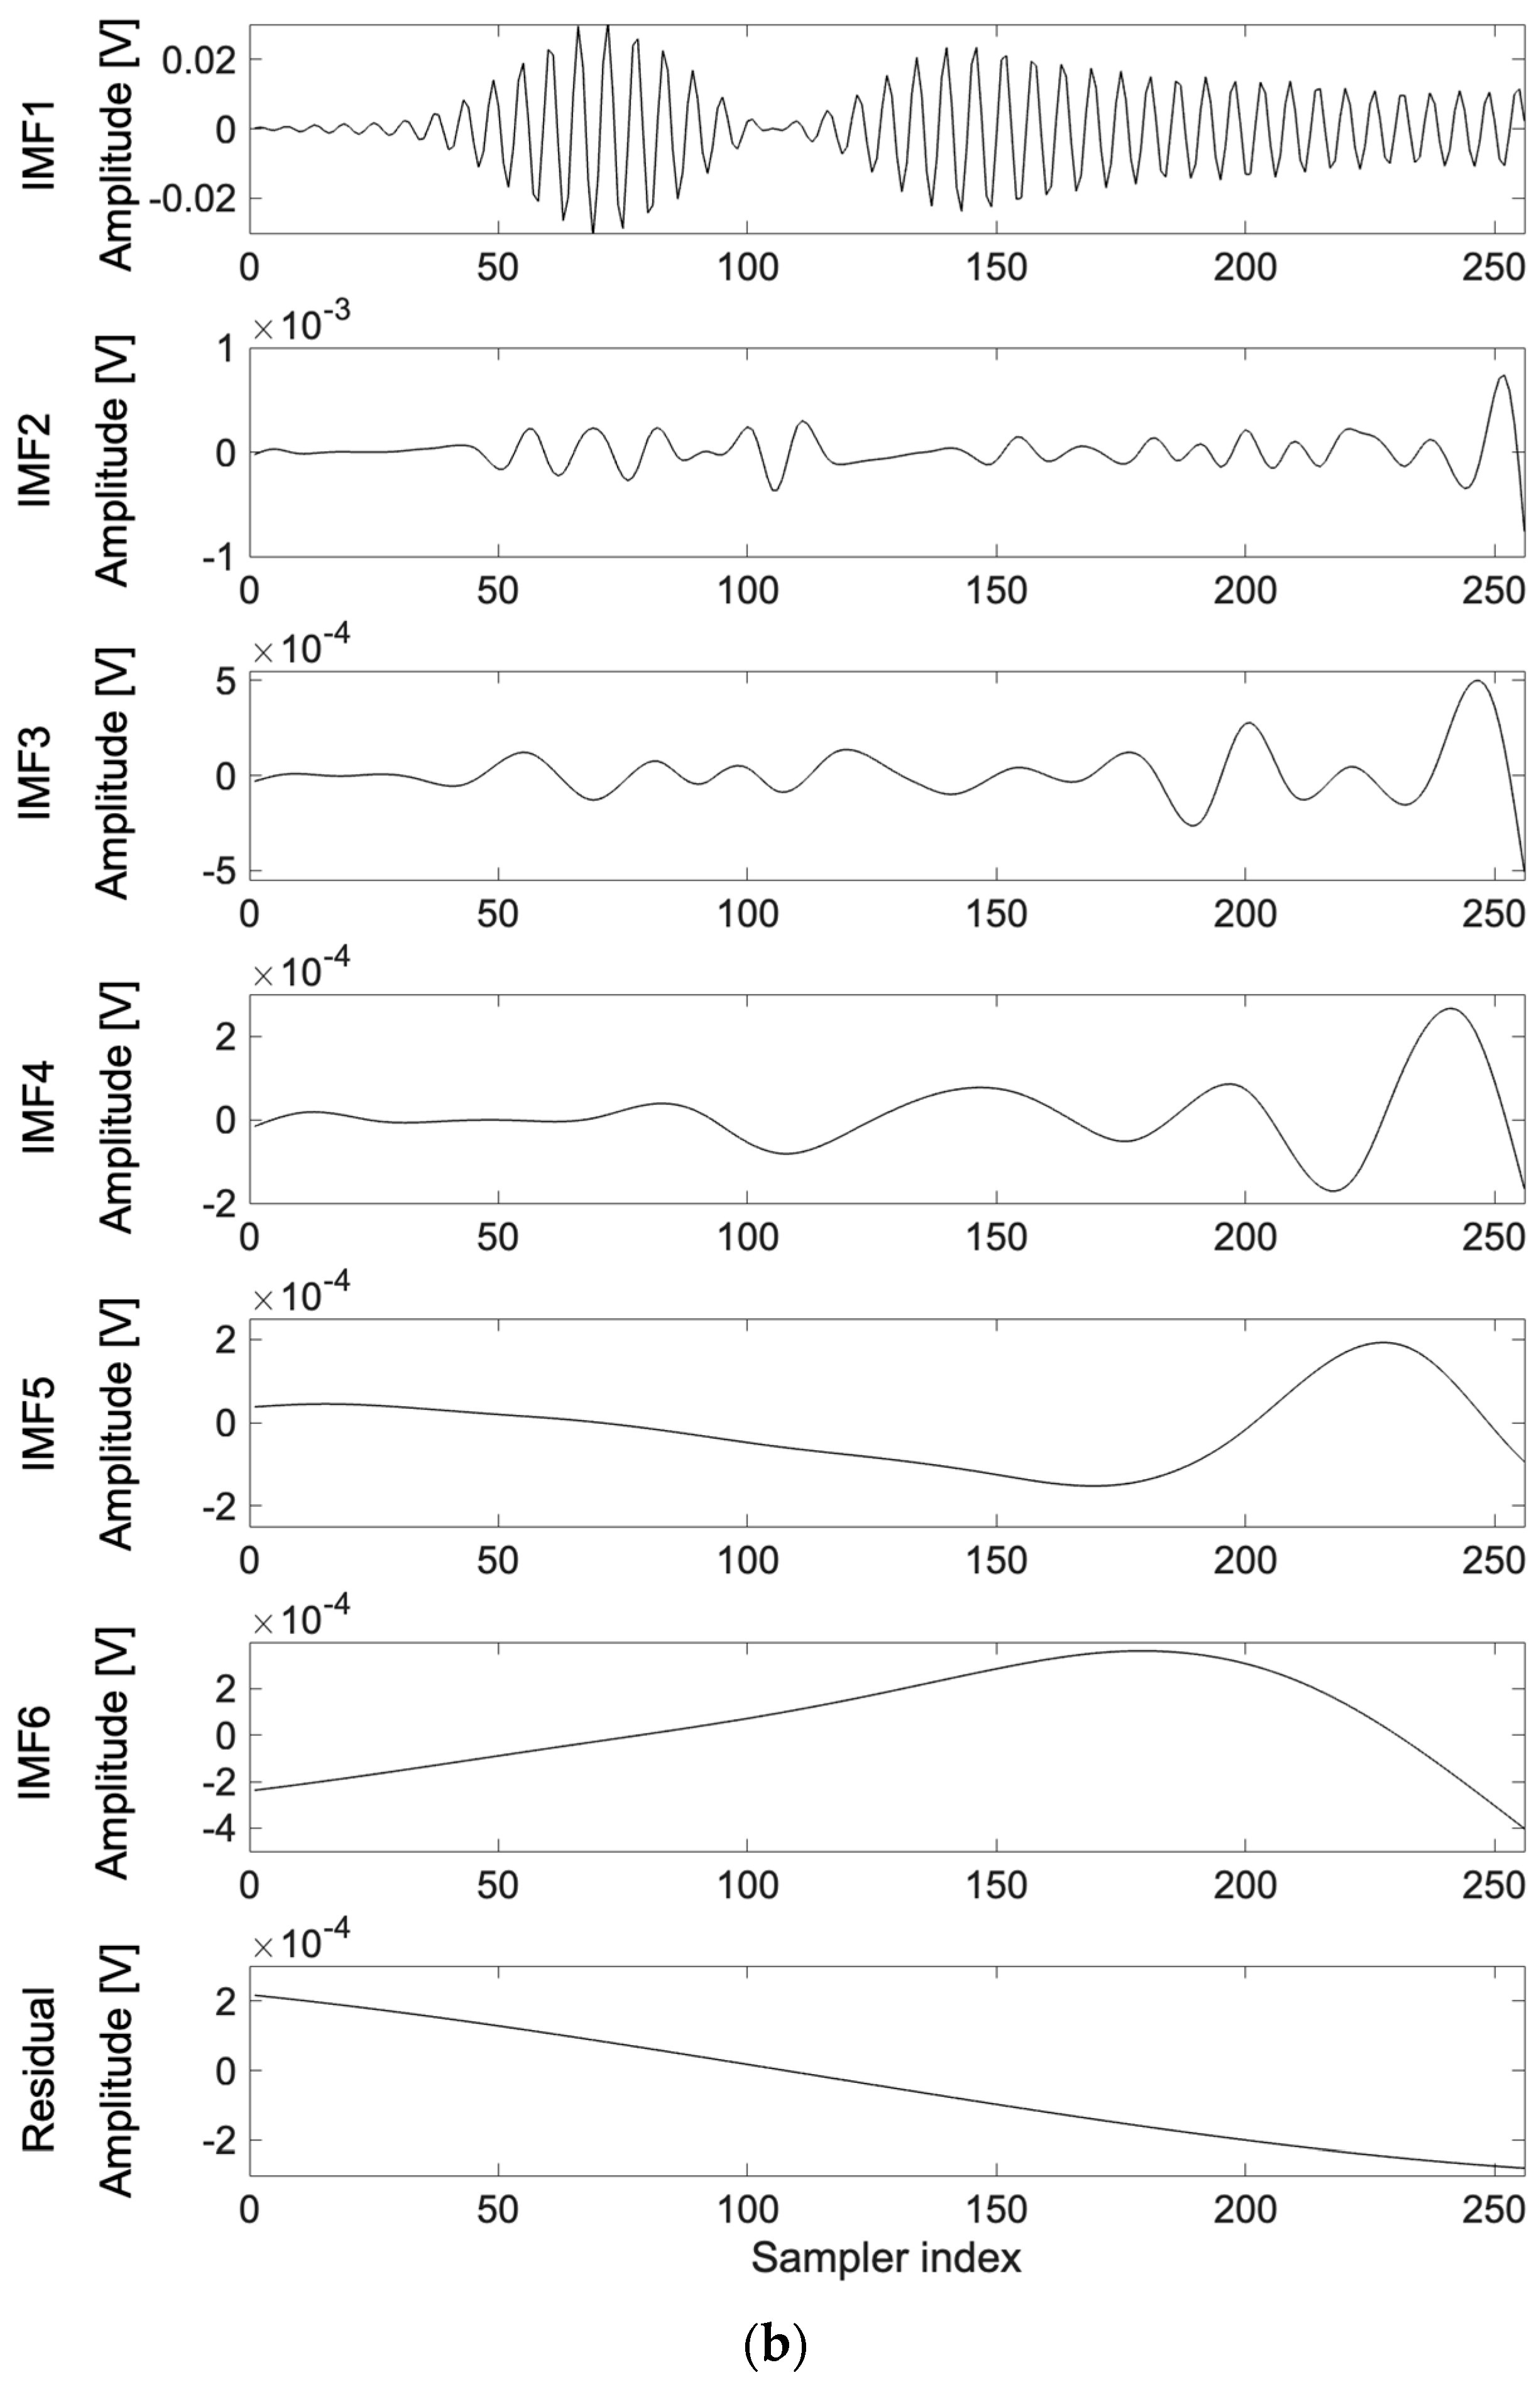
Each decomposed IMF component can be subsequently processed using the Hilbert transform to extract its instantaneous frequency and amplitude. These parameters are then used to construct the Hilbert spectrum, which provides a time–frequency representation that effectively captures the nonlinear and nonstationary characteristics of the original signal. An example of a radar frame acquired while a subject was performing a specific motion, along with its decomposition results using EMD, is shown in Figure 5.
The relative energy distribution of each IMF component derived from the radar frame example shown in Figure 5a is given in Table 1. Table 1 lists the frequency range and relative energy distribution of each IMF component and the residual signal obtained from the EMD analysis of the radar frame shown in Figure 5a. The results indicate that IMF1 accounts for 99.90% of the total signal energy, implying that this component contains nearly all the dominant spectral information of the original signal. The 6.34–7.21 GHz frequency band of IMF1 is compatible with the radar’s central frequency (6.8 GHz), suggesting that the fine phase shifts induced by human motion are predominantly captured in this band. The remaining IMF components (IMF2–IMF6) carry negligible energy, each contributing only between 0.01% and 0.04%. These components represent low-frequency elements that may correspond to low-frequency noise, environmental influences, or subtle biological motions. In particular, IMF6 and its residual component have minimal energy content and may be considered insignificant for motion characterization in this context.

3.3.2. EWT Applied to Radar Frames

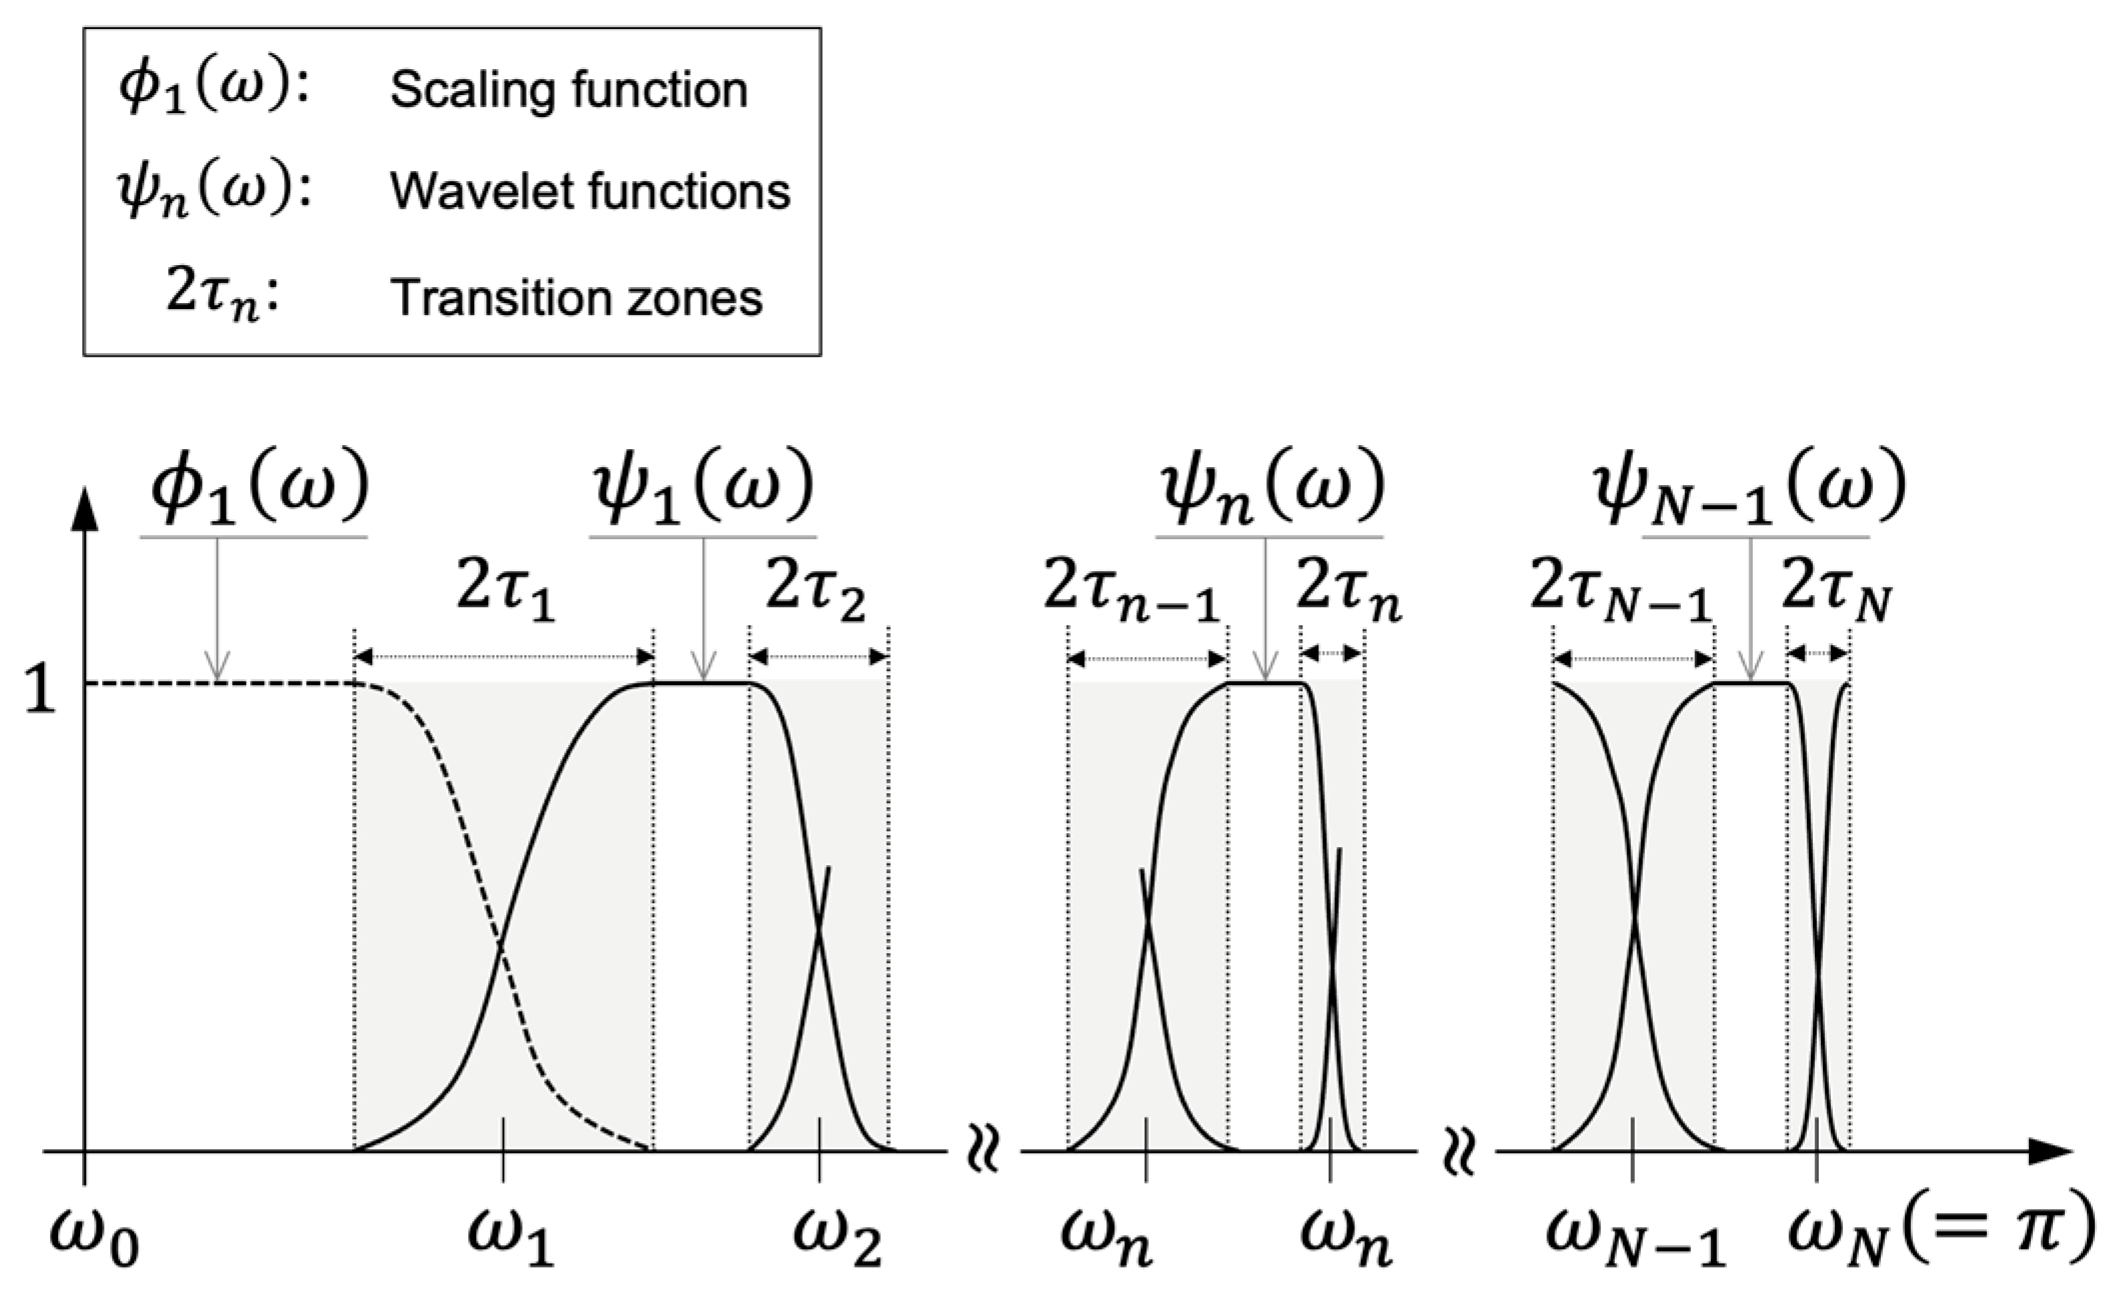
The EWT algorithm primarily comprises three stages. In the first stage, the input 1D radar signal x t is transformed into the frequency domain to obtain its spectrum X ω via the Fourier transform. From this spectrum, a set of N + 1 characteristic boundary frequencies { ω k ,   0     k     N } is extracted. These boundary frequencies are identified by locating local maxima within the signal spectrum. On the frequency axis, ω 0 corresponds to zero, and ω N corresponds to π. In the second stage, an adaptive filter bank based on the extracted boundary frequencies is designed to isolate the frequency bands. To ensure smooth transitions around each boundary and to minimize spectral leakage between adjacent bands, appropriate window functions are employed. Thus, a smoothly varying transition zone is obtained around each boundary. Specifically, the filter bank consists of scaling functions Φ n ω and wavelet functions Ψ n ω , each constructed using the corresponding boundary frequency ω n and half-width of the transition zone τ n , for 0 ≤ nN. Figure 6 shows an example in the frequency domain, showing the N + 1 boundary frequencies along with one of the resulting scaling functions Φ n ω and the N − 1 wavelet functions Ψ n ω derived from them.
By multiplying each of the designed filters with the Fourier transform X ω of the original signal x t , and subsequently applying the inverse Fourier transform, one can obtain the wavelet coefficients (also referred to as detail coefficients), denoted as W f ε n , t , and the scaling coefficient (also called the approximation coefficient), denoted as W f e 0 , t .
W f ε n , t = x τ ψ n t τ ¯   d τ = F 1 X ω ψ n ¯ ω
Here, ψ n t represents the inverse Fourier transform of Ψ n ω , and the overline symbol · ¯ denotes the complex conjugate.
W f ε 0 , t = x τ   ϕ 1 t τ ¯ d τ = F 1 X ω Φ 1 ¯ ω
Here, ϕ 1 t denotes the inverse Fourier transform of Φ 1 ω , and the overline symbol · ¯ indicates the complex conjugate.
These coefficients serve as the basis for reconstructing the original signal via empirical wavelet modes. These modes exhibit distinct spectral and temporal characteristics that are conducive to further analysis. Accordingly, the original signal x t can be reconstructed using the coefficients obtained from the above equations:
x t   =   W f ε 0 , t ϕ 1 t   +   n   =   2 N W f ε n , t ψ n t
Based on this decomposition, each empirical mode x n t is defined as follows:
x 0 t   =   W f ε 0 , t ϕ 1 t
x n t = W f ε n , t ψ n t           f o r   n = 1 ,   2 ,   ,   N 1
The resulting signal components x 0 t and x n t exhibit distinct time–frequency characteristics, which are particularly advantageous in subsequent processing stages, such as the application of the Hilbert transform to calculate the instantaneous frequency (IF) and generating 2D time–frequency representations in the form of Hilbert spectra.
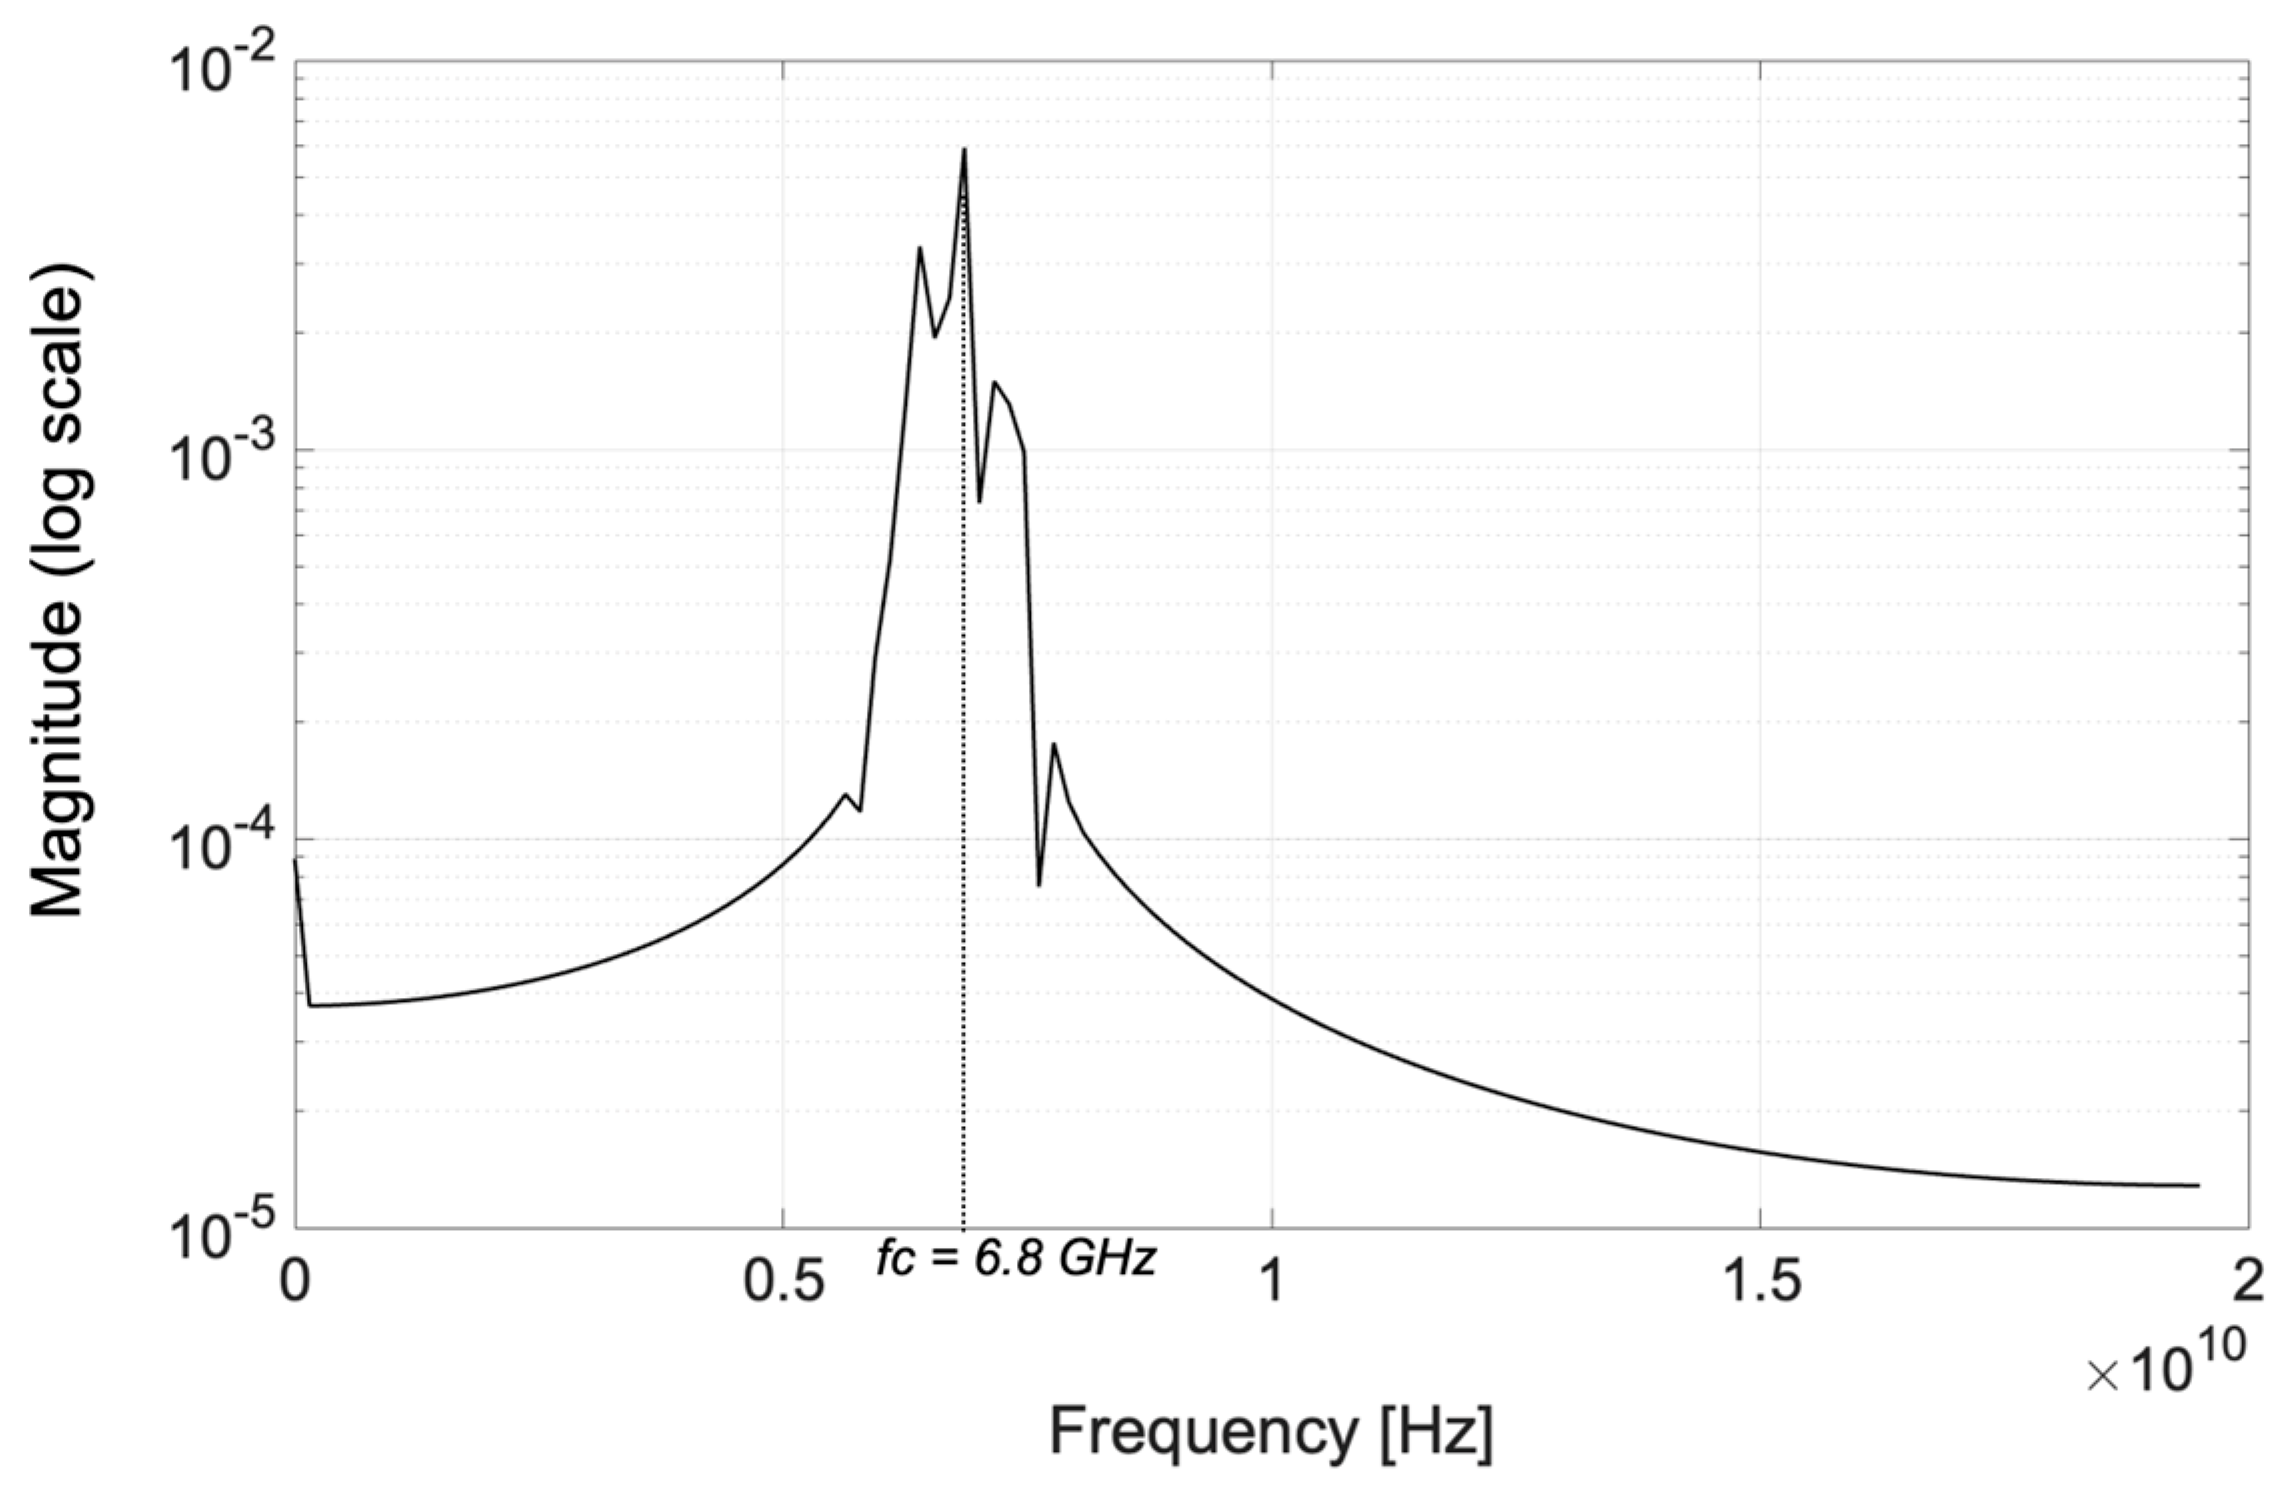
The frequency spectrum (Figure 7) of the radar frame shown in Figure 5a, which was obtained through actual measurements, reveals a single dominant spectral peak centered around 6.80 GHz—the central frequency of the UWB radar signal. The spectral concentration indicates that most of the signal energy is confined to a frequency region near the central frequency. In such cases, it becomes challenging to implement the core principle of EWT, which relies on identifying distinct boundary frequencies along the frequency axis to construct an adaptive filter bank for multiband decomposition.
As shown in Table 2, the boundary frequency extraction process under these conditions results in the division of the spectrum into one major frequency band near the central frequency and additional high-frequency bands that contain little to no spectral content. Specifically, the 6.34–7.21 GHz frequency band contained nearly all of the signal energy, emphasizing the dominance of the central peak. Consequently, under such spectral characteristics, the application of EWT to MRA may not yield multiple meaningful empirical modes, in contrast to the typical EMD results.
Applying EWT to UWB radar frames may appear to undermine the essence of data-adaptive MRA, as it typically results in only one dominant empirical mode function rather than multiple decomposed modes. However, this apparent limitation offers a valuable physical insight: the position along the frequency axis and the bandwidth of the dominant frequency component vary as a function of human motion, providing a key discriminative feature that reflects movement dynamics. When transformed via the Hilbert transform, these variations are manifested as distinct trajectories in the 2D time–frequency Hilbert spectrum, serving as critical motion-characterizing factors. A similar interpretation can be applied to the EMD results. As shown in Figure 5b and Table 1, most of the spectral energy is concentrated in IMF1. Hence, IMF1 can be regarded as equivalent to the dominant empirical mode extracted by EWT. Consequently, IMF1 represents a dominant frequency band whose spectral position and bandwidth vary with different human motions. When visualized through the Hilbert spectrum, these variations provide informative cues for distinguishing different motions. To validate this hypothesis, a sequence of radar frames was extracted during a representative action—bending the upper body forward and returning to the upright position. For each selected frame, the dominant empirical modes obtained from both EWT and EMD were analyzed in the frequency domain.
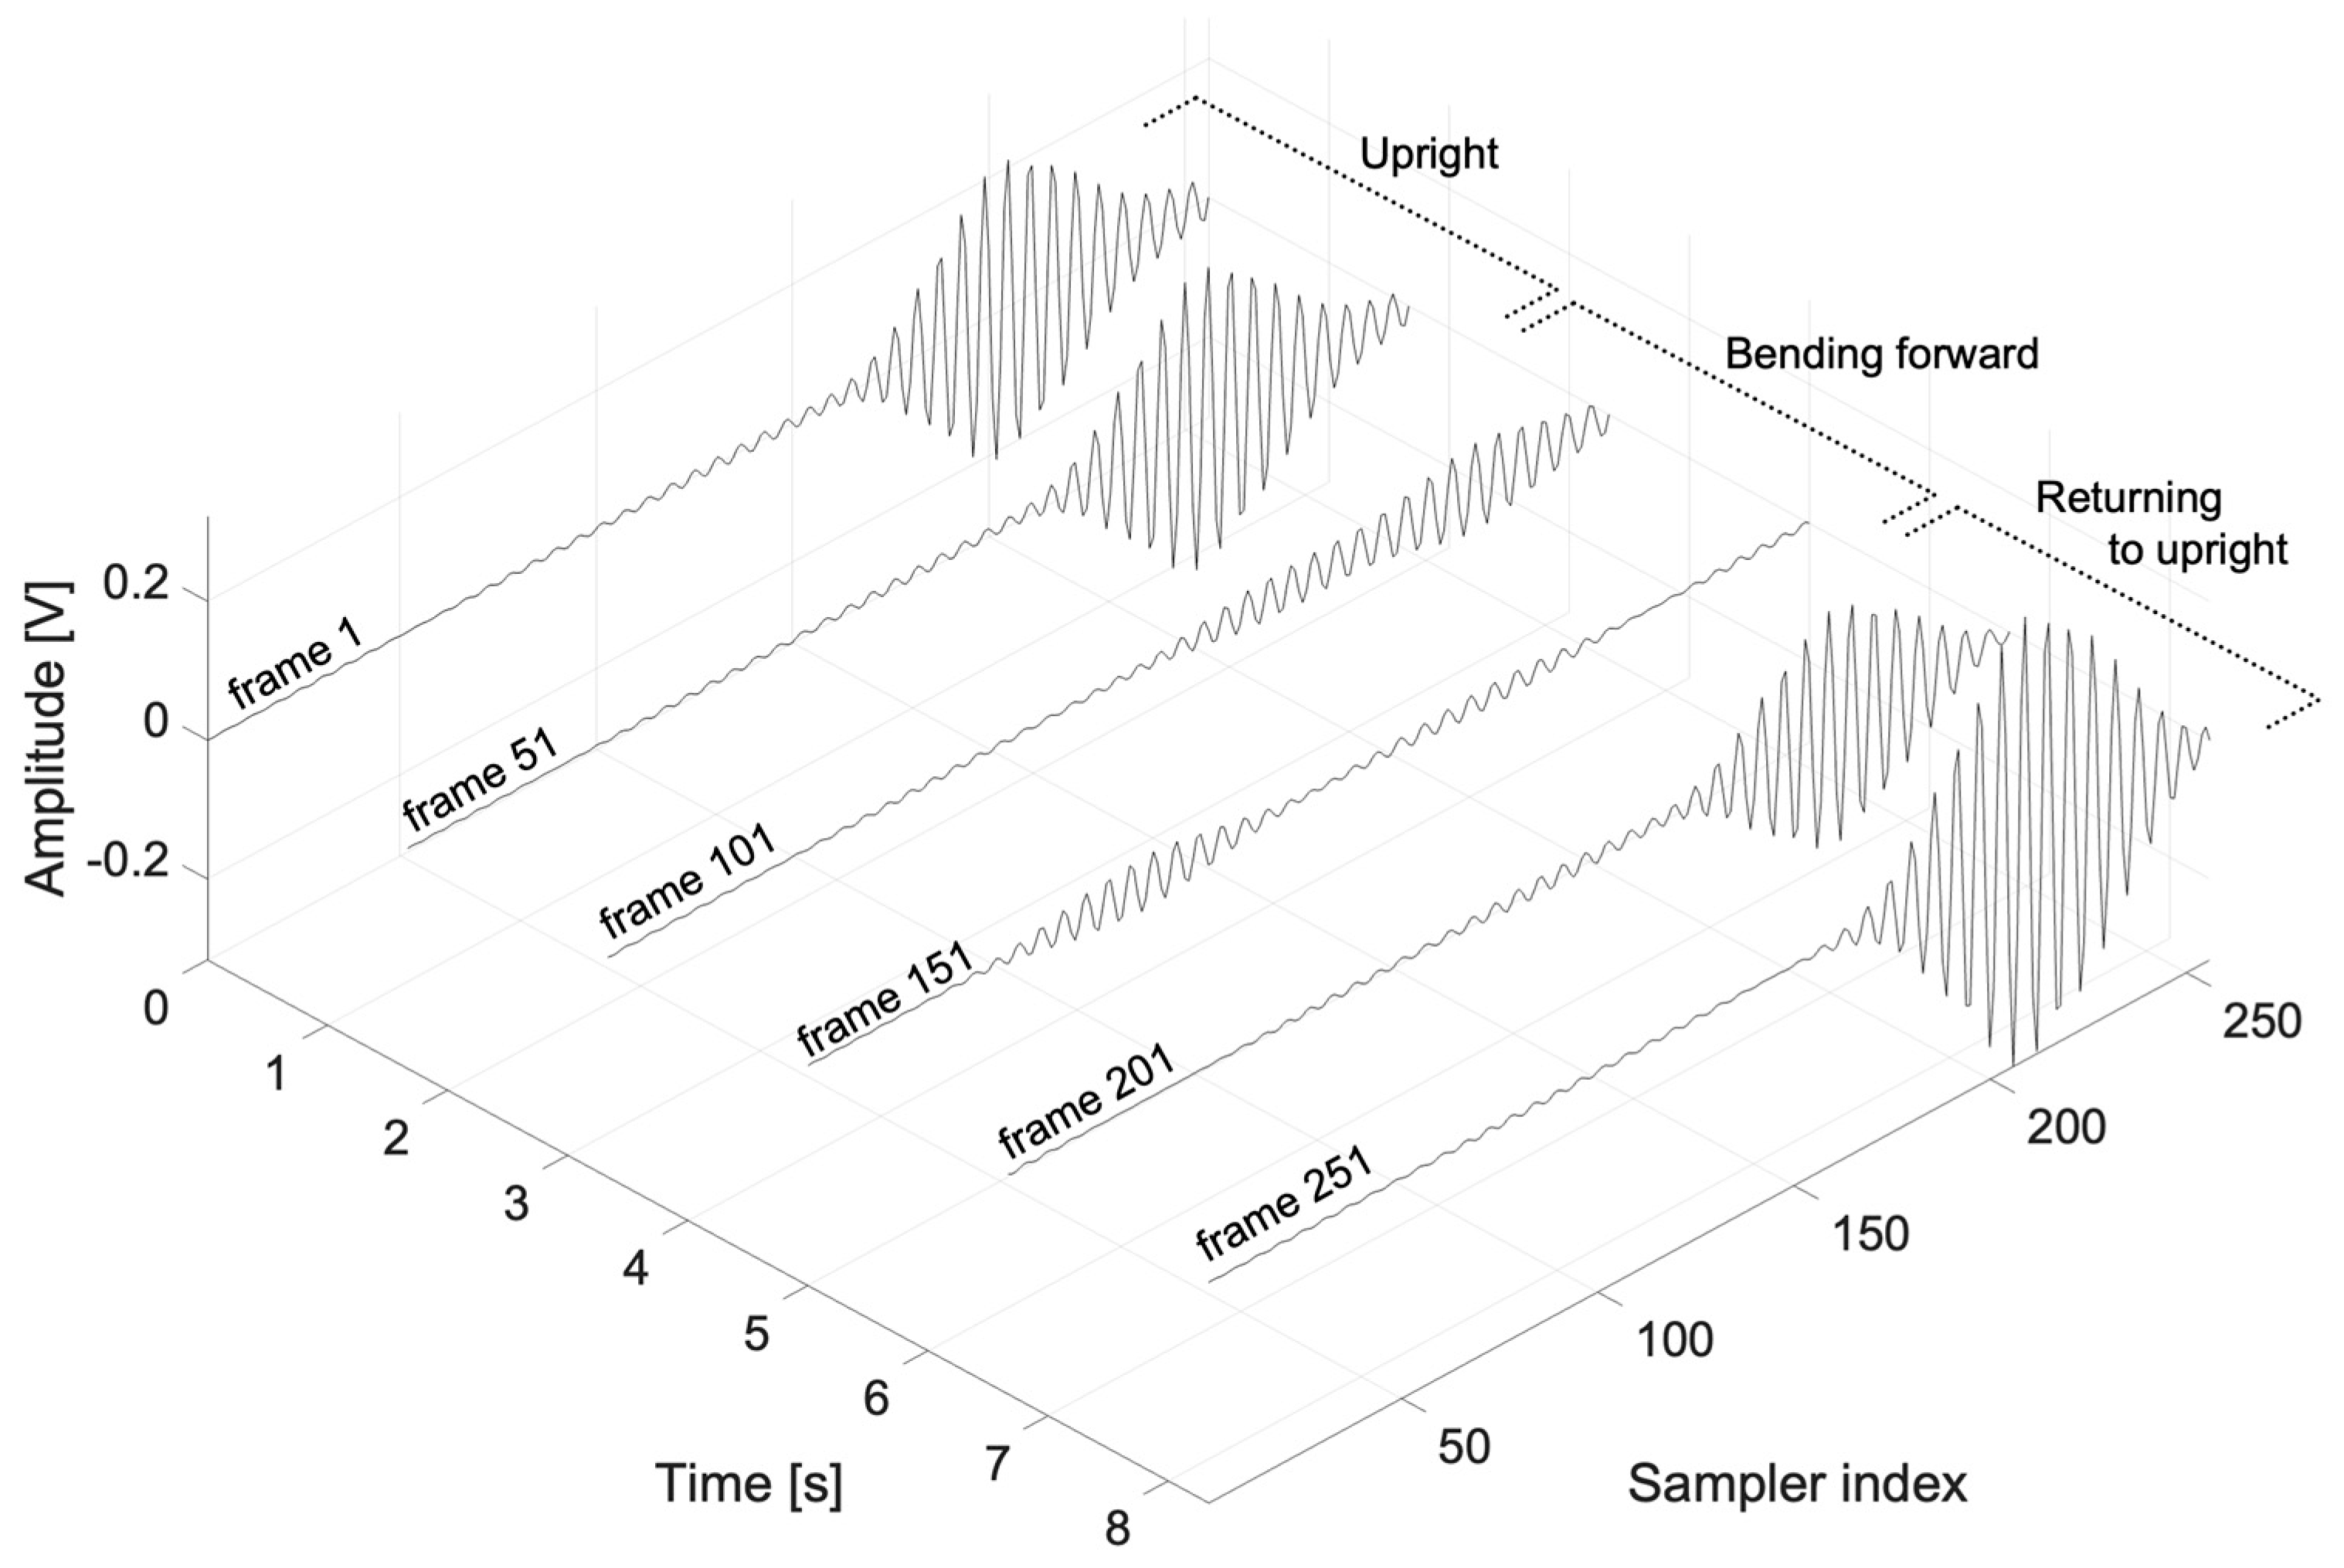
Figure 8 shows a sequence of radar frames captured at different time points while the subject performs a bending and returning motion. The dominant empirical mode functions extracted from each frame using EWT and EMD were analyzed in the frequency domain. Their corresponding frequency band positions, bandwidths, and relative energy distributions are summarized in Table 3. As shown in Table 3, the position and bandwidth of the dominant frequency band vary over time as the motion progresses. This observation confirms that both EWT and EMD, when applied as data-adaptive MRA techniques to radar frames, can capture the temporally evolving frequency characteristics influenced by human movement. However, although EMD performs fully adaptive decomposition, it is prone to mode mixing. This may lead to ambiguous frequency representations where individual IMFs fail to distinctly characterize separate frequency bands. Moreover, the EMD results are often sensitive to noise and boundary conditions, potentially compromising the reproducibility of the decomposition. In particular, mode-mixing artifacts can be manifested as spurious components in the Hilbert spectrum, leading to degraded interpretability. In contrast, for radar signals exhibiting a strong spectral peak concentrated around a central frequency—as is the case in this study—EWT is more advantageous for extracting high-purity spectral features. The dominant component extracted by EWT, when subjected to the Hilbert transform, enables accurate tracking of instantaneous frequency variations, thereby offering high sensitivity to subtle phase changes induced by human movement. This characteristic is critical for enhancing the accuracy and reliability of the proposed UWB radar-based human motion recognition system. Hence, EWT was chosen as the preferred MRA method for processing radar frames in the proposed framework.

3.3.3. Hilbert Spectrum Transformation of Mode Components

While empirical decomposition by EWT effectively and adaptively separates the original radar signal into mode components, it cannot by itself comprehensively capture the temporal and spectral characteristics of the signal. The UWB radar signals undergo subtle Doppler-induced phase variations continuously during human motion, necessitating an analytical framework that incorporates instantaneous frequency variations throughout the signal acquisition period. To address this need, the present study proposed a method for representing the EWT-based empirical mode components as a Hilbert spectrum. This approach is conceptually similar to the Hilbert–Huang transform (HHT) [50], which combines EMD with Hilbert spectral analysis.
The Hilbert transform enables the conversion of a real-valued signal into a complex analytic signal to extract the instantaneous amplitude (also known as the envelope) and instantaneous frequency [24]. One of the key advantages of coupling EWT with the Hilbert transform is that the instantaneous frequency can be derived from the time derivative of the signal phase. In this context, the instantaneous frequency effectively reflects the phase change rate, enabling the direct tracking of local phase variations in the signal. This capability is particularly beneficial for detecting fine-grained movements associated with Doppler-frequency shifts. Furthermore, by independently tracking the instantaneous frequency within each frequency band defined by EWT, the frequency variations attributed to different types of movement or their respective physical causes can be separately observed. This facilitates the isolation and analysis of distinct Doppler characteristics even in scenarios involving overlapping motion components. In summary, the Hilbert transform of the band-separated signals produced by EWT provides detailed temporal profiles of the instantaneous frequency of each component. This enables the precise characterization of motion dynamics, including variations in the movement speed and periodicity, thereby enhancing the discriminatory power of the proposed radar-based motion recognition system.
The Hilbert transform is a mathematical technique used to construct an analytic signal by generating an imaginary component from a real-valued signal. It is defined as follows:
x ^ t   =   1 π x τ t τ d τ
Here, x t represents the original real signal and x ^ t denotes the imaginary component derived by the Hilbert transform. By combining the real x t and imaginary x ^ t parts, the analytic signal z t can be expressed in the following complex-valued form:
z t   =   x t   +   j x ^ t   =   a t e j θ t
In this expression, a t denotes the instantaneous amplitude and θ t denotes the instantaneous phase. The instantaneous frequency can then be derived by taking the time derivative of the instantaneous phase θ t . In this study, the Hilbert transform is applied to each empirical mode function obtained through EWT, namely x 0 t and x n t , to construct a set of analytic signals defined as follows:
z i t   =   a i t e j θ i t   ,     0     i     N
From each analytic signal, the instantaneous amplitude and frequency corresponding to each empirical mode function can be extracted. These quantities are then jointly represented on a 2D time–frequency plane, forming what is referred to as the Hilbert spectrum. This spectrum describes how the energy (amplitude) of the signal is distributed with respect to both time and frequency, enabling a clear visualization of how motion-related features evolve over time. Moreover, by mapping the amplitude of each frequency component to a corresponding intensity level, the Hilbert spectrum can be visualized as a color image. This image format is well suited for use as an input in image-based or video-based deep learning models for classification tasks.
Figure 9 shows the Hilbert spectrum obtained by sequentially applying EWT and the Hilbert transform to a single radar frame, as shown in Figure 5a. The figure shows notable shifts in frequency over time around the central frequency of 6.8 GHz because of the reflective surface geometry of the human body at specific moments during a given motion. These frequency deviations result from subtle phase variations in the reflected radar pulses.
When such spectral information is derived from a temporally continuous sequence of radar frames, it functions as a unique signature corresponding to a specific human motion. This finding confirms that the proposed EWT–Hilbert transform signal-processing pipeline can effectively highlight motion-specific features. The results also demonstrate the strong potential of the method to improve the clarity and accuracy of human motion classification in practical radar-based recognition systems.

3.4. Deep-Learning-Based Human Motion Classification Using Video Data

Although conventional 2D deep learning models can capture spatial features in individual images, they are inherently limited in modeling the temporal continuity and progression of human motion. To address this limitation, a video-format dataset was constructed by transforming 1D radar pulse signals into Hilbert spectra via EWT and Hilbert transform and then arranging the resulting frames in temporal order. This representation enables the model to preserve temporal dynamics and supports joint learning of spatial and temporal characteristics embedded in human activity. Hence, we adopted a deep neural network specifically designed for video-based action recognition to maximize classification performance by fully utilizing the inherent temporal dynamics of the radar signal.

3.4.1. Generation of Video-Format Data for Deep Learning

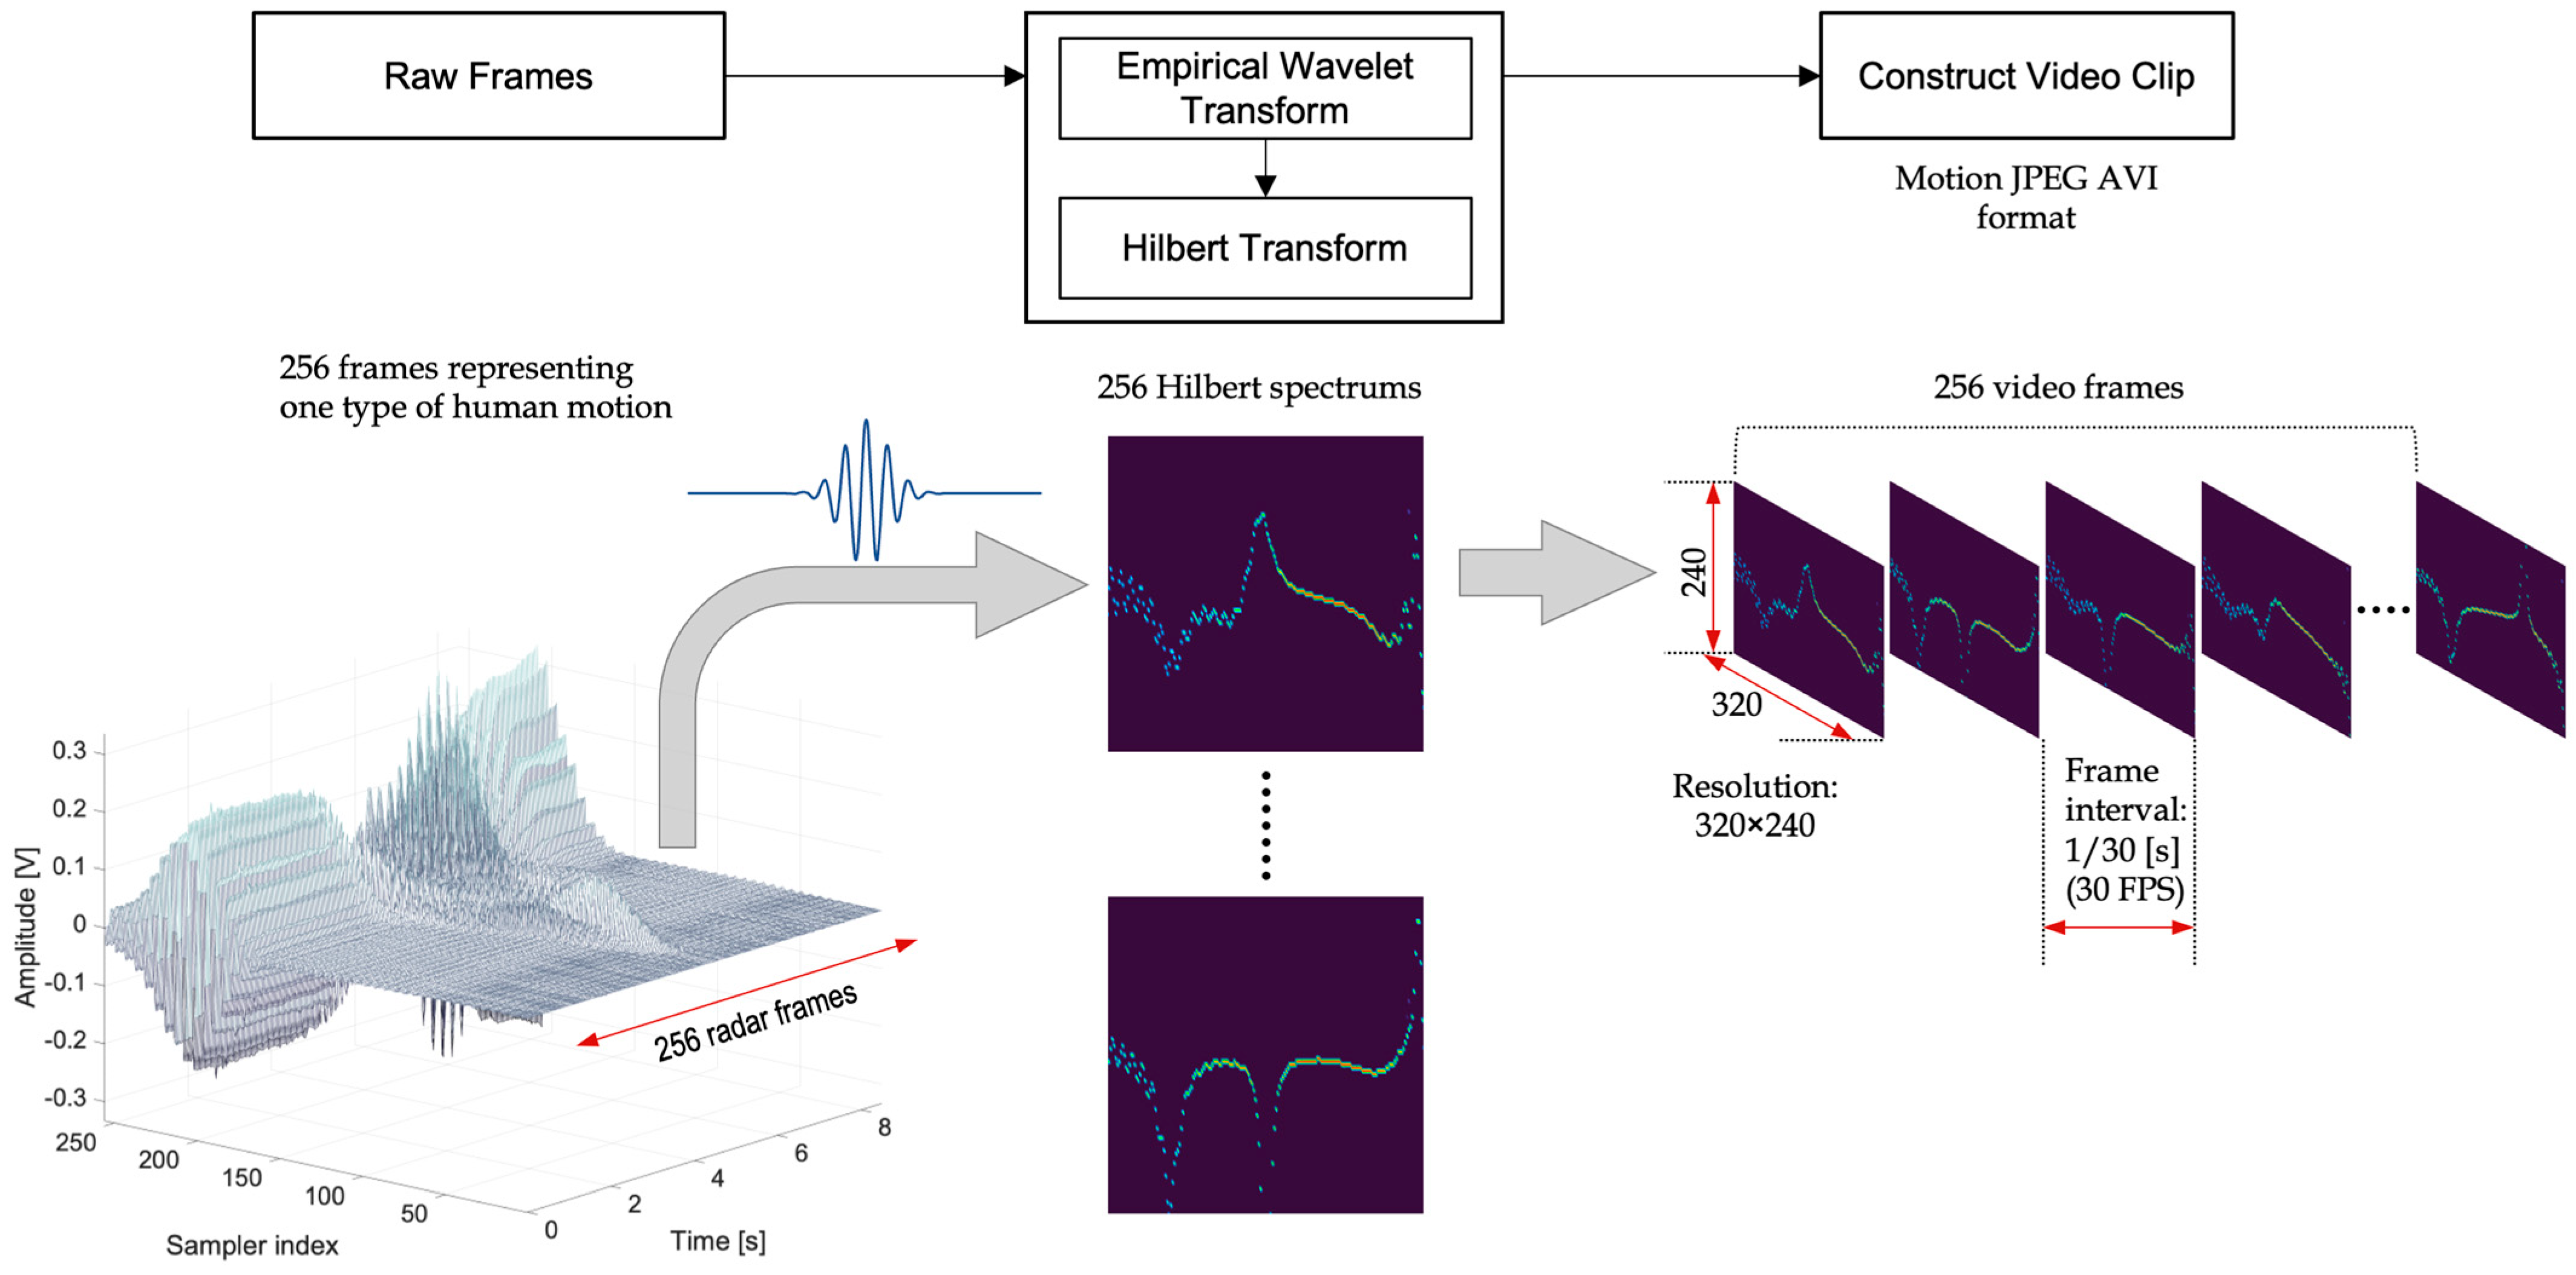
A video sequence can be generated by chronologically aligning Hilbert spectrum images extracted from temporally sequential radar frames collected during a specific motion. This video data clip captures the subtle phase variations associated with that action over time and serves as input for training deep learning models designed for motion classification. The complete workflow for generating the video dataset from the radar frame data is shown in Figure 10. For each motion type, 256 radar frames were collected. As described in Section 3.2, the radar pulses reflected from the human body were acquired at intervals of one-thirtieth of a second, implying that 8.53 s are required to acquire all 256 frames. This duration corresponds to the temporal length of a single video clip containing a single motion instance. In other words, in this study, radar pulses captured within an 8.53 s window in which a subject performs a single unit motion were processed and used as the basic data sample for training deep learning models.
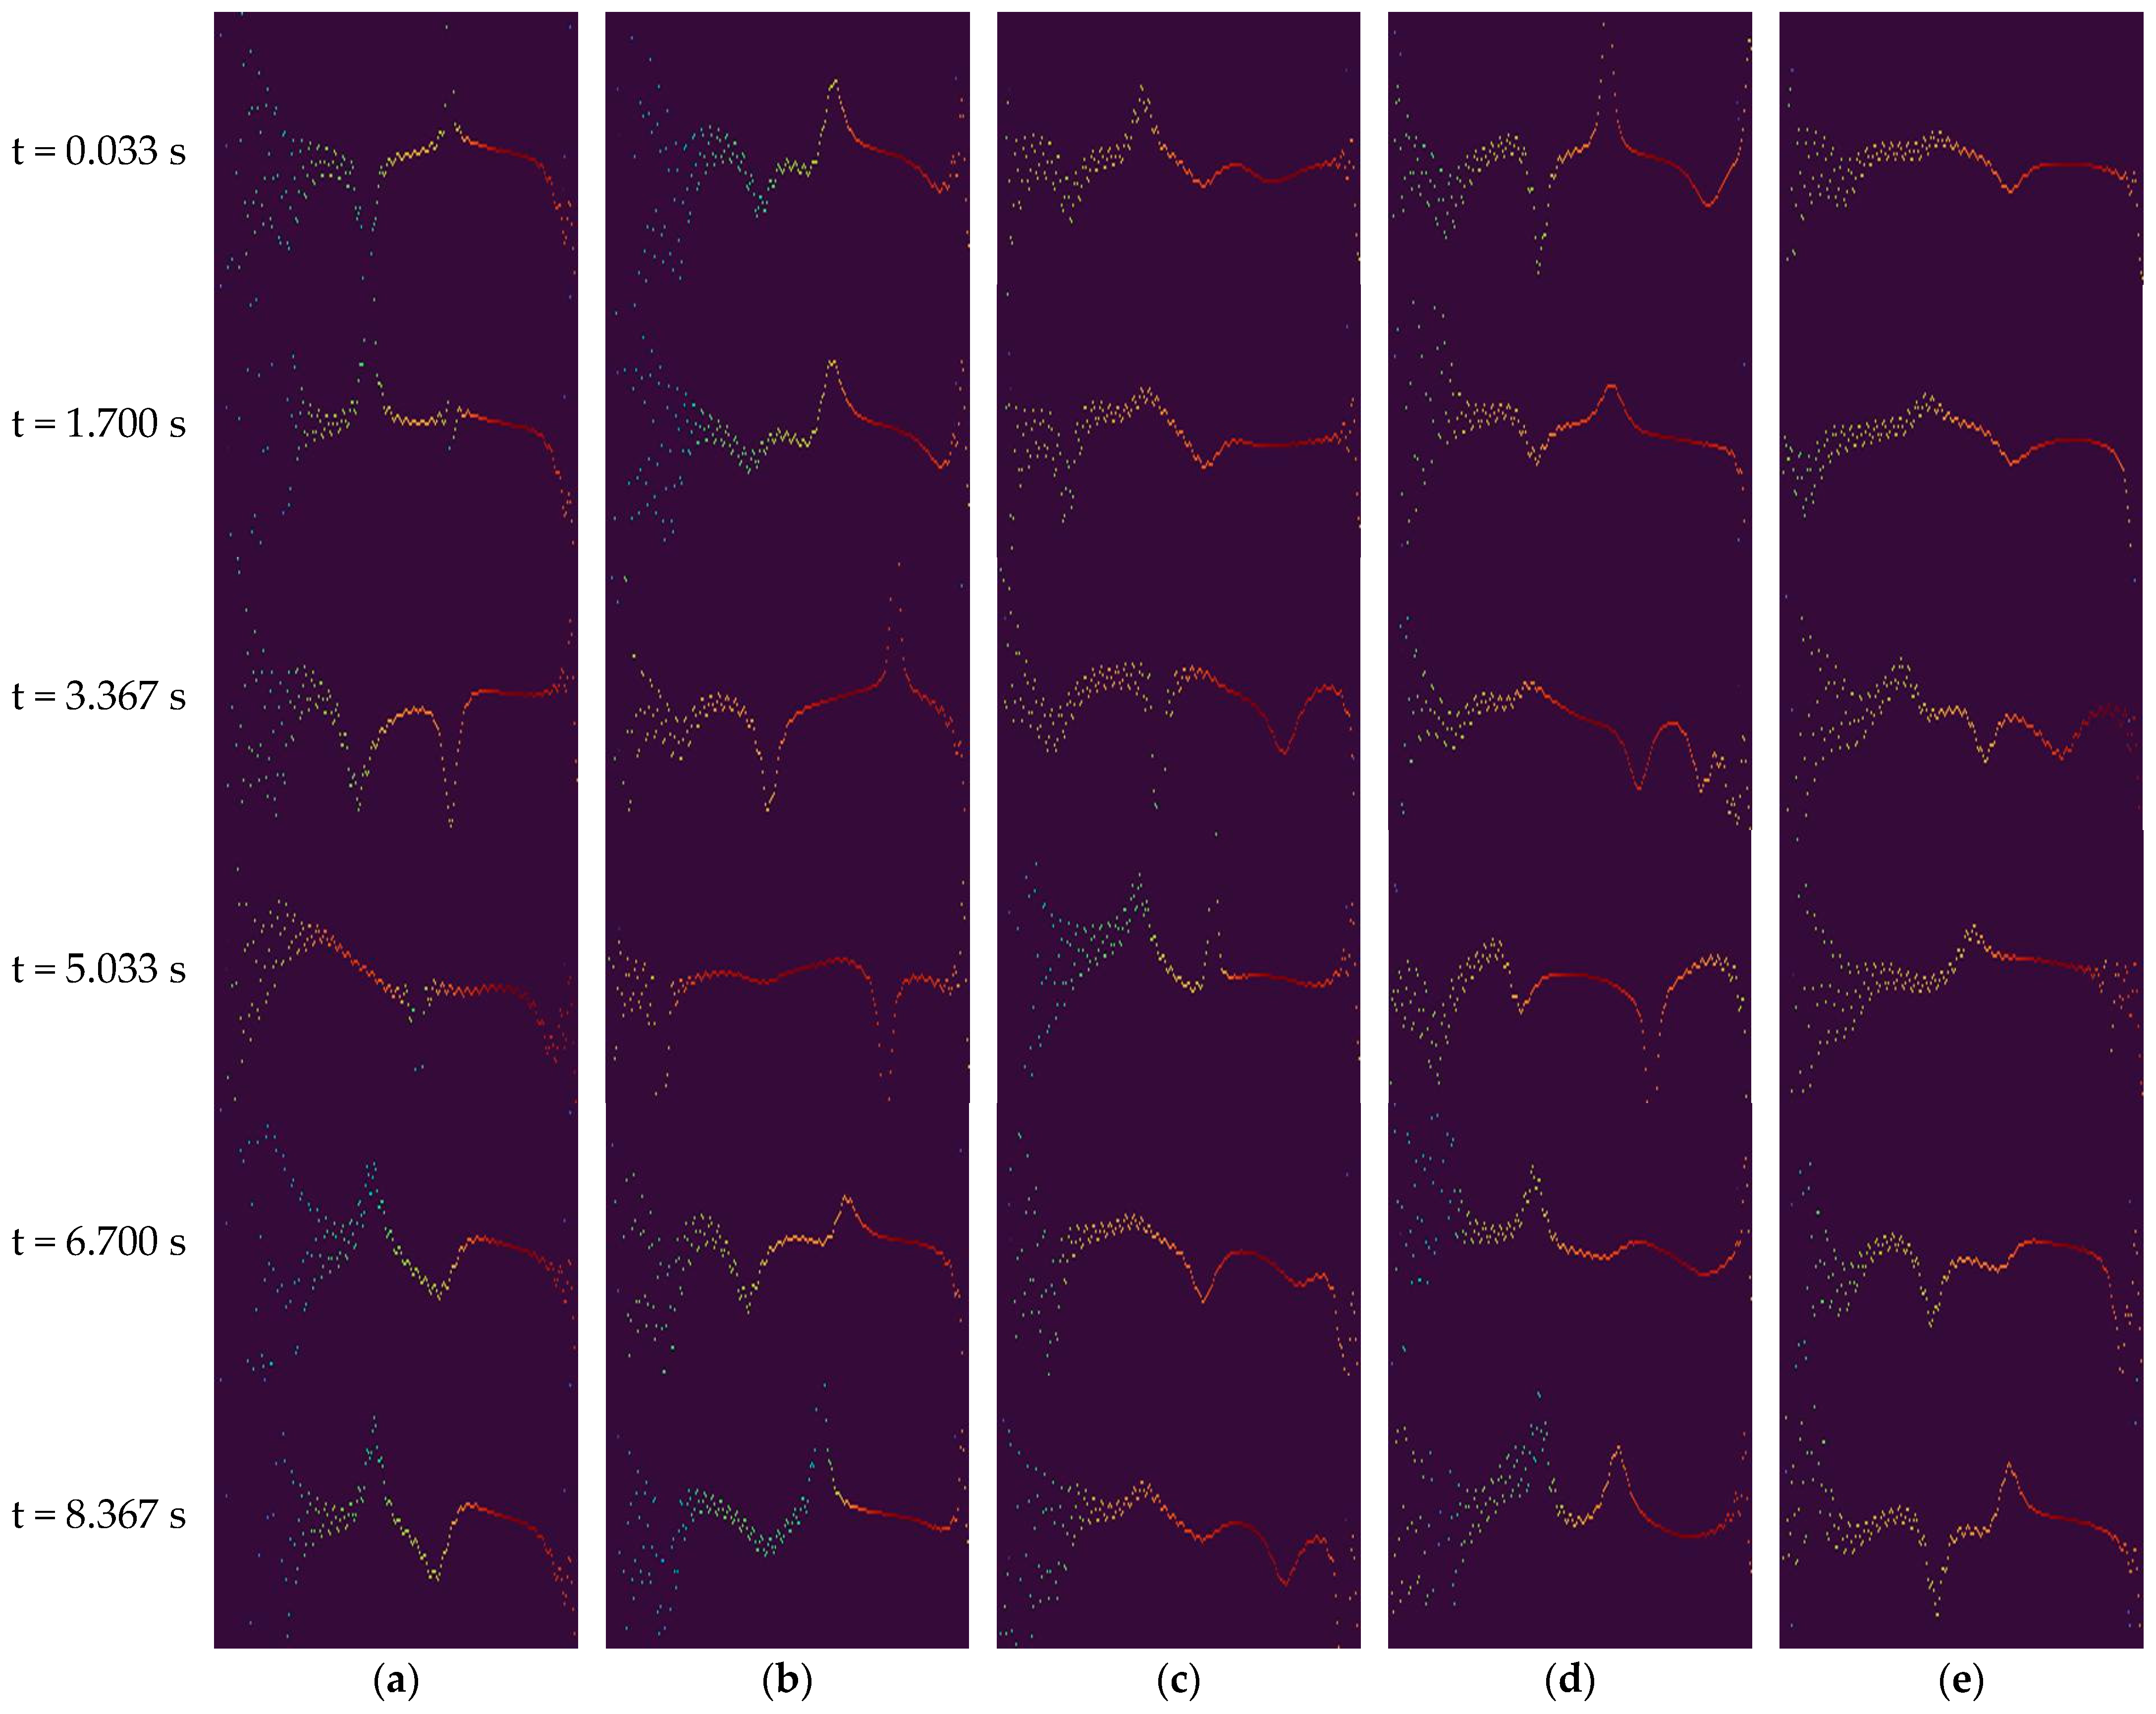
A total of 256 radar frames were processed through EWT and Hilbert transform to generate 256 corresponding spectral images. These images were then temporally ordered and compiled into a video sequence at a frame rate of 30 frames per second. The pulse acquisition interval was set to one-thirtieth of a second to ensure compatibility with the desired frame rate during video construction. A rescaling operation was performed when converting the Hilbert spectra into images so that each output frame had a resolution of 320 × 240 pixels before being assembled into the final video format. The resulting video clips were saved in Motion JPEG AVI format. For each of the five types of human motion, more than 100 video clips were generated, yielding 553 video samples. This dataset was used for the training and evaluation of the SlowFast network, which is a deep learning architecture tailored for video-based human action recognition. Figure 11 presents representative Hilbert spectrum images from each of the five human activities. We can observe distinct spectral patterns for each motion type, with arm movements showing concentrated energy variations around the 6.8 GHz center frequency. The temporal progression shown in these images demonstrates how different activities produce unique time–frequency signatures that enable accurate classification.

3.4.2. Human Motion Classification Using a Video-Based Deep Learning Model

The previous section described how radar signals represented as Hilbert spectrum images effectively captured the time–frequency features, thereby offering strong cues to distinguish and classify various types of human motion. Several deep learning-based network models—e.g., 3D CNN, I3D, and SlowFast networks—can be employed to learn these features and accurately recognize human actions. Specifically, 3D CNN models extend conventional 2D convolution into the temporal dimension to capture spatial and temporal patterns simultaneously. For example, Tran et al. [26] proposed the C3D network, which uses a 3 × 3 × 3 in all layers, demonstrating that action recognition can be performed using visual features extracted from short clips. These 3D convolutional networks offer the advantage of learning intrinsic representations of motion that are not accessible to 2D models and have achieved excellent results on benchmark datasets such as UCF101 [51]. However, 3D CNNs have structural limitations, such as substantial computational demands and the requirement for extensive training data. Because convolutional operations over the temporal axis significantly increase the number of parameters and computational complexity at each layer, these models are often unsuitable for real-time applications. For instance, the C3D network must be pretrained on massive datasets such as Sports-1M to avoid overfitting and ensure stable performance. To overcome these limitations, the I3D network was introduced by Carreira and Zisserman [27]. This model inflates 2D convolution and pooling layers from the Inception-V1 architecture into three dimensions, allowing effective temporal modeling. I3D is based on leveraging pretrained 2D filters from ImageNet [52] as initialization, enabling the efficient learning of 3D features even with a small amount of training data. Furthermore, I3D incorporates a two-stream architecture that combines an RGB stream and an optical flow stream to jointly capture the appearance and motion information. The two-stream I3D model achieved a Top-1 classification accuracy of approximately 75.7% on the Kinetics-400 dataset [53], setting a new standard in video action recognition. However, the optical flow calculation incurs substantial preprocessing overhead, and the dual-path architecture approximately doubles the computational load. Specifically, the single RGB stream requires over 100 giga floating-point operations (GFLOPs), and the complete two-stream model requires over 216 GFLOPs, primarily owing to the complexity of 3D convolutions. This can increase computational burden during inference.
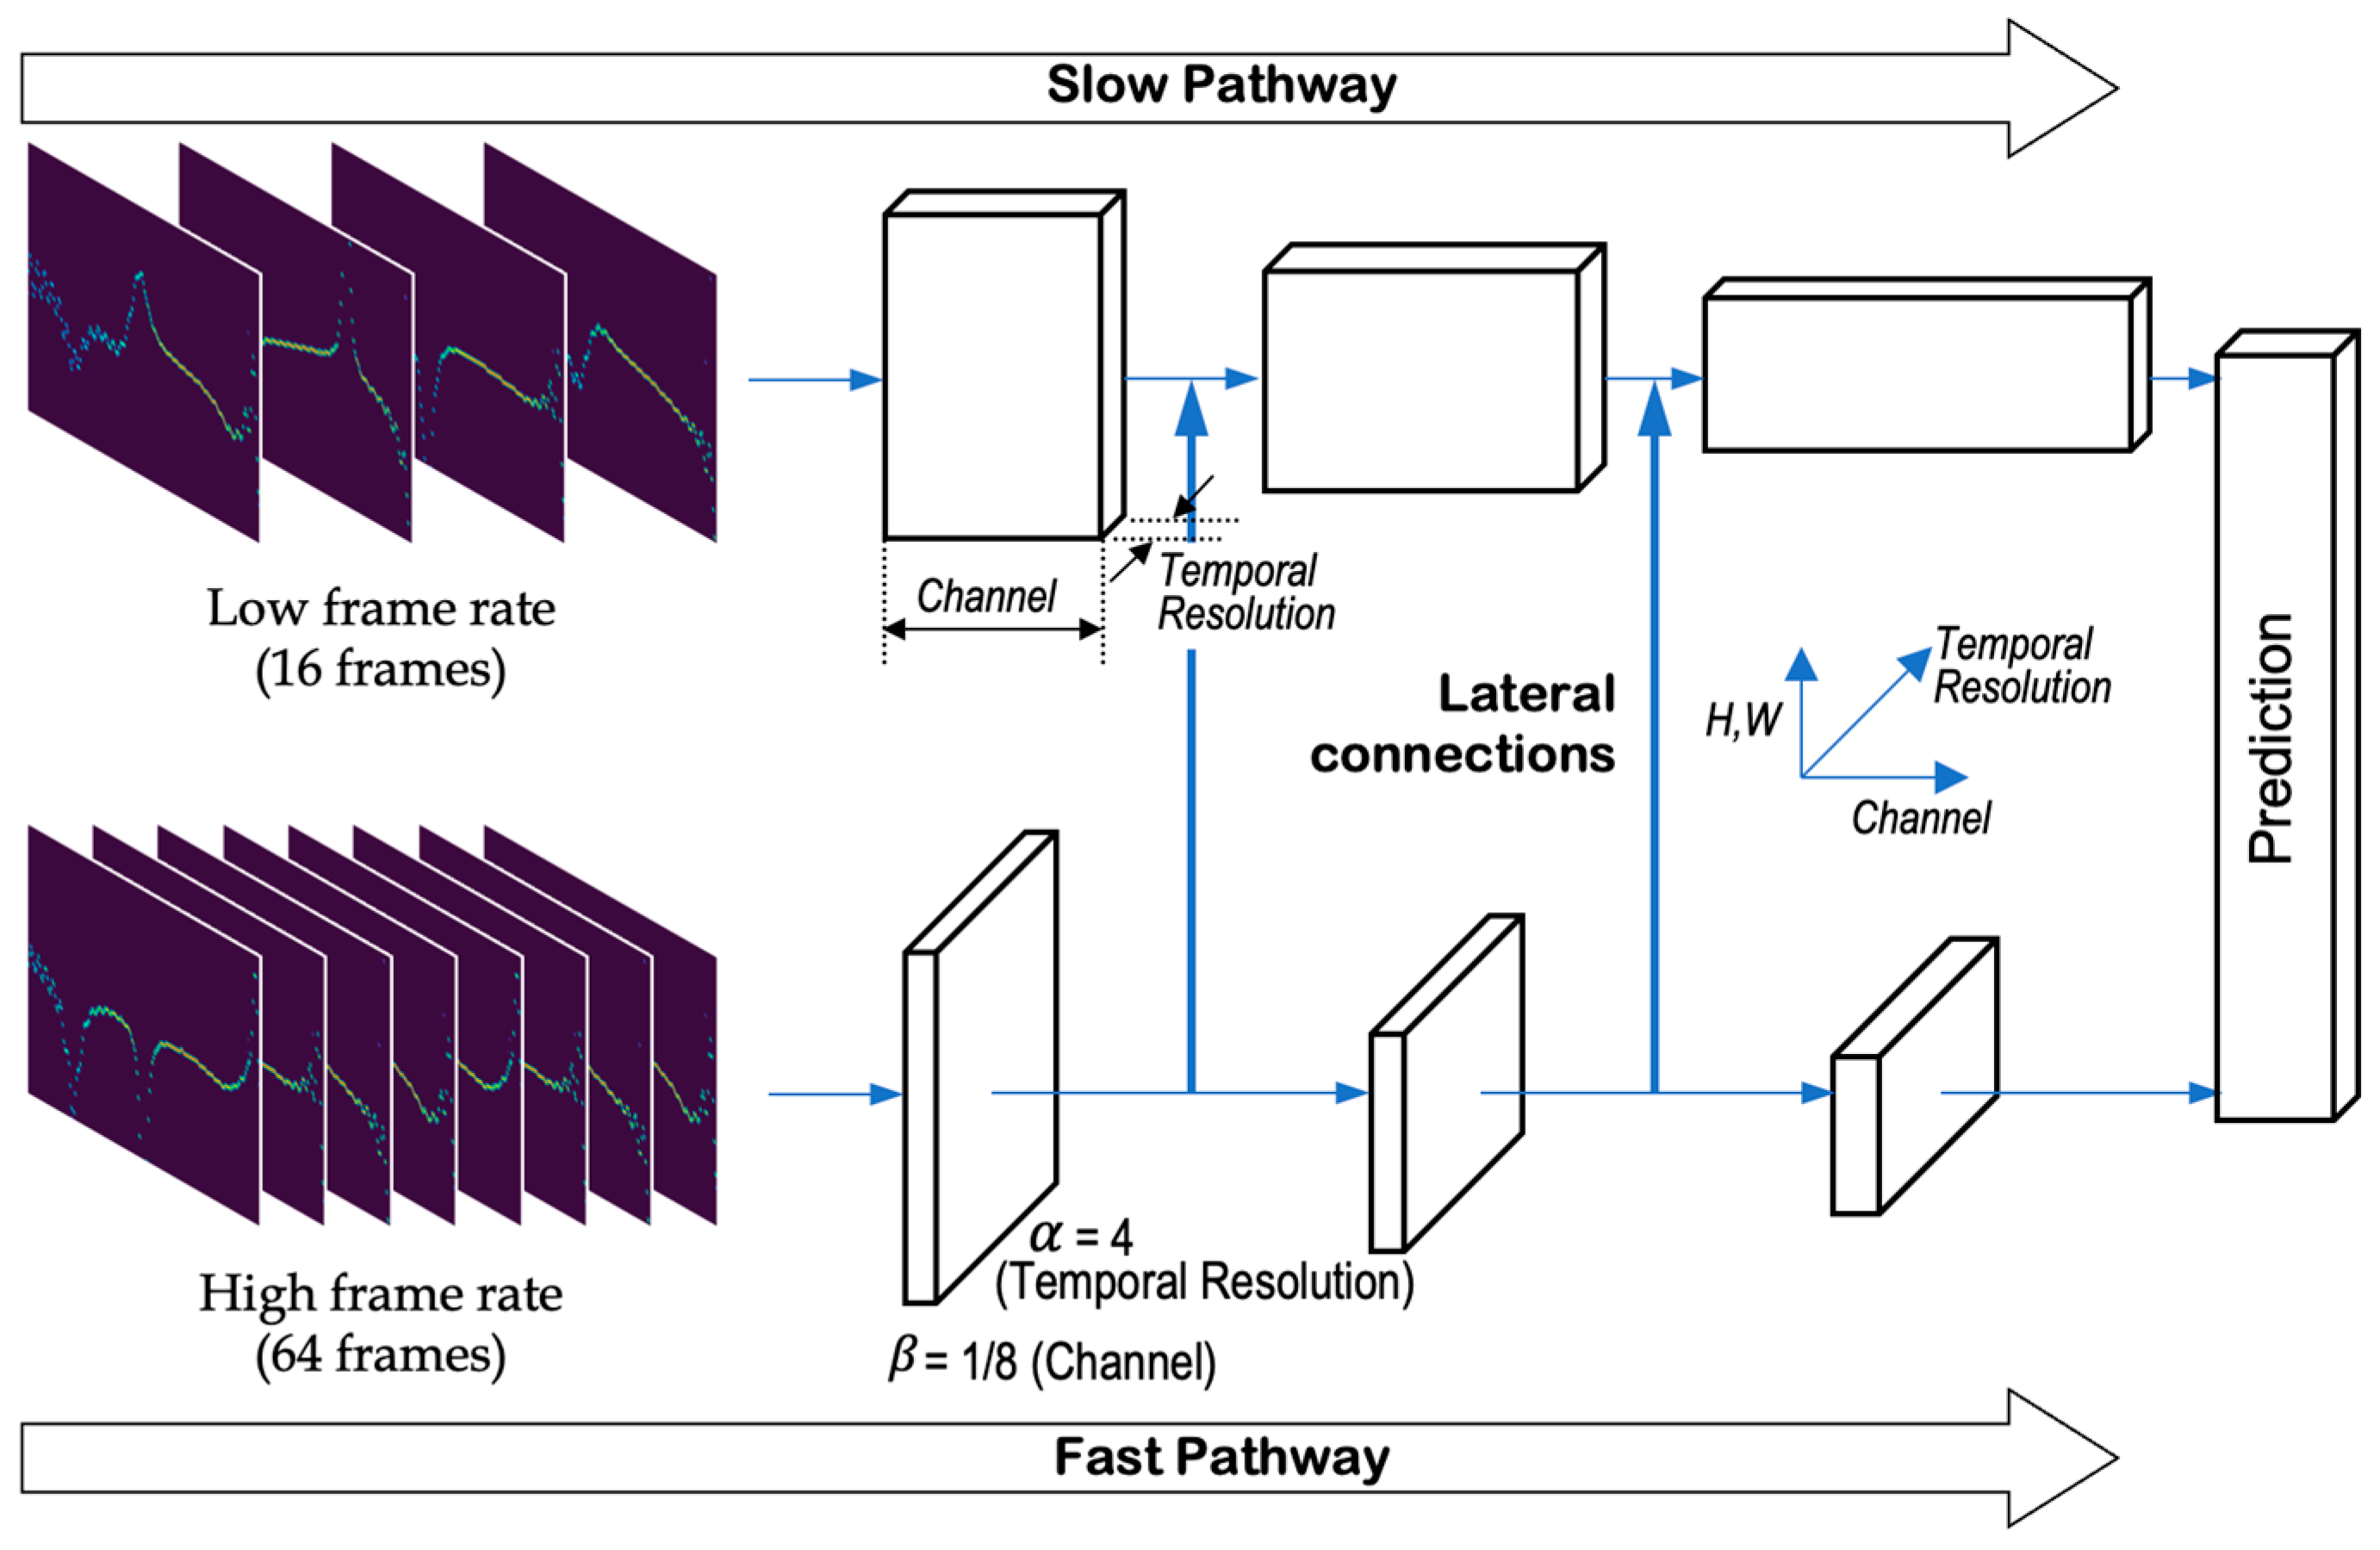
We employ the SlowFast network for video-based action recognition, as illustrated in Figure 12. The architecture’s dual-pathway design is particularly well-suited for our radar-derived video data.
The SlowFast network processes our EWT-Hilbert video data through dual pathways. The input video V ∈ ℝ^(T × H × W × C) contains T = 256 temporal frames with spatial dimensions H = 240, W = 320, and C = 3 and RGB channels from the Hilbert spectrum images.
The dual-pathway processing mechanism operates on different temporal sampling strategies applied to the same input. The fast pathway input and slow pathway input are respectively defined as follows:
V _ f a s t = S a m p l e V ,   α     ^ T × H × W × C
V _ s l o w = S a m p l e V ,   1     ^ T / α × H × W × C
where α = 4 represents the temporal sampling ratio between pathways. For our 256-frame input sequences, the fast pathway samples 64 frames (every 4th frame) while the slow pathway samples 16 frames (every 16th frame). This creates a 4:1 temporal resolution ratio, enabling the fast pathway to capture rapid movements at higher temporal resolution while the slow pathway models slower, sustained motion patterns. The complementary sampling rates allow the network to simultaneously process both fine-grained temporal dynamics and coarse motion structure.
The pathway-specific feature extraction is formulated as follows:
X _ f a s t = C o n v 3 D _ f a s t V _ f a s t ;   θ _ f a s t     ^ T × H × W × β C
X _ s l o w = C o n v 3 D V _ s l o w ;   θ _ s l o w     ^ T / α × H × W × C
where θ_fast and θ_slow represent the learnable parameters for fast and slow pathways, respectively, β = 1/8 is the channel ratio, and (H′, W′) are the reduced spatial dimensions after convolution operations.
Lateral connections facilitate information exchange at multiple network stages:
X _ s l o w ,   i = X _ s l o w ,   i L a t e r a l X _ f a s t , i ;   W _ l a t e r a l
where ⊕ denotes element-wise addition after appropriate temporal and channel transformations and W_lateral represents the lateral connection weights.
The final classification employs concatenated features from both pathways:
P = S o f t m a x F C X _ s l o w ,   f i n a l ;   X _ f a s t , f i n a l ;   W _ c l a s s i f i e r
where FC denotes the fully connected layer, [·; ·] represents feature concatenation, and W_classifier are the classification weights.
Following the mathematical formulation above, we configured the SlowFast network with α = 4 and β = 1/8. This configuration means that for every frame processed by the slow pathway, the fast pathway processes four frames, while using only one-eighth of the channel capacity. This asymmetric design enables our system to capture both the static postural configurations through the slow pathway and the rapid limb movements through the fast pathway, making it particularly well-suited for distinguishing the subtle temporal dynamics present in radar-derived motion signatures.
The SlowFast network demonstrated superior performance compared to existing state-of-the-art methods. On the Kinetics-400 dataset, SlowFast achieved 79.8% Top-1 accuracy without ImageNet pre-training, outperforming previous methods including R(2+1)D (73.9%) by 5.9 percentage points [25]. The best SlowFast model demonstrates superior performance compared to previous state-of-the-art methods [25,54]. This performance advantage stems from the dual-pathway architecture that effectively separates and integrates static and dynamic features by operating at different temporal resolutions, with the Fast pathway typically consuming only ~20% of the total computation.
In this study, Hilbert spectrum-based video data derived from UWB radar signals were used as the input to the SlowFast network. These spectrum images encapsulated the spatiotemporal characteristics of human motion by reflecting slow structural changes and rapid limb movements. The dual-pathway architecture of the SlowFast model is well suited for this data type because it can learn temporal and spatial representations simultaneously. This allows the model to identify subtle variations across diverse types of human motion and achieve highly accurate classification. In the implemented configuration, each motion sample was represented by approximately 256 sequential frames. Following the 1:4 temporal resolution ratio of SlowFast architecture, the slow pathway processed 16 uniformly sampled frames while the fast pathway processed 64 frames from the same sequence. This asymmetric sampling allows the slow pathway to capture overall motion patterns and the fast pathway to detect rapid movements, effectively leveraging the complementary temporal resolutions for comprehensive motion recognition. The input video resolution was standardized to 320 × 240 pixels, as described in Section 3.4.1. The proposed SlowFast-based model achieved superior classification performance on the constructed dataset comprising five human activity classes.

4. Experiments and Results

This section presents the experimental procedures and results for validating the proposed framework’s effectiveness at classifying human activities.

4.1. Experimental Overview

Herein, we describe the deep learning procedure designed to classify human motions based on video-format datasets derived from radar signals. In all, 553 video clips were constructed by reflecting variations in subjects and environmental scenarios for five motion types. Each motion category was defined as a distinct class, as summarized in Table 4. This table lists the class labels along with the number of corresponding video clips. The five motion classes are characterized as follows.
  • Arm_wave refers to the swinging of one arm sideways while it is extended forward.
  • Bowing refers to the bending of the upper body forward and then returning the body to an upright position.
  • Raise_hand refers to lifting one arm vertically upward and then lowering it.
  • Stand_up describes the action of rising from a seated position and then sitting down.
  • Twist refers to rotating the upper body to one side while standing and then returning to the original posture.
The SlowFast network used for motion classification was implemented based on an open-source baseline code [55] and trained using the dataset comprising the aforementioned motion classes.
Standardized preprocessing procedures were implemented to ensure experimental reproducibility. The signal preprocessing pipeline consisted of the following steps: First, a fourth-order Butterworth bandpass filter (5.60–8.00 GHz) was applied to remove low-frequency drift and high-frequency noise while preserving essential radar signal characteristics. Second, each radar frame was normalized to unit variance, ensuring consistent amplitude scaling across different measurement sessions and participants. Third, the empirical wavelet transform decomposition employed automatic boundary detection algorithms based on local maxima separation in the frequency domain, which eliminated subjective parameter selection and guaranteed consistent spectral segmentation. Fourth, the Hilbert transform was applied to the dominant frequency modes identified by EWT, producing instantaneous frequency and amplitude information that captured motion-induced phase variations. Finally, video frames were generated at a standardized resolution of 320 × 240 pixels, utilizing a consistent colormap scaling approach that maintained visual coherence across the entire dataset.
The experiment was conducted in two stages: a preliminary stage for identifying the optimal hyperparameters and pretrained initialization level that yield the best classification performance for training the SlowFast network, and a cross-validation stage for ensuring model generalizability and reliability of performance evaluation. In the preliminary stage, the entire dataset was divided into training and test sets at a ratio of 8:2, consisting of 441 and 112 video clips, respectively. Various combinations of hyperparameters and pretrained models were evaluated and compared to determine their impact on classification accuracy. The optimal training configuration derived in this stage was then applied consistently in the subsequent cross-validation experiments. This two-stage experimental design allowed for the validation of model configurations through exploratory analysis and a trustworthy performance evaluation in a constrained data environment. The software and hardware environments used for training and testing during the preliminary and cross-validation stages are summarized in Table 5. The deep learning pipeline was implemented using the PyTorch framework.
We implemented comprehensive quality control protocols to ensure experimental validity and data reliability. Laboratory conditions were maintained at consistent levels throughout all data collection sessions, with environmental parameters controlled at 23 ± 1 °C temperature and 45 ± 5% relative humidity, while electromagnetic interference was verified to remain below −80 dBm across the operational frequency band. Real-time signal integrity assessment identified and excluded anomalous patterns including signal saturation (amplitude exceeding 90% of dynamic range), excessive noise (SNR below 15 dB), and multipath interference artifacts. These automated detection algorithms ensured that corrupted frames, representing less than 0.8% of the collected data, were excluded from the dataset. Synchronization between participant motion execution and radar signal acquisition was verified through synchronized video recording, enabling post-hoc validation of movement timing and form. The participant cohort encompassed varied anthropometric characteristics (height range: 165–183 cm, weight range: 58–85 kg, age range: 22–35 years), ensuring generalizability across different body types and movement patterns. With each participant performing a minimum of 20 repetitions per motion type, the dataset achieved statistical power exceeding 0.95 for detecting meaningful differences between motion classes (α = 0.05, effect size d > 0.8). Temporal stability analysis revealed minimal drift in radar characteristics, with phase measurements remaining stable within ±2° over 1-hour continuous operation periods, confirming system reliability for extended data collection sessions.

4.2. Preliminary Experiment

4.2.1. Experimental Methodology

The objective of the preliminary experiment phase was to identify the optimal configurations that could maximize training performance by applying and fine-tuning several key hyperparameters. For model optimization, the stochastic gradient descent (SGD) algorithm was adopted. The learning rate—a critical factor controlling the magnitude of the parameter updates—was dynamically adjusted using a step-based scheduler to enhance the training stability and convergence speed. The proposed scheduler systematically reduced the learning rate at fixed epoch intervals. Weight decay—a form of L2 regularization—was employed to constrain model complexity and suppress overfitting. Previous research has highlighted this strategy as essential for ensuring strong generalization capability [54,56].
Several important aspects were considered when deriving the optimal hyperparameter settings. First, the experiment was designed to iteratively adjust the learning rate, scheduler configuration, and weight decay to identify the parameter set that yielded the highest model performance. Second, normalization was performed to enhance the training stability by adjusting the pixel intensity distribution of each frame to match the overall brightness characteristics of the radar-based input dataset. While normalization using fixed values is common in models trained on action recognition datasets such as Kinetics-400, which was used for SlowFast pretraining, image-based models trained on datasets such as ImageNet typically adopt adaptive normalization. Considering the domain gap between the radar-based data and the pretraining dataset, the brightness normalization factors were empirically computed from the radar dataset as mean = [0.1932, 0.0713, 0.2274] and standard deviation = [0.440, 0.0409, 0.0344]. These factors were applied during training and evaluation. Third, to enhance the generalization performance and mitigate overfitting under diverse input conditions, data augmentation was implemented on the training samples. Data augmentation introduces various transformations to the original input, effectively creating new and unseen data samples. Thus, the model is exposed to a broader distribution of inputs during training. In this study, the augmentation techniques random cropping and horizontal flipping were applied to artificially increase input diversity. Finally, transfer learning was performed by adapting a pretrained SlowFast network to the radar-derived dataset. To obtain pretrained weights, the PyTorchVideo library provided by Meta AI Research was employed. PyTorchVideo is a video understanding framework that includes state-of-the-art architectures such as SlowFast, pretrained on large-scale video datasets (e.g., Kinetics-400) [57]. The internal model structure can be adapted based on the number of input frames and the temporal sampling rate, which is typically specified in a frame length × sampling rate format. In this experiment, three pretrained models were utilized: the 8 × 8 format based on ResNet-50 (slowfast_r50), the 8 × 8 format based on ResNet-101 (slowfast_r101), and the 16 × 8 format based on ResNet-101 (slowfast_16 × 8_r101). The aim of using these variations was to identify the most suitable backbone network for motion recognition, as well as the optimal number of frames and sampling ratio of the fast and slow pathways for radar-based data. After training the different pretrained configurations of the SlowFast model using the radar-based training set, the model performance was evaluated using the corresponding test set.

4.2.2. Preliminary Experimental Results

The preliminary experimental phase was structured to identify the optimal combination of training parameters through a comparative evaluation of model performance under varying configurations. Seven experimental setups were devised (see Table 6), with different pretrained model types, learning rates, weight decays, normalization strategies, and sampling structures. These variations were systematically assessed to verify their impact on the classification accuracy across different network models.
In E1 and E2, the backbone networks were ResNet-50 and ResNet-101, respectively, both implemented using an 8 × 8 configuration. After transfer learning using the pretrained models, E2 outperformed E1, demonstrating that the deeper ResNet-101 architecture provides better feature representation and classification accuracy. In E3, the learning rate was increased while keeping the other parameters constant at their values in E2. This modification yielded a noticeable improvement in accuracy, indicating that tuning the update step size is crucial for convergence and generalization. E4 introduced radar-specific normalization statistics derived from the dataset itself, replacing the generic normalization parameters obtained from the Kinetics-400 dataset. This change improved the alignment between the input distribution and the expected input of the model, resulting in higher classification accuracy. E5 adjusted the weight decay parameter, further enhancing the performance of the model by improving regularization and mitigating overfitting. In E6, the 16 × 8 architecture of the SlowFast network with ResNet-101 as the backbone was tested under the optimal settings identified in previous experiments. This configuration achieved the highest Top-1 accuracy, achieving the highest performance. For the best-performing model, the value of α was 4, implying that for every 64 frames processed by the fast pathway, the slow pathway processed 16 frames. This frame ratio allowed the model to capture rapid motion dynamics while maintaining a detailed spatial representation. In contrast, E7 used the same 16 × 8 architecture but with a frozen backbone during transfer learning. Only the classifier weights and biases were updated during training, whereas the pretrained backbone parameters remained fixed. For this configuration, there was a significant drop in performance, suggesting that it is necessary to fine-tune the backbone network when adapting the model to radar-based datasets that differ substantially from the source domain used for pretraining.
Overall, the results demonstrated that adjusting the key hyperparameters, such as the learning rate, weight decay, scheduler, and normalization method, can significantly improve the Top-1 classification accuracy. Furthermore, increasing the number of frames input into the fast pathway can consistently enhance model performance. These findings support the notion that radar-based video clips primarily capture dynamic motion patterns rather than static background content, making high temporal resolution crucial for effective activity recognition.

4.3. Cross-Validation

In the preliminary experiment stage, the optimal network architecture and the most effective training parameters were identified. To validate the reliability of these findings, an additional learning and evaluation process was conducted using fivefold cross-validation. This process was performed considering only the best-performing pretrained model before transfer learning, the network structure defined by the product of frame length and sampling rate, and the optimal set of hyperparameters derived from earlier trials.
Specifically, as summarized in Table 7, the entire dataset was divided into five folds. For each iteration, a single fold was used as the test set, while the remaining four were combined to form the training set, maintaining an approximate ratio of 8:2. Fold 1 corresponds to the configuration employed in the preliminary experiment, while the remaining folds were used for additional validation. The experimental configuration for this cross-validation phase agreed with the setup used in Experiment E6, which demonstrated the highest classification accuracy during the preliminary trials. This evaluation strategy ensures that every data sample is included in both training and testing, thereby reducing evaluation bias and yielding more robust and reliable model performance estimates.
We present the detailed cross-validation results in Table 7, which demonstrates both the data distribution across folds and the corresponding classification performance metrics.
These results confirm that our model consistently maintained high classification performance across all validation folds, with minimal variation in accuracy despite different data partitions. The 553 total samples were distributed across five folds, resulting in test sets of 109–112 samples each, providing adequate sample sizes for reliable performance estimation. The stratified sampling approach maintained proportional representation of all five activity classes within each fold, with each activity type contributing approximately 20% of the samples, thereby preventing class imbalance effects on performance metrics. Statistical analysis of the cross-validation results demonstrated robust performance consistency across all folds. The mean accuracy achieved was 99.28% with a standard deviation of 0.41%, producing a coefficient of variation of only 0.41%, which indicates exceptionally stable performance. The 95% confidence intervals for individual fold accuracies ranged from 96.72% to 99.87% at the lower bound and 98.42% to 100.00% at the upper bound, with standard errors remaining below 0.009 for all folds, further validating the reliability of our reported performance metrics.
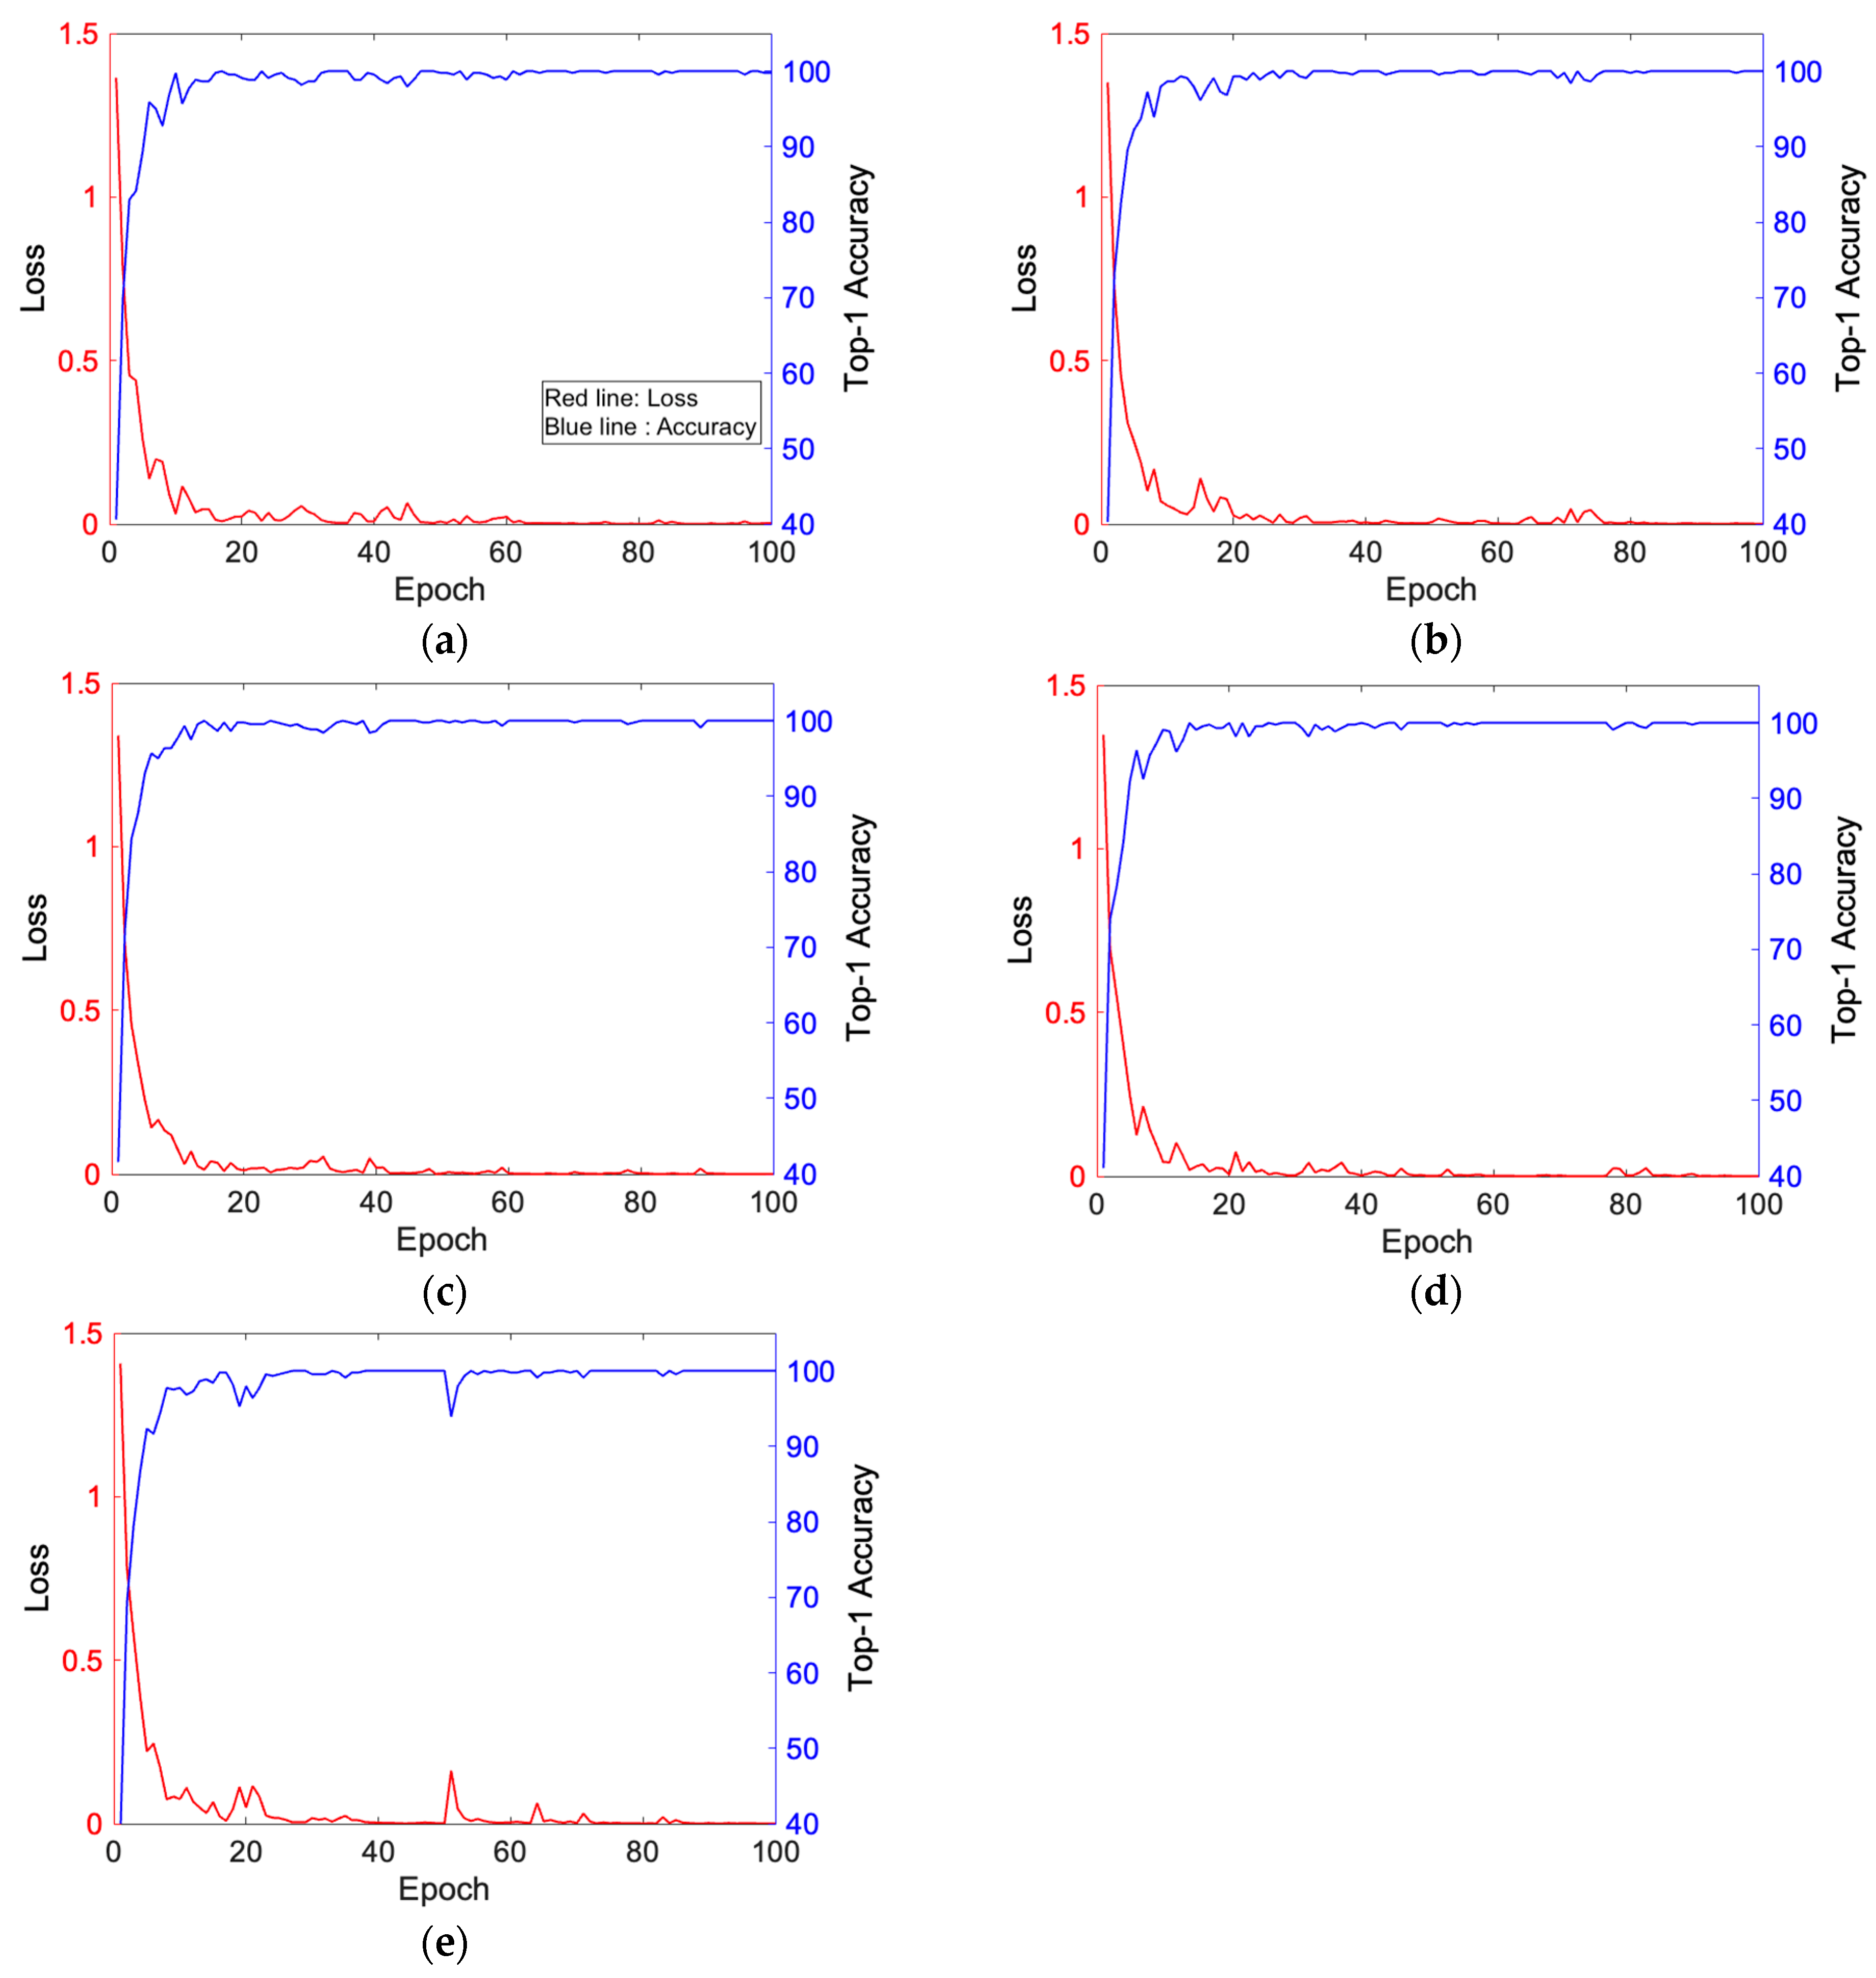
The variations in training loss (shown in blue) and accuracy (shown in red) during the 100 epochs of training the pretrained SlowFast model on each fold of the dataset are shown in Figure 13a–e. Overall, the observed trend of decreasing loss and increasing accuracy over time confirms that the model was trained in a stable and consistent manner.
To quantitatively evaluate the performance of the models trained with cross-validation, the Top-1 accuracy was calculated for each test set using the checkpoint that yielded the best performance (Table 7). The experimental results demonstrated that all folds achieved accuracy, maintaining high performance. These findings demonstrate that the trained model consistently maintained a high classification performance across various test set configurations, indicating its robustness and insensitivity to variations in test conditions.

4.4. Comparative Performance Analysis

We systematically evaluated our framework’s effectiveness by conducting comparisons with existing UWB radar-based human activity recognition methods.

4.4.1. Ablation Study Results

Table 8 demonstrates progressive performance improvements through the systematic integration of key components in the proposed framework. The contribution of each component to the overall system performance is shown below.
The systematic progression reveals that adaptive signal processing through EWT provides a 7.4 percentage point improvement over traditional STFT methods. The integration of phase information via Hilbert transform contributes an additional 2.3 percentage points, while the temporal modeling capability of SlowFast architecture provides the final 7.48 percentage point enhancement. This 23-percentage-point improvement from the baseline validates the synergistic effect of the proposed components.

4.4.2. Comparison with Existing Methods

We present a comparison of the proposed method with existing UWB radar-based human activity recognition approaches in Table 9. Since most existing studies do not report detailed computational performance metrics such as model size, inference time, or memory usage, we focused our analysis on quantifiable metrics that are consistently reported across studies, namely classification accuracy, number of recognized activities, and hardware requirements.
Our proposed method demonstrates several key advantages over existing approaches. In terms of hardware efficiency, our single-sensor configuration eliminates the complexity associated with multi-radar systems. While Maitre et al. [15] require three synchronized UWB radars and a voting mechanism to achieve 95% accuracy, our approach surpasses this performance with a single sensor. This hardware simplification directly translates to reduced installation complexity, elimination of inter-sensor calibration requirements, and lower overall system cost. Regarding classification performance, our approach achieved the highest accuracy among all compared methods and represents a 0.58 percentage point improvement over the previous best performance of 98.7% reported by An et al. [19]. This improvement is particularly significant considering that An et al. employed complex MIMO radar configurations with multiple antennas, while our method achieves superior performance with a single-sensor setup. Among the high-accuracy methods (>95%), our approach achieves the highest performance of 99.28% among all compared methods, representing a 0.58-percentage-point improvement over the previous best performance of 98.7% reported by An et al. [19]. However, Qi et al.’s method achieves approximately 85% accuracy, representing a significant performance gap compared to our framework.

4.4.3. Computational Performance Metrics

Although most existing studies do not report detailed computational metrics, we provide concrete performance benchmarks for future comparisons. Training the complete model on an NVIDIA GeForce RTX 3090 Ti GPU required 2.3 h, which represents a 52% reduction compared to I3D model training that took 4.8 h on the same dataset. During inference, our system processed an 8.53-second video clip containing 256 frames in 41.7 milliseconds on average, yielding 0.163 milliseconds per frame, which is significantly faster than the radar’s 33.3-millisecond acquisition interval. Peak GPU memory consumption during inference is 2.1 GB, representing a 44.7% reduction compared to I3D-based approaches (3.8 GB). This reduced memory footprint enables deployment on edge computing devices with limited resources.

4.5. Cross-Subject Validation

To evaluate the generalization capability of the proposed method across different users, cross-subject validation experiments were conducted using a leave-one-subject-out approach. This evaluation provides critical insight into system performance when applied to individuals not represented in the training data, which is essential for practical deployment scenarios. The validation protocol systematically excluded one participant’s data during training while using that participant’s entire dataset for testing. This procedure was repeated for each participant, ensuring comprehensive assessment of inter-subject generalization. Each training iteration utilized data from four participants, while the excluded participant’s data served as an independent test set.
The cross-subject validation yielded an average accuracy of 96.8%, with individual participant results ranging from 94.2% to 98.5%, demonstrating effective generalization across different users despite variations in motion execution patterns, body dimensions, and movement characteristics. The 2.6-percentage-point reduction from within-subject validation (99.28% to 96.8%) represents the expected performance decrease when generalizing across users, which primarily results from individual differences in motion amplitude, timing variations, and personal movement preferences not captured in the training data. This maintained high accuracy confirms that the EWT–Hilbert preprocessing successfully extracts motion-invariant spectral features that generalize across different users, while the SlowFast architecture learns temporal patterns that remain robust to individual variations in movement execution, validating the framework’s suitability for diverse user populations.

4.6. Environmental Robustness Analysis

The framework’s robustness was evaluated under varying operational conditions to assess practical deployment viability.
Performance testing revealed three key findings. First, recognition accuracy remained optimal within the 1–2 meter operational range, with predictable signal degradation at extended distances following inverse square law characteristics. Second, the system demonstrated inherent immunity to optical conditions, maintaining consistent performance regardless of lighting variations and visual occlusions, thus eliminating the need for controlled lighting or additional calibration procedures. Third, UWB radar signals effectively penetrated common clothing materials and non-metallic barriers, ensuring consistent recognition accuracy across different user attire and seasonal clothing variations without system reconfiguration.
The signal processing framework proved robust against various interference sources, successfully distinguishing motion-related signals from background noise and environmental reflections. Environmental factors including furniture placement, wall materials, and ambient electromagnetic conditions showed minimal impact on recognition accuracy. Performance degradation of less than 2–3% occurred only when subjects exceeded a 2.5 m distance, confirming the system’s resilience to typical indoor environmental variations encountered in real-world deployment scenarios.
It is important to distinguish between the robustness characteristics verified through our controlled experiments and those inferred from the physical properties of UWB radar technology. Our laboratory testing directly validated distance-dependent performance degradation and immunity to lighting variations. The radar’s ability to penetrate clothing and non-metallic materials was also empirically confirmed. However, performance in environments with complex multipath reflections, multiple simultaneous moving subjects, or significant electromagnetic interference remains to be validated through field deployments. These limitations notwithstanding, the fundamental physics of UWB radar provides strong theoretical support for the robustness claims, though empirical validation in diverse real-world settings would strengthen these findings.

5. Discussion

5.1. Principal Findings and Theoretical Implications

The proposed framework achieved exceptional classification performance of over 99% accuracy, advancing the state of the art in radar-based human activity recognition. This success results from the effective integration of adaptive signal processing through EWT–Hilbert transformation with temporal modeling via the SlowFast architecture, which addresses fundamental limitations in existing approaches that treat radar frames independently rather than as continuous sequences.
The effectiveness of EWT in processing UWB radar signals stems from its adaptive nature in identifying motion-sensitive frequency bands. Unlike traditional time–frequency analysis methods that impose fixed resolution constraints, EWT automatically partitions the signal spectrum based on its inherent characteristics. For UWB radar signals exhibiting concentrated spectral energy around 6.8 GHz, this adaptive approach proves particularly advantageous, as motion-induced phase variations manifest as subtle shifts in the dominant frequency component rather than distinct spectral patterns. The observed frequency band variations (6.30–7.20 GHz) during different motion phases provide empirical evidence that human movements modulate the radar signal’s spectral characteristics in predictable patterns.
The transformation of 2D Hilbert spectra into temporally coherent video sequences represents a paradigm shift in radar signal analysis. This approach leverages the continuous nature of human motion, enabling the capture of transitional dynamics between discrete poses that frame-independent methods inherently miss. The SlowFast architecture’s dual-pathway processing proves ideally suited for this representation, with the slow pathway capturing postural configurations while the fast pathway detects rapid limb movements. This temporal modeling capability explains the significant performance improvement over traditional approaches that treat each radar frame in isolation.

5.2. Practical Implications

The demonstrated capabilities of the proposed framework extend beyond academic performance metrics to practical deployment considerations. The single-sensor configuration achieving superior performance compared to multi-radar systems presents compelling economic and technical advantages. Installation complexity reduces significantly, calibration requirements simplify to single-point optimization, and system maintenance becomes more manageable. These factors collectively lower the total cost of ownership while maintaining operational excellence. The radar-based approach maintains the privacy-preserving characteristics inherent in UWB radar technology while achieving high recognition accuracy. This characteristic proves particularly valuable in sensitive environments such as healthcare facilities, private residences, and workplace settings where visual monitoring may be legally restricted or ethically questionable. The SlowFast architecture’s low memory requirement of only 2.1 GB during inference facilitates deployment on edge computing devices. This capability opens opportunities for immediate response systems in fall detection, gesture-based interfaces, and adaptive environmental controls.

5.3. Limitations and Future Directions

Despite the significant advances demonstrated, several limitations define the current scope of applicability and indicate directions for future research. The single-person constraint represents the most immediate limitation, as overlapping radar reflections from multiple individuals create complex interference patterns that cannot be resolved using the current single-sensor configuration. Addressing multi-person scenarios will require either advanced signal separation algorithms or strategic multi-sensor deployments with appropriate fusion strategies. The current validation encompasses five discrete activity types, representing common daily movements but not exhaustive human motion vocabulary. Extending to more complex, continuous activities such as cooking, cleaning, or exercise routines requires expanded training datasets and potentially architectural modifications to handle longer temporal sequences. The framework’s design principles support such extensions, but empirical validation remains necessary. Environmental factors impose operational constraints that merit consideration. Performance degradation of 2–3% beyond the 2.5-m range follows predictable radar propagation principles but may limit applicability in large spaces. Future research should investigate adaptive algorithms that compensate for environmental variations. While our controlled experiments demonstrate promising robustness indicators, comprehensive field studies across diverse deployment environments remain essential for establishing definitive performance boundaries. Future research directions include two key areas to extend the framework’s capabilities: first, the integration of multiple UWB sensors with fusion algorithms to enable multi-person activity recognition and extend the operational range beyond the current 2.5-m limitation and second, the implementation of hierarchical temporal models for continuous activity recognition, allowing more naturalistic motion understanding beyond discrete action classification.

6. Conclusions

The application scope of noncontact radar-based human sensing technologies has progressively broadened, from monitoring vital signs to the reliable recognition of daily human activities. Among various radar modalities, the UWB radar has emerged as a promising nonvisual alternative that offers robustness under varying lighting conditions, minimizes privacy concerns associated with camera-based systems, and provides millimeter-scale range resolution for precise motion discrimination even in challenging environments.
In this study, we proposed a human motion recognition framework based on a single UWB radar to classify five representative human motions with high accuracy. The proposed method introduces a data-adaptive signal-processing pipeline that begins with EWT, which effectively decomposes the radar signal into frequency sub-bands aligned with its intrinsic spectral structure. This decomposition enhances sensitivity to subtle body motion-induced phase variations. Subsequently, the Hilbert transform is applied to each sub-band to produce time–frequency representations that characterize the temporal evolution of instantaneous frequency and amplitude. These Hilbert spectra capture unique time–frequency signatures associated with diverse types of motion. To incorporate the temporal dynamics, we extended the conventional 2D spectral representation into video sequences by chronologically arranging Hilbert spectra over time. This allowed the learning model to encode both spatial patterns within individual frames and temporal transitions across frames. The resulting video data were then used to train a SlowFast network—a deep learning architecture designed for video-based activity recognition. Through the joint learning of spatial and temporal features, the proposed framework achieved superior classification performance, exceeding 99%accuracy in distinguishing all five activities. A significant academic contribution of this work lies in the integration of advanced signal-processing and deep learning techniques into a unified framework that is specifically tailored to the characteristics of UWB radar data. By leveraging EWT and Hilbert transforms, we captured the detailed time–frequency-phase information to enhance the model interpretability and learning capacity. Furthermore, the conversion of spectral images into temporally ordered video clips enabled the effective utilization of state-of-the-art video recognition models, such as SlowFast, which was fine-tuned using pretrained weights from the Kinetics-400 dataset. This transfer learning strategy proved highly effective even with a limited radar dataset, achieving high learning efficiency and robust generalization. The practical implications of the proposed framework are considerable. The proposed framework’s characteristics make it suitable for deployment in various domains, such as medical monitoring, smart home environments, security systems, and human–machine interfaces. The proposed approach also offers scalability and flexibility, making it adaptable to different hardware and application constraints.
Future research will focus on expanding the training dataset with recordings from a larger and more diverse group of participants to enhance model generalizability and robustness. Moreover, efforts will be directed toward the efficient implementation of embedded systems through network optimization and lightweight model design. These steps are expected to facilitate the deployment of radar-based activity recognition solutions in real-world scenarios where privacy, efficiency, and unobtrusiveness are critical.
In conclusion, this study proposes a comprehensive and interpretable framework for human motion classification using the UWB radar, combining adaptive signal decomposition, time–frequency feature construction, and deep video learning. The proposed methodology provides theoretical insight and offers practical utility, advancing the state-of-the-art in radar-based human activity recognition and paving the way for future applications across a range of fields. While the demonstrated performance validates the framework’s technical effectiveness, successful deployment requires careful consideration of practical implementation factors. The single-sensor configuration provides operational advantages through reduced hardware complexity and installation requirements compared to multi-sensor alternatives. Current implementation focuses on individual motion recognition, with multi-person scenarios representing an area for future algorithmic development. Training data requirements necessitate systematic motion capture across representative user populations to ensure robust generalization performance across diverse deployment environments. These characteristics establish the framework’s suitability for privacy-sensitive applications where non-intrusive motion recognition provides significant operational benefits, including healthcare monitoring, smart home environments, and security systems requiring reliable human activity detection without visual surveillance constraints.

Author Contributions

H.-S.C.: conceptualization, methodology, investigation, data curation, supervision, project administration, writing—original draft. H.-S.C. conceived and supervised the overall research design. He conducted the experiments to acquire UWB radar signals and developed the signal preprocessing methodology. He was primarily responsible for constructing the video-format dataset and drafting the manuscript. Y.-J.P.: software, validation, formal analysis, visualization, writing—review and editing. Y.-J.P. implemented and trained the deep learning models using the constructed dataset. He performed quantitative evaluation, visualized the experimental results, and contributed to reviewing the manuscript. All authors have read and agreed to the published version of the manuscript.

Funding

This work was supported by the DGIST R&D Program of the Ministry of Science and ICT (25-IT-03).

Data Availability Statement

The radar datasets used in this study are available from the corresponding author upon reasonable request, subject to institutional privacy policies and participant consent agreements. The dataset includes anonymized radar signal recordings, preprocessed Hilbert spectral images, corresponding activity labels, and detailed experimental protocols to ensure reproducibility.

Conflicts of Interest

The authors declare no conflicts of interest.

Abbreviations

The following abbreviations are used in this manuscript:
UWBUltra-Wideband
CWContinuous Wave
FMCWFrequency-Modulated Continuous Wave
ToFTime-of-Flight
STFTShort-Time Fourier Transform
CWTContinuous Wavelet Transform
EMDEmpirical Mode Decomposition
IMFIntrinsic Mode Function
EWTEmpirical Wavelet Transform
CNNConvolutional Neural Network
I3DInflated 3D
LSTMLong Short-Term Memory
WRTFTWeighted Range-Time–Frequency Transform
PCAPrincipal Component Analysis
KNNK-Nearest Neighbor
RMDLRandom Multimodal Deep Learning
DNNDeep Neural Network
RNNRecurrent Neural Network
MIMOMultiple-Input Multiple-output
SFCWStepped-Frequency Continuous Wave
MRAMultiresolution Analysis
PRFPulse Repetition Frequency
EIRPEffective Isotropic Radiated Power
HHTHilbert–Huang Transform
SGDStochastic Gradient Descent

References

  1. Bilich, C.G. Bio-Medical Sensing Using Ultra-Wideband Communications and Radar Technology: A Feasibility Study. In Proceedings of the 1st International Pervasive Health Conference and Workshops, Innsbruck, Austria, 29 November 2006; pp. 1–9. [Google Scholar]
  2. Cho, H.S.; Choi, B.; Park, Y.J. Monitoring Heart Activity Using Ultra-Wideband Radar. Electron. Lett. 2019, 55, 878–880. [Google Scholar] [CrossRef]
  3. Lee, Y.; Park, J.Y.; Choi, Y.W.; Park, H.-K.; Cho, S.-H.; Cho, S.H.; Lim, Y.-H. A Novel Non-Contact Heart Rate Monitor Using Impulse-Radio Ultra-Wideband (IR-UWB) Radar Technology. Sci. Rep. 2018, 8, 13053. [Google Scholar] [CrossRef]
  4. Zhang, X.; Yang, X.; Ding, Y.; Wang, Y.; Zhou, J.; Zhang, L. Contactless Simultaneous Breathing and Heart Rate Detections in Physical Activity Using IR-UWB Radars. Sensors 2021, 21, 5503. [Google Scholar] [CrossRef] [PubMed]
  5. Xu, H.; Ebrahim, M.P.; Hasan, K.; Heydari, F.; Howley, P.; Yuce, M.R. Accurate Heart Rate and Respiration Rate Detection Based on a Higher-Order Harmonics Peak Selection Method Using Radar Non-Contact Sensors. Sensors 2022, 22, 83. [Google Scholar] [CrossRef] [PubMed]
  6. Rong, Y.; Bliss, D.W. Remote Sensing for Vital Information Based on Spectral-Domain Harmonic Signatures. IEEE Trans. Aerosp. Electron. Syst. 2019, 55, 3454–3465. [Google Scholar] [CrossRef]
  7. Malešević, N.; Petrović, V.; Belić, M.; Antfolk, C.; Mihajlović, V.; Janković, M. Contactless Real-Time Heartbeat Detection via 24 GHz Continuous-Wave Doppler Radar Using Artificial Neural Networks. Sensors 2020, 20, 2351. [Google Scholar] [CrossRef]
  8. Cardillo, E.; Caddemi, A. Radar Range-Breathing Separation for the Automatic Detection of Humans in Cluttered Environments. IEEE Sens. J. 2021, 21, 14043–14050. [Google Scholar] [CrossRef]
  9. Lv, W.; He, W.; Lin, X.; Miao, J. Non-Contact Monitoring of Human Vital Signs Using FMCW Millimeter-Wave Radar in the 120 GHz Band. Sensors 2021, 21, 2732. [Google Scholar] [CrossRef] [PubMed]
  10. Turppa, E.; Kortelainen, J.M.; Antropov, O.; Kiuru, T. Vital Sign Monitoring Using FMCW Radar in Various Sleeping Scenarios. Sensors 2020, 20, 6505. [Google Scholar] [CrossRef]
  11. Court of Justice of the European Union. Judgment in Case C-212/13; Court of Justice of the European Union: Luxembourg, 2014. [Google Scholar]
  12. European Union Agency for Fundamental Rights. Surveillance by Intelligence Services: Fundamental Rights Safeguards and Remedies in the European Union; Publications Office of the European Union: Luxembourg, 2023. [Google Scholar]
  13. Wang, M.; Cui, G.; Yang, X.; Kong, L. Human Body and Limb Motion Recognition via Stacked Gated Recurrent Units Network. IET Radar Sonar Navig. 2018, 12, 1046–1051. [Google Scholar] [CrossRef]
  14. Ding, C.; Hong, H.; Zou, Y.; Chu, H.; Zhu, X.; Fioranelli, F.; Le Kernec, J.; Li, C. Continuous Human Motion Recognition with a Dynamic Range-Doppler Trajectory Method Based on FMCW Radar. IEEE Trans. Geosci. Remote Sens. 2019, 57, 6821–6831. [Google Scholar] [CrossRef]
  15. Maitre, J.; Bouchard, K.; Bertuglia, C.; Gaboury, S. Recognizing Activities of Daily Living from UWB Radars and Deep Learning. Expert Syst. Appl. 2021, 164, 113994. [Google Scholar] [CrossRef]
  16. Ding, C.; Zhang, L.; Gu, C.; Bai, L.; Liao, Z.; Hong, H.; Li, Y.; Zhu, X. Non-Contact Human Motion Recognition Based on UWB Radar. IEEE J. Emerg. Sel. Top. Circuits Syst. 2018, 8, 306–315. [Google Scholar] [CrossRef]
  17. Qi, R.; Li, X.; Zhang, Y.; Li, Y. Multi-Classification Algorithm for Human Motion Recognition Based on IR-UWB Radar. IEEE Sens. J. 2020, 20, 12848–12858. [Google Scholar] [CrossRef]
  18. Pardhu, T.; Kumar, V. Human Motion Classification Using Impulse Radio Ultra Wide Band Through-Wall Radar Model. Multimed. Tools Appl. 2023, 82, 36769–36791. [Google Scholar] [CrossRef]
  19. An, Q.; Wang, S.; Zhang, W.; Lv, H.; Wang, J.; Li, S.; Hoorfar, A. RPCA-Based High-Resolution Through-the-Wall Human Motion Feature Extraction and Classification. IEEE Sens. J. 2021, 21, 19058–19068. [Google Scholar] [CrossRef]
  20. Mitra, S.K. Digital Signal Processing: A Computer-Based Approach, 2nd ed.; McGraw-Hill: New York, NY, USA, 2001. [Google Scholar]
  21. Mallat, S. A Theory for Multiresolution Signal Decomposition: The Wavelet Representation. IEEE Trans. Pattern Anal. Mach. Intell. 1989, 11, 674–693. [Google Scholar] [CrossRef]
  22. Huang, N.E.; Shen, Z.; Long, S.R.; Wu, M.C.; Shih, H.H.; Zheng, Q.; Yen, N.-C.; Tung, C.C.; Liu, H.H. The Empirical Mode Decomposition and the Hilbert Spectrum for Nonlinear and Non-Stationary Time Series Analysis. Proc. R. Soc. A 1998, 454, 903–995. [Google Scholar] [CrossRef]
  23. Gilles, J. Empirical Wavelet Transform. IEEE Trans. Signal Process. 2013, 61, 3999–4010. [Google Scholar] [CrossRef]
  24. Hahn, S.L. Hilbert Transforms in Signal Processing; Artech House: Boston, MA, USA, 1996. [Google Scholar]
  25. Feichtenhofer, C.; Fan, H.; Malik, J.; He, K. SlowFast Networks for Video Recognition. In Proceedings of the IEEE/CVF International Conference on Computer Vision (ICCV), Seoul, Korea, 27–28 October 2019; pp. 6202–6211. [Google Scholar]
  26. Tran, D.; Bourdev, L.; Fergus, R.; Torresani, L.; Paluri, M. Learning Spatiotemporal Features with 3D Convolutional Networks. In Proceedings of the IEEE International Conference on Computer Vision, Santiago, Chile, 7–13 December 2015; pp. 4489–4497. [Google Scholar]
  27. Carreira, J.; Zisserman, A. Quo Vadis, Action Recognition? A New Model and the Kinetics Dataset. In Proceedings of the IEEE Conference on Computer Vision and Pattern Recognition, Honolulu, HI, USA, 21–26 July 2017; pp. 4724–4733. [Google Scholar]
  28. Kim, Y.; Ling, H. Human activity classification based on micro-Doppler signatures using a support vector machine. IEEE Trans. Geosci. Remote Sens. 2009, 47, 1328–1337. [Google Scholar]
  29. Zhang, J. Basic gait analysis based on continuous wave radar. Gait Posture. 2012, 36, 667–671. [Google Scholar] [CrossRef] [PubMed]
  30. Shrestha, A.; Li, H.; Le Kernec, J.; Fioranelli, F. Continuous human activity classification from FMCW radar with Bi-LSTM networks. IEEE Sens. J. 2020, 20, 13607–13619. [Google Scholar] [CrossRef]
  31. Cao, L.; Liang, S.; Zhao, Z.; Wang, D.; Fu, C.; Du, K. Human activity recognition method based on FMCW radar sensor with multi-domain feature attention fusion network. Sensors 2023, 23, 5100. [Google Scholar] [CrossRef]
  32. Zhang, Y.; Tang, H.; Wu, Y.; Wang, B.; Yang, D. FMCW radar human action recognition based on asymmetric convolutional residual blocks. Sensors 2024, 24, 4570. [Google Scholar] [CrossRef]
  33. Abratkiewicz, K. Radar detection-inspired signal retrieval from the short-time Fourier transform. Sensors 2022, 22, 5954. [Google Scholar] [CrossRef]
  34. Song, M.-S.; Lee, S.-B. Comparative study of time-frequency transformation methods for ECG signal classification. Front. Signal Process. 2024, 4, 1322334. [Google Scholar] [CrossRef]
  35. Guo, J.; Hao, G.; Yu, J.; Wang, P.; Jin, Y. A novel solution for improved performance of time-frequency concentration. Mech. Syst. Signal Process. 2023, 185, 109784. [Google Scholar] [CrossRef]
  36. Zhang, M.; Liu, L.; Diao, M. LPI radar waveform recognition based on time-frequency distribution. Sensors 2016, 16, 1682. [Google Scholar] [CrossRef]
  37. Konatham, S.R.; Maram, R.; Cortés, L.R.; Chang, J.H.; Rusch, L.; LaRochelle, S.; de Chatellus, H.G.; Azaña, J. Real-time gap-free dynamic waveform spectral analysis with nanosecond resolutions through analog signal processing. Nat. Commun. 2020, 11, 3309. [Google Scholar] [CrossRef]
  38. Kim, Y.; Moon, T. Human detection and activity classification based on micro-Doppler signatures using deep convolutional neural networks. IEEE Geosci. Remote Sens. Lett. 2015, 13, 1–5. [Google Scholar] [CrossRef]
  39. Li, Z.; Le Kernec, J.; Abbasi, Q.; Fioranelli, F.; Yang, S.; Romain, O. Radar-based human activity recognition with adaptive thresholding towards resource constrained platforms. Sci. Rep. 2023, 13, 3473. [Google Scholar] [CrossRef]
  40. Seyfioğlu, M.S.; Gürbüz, S. Deep neural network initialization methods for micro-Doppler classification with low training sample support. IEEE Geosci. Remote Sens. Lett. 2017, 14, 2462–2466. [Google Scholar] [CrossRef]
  41. Li, H.; Shrestha, A.; Heidari, H.; Le Kernec, J.; Fioranelli, F. Bi-LSTM network for multimodal continuous human activity recognition and fall detection. IEEE Sens. J. 2019, 20, 1191–1201. [Google Scholar] [CrossRef]
  42. Hernangomez, R.; Santra, A.; Stanczak, S. Human activity classification with frequency modulated continuous wave radar using deep convolutional neural networks. In Proceedings of the 2019 International Radar Conference, Toulon, France, 23–27 September 2019; pp. 1–6. [Google Scholar]
  43. Chen, D.; Xiong, G.; Wang, L.; Yu, W. Variable length sequential iterable convolutional recurrent network for UWB-IR vehicle target recognition. IEEE Trans. Geosci. Remote Sens. 2023, 61, 1–11. [Google Scholar] [CrossRef]
  44. Hung, W.-P.; Chang, C.-H. Dual-mode embedded impulse-radio ultra-wideband radar system for biomedical applications. Sensors 2024, 24, 5555. [Google Scholar] [CrossRef] [PubMed]
  45. Liang, X.; Deng, J.; Zhang, H.; Gulliver, T.A. Ultra-wideband impulse radar through-wall detection of vital signs. Sci. Rep. 2018, 8, 13367. [Google Scholar] [CrossRef] [PubMed]
  46. Novelda. NVA620x Preliminary Datasheet; Novelda: Oslo, Norway, 2013. [Google Scholar]
  47. Breed, G. A Summary of FCC Rules for Ultra Wideband Communications. High. Freq. Electron. 2005, 4, 42–44. [Google Scholar]
  48. Gabor, D. Theory of Communication. J. Inst. Electr. Eng. 1946, 93, 429–457. [Google Scholar] [CrossRef]
  49. Fairchild, D.P.; Narayanan, R.M. Classification of Human Motions Using Empirical Mode Decomposition of Human Micro-Doppler Signatures. IET Radar Sonar Navig. 2014, 8, 425–434. [Google Scholar] [CrossRef]
  50. Huang, N.E.; Shen, S.S.P. (Eds.) Hilbert–Huang Transform and Its Applications, 2nd ed.; World Scientific: Singapore, 2014. [Google Scholar]
  51. Soomro, K.; Zamir, A.R.; Shah, M. UCF101: A Dataset of 101 Human Actions Classes from Videos in the Wild. arXiv 2012, arXiv:1212.0402. [Google Scholar] [CrossRef]
  52. Russakovsky, O.; Deng, J.; Su, H.; Krause, J.; Satheesh, S.; Ma, S.; Huang, Z.; Karpathy, A.; Khosla, A.; Bernstein, M.; et al. ImageNet Large Scale Visual Recognition Challenge. Int. J. Comput. Vis. 2015, 115, 211–252. [Google Scholar] [CrossRef]
  53. Kay, W.; Carreira, J.; Simonyan, A.; Zhang, B.; Hillier, C.; Vijayanarasimhan, S.; Viola, F.; Green, T.; Back, T.; Natsev, P.; et al. The Kinetics Human Action Video Dataset. arXiv 2017, arXiv:1705.06950. [Google Scholar] [CrossRef]
  54. Kosson, A.; Messmer, B.; Jaggi, M. Rotational Equilibrium: How Weight Decay Balances Learning Across Neural Networks. OpenReview 2024. Available online: https://openreview.net/forum?id=Kr7KpDm8MO (accessed on 12 June 2025).
  55. Available online: https://github.com/leftthomas/SlowFast (accessed on 12 June 2025).
  56. Loshchilov, I.; Hutter, F. Decoupled Weight Decay Regularization. In Proceedings of the International Conference on Learning Representations (ICLR), New Orleans, LA, USA, 6–9 May 2019. [Google Scholar]
  57. Fan, H.; Murrell, T.; Wang, H.; Alwala, K.V.; Li, Y.; Li, Y.; Xiong, B.; Ravi, N.; Li, M.; Yang, H.; et al. PyTorchVideo: A Deep Learning Library for Video Understanding. In Session 26: Open Source Competition, Proceedings of the 29th ACM International Conference on Multimedia, Chengdu, China, 20–24 October 2021; ACM: New York, NY, USA, 2021. [Google Scholar]
Figure 1. Overall flow diagram of the proposed UWB radar-based human activity recognition framework.
Electronics 14 03264 g001
Figure 2. X2 UWB radar transceiver system showing key hardware components and experimental configuration.
Electronics 14 03264 g002
Figure 3. Representative waveform of a single radar frame.
Electronics 14 03264 g003
Figure 4. Schematic of the experimental setup for UWB radar-based human motion sensing.
Electronics 14 03264 g004
Figure 5. (a) A radar frame and (b) its decomposed intrinsic mode functions (IMFs) and residual obtained via empirical mode decomposition (EMD).
Electronics 14 03264 g005aElectronics 14 03264 g005b
Figure 6. Boundary frequencies and corresponding filters in the frequency domain.
Electronics 14 03264 g006
Figure 7. Log-scale magnitude spectrum of a raw UWB radar frame.
Electronics 14 03264 g007
Figure 8. Sequentially sampled radar frames in a single motion instance.
Electronics 14 03264 g008
Figure 9. Hilbert spectrum obtained from an EWT-processed radar frame.
Electronics 14 03264 g009
Figure 10. Construction of video clips from the EWT-Hilbert processed radar frames.
Electronics 14 03264 g010
Figure 11. Sequential Hilbert spectrum images for five human activities: (a) arm swing, (b) upper body bending, (c) arm lifting, (d) sit-to-stand, and (e) torso rotation. Each image shows frequency (vertical axis) versus time (horizontal axis). Rows correspond to frames 1, 51, 101, 151, 201, and 251 of the 256-frame sequence.
Electronics 14 03264 g011
Figure 12. Schematic overview of SlowFast network architecture for video-based motion classification.
Electronics 14 03264 g012
Figure 13. Training curves for five-fold cross-validation: loss (red) and Top-1 accuracy (blue). (a) Fold 1, (b) Fold 2, (c) Fold 3, (d) Fold 4, and (e) Fold 5.
Electronics 14 03264 g013
Table 1. Frequency bands and relative energy distributions of the decomposed intrinsic mode functions (IMFs) from the radar signal.
Decomposition ModeFrequency [GHz]Relative Energy [%]
IMF16.34–7.2199.90
IMF21.20–6.830.02
IMF30.52–3.380.01
IMF40.25–1.350.00
IMF50.08–0.700.01
IMF60.04–0.350.04
Residual0.05–1.480.02
Table 2. Frequency bands and relative energy distributions of the decomposed mode functions from the radar signal.
Decomposition ModeFrequency [GHz]Relative Energy [%]
x 0 t (approximation)6.34–7.2199.98
x 1 t (detail)11.80–11.890.02
Table 3. Dominant frequency bands and relative energy determined by EMD and EWT.
EMDEWT
Frame
Index
Frequency [GHz]Relative Energy [%]Frequency [GHz]Relative Energy [%]
16.33–7.1599.926.33–7.1599.99
516.34–7.1499.946.34–7.1499.99
1016.34–7.0399.726.33–7.0299.96
1516.30–7.1699.976.30–7.16100.00
2016.37–7.2099.986.37–7.20100.00
2516.36–7.1599.956.36–7.15100.00
Table 4. Motion classes and number of video clips per class.
LabelArm_WaveBowingRaise_HandStand_UpTwistTotal
Number108104110120111553
Table 5. Software and hardware specifications used for model training and evaluation.
SoftwareHardware
OSUbuntu 20.04CPUIntel core i9-10980XE 3.00 GHz
PyTorch1.8.0 (TorchVision 0.9.0)RAM32 GB
Python3.7GPUNvidia GeForce RTX 3090 Ti 24 GB
CUDA11.1 (CuDNN 8.0.5)
Table 6. Performance comparison of preliminary experiments with different SlowFast configurations and hyperparameter settings.
Experiment
Number
Pretrained ModelBatchSchedulerLearning RateWeight DecayNormalizationTop-1
Accuracy (%)
E-1slowfast_r504SGD1 × 10−41 × 10−5kinetics-40082.14
E-2slowfast_r1014SGD1 × 10−41 × 10−5kinetics-40085.71
E-3slowfast_r1014SGD1 × 10−31 × 10−5kinetics-40090.18
E-4slowfast_r1014SGD1 × 10−31 × 10−5radar-591.07
E-5slowfast_r1014SGD1 × 10−35 × 10−4radar-591.96
E-6slowfast_16 × 8_R1012SGD1 × 10−35 × 10−4radar-599.11
E-7slowfast_16 × 8_R101
(freeze)
2SGD1 × 10−35 × 10−4radar-575.00
Table 7. Distribution of samples across folds for cross-validation.
Fold NumberTrain SizeTest SizeAccuracy (%)95% Confidence
Interval
Standard Error
144111299.11[96.82, 99.87]0.0087
244211199.10[96.79, 99.86]0.0088
3442111100.00[98.42, 100.00]0.0000
444311099.09[96.75, 99.85]0.0089
544410999.08[96.72, 99.84]0.0090
Table 8. Progressive performance improvement through component integration.
ConfigurationAccuracy (%)Key Enhancement
Raw + 2D CNN76.3Baseline
STFT + 2D CNN82.1Time–frequency analysis
EWT + 2D CNN89.5Adaptive decomposition
EWT-Hilbert + 2D CNN91.8Phase information
EWT-Hilbert + SlowFast99.28Temporal modeling
Table 9. Performance comparison of UWB radar-based human activity recognition methods.
MethodRadar TypeActivitiesAccuracy (%)Validation
Maitre et al. [15]3 × UWB1595.0Multi-subject
Ding et al. [16]UWB1295.3Multi-subject
Qi et al. [17]UWB12~85.0Multi-subject
Pardhu et al. [18]UWB395.6Limited
An et al. [19]UWB-MIMO698.7Multi-subject
Our Method1 × UWB599.285-fold cross-validation
Disclaimer/Publisher’s Note: The statements, opinions and data contained in all publications are solely those of the individual author(s) and contributor(s) and not of MDPI and/or the editor(s). MDPI and/or the editor(s) disclaim responsibility for any injury to people or property resulting from any ideas, methods, instructions or products referred to in the content.