1. Introduction
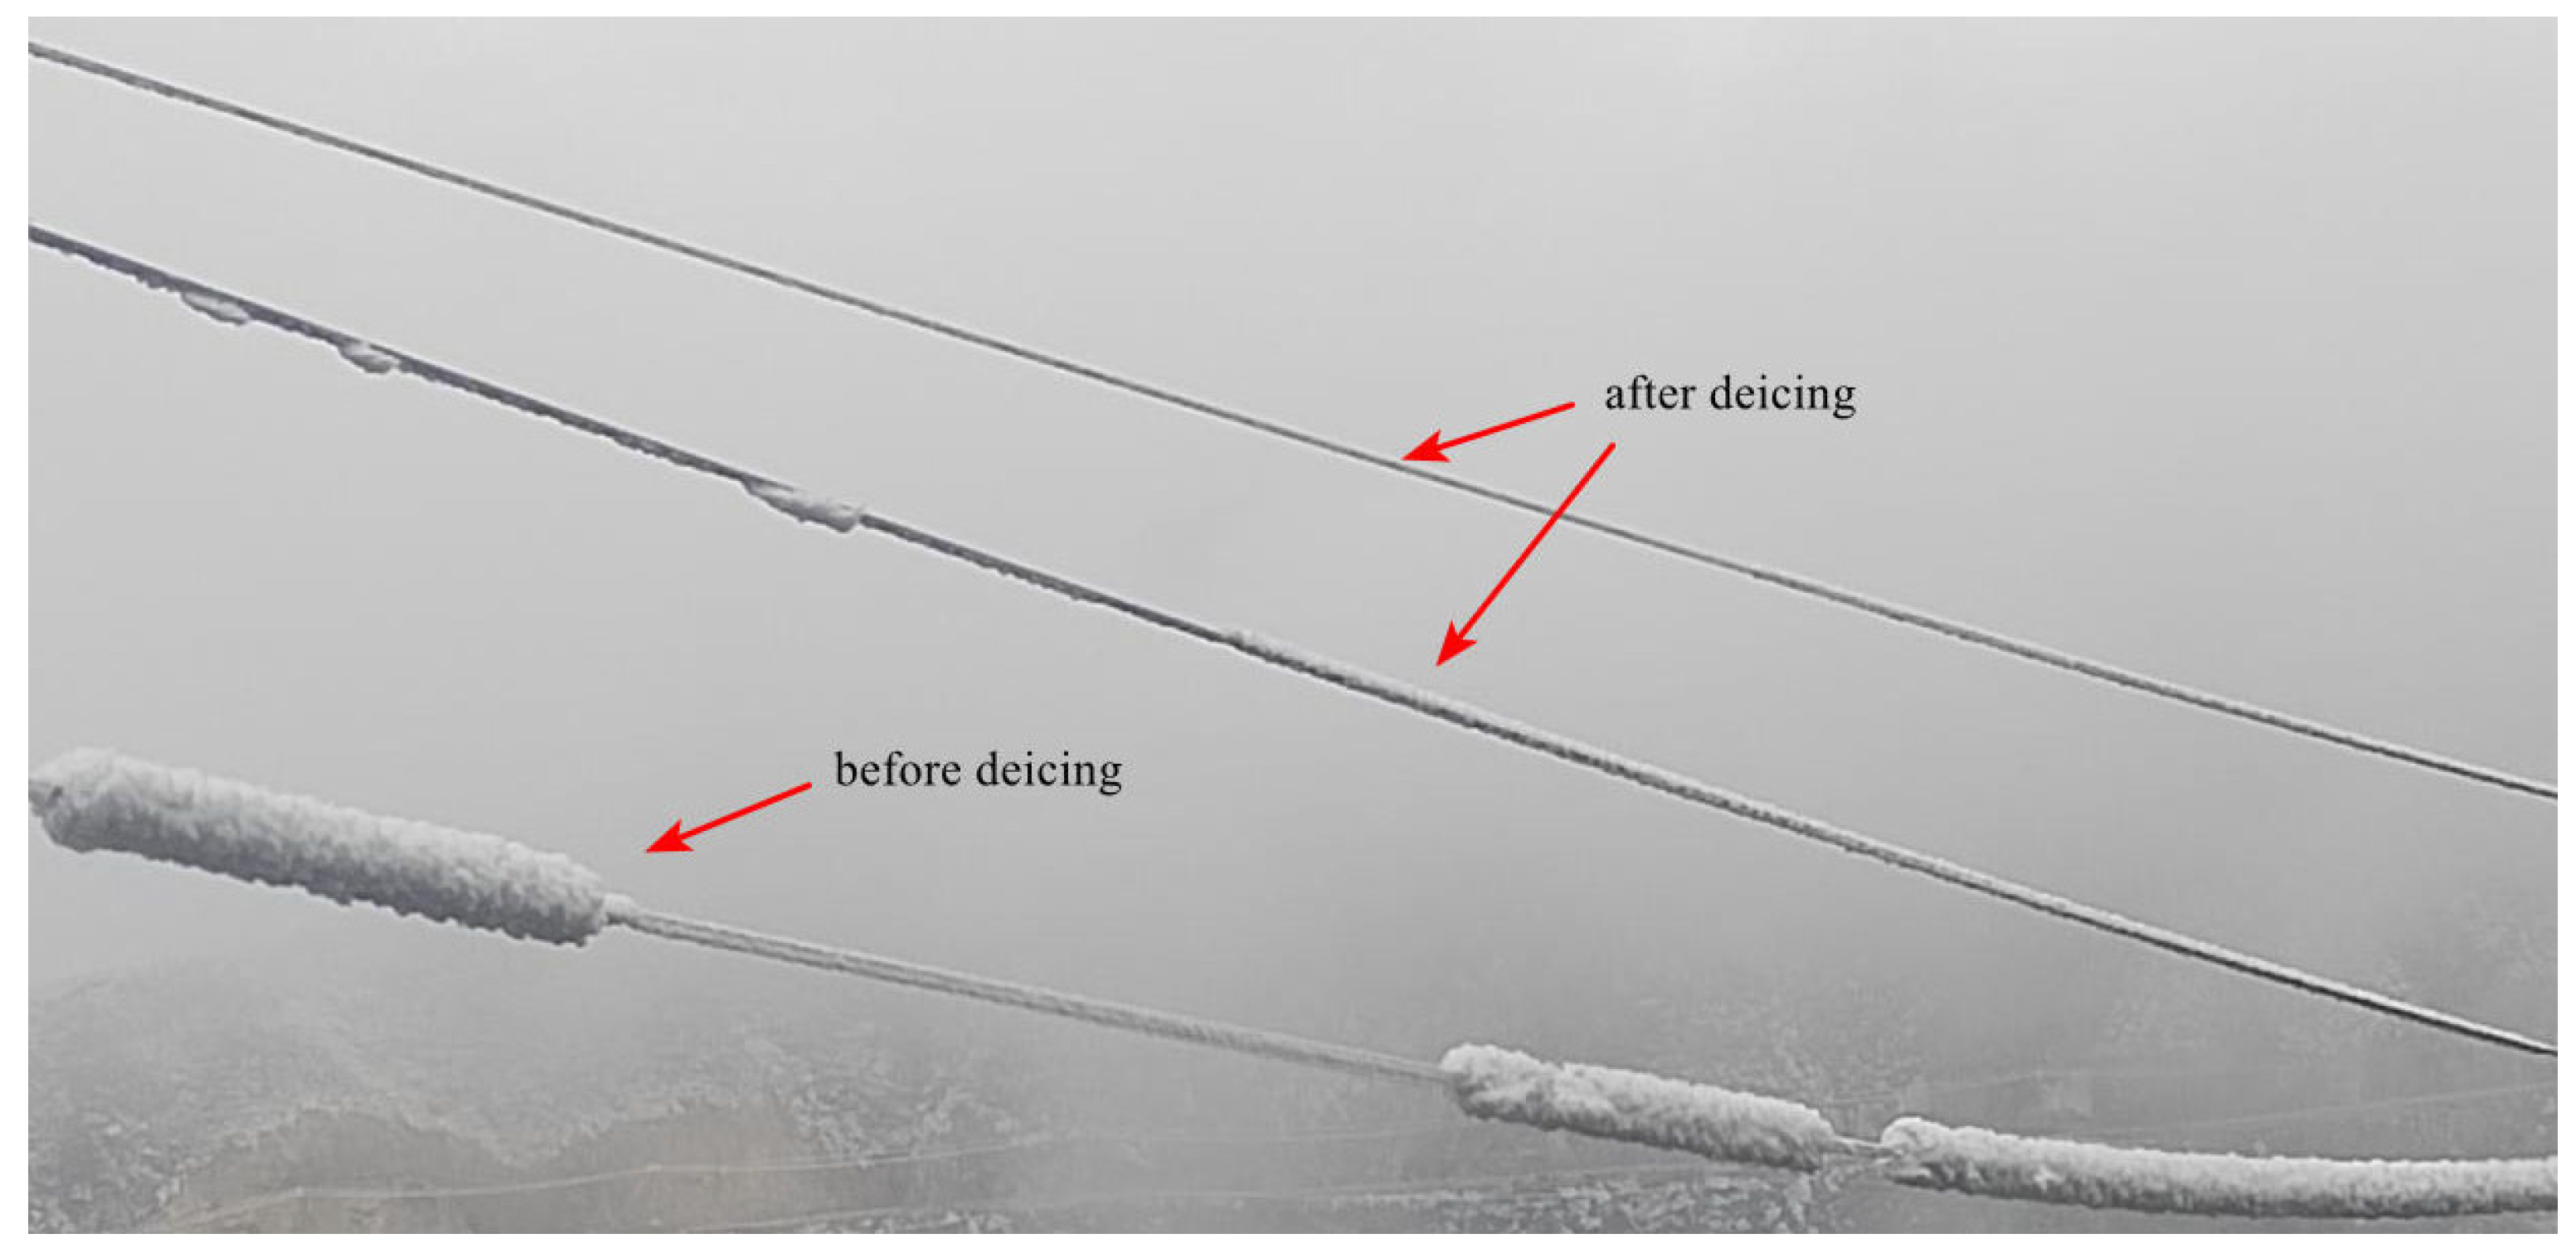
Winter is characterized by a low-temperature and low-rainfall climate. When an inversion layer exists in the lower atmosphere, the near-surface temperature ranges from −5 to −1 °C. Rainwater dripping onto this surface freezes into freezing rain, quickly forming a layer of ice that can easily accumulate additional ice. When the ice-covered snow generated by the hanging ice load exceeds a certain limit value, it will make the tower collapse and interrupt the power supply, jeopardizing the safety of the distribution network. China is one of the countries in the world that is seriously affected by line ice cover, and line ice cover exceeding design standards may lead to ice accidents such as line tower breakage, conductor dancing, switchgear failure, equipment external insulation discharge, and large-area blackout; flashover and insulator damage are easily generated when the ice cover melts and falls off [
1]. Sporadic freezing rain and snow occurred in Hubei, Hunan, and other areas before and after the Spring Festival of 2024, causing traffic disruptions on high-speed railways and highways. It caused the interruption of high-speed rail and highway traffic, which caused significant disasters and losses to peoples’ productivity and lives, and the direct economic losses exceeded ten billion yuan.
Currently, the primary methods for line de-icing include manual de-icing, mechanical de-icing, and thermal de-icing. Manual de-icing is hazardous and inefficient; mechanical de-icing equipment is expensive and complex to maintain; and thermal de-icing consumes large amounts of energy, significantly impacting the environment. Therefore, developing high-efficiency, safe, and environmentally friendly de-icing devices is of great importance [
2]. Regarding ice detection on overhead lines, advancements in computer vision technology have led to increased attention to object detection methods. The YOLO algorithm, one of the leading object detection algorithms today, has been widely applied across various scenarios due to its fast processing speed and high accuracy [
3].
Extensive international research has been conducted on robotic de-icing. MONTAMBAULTS developed a non-obstacle-crossing inspection robot capable of real-time monitoring and the effective de-icing of overhead iced power lines. However, the robot lacks sufficient intelligence and cannot operate continuously, which limits its development [
4]. Vijay et al. proposed a boundary sliding-mode control strategy based on an RBFNN observer, achieving the motion control of a three-degree-of-freedom de-icing robotic arm. Nevertheless, the system’s robustness requires improvement to handle strong disturbances [
5]. Paul et al. developed a self-powered system for power line de-icing robots using nonlinear modeling techniques based on electromagnetic energy harvesters [
6]. Regarding de-icing technology classification, the Regina team systematically analyzed the performance boundaries of passive and active de-icing methods, providing critical reference criteria for engineering anti-icing system design [
7]. Xu verified the efficiency enhancement mechanism of ultrasonic-guided waves synergizing with low-frequency resonance by exciting composite vibration modes using piezoelectric ceramics [
8]. As a novel de-icing technology, resonance technology remains in the exploratory stage for its application in overhead line de-icing, with relatively limited research conducted to date.
Addressing the issue of winter icing on medium-voltage overhead lines, this paper enhances the existing YOLOv7 algorithm by incorporating a parameter-free attention mechanism called SimAM. It also introduces the MPDIoU loss function, develops a task-specific decoupled head, and proposes an improved YOLOv7 object detection algorithm for accurately identifying the thickness of ice accumulation on power lines. Furthermore, a de-icing device based on mechanical resonance technology is designed and developed. By deploying the improved YOLOv7 algorithm on this device, it can detect ice thickness in real time, adjust the motor’s vibration frequency, increase the amplitude of wire vibrations, and thereby improve de-icing efficiency.
2. Ice Detection Algorithm Design
2.1. Introduction to Basic Principles of YOLOv7 Algorithm
YOLOv7 is one of the most advanced YOLO algorithms available, and it has achieved leading speed and accuracy in the range of 5 to 160 frames per second (FPS) on the MSCOCO dataset [
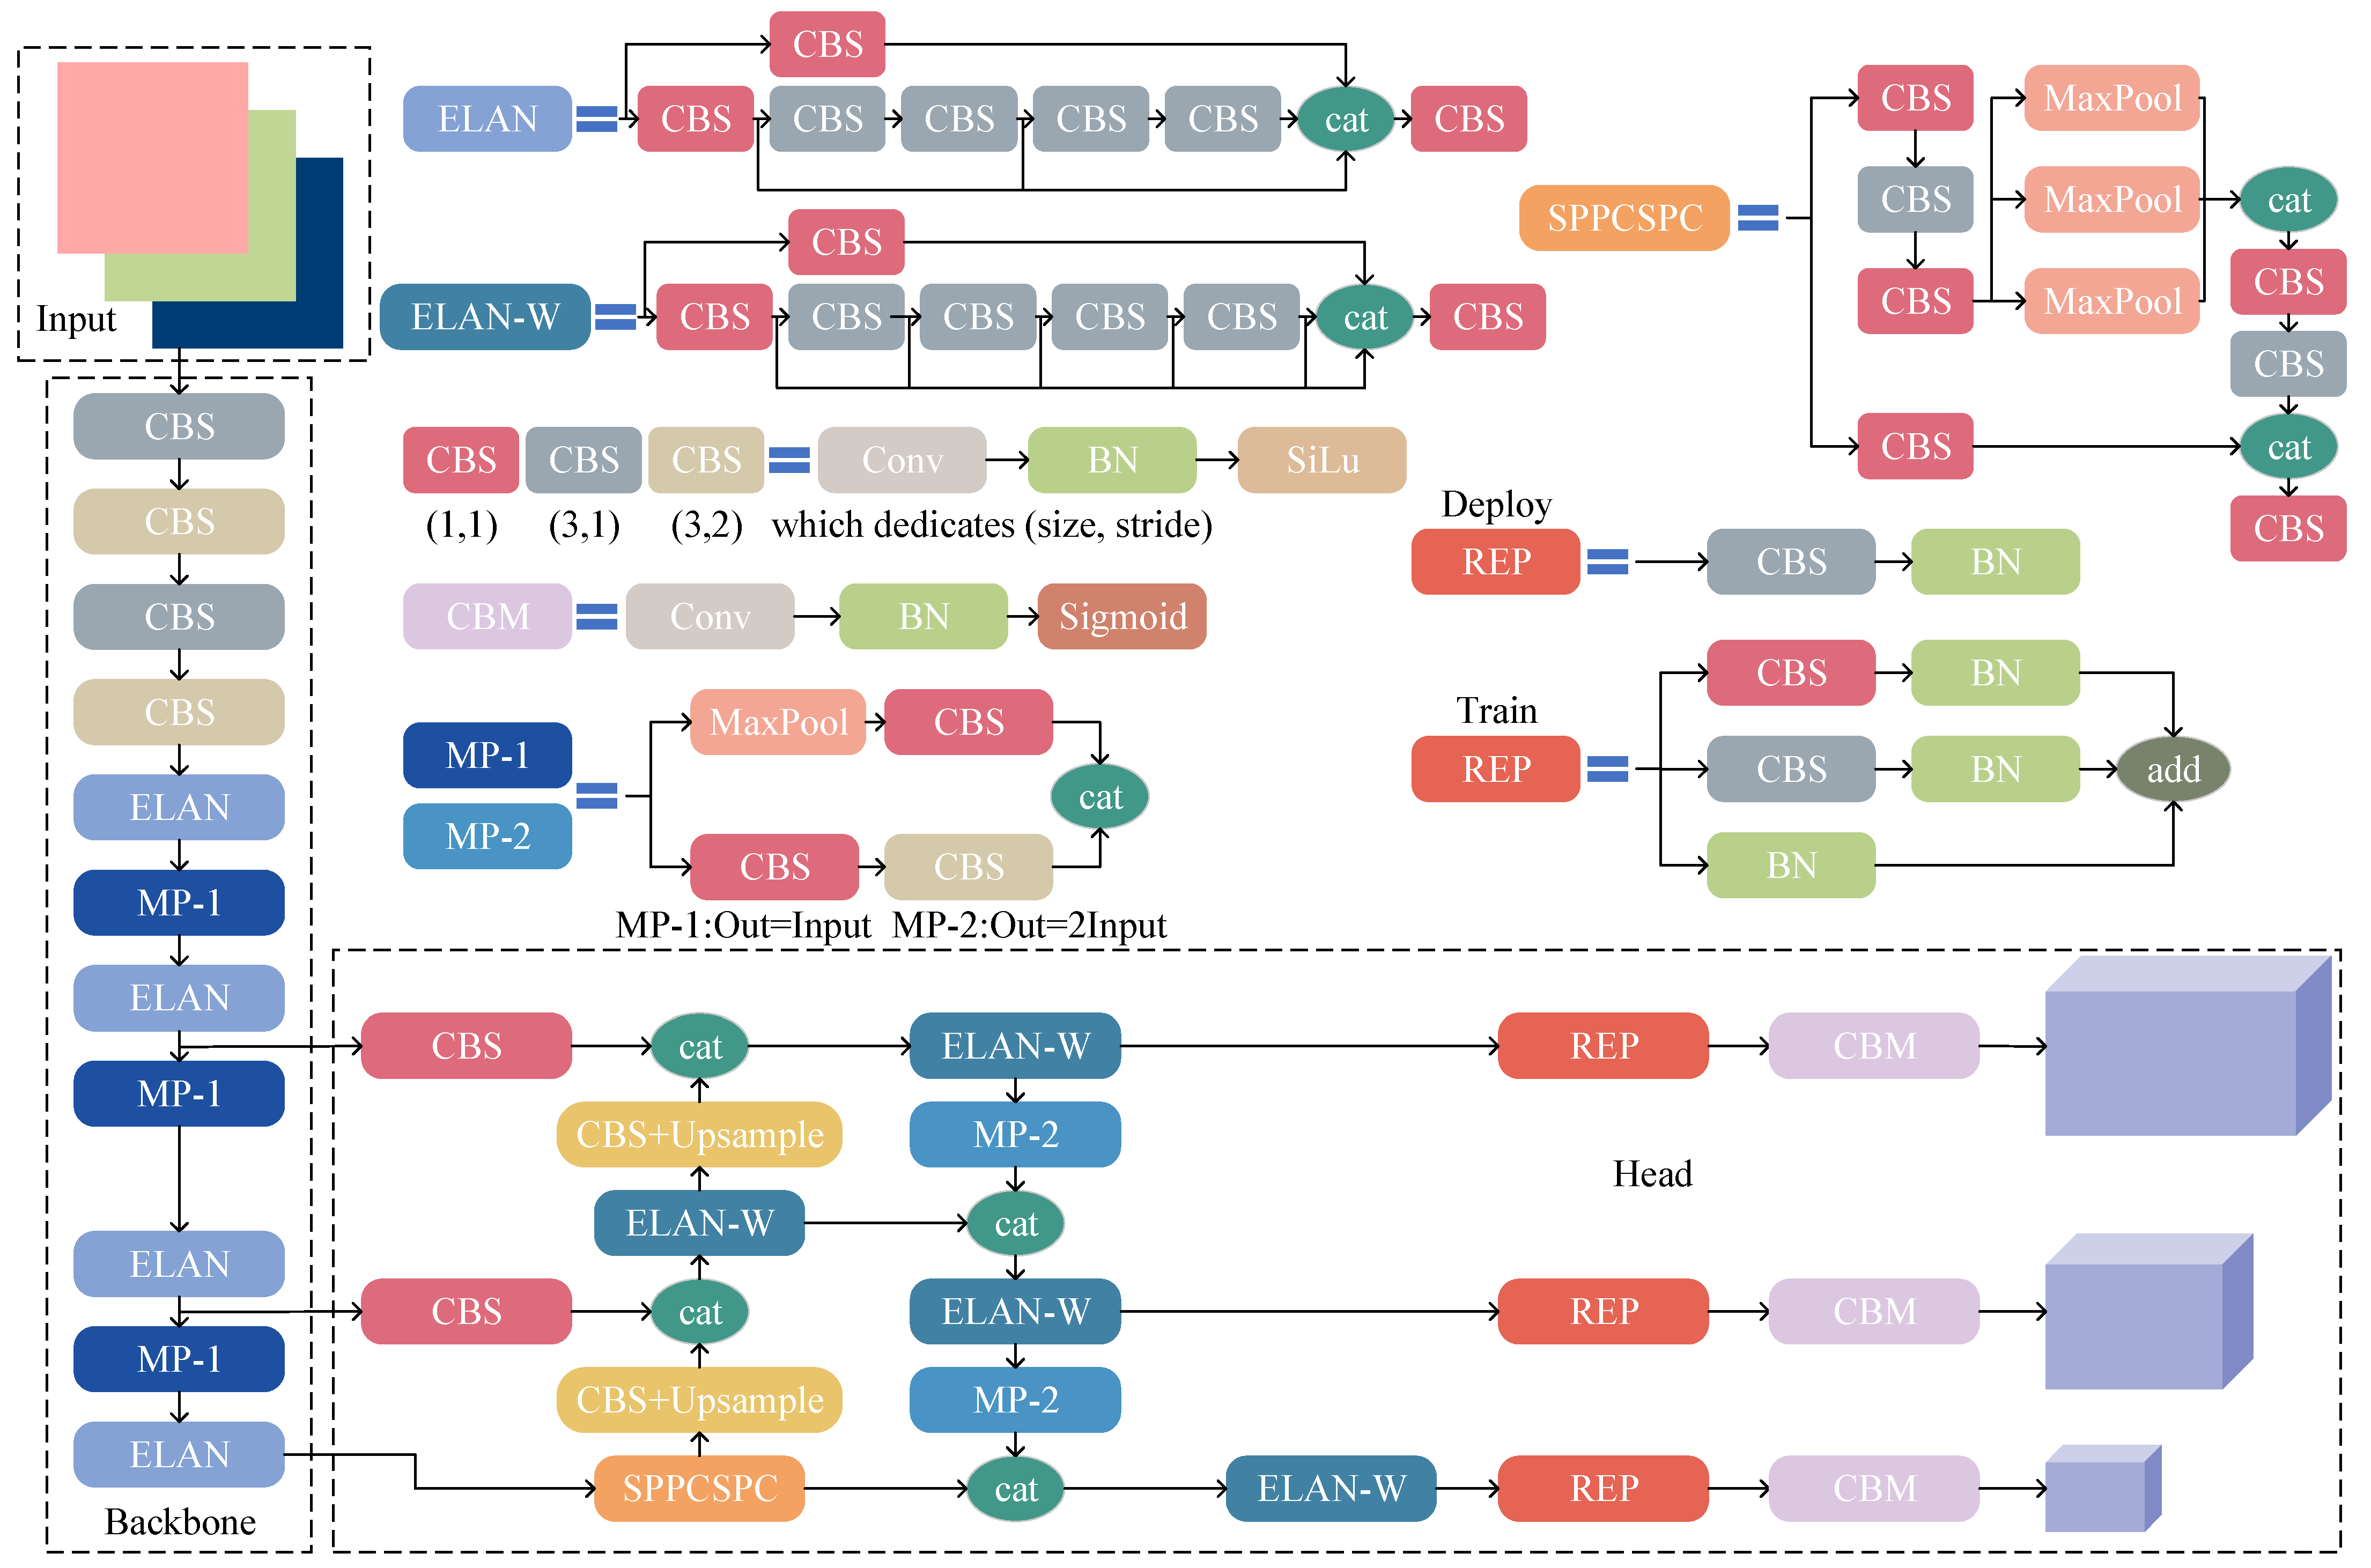
9]. The input, backbone, and head constitute the main structure of the YOLOv7 network, as shown in
Figure 1. At the input side, the YOLOv7 network uniformly adjusts the size of the input image to the size of 640 × 640 and passes it to the backbone network, after which the image data undergoes convolutional transformation by the four groups of CBS modules; the function of the backbone network is to regulate the overall gradient path of the network through the ELAN module. This enables the network to achieve the gradient path, even in instances where the stacking is inadequate. The backbone network controls the overall gradient path of the network through the ELAN module, which enables the network to realize efficient learning and convergence even in the case of deep stacking, thus improving the speed of algorithmic reasoning while improving the accuracy; the head network adopts the same multi-layer feature extraction strategy as the YOLOv3 series, i.e., the output of the backbone network is taken from three different features as the base data for prediction, and the different dimensional features go through the feature pyramid when making predictions [
10] and the path fusion network [
11] to realize different levels of information fusion and complementarity. Eventually, the features of different dimensions are output as results through the reparameterized convolutional layer. The reparameterized convolutional module integrates the convolutional layer and the BatchNorm layer, which consists of a set of 3 × 3 and a set of 1 × 1 convolutions as well as constant mapping at the time of training, and it was reparameterized to a single 3 × 3 convolution at the time of inference, which improves algorithmic performance.
To improve the accuracy of the device of ice overlay detection and realize the accurate positioning of the ice layer, the algorithm needs to be highly robust, and there is a large amount of background information in the medium-voltage overhead line ice overlay image, which increases the difficulty of detecting ice overlay line ice cover [
12]. The existing YOLOv7 algorithm small-object detection accuracy is low, with background misjudgment and other issues. Based on the existing YOLOv7 algorithm, the SimAM attention mechanism is introduced, the MPDIoU loss function is designed, and the TOCODE decoupling head is constructed, which lays the foundation for subsequent devices to accurately identify the ice overlay.
2.2. Introduction of SimAM Attention Mechanism
The existing YOLOv7 algorithm does not differentiate the importance of the input features, which leads to the algorithm’s insufficient attention to key information, making it difficult to adapt to the complex scenarios of wire ice cover. The attention mechanism can give different weights to different pieces of information so as to extract the important information in the redundant data and improve detection accuracy [
13]. The principle of the attention mechanism is that when humans process complex visual image information, they can quickly focus on the key areas. The computer transforms the above process into the following equation:
where
is the input feature,
is the attention produced based on the input feature, and
is the method of processing the input feature based on the attention.
In order to improve the accuracy of the YOLOv7 algorithm for ice cover detection and the adaptability of the algorithm to the complex environment, the SimAM attention module is constructed for YOLOv7, and based on neuroscience theory, three-dimensional weights are introduced to consider the influence of the space and channel dimensions on the attention at the same time, and the energy function is constructed for line ice cover individual neurons, which is given in the following formulas:
where
is the adjustable hyperparameter,
is the mean value of all neurons excluding neuron t under this channel, and
is the variance of all neurons with the exception of neuron
t in this particular channel. The formulas are as follows:
Combining the above formulas and considering that the pixels in each channel follow the same distribution among them, the mean and variance of all neurons can be used to calculate the energy of all neurons in that channel, and the neuron minimum energy formula is
From Equation (6), it can be seen that the lower the similarity between a single neuron and other neurons, the lower the energy and the more important it is for network recognition. SimAM attention of the processed features is calculated as follows:
where
E is the individual channel energy function, and the
Sigmoid function is used to limit the range of
E.
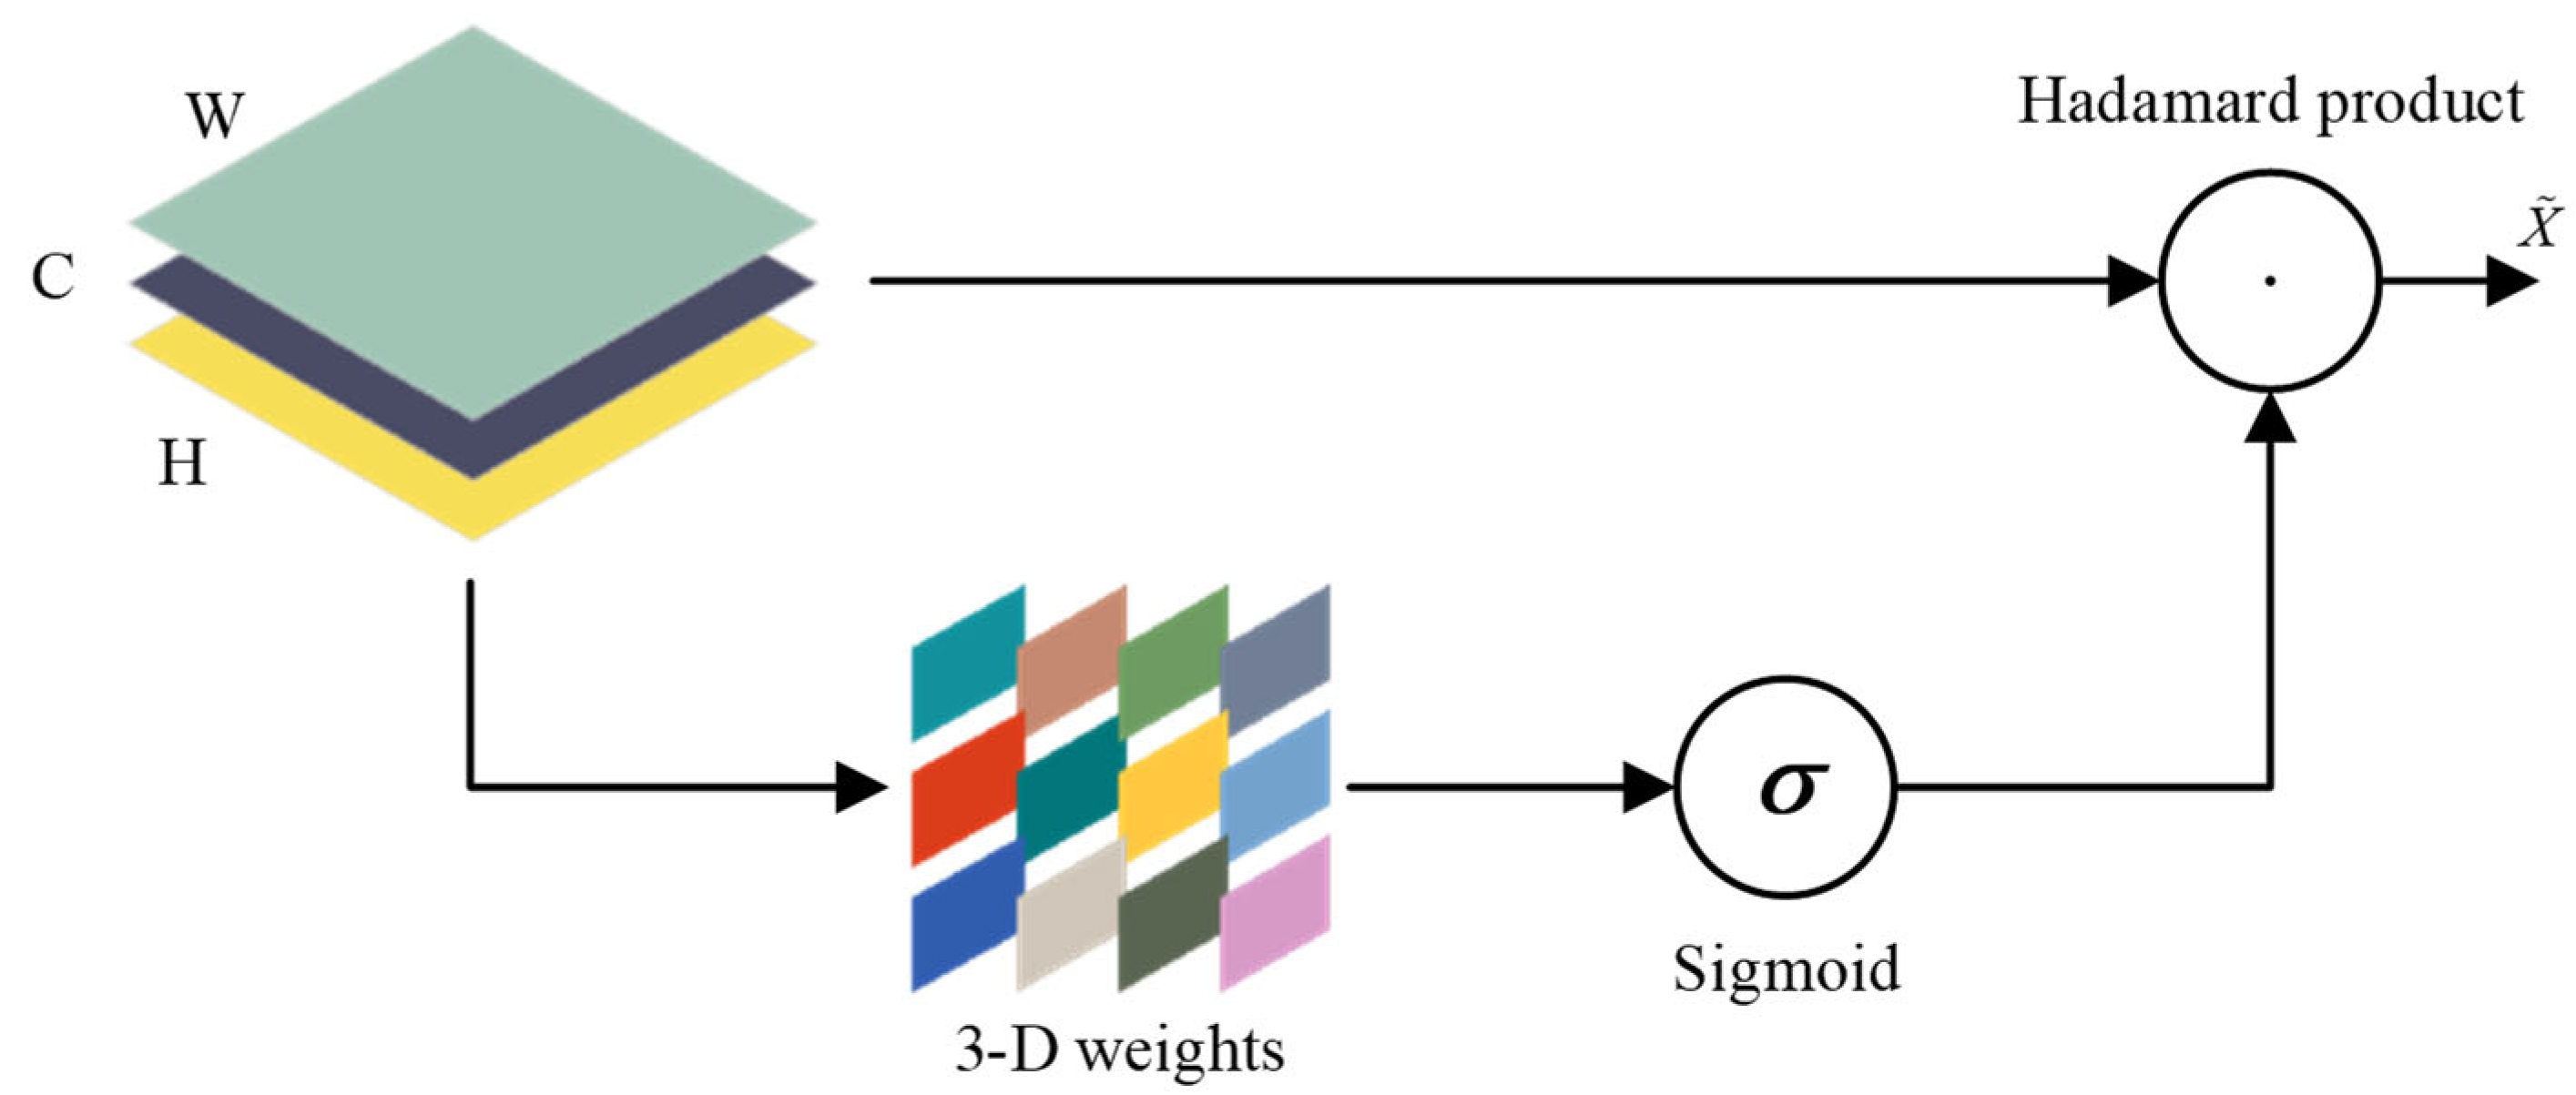
In summary, the principle of the SimAM attention mechanism is shown in
Figure 2, which embeds the SimAM mechanism into the convolutional network, realizes the attention extraction without adding additional parameters, and effectively solves the problem of background misjudgment.
2.3. MPDIoU Loss Function Design
YOLOv7 uses the
CIoU loss function to calculate the bounding box regression loss, which introduces the shape information of the object anchor frame for the algorithm and improves the recognition accuracy of the algorithm for objects with different aspect ratios [
14], and at the same time, the diagonal distance of the object frame is considered so that the algorithm is more sensitive to the position of the object anchor frame, and the formula of the
CIoU is
where
is the intersection over union between the predicted anchor frame and the actual anchor frame,
is the Euclidean distance in the predicted anchor frame and the actual anchor frame,
c is the diagonal length of the smallest outer rectangle formed by the predicted anchor frame and the actual anchor frame,
v is used to measure the consistency of the aspect ratio between the predicted anchor frame and the actual anchor frame, α is the trade-off parameter, and the formulas of
v and α are
The
CIoU loss function comprehensively considers the intersection over union, spatial distance, shape, and other information of the anchor frames, which more comprehensively optimizes the accuracy of the algorithm for object localization and is able to deal with more complex scenes. However, the
CIoU loss function involves calculations such as the inverse trigonometric function, which has a high computational complexity and leads to poor real-time performance of the algorithm. In addition, the parameter v introduced in the
CIoU only measures the difference in aspect ratios, which leads to the algorithm incorrectly optimizing the similarity between anchor frames. Considering the limitations of the
CIoU loss function mentioned above, the MPDIoU loss function was designed to optimize the regression loss using the minimum distance between specific points of the anchor frames [
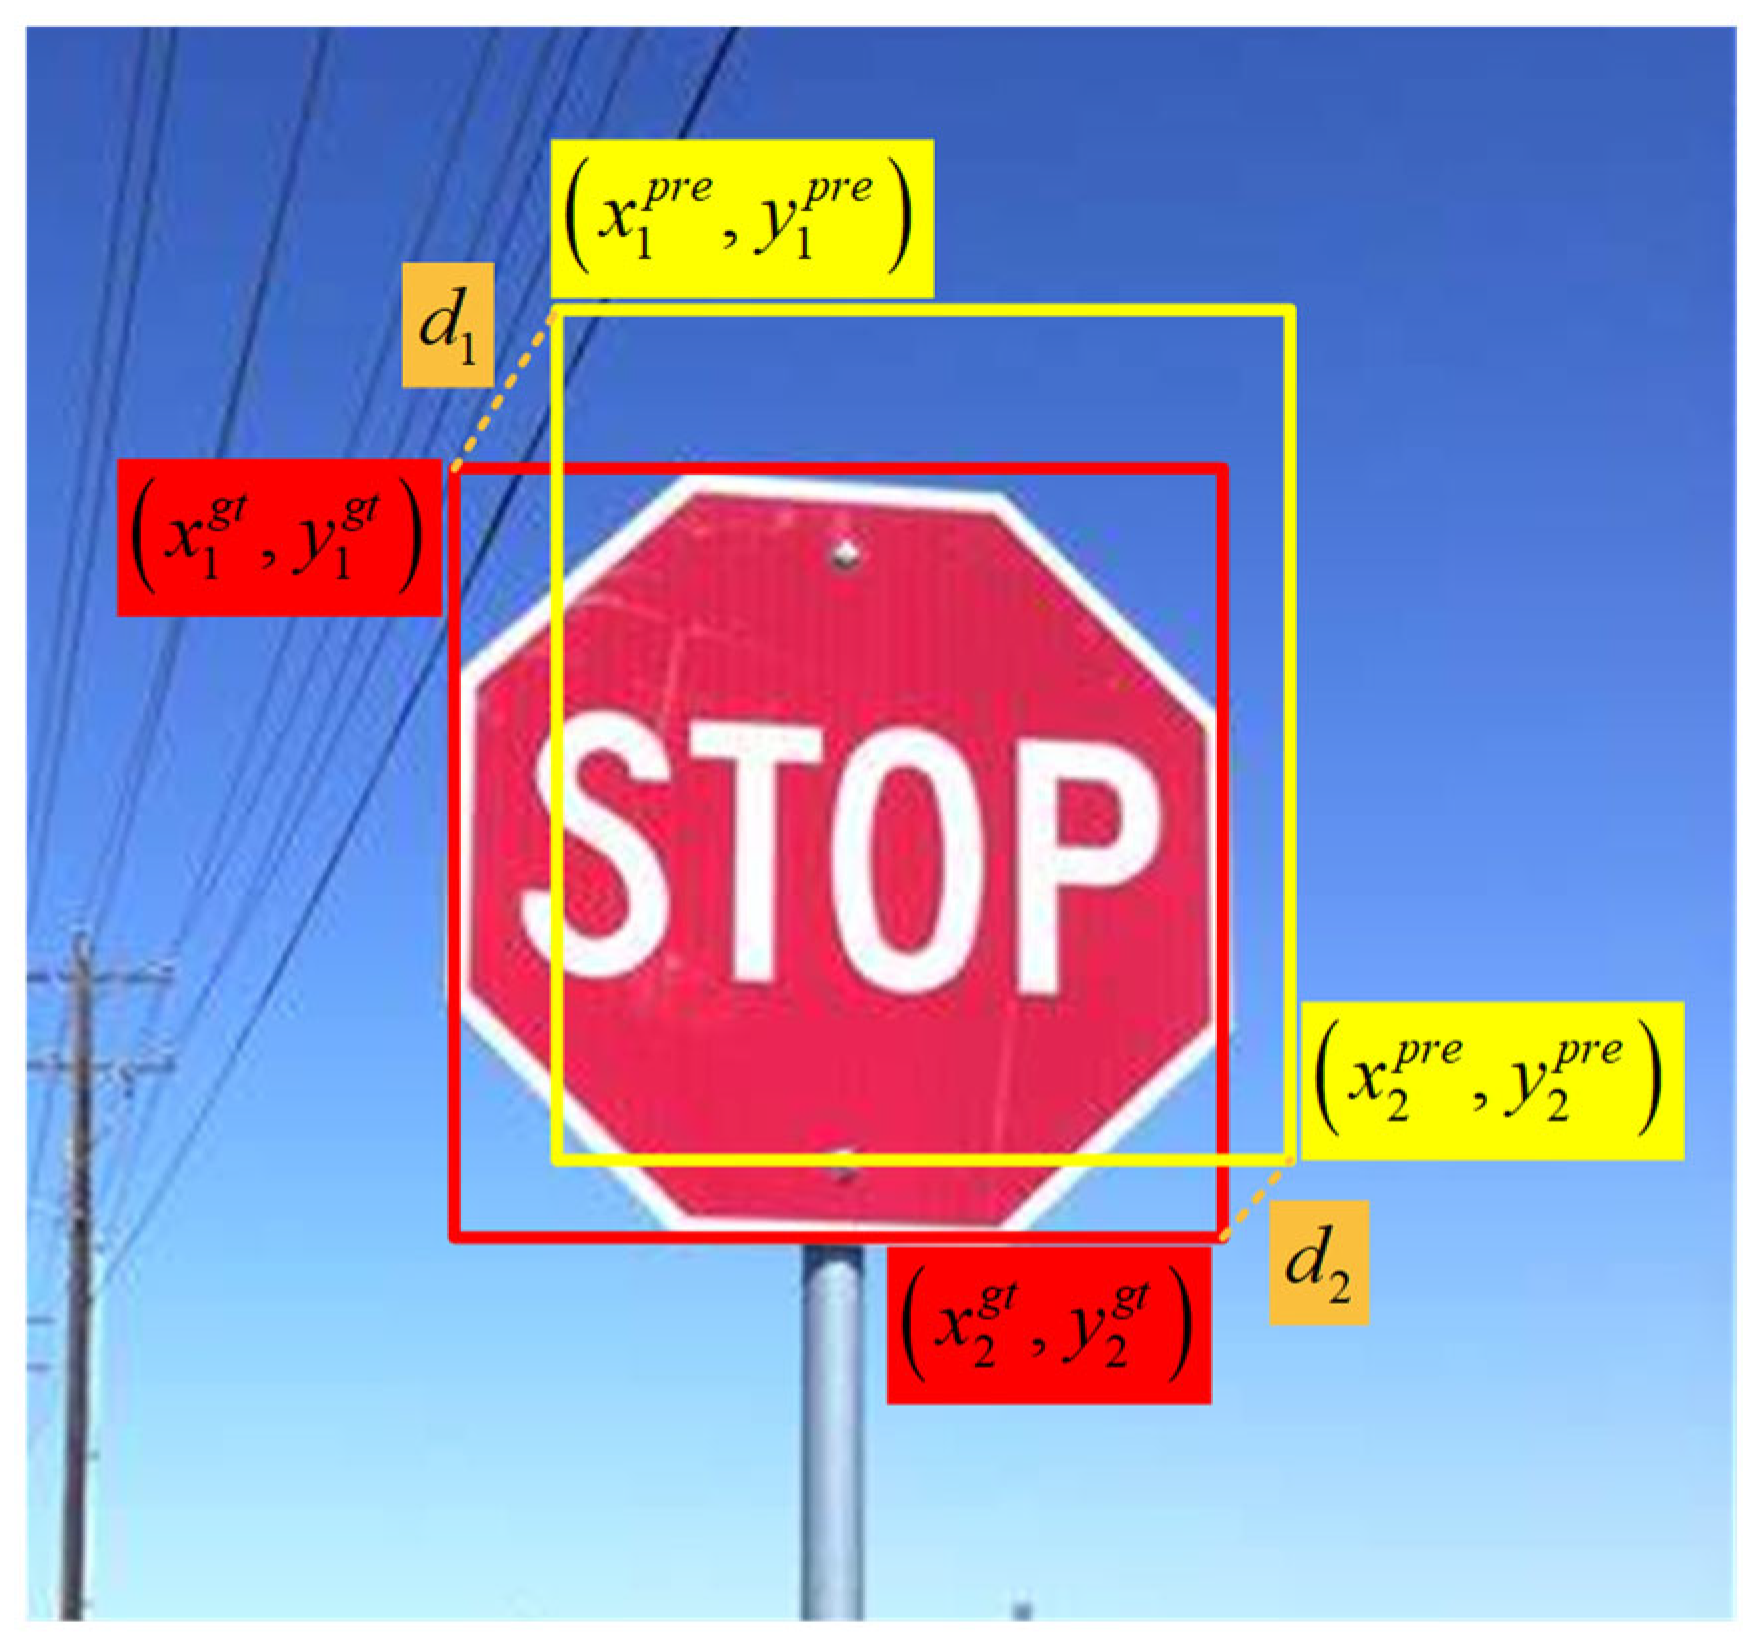
15]. The MPDIoU loss function defines the vertex distance between the actual anchor frames and the predicted anchor frames at the top-left corner as d
1 and defines the vertex distance at the top-right corner as d
2, as shown in
Figure 3.
The
MPDIoU loss function is calculated as
where
w is the width of the input image and
h is the height of the input image.
From Equation (10), it can be seen that the MPDIoU loss function efficiently takes into account the positional and shape differences between anchor frames, which simplifies the complex calculation method in CIoU and thus improves the computational efficiency. By designing the MPDIoU loss function to replace the CIoU loss function, the algorithm’s ability to localize the object is improved, which helps to improve the robot’s accuracy in detecting wire ice cover.
2.4. Construction of Task-Specific Context Decoupling Head
In object detection tasks, it is typically necessary to perform two subtasks, namely classification and regression. The object detection head in the existing YOLOv7 algorithm tends to couple these tasks together. However, the objectives and requirements of classification and regression differ significantly. Classification focuses more on the semantic information of the object, such as color and texture, whereas regression emphasizes the geometric information, including position and size. A decoupled head can be employed to create specific task contexts for classification and regression. This approach allows for tailored feature extraction and processing for each task, thereby improving detection accuracy and training efficiency. Coupling the two tasks can lead to optimization conflicts, which negatively impact both localization and classification accuracy.
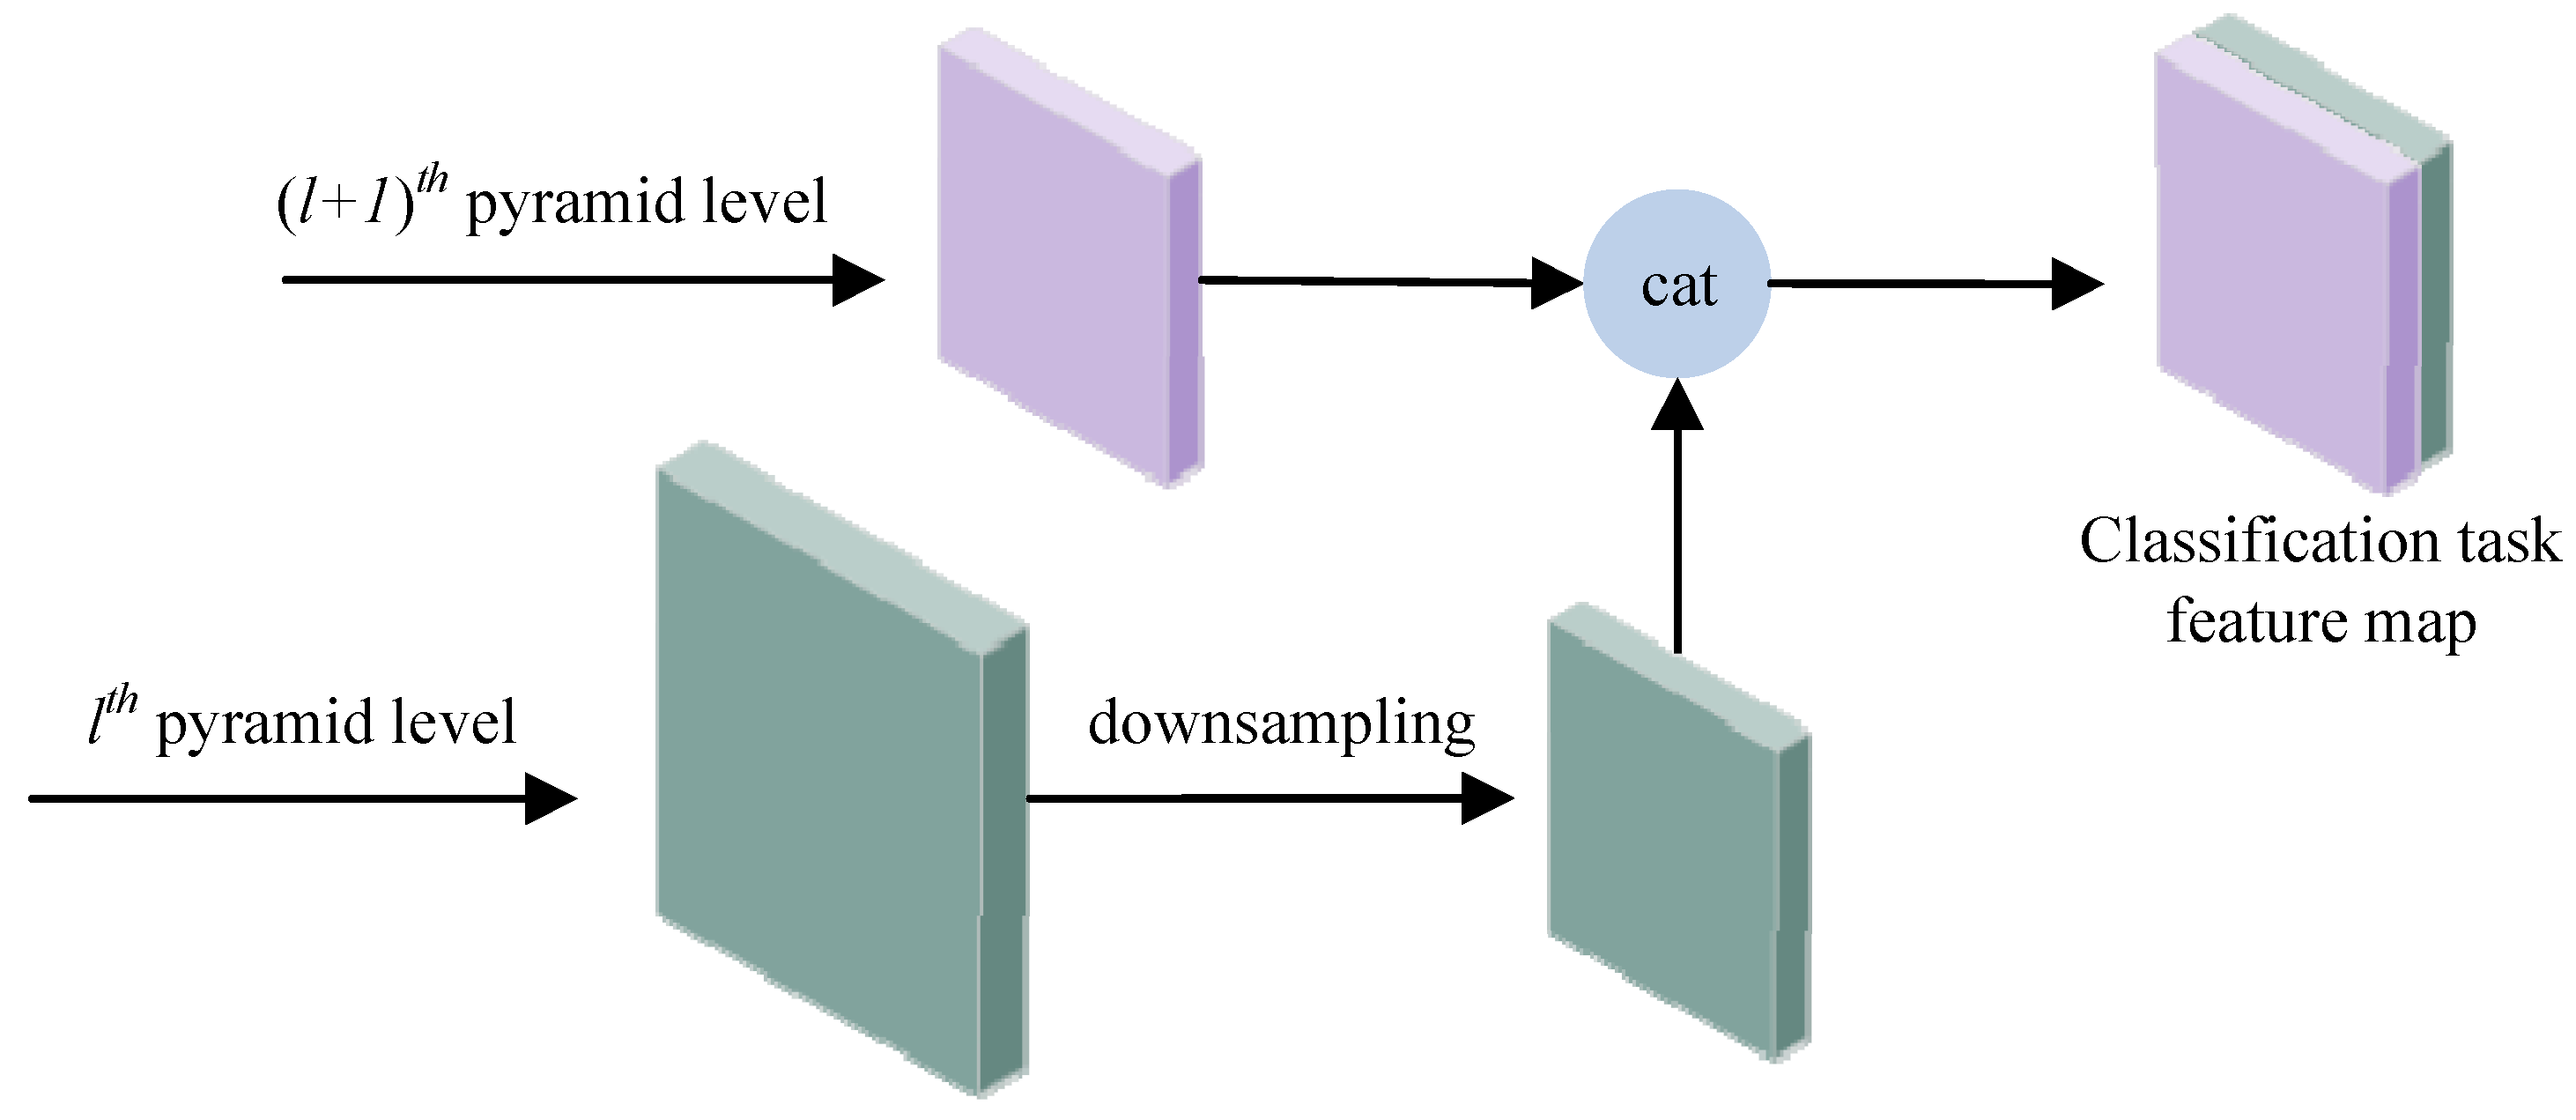
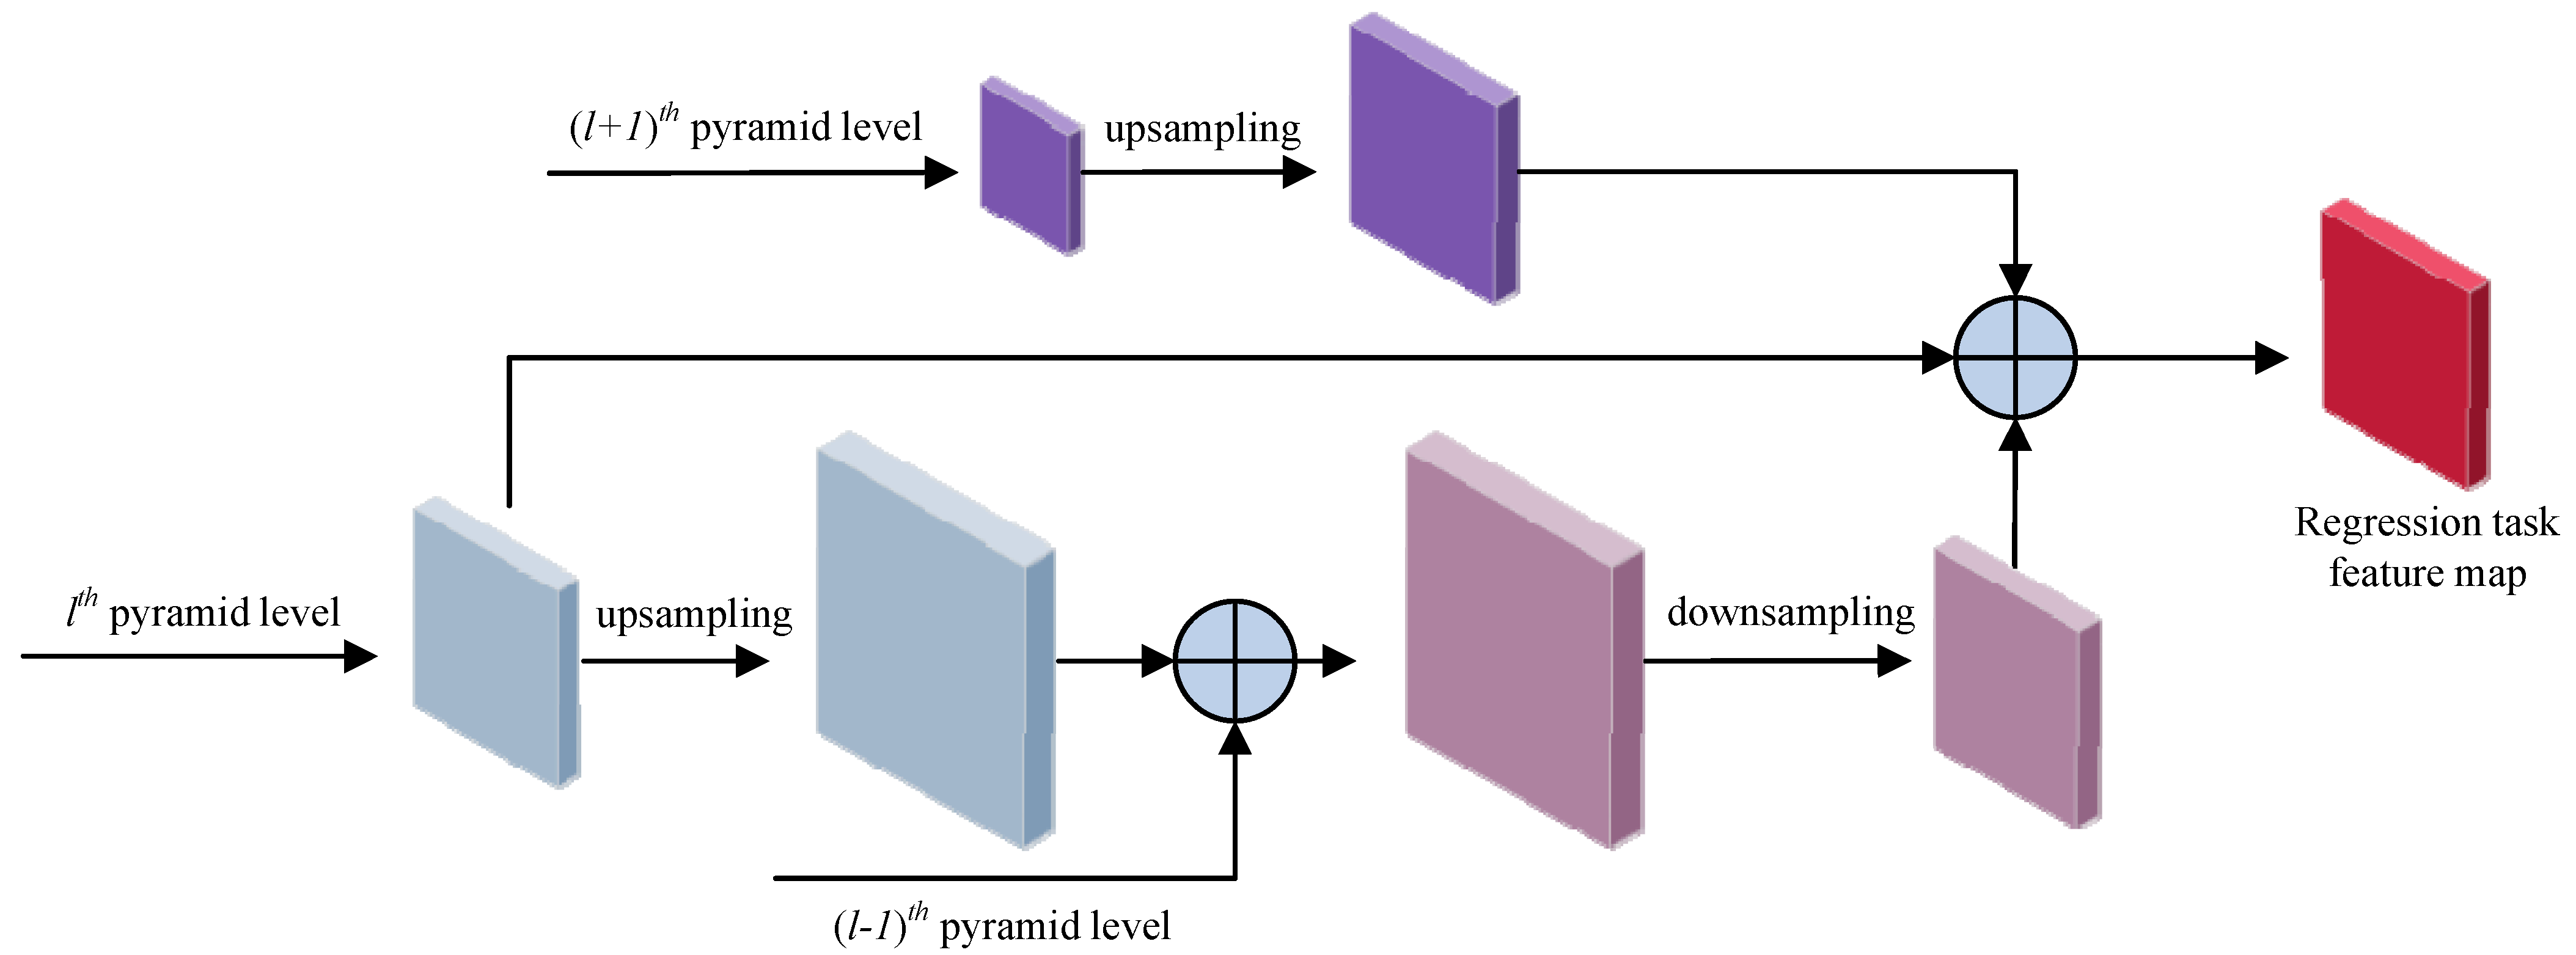
To address the aforementioned challenges, distinct feature networks have been designed for different tasks, and a task-specific context decoupling (TSCODE) framework has been developed. The classification task demands richer contextual semantic information; therefore, deep features are fused with shallow layers during classification. Conversely, the regression task requires more detailed spatial information, so adjacent feature layers are fused during regression. The classification and regression feature maps are illustrated in
Figure 4 and
Figure 5, respectively.
From the figure, it can be seen that the TSCODE head carries out independent feature extraction design for different tasks, which reduces the interference between different tasks, optimizes the utilization of features, makes the independence between different tasks higher, and thus improves the accuracy of the algorithm in detecting and identifying, as well as locating, the iced-over wires.
3. Development of Resonant De-Icing Device
3.1. De-Icing Device Structure Design
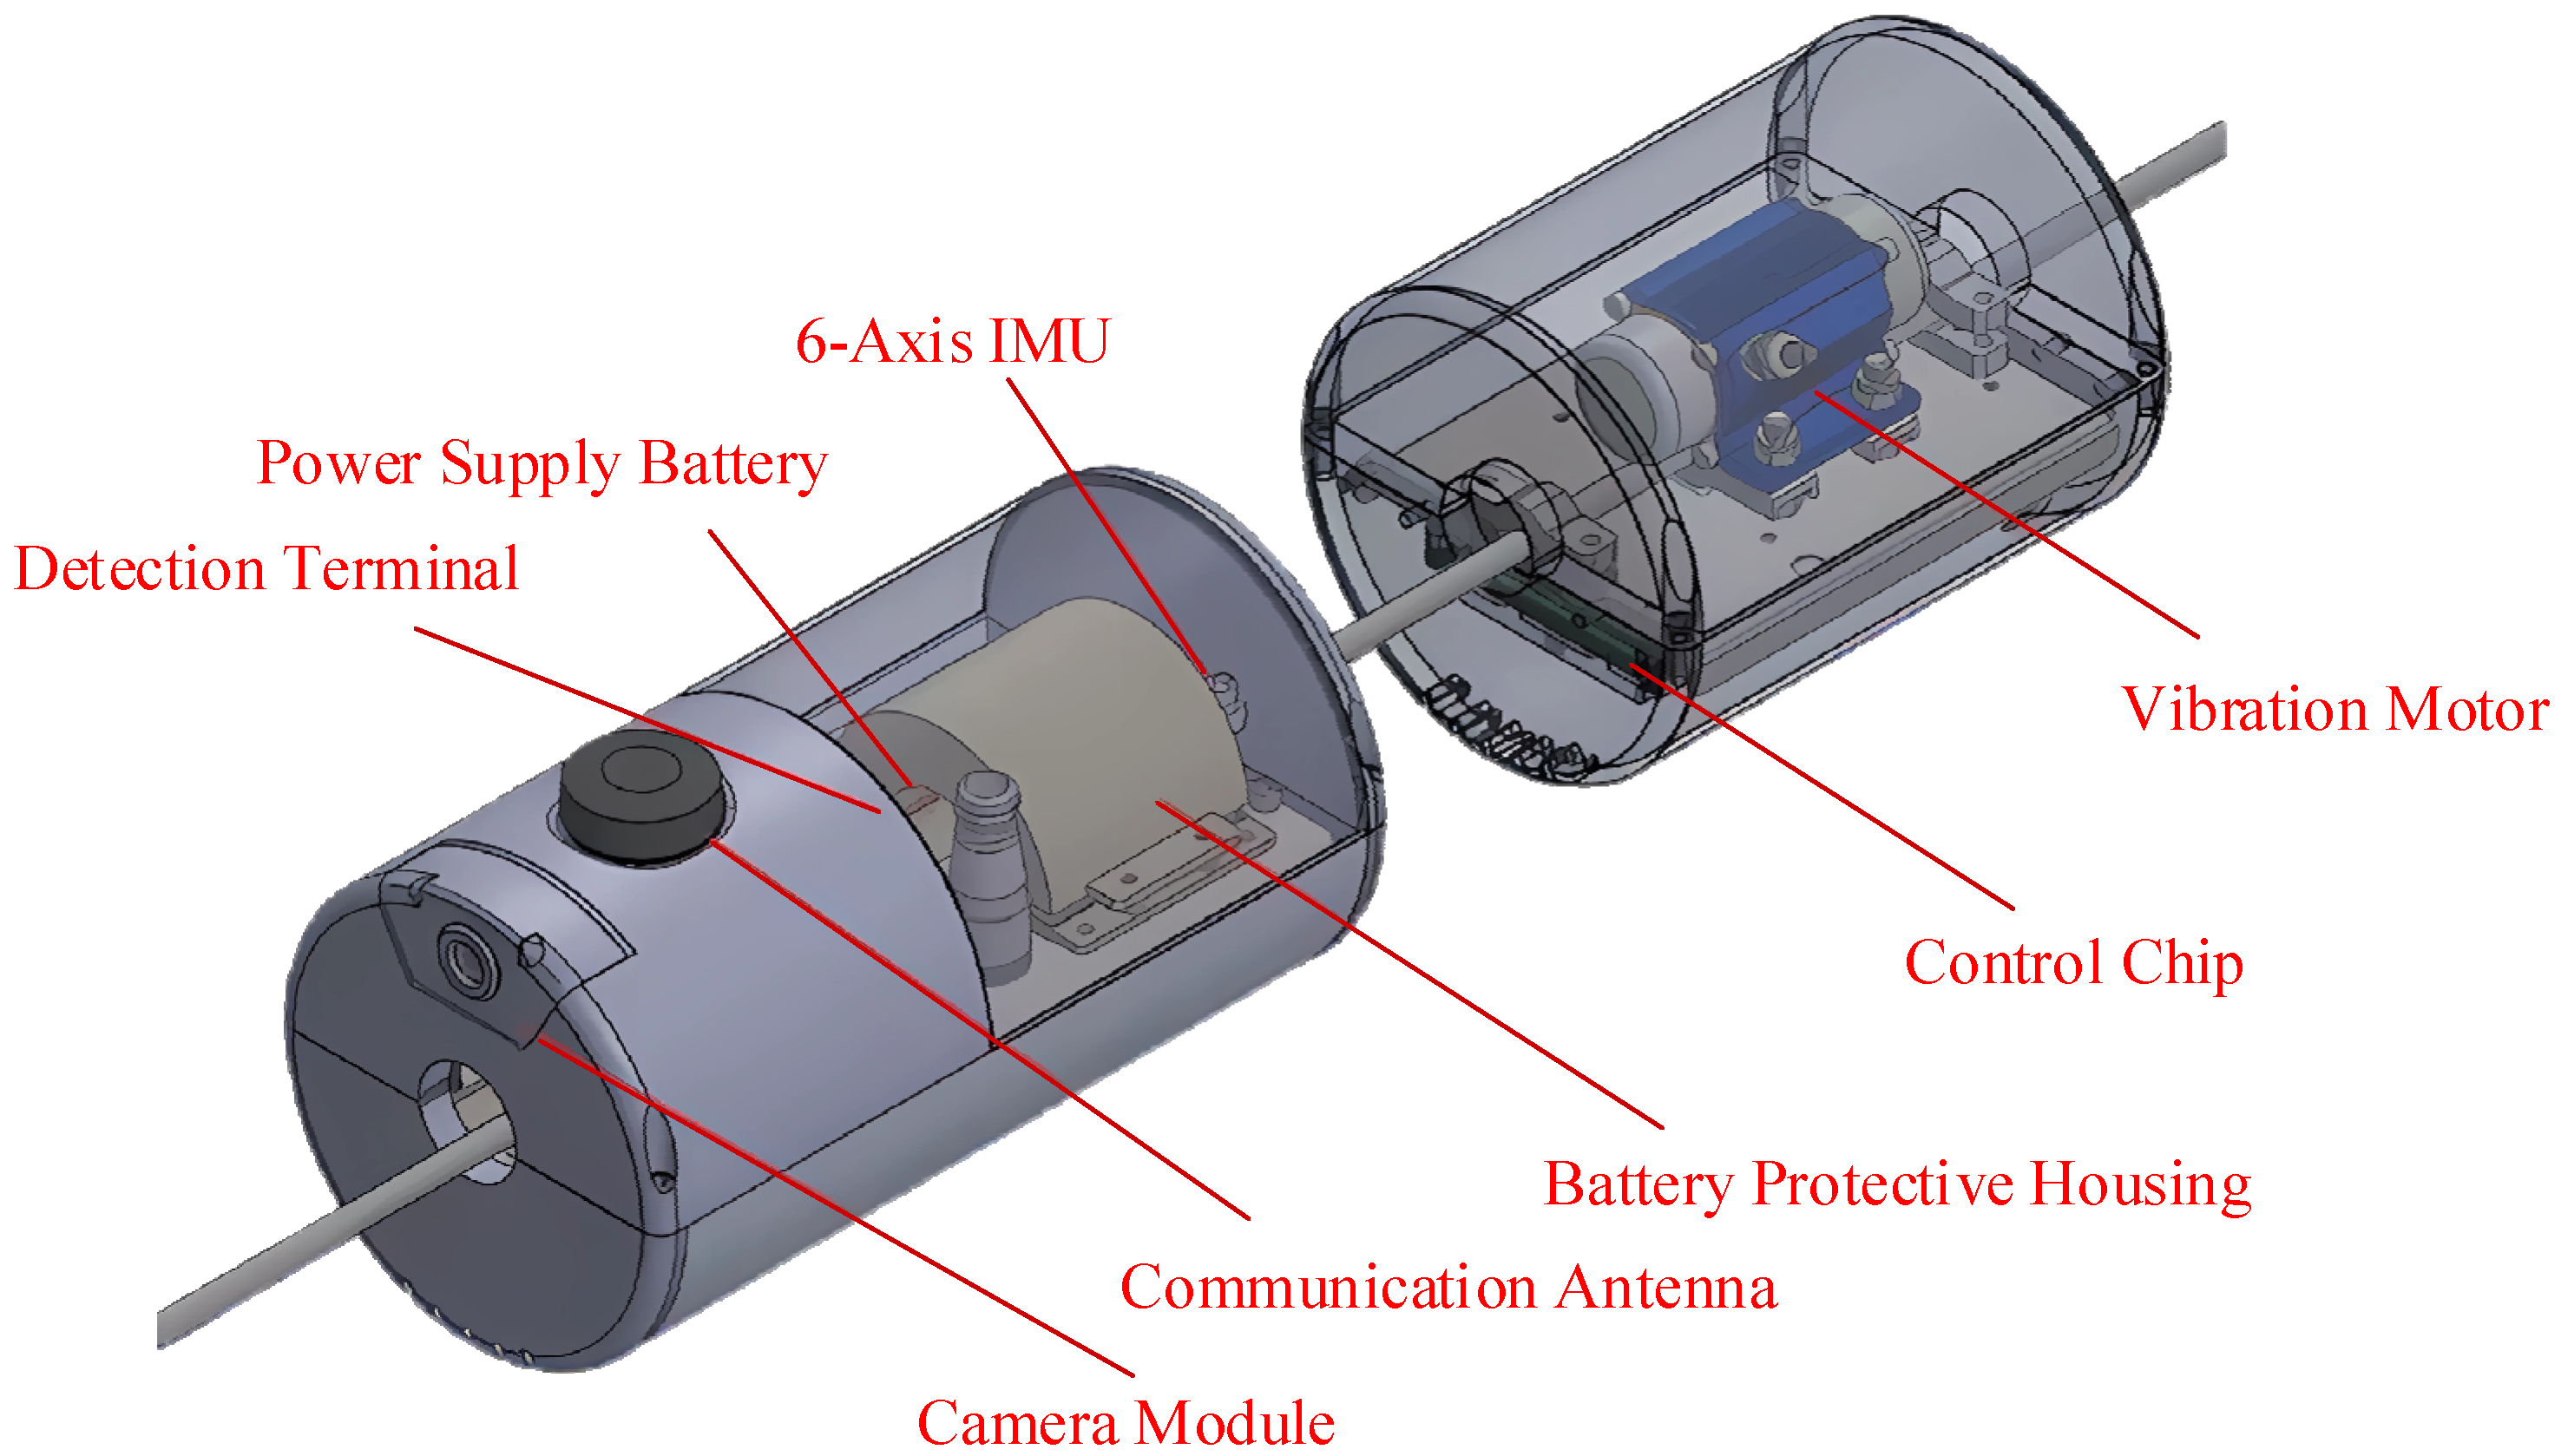
In this paper, according to the line de-icing needs, a resonance de-icing device based on mechanical resonance technology is designed, and its structure is shown in
Figure 6 and the physical figure is shown in
Figure 7, which shows the structure of the integrated de-icing device, which mainly contains the ice thickness detection module, the vibration module, and the control module.
The ice thickness detection module of the device consists of a detection terminal and a camera, which is used for real-time monitoring of the ice-covered condition of the conductor. When working, the 5-megapixel heating camera shoots images of the conductor in accordance with the set time period to obtain real-time image information of the conductor, and the built-in improved YOLOv7 algorithm in the detection terminal analyzes the processed image data intelligently to determine the ice cover status of the conductor. The analysis results are transmitted to the control module through the communication antenna in real time.
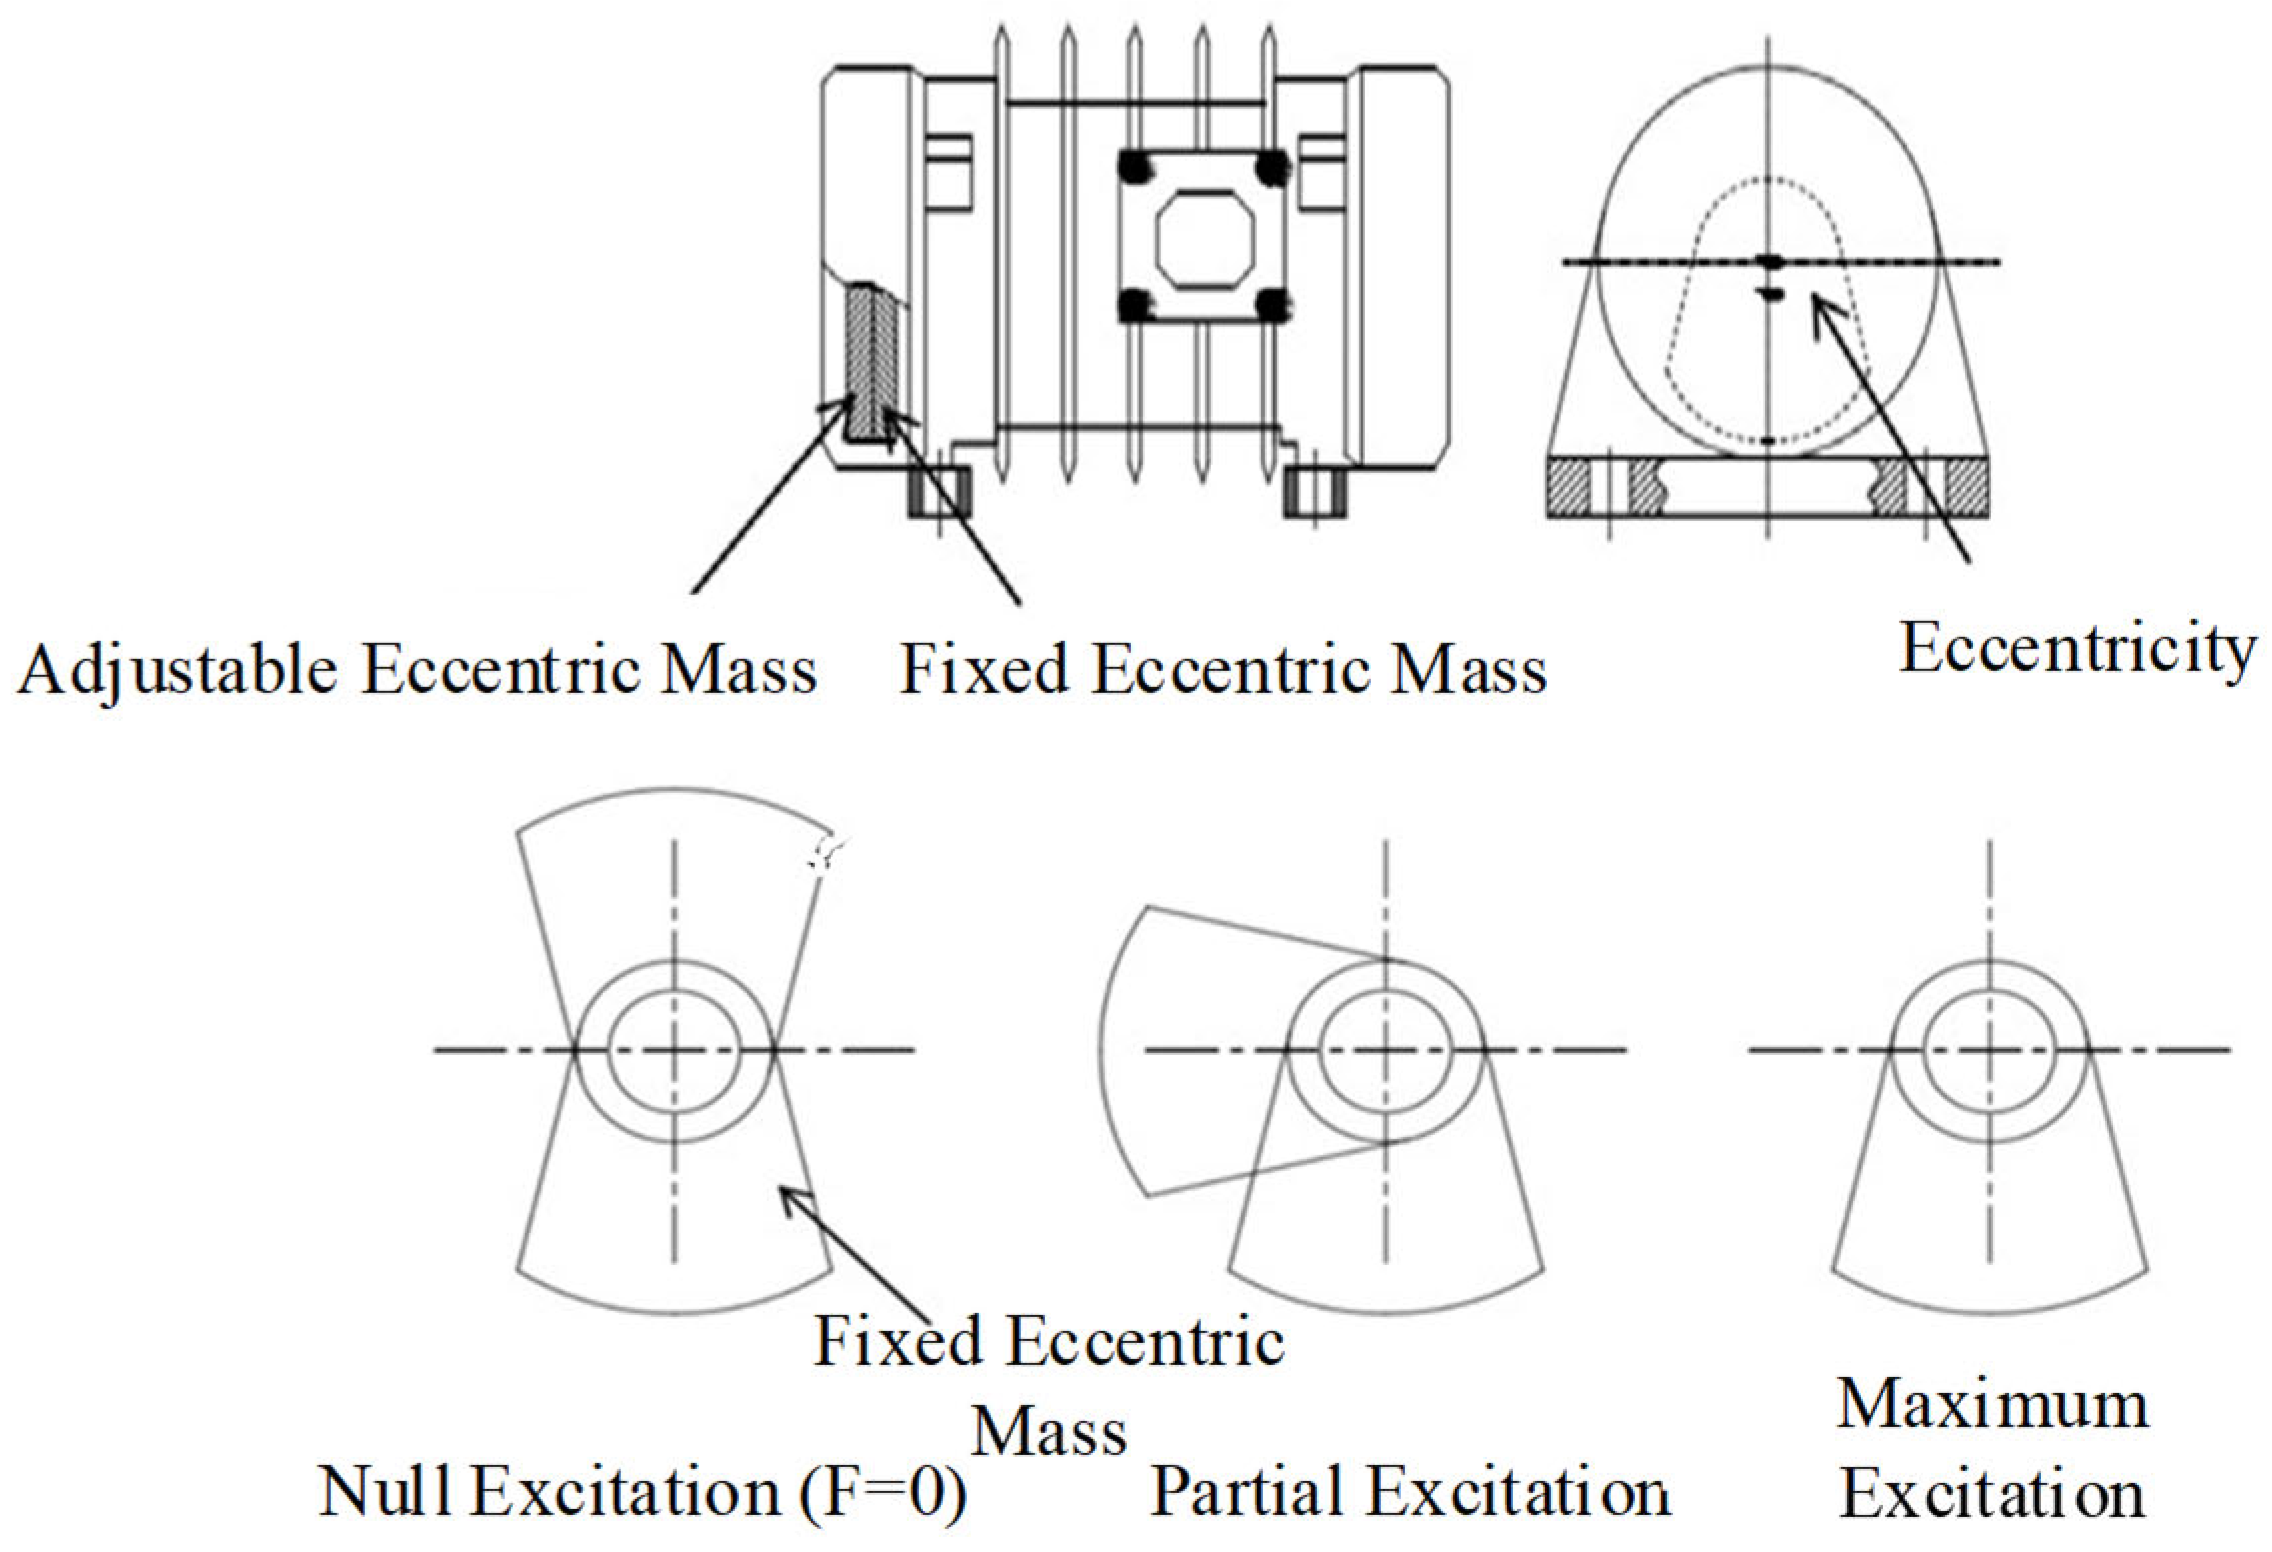
The vibration module of the device is the key execution part of the de-icing operation, and the vibration module is mainly composed of a vibration motor and its power supply circuit. When the required excitation force increases, the angle between the two eccentric blocks of the vibration motor decreases to achieve sufficient rotational speed, thus increasing the vibration amplitude; when the required excitation force decreases, the angle between the eccentric blocks increases, reducing the vibration amplitude, and the vibration frequency output from the vibration exciter is matched with the intrinsic frequency of the conductor through adjusting the speed of the stepping motor so as to realize highly efficient vibration de-icing; the structure of the vibration motor is shown in
Figure 8.
The control module takes the STM32L476RET6 microcontroller as the core control unit, which is able to accurately generate the PWM waveform to realize the accurate control of the vibration motor frequency. The control module receives the communication signals from the ice thickness detection module and the gyroscope through the 485 communication circuit and processes and analyzes the signals to further regulate the vibration module and improve the de-icing efficiency.
3.2. Analysis of Excitation Force of Vibration Module
The physical properties of the ice, including density, elastic modulus, and fracture toughness, have an important influence on the formation and stability of the ice [
16]. When the wire is struck, the vibration amplitude of the system increases significantly when the excitation frequency approaches the intrinsic frequency [
17], Similarly, for ice-covered wires, the different frequencies of the excitation force have different effects on the propagation of the wire vibration; when the frequency of the excitation force coincides with the intrinsic frequency of the wire, it will enhance the vibration signals significantly, thus extending the transmission distance of the vibration.
The key to the design of the resonant de-icing device is to determine the appropriate excitation frequency to match the intrinsic frequency of the overhead line, and the intrinsic frequency of the structure can be calculated by the following formula:
where
f is the ideal vibration frequency,
k is the system stiffness, and
m is the system mass.
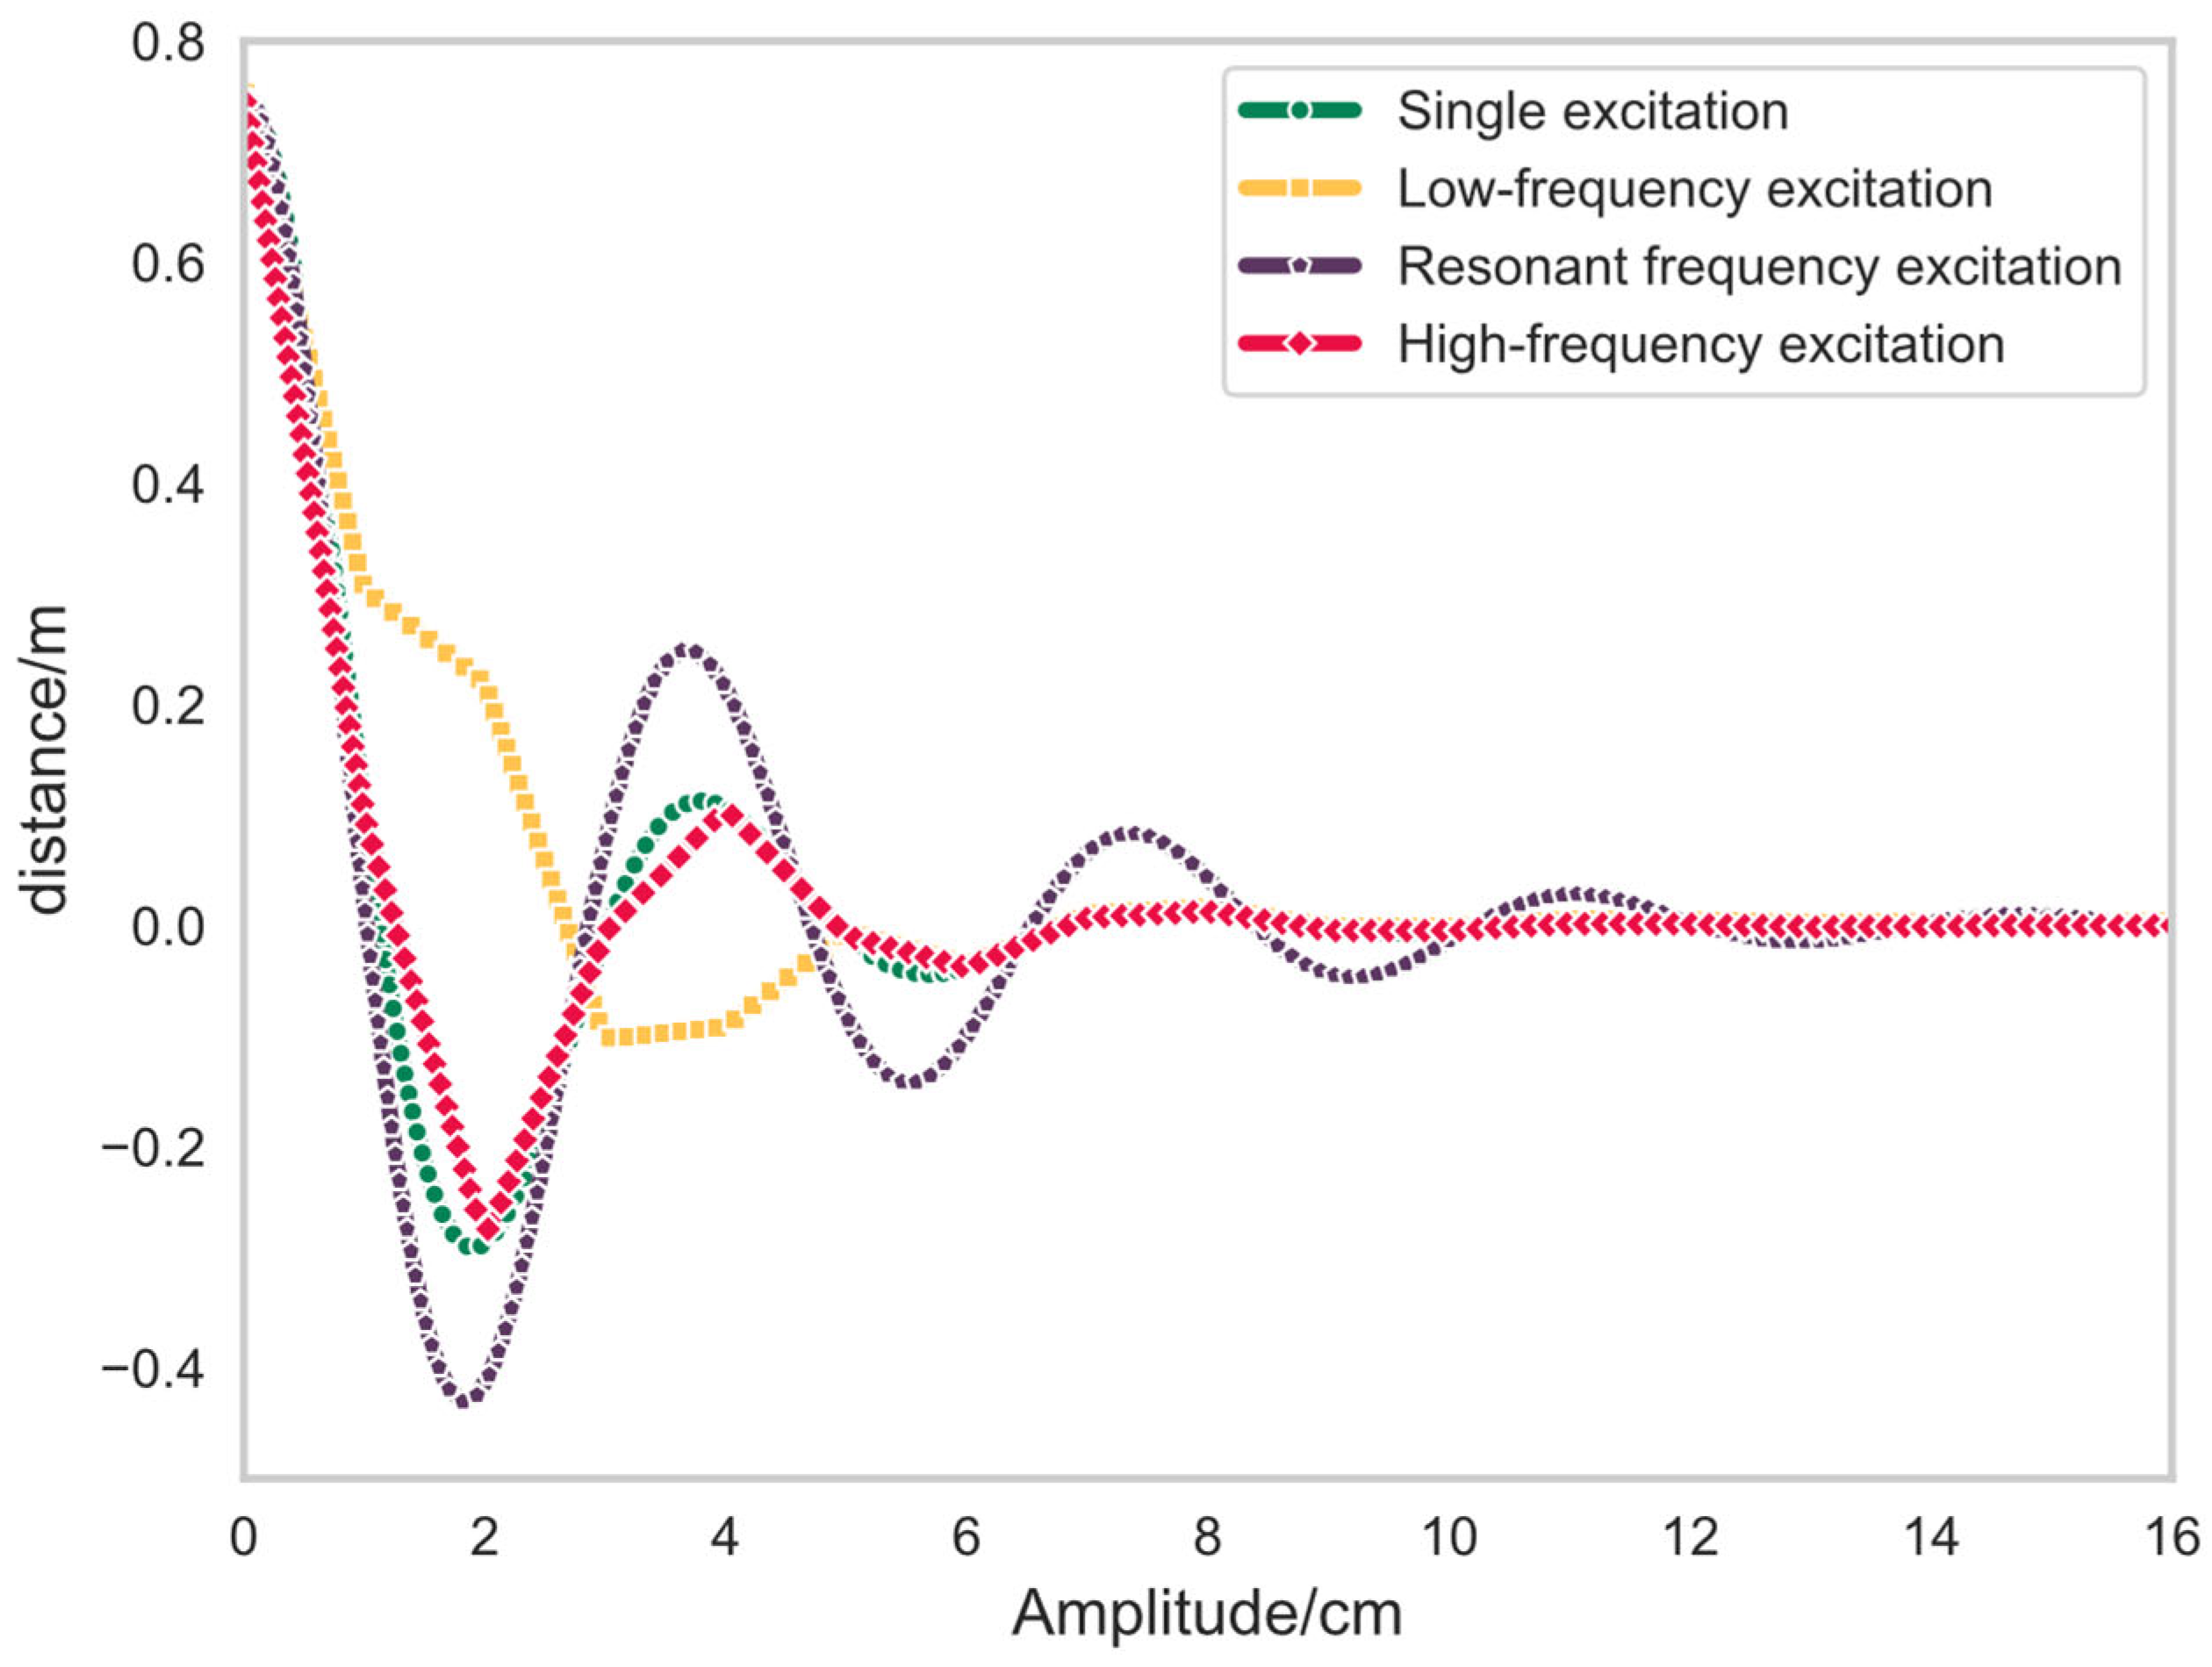
In order to verify the single-knock and different frequency excitation force on the ice-covered wire vibration propagation distance, the use of a vibration module was used to carry out the excitation force experiment, and the results are shown in
Figure 9.
From
Figure 9, it can be clearly observed that when the frequency of the excitation force matches the intrinsic frequency of the wire, it will lead to the resonance phenomenon of the wire, and this resonance phenomenon will significantly enhance the vibration amplitude of the wire, making the vibration signal propagate farther.
3.3. Vibration Frequency Optimization Based on Ice Thickness Detection
The thickness of the ice layer is an important factor affecting the de-icing efficiency, and the energy or force required for de-icing usually grows nonlinearly as the thickness of the ice layer increases. Therefore, the control strategy design of the vibration module needs to take into account the ice thickness detection results of the improved YOLOv7 algorithm to achieve dynamic vibration frequency optimization based on ice thickness.
To accurately determine the natural frequency of the wire, the de-icing device combines the tapping method with the dynamic excitation method [
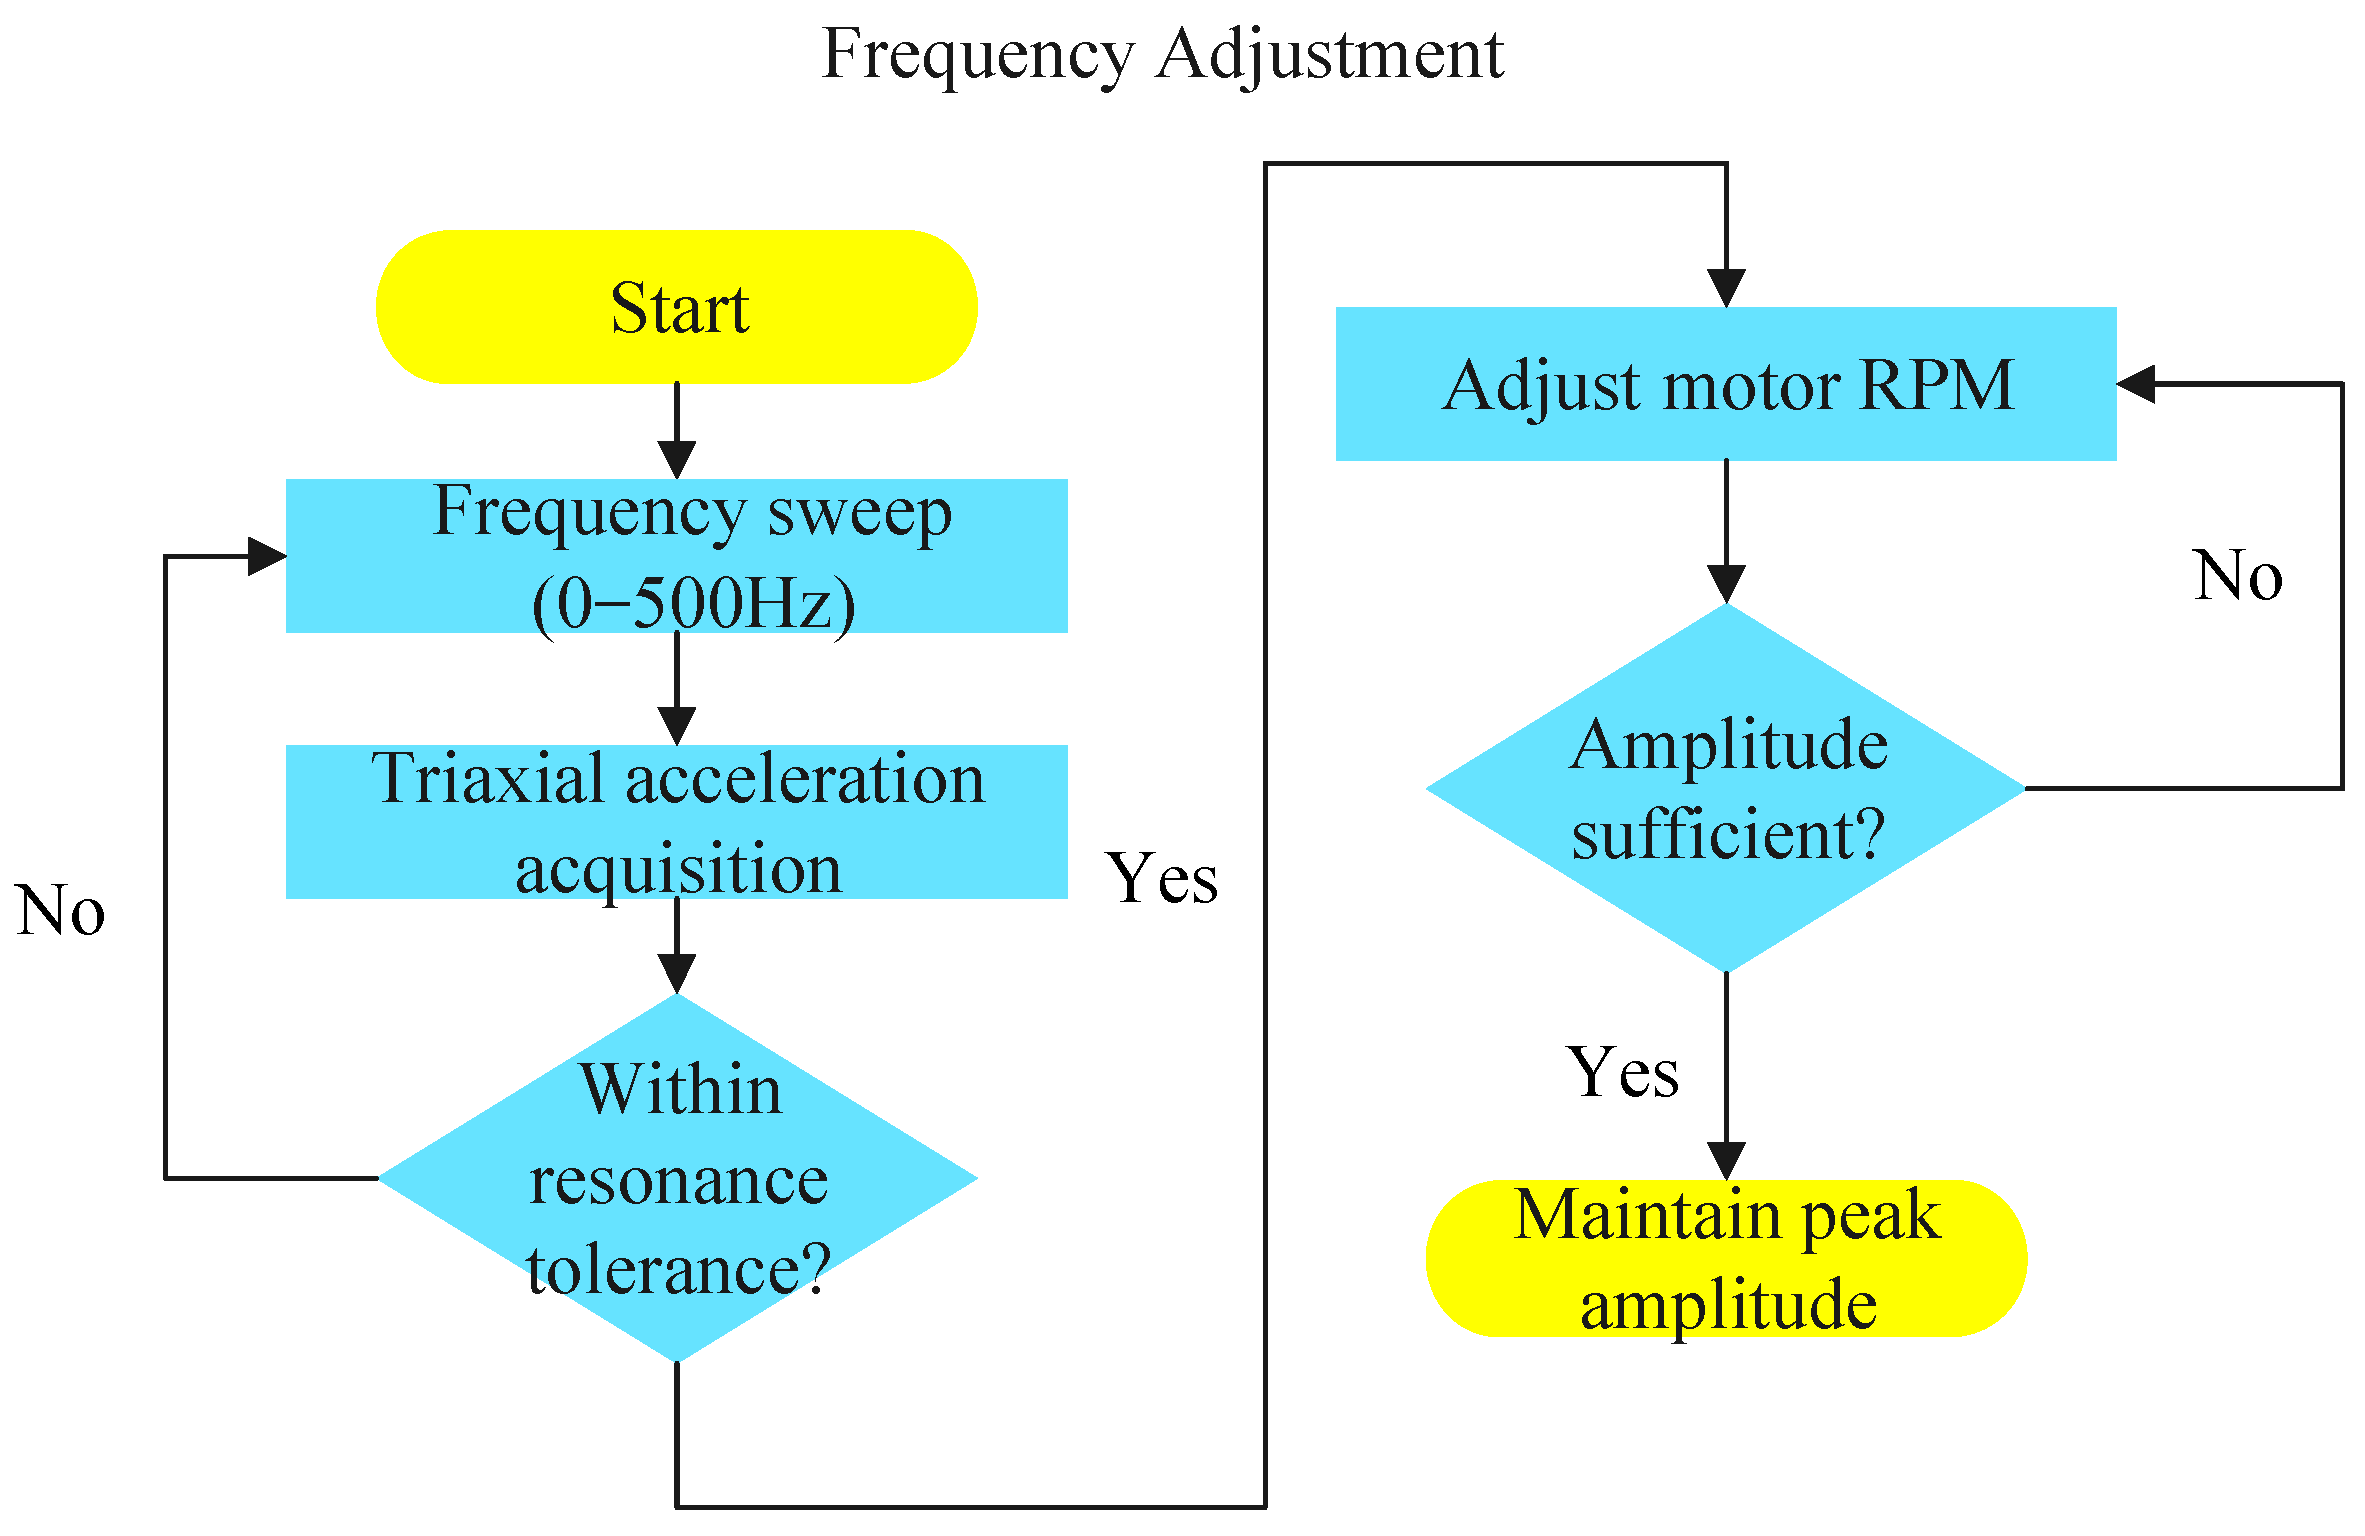
18]. When the improved YOLOv7 algorithm detects an ice thickness exceeding the set threshold (thickness ≥ 5 mm), the robot employs a force hammer to induce free vibration in the wire. The natural frequency is then identified by collecting acceleration data and performing spectral analysis. For areas with mild icing (thickness < 5 mm), the resonance frequency is determined by gradually adjusting the exciter frequency range (0–500 Hz) while monitoring amplitude changes in real time.
The device utilizes a BMI270 six-axis gyroscope to monitor amplitude and combines the amplitude data with the ice state assessment results from the improved YOLOv7 to feed back to the main control unit, which adjusts the PWM duty cycle to match the vibration frequency with the wire’s natural frequency. The frequency adjustment process is illustrated in
Figure 10. Simultaneously, the main control unit receives ice distribution information to dynamically adjust eccentricity. If the ice is concentrated on one side of the wire, the system increases eccentricity to enhance the amplitude of a single side; if the ice is uniformly distributed, a symmetric vibration mode is employed.
3.4. Specific Workflow of Resonance De-Icing Device
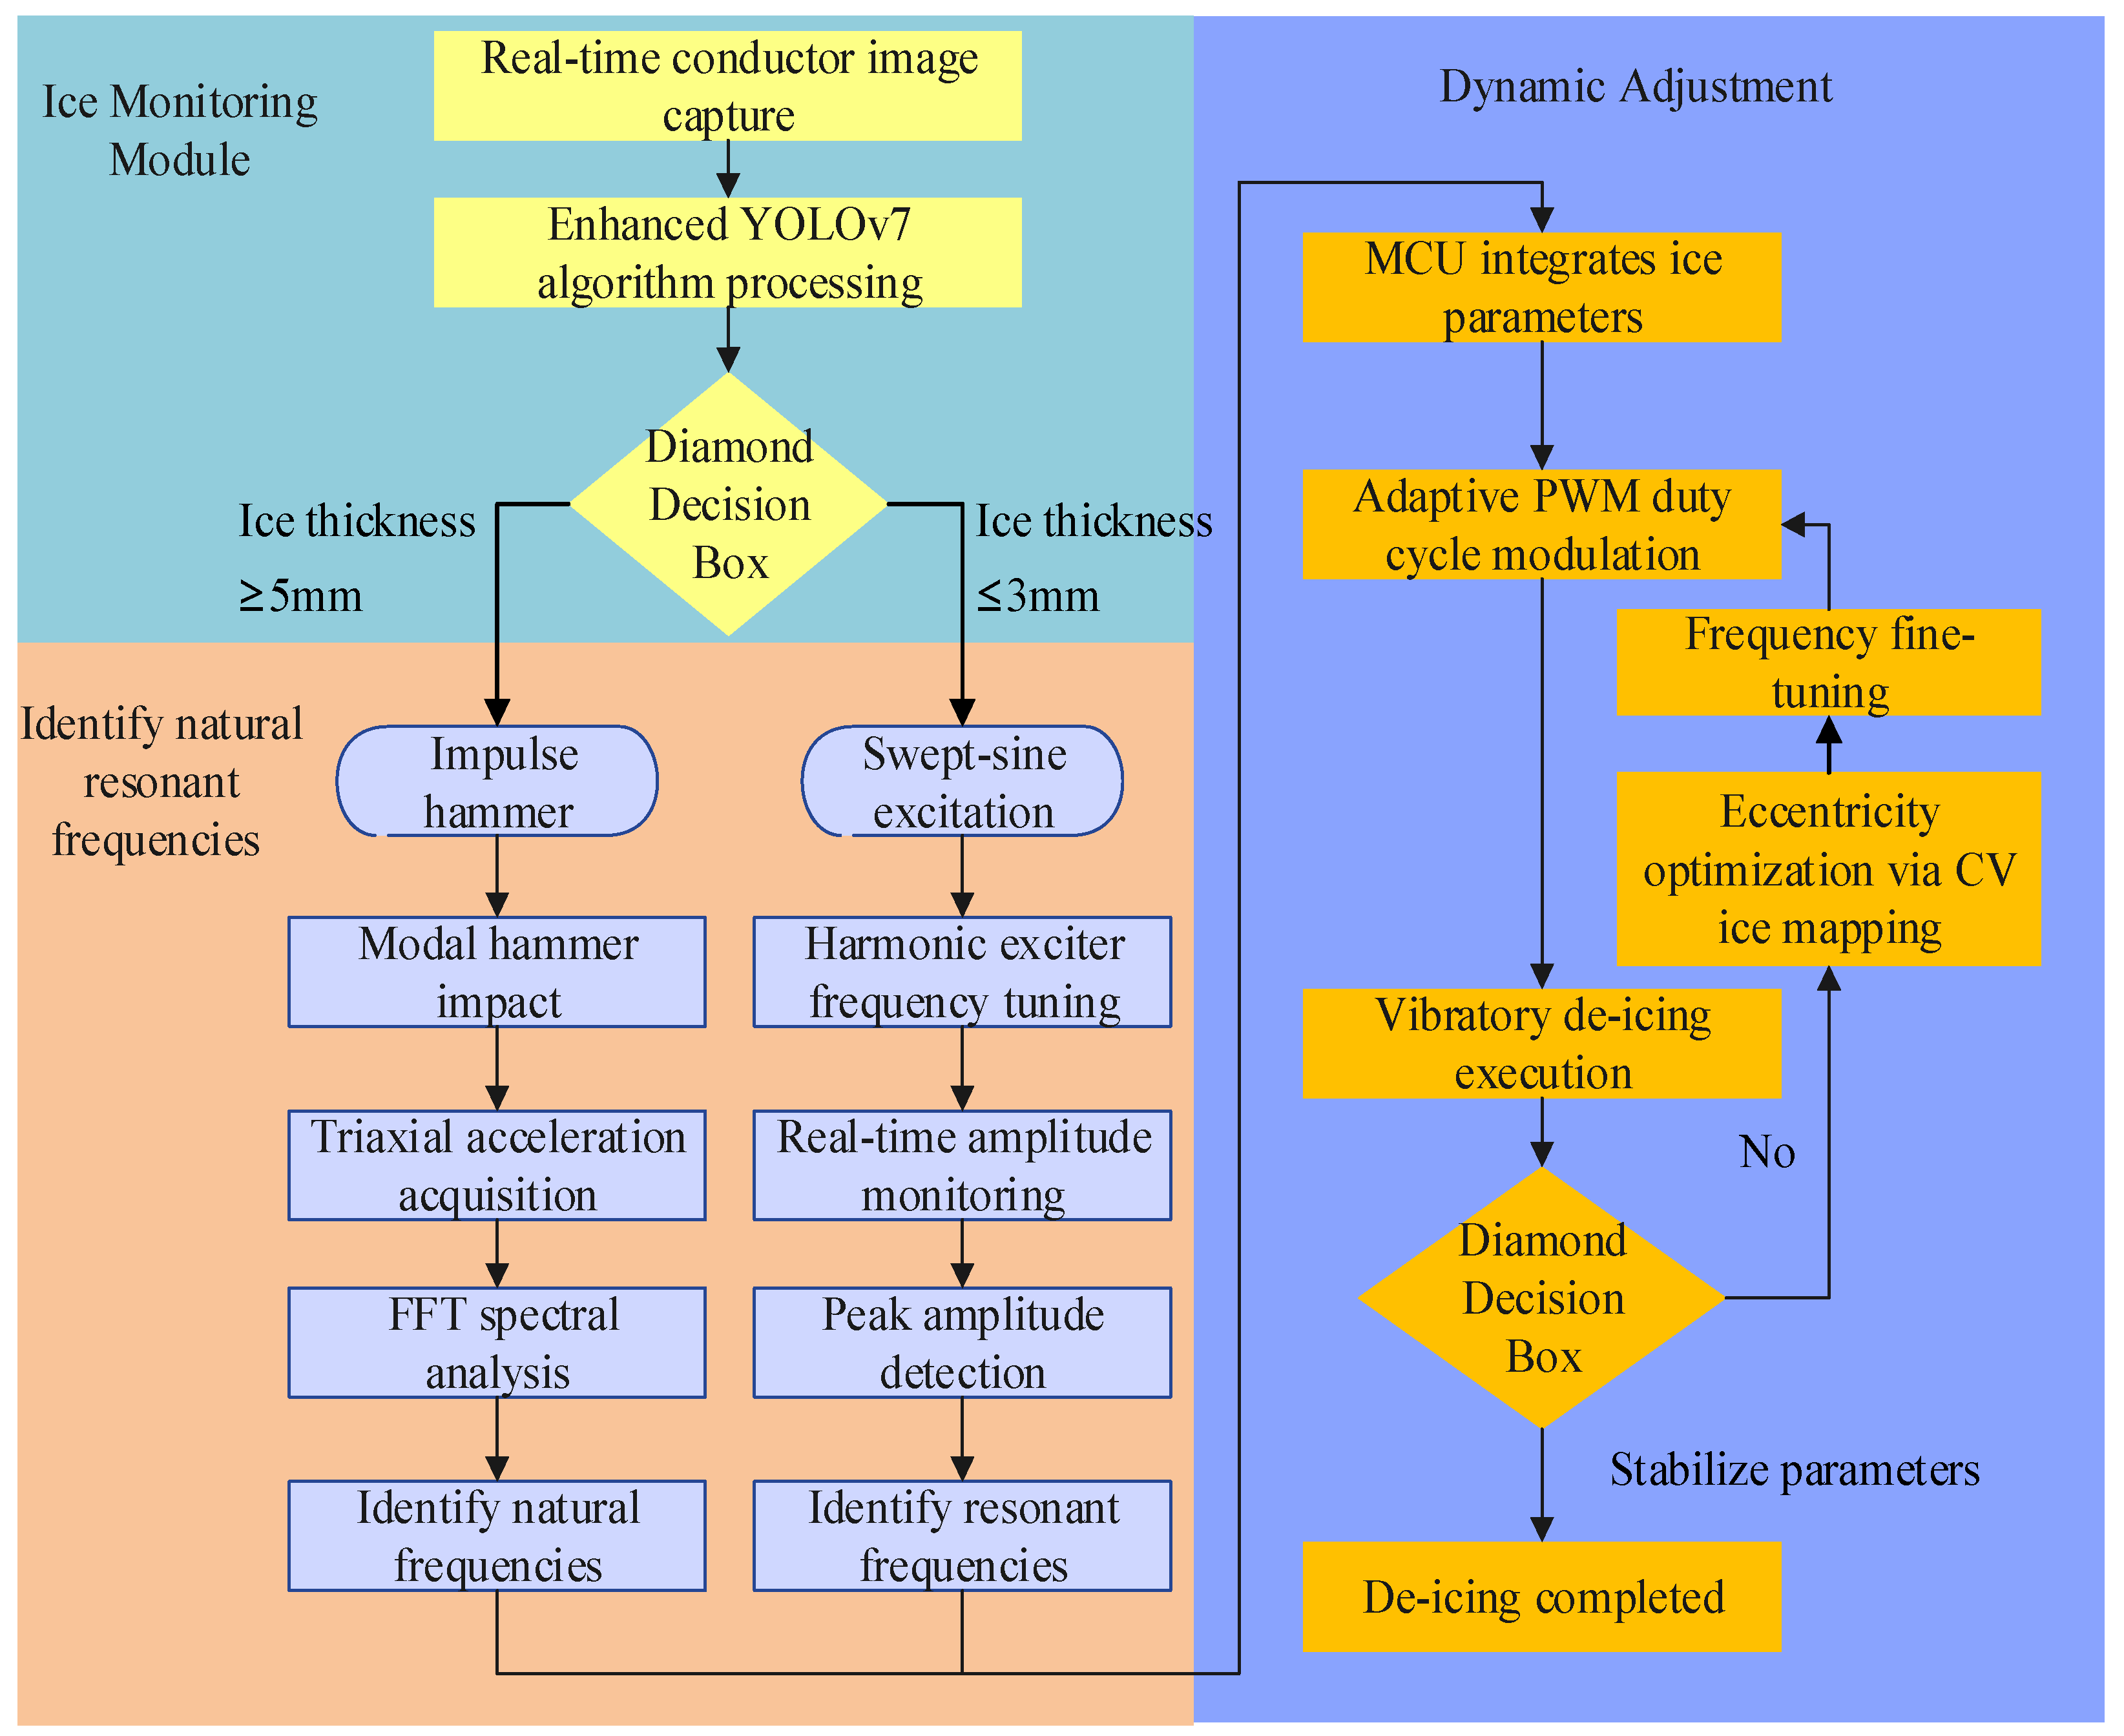
The specific workflow of the resonance de-icing device designed and developed in this study is shown in
Figure 11.
First of all, the ice observation camera monitors the ice-cover condition of the wire in real time, takes pictures of the wire image according to the set time period, and carries out intelligent analysis based on the improved YOLOv7 algorithm to determine the ice-cover state of the wire. The analysis results are transmitted to the vibration module and the host computer through the network in real time.
The main control unit of the vibration module dynamically selects the scanning mode according to the parameters of the ice layer: if the ice thickness is ≥5 mm, it starts the force hammer percussion method to quickly lock the resonant frequency; if the ice thickness is <5 mm, it adopts broadband scanning to reduce energy consumption.
The knocking method or the dynamic excitation method was adopted to determine the wire’s intrinsic frequency or resonance frequency.
Real-time monitoring of the conductor amplitude and ice shedding rate; if the ice residue exceeds the threshold, then the frequency step was refined from 1 Hz to 0.5 Hz or the duration of high-frequency vibration was extended.
The system continuously integrates YOLOv7′s ice status update and gyroscope data to form a closed-loop control system comprising detection, adjustment, execution, and feedback.
5. Discussion
This paper proposes a solution to the problem of ice cover on medium-voltage overhead lines. The solution involves the development of an improved YOLOv7 ice-cover detection algorithm, as well as a resonant de-icing device. The combination of these two elements has resulted in the following outcomes:
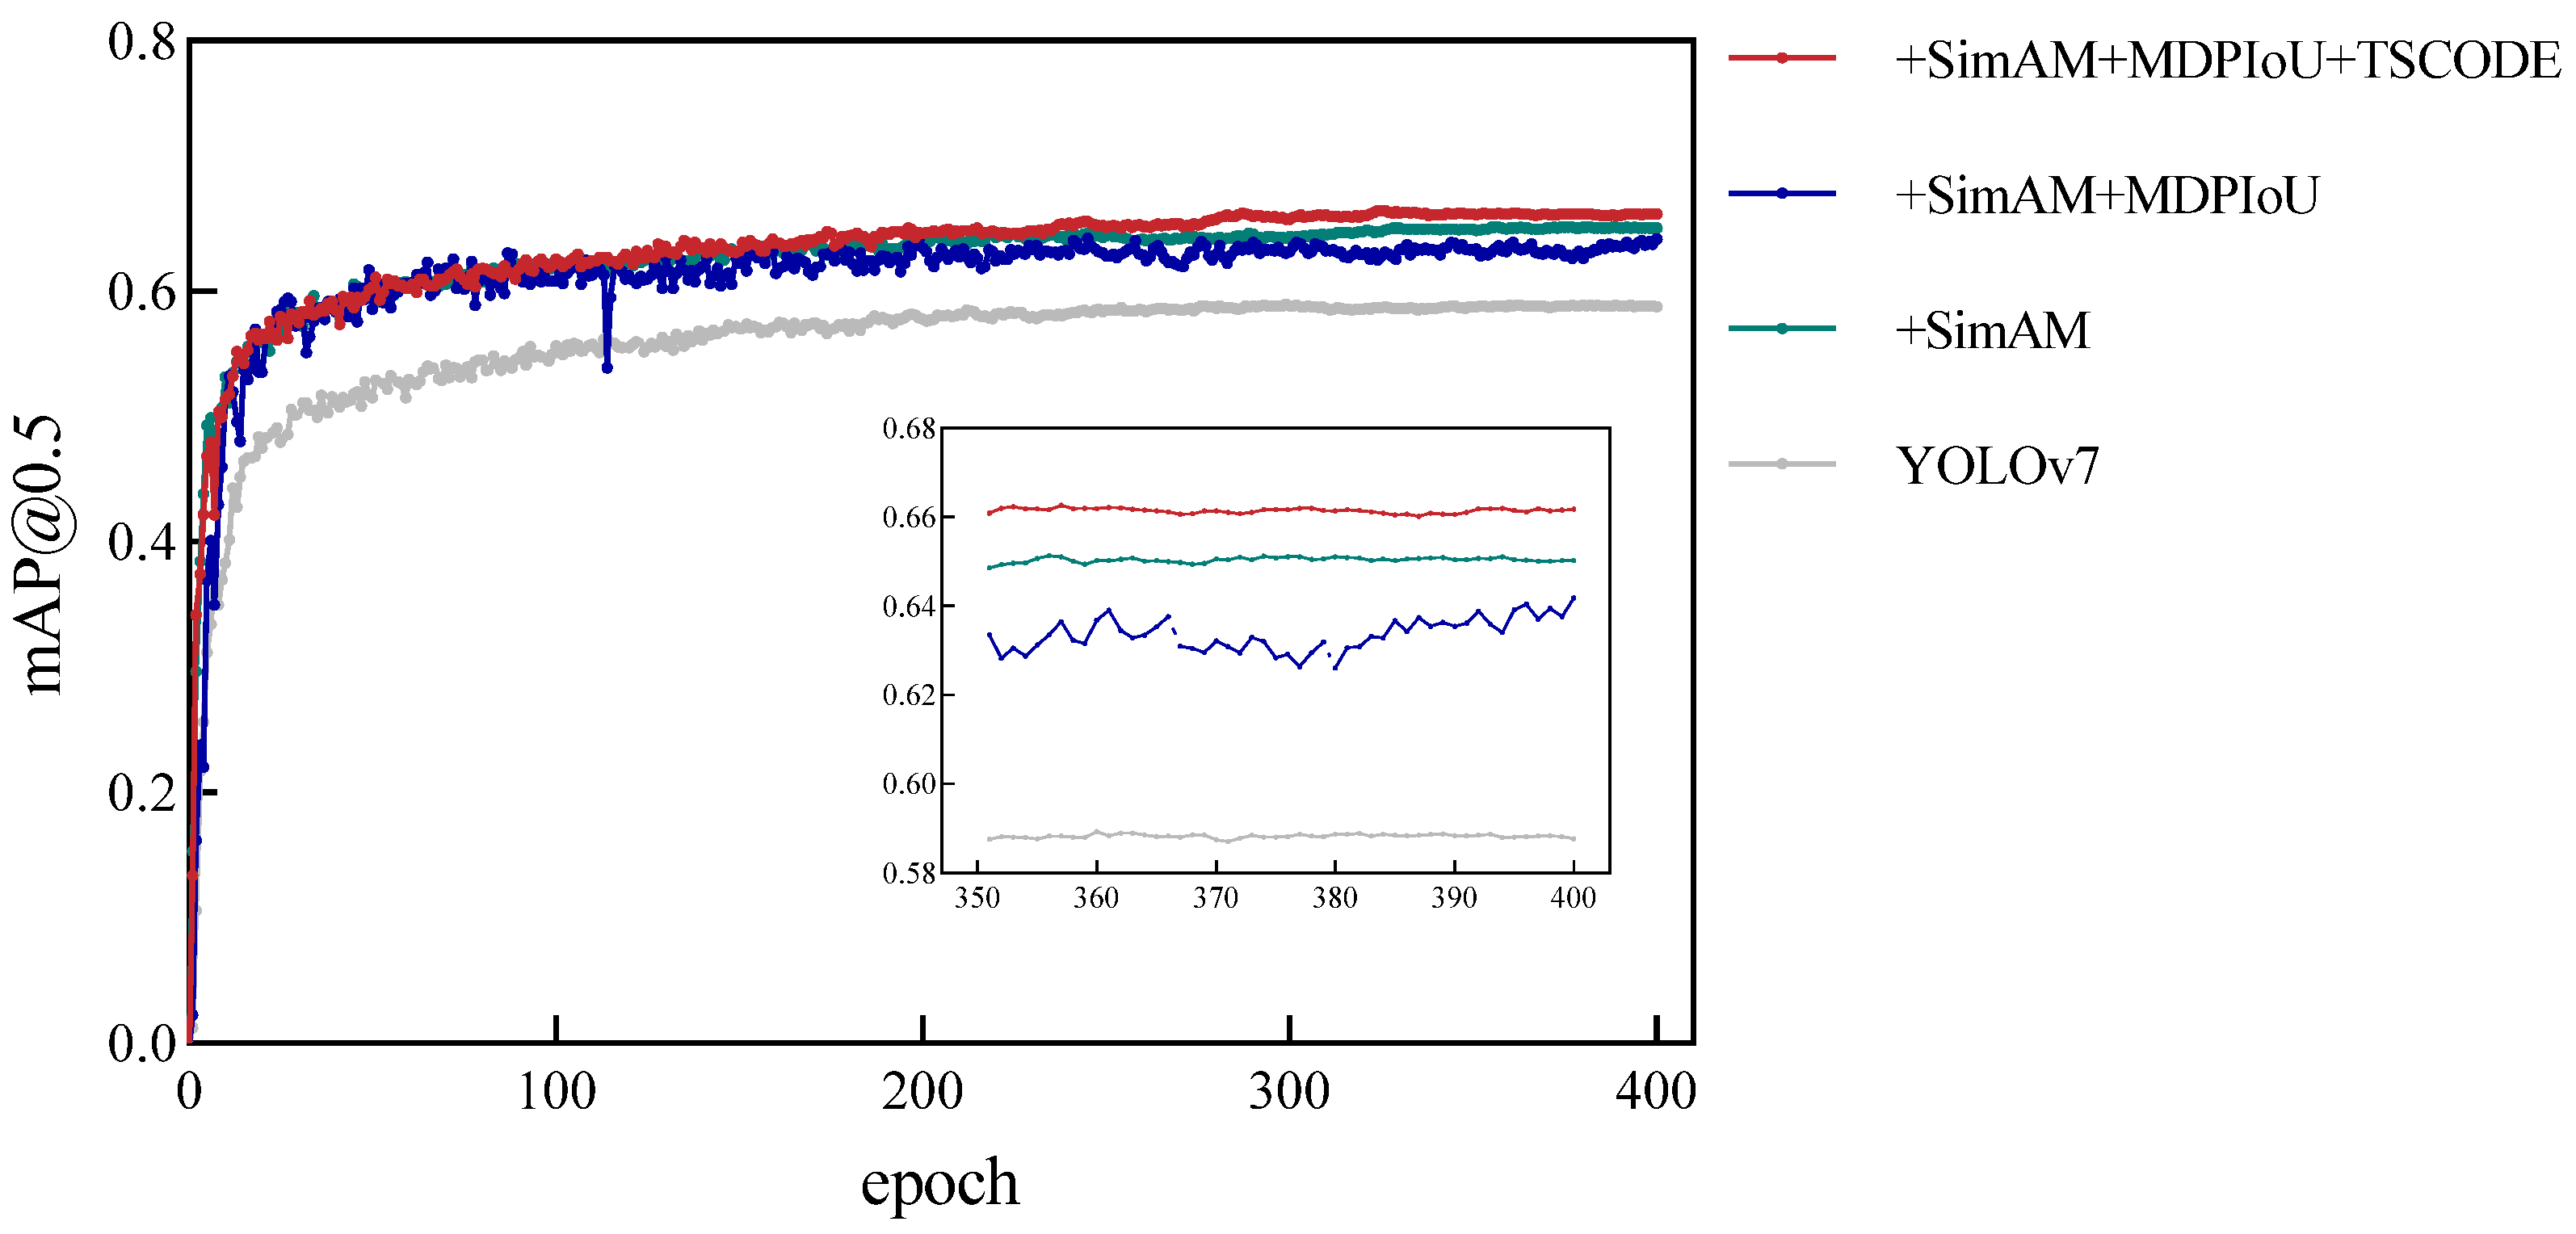
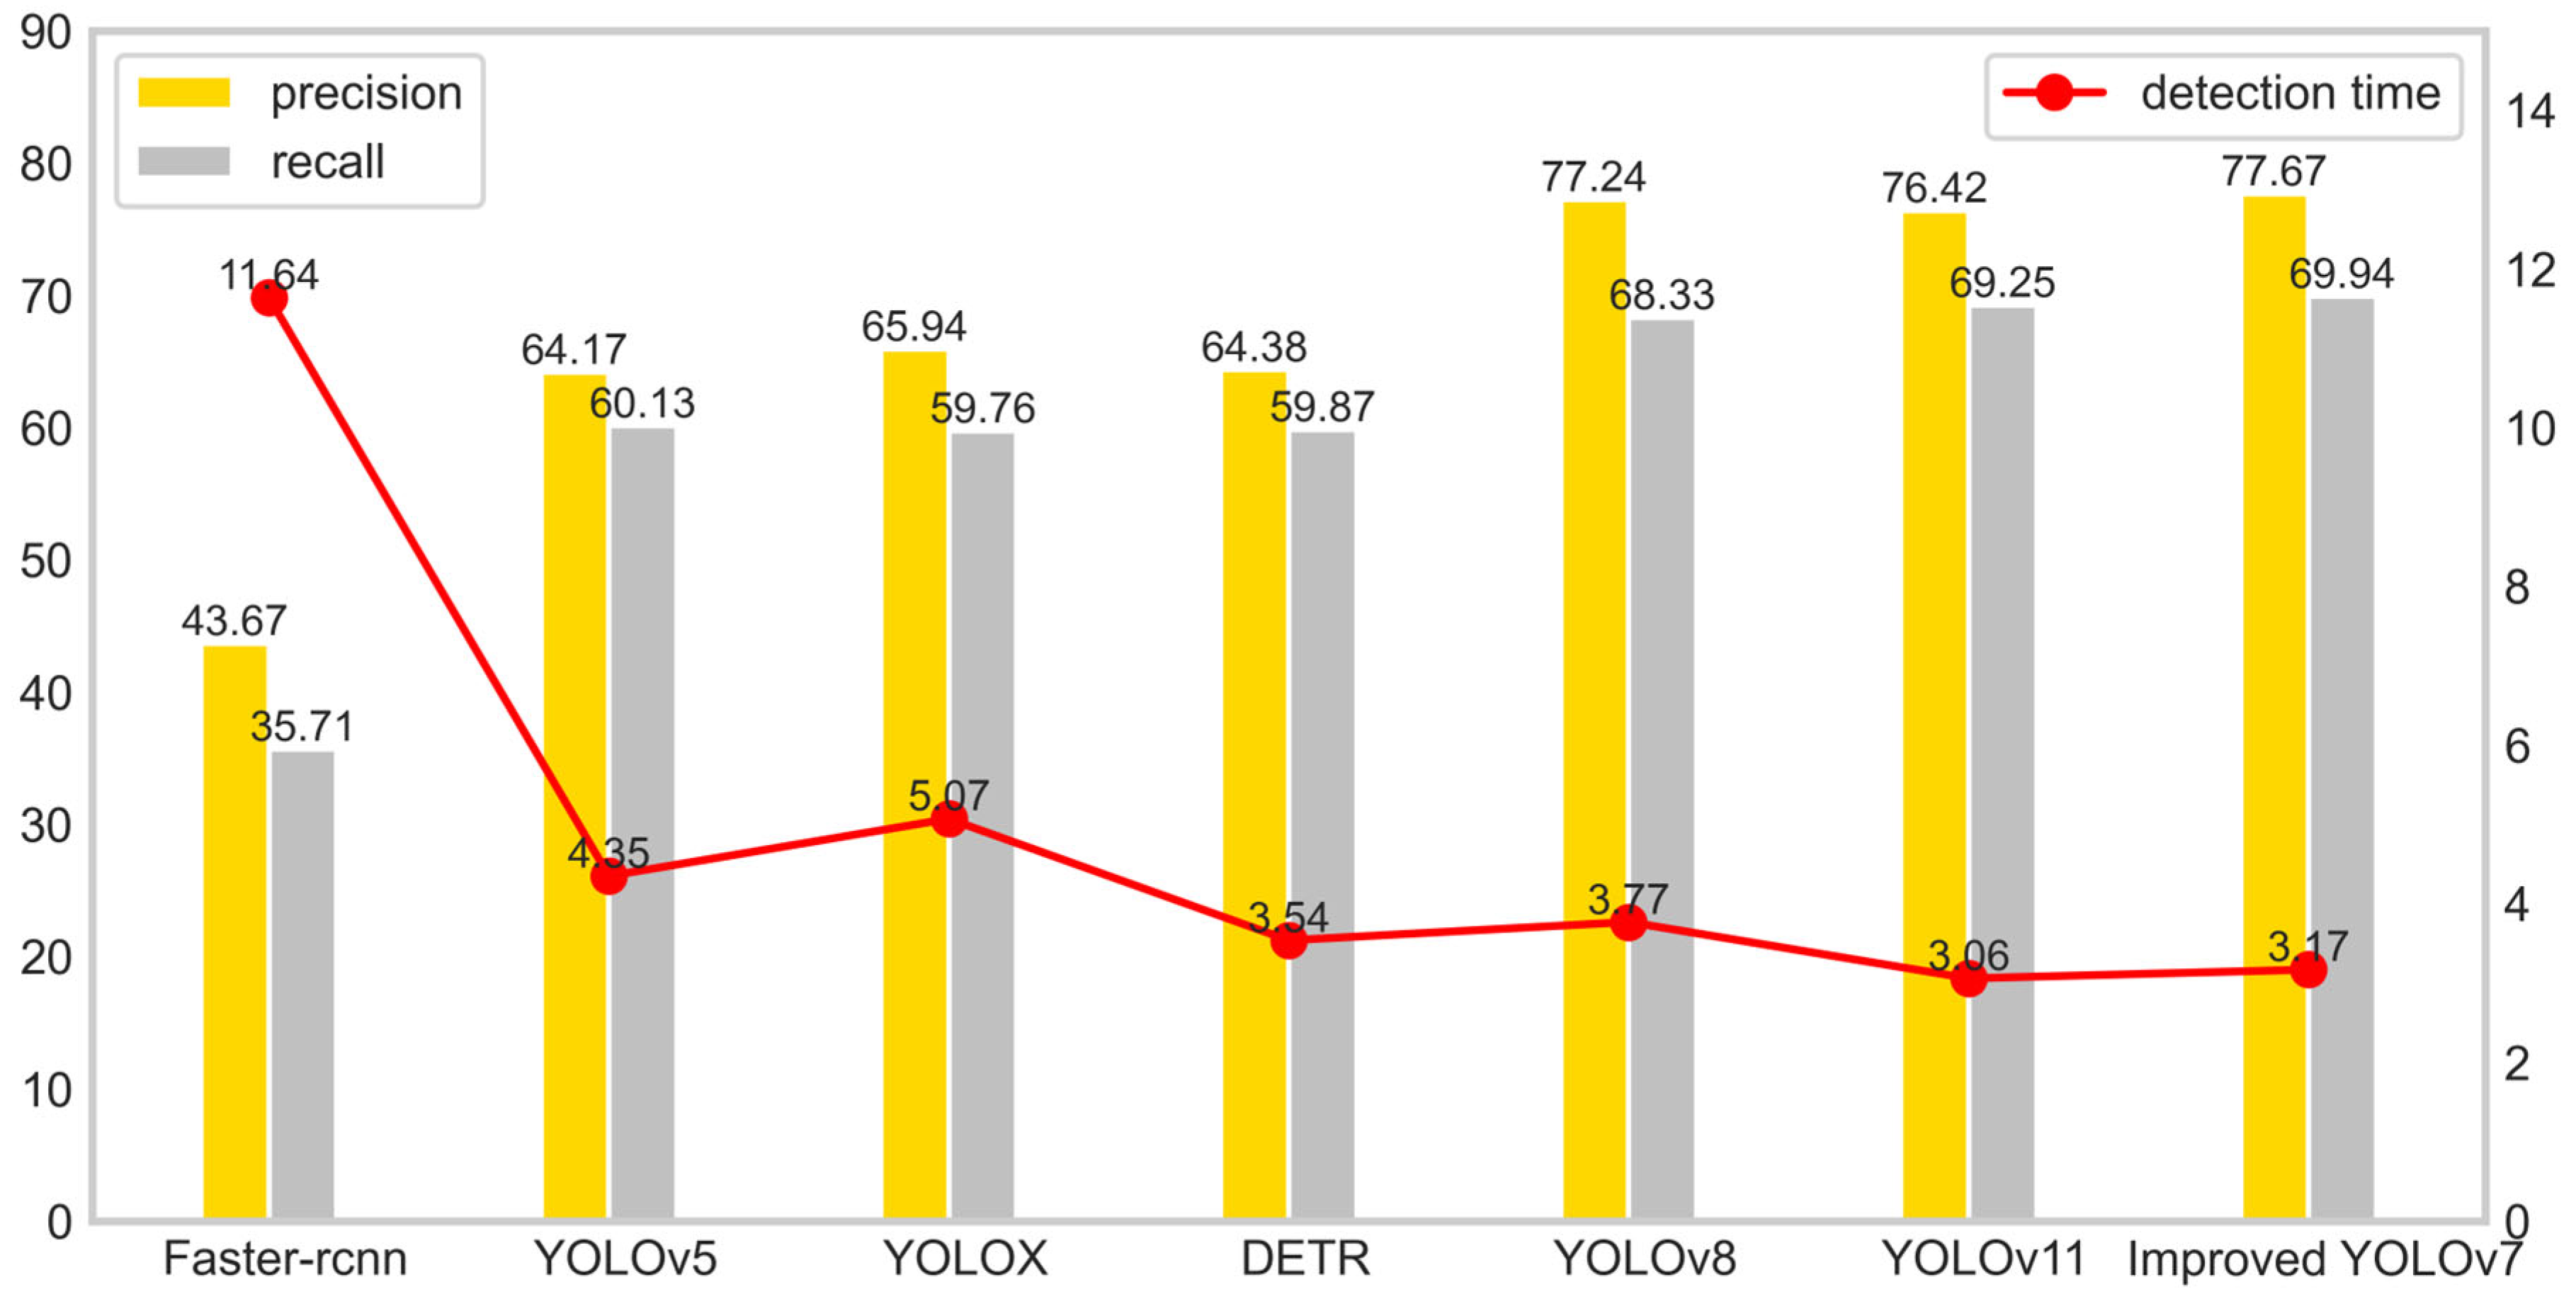
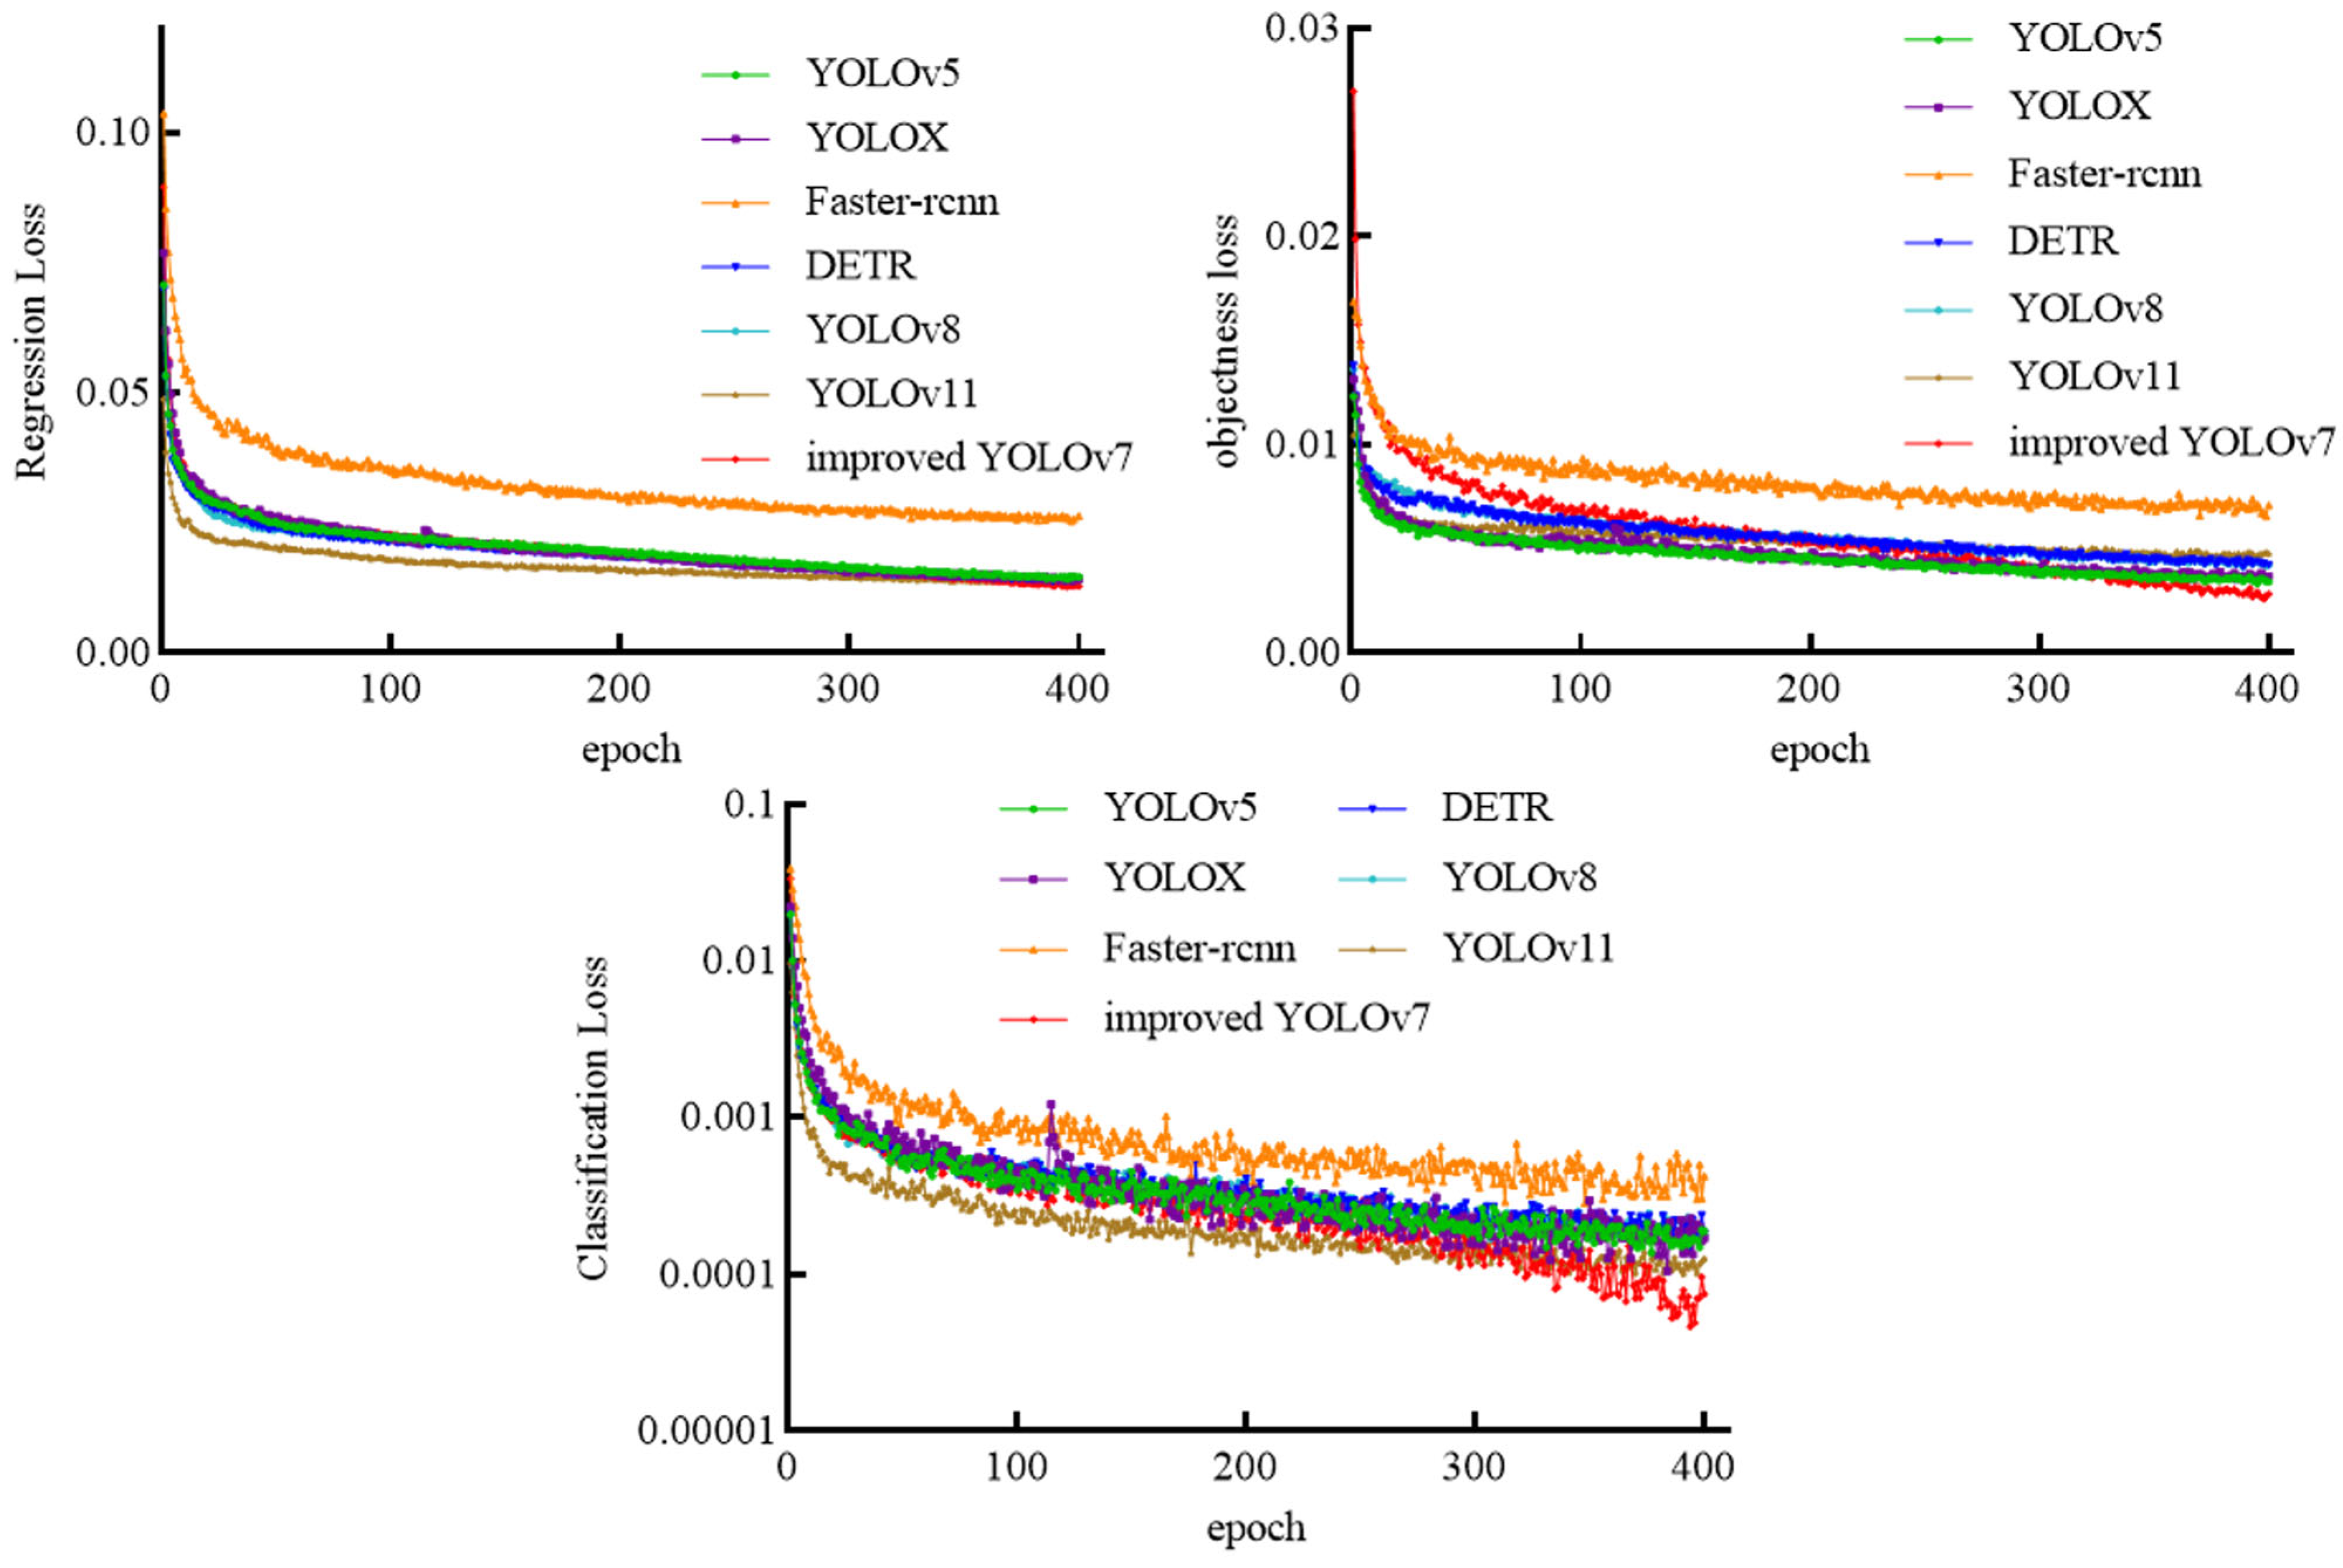
The present study proposes a novel approach to enhancing the capabilities of the YOLOv7 algorithm. The approach involves the integration of the SimAM attention mechanism, the design of an MPDIoU loss function, and the construction of a TSCODE head. The efficacy of these modifications is demonstrated through a series of ablation and comparative experiments. The experimental results substantiate the improved YOLOv7 algorithm’s capacity to expedite the identification process while maintaining a high degree of accuracy;
A mechanical resonance-based de-icing device has been designed, integrating visual detection and dynamic frequency control technology. This enables accurate identification and efficient removal of ice-covered wires through a closed-loop adjustment of excitation frequency and amplitude;
Experiments in the field of engineering have demonstrated the efficacy of a specially engineered resonance de-icing device. This device has been shown to accurately identify over-iced lines and de-ice them, thus providing a valuable reference for engineering applications.
Future research endeavors could enhance the lightweight deployment of the algorithm, ensuring long-term stability in extreme environments, and investigate multi-machine collaborative de-icing strategies to broaden its application scope in complex grid scenarios.
