1. Introduction
The increasing adoption of e-learning platforms, driven by the Fourth Industrial Revolution, has drastically transformed the educational landscape. These platforms—enriched by technologies such as artificial intelligence (AI), virtual reality, and data analytics—provide adaptive and scalable learning environments [
1,
2]. As classrooms shift toward student-centered and data-driven models, detecting and responding to student engagement signals has become essential for improving learning outcomes and retention. The concept of student engagement has deep roots in educational psychology, where it is traditionally linked to motivation, self-regulation, and learner autonomy. Early models [
3,
4] emphasize the interplay of affective, behavioral, and cognitive dimensions. More recently, engagement has become central to learning analytics, where it serves as a proxy for student attention, persistence, and potential risk of dropout [
5]. In online settings, this shift has led to operationalizing engagement through digital traces—such as login frequency, task completion, and interaction time—making engagement both measurable and actionable in real time. Student engagement is consistently recognized as a key predictor of success in digital education. To support engagement effectively, instructors must first be able to classify students based on their behavioral patterns and provide tailored interventions [
6].
While various machine learning approaches have been proposed, limited research has specifically explored the use of unsupervised AI techniques, such as clustering, to dynamically model and predict engagement levels using real-world learning management system (LMS) data. This study addresses that gap by applying K-means clustering, a widely used AI method, to uncover weekly engagement profiles that can support timely and personalized feedback in online learning contexts [
7]. Accurately identifying student engagement patterns in online learning environments remains critically important due to its direct impact on learning outcomes, retention, and the academic success [
8]. Moreover, engagement is malleable, unlike fixed traits such as gender or socioeconomic status [
4,
5]. Understanding when and why engagement dips could allow targeted, real-time support. Most existing research, as highlighted by systematic reviews like [
7], predominantly emphasize final outcomes such as course completion or final grades, thus providing limited actionable insights during the continuous learning process; consequently, there is a pressing need for models capable of capturing week-to-week fluctuations in engagement to enable timely interventions for at-risk learners, a need underscored by studies advocating for more granular, dynamic, and actionable learning analytics. Complicating this task are challenges in defining engagement, collecting fine-grained behavioral data, selecting methods that avoid biases, and, significantly, addressing the impact of boredom, given that engagement is intrinsically linked to the dynamic, unfolding process of learning itself, rather than being solely a reflection of a learner’s initial intentions or static attributes [
9,
10]. Furthermore, it is a multifaceted psychological construct shaped by reciprocal factors that affect academic performance comprising both affective (emotional and feeling-based) and cognitive (intellectual and thought-based) dimensions. Specifically, it includes elements such as interest, effort, and absorption [
11].
This study addresses these limitations by proposing a clustering-based methodology using K-means on real-world student activity data from a learning management system (LMS). The goal is to profile students weekly into distinct engagement groups—low, moderate, and high—and validate those profiles against predefined engagement levels. By incorporating advanced feature engineering, the approach reflects both interaction (e.g., quiz attempts, forum posts) and effort (e.g., time spent) dimensions of engagement. It contributes by developing and validating a robust, unsupervised method to detect and label weekly engagement patterns. The model clusters students based on activity logs and assesses the validity of those clusters both statistically and through external comparisons with pre-labeled engagement levels. The research is driven by the following questions:
RQ1: Within the context of LMS, what is the optimal number of clusters that effectively partitions students into distinct groups based on the multivariate analysis of their online activity data?
RQ2: To what extent do the student engagement profiles identified through cluster analysis align with pre-existing classifications of students into “Low Engagement,” “Medium Engagement,” and “High Engagement” levels?
RQ3: What is the relationship between a student’s weekly engagement level and their learning progress as measured by their exam performance?
By providing answers to these questions, we hope to give educators access to timely, data-driven resources for identifying disengaged pupils and enhancing instructional strategies.
The remainder of this paper is organized as follows:
Section 2 reviews related work on student engagement in online learning and the application of machine learning techniques for modeling learners’ engagement.
Section 3 outlines the methodology, including clustering and validation techniques.
Section 4 presents the results of the clustering analysis.
Section 5 provides a discussion of the findings, connects them to prior research, and outlines potential future enhancements. Finally,
Section 6 concludes the paper by summarizing the main contributions and emphasizing the practical value of unsupervised techniques in educational data analysis.
2. Related Work
Student engagement is generally defined as the level of interest and effort a student demonstrates through weekly interaction with content and task completion [
12]. This study adopts a behaviorally grounded definition, consistent with prior research [
13,
14,
15]. We emphasize cognitive and behavioral engagement, as these are observable through platform data, along with interaction-based engagement, which positively influences learning outcomes [
16].
Student engagement in e-learning is a multidimensional construct that refers to the degree of attention, curiosity, and involvement students exhibit while participating in learning activities online [
12]. It reflects not only the learner’s motivation and interest but also their emotional and cognitive investment in the course content. Research indicates that higher engagement is associated with improved knowledge retention, performance, and satisfaction [
17]. Effective engagement results in deeper learning and more productive educational experiences.
In e-learning environments, engagement is often inferred from digital footprints such as login frequency, task completion rates, time on task, and interaction with course materials. These indicators allow educators and system designers to detect patterns of disengagement or behavioral shifts over time [
18,
19]. Modeling and predicting engagement using such data has become increasingly viable due to the integration of learning analytics and machine learning (ML) techniques.
2.1. Machine Learning for Engagement Modeling
Machine learning enables the development of intelligent systems that can adapt to learners’ needs by modeling their behaviors, preferences, and performance. Personalized learning strategies depend heavily on accurate learner modeling, which includes dynamic profiling of student progress, challenges, and engagement states [
20,
21,
22]. For example, [
23] emphasizes that adaptive systems must account for individualized learning trajectories, leveraging behavioral data such as login frequency or time spent on quizzes to trigger timely instructional responses.
One of the primary benefits of ML-based engagement modeling is the ability to intervene early. As [
24,
25] highlight, early detection of disengagement enables targeted interventions ranging from automated feedback and nudges to personalized resources or even referrals to support services.
Student engagement in online learning has been examined through various lenses, including course design, interaction quality, and learner behavior. Recent studies adopt diverse analytical techniques and data sources to capture engagement dynamics and improve online learning outcomes. This section analyzes the dominant research directions in student engagement and identifies key limitations addressed by the present study.
2.2. Video and Sensor-Based Engagement Detection
Most existing research in engagement prediction predominantly relies on supervised learning, necessitating labeled datasets for model training. Common techniques span cascaded neural networks like CNNs, L2CS-Net, and RepVGG, which interpret visual engagement cues [
26]. Several studies utilize multimodal data—especially video and sensor inputs—to infer engagement levels. For example, [
26,
27,
28,
29] apply techniques such as gaze estimation, facial expression analysis, and action recognition. These approaches typically rely on deep learning models like CNNs and RNNs to handle high-dimensional video data. Although they demonstrate reasonable predictive accuracy, their generalizability is often constrained by small sample sizes, dataset biases, and platform-specific features [
28,
29]. These supervised models frequently face practical limitations, including a heavy reliance on manually labeled data, high computational demands [
30], and a limited generality to the dynamic and unseen data, such as week-to-week fluctuations in learner behavior, consequently reducing their real-world adaptability [
31].
2.3. Behavioral Analysis and Traditional Classroom Approaches
Some studies rely on manual coding and observation to assess engagement. [
32] used the COPUS protocol in STEM classrooms to classify engagement behaviors such as note-taking and discussion participation. While detailed and context-rich, these methods are labor-intensive and not easily scalable to large online cohorts. [
33] integrated qualitative and quantitative data from university courses, but their domain-specific approach limits cross-context applicability.
A more scalable approach is evident in studies that analyze LMS trace data. [
34] used access logs and forum data with logistic regression to predict engagement. [
35] applied statistical models (ANOVA, GLMs, Poisson models) to assess LMS tool usage patterns and engagement. These approaches offer automated, data-driven insight into behavior but are typically focused on static or end-of-term metrics rather than dynamic, weekly engagement profiles. These support insights into group-level behavior and tool usage, but often lack the granularity or adaptiveness needed for weekly, personalized interventions.
2.4. Self-Report and Perception-Based Studies
Other researchers examined engagement via self-report instruments. Ref. [
36] applied structural equation modeling to survey responses in online courses, while ref. [
37] used partial least squares modeling to analyze student perceptions in MOOCs. While valuable for capturing subjective experience, these methods are prone to bias and lack real-time behavioral resolution. Ref. [
29] attempted to integrate self-report with system logs but still relied heavily on predefined labels.
In contrast to supervised methods, unsupervised learning techniques, especially clustering, do not require labeled data and can uncover meaningful engagement profiles directly from student behavior. Clustering groups students based on similarities in interaction patterns, such as video views, forum activity, and assignment completion, revealing latent behavioral types without instructor bias.
Recent research highlights the utility of unsupervised learning in this space. Ref. [
38] used LMS interaction data and cluster analysis to model students’ progress levels in their learning and identify their behavior patterns. Similarly, ref. [
39] applied unsupervised methods to identify behavioral indicators within LMS data that strongly correlate with academic success. These studies demonstrated how clustering can effectively differentiate student types and engagement levels without relying on subjective labels. Ref. [
40] further emphasize that clustering is a core strategy in educational data mining, particularly for learner profiling and engagement modeling at scale.
2.5. Research Gap and Contribution
Despite the rich body of research on student engagement, existing methods suffer from several limitations: heavy reliance on self-reporting, static observation-based classification, and limited use of LMS behavioral data in time-sensitive ways. More importantly, most studies lack unsupervised machine learning techniques, which are well suited for revealing latent behavioral patterns without requiring labeled data [
39].
This study addresses these gaps by applying K-means clustering to actual LMS activity logs to detect weekly engagement profiles. Unlike prior work, it focuses on temporal dynamics of engagement and does not require pre-labeled training data, making it scalable, interpretable, and actionable for real-time educational interventions.
Table A1 in
Appendix A presents a comprehensive comparison of key studies focused on students’ engagement detection in digital learning environments. It outlines the platforms used, dataset characteristics, behavioral indicators of engagement, applied analytical techniques, evaluation metrics, and reported limitations. The table reveals that most existing research relies on supervised learning models, self-reported data, or static observational methods. It also highlights limited generalizability, domain-specific constraints, and a lack of focus on temporal engagement patterns. This comparison helps situate the current study within the broader research landscape and emphasizes the need for more dynamic, data-driven approaches such as unsupervised clustering of weekly LMS activity.
3. Methodology
This study applies a structured methodology for identifying student engagement patterns in e-learning environments using unsupervised clustering and external validation. Defining student interaction scopes within LMS environments is critical for assessing engagement accurately [
41,
42]. Accordingly, this research characterizes the behavioral, social, and cognitive dimensions of engagement as reflected in students’ LMS activity patterns [
43].
The dataset comprises 127 student records with 44 features that describe interactions with various LMS activities over a 13-week instructional design course offered by the Department of Educational Technology at Mansoura University, Mansoura, Egypt (EG). The methodology, summarized in
Figure 1, includes data cleaning, feature engineering, unsupervised clustering (K-means), and both internal and external validation to ensure robustness and interpretability of the identified engagement profiles. While various clustering methods offer unique advantages, the decision to use K-means clustering for segmenting student learning behaviors was based on its suitability for the characteristics of our dataset and our research goals. Drawing from a broader understanding of clustering methodologies [
44], we considered the strengths and limitations of alternative approaches. Density-based algorithms, such as DBSCAN, excel at identifying clusters with irregular shapes and detecting outliers; however, they can struggle with clusters of varying densities and encounter difficulties in high-dimensional spaces, which is typical of our 13 weekly activity features. Hierarchical clustering provides a useful dendrogram for examining nested relationships and is well suited for data with inherent hierarchical structures. Similarly, distribution-based clustering, such as Gaussian mixture models (GMMs), provides advanced probabilistic assignments and flexibility with elliptical cluster shapes. However, GMMs require assumptions about the underlying data distributions, and their increased computational complexity makes them less efficient for initial exploration compared to K-means, especially when working with the scale of educational interaction data.
This study was conducted in compliance with the ethical guidelines of the host institution. All data used in the analysis were fully anonymized and de-identified prior to access by the researchers. No personally identifiable information (PII) was collected, stored, or processed at any stage of the research.
3.1. Feature Engineering and Clustering
In online learning environments, student engagement is not static; it fluctuates over time. To capture these dynamics, we segmented the dataset into weekly intervals, where each learner’s behavior was tracked and represented across multiple weeks. Feature engineering was applied to create and refine relevant indicators of student behavior. The raw interaction data from the online learning platform underwent preprocessing to ensure data quality and consistency. This included handling missing values, standardizing formats, and transforming event logs into quantifiable metrics suitable for analysis. A comprehensive set of features was then derived to reflect different dimensions of student engagement, including the frequency and sequence of interactions such as assignment submissions, discussion forum participation, and electronic book viewing. Given the inherent sparsity and high dimensionality of educational interaction data, feature selection and scaling were carefully applied to mitigate the potential influence of zero-value dominance [
40]. These steps ensured that the constructed features effectively captured behavioral patterns while reducing distortion in clustering results.
To segment students based on their online learning patterns, K-means clustering was employed. The choice of K-means, while acknowledging its assumption of spherical clusters and sensitivity to initial centroids, was driven by its computational efficiency, scalability for our dataset size, and interpretability of cluster centroids, which allowed for straightforward characterization of learning profiles.
We utilized Euclidean distance as our similarity metric. While cosine similarity is often preferred for high-dimensional sparse data to measure directional similarity, Euclidean distance was chosen here because the magnitude of difference in activity levels (i.e., the absolute number of interactions) was considered crucial for distinguishing distinct behavioral groups, not just the pattern of presence/absence. The potential clustering bias caused by zero-value dominance was addressed through the aforementioned feature engineering and normalization steps, aiming to transform raw counts into more robust indicators of engagement.
Validation of the clustering results was conducted using two complementary strategies to ensure robustness and meaningfulness. Internal validation employed established cluster performance metrics such as the silhouette score and Davies–Bouldin index to assess compactness and separation, providing quantitative evidence of cluster quality. For external validation, we benchmarked the generated clusters against pre-labeled engagement levels. These external labels were derived from a weighted scoring method, independently defined to reflect overall student engagement, allowing us to assess how well our unsupervised clusters aligned with an expert-driven definition of engagement. This dual validation approach aimed to confirm both the statistical integrity and practical relevance of the identified student segments
3.2. Temporal Dynamics Analysis of Engagement
To investigate how student engagement evolves over time, a temporal dynamics analysis was conducted across the 13-week course duration. Specifically, weekly activity data were encoded as a series of binary vectors representing the presence or absence of student interactions across various learning activities over each of the 13 instructional weeks. The specific behavioral features used in this temporal encoding are described in detail in
Section 4.1. After initially clustering students into engagement groups (high, moderate, low) based on weekly behavioral features, these clusters were monitored over time to evaluate changes in individual engagement levels.
For each week, students were assigned to one of the three engagement clusters using the trained unsupervised model. This resulted in a time series of cluster labels for each student, capturing their week-by-week engagement trajectory. The temporal analysis involved calculating the number of transitions in cluster membership per student over the 13 weeks and identifying patterns of movement between clusters. This temporal analysis highlights the dynamic nature of learner behavior and supports the integration of time-aware strategies in both modeling and intervention design.
To determine the optimal cluster count (RQ1), both two- and three-cluster models were tested. While literature often dichotomizes engagement (engaged vs. disengaged) [
43], we aimed to explore whether a finer granularity could yield more actionable insights. We validated clustering outputs using
t-tests to assess statistical distinctiveness and calculated the silhouette coefficient for each model, as defined by [
45],
where
a(
i) is the mean intra-cluster distance, and
b(
i) is the mean nearest-cluster distance. This metric quantifies how well a data point is clustered, offering an overall measure of cluster cohesion and separation.
To answer RQ2, we introduced a classification method based on online activity frequency and duration. Engagement levels: high (HE), medium (ME), and low (LE), were assigned using percentile thresholds (bottom 25%, middle 50%, top 25%) derived from a weighted scoring system. Each activity was assigned a weight based on its frequency across the 13-week semester. These scores were aggregated per student, enabling engagement classification before clustering. This facilitated a meaningful comparison with clustering results for external validation.
To answer RQ3, we employed ordinal logistic regression using the polr () function from the MASS package in R. The outcome variable, engagement level, was treated as an ordered categorical factor with three levels: low, medium, and high. A composite performance score was created by averaging key academic indicators, including midterm scores, two quizzes, and assignment scores. This composite metric was used as the sole predictor in the regression model. This approach enabled us to estimate the probability of a student belonging to each engagement level as a function of their overall academic performance.
4. Results
4.1. Data Overview and Preprocessing
The dataset captures detailed engagement logs from a university-level course designed to deliver personalized, adaptive learning experiences. It comprises behavioral interaction logs from 127 students, spanning 13 weeks, with 44 weekly features per student, resulting in a total of 72,644 data points categorized as follows:
Demographics: Gender and academic department;
Interaction Data: Weekly engagement across LMS-based activities (e.g., electronic books, discussions, lectures, quizzes);
Academic Performance: Quiz scores and time spent on assessments.
Academic performance variables were excluded intentionally to detect early engagement without conflating it with final outcomes.
To ensure data integrity, standard preprocessing was conducted for handling missing values, removing duplicates, and resolving inconsistencies. After initial cleaning (handling missing values, duplicates, and anomalies), categorical features were numerically encoded [
46].
One-hot encoding for activity data to prevent ordinal bias;
Label encoding for engagement levels (high, medium, low).
In preparation for clustering, all continuous features—such as time spent—were standardized to zero mean and unit variance. This step is essential to mitigate the well-known sensitivity of K-means to feature scaling, as distance-based algorithms like K-means can be disproportionately influenced by features with larger numerical ranges [
47].
Recent findings confirm that neglecting feature scaling in K-means clustering can significantly reduce clustering performance. [
48] demonstrated that applying scaling methods such as Z-score or min–max normalization notably improves accuracy, precision, recall, and F-score, particularly when features have different units.
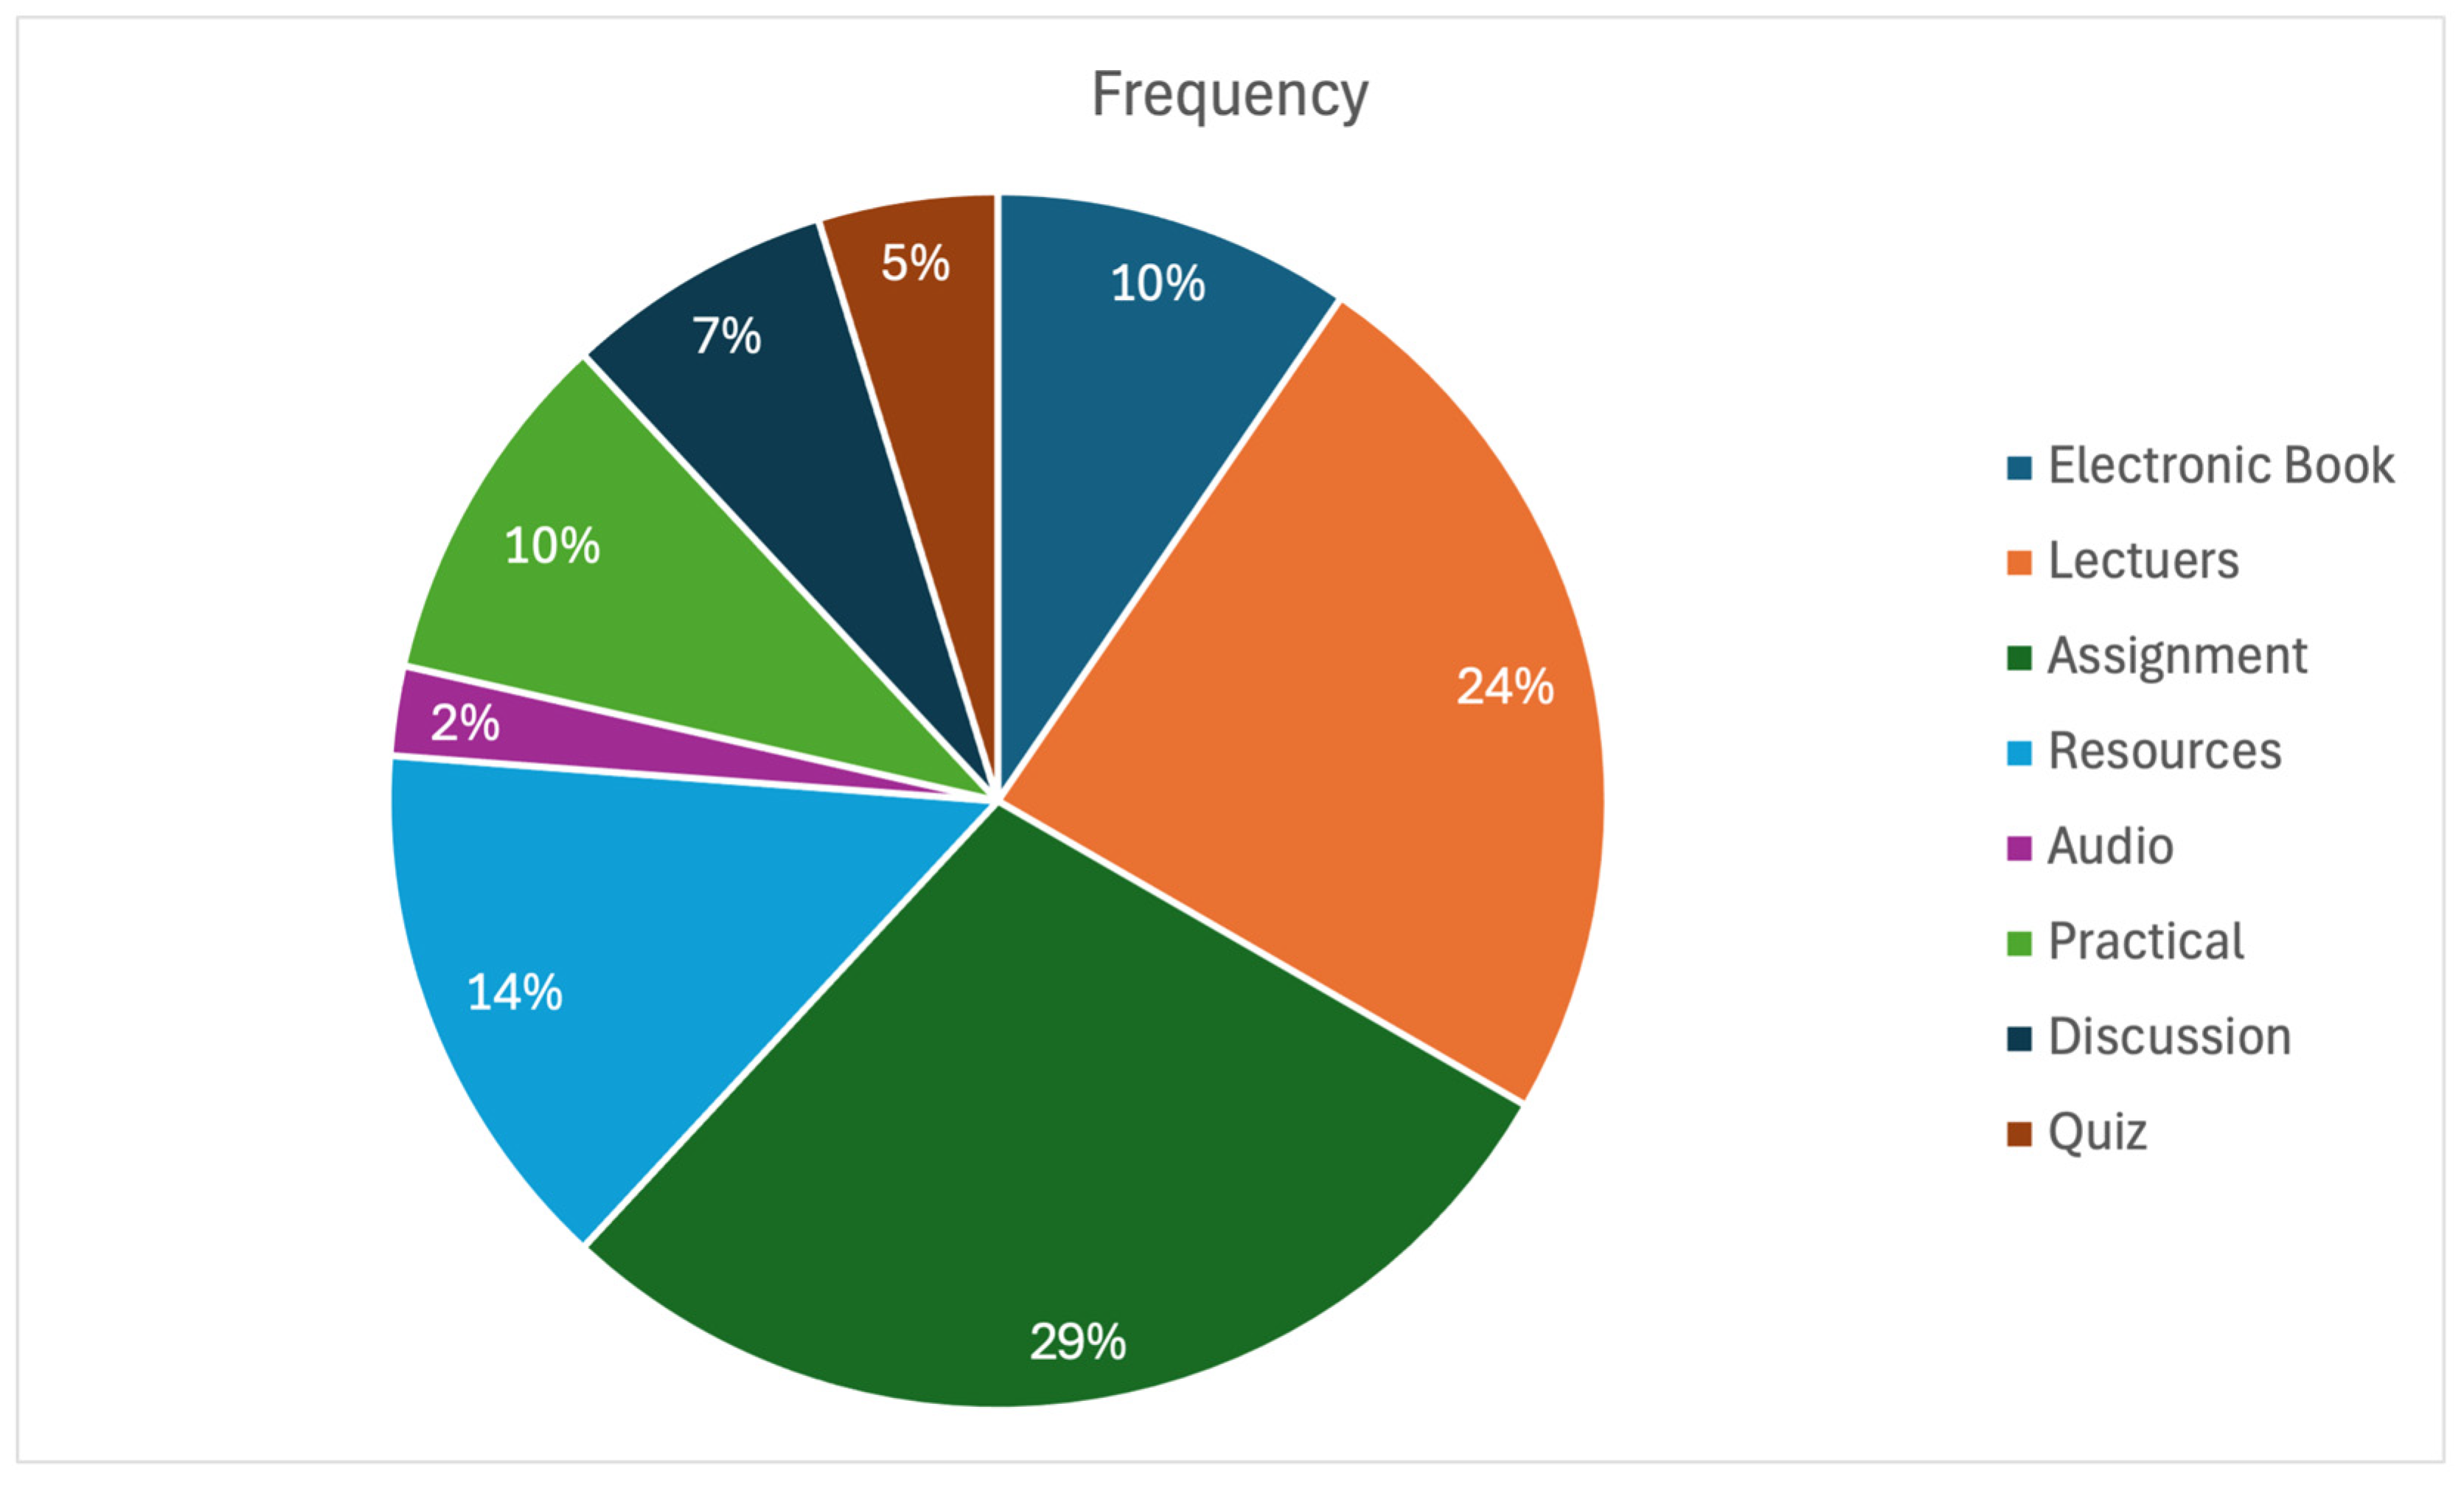
Figure 2 illustrates the percentage distribution of LMS activity completion over the 13-week course, highlighting variations in student engagement across different learning features.
Table 1 categorizes and defines all dataset features, organizing them by interaction type. These representations allowed us to ensure that activity weighting, feature selection, and clustering decisions are based on actual behavioral patterns rather than assumptions, thereby increasing the transparency, relevance, and validity of the overall methodology.
4.2. Preliminary Data Exploration
Preliminary data exploration is the initial stage of data preparation and analysis. It is designed to uncover patterns, anomalies, and relationships within the dataset. This phase uses statistical techniques and visualization tools such as charts and correlation matrices to evaluate data quality and understand the structural dependencies among variables.
This step is critical for guiding decisions in later modeling phases by identifying how features interact and determining which variables most influence student engagement. Specifically, heatmaps were employed to assess the relationships among diverse types of online learning activities recorded in the learning management system.
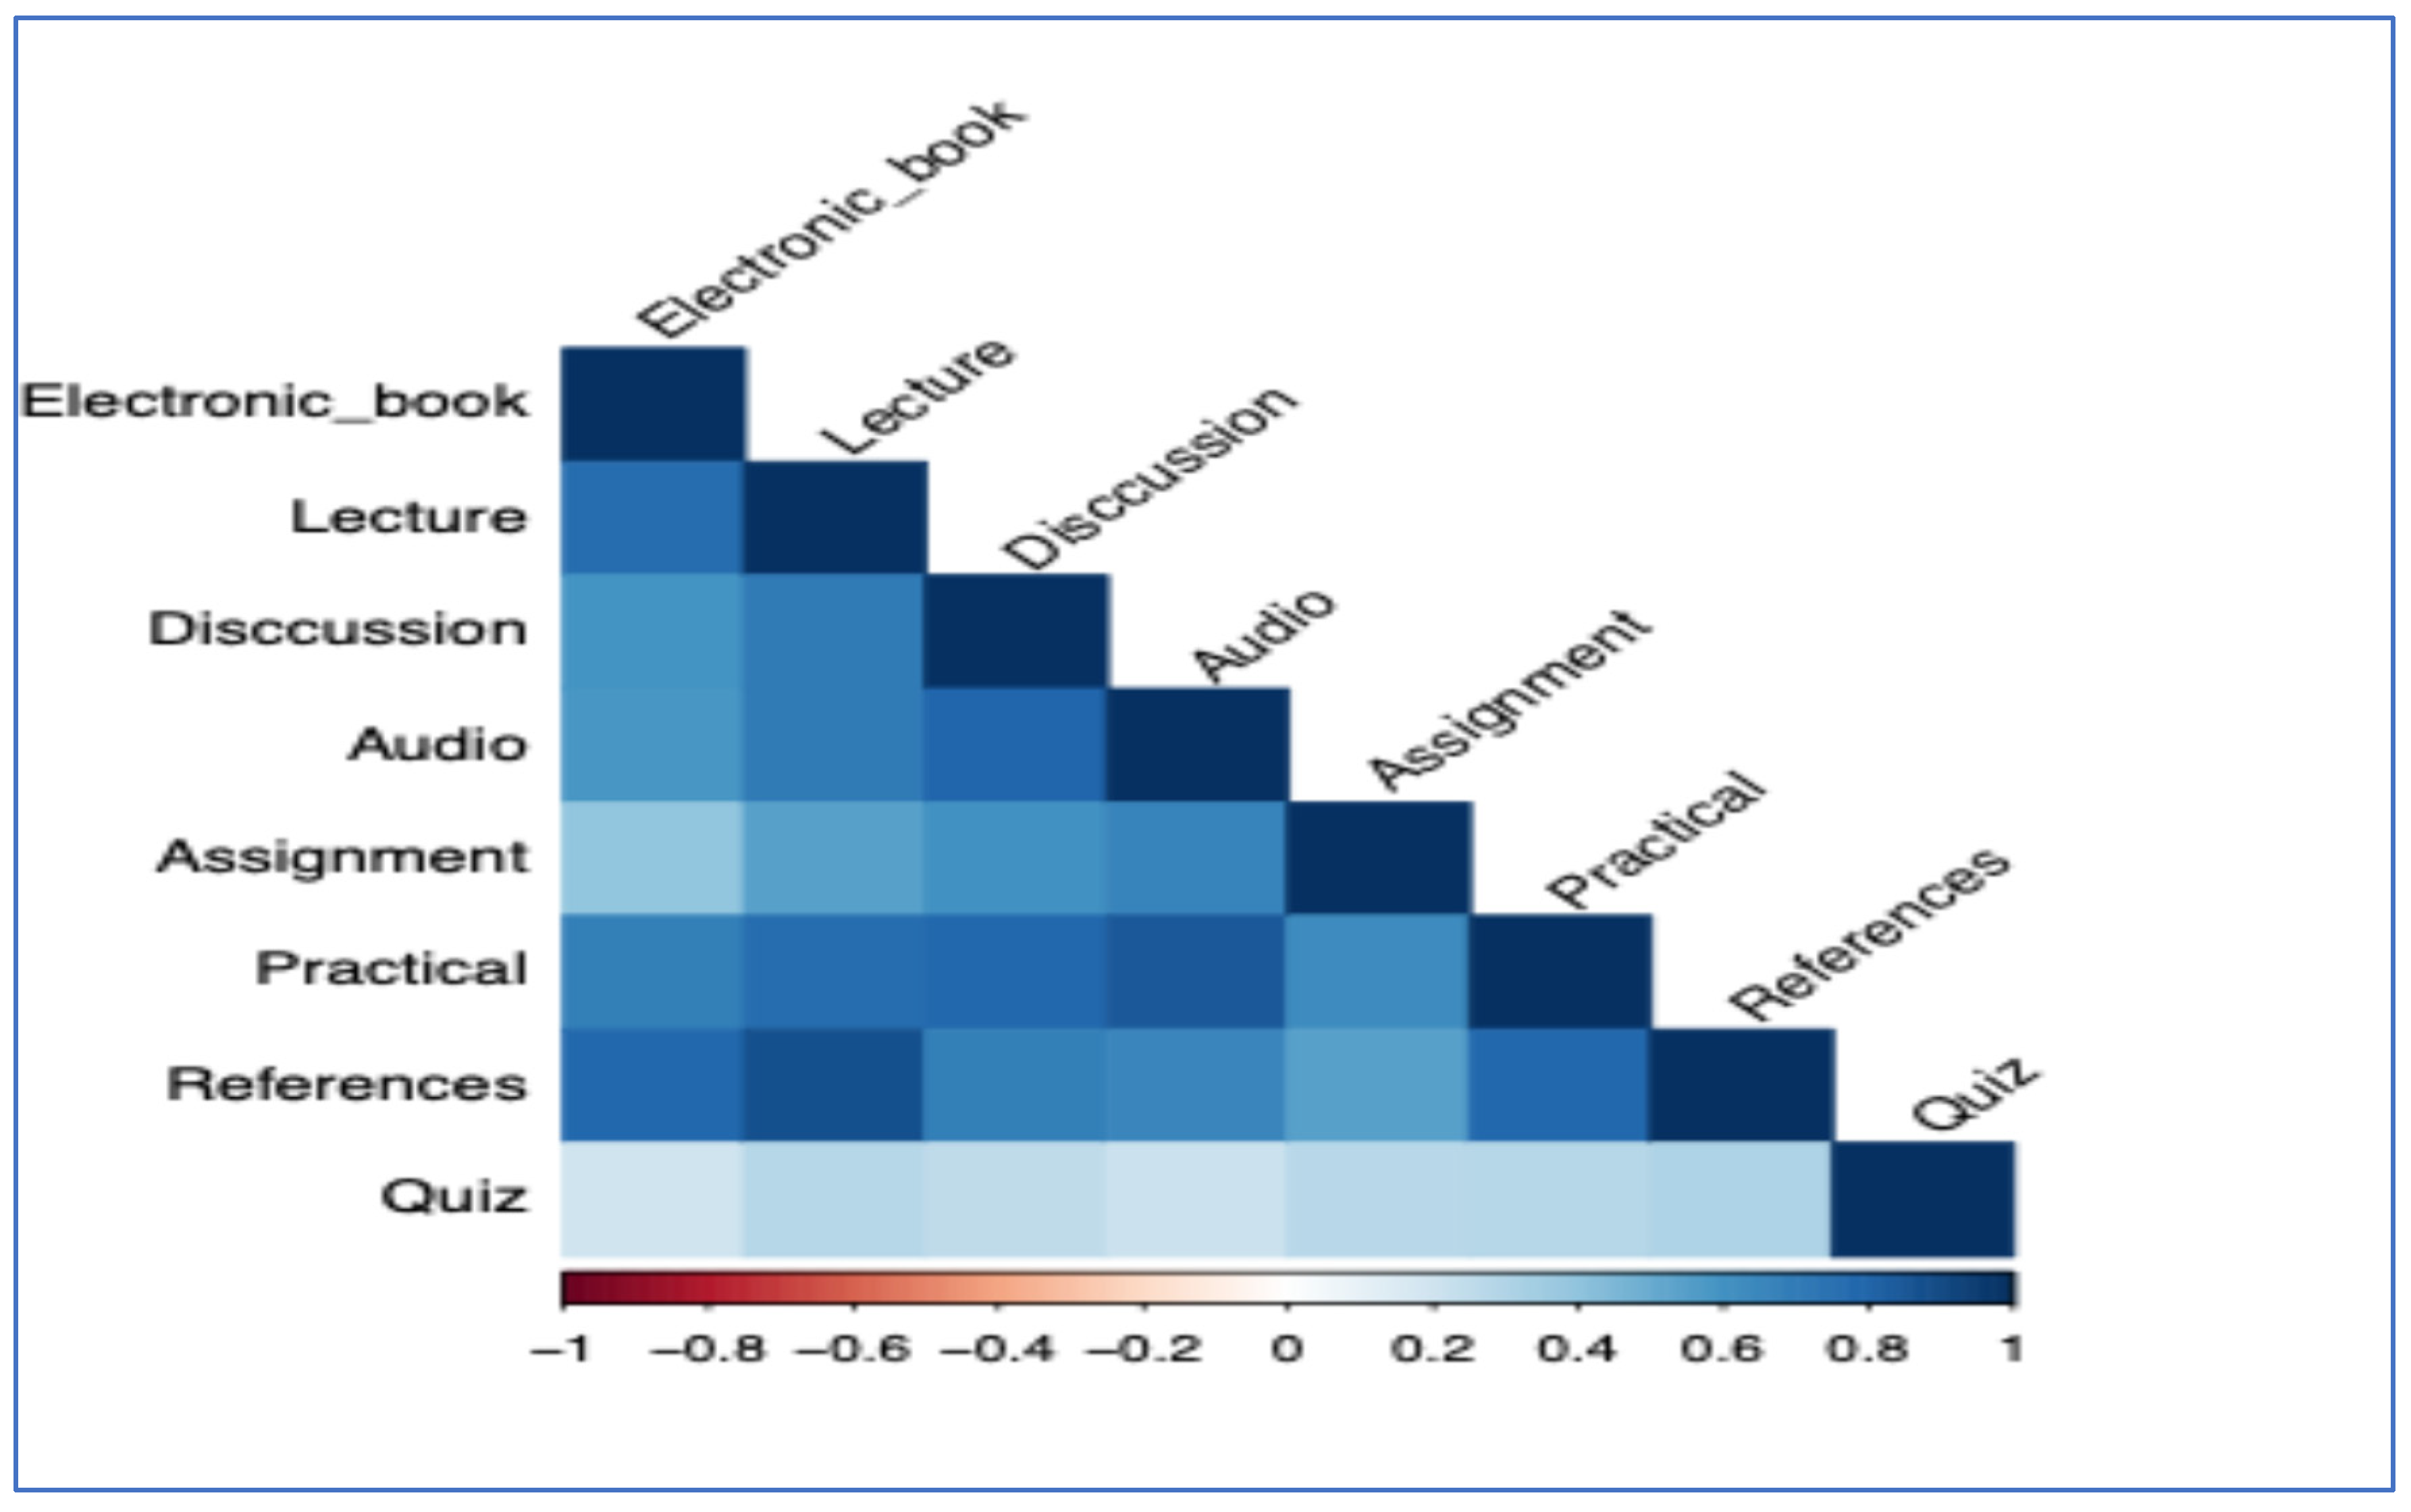
Figure A1 in
Appendix A displays the correlation matrix derived from the dataset. In this figure, darker shades of blue indicate stronger positive correlations. This means students who regularly engage with one activity, such as attending lectures, are also likely to participate in others like completing assignments or reading electronic books. Lighter shades of blue represent weaker but still positive relationships. The absence of red in the heatmap indicates no significant negative correlations, suggesting that different forms of engagement tend to reinforce each other rather than compete.
The results confirm a key premise of the study: engagement behaviors are aligned across multiple activity types. This alignment supports the use of cluster analysis, which assumes that student engagement can be meaningfully segmented based on combined patterns of interaction rather than single activity metrics.
4.3. Dataset Labeling
Before applying clustering techniques, we labeled the dataset using a weighted engagement scoring algorithm, as illustrated in Algorithm 1. This algorithm assigns greater importance to activities that occur consistently throughout the 13-week course period. For example, if the “lecture view” activity is performed every week by a student, it receives a proportionally higher weight than an activity engaged with only sporadically. This approach reflects the principle that sustained engagement is a more reliable indicator of involvement than occasional participation.
| Algorithm 1. Algorithm of Weighted Engagement Score Calculation |
Input:- 1-
Student Activity Data: A record for each student over the learning period (e.g., weekly data); each record contains information about the presence (1) or absence (0) of each tracked online activity. - 2-
Tracked Activities: A list of the M unique online activities being monitored. - 3-
Number of Weeks (N): The total duration of the learning period in weeks.
Steps:- 1-
Initialize an empty dictionary ‘student_weighted_scores’ to store the results. - 2-
Calculate Activity Weights: Initialize an empty dictionary ‘activity_weights’. For each tracked activity ‘A’ in ‘Tracked Activities’: Initialize ‘total_occurrences’ = 0. Iterate through all student activity data. For each student, count the number of weeks (out of N) in which activity ‘A’ was present (value = 1) Add this count to ‘total_occurrences’. For each tracked activity ‘A’ in ‘Tracked Activities’: Calculate the weight for activity ‘A’: ‘weight[A] = (total_occurrences of A across all students) / (Total number of students * N)’ ‘weight[A] = (Number of weeks activity A was active for *a representative student*)/N
- 3-
Calculate Weighted Engagement Score for Each Student: For each ‘student_data’ in the ‘Student Activity Data’: Get the ‘student_id’. Initialize ‘weighted_score’ = 0. For each tracked activity ‘A’ at each week ‘W’ (from 1 to N): Get the activity status (0 or 1) for activity ‘A’ in week ‘W’. If the activity was present (status = 1): Get the weight of activity ‘A’ (calculated in step 2). Add ‘weight[A]’ to ‘weighted_score’. Store the ‘weighted_score’ in ‘student_weighted_scores’ with the ‘student_id’ as the key.
- 4-
Classify Students into Engagement Groups (using the calculated ‘student_weighted_scores’): Determine thresholds for low, medium, and high engagement based on the distribution of the ‘student_weighted_scores’. This performed using percentiles:
-
Define thresholds based on percentiles (e.g., bottom 25% as low, middle 50% as medium, top 25% as high). - a.
Initialize an empty dictionary ‘student_engagement_levels’. - b.
For each ‘student_id’ and ‘score’ in ‘student_weighted_scores.items()’: If ‘score’ is below the low engagement threshold:’student_engagement_levels[student_id] = "Low"‘ - c.
Else if ‘score’ is below the medium engagement threshold:’student_engagement_levels[student_id] = "Medium"‘ - d.
- Else:’student_engagement_levels[student_id] = "High"‘
Output:- 1-
‘student_weighted_scores’: A dictionary of student IDs and their calculated weighted engagement scores. - 2-
‘student_engagement_levels’: A dictionary of student IDs and their classified engagement levels (low, medium, high).
|
The weight for each activity was computed as the number of weeks it was active divided by the total number of potential activity instances across all tracked features and weeks. This method draws from established learning analytics practices designed to quantify consistent behavioral engagement [
49].
For each student, a total weighted engagement score was then calculated by summing the products of each activity’s assigned weight and its presence (binary: 1 for engaged, 0 for not) across all weeks. This method supports a more nuanced classification of engagement than simple frequency counts, based on the view that no single activity alone guarantees high engagement [
50].
The algorithm produces two main outputs:
Student_weighted_scores: a dictionary mapping student IDs to their total weighted engagement scores;
Student_engagement_levels: a dictionary mapping student IDs to their categorized engagement level (low, moderate, high), based on score percentiles.
The classification thresholds were defined as follows:
Low engagement (LE): Bottom ~33% of scores (13.86 or below);
Moderate engagement (ME): Scores between the 33rd and 66th percentiles (greater than 13.86 and ≤ 27.72);
High engagement (HE): Top ~33% (greater than 27.72).
The calculated activity weights are listed in
Table 2, which shows that assignments, lectures, and electronic books were the most heavily weighted activities due to their consistent weekly recurrence.
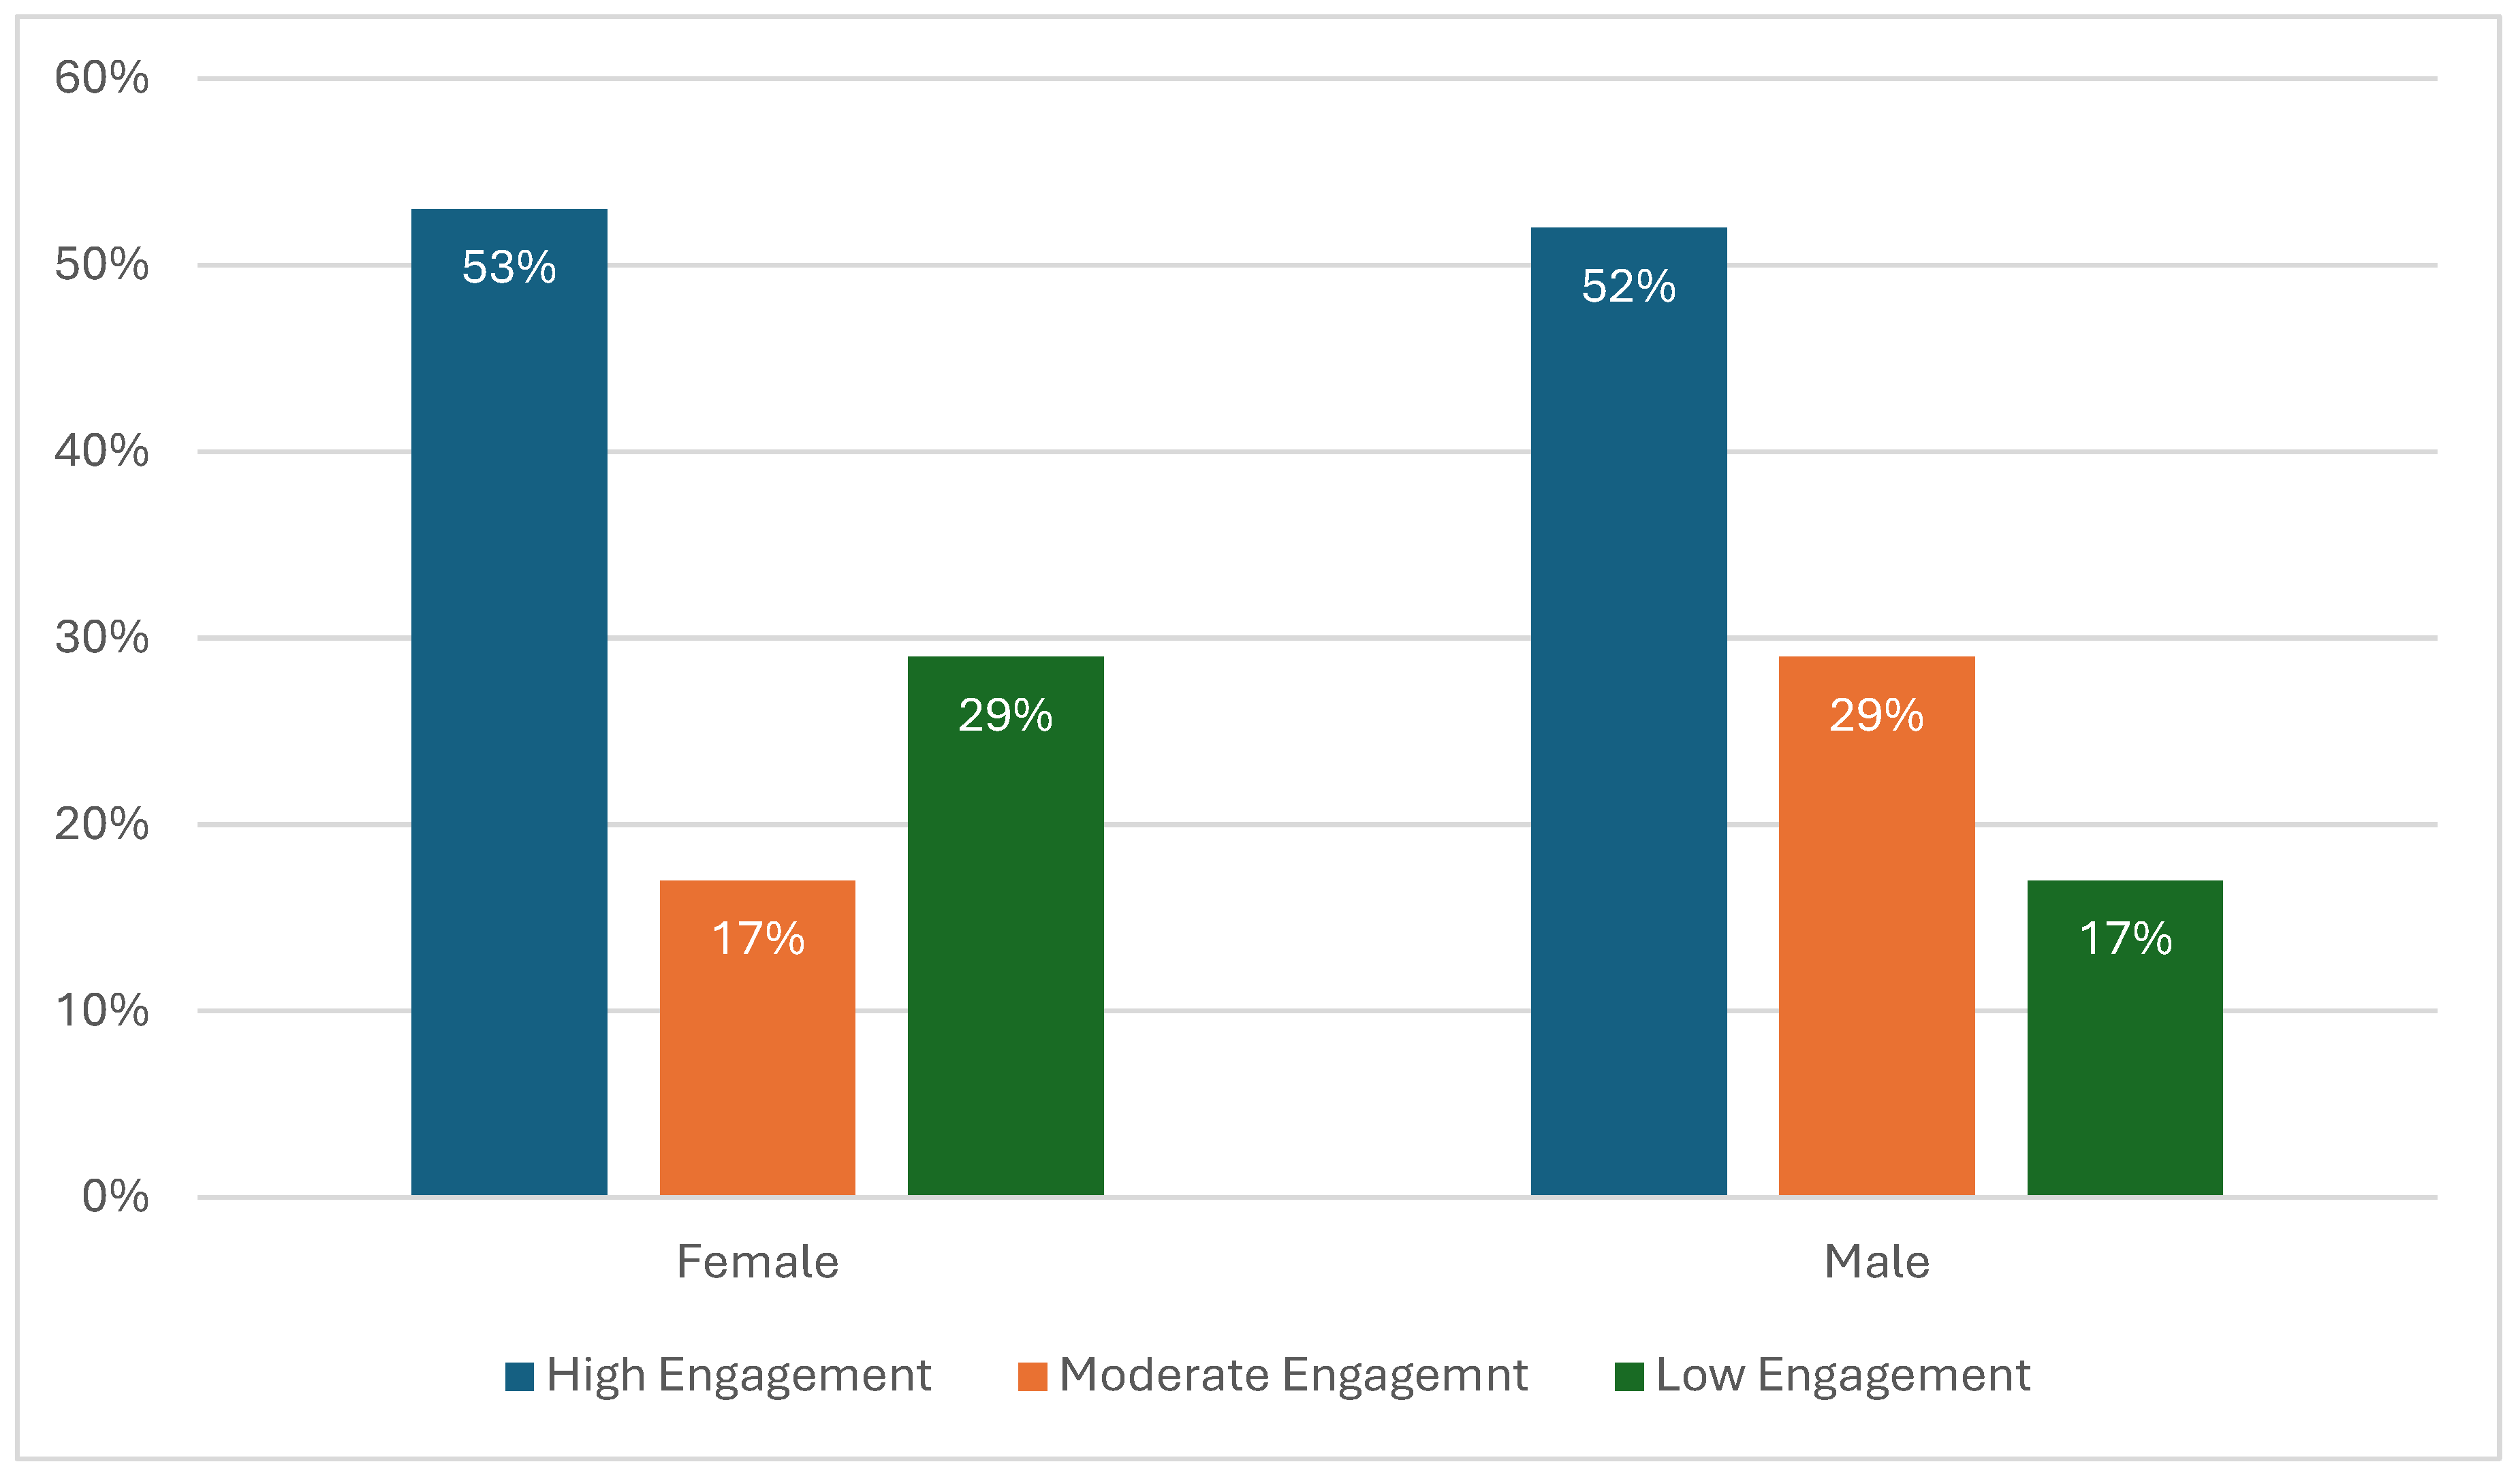
The distribution of engagement levels by gender is shown in
Table 3, with high engagement most common among both male and female students.
Figure 3 provides a visual summary of this distribution. It indicates that high engagement is nearly equally prevalent among male (52%) and female (53%) students. However, a disparity is evident in the lower engagement category, where female students show a higher rate (29%) of low engagement compared to males (17%).
This pattern is consistent with recent research indicating potential gender-based differences in online learning engagement, which may be influenced by factors such as learning preferences or digital interaction styles [
51]. While both genders exhibit strong overall engagement, further exploration is warranted to understand the underlying causes of gender-specific engagement dynamics in virtual learning environments. While such disparities might initially be considered through the lens of individual learning preferences, a more nuanced interpretation demands consideration of broader socio-cultural influences, potential disparities in access to resources or technology, varying time constraints, or even inherent design choices within the learning platform itself. Attributing these differences solely to “preferences” risks oversimplifying complex behavioral patterns and overlooking systemic factors. We acknowledge that observed differences are multifactorial and require deeper investigation into their underlying causes and implications, particularly concerning algorithmic fairness, as further discussed in
Section 5.5. If unaddressed, such algorithmic biases could perpetuate feedback loops in which learner models trained on biased behavioral patterns reinforce and amplify gender disparities in future predictions and interventions.
4.4. Model Building and Testing
After aggregating, integrating, and preparing student activity data from the Blackboard LMS, we applied the K-means clustering algorithm using two different configurations: a two-level model and a three-level model. The input features consisted of eight engagement indicators extracted from students’ online activity over a 13-week period, as described in
Section 4.1. Notably, the target variable representing student engagement levels (high, medium, low) was excluded during clustering to maintain an unsupervised modeling approach.
Each clustering model was trained using 10-fold cross-validation to ensure reliable performance. To determine the optimal number of clusters, we used the elbow method, a widely used heuristic for estimating the optimal number of clusters in K-means clustering [
52], as shown in
Figure 4. This method plots the within-cluster sum of squares (WSS) against the number of clusters. The graph shows a sharp decline from K = 1 to K = 2, followed by a gradual decrease beyond K = 3, where the curve begins to level off. This “elbow“ points at K = 3, suggesting it as the most appropriate number of clusters, balancing model simplicity with effective data segmentation.
Although two clusters explain a significant portion of the variance, selecting three clusters offers a more nuanced segmentation of student engagement, providing a better trade-off between complexity and explanatory power.
Further analysis was conducted to compare the performance and interpretability of both models. The two-cluster model primarily distinguished between a group with generally high activity and another with low overall participation. In contrast, the three-cluster model enabled a finer-grained classification, capturing not just high and low engagement, but also identifying a moderately engaged group—particularly evident in collaborative activities such as discussions and practical tasks.
This is illustrated in
Figure 5, which compares the centroid means for each feature across the two- and three-level clustering models.
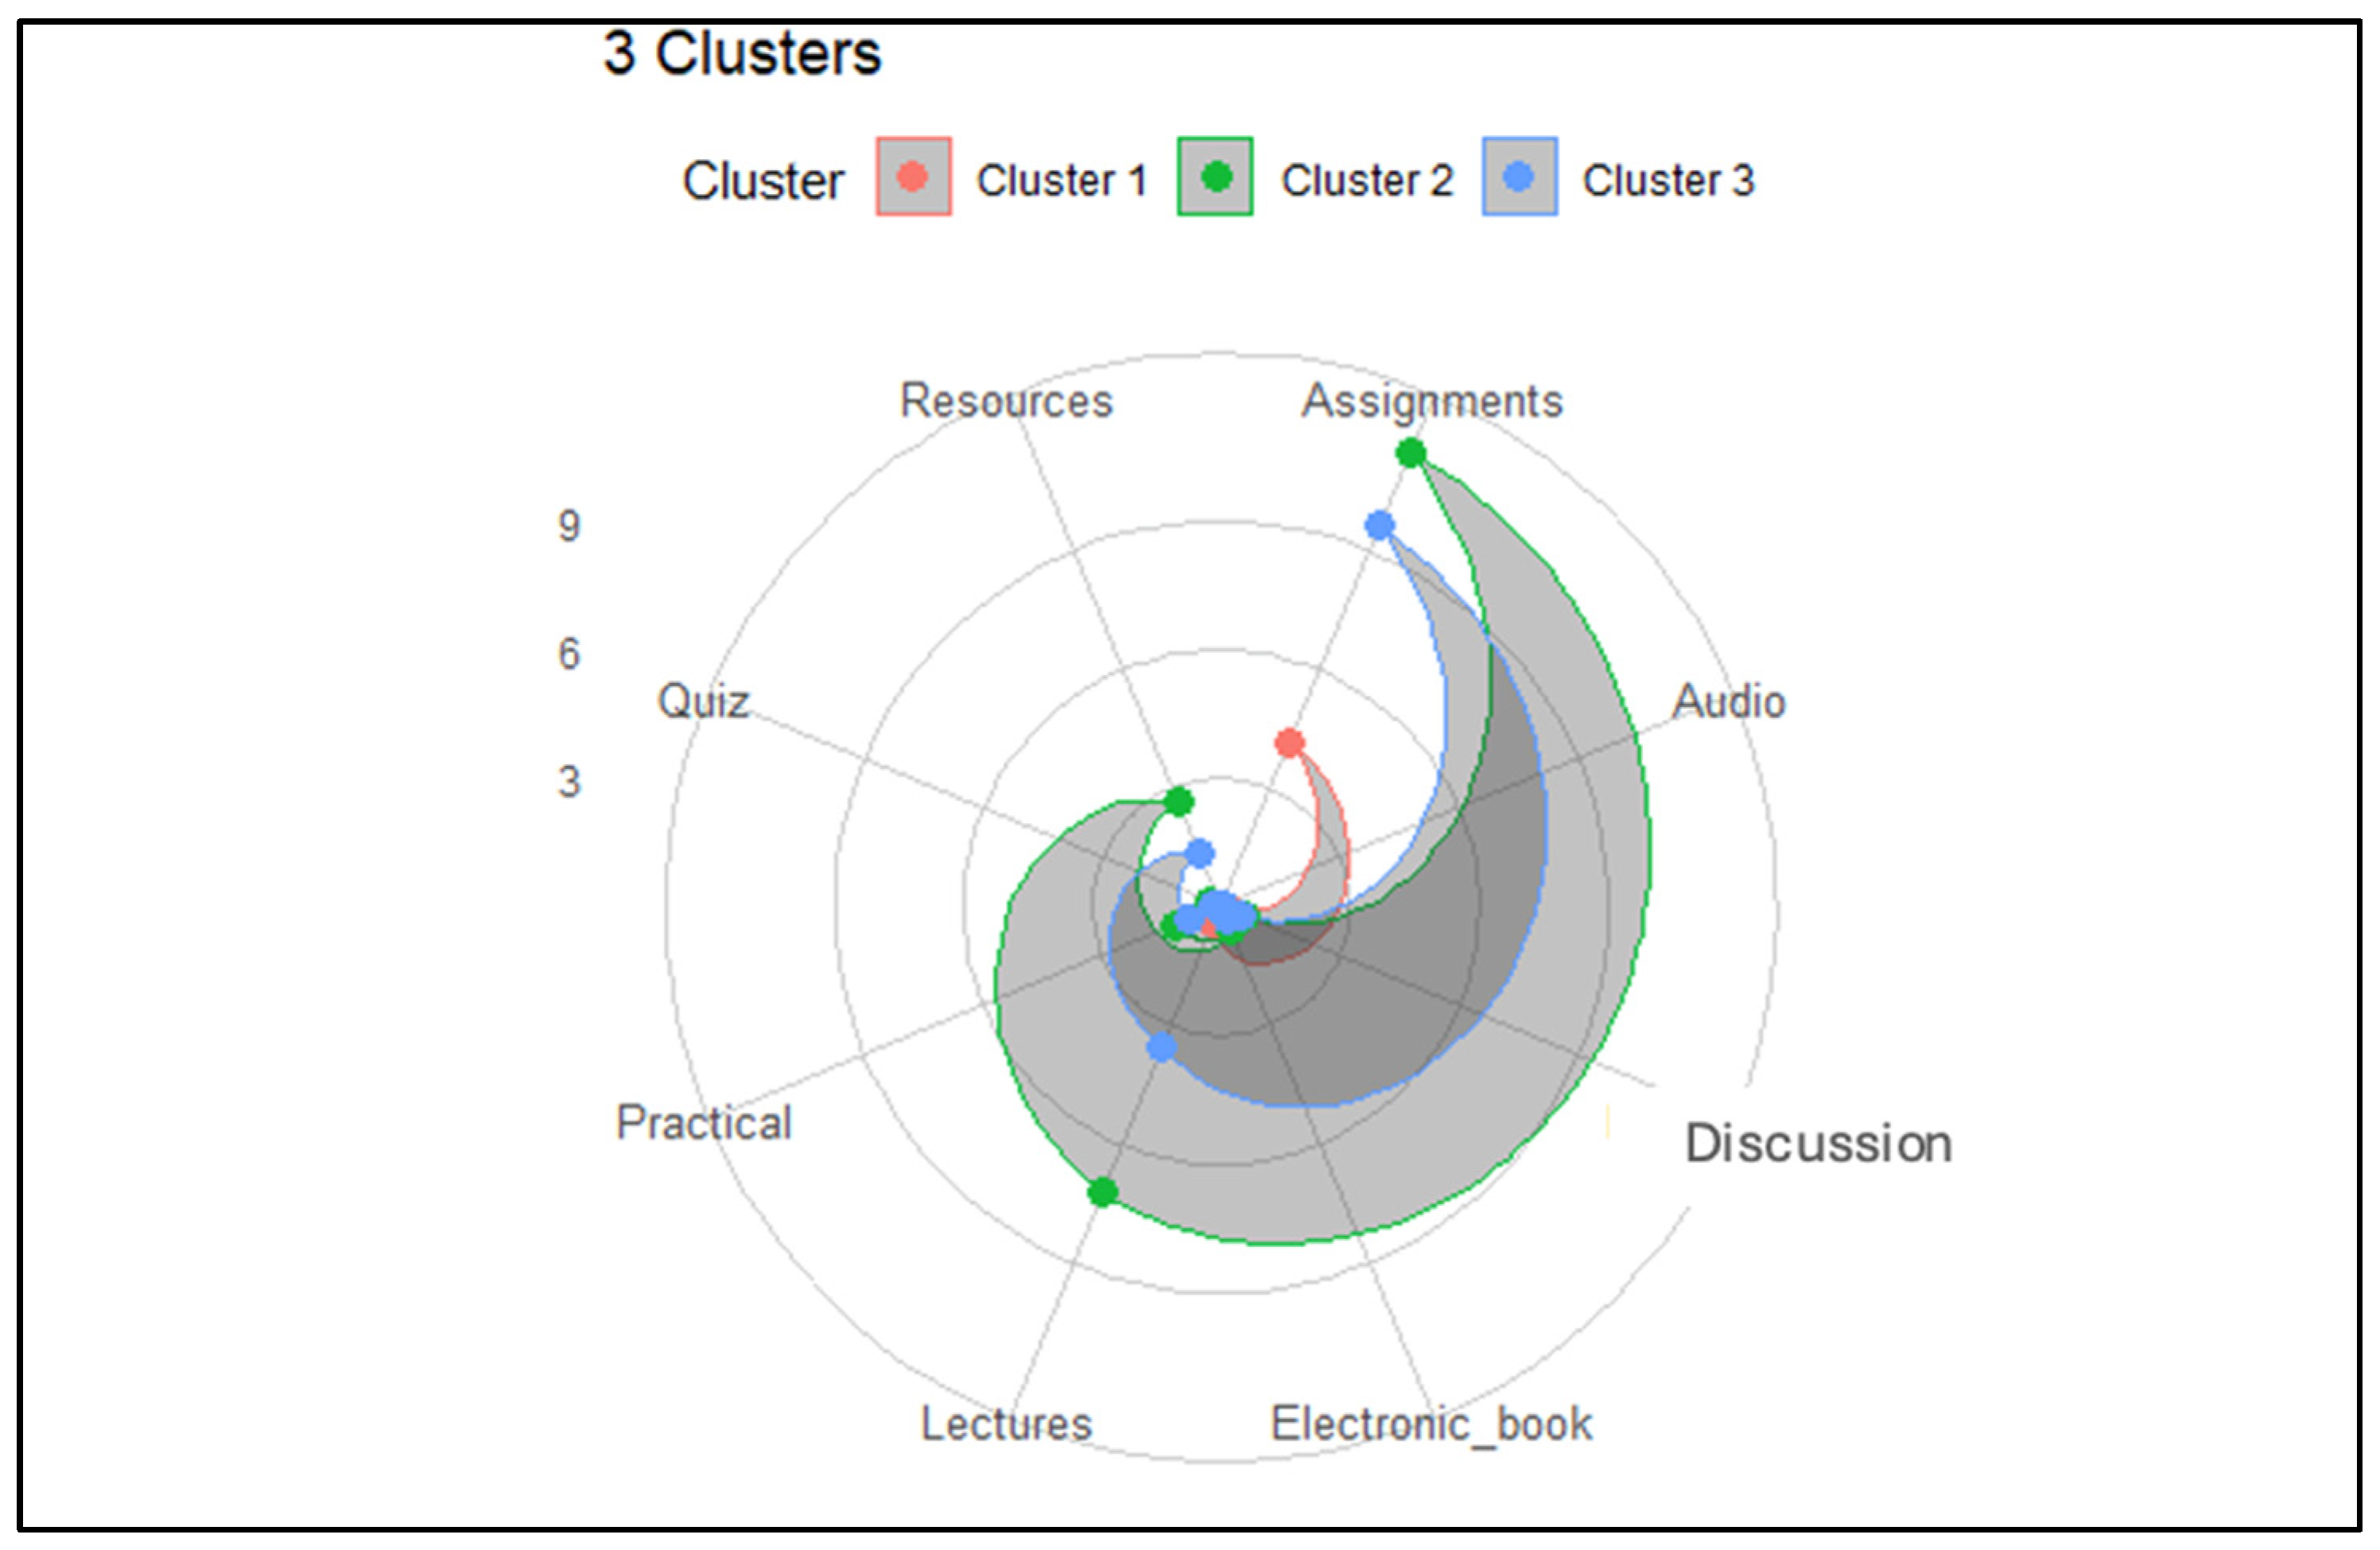
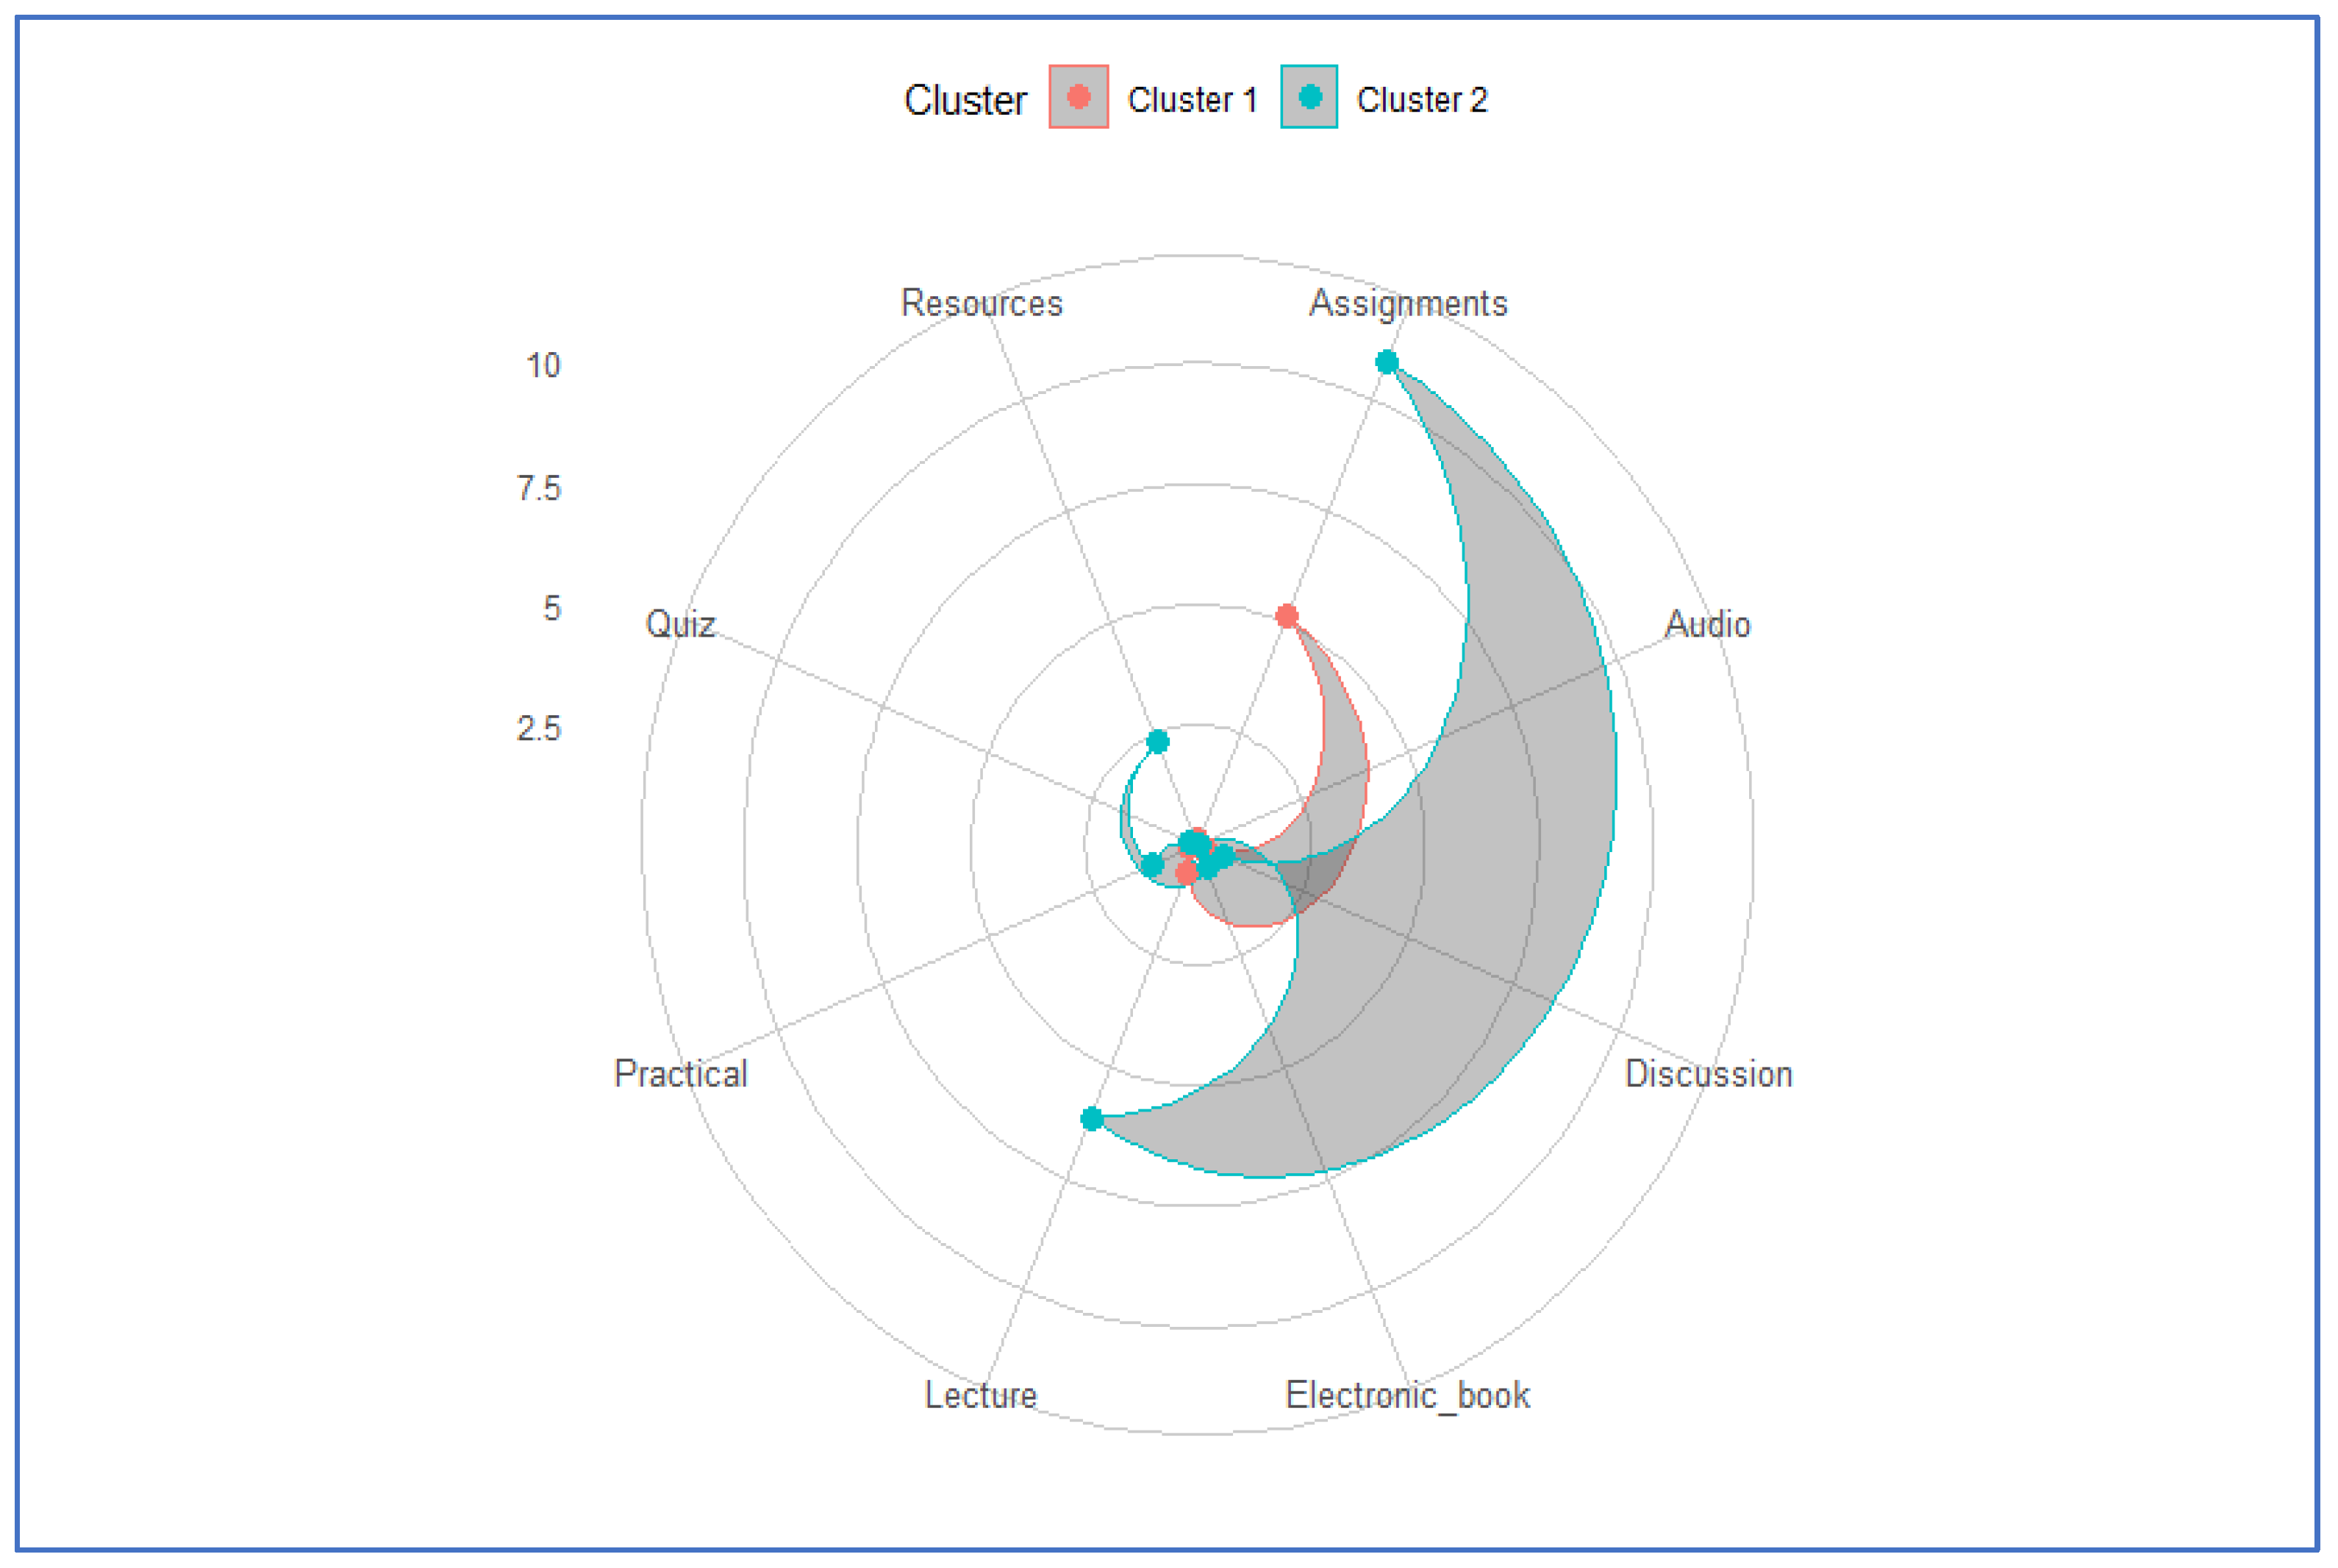
To further examine the engagement patterns, radar plots were used.
Figure 6 shows the distinct activity profiles across three clusters, identified using K-means with Euclidean distance on standardized data. Cluster 1 reflects moderate engagement across all activity types. Cluster 2 is characterized by high activity, indicating a highly engaged group, while cluster 3 shows low activity levels, suggesting disengagement.
In the two-cluster model, shown in
Figure 7, cluster 1 captures the lower engagement group, and cluster 2 represents students with consistently higher participation.
An important observation emerged concerning the “Audio” feature. Across all clusters, this feature exhibited similar values, making it ineffective for distinguishing between engagement levels. This limitation likely stems from the infrequent appearance of audio-based content during the semester, which provides limited resolution and contributes less insight into students’ behavioral differences. In contrast, repeated activities such as assignments, discussions, and lectures offered a more comprehensive and reliable picture of engagement over time.
4.5. Model Evaluation (Internal and External)
To assess the effectiveness of the clustering approach, both internal and external validation methods were applied.
- -
Internal Validation
The internal evaluation involved comparing the performance of two-cluster and three-cluster models using several metrics: silhouette score, within-cluster sum of squares (WSS), between-cluster sum of squares (BSS), total sum of squares (TSS), and R-squared. These values are presented in
Table 4.
While the two-cluster model achieved a higher silhouette score (0.595), indicating better defined cluster boundaries, the three-cluster model exhibited lower WSS (618.293), suggesting more compact clustering. Additionally, the three-cluster configuration showed greater between-cluster separation (BSS = 2329.142) and a higher R-squared value (0.80), indicating that it explained a larger proportion of the variance in the data. These findings suggest that, although the two-cluster model delivers more distinct segmentation, the three-cluster model offers superior explanatory capability and a richer stratification of engagement behaviors. Overall, the moderate silhouette coefficient (0.493) can be attributed to two main factors. First, the data exhibit high-dimensional sparsity, especially among low-engagement students whose activity vectors are dominated by zero values, limiting the effectiveness of distance-based separation. Second, there is correlation among features as shown in
Figure A1 in
Appendix A, as certain behaviors (e.g., watching lectures and completing assignments) tend to co-occur, reducing the distinctiveness of cluster boundaries. These factors contribute to overlapping regions in the feature space, thereby lowering the silhouette score despite the presence of meaningful behavioral groupings.
- -
External Validation
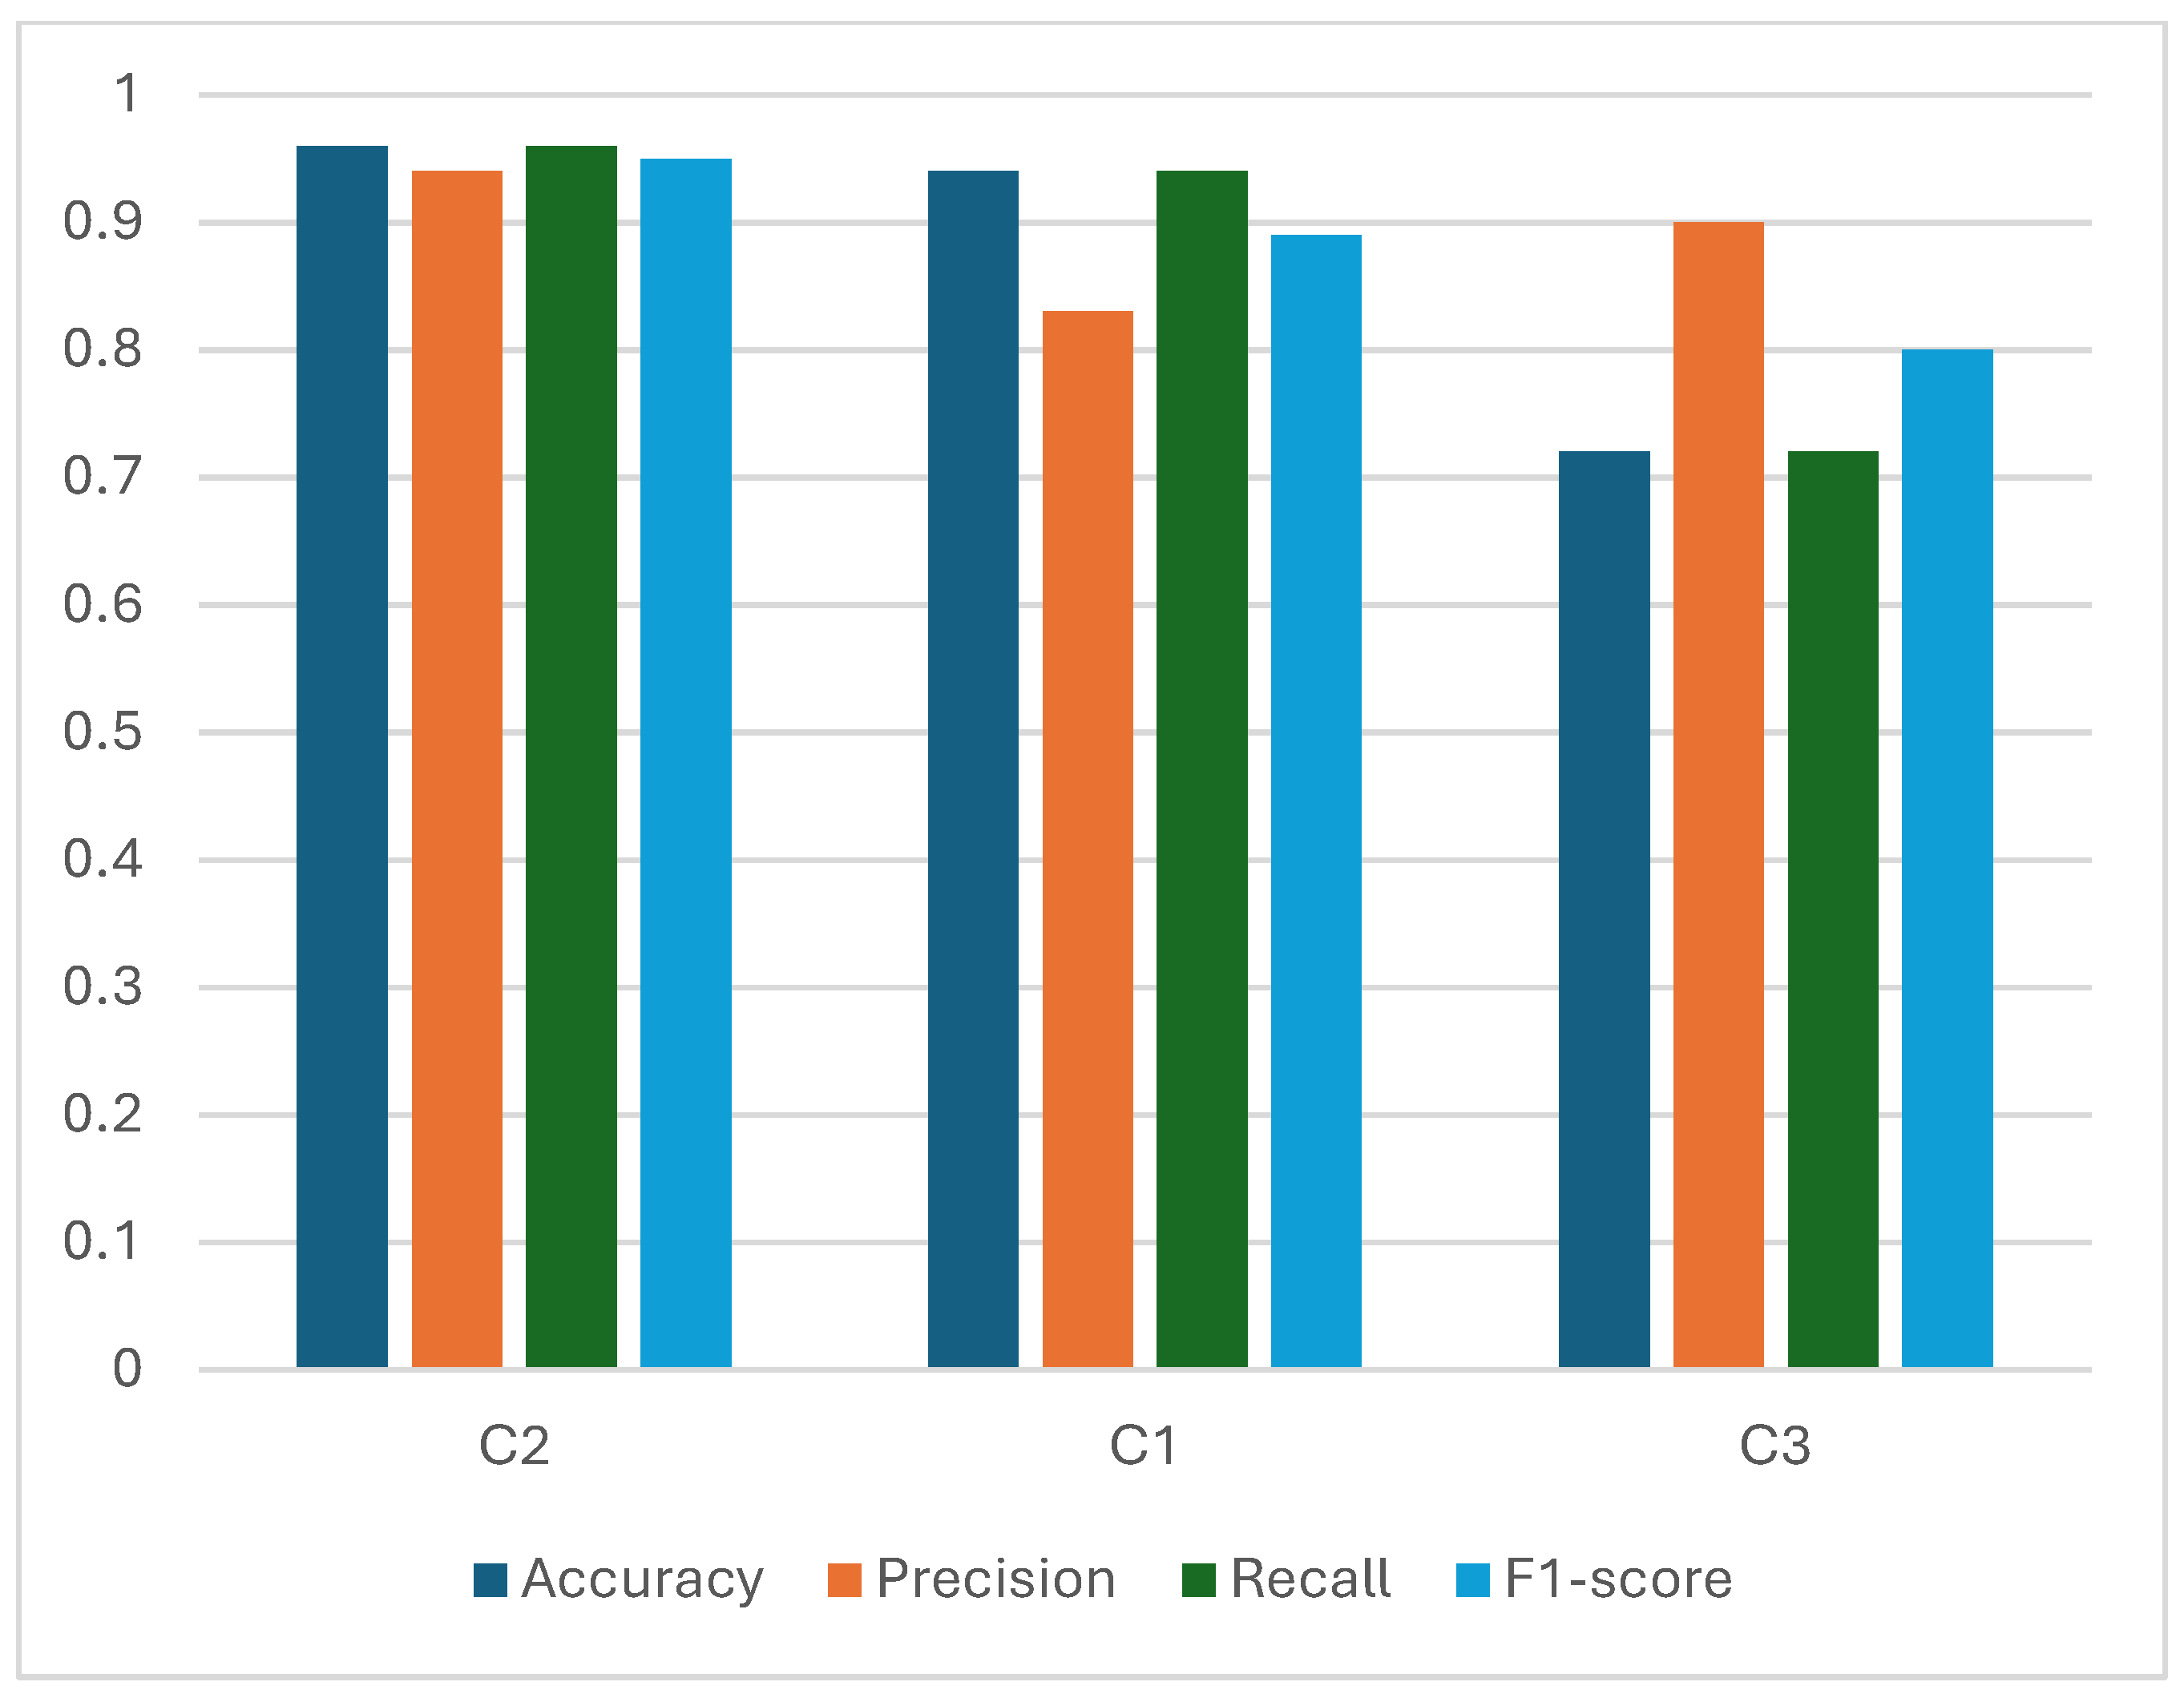
To validate the clusters externally, we compared them against the pre-labeled dataset using classification performance metrics. Results are provided in
Table 5, which reports accuracy, precision, recall, and F1-score for each of the three clusters. These are also visualized in
Figure 8.
Figure 8 clearly illustrates the robust performance of the three-cluster model across all evaluation metrics. Cluster C2 demonstrates the highest accuracy and F1-score, reflecting high model confidence and consistency for students classified in this group, likely the highly engaged cohort. Cluster C1 also shows strong precision and recall, indicating reliable identification of moderately engaged students. While cluster C3 lags slightly in accuracy and recall, its high precision suggests that the students it does classify as low engagement are correctly identified. However, the challenge in identifying low engagement students is significantly compounded by feature sparsity. For this group, many of the behavioral metrics (e.g., discussions, assignment completed) are characterized by a high proportion of zero values. This pervasive ”absence” of activity makes it difficult for the model to learn distinct, non-zero patterns that uniquely define low engagement, as it offers limited discriminative signal compared to the more active, denser feature representations of other student groups.
Overall, the average scores confirm that the model aligns well with the labeled data, validating the effectiveness and reliability of the three-level clustering approach in distinguishing student engagement levels.
4.6. Temporal Dynamics of Student Engagement Clusters
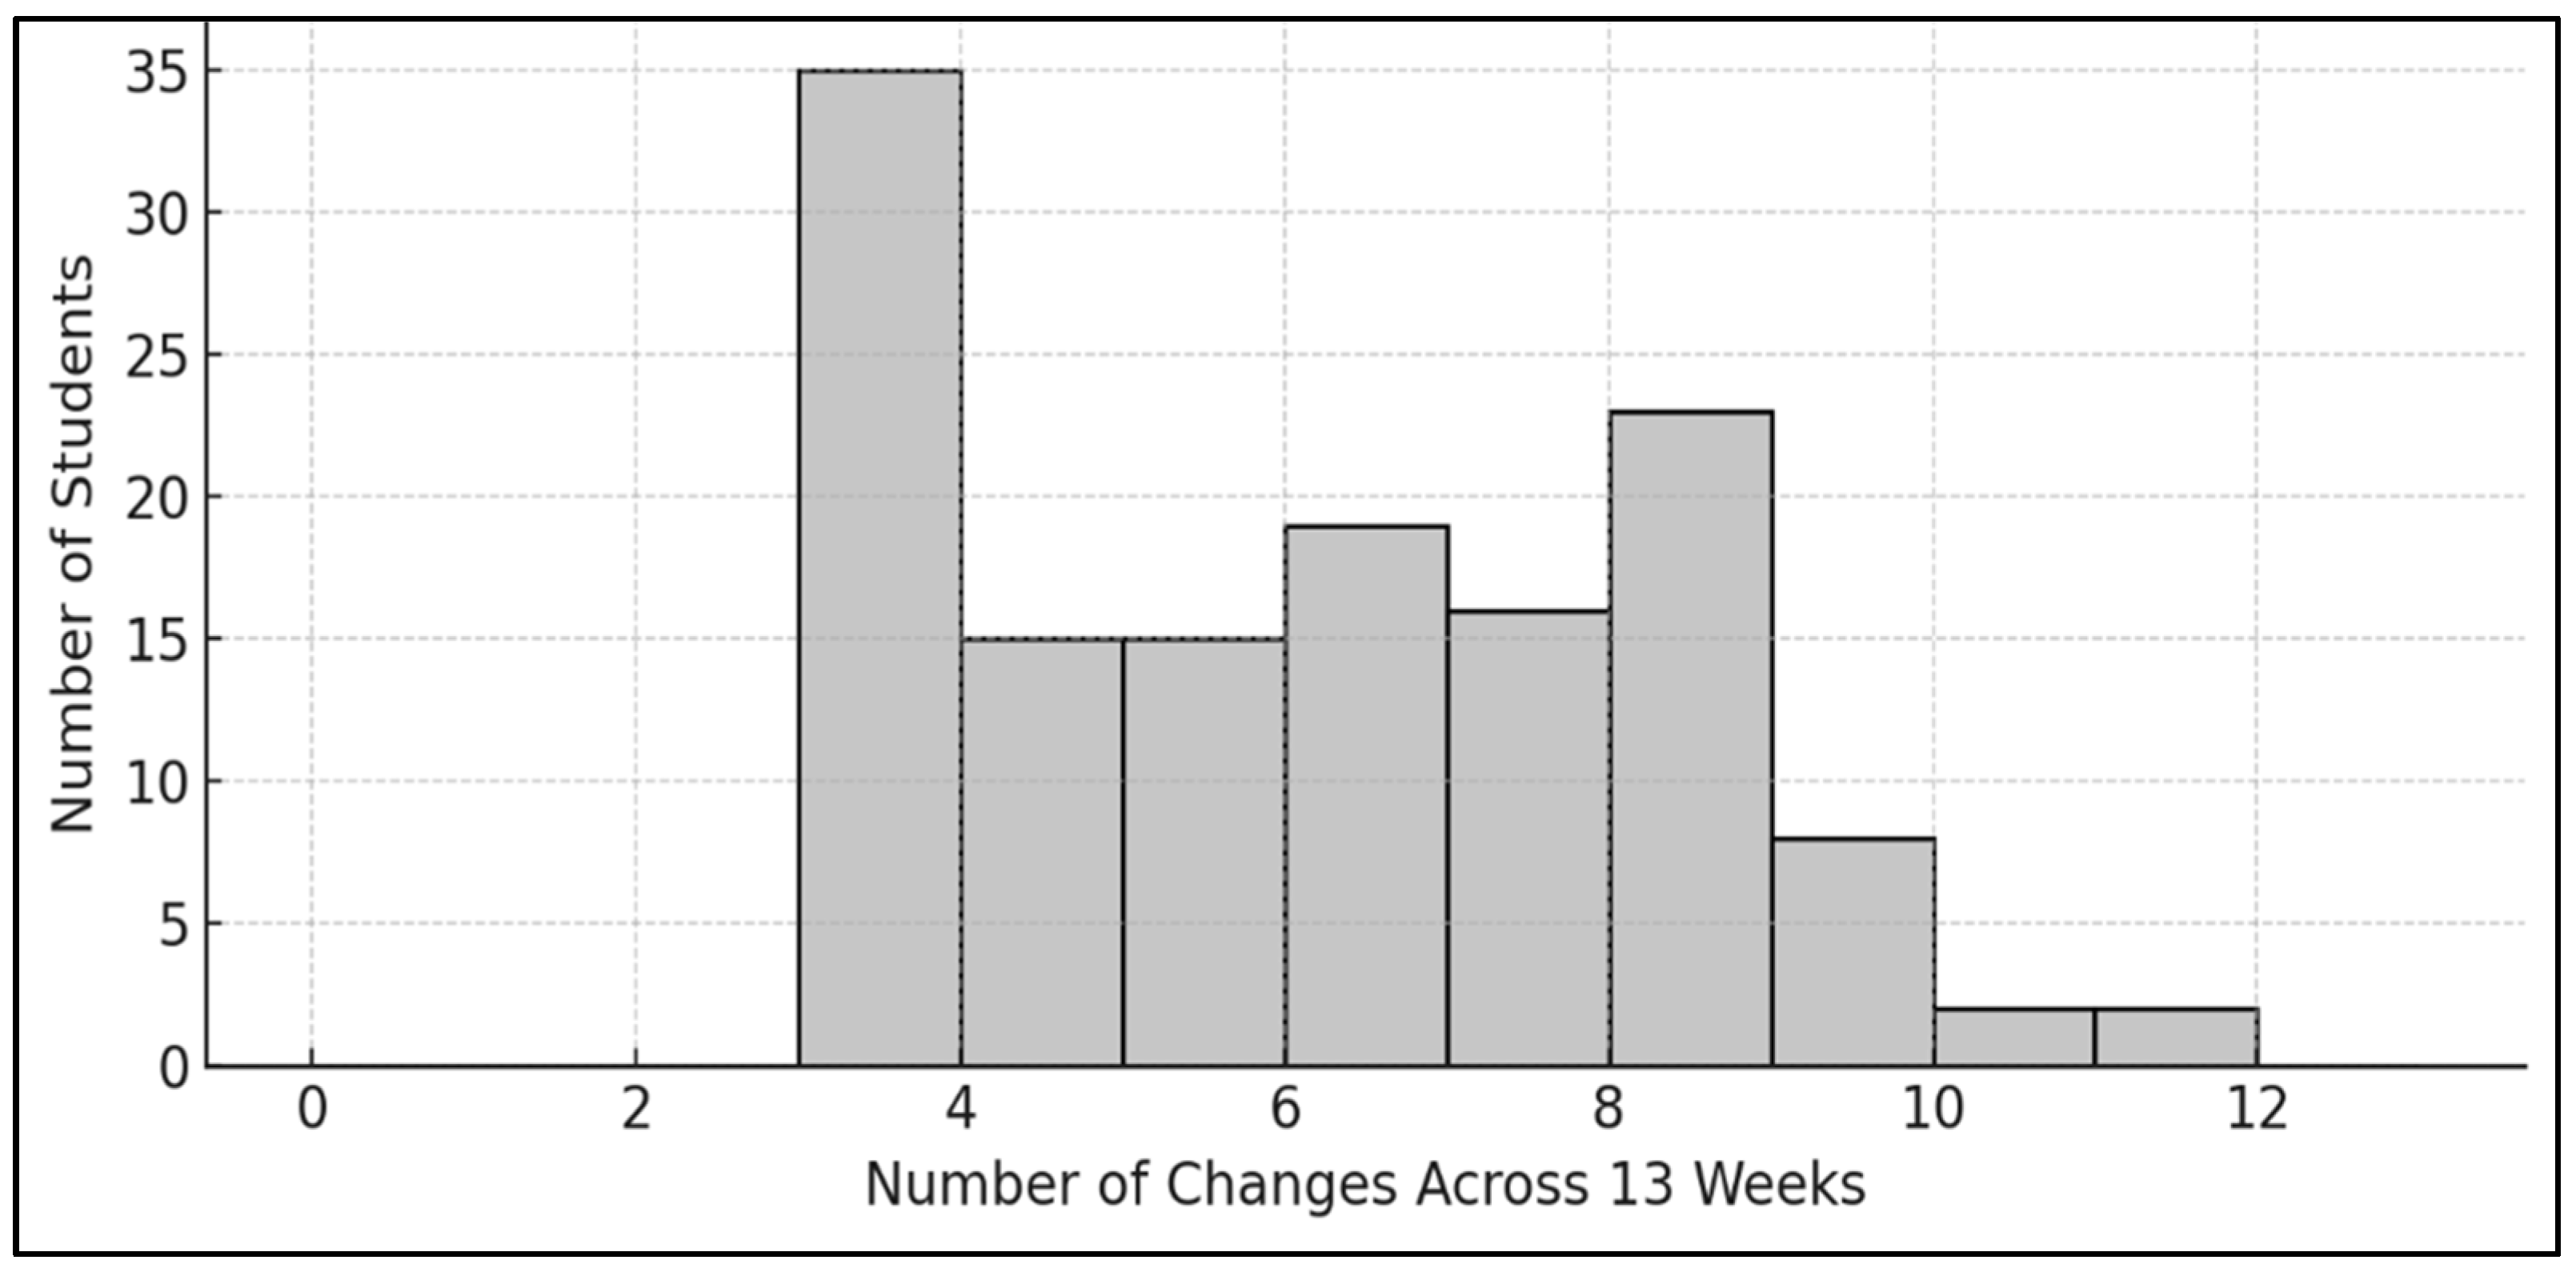
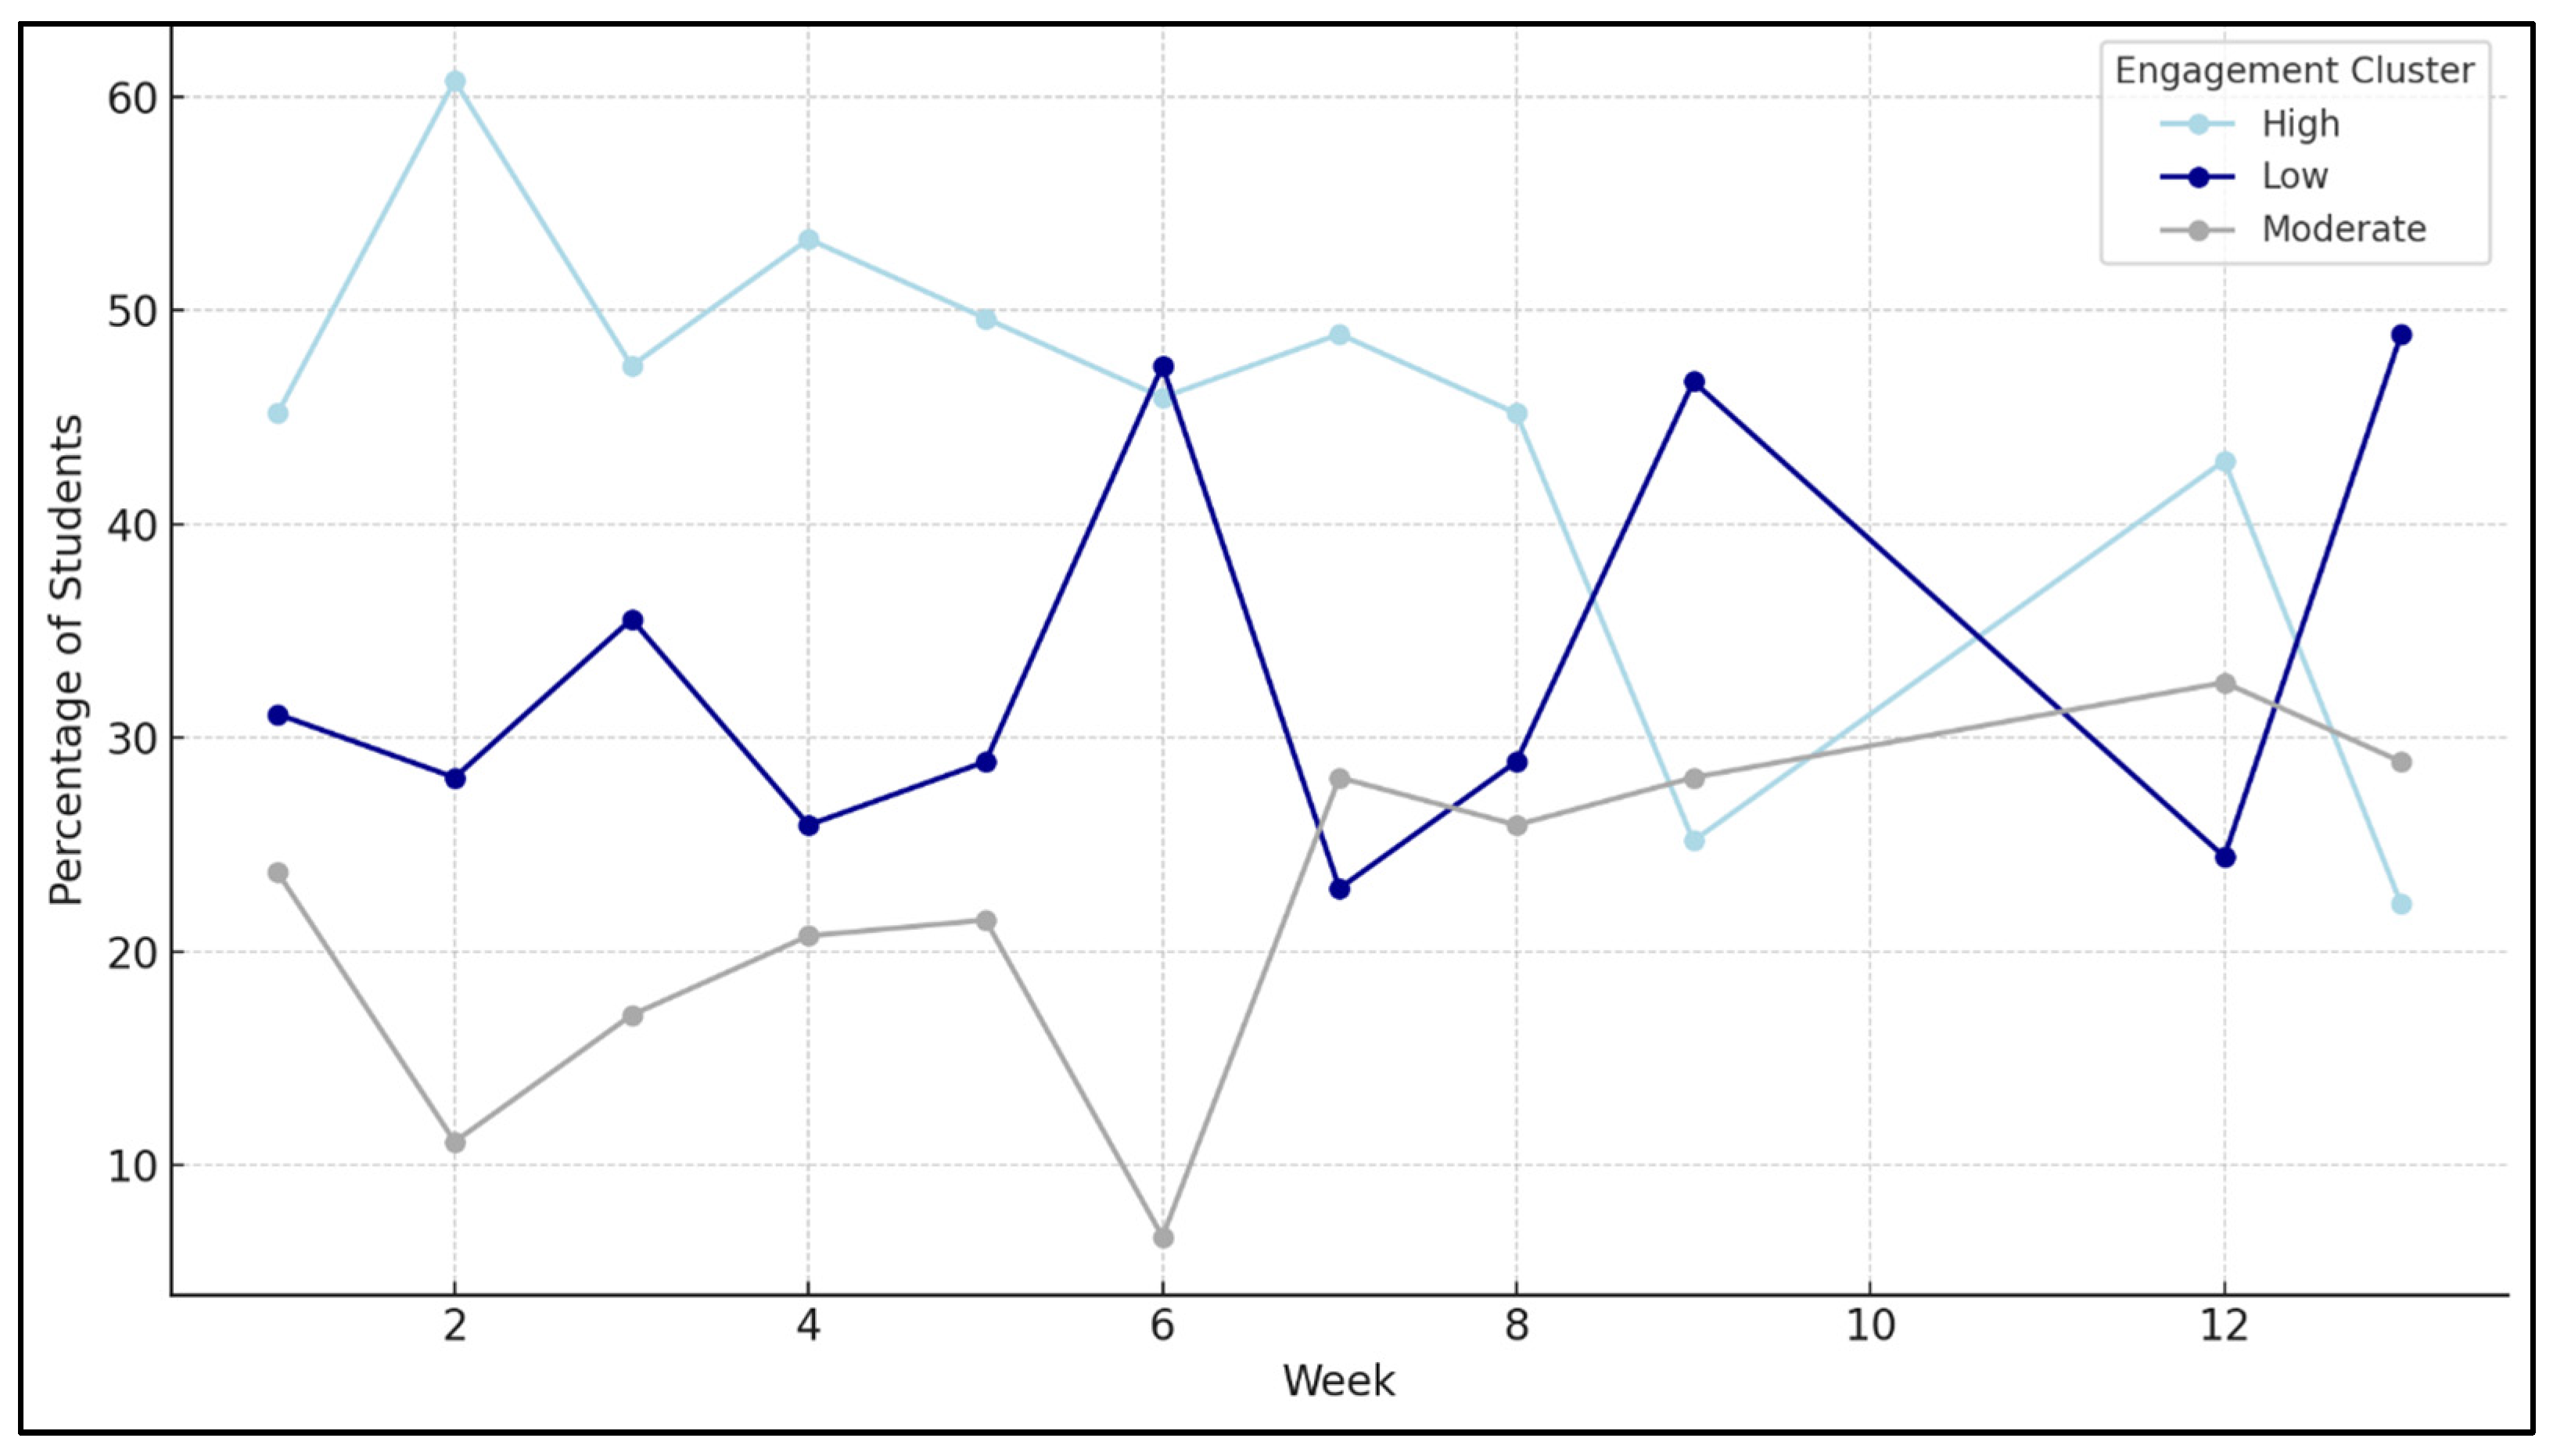
The temporal analysis of student engagement clusters over 13 weeks reveals that engagement is highly dynamic, with frequent transitions between high, moderate, and low clusters. Line plot and histogram (
Figure 9 and
Figure 10) show substantial movement between clusters from week to week, confirming the fluidity of learner behavior. Notably, no student remained in a single cluster throughout, and most experienced multiple shifts in engagement. The histogram showing the distribution of cluster changes per student across 13 weeks indicates that most students experienced multiple changes in engagement levels. Notably, zero percent of students remained in the same cluster throughout all weeks, which substantiates the presence of temporal dynamics. Overall, the weekly trends depicted in the plot line indicate a gradual decline in high engagement and increased variability in other clusters, emphasizing the importance of implementing time-aware strategies for monitoring and supporting student engagement.
4.7. Engagement and Exam Performance
The results of the ordinal logistic regression (
Figure 11) indicate a strong and statistically significant association between exam performance and student engagement. The coefficient for the performance predictor was 1.664 (
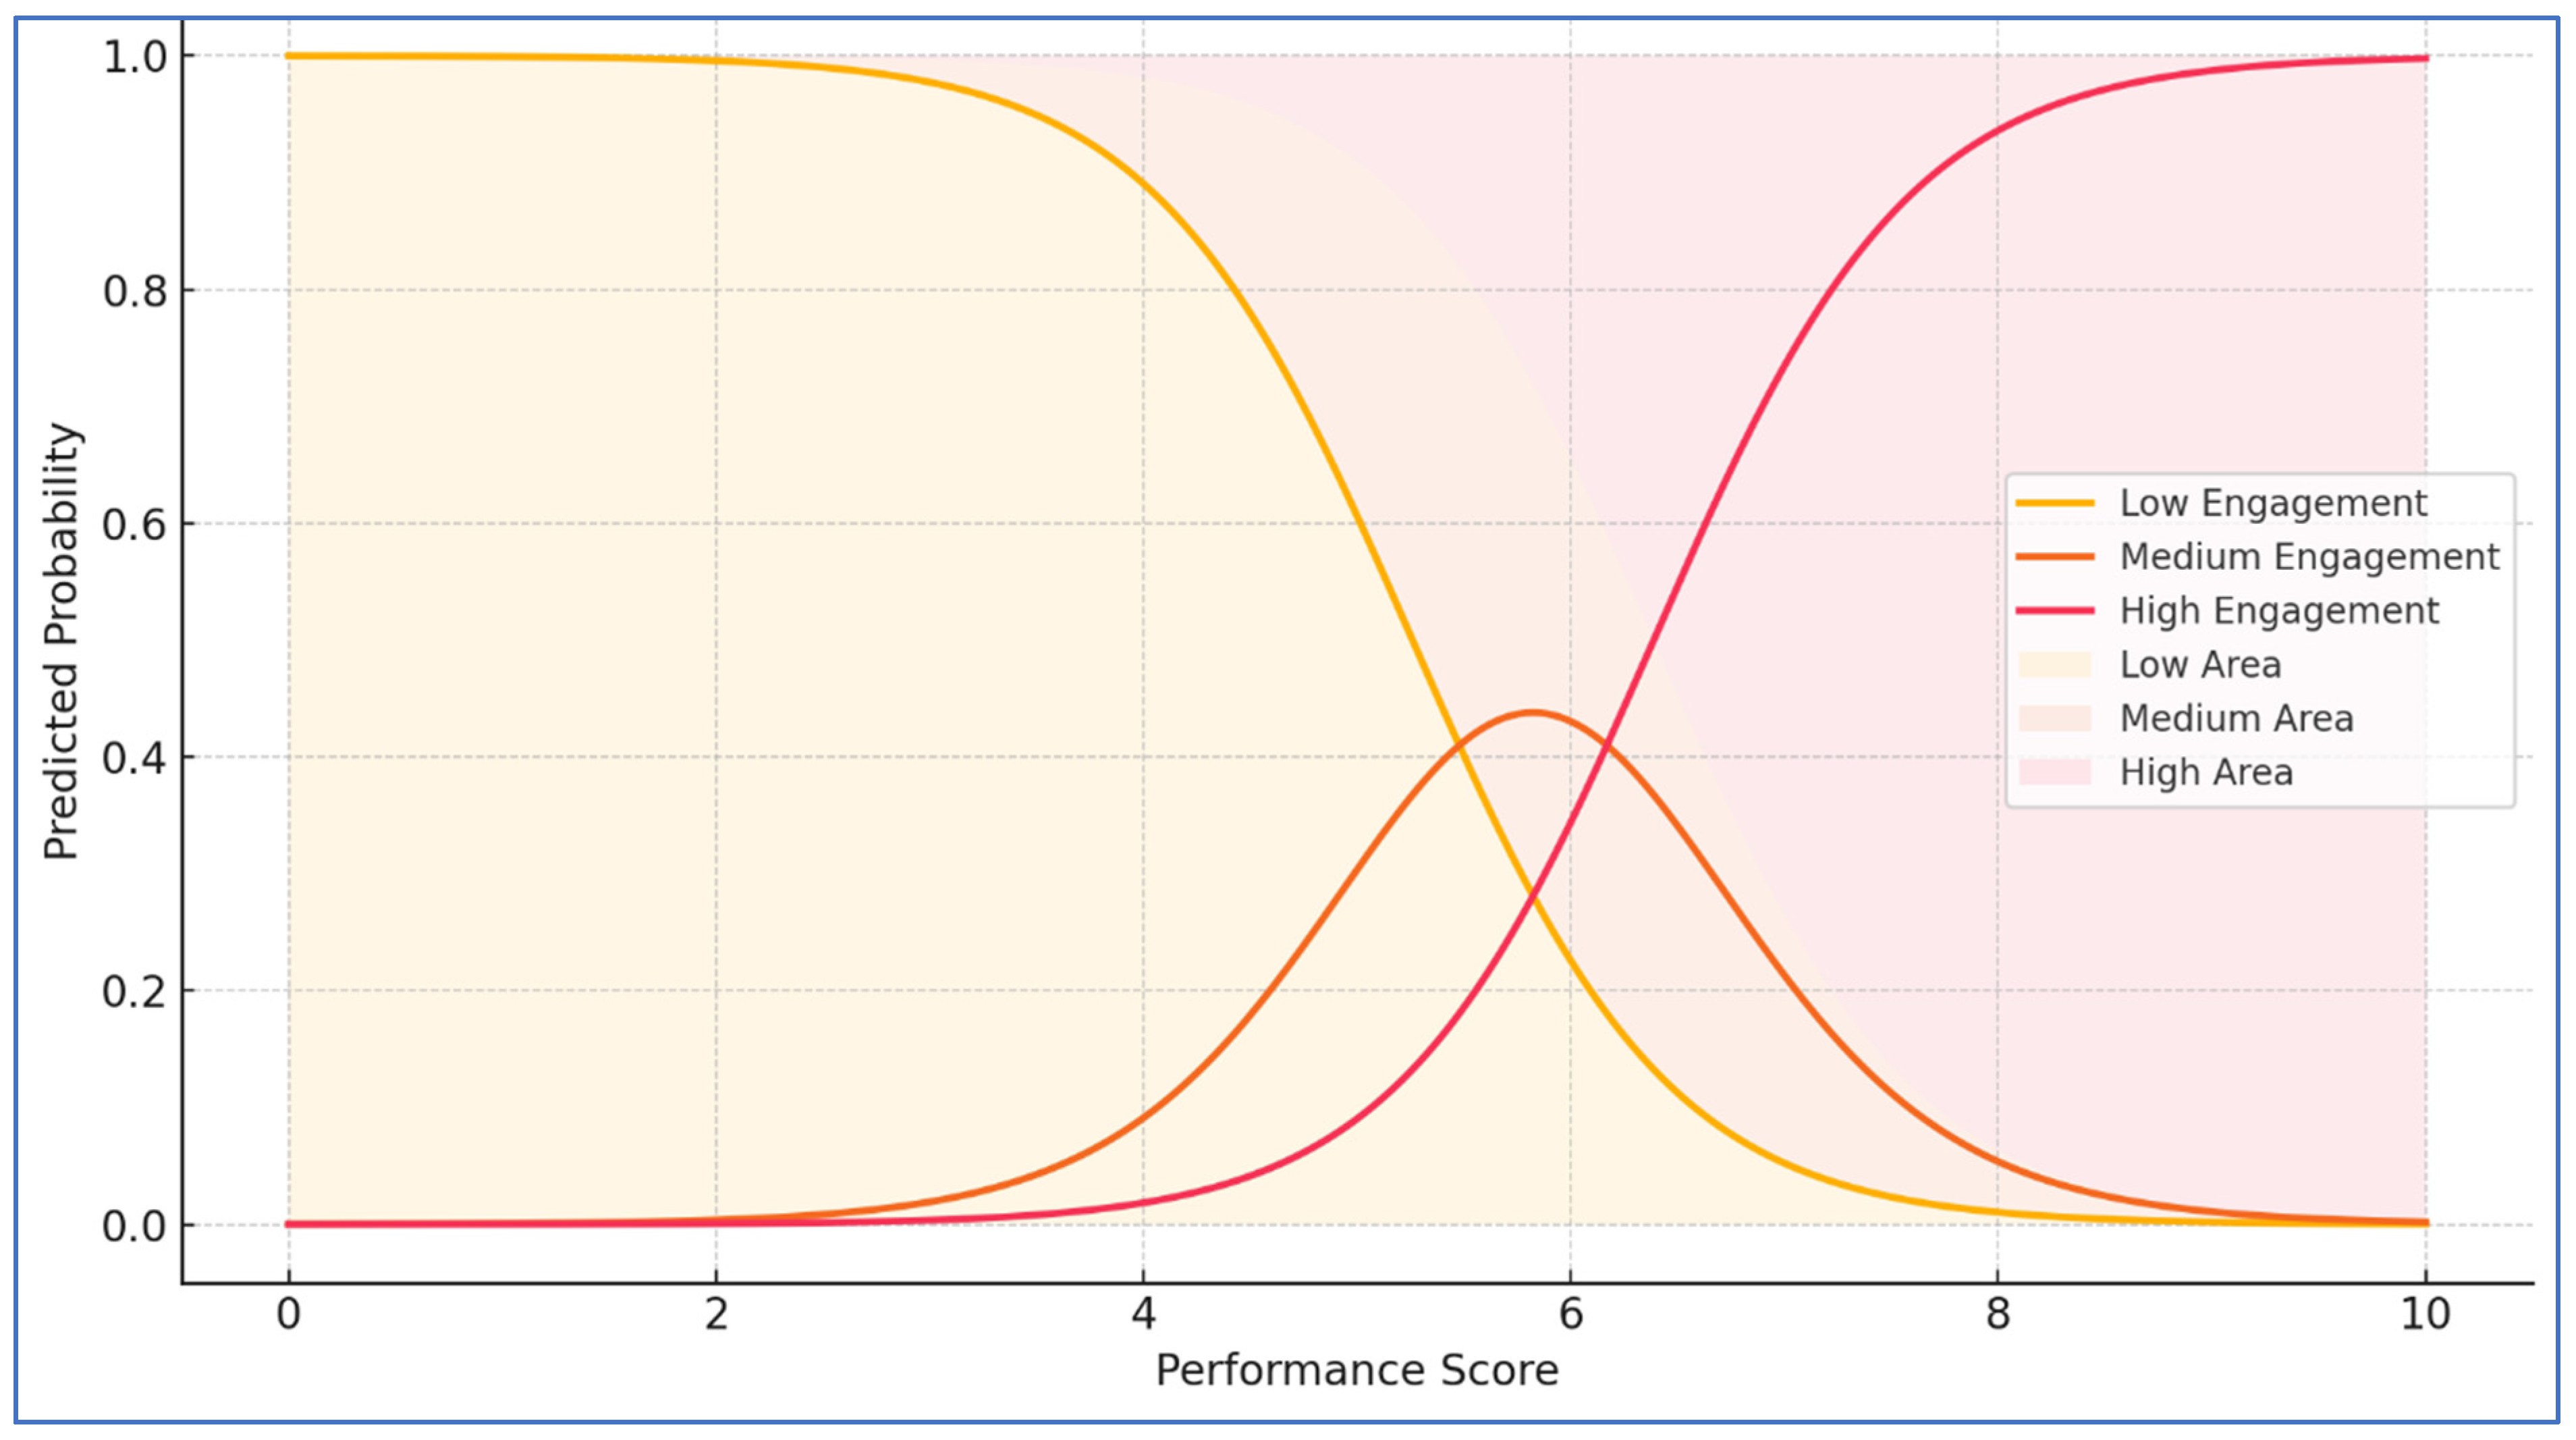
p < 0.001), suggesting that higher exam scores are strongly predictive of placement in higher engagement categories. The predicted probability plot derived from this model clearly delineates this relationship: students with lower performance scores (approximately 0–5) are predominantly classified as low engagement. In contrast, those scoring in the mid-range (~5–7) are more likely to be categorized under medium engagement. Students exceeding a performance score of ~7 demonstrate a markedly high probability of being identified as highly engaged. These patterns highlight the predictive utility of composite academic performance in estimating student engagement levels.
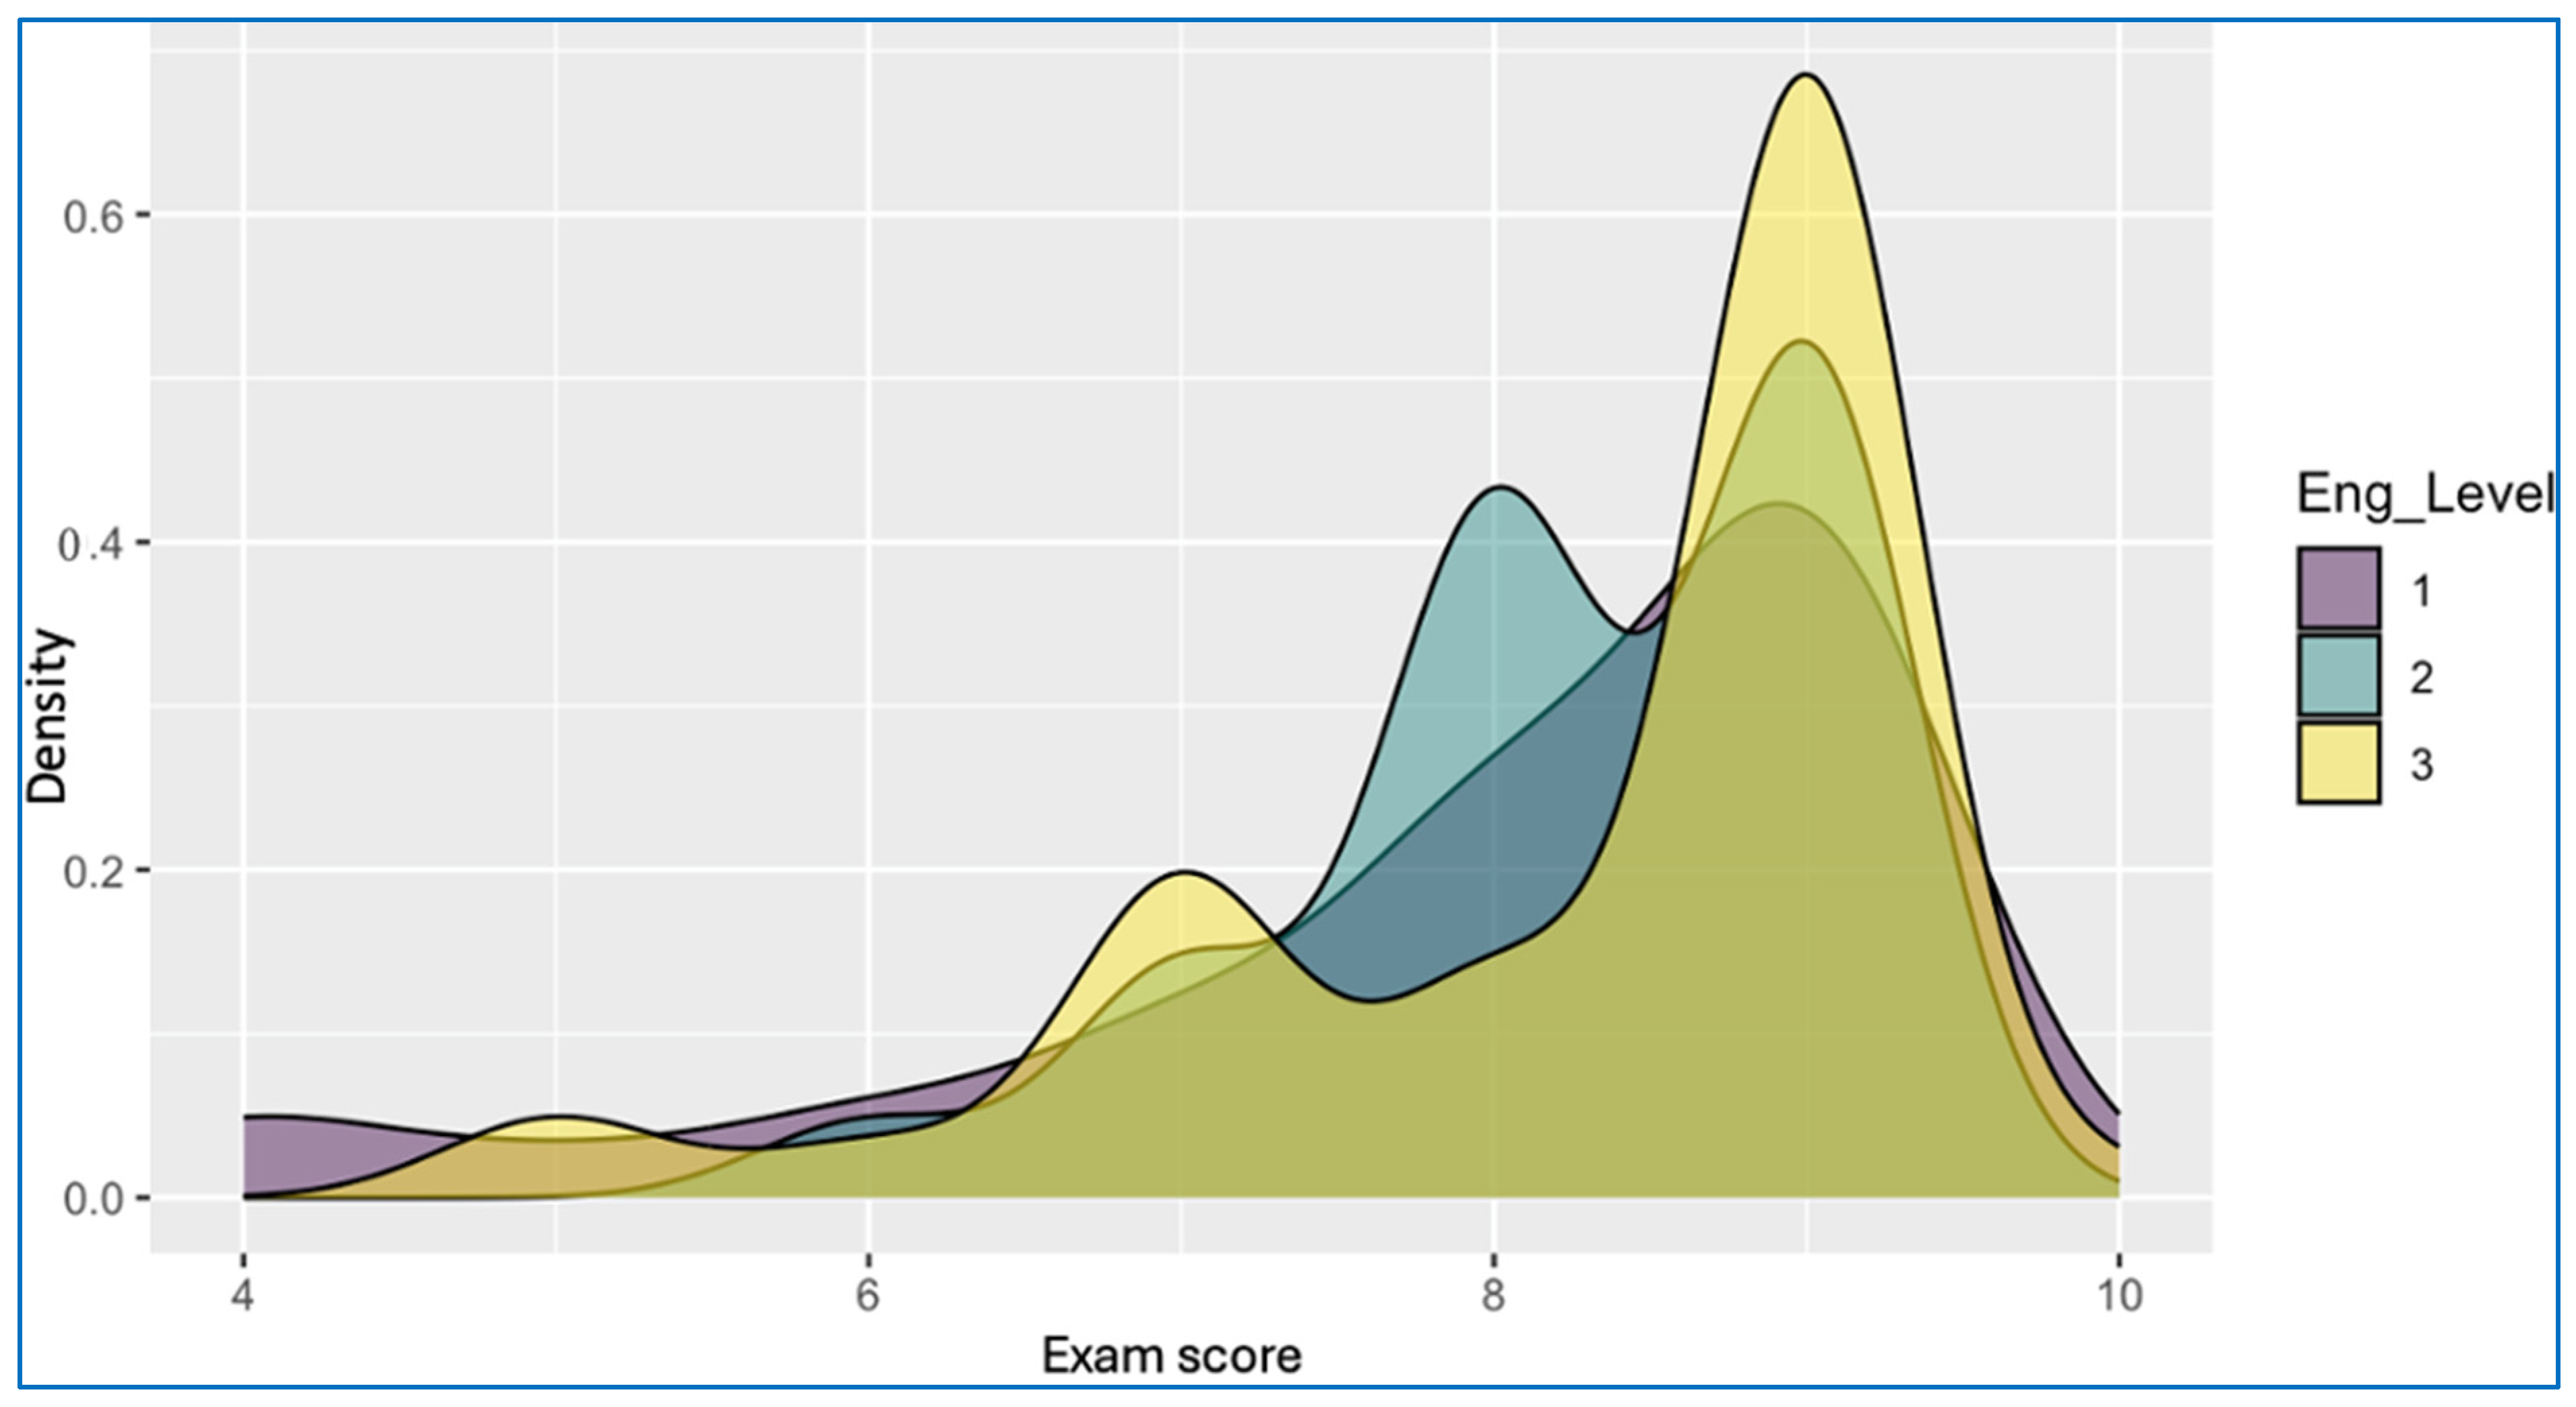
In addition, the density plot in
Figure 12 illustrates the distribution of exam scores across three engagement levels (coded as 1 = low, 2 = medium, 3 = high). The plot reveals a distinct trend: students with higher engagement levels consistently achieve higher exam scores. Engagement level 3 (yellow) is densely concentrated around the upper score range (8–10), whereas level 2 (teal) is centered at slightly lower values, and level 1 (purple) is broadly distributed with a skew towards the lower end of the score spectrum. The separation among these density curves reinforces the interpretation that engagement is positively correlated with academic achievement.
These findings are consistent with the growing body of research emphasizing the reciprocal relationship between performance and engagement. [
53] found that students who excel academically are more likely to demonstrate behavioral, emotional, and cognitive engagement. Similarly, [
54] in their study published in
Computers & Education, highlighted how learning analytics indicators such as grades, assignment submissions, and quiz results reliably predict long-term engagement, particularly in online and blended learning environments. The current analysis supports these conclusions, suggesting that academic performance is not only an outcome of student effort but also a meaningful indicator of deeper engagement and motivation within the learning process.
5. Discussion
5.1. Insights into Student Engagement Patterns
Applying K-means clustering utilizing Euclidean distance on Z-score normalized data is appropriate in our context due to the nature of the features and the moderate dimensionality (13 features). While Euclidean distance can degrade in extremely high-dimensional settings, our feature space does not exhibit such behavior. Standardizing each feature to have zero mean and unit variance ensures that each contributes equally to distance calculations, which helps mitigate the dominance of zero values that often appear in sparse interaction data [
40]. Furthermore, Euclidean distance enables direct comparison of absolute engagement levels week-by-week, which is crucial for capturing behavioral intensity in student activity profiles. In contrast, cosine similarity typically suited for high-dimensional textual data focuses on angular relationships and would under-represent actual magnitude differences in student behaviors [
55].
The three-cluster model developed in this study effectively identified distinct engagement patterns among students using only their weekly LMS activity. Students in the high-engagement cluster consistently interacted with multiple content types across all 13 weeks. Their participation was marked by elevated completion rates for assignments, active engagement in discussions and practical activities, and consistent utilization of lecture materials and digital resources.
In contrast, students in the moderate-engagement cluster exhibited more variable patterns. Their interaction was sporadic and uneven across different weeks and activity types. This group may benefit from intermittent support or nudges to stabilize their participation levels.
Students in the low-engagement cluster showed minimal interaction across the semester. Their limited engagement suggests either a lack of motivation, technical access issues, or misalignment with the course structure. The distinctiveness of these clusters supports the model’s internal validity and reinforces the argument for using unsupervised techniques to uncover emergent learning behaviors without instructor bias or performance dependence.
Furthermore, the analysis of engagement trends over the 13 weeks demonstrated that students’ interaction with content on the e-learning platform is dynamic rather than static. Engagement levels evolved in response to course progression, deadlines, or external factors. For instance, high engagement peaked in the early weeks but declined later in the term, while low engagement increased toward the end, particularly in weeks 6 and 13. These patterns underscore the importance of monitoring engagement longitudinally and adapting interventions to students’ shifting participation. Educators should remain cognizant of these evolving dynamics to identify critical periods or activities marked by reduced engagement and deliver timely, targeted support through appropriate instructional strategies.
5.2. Practical Applications for Instructional Support
This clustering framework is highly adaptable for real-time deployment in learning management systems. Because the model relies exclusively on LMS activity data such as quiz attempts, assignment uploads, and forum participation, it is compatible with widely adopted platforms like Moodle, Blackboard, and Canvas.
If integrated into instructor dashboards, the model could enable weekly engagement monitoring and automatic identification of at-risk learners. This functionality allows educators to deliver timely, targeted interventions, such as personalized messages, resource recommendations, or one-on-one consultations. To ensure successful implementation, institutions must ensure consistent data collection, timely syncing of activity logs, and instructor training in data interpretation.
Operationally, large-scale adoption would require a data pipeline that automates preprocessing, clustering, and visualization. Institutions must also account for possible data delays or tracking inconsistencies, which could affect accuracy if not managed effectively.
5.3. Linking Engagement with Learning Progress
Although the primary focus of this study was on clustering student engagement through LMS behavioral data, the resulting engagement profiles show a clear and empirically supported connection to academic performance. As outlined in
Section 4.6, students in the high engagement group consistently achieved better exam results compared to their peers. The ordinal logistic regression confirmed a statistically significant relationship between engagement levels and performance scores, with higher academic outcomes strongly associated with higher probabilities of engagement.
These findings are further supported by the predicted probability and density plots, which show distinct performance distributions across engagement categories. High engagement students were heavily concentrated within the upper performance range, particularly among those scoring between 8 and 10. This pattern suggests that engagement, when captured through consistent interaction with LMS components, reliably reflects student learning progress.
The correlation between weekly engagement levels and academic performance, as demonstrated through regression analysis, validates the behavioral model and highlights its practical implications. Specifically, this engagement–performance link strengthens the case for using the model as an early warning system for academic risk. Real-time monitoring of behavioral indicators allows educators to identify students in lower engagement categories and intervene with targeted, differentiated instruction before performance declines further.
These insights are consistent with prior research [
53,
54] which has shown that engagement is a strong predictor of academic outcomes. The current analysis adds to this body of work by demonstrating that LMS-derived behavioral metrics can effectively support predictive modeling and guide instructional decision-making in both online and blended learning environments.
5.4. Methodological Considerations: Clustering vs. Supervised Models
The current model uses unsupervised clustering to identify latent engagement patterns without relying on predefined categories. This approach is advantageous in that it reveals natural groupings based on behavior alone. However, supervised learning models such as decision trees, support vector machines, or random forests could potentially improve prediction precision if trained on historical engagement and performance data.
Comparing the unsupervised cluster labels to predictions generated by supervised models would clarify the strengths and trade-offs in each approach. Supervised models offer the ability to rank feature importance and provide probabilistic outputs, which may be more interpretable for educators. A hybrid approach could combine clustering to segment students and classification to assign likelihoods of disengagement or dropout, further enhancing early intervention capacity.
5.5. Future Research Directions
The use of K-means clustering in this study represents an application of unsupervised machine learning, a core technique within the broader field of artificial intelligence (AI). By grouping students based on behavioral similarity, the model identifies engagement patterns without requiring labeled data—offering a scalable and interpretable method suited for online learning environments. As noted in [
56], AI is increasingly being integrated into education to support key functions such as automated assessment, detection of learning gaps, student profiling, and personalized tutoring. In particular, intelligent systems enable the creation of digital learner profiles and personalized learning pathways, which improve not only educational outcomes but also accessibility for students with diverse needs. While our current model focuses on engagement clustering, future work may benefit from integrating deep learning architectures to capture complex temporal patterns or employing reinforcement learning to enable real-time adaptation of learning content. These AI-driven extensions would support the design of intelligent MOOC platforms that deliver personalized, responsive educational support at scale. In addition, this study opens multiple avenues for research expansion and applied innovation:
Longitudinal validation: Future work should examine whether early engagement clusters persist across the semester and whether they predict final grades or dropout rates. This would confirm the predictive value of early engagement monitoring.
Feature expansion: Incorporating demographic, motivational, and affective data—such as survey responses or sentiment analysis—could refine engagement categorization and improve interpretability. In addition, integrating behavioral quality indicators (e.g., time-on-task, depth of participation) alongside activity frequency may help better distinguish low-engagement students and enhance clustering effectiveness.
Cross-course and cross-institutional analysis: Testing the model across diverse course types (e.g., STEM vs. humanities) or institutional contexts would evaluate its generalizability.
Real-time deployment: The ultimate goal is to embed this framework into institutional analytics platforms. Custom dashboards should translate clustering outputs into actionable insights for educators, with weekly updates and suggested intervention strategies.
Ethical and pedagogical considerations: As predictive tools are deployed, research must also address questions of data privacy, algorithmic bias, and the psychological impact of labeling students as “low engagement.” Moreover, the very algorithms designed to identify patterns can, paradoxically, inherit and even exacerbate existing biases present in the training data [
57]. If historical educational data reflects societal inequities or skewed participation patterns, models can inadvertently amplify these biases, leading to unfair or discriminatory outcomes for certain student groups. The ethical implications of such biases in educational contexts are profound, as they can inadvertently reinforce stereotypes, limit learning opportunities, or perpetuate existing inequalities [
58]. This highlights an inherent tension between maximizing personalization and ensuring fairness and equity in algorithmic systems. Therefore, future research must prioritize the development of fair algorithms that are transparent, interpretable, and regularly audited for bias, emphasizing diverse data collection and robust evaluation metrics that extend beyond traditional accuracy to include fairness-specific measures [
59].
6. Conclusions
This study introduced a weekly engagement profiling framework for online learning environments using unsupervised machine learning. By applying K-means clustering to behavioral features derived from student interactions within a learning management system, the model successfully segmented learners into high, moderate, and low engagement profiles. Importantly, the clustering approach operated independently of academic outcomes or instructor-defined labels, ensuring scalability and broad applicability in real-time educational settings.
The three-cluster model demonstrated strong internal validity, achieving a silhouette score of 0.493 and an R-squared value of 0.80, reflecting well-separated and behaviorally coherent engagement groups. External validation further confirmed the reliability of the approach, with average classification metrics exceeding 88 percent in accuracy, precision, recall, and F1-score. These results affirm the model’s capacity to detect meaningful engagement patterns without requiring subjective input or final grade data.
In addition to its predictive robustness, the model revealed distinct behavioral signatures across engagement tiers. Highly engaged students exhibited consistent task completion and frequent interaction with diverse content types. Moderately engaged students displayed selective but regular participation, while low-engagement students engaged sporadically and irregularly. These differentiated profiles offer instructors actionable insight into evolving student behaviors and support timely, data-informed interventions. Importantly, the analysis also revealed that these engagement patterns are not fixed but shift over time, highlighting the dynamic nature of learner participation and the need for instructional approaches that adapt to these temporal fluctuations.
Importantly, this study demonstrated a statistically significant link between engagement and academic performance. As demonstrated by regression and distribution analyses, higher levels of engagement were significantly associated with better exam results, strengthening the validity of behavioral engagement as an indicator of learning progress. This correlation makes the engagement profiling framework a practical early warning system for academic risk, with direct implications for personalized learning and learner support.
This work advances the field by addressing limitations in prior research, particularly the reliance on static, self-reported, or end-of-course data. By capturing temporal engagement dynamics every week, the framework offers a foundation for continuous monitoring and more responsive pedagogical strategies.
Future work should enhance engagement modeling by incorporating demographic and affective variables, and comparing performance with supervised models to identify key predictors. Embedding the model in real-time dashboards can support early intervention. However, practical deployment must account for technical barriers like LMS synchronization delays, ethical risks such as stigmatization, and the need for privacy and fairness safeguards to ensure responsible and effective application.


