Article

FIGS: A Realistic Intrusion-Detection Framework for Highly Imbalanced IoT Environments

by
Zeynab Anbiaee
*,
Sajjad Dadkhah
and
Ali A. Ghorbani
Canadian Institute for Cybersecurity (CIC), University of New Brunswick, Fredericton, NB E3B 5A3, Canada
*
Author to whom correspondence should be addressed.
Electronics 2025, 14(14), 2917; https://doi.org/10.3390/electronics14142917
Submission received: 10 June 2025 / Revised: 14 July 2025 / Accepted: 16 July 2025 / Published: 21 July 2025
(This article belongs to the Special Issue Network Security and Cryptography Applications)

Abstract

The rapid growth of Internet of Things (IoT) environments has increased security challenges due to heightened exposure to cyber threats and attacks. A key problem is the class imbalance in attack traffic, where critical yet underrepresented attacks are often overlooked by intrusion-detection systems (IDS), thereby compromising reliability. We propose Feature-Importance GAN SMOTE (FIGS), an innovative, realistic intrusion-detection framework designed for IoT environments to address this challenge. Unlike other works that rely only on traditional oversampling methods, FIGS integrates sensitivity-based feature-importance analysis, Generative Adversarial Network (GAN)-based augmentation, a novel imbalance ratio (GIR), and Synthetic Minority Oversampling Technique (SMOTE) for generating high-quality synthetic data for minority classes. FIGS enhanced minority class detection by focusing on the most important features identified by the sensitivity analysis, while minimizing computational overhead and reducing noise during data generation. Evaluations on the CICIoMT2024 and CICIDS2017 datasets demonstrate that FIGS improves detection accuracy and significantly lowers the false negative rate. FIGS achieved a 17% improvement over the baseline model on the CICIoMT2024 dataset while maintaining performance for the majority groups. The results show that FIGS represents a highly effective solution for real-world IoT networks with high detection accuracy across all classes without introducing unnecessary computational overhead.

1. Introduction

IoT devices are widely used in daily life and often store sensitive personal information. IoT technology enhances convenience by interconnecting billions of devices while introducing significant security risks. These devices often struggle with resource constraints, such as limited processing power, memory, and battery life. Therefore, IoT devices prioritize power efficiency over security, resulting in significant challenges. To address this issue, simple security protocols and encryption methods are embedded in IoT devices, making them a popular target for cyber attacks [1].
Due to the rapid expansion of the IoT environment and simple security protocols, these systems are vulnerable to cyber intrusions. IDSs play a crucial role in maintaining the security of systems by detecting intrusions and threats. The performance and effectiveness of IDSs are hindered by the highly imbalanced nature of IoT traffic. This problem arises when certain types of attack are in the minority, resulting in high false negative rates and poor generalization performance in traditional IDS models [2].
IDSs are divided into two groups based on their detection techniques: signature-based and anomaly-based [3]. The signature-based method relies on the signature of traffic and known attacks, which can fail in the presence of new and unknown threats. This limitation can be addressed using the anomaly-based method, which uses machine-learning (ML) and deep-learning (DL) models and excels in detecting unseen attacks [4]. However, these models have an important bottleneck, which is the class imbalance problem in IoT datasets. Some types of attacks, such as DOS and DDOS, dominate IDS datasets, while some other important categories, such as Heartbleed, are underrepresented. This problem leads to biased models that fail to distinguish threats effectively [5].
The problem of class imbalance has attracted much attention, and many data augmentation and resampling techniques have been proposed. Traditional approaches, such as SMOTE, create artificial samples to balance the datasets; however, they introduce irrelevant noise [5]. GANs are also used for generating synthetic data, but their performance depends on some factors like feature selection methods [4]. The limitations of current augmentation techniques highlight the need for a novel approach that preserves data integrity, generates data based on critical features, and minimizes computational overhead for IoT environments.
Despite recent advancements in IDS, there are some challenges in handling class imbalance problems in IoT security. This study addresses the following questions:
  • How can we effectively identify and quantify class imbalance beyond traditional sample-based metrics to prioritize augmentation for high-risk attack categories?
  • How can feature selection be incorporated into data augmentation frameworks to ensure that synthetic samples maintain real-world attack characteristics?
  • How can we minimize the computational complexity of an augmentation framework to keep it lightweight while maintaining augmentation effectiveness?
Existing approaches suffer from feature-agnostic augmentation, excessive computational overhead, and a lack of prioritization for rare but critical attack types. To overcome these limitations and address the research questions, we propose FIGS, a realistic and effective IDS augmentation framework for highly imbalanced IoT environments. Our objective is to enhance the detection rate of minority classes while maintaining the detection rate of majority classes. Our method integrates:
The main contributions of our work are as follows:
  • Generalized Imbalance Ratio (GIR): A new weighted imbalance ratio method for class comparison in imbalanced datasets is proposed. Unlike the existing imbalance ratio that relies purely on sample count, GIR gives higher priority to higher-risk attack types. GIR considers the domain-specific importance of classes, which is particularly beneficial for imbalanced IoT environments where certain attack types are rare yet critical.
  • Feature Importance GAN (FIGAN): A new feature-aware data generation method by integrating GAN and feature-importance analysis for high-quality data augmentation. To the best of our knowledge, our model is the first to utilize the feature importance derived from sensitivity analysis in the combination of GAN for synthetic data generation.
  • Feature Importance SMOTE (FISMOTE): An efficient hybrid model is introduced that finds critical minority class features and synthesizes data for the extremely underrepresented attacks. By focusing on the most important features, our model avoids introducing noise, which is common in SMOTE-based frameworks.
  • FIGS: A realistic data-generating and resampling framework was designed to solve the class imbalance problem. Comprehensive evaluations done on benchmark IoT datasets CICIoMT2024 and CICIDS2017 demonstrate significant improvements (up to 17%) in detecting critical but rare attack classes while maintaining high accuracy for the other classes.
The rest of this paper is structured as follows: Section 2 reviews related works on class imbalance, mainly concerning IoT security. Section 3 provides an in-depth discussion of our motivation, including dataset challenges and introducing a new imbalance ratio. Section 4 explains our methodology, and Section 5 provides details about the implementation of FIGS. Section 6 presents the experimental setup and performance metrics. Section 7 discusses the evaluation results. Section 8 is the discussion about the advantages of FIGS and suggests directions for future research, and finally, we conclude the results.

2. Literature Review

IDSs are a vital component of IoT network security and play a crucial role in identifying malicious network activities. In recent years, various methods have been developed to improve the performance of these systems, and some of them have a special focus on solving the problem of class imbalance. This section provides an overview of the literature on intrusion detection while addressing the class imbalance problem.

2.1. Data-Generating Models

GAN and RNN models worked together according to Mishra et al. [6] to enhance detection system performance levels as well as anomaly identification capabilities. The researchers did not address the dataset imbalance, which reduced the reliability of their results for unbalanced datasets. Various research papers handle the class imbalance problem by creating artificial data samples. For example, Majeed et al. [7]. The system uses CTGAN to create selected minority class examples and the coin-throwing algorithm to reduce data noise, but their approach lacks a mechanism to prioritize feature importance, potentially generating inconsistent synthetic samples.
Rao et al. [8] present an imbalanced GAN approach to generate synthetic samples of the minority classes. They integrated an ensemble model combining LeNet 5 and LSTM to classify network traffic into various attack categories. Lee et al. [9] used GAN for generating data and RF for classifying and evaluating the effectiveness of the approach. Finally, Ali et al. [10] employed a GAN to create multiple fake classes and then assessed the performance on both the original and augmented image datasets.
Zhou et al. in [11] present a new method that uses AE to extract fault features from limited fault samples for the generator to create additional samples for training. The training of the generator is guided by fault features and fault diagnosis errors instead of the statistical coincidence of traditional GAN. Huang et al. in [12] proposed an imbalanced data filter and convolutional layers to the typical GAN to cope with class-imbalanced intrusion detection, using the instances generated by IGAN.

2.2. Data-Resampling Models

Traditional oversampling methods such as SMOTE [13], ADASYN [14], Borderline-SMOTE [15], etc., by interpolation between data generate synthetic samples for minority classes. Their important shortage is overlooking feature importance, which leads to the introduction of redundant data or noise that lessens performance. Some new works try to solve this problem. Abdelkhalek et al. [16] proposed a data-resampling technique that integrates Adaptive Synthetic Sampling (ADASYN) with Tomek Link undersampling to enhance the detection capabilities of NIDS. While the ADASYN enhances the model’s sensitivity to rare classes, the Tomek Link method reduces false positives (FP) by removing overlapping samples.
Alfrhan et al. [17] implemented SMOTE to improve the frequency of occurrence of minor classes. Thiyam et al. [18] created a combined model that unites SMOTE with Tomek–Links to manage class imbalance. The method generates synthetic minority samples and performs data cleaning through the removal of overlapping samples. The combination of SMOTE and Tomek–Links serves as an approach for handling the imbalanced datasets in big data environments, according to Al et al. [19].
Unlike SMOTE and GAN-based methods, FIGS provides a method that integrates the benefits of two approaches, first selects the most important features, and then generates data. FIGS ensures the provision of better presentations about the characteristics of underrepresented groups and generates higher-quality synthetic data without noise to reduce complexity and make it practical for IoT deployment.

2.3. Hybrid-Generating Models

Recent works try to integrate synthetic data generation and oversampling data to benefit both approaches. Wand et al. [4] proposed S2CGAN to augment data for minority groups. They split the dataset into different imbalanced levels and applied GAN and SMOTE. However, S2CGAN lacks feature sensitivity analysis, which leads to unoptimized feature augmentation. Cui et al. [20] proposed a feature extraction method based on stacked autoencoders to combine a Gaussian Mixture Model (GMM)-based clustering algorithm with a Wasserstein GAN. Their imbalanced dataset is divided into two parts. For the majority class, the GMM-based clustering algorithm is used to remove the redundant samples. For the minority class, GMM-based WGAN generates samples to expand the labeled sample set.

2.4. Non-Generating Models

Some works, such as Yazdinejad et al. [21], extract balanced data from the entire dataset and do not generate synthetic data. These studies eliminate consideration of rare groups by solely focusing on the existing available data. The research conducted by Altunay et al. [22] focuses on using LSTM and CNN for enhancing IIoT intrusion-detection capabilities by optimizing classifiers without augmenting data. Wu et al. established an IDS for the IoT through the integration of a meta-learning framework in their work [23]. Their approach provided solutions to address the problems of few-shot learning, which faces shortages where labeled data are scarce. The methodology utilizes a multi-stage attention Siamese network (MASiNet) as its core component for advancing intrusion-detection ability with limited training sample availability.
Table 1 presents a detailed comparison of the reviewed literature.

3. Motivation

The issue of class imbalance in IoT datasets leads to biased models that favor majority groups while struggling to identify underrepresented attacks. This challenge arises for various reasons, including the use of diverse devices and the heterogeneous nature of IoT environments, resource limitations, unbalanced real-world attack distributions, etc. Traditional IDSs fail to generalize a solution for these environments because they learn overrepresented classes of attacks and perform poorly for underrepresented ones. This problem should be addressed to ensure a secure and stable environment, preventing intrusion in vulnerable large-scale IoT networks. GAN-based augmentation can mitigate class imbalance, but existing methods generate data without feature relevance, resulting in noisy, low-quality samples. In addition, resampling methods do not learn attack behavior that reduces the robustness of models.
Identifying the most important features enhances both the generation process and the model’s performance. In our model, we use a novel feature-aware augmentation approach that uses GANs not only for data generation but also for feature selection. This approach ensures the production of meaningful synthetic data and prevents overfitting. Moreover, the GIR is introduced for dynamic and class-importance-aware augmentation that is more effective than traditional ones.
In this section, the details of the used datasets and the proposed GIR are provided to address the problem of class imbalance in IoT deployments.

3.1. Why FIGS?

The existing data augmentation techniques suffer from severe limitations:
  • Oversampling techniques such as SMOTE, ADASYN, etc., do not consider the feature importance and generate samples containing noise and irrelevant samples. Moreover, they do not learn the attack pattern effectively.
  • GAN-based data augmentation methods lack feature awareness, which results in generating low-quality data. Additionally, these models require high power, which is not suitable for resource-constrained IoT environments.
  • Although some models combine GANs with resampling methods, they still fail to find the most important features, making them computationally expensive and not practical for IoT deployment.
FIGS is proposed to solve the above problems:
  • Performs feature-aware augmentation by selecting the critical attack features for synthetic sample generation.
  • Using targeted GAN-based data generation, it produces high-quality synthetic data.
  • Improve the resampling method by FISMOTE and prevent noisy data.
  • Using the new GIR metric, FIGS can dynamically adapt augmentation strategies and be more effective than traditional models.
The enhancements provided by FIGS are summarized in Table 2.

3.2. Datasets

We conducted a comprehensive investigation of many datasets to choose the best for our work. Based on our research, some datasets were frequently used in the papers that addressed the class imbalance problem, and we provide details of these datasets in Table 3.
The CICIoMT2024 dataset [24] is a realistic benchmark for evaluating the security of Internet of Medical Things (IoMT) devices in healthcare environments. It consists of 9 million records, including 18 various attacks against a testbed of 40 IoMT devices (25 real and 15 simulated), considering common protocols in healthcare devices such as MQTT, WiFi, and Bluetooth. The attacks are categorized into five major categories: DDoS, DoS, Recon, MQTT, and Spoofing. This dataset uses real and simulated IoMT devices as attackers and victims and provides a robust platform for developing and testing IDS. By doing so, CICIoMT2024 fills the critical gaps in earlier datasets to reflect the dynamic and heterogeneous nature of IoMT environments.
To investigate the performance of this dataset, several ML and DL algorithms, such as Logistic Regression (LR), Random Forest (RF), Adaptive Boosting classifier (AdaBoost), and Deep Neural Networks (DNN), have been evaluated. Like other datasets, CICIoMT2024 presents the class imbalance challenge across its attack categories. Although this dataset includes a diverse range of attack classes, some of them, such as DDoS floods, dominate the dataset, and some others, such as ARPSpoofing, are significantly underrepresented.
We are the first to investigate the CICIoMT2024 dataset to examine the class imbalance problem. In fact, the CICIoMT2024 dataset was chosen for evaluating the FIGS because of its comprehensive nature for IoMT environments. IoMT environments are parts of IoT environments and overlap with them in terms of security challenges and resource constraint problems. This dataset has a broad range of attack types that make it suitable for investigating conditions in IoT environments. In contrast, the CICIoT2022 dataset reflects IoT profiling and is limited in scope in terms of attack diversity and distribution. The dataset does not provide a necessary range of attacks and malicious traffic required to evaluate an IDS, and instead targets profiling and behavioral analysis rather than attack assessment. The CICIoT2023 dataset introduces a larger number of attacks, but its attack distribution is more balanced compared to CICIoMT2024. Using CICIoMT2024 ensures that the proposed model is evaluated in realistic scenarios and increases its reliability for real-world IoT deployments. The class distribution and category distribution of the CICIoMT2024 dataset are shown in Figure 1 and Figure 2.
The CICIDS2017 dataset is widely recognized as a comprehensive and highly valuable dataset for IDS. One of its key strengths is the inclusion of various kinds of modern attack simulations. These are DoS/DDoS, Patator, Heartbleed, infiltration, web attacks, etc. This variety makes CICIDS2017 a robust dataset for training and testing, especially for the ML models that seek to identify different forms of intrusions. Because of the diverse attack types in CICIDS2017, this dataset is a good option that can perform well in real-world scenarios.
In terms of features, CICIDS2017 provides 80 features; some are related to low levels of network traffic, such as packet size and flags, and others are related to high-level features, including connection duration and source IP. This has made the dataset ideal for feature selection to ensure that only ideal features for intrusion detection are considered. The CICIDS2017 emulates real network traffic in a laboratory setting with both normal and attack traffic. This represents a real-world implementation since traffic flows with noise and anomalies must be processed in an IDS. On the other hand, other datasets, such as NSL-KDD, sometimes termed synthetic, cannot fully represent real traffic. Thus, for the IoT systems that may be connected with more extensive enterprise or cloud networks, such a realistic model of attacks makes CICIDS2017 an effective dataset for identifying network-based intrusions.
The size of CICIDS2017 is about 3 million records, which means that the dataset is not too small to train complex models, but also does not require significant computational resources. Finally, CICIDS2017 offers a meaningful starting point to test different ML/DL methods. RF, SVM, and DNN have been tested before on CICIDS2017; thus, it is a perfect platform for developing a practical IDS for various IoT applications. In this work, CICIDS2017 is used because it consists of real attack scenarios and non-malicious traffic, including brute force, DoS, DDoS, and infiltration. We divide this dataset into 8 main classes, including Benign, DoS, DDoS, PortScan, Patator, WebAttack, BoT, Infiltration, and Heartbleed. The class distribution of the CICIDS2017 dataset is shown in Figure 3.

3.3. Generalized Imbalance Ratio (GIR)

One of the biggest problems in the IoT IDS is the impossibility of reaching a high detection rate for all categories without threatening the detection rate of other groups. Traditional imbalanced metrics often fail to capture the importance of different attack types in many IDS cases. To address this problem, we define a new metric called GIR, which integrates sample counts and domain-specific weighting factors to improve imbalance assessments and identify the datasets’ imbalance rate.
Why is a new imbalance metric (GIR) needed?
The common class imbalance metrics, such as the imbalance ratio (IR), measure dataset imbalance solely with a simple sample count. Therefore, these methods face two main drawbacks for IoT security applications. The first one is, they assume all traffic classes have the same priority, which leads to augmenting data regardless of real-world concerns. Secondly, existing oversampling approaches treat all minority classes the same, while some of them are more critical than others. Additionally, GAN-based augmentation models do not prioritize rare but critical attacks and generate traffic for less relevant attacks.
The GIR metric addresses this problem by a dynamic weighting procedure that specifically focuses on important attack categories. The GIR operates differently from standard IR because the GIR allocates increased generation emphasis on attack types that represent higher security risks, which supports real-world IDS effectiveness through enhanced synthetic traffic generation. For example, if two attack types have approximately similar sample counts, but one of them has more attack severity, GIR ensures that the high-risk one gets more priority for augmentation.
Overall, GIR helps enhance IDS performance by:
  • Prevents over-augmentation of non-critical attack classes.
    GIR dynamically prioritizes the data generation process to give more focus to critical attacks.
    Without GIR, all minority classes are treated equally, leading to unnecessary augmentation for non-critical attack categories.
  • Helps to balance the datasets without compromising the detection rate.
    Traditional augmenting methods balance the dataset blindly and are prone to introducing noise and irrelevant data.
    By optimizing the augmentation data, GIR helps to improve the recall rate without distorting the dataset.
  • Improves model generalization for real-world IoT security.
    Most IDSs are biased in favor of majority groups and fail to generalize the imbalanced nature of IoT environments.
    Using GIR helps the augmentation methods, such as FIGS, to adjust data generation strategies and provide more resilient samples for unseen attacks.
Some recent research, such as [4,7,11,12,36,37], used IR for calculating the imbalance rate of datasets, but it solely focuses on the number of instances per class. Although IR is useful for understanding underlying class imbalance, it does not account for situations where the importance of classes is not simply a function of their size. By introducing weights, GIR allows for more accurate measurement and management of class imbalances. On the other hand, in many real-world applications, not all classes are equally important, and GIR allows us to prioritize some classes. A summary of using IR in various studies is provided in Table 4. One of the novelties of this paper is proposing a new metric for calculating class imbalance in imbalanced datasets, designed to quantify the degree of imbalance between classes in a dataset, especially when dealing with scenarios where the minority class is underrepresented. The formula for GIR is:
GIR = w maj × n maj w min × n min
where:
-
n maj : the number of samples in the majority class.
-
n min : the number of samples in the minority class.
-
w maj : the weight assigned to the majority class.
-
w min : the weight assigned to the minority class.
Table 4. Comparison of models for imbalance ratio.
Ref.Calculating Imbalance RatioConsidering Weight for Minority ClassConsidering IDSConsidering IoT
CTGAN-MOS [7]
Fault Diagnosis [11]
IGAN-IDS [12]
S2CGAN-IDS [4]
Improved SMOTE [36]
CIDH-ODLID [37]
FIGS
To calculate the GIR with weights, it is necessary to define the weights based on the importance of each class. We set:
  • w maj equal to 1 in order not to give additional weight to the majority class.
  • w min is higher, to give more importance to minority classes.
To reflect the critical impact of minority attack types in IoT security, we assign a higher importance weight to minority classes. Specifically, we set w maj = 1 and w min = 2, assigning twice the priority to minority attack types, based on the assumption that failing to detect rare attacks can result in disproportionately higher security risks. These fixed weights allow the GIR to not only capture imbalance based on sample count but also incorporate a basic form of risk prioritization, which is particularly relevant in anomaly-based IDS contexts.
After the GIR calculation, we categorize classes based on percentiles of the GIR values. This is a flexible way of partitioning the classes depending on their relative standing in the distribution of the GIR values. We used a percentile classification that divides the classes into three groups:
  • Plentiful Class: The GIR in this group is less than 33%; thus, the classes in this group are fine and have sufficient data and little imbalance.
  • Limited Class: This class represents the minority class, the GIR is 34% to 66%. This category of classes requires data augmentation to help balance the ratios.
  • Sparse Class: The GIR in this category is greater than 67% and revealed that the imbalance is the worst. This data scarcity will lead to some serious issues in the generation and classification models.
This percentile-based categorization enables us to employ targeted augmentation strategies for the mentioned groups and make sure that the model handles various levels of class imbalance. This approach helps to improve the overall performance and robustness of the IDS, especially for minority classes. We calculated the GIR for all the classes in all datasets and categorized them into three categories. The details are provided in Table 5 and Table 6. For the CICIoMT2024, the categories of the data were also considered to have a comparison between our model and the baseline for 6-class classification. So, the GIR values are calculated for this kind of data, and the details are provided in Table 7.

4. Methodology

This section focuses on our framework proposed for realistic IDS, which is illustrated in Figure 4. FIGS aims to boost the performance of intrusion detection on imbalanced datasets. In this regard, our framework consists of two different data augmentation methods for different data groups. The proposed framework includes data preprocessing, FIGS as the main module, and classifiers for evaluation of the model, which are detailed below. The framework first categorizes data using the GIR, extracts feature importance through discriminator-based sensitivity analysis, and then applies feature-aware augmentation techniques before final dataset integration.
The first step is data preprocessing, which is performed by checking for infinite and missing values and filling them with mean values. The data are then normalized, and the dataset is divided into training and testing datasets.
We classify the dataset into three subcategories according to GIR and use our model to generate synthetic data for minority groups. Our model is structured in two submodules: FIGAN and FISMOTE. Table 8 presents a comprehensive overview of recent models that have addressed the class imbalance problem, considering their method for feature selection. As far as we are aware, our model is the first to use the feature importance derived from sensitivity analysis in the combination of GAN and SMOTE for synthetic data generation. This innovative approach helps improve the performance of IDS in the IoT environment.
Finally, to evaluate the performance of our model, FIGS is applied to the training dataset to generate synthetic data. After that, we train several classifiers with the training set and record the results of the classifiers on the test set. It should be mentioned that to ensure the validity of the experiments, all the augmentation processes are done on the training set, and the test set is solely used for the evaluation.
To clarify the distinctiveness and uniqueness of the proposed FIGS framework, we compare it with three recent hybrid oversampling methods: FSGAN [38], KNN-GAN [39], and SMOTE-GAN [40]. Unlike these approaches, which are equally biased towards class imbalance and usually ignorant of feature relevance, FIGS introduces the GIR that incorporates both class distribution and domain-aware risk prioritization. This enables the selective generation of data for underrepresented but critical classes. Moreover, FIGS is the first model to incorporate feature sensitivity analysis in both FIGAN and FISMOTE components, ensuring that only the most important features are involved in synthetic data generation, while decreasing noise through zero-padding of irrelevant dimensions.
In contrast, FSGAN modulates signal generation through convolutional-style filters but lacks feature-level interpretability and is designed for time-series fault diagnosis rather than tabular IoT intrusion data. KNN-GAN restricts training samples via local density filtering but treats all features equally, while SMOTE-GAN refines SMOTE outputs using a GAN without any sensitivity or risk-guided selection. FIGS uses a tiered classification strategy of handling classes, such as Plentiful, Limited, or Sparse, and performs varying augmentation, which makes it applicable for deployment in resource-constrained IoT environments, representing an upstanding evolution over existing hybrid oversampling methods.

5. Implementation

FIGS consists of two submodules, which will be detailed in this section. We categorized the dataset into three parts: Plentiful, Limited, and Sparse. The number of Plentiful group samples is enough, and there is no need to generate any artificial samples. Therefore, these classes enter the training space without any change. Since the number of Limited attack examples is not large enough, the submodule FIGAN is used to find important features and then construct synthetic data to improve performance. Finally, submodule FISMOTE finds the most critical features for the Sparse group and creates synthetic samples for this category. At the final stage, the new augmented sets combine with the Plentiful set to generate the balanced dataset. In the following, more details about FIGS are presented, and the mathematical presentation is highlighted in Algorithm 1.
The structure of the feature space means that each augmented instance has the same feature representation as the original traffic. The feature set remains consistent across all parts of the dataset because FIGS employed a sensitivity-based analysis to find the critical features. Indeed, the FIGS uses the relevant features for generating data and sets non-relevant features to the value of 0 and maintains the features distribution. Therefore, the balanced dataset respects the original feature origin.
Algorithm 1 FIGS Framework for IoT IDS
 1:
Input: Original IoT dataset D
 2:
Output: Augmented training dataset D a
 3:
Initialization:
 4:
    Impute missing values and normalize features in D
 5:
    Split D into D t r a i n and D t e s t
 6:
Compute Imbalance:
 7:
    Calculate GIR on D t r a i n
 8:
    Categorize data as D P l e n t i f u l , D L i m i t e d , D S p a r s e
 9:
FIGAN Process:
10:
    Train discriminator D l on D L i m i t e d
11:
    Compute feature importance F l via perturbation.
12:
    Generate D L i m i t e d g e n using F l the generator.
13:
    Set non-important features to 0 to keep the feature distribution.
14:
FISMOTE Process:
15:
    Train discriminator D s on D S p a r s e
16:
    Compute feature importance F s via perturbation.
17:
    Apply SMOTE on D S p a r s e using F s D S p a r s e g e n
18:
    Set non-important features to 0
19:
Final Dataset:
20:
    D a D P l e n t i f u l D L i m i t e d g e n D S p a r s e g e n
21:
Evaluation:
22:
    Train model M on D a
23:
    Evaluate on D t e s t using performance metrics

5.1. Feature-Importance Calculation in FIGS

Feature selection is a key step in machine learning before training a model, which facilitates defining critical features. Indeed, feature selection simplifies the functions, leading to decreased complexity and increased performance. The discriminator, denoted by D, is a component in GAN that identifies real data from generated one. Feature selection is integrated with GAN to dynamically find the most important features based on the output variance from a discriminator and generate synthetic data. It works by evaluating how small perturbations in each feature affect the output of the discriminator. This sensitivity analysis helps to identify the features that have the most impact on the discriminator’s decision process. The importance I i of a feature i is calculated as follows:
I i = D ( x ) D ( x + ϵ · e i )
where D ( x ) is the discriminator output for input x , ϵ is a small perturbation and e i is the unit vector in the direction of the i-th feature. This method is useful to find which features the discriminator is most sensitive to. For each feature i, the importance score I i is computed over all samples in the training set and provides a global sensitivity score for each feature. This global ranking helps in the selection of top-N features in the dataset. This global approach ensures simplified feature selection while maintaining effective augmentation. While class-based feature importance could offer fine-grained control, for model simplicity and reducing computational overhead, we opted for a global ranking. This is important in IoT environments where there is a critical resource constraint.
After computing I i for each feature, features are ranked in descending order of their importance scores. The top-N features are selected based on empirical validation. Remaining features are set to zero in the synthetic sample to preserve feature vector structure and reduce noise. We chose perturbation-based sensitivity over SHAP or gradient-based methods due to its model-agnostic simplicity and low computational overhead, making it practical for IoT environments.

5.2. FIGAN

This section explains the details of the FIGAN submodule, which aims to produce samples for the Limited group by integrating GAN with a discriminator-based feature-importance mechanism for synthetic data generation.
Goodfellow et al. [41] introduced GAN as a powerful tool for generating realistic images. GAN tries to discover the data distribution and generate fake samples in a way that would not be recognized by a discriminator. GAN includes two competing DNNs, namely the generator and the discriminator. The generator tries to produce synthetic data that resamples real data and fools the discriminator. On the other hand, the discriminator tries to differentiate between real and fake data and provides feedback to improve the generator. Both networks improve through adversarial training to generate and evaluate synthetic data.
However, this method was not limited to image generation, and since then, this method has been expanded to other areas for data generation. Since this model created samples belonging to different classes without any control over the specific class, the CGAN method [42] was created to combine conditional information with the generator and intelligently create targeted synthetic data.
Our model uses a Conditional GAN (CGAN) integrated with an important feature selection method for generating targeted synthetic data. This helps us focus more on generating synthetic data and increases the robustness of our model in detecting anomalies. Feature selection reduces the complexity of the augmentation process by eliminating unnecessary computation for unimportant features and ensures our model is lightweight enough for IoT environments with resource-constrained problems. The model calculates the most important features and generates the synthetic data for them, and then unimportant features are set to zero to reduce complexity while ensuring feature space consistency across real and synthetic samples. Using FIGAN enhances the quality of synthetic data and guarantees that our model is optimized for real-world IoT applications.
The generator G receives a random noise vector z from a normal distribution. Then, the important features from the sensitivity-based feature selection are used for generating synthetic samples. Non-important features are set to 0 to keep the new sample aligned with the dataset and other categories. The discriminator D is trained to differentiate between real and synthetic instances. The high-quality generated samples are appended to the augmented dataset.

5.3. FISMOTE

Most of the time, when the number of samples is very limited, GAN fails to generate meaningful synthetic data. In this condition, the oversampling methods are beneficial and essential to provide a better representation of minority groups.
In this work, we propose a custom method for data augmentation using SMOTE, which combines feature importance to enhance the efficiency of the process and decrease the computational overhead. SMOTE is a popular approach for handling class imbalance by generating synthetic samples for minority groups. SMOTE interpolates between existing samples, selects random pairs of nearest neighbors from the underrepresented class, and creates new samples. Considering all the features equally leads SMOTE to have the potential for introducing noise if unimportant features are treated the same as important features. This paper proposes a novel methodology to focus SMOTE on the most relevant features recognized by a discriminator-based feature-importance calculator. By concentrating on the most important features, the model minimizes the risk of generating irrelevant or noisy synthetic samples, which often happens when SMOTE is applied indiscriminately across all features.
By sensitivity analysis, the discriminator identifies the most important features. Sensitivity analysis is carried out by measuring the impact of small perturbations on each feature’s output. Features that cause larger changes in the discriminator’s output are considered more important and ensure that the synthetic data generation process is targeted to critical features instead of treating all features equally. After calculating feature importance, SMOTE is applied to these features rather than to the entire feature set. This custom SMOTE approach generates synthetic data that better mimics the minority class. Avoiding unnecessary variance and noise helps to prevent overfitting and increases the effectiveness of the augmentation process.
Unlike traditional oversampling methods that feature selection techniques done as a preprocessing step, FIGS introduces a discriminator-based and class-specific feature sensitivity mechanism that is embedded into the augmentation process directly. Instead of applying global filters for feature selection, FIGAN and FISMOTE use a perturbation strategy that computes the discriminator’s output sensitivity to feature-wise changes. That will enable FIGS to learn features that are very discriminative of underrepresented classes so that the generator or the SMOTE mechanism can generate samples in the most informative subspace. Furthermore, the non-important features are masked during generation and interpolation to reduce distributional noise and avoid overfitting. This tight integration of feature importance with sample generation distinguishes FIGS from prior hybrid methods and facilitates high-fidelity augmentation under extreme class imbalance conditions, particularly in IoT intrusion-detection settings.

6. Experiment

6.1. Data Normalization

Data normalization is essential for neural network models because it ensures that the range of input values is consistent. Normalization allows faster convergence and speeds up the learning process. Large input values cause rapid updating of the weights, leading the training process to be unstable. Therefore, normalization reduces the probability of entering such values. Especially in models like GAN, stability can be a big challenge. In this condition, data normalization helps maintain a balance between the generator and the discriminator, leading to a more stable training process. Generally, normalization helps neural networks learn and converge faster and avoids problems with gradient updates. In our work, Min-Max normalization is used, which transfers the data to the range [0, 1] and increases the comparability and consistency of the features.
After the preprocessing stage, the dataset was randomly divided into training and test sets at a ratio of 8:2. Data balancing was applied only to the training set, and the test set was used just for the IDS evaluation. We calculated the GIR for all data categories and used a percentile-based threshold to categorize various classes. Table 5, Table 6 and Table 7 show the segmentation of our selected datasets based on GIR.

6.2. Evaluation Metrics

Since our work aims to reduce the false negative rate in the imbalanced datasets, we should concentrate on metrics that specifically account for false negatives. To this aim and to evaluate the performance of the proposed IDS, this work uses precision, recall, accuracy, and F1-score as evaluation criteria. These metrics offer a comprehensive evaluation of system performance.
The Matthews Correlation Coefficient (MCC) functions as a dependable evaluation tool for both binary and multiclass classifications, especially in datasets where other metrics like accuracy or F1-score prove inadequate due to class imbalance. MCC analyzes actual and incorrect assessment results through its negative-one to positive-one value scale, which indicates perfect prediction (+1) and random guessing (0), and complete prediction discrepancy (−1).
It is preferred to use MCC for IDS evaluation in IoT settings due to its performance not being affected by imbalanced class distributions because it produces a reliable assessment of IDS [43,44].
Mathematically, MCC is computed as:
MCC = T P · T N F P · F N ( T P + F P ) ( T P + F N ) ( T N + F P ) ( T N + F N )

6.3. Classifiers

In this article, several classifiers are employed to evaluate the effectiveness of our model in IoT environments. These classifiers include RF, Extreme Gradient-Boosting classifier (XGBoost), DNN, LR, and AdaBoost. At first, the model is trained by the augmented training dataset, and then the test set is used by the classifiers to reach the results.

6.3.1. RF Classifier

The RF algorithm [45] is a lightweight and strong supervised learning method that creates multiple decision trees. Collecting predictions from various trees can reduce overfitting in comparison to a single tree. RF is a very powerful method in the realm of feature importance, making it a useful method for our work [19]. By increasing the number of trees, the performance of the classifier improves, leading to higher performance and better prevention of overfitting, and making it an ideal classifier for various scenarios. In our work, the number of decision trees is set to 100 as the hyperparameter.

6.3.2. XGBoost Classifier

XGBoost is an efficient and scalable machine-learning algorithm that is used for classification. XGBoost can achieve excellent results in IDSs [46], particularly in imbalanced datasets. It provides a parallel tree that improves the model based on the errors of the previous trees, and it stands for its speed and performance. Since it has strong predictive power and low computational overhead, it is ideal for IoT environments.

6.3.3. Deep Neural Network Classifier

We also used a DNN classifier with an architecture that includes four hidden layers with 128 × 64 × 32 × 16 neurons. It employs the ReLU activation function, and the output layer is set to the number of classes. The DNN classifier is trained for 100 epochs. Finally, the Adam optimizer with a learning rate of 0.001 and cross-entropy loss is used.

6.3.4. Logistic Regression Classifier

LR is a simple and effective supervised learning algorithm that can be used for both binary and multiclass classification. It models the relationship between input features and the probability of each class and assigns the highest probability to the class. Because of its simplicity, it is commonly used in IDS.

6.3.5. AdaBoost Classifier

AdaBoost is an ensemble learning method that combines the predictions of multiple weak classifiers to create a strong classifier. It is appropriate for addressing imbalanced datasets since it assigns weights to samples and gives higher importance to those that were misclassified in previous iterations.

6.4. Experimental Settings

Our experiments were conducted using the PyTorch version 2.6.0+cu124 framework on the Google Collaboratory Pro platform with an NVIDIA A100 GPU (NVIDIA Corporation, Santa Clara, CA, USA). First, the datasets were preprocessed, and then they were split into two subsets: the training set and the test set. The data balancing is carried out on the training set, and the test set is reserved for the evaluation phase. Based on the GIR value, the data are divided into three subcategories: Plentiful, Limited, and Sparse. To maintain simplicity and reduce complexity and computational overhead, we refrain from generating synthetic data for the Plentiful groups. Instead, Plentiful data are directly added to the augmented training dataset. The Limited category attacks that present underrepresented attacks were processed using the FIGAN, and the Sparse attack groups were processed by the FSMOTE submodule.
In the CGAN architecture, the Gaussian noise vector is fed to the generator as input. To maintain simplicity, the hidden layer parameters of the generator are configured as (noise dimension) × 128. The activation function used for the hidden layer is ReLU. Moreover, by setting non-essential features to zero, CGAN just generated fake data for the indices of important features, which leads to minimizing the computational overheads. The output layer uses the Tanh activation function. We investigated various architectures and selected the simplest architecture that still yielded satisfactory results, so we ensured this model was sufficiently lightweight to deploy in IoT environments. Adding more layers to the generator not only does not gain good performance but also leads to the degradation of performance in some classifiers, particularly in DNN. Figure 5 illustrates the performance of the model across various architectures.
The discriminator plays an important role in the model since it has dual purposes: firstly, it identifies important features, and secondly, it acts as a discriminator in the GAN architecture to improve the generation of realistic synthetic data. Due to its critical responsibility, the discriminator’s architecture is more advanced and includes two hidden layers. This added complexity enables the model to more effectively differentiate between real and generated data, ensuring higher-quality synthetic data generation while focusing on the most significant features. The hidden layer of the discriminator is configured as 256 × 128, and the activation function used for the hidden layer is LeakyReLU. We also used a small slope (0.2 in this case) for negative input values that allows a slight, non-zero gradient when the input is less than zero. This slope prevents dying neurons, an issue that is often encountered with the standard ReLU activation function, where neurons can become inactive and stop learning. By allowing a small gradient, Leaky ReLU helps maintain gradient flow throughout the training process and improves the overall learning performance of the model.
To identify the most important features, it is crucial to find an optimal value for epsilon to perform a sensitivity analysis. This process involved testing various values of epsilon with the classifiers to find the optimal value. Analyzing precision and recall with different epsilon values (ranging from 10 7 to 10 3 ) reveals that 10 5 is the optimal value for further experiments. For the recall, both RF and XGBoost maintain stable high values near 1.00 across all epsilon settings, while DNN shows fluctuating performance with increasing epsilon. As shown in the Figure 6, recall peaks at 10 5 and then significantly drops at 10 4 . This trend shows that 10 5 provides the best balance for recall, especially for the DNN classifier. Moreover, RF and XGBoost maintain stable Precision near 1.00 throughout all epsilon values. The DNN reaches the lowest value and shows a notable dip at 10 6 but sharply increases and maintains around the best value, aligning with RF and XGBoost. The dip at 10 6 is made because this value introduces enough noise to disrupt the model’s learning. Still, it is not large enough to help the discriminator identify the features’ importance, and it leads to a dip in precision. Therefore, 10 5 is an appropriate value for epsilon because it maximizes recall without reducing precision, particularly for DNN by providing stability in performance metrics.
Understanding the dynamics between the generator and discriminator in a GAN during the training process is crucial. Suppose the discriminator loss is much lower than 0.5. In that case, the discriminator is too strong and easily distinguishes real from fake samples. Conversely, if the loss is much higher than 0.5, the discriminator is too weak to distinguish well. The generator aims to deceive the discriminator by producing data that the discriminator cannot distinguish from real data. Higher generator loss suggests that the generator is not yet fooling the discriminator effectively, and low generator loss means the generator is too strong to deceive the discriminator, which leads to the discriminator being too weak.
Ideally, the generator and discriminator should be balanced, and their loss should be around 0.5. Plotting both discriminator loss (d_loss) and generator loss (g_loss) against epochs provides brilliant insight into how well each component of GAN is training. This plot helps to understand model stability and decide on training duration. Figure 7 illustrates the training dynamics of GAN components by representing g_loss and d_loss across different epochs. Based on this insight, around 50 epochs, g_loss and d_loss converge to 0.5 and have the best results.
The experiments are conducted with different numbers of important features in both datasets. In CICIDS2017, the evaluations were done with three classifiers, RF, XGBoost, and DNN, on three classes of attack (Bot, Patator, and Web Attack) from the Limited category to highlight the impact of feature selection on model performance metrics: F1-score, recall, and precision. In CICIoMT2024, the evaluations were done with five classifiers, RF, XGBoost, DNN, AdaBoost, and LR, on the multiclass classification to indicate the performance of feature selection on metrics, including macro precision, macro recall, and macro F1-score. We want to show the balance between model complexity (number of features) and classification performance to provide insights for optimizing IDS. The results of different experiments by changing the number of important features are depicted in Figure 8 and Figure 9.
For the CICIDS2017 dataset, precision remains perfect for the Web Attack class in all experiments; in contrast, the Bot and Patator classes experience a decrease in precision with more features. This suggests that additional features introduce marginal noise, resulting in a small increase in false positives. The Web Attack and Patator classes exhibit stable recall and remain consistent across feature counts, showing that the number of features does not affect the model’s ability to detect true positives (TP). In contrast, the Bot class shows a noticeable decrease in recall, indicating worse detection of Bot attacks as more features are added. The F1-score remains stable for the Web Attack and Patator classes across most feature counts, indicating that increasing the number of features does not significantly impact its performance. The Bot class’s F1 score degrades as the feature count increases.
Analysis shows that increasing the number of important features leads to gradual improvements in performance in some classes. For Web Attack, performance remains stable across all feature counts, while for Patator, adding more features results in minor performance gains. Therefore, selecting between 25 and 35 features should provide a balanced trade-off between complexity and performance. Based on the results, the number of important features is assumed as 30 in our comparison experiments in the Evaluation section.
For the CICIoMT2024, the results in Figure 9 and the analyses suggest that selecting 10 important features leads to consistent and superior performance in all the classifiers. The RF and XGBoost have consistent and high precision in all evaluations. For other classifiers such as DNN, LR, and AdaBoost, the precision is at its highest for 10 important features and slightly declines by increasing the number of features. This trend suggests that increasing the number of important features introduces marginal noise and irrelevant attributes and decreases the ability of classifiers to distinguish patterns.
The recall is a crucial metric since it reflects false negatives and is important in this work. The analysis shows that 10 important features are good choices for recall since RF, XGBoost, and DNN have a stable recall in all tests, but other classifiers, such as LR and AdaBoost, have the best recall in 10 features and experience degradation with increasing features. The diminishing recall reflects that growing feature space introduces complexity in these classifiers. Similar results are seen for the F1-score metric, and it reveals that RF and XGBoost have stable and near-optimal performance regardless of feature count. Increasing the number of features deteriorates the performance for DNN and LR, so 10 features make a balance between maximizing relevant information and minimizing overfitting. Overall, a sharp decrease in the performance of AdaBoost is clear in the evaluations. This degradation in performance has come because of overfitting due to high complexity. AdaBoost heavily relies on assigning more weight to misclassified instances by increasing the number of features by which the model overfits the training data, especially if the added features introduce noise. Moreover, by increasing the number of features, the required computational and memory resources for each iteration increase, leading to suboptimal training and overfitting. Based on the results, the best choice for the number of important features for the CICIoMT2024 dataset in the evaluation is 10.

7. Evaluation and Results

In this section, we evaluate the performance of our method against other class balance algorithms and demonstrate its superiority in addressing class imbalance and detecting IoT security threats. We aim to highlight that our framework not only enhances performance but also reduces complexity and computational overhead. This comprehensive comparison demonstrates the advantages of our approach in effectively addressing the challenges in IoT environments.
To maintain the integrity of the evaluation without increasing performance, a strict 80–20 strategy was used, and the test set was isolated before any data augmentation. This ensures that no synthetic samples were present in the test set and eliminates the risk of data leakage. All performance metrics, including F1-score, precision, and MCC, were computed on this unseen test set to reflect generalization capability. Table 9 shows each step and how operations are constrained to the training set only. The test set remains completely unseen until the final evaluation phase, with no augmentation or feature-importance extraction performed using test data. This guarantees that the reported performance metrics reflect true generalization capability without contamination.
The preprocessed datasets were randomly partitioned into training and test sets, with 8:2 ratio. To address the class imbalance issue, the FIGS framework was used to generate synthetic data exclusively for minority classes in the training datasets. This approach ensured that the original distribution and integrity of the test data remained untouched, thus allowing us to perform a fair and unbiased evaluation of our models. This decision ensures the prevention of data leakage and preserves the generalization capabilities of our models. By only balancing the training data and strictly isolating the test set, our evaluation results reflect the true effectiveness of the IDS models trained using FIGS. Table 10 and Table 11 present the sample distributions of CICIoMT2024 and CICIDS2017 before and after using FIGS.
The CICIoMT2024 dataset is a new dataset, and FIGS is the first model to use this dataset to investigate the class imbalance problem. The effect of balancing the dataset using FIGS and generating synthetic data was investigated, and the performance results are presented in the figures and tables below. The first comparison is the binary classification for the baseline and after generating synthetic data for unbalanced classes. Table 12 shows the performance metrics for the comparison, and consistent improvement is observed across all metrics.
The results demonstrate that FIGS significantly enhances detection performance, especially for minority classes such as Recon-VulScan and Recon-Ping-Sweep. In the baseline setting, classifiers such as DNN and XGBoost exhibited a lower recall and F1-score due to limited training samples and unequal distribution between classes. For example, DNN has a recall of only 0.9231 for Ping-Sweep and a precision of 0.9608 for VulScan. After applying FIGS, all classifiers achieved perfect or near-perfect scores across all metrics, indicating the effectiveness of FIGS in improving the detection of underrepresented attack types.
Although RF generally performed well at baseline, FIGS significantly improved the robustness of DNN and XGBoost in all traffic categories. This enhancement is critical for IDSs deployed in unbalanced, real-world environments where minor attack classes may not be detected. The improvements observed suggest that FIGS effectively reduces model bias towards majority classes, enabling more reliable threat identification.
The high-performance metrics observed in this table, especially the F1-scores that are approaching 1.0, can be explained by the evaluation design that is based on binary classification tasks conducted per attack class. Under this configuration, each attack category is independently framed as a binary detection problem (attack and benign), rather than being evaluated under a multiclass configuration. This formulation inherently facilitates higher classification metrics, especially for well-separated classes such as TCP-IP DDoS and DoS variants, which exhibit distinct statistical patterns. When the FIGS were employed in generating synthetic samples for minority classes, there was great improvement in the generalizing capacity of the classifier on minority examples as well as a decrease in the number of FPs and FNs.
An MCC calculation is used to test the reliability and robustness of the proposed FIGS framework under binary classification. The performance evaluation of RF, XGBoost, and DNN models based on MCC measures presented in Figure 10, where per-class results demonstrated comparative assessment with baseline MCC values without FIGS implementation.
The experimental results confirm FIGS as an effective performance enhancement method that excels at detecting minority classes that usually disappear in imbalanced scenarios. FIGS boosted the MCC evaluation scores to reach perfect correlation (MCC 1 ) for certain attacks such as TCP-IP-DDoS-UDP, TCP-IP-DDoS-TCP, and Recon-VulScan, even though their baselines ranged between 0.86 and 0.98 across all three classifiers. FIGS improves classification performance and addresses class-majority bias by reflecting all confusion matrix elements (TP, TN, FP, FN), which makes it highly appropriate for imbalanced datasets [47].
XGBoost delivered the most reliable performance by demonstrating minimal variance in attack detection, while DNN gained maximum advantages from FIGS, especially for Recon-Ping-Sweep and Recon-VulScan attacks. These results validate FIGS’ capability to enhance reliable classification outcomes under serious data imbalance situations typical of IoMT intrusion contexts.
To further support the MCC-based evaluation, the confusion matrices for all three classifiers under both baseline and FIGS conditions are analyzed. FIGS framework significantly reduces both false positives and false negatives according to Figure 11 and Figure 12.
DNN started with moderate false positives (2738) and false negatives (42) before FIGS implementation made zero and 14 results, yielding a more reliable detection capability. The RF classifier achieves improved precision through FIGS because the framework succeeds in eliminating all false positive results. XGBoost shows the most reliable effectiveness since FIGS converted 20,157 false negatives to merely 12 instances, indicating robust recall without compromising its ability to identify correct patterns.
These improvements reflect FIGS’ ability to balance all components of the confusion matrix (TP, TN, FP, FN), which is particularly crucial in highly imbalanced IoT environments. The decrease of false negatives enhances the detection capacity of minority classes since they tend to produce incorrect classifications. Thus, confusion matrix analysis confirms that the proposed FIGS framework not only enhances overall classifier robustness but also ensures dependable detection across all traffic categories, even those traditionally underrepresented.
Since the results of the studies showed that the performance of this dataset for binary classifiers was close to optimal, in the subsequent studies, the performance of the dataset in multiclass classification was continued by considering the six existing categories. By examining the basic case in multiclass classification, it was found that the classifiers had a performance drop and were struggling with classes with few samples. After using the Figs model, a tremendous improvement in the results was observed. Additionally, we compared FIGS with DeepSMOTE [48], a deep learning-based oversampling method designed that aims to mitigate class imbalance by interpolating latent representations of minority class samples. While DeepSMOTE achieved improvements over the baseline, its performance consistently fell short when compared to FIGS, as illustrated in Figure 13. In this evaluation, for better comparison, we added LR and AdaBoost results. Table 13 shows the numerical value for all micro, macro, and weighted metrics.
Based on the results that are shown in Table 13, FIGS significantly enhanced the performance of all the classifiers compared to both the baseline and DeepSMOTE and achieved higher macro recall and macro F1-score. For example, the RF classifier has an increase in recall from 0.9379 in the baseline to 0.9449 with FIGS and F1-score from 0.9422 to 0.9525. Moreover, AdaBoost has a significant boost in recall from 0.7465 to 0.8545 and macro F1-score from 0.7748 to 0.8793. This pattern is consistent across DNN and LR as well, where DeepSMOTE offered marginal gains, but FIGS produced better performance boosts. These results validate the FIGS’s ability to outperform other oversampling methods like DeepSMOTE by generating higher-quality and more effective synthetic samples for minority classes.
The most significant enhancements are in classifiers with relatively lower baseline performance, such as LR and DNN. For LR, macro recall increased from 0.609 to 0.651, and macro F1-score from 0.6044 to 0.677. Indeed, LR had struggled with recall in the baseline, and FIGS provides critical improvements. Similarly, DNN, which had the lowest baseline recall at 0.7602, improved to 0.7695, and its F1-score increased from 0.7335 to 0.7742. FIGS also improved classifier accuracy; for instance, AdaBoost’s accuracy jumped from 0.7923 to 0.8368 with DeepSMOTE and to 0.9297 with FIGS. RF also saw a rise from 0.9938 to 0.9950 and then to 0.9978.
The evaluation results highlight the robustness of FIGS in enhancing classifiers’ performance under class imbalance, particularly when compared to DeepSMOTE. While DeepSMOTE provided incremental gains, especially in recall, it occasionally introduced instability or failed to improve precision and F1-scores. In contrast, FIGS consistently delivered superior and balanced performance across all metrics and classifiers. This suggests that FIGS not only improves general performance but also specifically targets and corrects deficiencies such as high false negatives in minority classes.
The performance metrics for all the categories are provided in Table 14. The detection rate of the ARPSpoofing category improves notably, and the recall shows consistent growth among various classifiers. XGBoost improved its recall from 0.68 to 0.72. These results show that FIGS enhances the ability of most classifiers to identify even Sparse categories of data by generating meaningful synthetic samples for these categories and reducing false negatives.
Some other categories, like DDOS and MQTT, as plentiful categories, have strong performance even in the baseline. For example, both RF and XGBoost achieved perfect scores of 1.0 in precision, recall, and F1-score for DDoS in both baseline and augmented datasets. This consistency highlights that FIGS maintained a high performance for well-represented categories while improving the performance of underrepresented categories. The Recon category shows meaningful growth with the LR classifier, particularly with the recall metric that increases from 0.4 to 0.5, and the F1-score increases from 0.52 to 0.64. Indeed, FIGS addresses the challenges that LR has with an imbalanced dataset by providing more training opportunities for LR to recognize patterns in the Limited categories.
Another important highlight is how FIGS balances performance across all classes. While DeepSMOTE sometimes boosted recall, it occasionally harmed precision or introduced instability that is particularly visible in AdaBoost’s performance on the ARPSpoofing class, where DeepSMOTE’s precision dropped to 0.90 and recall to 0.20, leading to a weak F1-score of 0.33. On the other hand, FIGS produces a balanced output and ensures robustness without compromising specificity. This consistency comes from FIGS’s ability to create realistic and structurally similar synthetic samples rather than interpolated embeddings.
The percentile improvements achieved through the FIGS model across all classifiers are gathered in Table 15. The key performance metrics for this table are accuracy, macro precision, macro recall, and macro F1-score, and the most significant improvements are highlighted. Based on the findings, AdaBoost exhibited the most significant improvements in accuracy (17.34%), macro recall (14.47%), and macro F1-score (13.49%). These significant enhancements result from several reasons. The first reason for this improvement is related to the inherent nature of AdaBoost, which creates a set of weak learners by assigning higher weights to misclassified examples in each iteration. This approach works well for standard datasets, but it suffers from performance degradation on imbalanced datasets because minority classes are less important due to their scarcity, leading to their neglect. By generating synthetic data, FIGS balances the class distributions, helping AdaBoost receive a variety of examples and focus equally on minority and majority classes during training, leading to a significant improvement in recall and a significant reduction in false negatives.
The second reason pertains to the nature of reweighting. FIGS provides a uniform distribution of examples from all classes and ensures that the reweighting process is not dominated by the majority class, thus improving AdaBoost’s performance. In addition, AdaBoost relies on weak learners, and these learners are exposed to noisy data. FIGS generates high-quality synthetic data that is closely similar to real minority class samples without introducing noise. Finally, the FIGS process directly targets false negative reduction, which is important for improving recall. Since AdaBoost emphasizes misclassifications during the iterative process, the additional minority class samples provided by FIGS allow AdaBoost to correct false negatives.
A critical challenge in most classifiers is addressing false negatives. XGBoost showed notable improvements in macro recall (15.57%) and macro F1-score (8.48%), indicating that FIGS can address this critical challenge. The increase in recall suggests an improved ability to correctly classify minority classes, a vital improvement for highly imbalanced datasets.
XGBoost is a gradient-boosting algorithm, and its performance is highly sensitive to the quality and distribution of the training data. FIGS provides a balanced training dataset by generating realistic synthetic samples for minority classes. This improved data distribution helps XGBoost to identify underrepresented classes more effectively, increases recall, and reduces false negatives. Moreover, XGBoost assigns higher weights to errors and misclassifications in subsequent boosting iterations. This enhances XGBoost’s ability to correct false negatives and leads to significant recall improvement.
The other classifiers, including DNN, RF, and LR, also showed improvements in their metrics, demonstrating the applicability of FIGS. DNN achieved a 9.19% increase in precision, signifying enhanced classification reliability. LR showed a balanced improvement across all metrics but has a special enhancement in the F1-score with 12.01%, highlighting FIGS’ role in bolstering performance. These results underscore the effectiveness of FIGS in improving classifier performance among a wide range of models and metrics. It also indicates that FIGS is successful in fulfilling its target of reducing false negatives and detecting minor but critical attacks.
To validate the performance improvements of FIGS, we employed McNemar’s test, a non-parametric statistical test, to assess the difference in classification based on the identical test sets. Unlike accuracy-based comparisons, the McNemar test specifically examines the pairs of mismatched points in which only one of the models has correctly classified or not. Thus, McNemar’s test offers a robust assessment of whether observed performance differences are statistically significant. This test was applied to compare FIGS with the baselines and DeepSMOTE on five classifiers.
The McNemar’s test results are summarized in Table 16 and show that FIGS achieved statistically significant improvements over both comparators (p < 0.05 for all tests). Specifically, the number of test samples correctly classified only by FIGS (b10) is significantly higher than those correctly classified by the baseline or DeepSMOTE (b01). While traditional performance metrics quantify these improvements in Table 15, McNemar’s test confirms that these observed differences are not accidental but represent statistically robust enhancements. These findings provide strong statistical evidence that supports the efficacy of FIGS in enhancing classifier sensitivity to underrepresented attacks, therefore addressing a critical limitation in imbalanced intrusion-detection systems.
To substantiate the lightweight nature of the proposed FIGS framework, we conducted a comparative evaluation against S2CGAN (a recent lightweight IDS that integrates GANs with resampling). Our evaluation focuses on two key aspects: detection performance and computational efficiency under varying data load conditions using the CICIoMT2024 dataset.
Figure 14a shows the training efficiency; FIGS achieves significantly lower training time compared to S2CGAN across all load settings. At full load, FIGS trains under 600 s, while S2CGAN exceeds 1100 s. This performance gain is attributed to FIGS’s targeted augmentation mechanism that generated synthetic samples just for minority classes and only on important features identified by sensitivity analysis. In addition, FIGAN uses a shallow architecture of hidden layers that reduces training overhead.
Meanwhile, Figure 14b presents the average recall achieved by FIGS and S2CGAN as the data set load increases. The recall metric was selected because of its relevance in intrusion detection, where minimizing false negatives and detecting actual attacks are important. FIGS consistently outperforms S2CGAN and obtains a 9.8% improvement in detection accuracy in comparison with S2CGAN. This demonstrates the robustness and high detection capability of FIGS, especially under high-volume, class-imbalanced intrusion scenarios common in IoT networks.
It is important to mention that the generation component in FIGS is used solely during training. During deployment, the model operates as a conventional classifier (e.g., XGBoost or RF), making inference latencies at the ms level that are compatible with real-time constraints in IoT environments. These findings show that FIGS offers a trade-off between accuracy and efficiency. Despite the integration of generative models, its selective design ensures reduced computational cost, rapid training, and real-time inference performance, making it practical for intrusion detection in resource-constrained IoT settings.
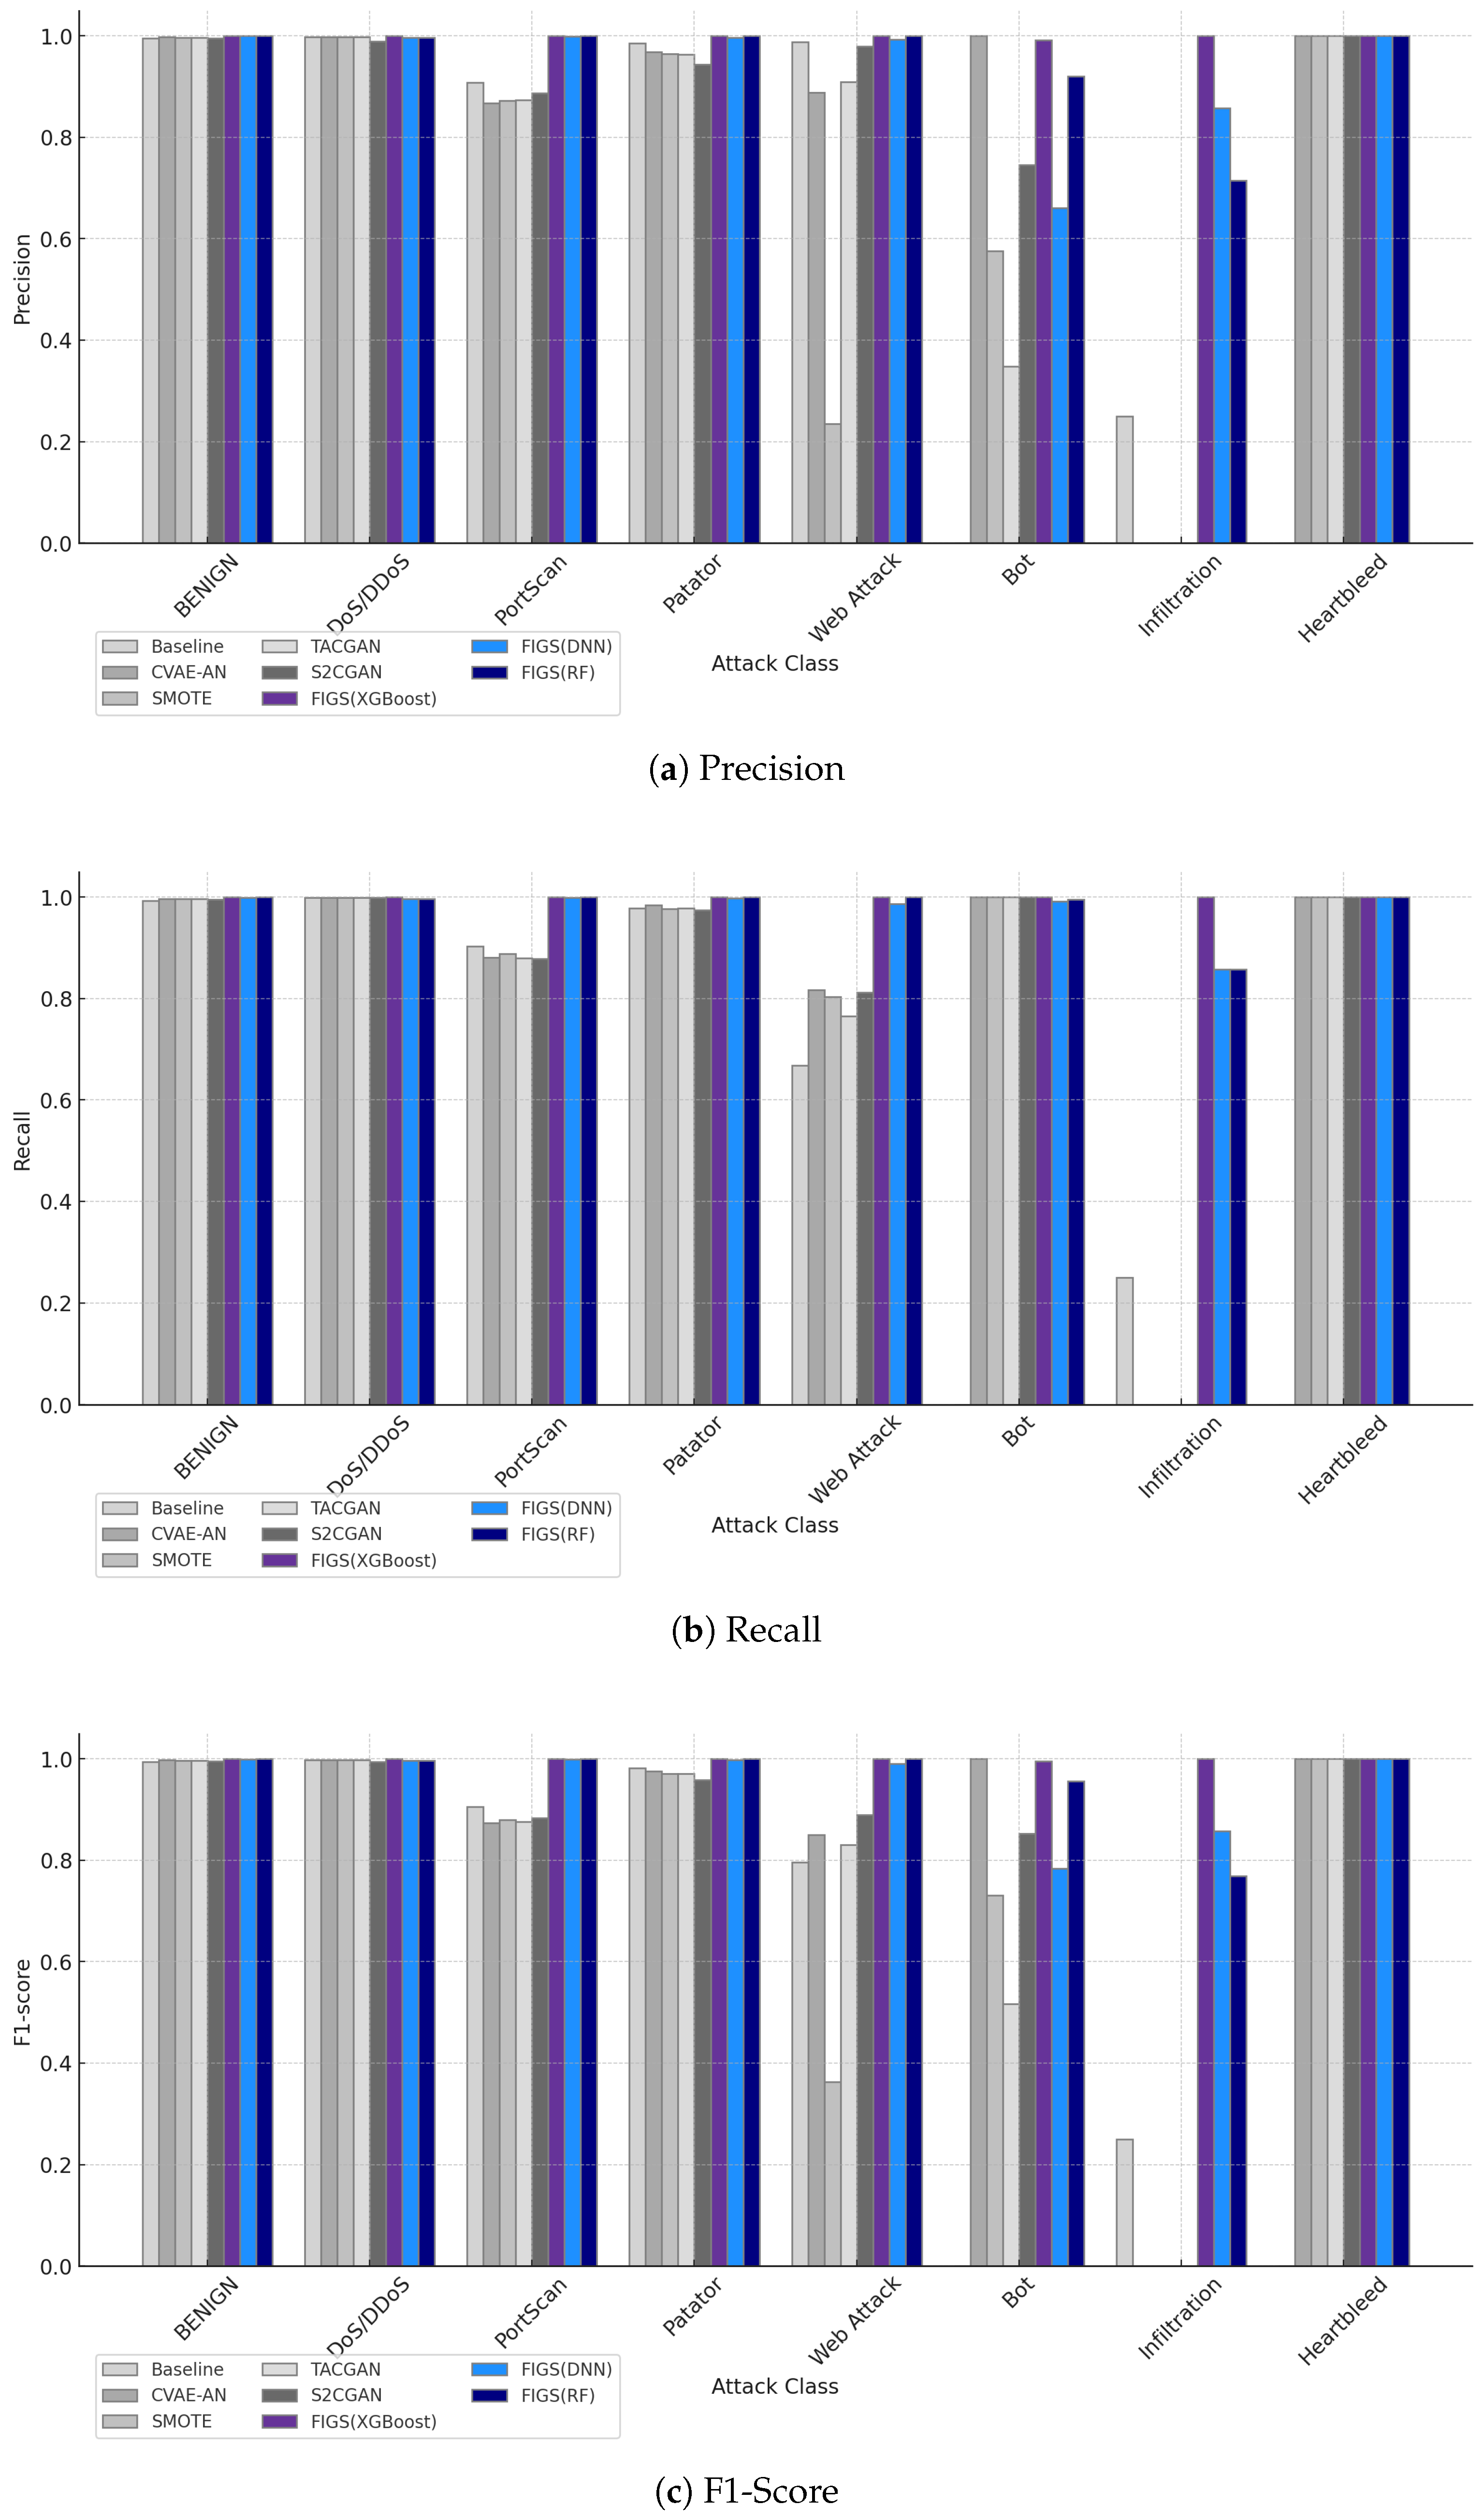
To validate the effectiveness of FIGS, we conduct extensive experiments on the CICIDS2017 dataset, comparing our method against three main categories of class imbalance handling techniques used in IDS research, including data generating, data resampling, and hybrid-generating models. The methods used for comparison of the CICIDS2017 dataset are as follows:
  • Baseline: It is the original dataset to which no data generation has been applied.
  • SMOTE: Tesfahun et al. [49] proposed utilizing SMOTE to tackle the class imbalance issue in ML applications. SMOTE generates fake samples instead of duplicating minority group samples by interpolating between minority class samples and their nearest neighbors.
  • CVAE-AN: Sabeel et al. [50] proposed the Conditional Variational Autoencoder Adversarial Network method (CVAE-AN) to address the challenges of the misclassification of uncommon attack flows in NIDS. This method uses adversarial incremental learning to enhance the detection rate of minority classes that are often ignored because of class imbalance. The CVAE module learns the distribution of attack features to generate new samples. The discriminator in the GAN module evaluates the synthetic data against real data to ensure that the model enhances effectiveness against various atypical attacks.
  • TACGAN: The TACGAN model presented by Ding et al. [39] integrates undersampling and oversampling methods in GAN to address the challenge of class imbalance in IDS. It uses KNN to undersample the majority class and reduce redundancy without loss of information. It also utilizes GAN to oversample the underrepresented classes of attack to rebalance the class distribution.
  • S2CGAN: Wang et al. [4] proposed S2CGAN as a hybrid model that combines GAN with a focus on both data space and feature space. It uses Siamese networks and an autoencoder for feature extraction in scarce data groups and feeds them to CGAN to generate new samples. In the meantime, it leverages a variant of the SMOTE algorithm with K neighbors to address the challenges posed by rare-level attack categories in IoT networks.
  • FIGS: Our proposed model in this paper.
The detailed findings are recorded in 
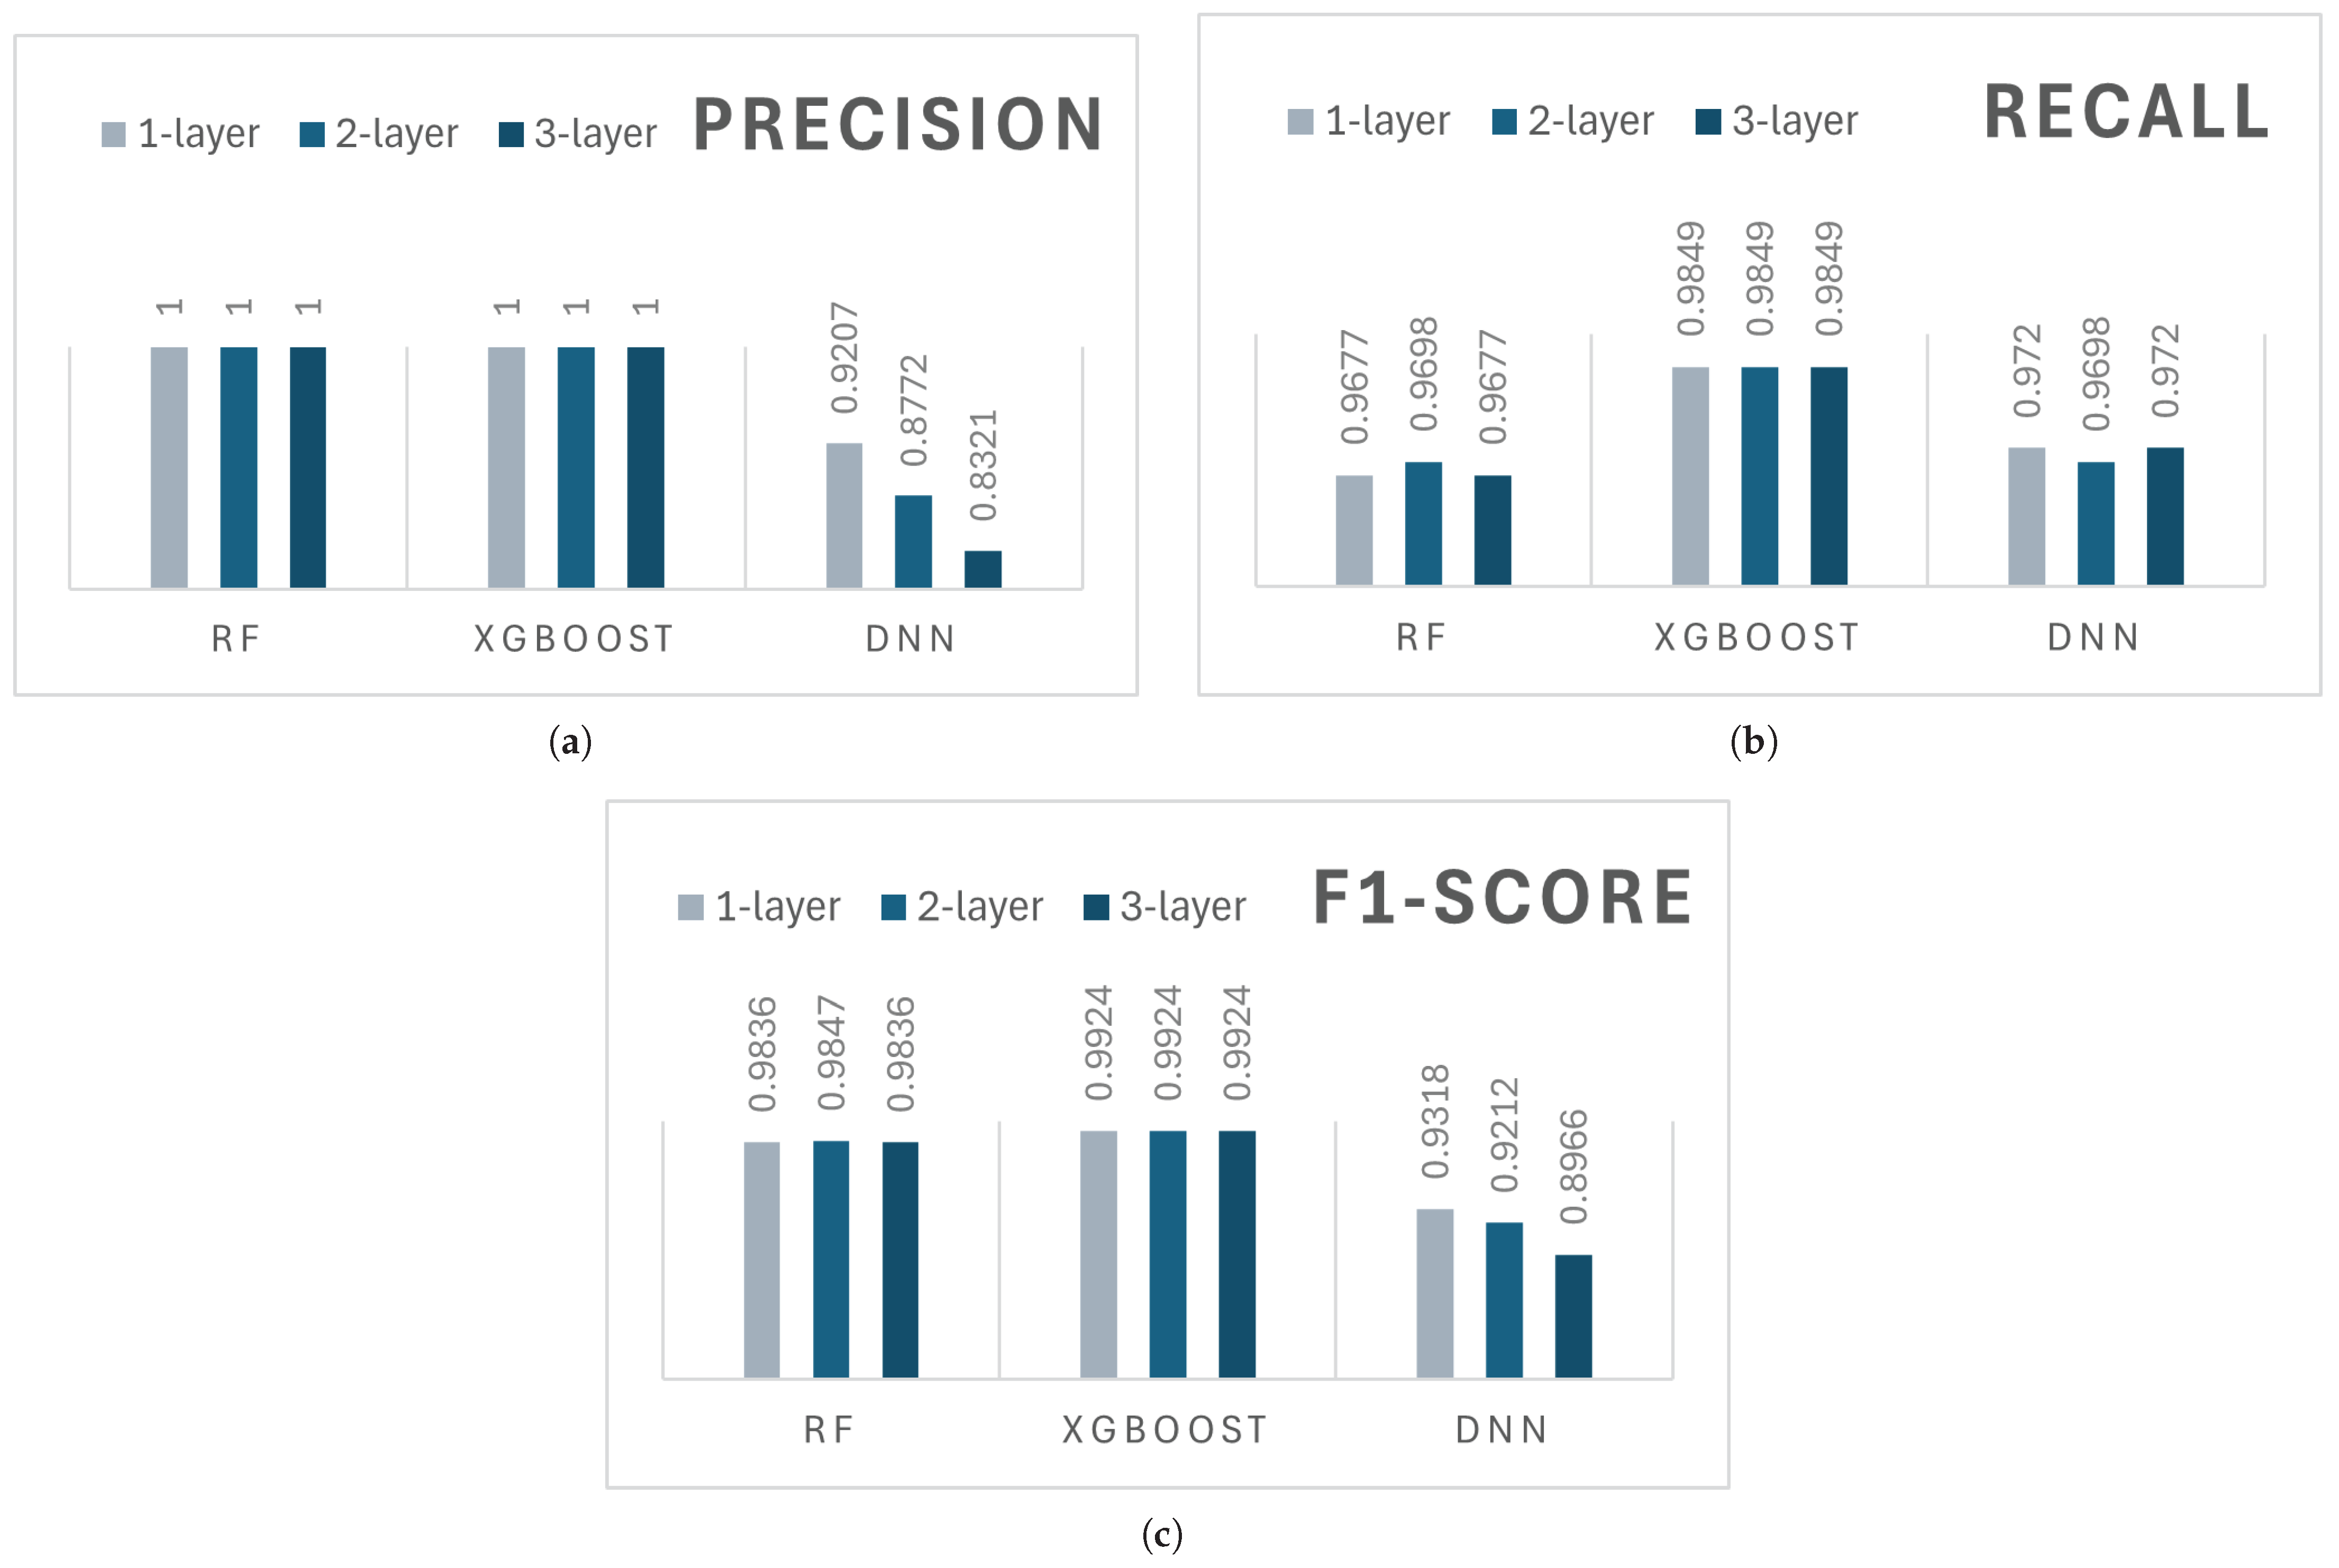
Table 17. This table gives a detailed overview of the results obtained from evaluating five state-of-the-art algorithms with a DNN classifier and our model with RF, XGBoost, and DNN classifiers separately. Moreover, Figure 15 depicts the precision, recall, and F1-score in different classes.
The results clearly show that FIGS consistently outperforms or matches the best existing methods, especially in detecting minority attack classes while maintaining strong performance in Plentiful categories. For Plentiful groups that have sufficient data, such as DoS/DDoS, FIGS performs similarly to other models. As depicted in Figure 15, FIGS, similar to other methods, reaches nearly perfect precision (1.00). This confirms that our model, as well as some state-of-the-art methods, manages attack classes where data imbalance is not a concern. In addition, unlike some other models such as SMOTE and CVAE-GAN, FIGS maintains sturdy performance in these Plentiful categories without introducing unnecessary complexity and extra computation overhead.
In Limited-level attack categories, such as Web Attack and Bot, FIGS demonstrates clear superiority, and for the Patator class, other models also have good results, but FIGS reaches better results near 1.00. The experimental results underscore the exceptional performance of FIGS in the BoT class of attack, while other models encounter challenges. Although some methods, such as TACGAN and CVAE-AN, show high Precision, they fall short in recall and F1-score. This reveals their inability to adequately detect true positive instances of the BoT class, leading to unreliable performance in real-world applications. In contrast, our model achieves a perfect score across all the metrics, demonstrating its robustness and reliability in identifying the BoT class. This improvement is crucial, as it demonstrates FIGS’s ability to generalize better and reduce false negatives in Limited attack detection. While methods like SMOTE and CVAE-GAN show moderate gains in these categories, FIGS stands out by delivering more consistent and reliable results.
As highlighted in Table 17, other models struggle with Bot attacks, but FIGS, especially with XGBoost and RF classifiers, outperform in all the evaluation metrics. Although some models, such as TACGAN, achieve good precision, they fail in the recall and show bad results, which leads to their low F-score. Our model improves all metrics, indicating our model’s balancing performance and robustness. By investigating the results, we find that other models may avoid false positives but fail to capture enough true positives. This demonstrates that FIGS is the most reliable model for detecting BoT attacks.
The other advantages of FIGS are evident in the Sparse-level attack categories, such as Infiltration and Heartbleed. These attack types, characterized by extremely rare data, are challenging for most algorithms. In the Infiltration category, FIGS achieves near-perfect recall and F1-score (1.00), where baseline methods and even advanced techniques like TACGAN fail to perform adequately. This highlights FIGS’s unique capability to generate meaningful synthetic data in environments with severe data scarcity, a critical feature in IDS.
The good performance of the FIGS model in the Heartbleed class is due to the model’s effective use of advanced resampling techniques. Traditional models often struggle with Sparse classes. However, FIGS overcomes this problem by combining feature-importance-based selection with artificial data generation methods. This approach tries to make the synthetic samples for the Heartbleed class match the real data. The validation process confirmed that FIGS’s strong performance in Heartbleed was not just a fluke. For this reason, our model improves the reliability of the results even for highly unbalanced classes.
FIGS has one major advantage compared to other methods: it outperforms the Limited and Sparse categories and is on par with the Plentiful categories. Finding critical features and combining data augmentation enables FIGS to overcome the flaws of the oversampling techniques, such as SMOTE, which may introduce noise and redundancy.
The MCC analysis of the CICIDS2017 dataset confirms a comprehensive view of classifier reliability across different attack situations. As illustrated in Figure 16, the FIGS model maintains superior MCC values for all attack types in comparison with the baseline model. Significantly, notable improvements are observed in previously underperforming classes, such as Bot and Infiltration. For instance, the baseline MCC for Bot detection was approximately 0.61, proving poor performance because of class imbalance, while FIGS increased this metric to over 0.80 by DNN and close to 0.99 using XGBoost. These results demonstrate that FIGS significantly improves the classification capability for the different attack types. Similarly, infiltration improved from baseline values below 0.86 to values above 0.92 with FIGS-enabled classifiers.
FIGS proves effective for fighting bias caused by class imbalance because it strengthens recognition of real positives while preserving accurate false positive identification. Moreover, similar performance among the RF, XGBoost, and DNN under FIGS highlights the framework’s generalizability across learning methods. These findings underscore the value of MCC as a stability-aware evaluation metric in imbalanced network intrusion-detection contexts.
FIGS proves to be stable and accurate among all the data imbalance levels and offers better computational efficiency. It not only outperforms the previous methods but also detects the minority attacks clearly, making it a possible solution for real-world IDS where data imbalance is an issue.

7.1. FIGS Complexity

Computational efficiency for FIGS is evaluated to validate its effectiveness compared to conventional data augmentation methods. FIGS achieves optimization of augmentation through its feature-importance selection process, while traditional IDS models analyze the entire feature space. FIGS’ operational complexity across all stages is provided in the following.

7.1.1. Feature-Importance Calculation (Sensitivity Analysis)

Each feature x i is perturbed and evaluated through the discriminator D.
Complexity:
O ( N × F )
where:
  • N = number of training samples
  • F = number of features
Since only a subset of features is used, F is a small and constant value, and the complexity in this stage is O ( N )

7.1.2. FIGAN Complexity

GAN training involves updating the Generator (G) and the Discriminator (D) iteratively.
Complexity:
O ( E × B × ( F selected + L D + L G ) )
where:
  • E = number of epochs
  • B = batch size
  • F selected = number of selected important features
  • L D , L G = number of layers in D and G
The number of epochs, batch size, number of selected important features, and number of layers in the discriminator and generator are all finite values and constant, so the final complexity for this step is O ( 1 ) .

7.1.3. FISMOTE Complexity

Complexity:
O ( N m × k )
where:
  • N m = number of minority class samples
  • k = number of nearest neighbors
The number of nearest neighbors is constant, and N m is typically much smaller than N. In the worst case, if all minority samples are augmented, N m can be at most proportional to N. Therefore, the complexity in this stage is O ( N ) .

7.1.4. Final Complexity Expression for FIGS

Summing all dominant terms:
O ( N ) + O ( 1 ) + O ( N ) = O ( N )
Thus, FIGS has an overall complexity of O ( N ) , indicating that it scales linearly with the dataset size. This confirms FIGS as a computationally efficient framework, as linear time complexity is ideal for handling large-scale IoT datasets. By leveraging feature-aware augmentation strategies, FIGS optimizes data generation while maintaining minimal computational overhead. These efficiency gains make FIGS highly suitable for real-time IoT security applications where computational resources are limited.

8. Discussion and Future Work

IDSs should handle important concerns of scalability and generalization in IoT environments with diverse attack types. In this study, FIGS was evaluated with two benchmark datasets, including CICIDS2017 and the newly introduced CICIoMT2024. FIGS illustrated its adaptability in different IoT network structures and real-world traffic scenarios with different attack distributions. The obvious improvements in detecting attacks, especially for underrepresented attacks in both datasets (Table 13, Table 15, and Table 17) prove FIGS’s generalization in different datasets.
Unlike traditional methods that require extensive computational resources, FIGS is computationally efficient and prioritizes the most critical features, thus reducing unnecessary synthetic data generation. FIGS provides practical solutions for resource-constrained real-world IoT environments such as IoMT applications and smart home devices. Future work will explore the real-time deployment of FIGS on IoT edge devices to validate its efficiency under operational constraints.

9. Conclusions

This paper introduces FIGS, a novel, practical framework for intrusion detection in imbalanced IoT environments. FIGS combines the concept of feature importance, GAN, and an optimized SMOTE to address the challenge of class imbalance in the IoT environment. Our method is distinctive in its use of sensitivity analysis to find the most important features and then focus on them for generating synthetic data while minimizing noise and complexity.
GIR was proposed, which not only accounts for class distribution but also assigns weights based on domain knowledge and attack severity. It makes sure that critical but rare attacks receive priority for augmentation. Then, the original dataset is categorized into different levels of distribution. FIGS leverages a novel sensitivity-based feature analysis to determine feature importance and focuses only on the most impactful features during augmentation. By generating synthetic data based on the important features, FIGS remain realistic and aligned by traffic distribution while preventing noise and computational complexity. FIGS limited the data generation to only the most critical features and set non-important features to zero. It reduces the computation complexity and redundant synthetic data generation and makes it convenient for real-world IoT deployments.
FIGS generates synthetic data for each category and maintains performance in all levels of data imbalance. Our experimental results on the CICIoMT2024 and CICIDS2017 datasets reveal that FIGS not only enhances detection rates for minority attack groups but also reduces false negatives compared to state-of-the-art methods and the baseline. The results demonstrate that FIGS achieves superior results in all categories of data, even for rare data, making it appropriate for real-world IoT deployments.

Author Contributions

Conceptualization, Z.A.; methodology, Z.A.; software, Z.A.; validation, Z.A., S.D. and A.A.G.; formal analysis, Z.A.; investigation, Z.A.; resources, Z.A.; data curation, Z.A.; writing original draft preparation, Z.A.; writing review and editing, Z.A., S.D. and A.A.G.; visualization, Z.A.; supervision, S.D. and A.A.G. All authors have read and agreed to the published version of the manuscript.

Funding

This research received no external funding.

Data Availability Statement

The original contributions presented in this study are included in the article. Further inquiries can be directed to the corresponding author.

Conflicts of Interest

The authors declare no conflicts of interest.

Abbreviations

The following abbreviations are used in this manuscript:
AdaBoostAdaptive Boosting classifier
ADASYNAdaptive Synthetic Sampling
AEAutoencoder
AE-GANAutoencoder-based GAN
CICIDS2017Canadian Institute for Cybersecurity Intrusion-Detection System Dataset 2017
CICIoMT2024Canadian Institute for Cybersecurity IoMT Dataset 2024
CNNConvolutional Neural Network
DLDeep Learning
DNNDeep Neural Network
FIGANFeature-Importance GAN
FIGSFeature-Importance GAN SMOTE
FISMOTEFeature-Importance SMOTE
FNFalse Negative
FPFalse Positive
GANGenerative Adversarial Network
GIRGeneralized imbalance ratio
GMMGaussian Mixture Model
IDSIntrusion-Detection System
IoMTInternet of Medical Things
IoTInternet of Things
IRImbalance Ratio
LRLogistic Regression
MCCMatthews Correlation Coefficient
MLMachine Learning
MLPMulti-Layer Perceptron
RFRandom Forest
SMOTESynthetic Minority Oversampling Technique
TNTrue Negative
TPTrue Positive
XGBoost      Extreme Gradient Boosting

References

  1. Qaddos, A.; Yaseen, M.U.; Al-Shamayleh, A.S.; Imran, M.; Akhunzada, A.; Alharthi, S.Z. A novel intrusion detection framework for optimizing IoT security. Sci. Rep. 2024, 14, 21789. [Google Scholar] [CrossRef] [PubMed]
  2. Musthafa, M.B.; Huda, S.; Kodera, Y.; Ali, M.A.; Araki, S.; Mwaura, J.; Nogami, Y. Optimizing IoT intrusion detection using balanced class distribution, feature selection, and ensemble machine learning techniques. Sensors 2024, 24, 4293. [Google Scholar] [CrossRef] [PubMed]
  3. Nguyen, H.; Kashef, R. TS-IDS: Traffic-aware self-supervised learning for IoT Network Intrusion Detection. Knowl.-Based Syst. 2023, 279, 110966. [Google Scholar] [CrossRef]
  4. Wang, C.; Xu, D.; Li, Z.; Niyato, D. Effective Intrusion Detection in Highly Imbalanced IoT Networks With Lightweight S2CGAN-IDS. IEEE Internet Things J. 2023, 11, 15140–15151. [Google Scholar] [CrossRef]
  5. Walling, S.; Lodh, S. Enhancing IoT intrusion detection through machine learning with AN-SFS: A novel approach to high performing adaptive feature selection. Discov. Internet Things 2024, 4, 16. [Google Scholar] [CrossRef]
  6. Mishra, A.K.; Paliwal, S.; Srivastava, G. Anomaly detection using deep convolutional generative adversarial networks in the internet of things. ISA Trans. 2024, 145, 493–504. [Google Scholar] [CrossRef] [PubMed]
  7. Majeed, A.; Hwang, S.O. CTGAN-MOS: Conditional generative adversarial network based minority-class-augmented oversampling scheme for imbalanced problems. IEEE Access 2023, 11, 85878–85899. [Google Scholar] [CrossRef]
  8. Rao, Y.N.; Suresh Babu, K. An imbalanced generative adversarial network-based approach for network intrusion detection in an imbalanced dataset. Sensors 2023, 23, 550. [Google Scholar] [CrossRef] [PubMed]
  9. Lee, J.; Park, K. GAN-based imbalanced data intrusion detection system. Pers. Ubiquitous Comput. 2021, 25, 121–128. [Google Scholar] [CrossRef]
  10. Ali-Gombe, A.; Elyan, E. MFC-GAN: Class-Imbalanced dataset classification using multiple fake class generative adversarial network. Neurocomputing 2019, 361, 212–221. [Google Scholar] [CrossRef]
  11. Zhou, F.; Yang, S.; Fujita, H.; Chen, D.; Wen, C. Deep learning fault diagnosis method based on global optimization GAN for unbalanced data. Knowl.-Based Syst. 2020, 187, 104837. [Google Scholar] [CrossRef]
  12. Huang, S.; Lei, K. IGAN-IDS: An imbalanced generative adversarial network towards intrusion detection system in ad-hoc networks. Ad Hoc Netw. 2020, 105, 102177. [Google Scholar] [CrossRef]
  13. Chawla, N.V.; Bowyer, K.W.; Hall, L.O.; Kegelmeyer, W.P. SMOTE: Synthetic minority over-sampling technique. J. Artif. Intell. Res. 2002, 16, 321–357. [Google Scholar] [CrossRef]
  14. He, H.; Bai, Y.; Garcia, E.A.; Li, S. ADASYN: Adaptive synthetic sampling approach for imbalanced learning. In Proceedings of the 2008 IEEE International Joint Conference on Neural Networks (IEEE World Congress on Computational Intelligence), Hong Kong, China, 1–8 June 2008; pp. 1322–1328. [Google Scholar]
  15. Han, H.; Wang, W.Y.; Mao, B.H. Borderline-SMOTE: A new over-sampling method in imbalanced data sets learning. In Proceedings of the International Conference on Intelligent Computing, Hefei, China, 23–26 August 2005; Springer: Berlin/Heidelberg, Germany, 2005; pp. 878–887. [Google Scholar]
  16. Abdelkhalek, A.; Mashaly, M. Addressing the class imbalance problem in network intrusion detection systems using data resampling and deep learning. J. Supercomput. 2023, 79, 10611–10644. [Google Scholar] [CrossRef]
  17. Alfrhan, A.A.; Alhusain, R.H.; Khan, R.U. SMOTE: Class imbalance problem in intrusion detection system. In Proceedings of the 2020 IEEE International Conference on Computing and Information Technology (ICCIT-1441), Tabuk, Saudi Arabia, 9–10 September 2020; pp. 1–5. [Google Scholar]
  18. Thiyam, B.; Dey, S. Efficient feature evaluation approach for a class-imbalanced dataset using machine learning. Procedia Comput. Sci. 2023, 218, 2520–2532. [Google Scholar] [CrossRef]
  19. Al, S.; Dener, M. STL-HDL: A new hybrid network intrusion detection system for imbalanced dataset on big data environment. Comput. Secur. 2021, 110, 102435. [Google Scholar] [CrossRef]
  20. Cui, J.; Zong, L.; Xie, J.; Tang, M. A novel multi-module integrated intrusion detection system for high-dimensional imbalanced data. Appl. Intell. 2023, 53, 272–288. [Google Scholar] [CrossRef] [PubMed]
  21. Yazdinejad, A.; Kazemi, M.; Parizi, R.M.; Dehghantanha, A.; Karimipour, H. An ensemble deep learning model for cyber threat hunting in industrial internet of things. Digit. Commun. Netw. 2023, 9, 101–110. [Google Scholar] [CrossRef]
  22. Altunay, H.C.; Albayrak, Z. A hybrid CNN+ LSTM-based intrusion detection system for industrial IoT networks. Eng. Sci. Technol. Int. J. 2023, 38, 101322. [Google Scholar] [CrossRef]
  23. Wu, Y.; Lin, G.; Liu, L.; Hong, Z.; Wang, Y.; Yang, X.; Jiang, Z.L.; Ji, S.; Wen, Z. MASiNet: Network Intrusion Detection for IoT Security Based on Meta-Learning Framework. IEEE Internet Things J. 2024, 11, 25136–25146. [Google Scholar] [CrossRef]
  24. Dadkhah, S.; Neto, E.C.P.; Ferreira, R.; Molokwu, R.C.; Sadeghi, S.; Ghorbani, A. Ciciomt2024: Attack vectors in healthcare devices-a multi-protocol dataset for assessing iomt device security. Internet Things 2024, 28, 101351. [Google Scholar] [CrossRef]
  25. Neto, E.C.P.; Dadkhah, S.; Ferreira, R.; Zohourian, A.; Lu, R.; Ghorbani, A.A. CICIoT2023: A real-time dataset and benchmark for large-scale attacks in IoT environment. Sensors 2023, 23, 5941. [Google Scholar] [CrossRef] [PubMed]
  26. Dadkhah, S.; Mahdikhani, H.; Danso, P.K.; Zohourian, A.; Truong, K.A.; Ghorbani, A.A. Towards the development of a realistic multidimensional IoT profiling dataset. In Proceedings of the 2022 IEEE 19th Annual International Conference on Privacy, Security & Trust (PST), Fredericton, NB, Canada, 22–24 August 2022; pp. 1–11. [Google Scholar]
  27. Sharafaldin, I.; Lashkari, A.H.; Ghorbani, A.A. Toward generating a new intrusion detection dataset and intrusion traffic characterization. ICISSp 2018, 1, 108–116. [Google Scholar]
  28. Moustafa, N.; Slay, J. UNSW-NB15: A comprehensive data set for network intrusion detection systems (UNSW-NB15 network data set). In Proceedings of the 2015 IEEE Military Communications and Information Systems Conference (MilCIS), Canberra, Australia, 10–12 November 2015; pp. 1–6. [Google Scholar]
  29. Sharafaldin, I.; Lashkari, A.H.; Hakak, S.; Ghorbani, A.A. Developing realistic distributed denial of service (DDoS) attack dataset and taxonomy. In Proceedings of the 2019 IEEE International Carnahan Conference on Security Technology (ICCST), Chennai, India, 1–3 October 2019; pp. 1–8. [Google Scholar]
  30. Ferrag, M.A.; Friha, O.; Hamouda, D.; Maglaras, L.; Janicke, H. Edge-IIoTset: A new comprehensive realistic cyber security dataset of IoT and IIoT applications for centralized and federated learning. IEEE Access 2022, 10, 40281–40306. [Google Scholar] [CrossRef]
  31. Ring, M.; Wunderlich, S.; Grüdl, D.; Landes, D.; Hotho, A. Flow-based benchmark data sets for intrusion detection. In Proceedings of the 16th European Conference on Cyber Warfare and Security, Dublin, Ireland, 29–30 June 2017; pp. 361–369. [Google Scholar]
  32. Tavallaee, M.; Bagheri, E.; Lu, W.; Ghorbani, A.A. A detailed analysis of the KDD CUP 99 data set. In Proceedings of the 2009 IEEE Symposium on Computational Intelligence for Security and Defense Applications, Ottawa, ON, Canada, 8–10 July 2009; pp. 1–6. [Google Scholar]
  33. Garcia, S.; Parmisano, A.; Erquiaga, M.J. IoT-23: A labeled dataset with malicious and benign IoT network traffic. Zenodo 2020. [Google Scholar] [CrossRef]
  34. Koroniotis, N.; Moustafa, N.; Sitnikova, E.; Turnbull, B. Towards the development of realistic botnet dataset in the internet of things for network forensic analytics: Bot-iot dataset. Future Gener. Comput. Syst. 2019, 100, 779–796. [Google Scholar] [CrossRef]
  35. Moustafa, N. A new distributed architecture for evaluating AI-based security systems at the edge: Network TON_IoT datasets. Sustain. Cities Soc. 2021, 72, 102994. [Google Scholar] [CrossRef]
  36. Singh, T.; Khanna, R.; Satakshi; Kumar, M. Improved multi-class classification approach for imbalanced big data on spark. J. Supercomput. 2023, 79, 6583–6611. [Google Scholar] [CrossRef]
  37. Srinivasan, M.; Senthilkumar, N.C. Class imbalance data handling with optimal deep learning-based intrusion detection in IoT environment. Soft Comput. 2024, 28, 4519–4529. [Google Scholar] [CrossRef]
  38. Wang, Y.; Zeng, L.; Wang, L.; Shao, Y.; Zhang, Y.; Ding, X. An efficient incremental learning of bearing fault imbalanced data set via filter StyleGAN. IEEE Trans. Instrum. Meas. 2021, 70, 1–10. [Google Scholar] [CrossRef]
  39. Ding, H.; Chen, L.; Dong, L.; Fu, Z.; Cui, X. Imbalanced data classification: A KNN and generative adversarial networks-based hybrid approach for intrusion detection. Future Gener. Comput. Syst. 2022, 131, 240–254. [Google Scholar] [CrossRef]
  40. Liu, Y.; Liu, Q. SMOTE oversampling algorithm based on generative adversarial network. Clust. Comput. 2025, 28, 271. [Google Scholar] [CrossRef]
  41. Goodfellow, I.; Pouget-Abadie, J.; Mirza, M.; Xu, B.; Warde-Farley, D.; Ozair, S.; Courville, A.; Bengio, Y. Generative adversarial networks. Commun. ACM 2020, 63, 139–144. [Google Scholar] [CrossRef]
  42. Mirza, M.; Osindero, S. Conditional generative adversarial nets. arXiv 2014, arXiv:1411.1784. [Google Scholar] [CrossRef]
  43. Chicco, D.; Jurman, G. The advantages of the Matthews correlation coefficient (MCC) over F1 score and accuracy in binary classification evaluation. BMC Genom. 2020, 21, 6. [Google Scholar] [CrossRef] [PubMed]
  44. Boughorbel, S.; Jarray, F.; El-Anbari, M. Optimal classifier for imbalanced data using Matthews Correlation Coefficient metric. PLoS ONE 2017, 12, e0177678. [Google Scholar] [CrossRef] [PubMed]
  45. Zhang, J.; Zulkernine, M.; Haque, A. Random-forests-based network intrusion detection systems. IEEE Trans. Syst. Man Cybern. Part C (Appl. Rev.) 2008, 38, 649–659. [Google Scholar] [CrossRef]
  46. Le, T.T.H.; Oktian, Y.E.; Kim, H. XGBoost for imbalanced multiclass classification-based industrial internet of things intrusion detection systems. Sustainability 2022, 14, 8707. [Google Scholar] [CrossRef]
  47. Matthews, B.W. Comparison of the predicted and observed secondary structure of T4 phage lysozyme. Biochim. Biophys. Acta (BBA)-Protein Struct. 1975, 405, 442–451. [Google Scholar] [CrossRef]
  48. Dablain, D.; Krawczyk, B.; Chawla, N.V. DeepSMOTE: Fusing deep learning and SMOTE for imbalanced data. IEEE Trans. Neural Netw. Learn. Syst. 2022, 34, 6390–6404. [Google Scholar] [CrossRef] [PubMed]
  49. Tesfahun, A.; Bhaskari, D.L. Intrusion detection using random forests classifier with SMOTE and feature reduction. In Proceedings of the 2013 IEEE International Conference on Cloud & Ubiquitous Computing & Emerging Technologies, Pune, India, 15–16 November 2013; pp. 127–132. [Google Scholar]
  50. Sabeel, U.; Heydari, S.S.; Elgazzar, K.; El-Khatib, K. CVAE-AN: Atypical attack flow detection using incremental adversarial learning. In Proceedings of the 2021 IEEE Global Communications Conference (GLOBECOM), Madrid, Spain, 7–11 December 2021; pp. 1–6. [Google Scholar]
Figure 1. Class distribution of the CICIoMT2024 dataset.
Electronics 14 02917 g001
Figure 2. Category distribution of the CICIoMT2024 dataset.
Electronics 14 02917 g002
Figure 3. Class distribution of the CICIDS2017 dataset.
Electronics 14 02917 g003
Figure 4. Proposed FIGS model framework.
Electronics 14 02917 g004
Figure 5. The effect of different architectures on classification metrics: (a) Precision, (b) Recall, and (c) F1-score.
Electronics 14 02917 g005
Figure 6. The effect of varying ϵ values on classification performance: (a) Recall vs. ϵ , and (b) Precision vs. ϵ .
Electronics 14 02917 g006
Figure 7. Training dynamics of a GAN loss across epochs.
Electronics 14 02917 g007
Figure 8. Performance comparison across different classes of attack by changing the number of important features in the CICIDS2017 dataset.
Electronics 14 02917 g008
Figure 9. Performance comparison by changing the number of important features in the CICIoMT2024 dataset.
Electronics 14 02917 g009
Figure 10. MCC comparison for binary classification using RF, XGBoost, and DNN classifiers on the CICIoMT2024 dataset.
Electronics 14 02917 g010
Figure 11. Confusion matrices for DNN, RF, and XGBoost classifiers on the CICIoMT2024 dataset after applying FIGS.
Electronics 14 02917 g011
Figure 12. Confusion matrices of the CICIoMT2024 baseline experiment using DNN, RF, and XGBoost classifiers.
Electronics 14 02917 g012
Figure 13. Performance metrics (accuracy, precision, recall, and F1-score) of CICIoMT2024 for multiclass classification.
Electronics 14 02917 g013
Figure 14. Comparison of FIGS and S2CGAN across varying dataset loads on CICIoMT2024. (a) FIGS demonstrates lower training time, confirming its computational efficiency. (b) FIGS also consistently achieves higher average recall, indicating better attack detection.
Electronics 14 02917 g014
Figure 15. Metric comparison across different models for all traffic classes.
Electronics 14 02917 g015
Figure 16. MCC comparison for binary classification in the CICIDS2017 dataset.
Electronics 14 02917 g016
Table 1. Summary of recently developed methods for addressing class imbalance in IDSs.
CategoryRef.DatasetAlgorithmsClassifiersKey BenefitsChallenges
Data-Generating Models[6]IoT23, BOT-IoT, UNSWNB15, ToN-IoTDCGAN, Bi-LSTMGANCombining GAN and RNN.Ignoring imbalanced data.
[7]Adult, Stroke-PredictionCGAN, Coin-ThrowingEnsemble MLRemoving noisy samples by coin-throwing.Computational complexity, potential overfitting, sophisticated data preprocessing.
[8]UNSW-NB15, ICIDS2017IGANLenet 5, LSTMStopping random undersampling.High computational demand, potential overfitting.
[9]CICIDS2017GANRFGenerating data for minority class.Complexity.
[10]E-MNIST, CIFAR-10GANCNNUsing GAN with multiple fake classes.Complexity.
[11]Scania-Trucks-datasetGAN, AEDNNAE to generate fault features; two-hierarchical discriminators.Complexity in training, potential overfitting.
[12]NSL-KDD, UNSW-NB15, CICIDS2017FNN, IGANDNNFilter in IGAN for resampling; convolutional layers for expression.Complexity.
Data-Resampling Models[16]NSL-KDDADASYN, Tomek–LinksMLP, DNN, CNN, CNN-BLSTMOversampling by ADASYN and undersampling by TomekLink.Computational complexity.
[18]CIC-DDoS2019, Edge-IIoTTomek Link, SMOTEKNN, LR, DT, RF, GDB, AdaboostFeature selection by ROC value.Computational complexity, potential overfitting.
[17]CICIDS2017SMOTENaive Bayes, RF, kNNUsing SMOTE.Complexity.
[19]CIDDS-001, UNS-NB15SMOTE, Tomek–LinksCNN-LSTMNIDS for big data environments.Complexity.
Hybrid-Generating Models[4]CICIDS2017GAN, SNN, AE, KNNDNNCombine SNN+AE to preserve class differences; rare category synthesis.Complexity, high computation.
[20]NSL-KDD, UNSW-NB15Stacked AE, GMM, WGANCNN-LSTMFeature extraction via AE; GMM + WGAN-based generator.Training complexity; real-time limitations.
Non-Generating Models[21]GP, SWaTLSTM, AEDTAdjustable time steps; dimension reduction.Ignores the minority class data generation.
[23]NSL-KDD, UNSWNB15SNN, Meta-learningSNNFew-shot learning; composite loss.Training complexity.
Table 2. Comparison of different methods for data balancing.
MethodFeature-Aware?Handles Minority Class Prioritization?Computationally Efficient?
Oversampling MethodsNoNoYes
Data Generation methodsNoNoNo (High Complexity)
Hybrid ModelsNoNoNo (High Complexity)
FIGSYes (Feature-Importance Selection)Yes (GIR Prioritization)Yes (Realistic for IoT)
Table 3. Comparison of common intrusion-detection datasets.
DatasetFeature CountRecordsClassesImbalance IssueApplication DomainClass Imbalance Ratio
CICIoMT2024 [24]458.5 million18 attacks in 5 categories,
including DDoS, DoS, Recon, MQTT, Spoofing
Some attack classes or categories are underrepresentedIoMT Security, Intrusion Detection1:1 to 1:2000 (varies)
CICIoT2023 [25]4614.5 million33 attacks in 7 categories: DDoS, DoS, Recon, Web-based, Brute Force, Spoofing, MiraiSome attacks underrepresentedIoT Security, Intrusion Detection1:1 to 1:6000 (varies)
CICIoT2022 [26] IoT Device Profiling
CICIDS2017 [27]803 millionDDoS, BoT, Heartbleed, Brute Force, etc.Certain attacks are rareIntrusion Detection1:1 to 1:1000 (varies)
UNSW-NB15 [28]492.5 millionNormal, DoS, Fuzzers, Reconnaissance, Exploits, etc.Some attacks underrepresentedIntrusion Detection∼1:10 (minority)
CIC-DDoS2019 [29]8550 millionDDoS, BenignDDoS attacks dominateDDoS Detection∼1:20 (minority)
Edge-IIoT [30]Varies50,000Normal, Man-in-the-Middle, Spoofing, Replay, DoSIoT attacks underrepresentedIoT Security∼1:100
CIDDS-001 [31]17400,000DoS, External/Insider threatsDoS underrepresentedIntrusion Detection∼1:20
NSL-KDD [32]41125,000Normal, DoS, Probe, U2R, R2LU2R and R2L underrepresentedIntrusion Detection1:100 for some classes
IoT23 [33]502 millionNormal, Botnet, DoS, DDoS, MalwareDoS underrepresentedIoT Security∼1:20
BOT-IoT [34]Varies72 millionNormal, DDoS, DoS, Reconnaissance, TheftDDoS and DoS dominateIntrusion Detection∼1:100
ToN-IoT [35]3822 millionNormal, Malware, DoS, Data Injection, Password attacksSome attack types underrepresentedIoT System Telemetry∼1:10
Table 5. GIR values and categories for each class in the CICIDS2017 dataset.
ClassGIR ValueCategory
DOS4.26Plentiful
PortScan6.77Plentiful
DDOS8.41Plentiful
Patator182.02Limited
Web Attack493.84Limited
BoT547.71Limited
Infiltration29,900.99Sparse
Heartbleed97,830.73Sparse
Table 6. GIR values and categories for each class in the CICIoMT2024 dataset.
ClassGIR ValueCategory
TCP-IP-DDoS-UDP0.5Plentiful
TCP-IP-DDoS-ICMP0.53Plentiful
TCP-IP-DDoS-TCP1.01Plentiful
TCP-IP-DoS-UDP1.42Plentiful
TCP-IP-DoS-SYN1.85Plentiful
TCP-IP-DoS-ICMP1.94Plentiful
TCP-IP-DDoS-SYN2.06Plentiful
TCP-IP-DoS-TCP2.16Plentiful
MQTT-DDoS-Connect-Flood4.65Limited
Recon-Port-Scan9.37Limited
MQTT-DoS-Publish-Flood18.91Limited
MQTT-DDoS-Publish-Flood27.7Limited
Recon-OS-Scan48.29Sparse
ARP Spoofing56.18Sparse
MQTT-DoS-Connect-Flood62.84Sparse
MQTT-Malformed-Data145.34Sparse
Recon-VulScan311.77Sparse
Recon-Ping-Sweep1078.02Sparse
Table 7. GIR values for attack categories in CICIoMT2024 dataset.
Attack CategoryGIR ValueCategory
DDoS0.5Plentiful
DoS1.32Plentiful
MQTT8.95Limited
Recon22.27Sparse
ARP Spoofing164.34Sparse
Table 8. Comparison of feature selection and synthetic data generation method.
Ref.Feature SelectionCalculating Feature ImportanceGenerating Synthetic Data
FSGAN [38]Filter styleGAN
KNN-GAN [39]GAN
SMOTE-GAN [40]SMOTE, GAN
DCGAN+Bi-LSTM [6]DCGAN
CTGAN-MOS [7]CTGAN
IGAN-based IDS [8]IGAN
GAN-based IDS [9]GAN
MFC-GAN [10]MFC-GAN
Fault Diagnosis [11]AutoEncoderGAN
IGAN-IDS [12]Feed-Forward Neural NetworkIGAN
ADASYN+TomekLink [16]ADASYN
SMOTE [17]SMOTE
STL-HDL [19]SMOTE
S2CGAN-IDS [4]Siamese AutoEncoder NetworkCGAN, SMOTE
GMM-WGAN-IDS [20]Stacked AutoencoderWasserstein GAN
Ensemble LSTM+AE [21]AutoEncoder
MASiNet [23]Siamese Networks
FIGS (Our Model)Importance Feature SelectionSensitivity AnalysisFIGAN, FISMOTE
Table 9. Data leakage prevention strategy across FIGS.
Processing StepApplied OnData Leakage Risk Prevented
Data Splitting (Train/Test)Raw dataPrevents inclusion of test samples in augmentation
Feature-Importance Calculation (Sensitivity
Analysis)
Only training setAvoids computing feature rankings using
test information
Synthetic Data Generation (FIGAN/FISMOTE)Only on training setEnsures test data are not artificially altered or leaked
Model TrainingAugmented training
set only
Prevents exposure to test labels during training
Model EvaluationHold-out test setEnsures realistic generalization performance
Table 10. Training and testing sample distribution of CICIoMT2024 before and after using FIGS.
ClassInitial Training SamplesTraining Samples After FIGSTesting Samples
TCP_IP-DDoS-UDP1,598,4201,598,420399,606
TCP_IP-DDoS-ICMP1,509,7401,509,740377,435
TCP_IP-DDoS-TCP789,650789,650197,413
TCP_IP-DoS-UDP563,602563,602140,901
TCP_IP-DoS-SYN432,398432,398108,100
TCP_IP-DoS-ICMP411,779411,779102,945
TCP_IP-DDoS-SYN388,953388,95397,238
TCP_IP-DoS-TCP369,984369,98492,496
MQTT-DDoS-Connect_Flood171,962369,98442,990
Recon-Port_Scan85,282369,98421,321
MQTT-DoS-Publish_Flood42,304369,98410,577
MQTT-DDoS-Publish_Flood28,831369,9847208
Recon-OS_Scan16,532184,2714134
ARP_Spoofing14,232184,2713559
MQTT-DoS-Connect_Flood12,723184,2713181
MQTT-Malformed_Data5501184,2711376
Recon-VulScan2565184,271642
Recon-Ping_Sweep740184,271186
Table 11. Training and testing sample distribution of CICIDS2017 before and after using FIGS.
NameInitial Training SamplesTraining Samples After FIGSTesting Samples
Benign1,721,8211,721,821430,455
DOS/DDoS304,559304,55976,140
PortScan127,144127,14431,786
Papator4730127,1441183
Web Attack1744127,144436
BOT1573127,144393
Infilteration2915737
Heartblead915732
Table 12. Performance comparison between baseline and FIGS for different classifiers and traffic types for binary classification.
TrafficClassifierBaselineFIGS
AccuracyPrecisionRecallF1-ScoreAccuracyPrecisionRecallF1-Score
TCP-IP-DDoS-UDPRF11111111
XgBoost0.997510.97730.98851111
DNN0.99990.993510.99671111
TCP-IP-DDoS-ICMPRF10.989810.99491111
XgBoost11111111
DNN11111111
TCP-IP-DDoS-TCPRF11111111
XgBoost0.997510.97730.98851111
DNN11111111
TCP-IP-DoS-UDPRF0.997510.97730.98851111
XgBoost11111111
DNN11111111
TCP-IP-DoS-SYNRF11111111
XgBoost11111111
DNN11111111
TCP-IP-DoS-ICMPRF11111111
XgBoost11111111
DNN11111111
TCP-IP-DDoS-SYNRF10.998110.99911111
XgBoost0.997510.97730.98851111
DNN11111111
TCP-IP-DoS-TCPRF11111111
XgBoost0.997510.97730.98851111
DNN11111111
Recon-Port_ScanRF11111111
XgBoost11111111
DNN11111111
MQTT-DoS-Publish_FloodRF11111111
XgBoost0.99990.9990.9970.9981111
DNN0.99990.99710.99851111
MQTT-DDoS-Publish_FloodRF10.998110.99911111
XgBoost10.998110.99911111
DNN0.99980.990610.99531111
Recon-OS_ScanRF0.99990.993510.99671111
XgBoost0.99990.99670.99670.99671111
DNN110.99670.9984110.99670.9984
ARP_SpoofingRF11111111
XgBoost110.99620.99811111
DNN11111111
MQTT-DoS-Connect_FloodRF11111111
XgBoost11111111
DNN11111111
MQTT-Malformed_DataRF11111111
XgBoost10.989810.99491111
DNN11111111
Recon-VulScanRF0.99990.961510.980410.980410.9901
XgBoost110.99410.99710.9940.98220.9881
DNN0.99990.96080.980.97031111
Recon-Ping_SweepRF11111111
XgBoost110.92310.961111
DNN110.92310.961111
Table 13. Classifier performance for multiclass classification.
ClassifierAccMacro PMacro RMacro F1Micro PMicro RMicro F1Weighted PWeighted RWeighted F1
FIGS
RF0.99780.96130.94490.95250.99780.99780.99780.99780.99780.9977
XGBoost0.99760.95680.94220.94910.99760.99760.99760.99760.99760.9976
DNN0.79770.83860.76950.77420.79770.79770.79770.81210.79770.7558
AdaBoost0.92970.93870.85450.87930.92970.92970.92970.93570.92970.9260
LR0.76150.76760.65100.67700.76150.76150.76150.74680.76150.7139
DeepSMOTE
RF0.99500.95440.94170.94730.99570.99770.99580.97870.96100.9727
XGBoost0.99460.95630.94010.94420.99780.99781.00000.99381.00000.9944
DNN0.78970.78750.76510.76870.78790.79240.78940.80700.79260.7462
AdaBoost0.83680.93130.78320.84760.82600.83400.89610.87610.81920.8981
LR0.75570.74290.64200.63660.75300.75130.75550.73810.66810.6981
Baseline (Imbalanced)
RF0.99380.94860.93790.94220.99390.99390.99390.94860.93790.9422
XGBoost0.99760.95660.93590.94530.99760.99760.99760.99750.99760.9975
DNN0.78050.76800.76020.73350.78050.78050.78050.76800.76020.7335
AdaBoost0.79230.92160.74650.77480.79230.79230.79230.83030.79230.7426
LR0.74390.73220.60900.60440.74390.74390.74390.73220.60900.6044
Table 14. Comparison of baseline, DeepSMOTE, and FIGS results for various classifiers on different categories.
ClassifierCategoryBaselineDeepSMOTEFIGS
PRF1PRF1PRF1
RFDDoS111111111
DoS111111111
MQTT10.990.9910.990.9910.990.99
Benign0.960.990.970.960.990.970.960.990.97
Recon0.990.960.970.990.960.970.980.960.97
ARP Spoofing0.860.710.780.820.680.740.840.720.77
XgBoostDDoS111111111
DoS111111111
MQTT10.990.9910.990.9910.990.99
Benign0.960.990.970.960.990.970.960.990.97
Recon0.980.950.970.980.960.970.980.950.97
ARP Spoofing0.810.680.740.810.690.750.810.720.76
DNNDDoS0.780.990.870.770.990.870.780.980.87
DoS0.870.260.400.900.230.370.860.250.39
MQTT0.990.990.990.990.980.9910.980.99
Benign0.920.980.950.910.970.940.910.970.94
Recon10.910.950.980.910.9410.900.95
ARP Spoofing0.520.470.490.520.500.510.490.520.51
AdaBoostDDoS0.770.990.860.920.990.960.9110.96
DoS0.960.220.360.990.740.8410.730.85
MQTT0.900.990.940.950.980.970.870.990.93
Benign0.9210.960.900.980.940.940.990.96
Recon0.990.810.890.970.920.950.990.940.96
ARP Spoofing10.470.640.900.200.330.940.470.63
LRDDoS0.720.970.830.740.960.840.760.960.85
DoS0.600.200.300.670.200.310.660.210.31
MQTT0.880.900.890.960.960.960.970.960.97
Benign0.850.910.880.880.830.860.880.920.90
Recon0.750.400.520.860.480.620.880.500.64
ARP Spoofing0.400.300.340.460.350.400.460.370.41
Table 15. Performance improvement made by FIGS.
ClassifierAccuracy (%)Macro Precision (%)Macro Recall (%)Macro F1-Score (%)
RF0.4024954721.3388150960.7463482251.09318616
XGBoost0.2004811551.06605351215.568350678.476135286
DNN2.2037155679.1927083331.2233622735.548738923
AdaBoost17.341915941.8554687514.4675150713.48735157
LR2.3659093964.8347446056.89655172412.01191264
Note: The bold values indicate the highest improvements for each metric.
Table 16. McNemar’s test: statistical significance and improvement percentage of FIGS over baseline and DeepSMOTE across classifiers.
ClassifierComparisonb01b10p-ValueSignificant (p < 0.05)
RFDeepSMOTE vs. FIGS72017 3.6932 × 10 188 TRUE
Baseline vs FIGS72313 1.5124 × 10 194 TRUE
XGBoostDeepSMOTE vs. FIGS73514 1.2222 × 10 196 TRUE
Baseline vs FIGS72516 5.9308 × 10 191 TRUE
DNNDeepSMOTE vs. FIGS37193490TRUE
Baseline vs. FIGS36053750TRUE
AdaBoostDeepSMOTE vs. FIGS117577 5.7302 × 10 253 TRUE
Baseline vs. FIGS1199200TRUE
LRDeepSMOTE vs. FIGS908115400TRUE
Baseline vs. FIGS899614030TRUE
Table 17. Experimental results of multiclassification. Include the baseline, four state-of-the-art models, and FIGS with three different classifiers.
MethodsMetricBaselineCVAE-ANSMOTETACGANS2CGANFIGS(XGBoost)FIGS(DNN)FIGS(RF)
BENIGNPrecision0.99470.99790.99690.99600.99551.0000.99980.9999
Recall0.99150.98770.98490.98880.99031.0001.0000.9999
F1-Score0.99300.99280.99080.99240.99291.0000.99990.9999
DoS/DDoSPrecision0.99840.99140.98780.99140.98960.99810.96950.9996
Recall0.99940.99800.99930.99800.99930.99880.99930.9963
F1-Score0.99440.99470.99350.99470.99440.99840.98420.9965
PortScanPrecision0.90880.86740.87220.88860.90151.0001.0000.9999
Recall0.93710.98160.96440.96150.94191.0000.99940.9999
F1-Score0.92270.92100.91600.92360.92131.0000.99970.9999
PatatorPrecision0.98650.96620.98460.98240.94300.99960.99711.0000
Recall0.98770.89340.98910.98950.99281.00000.99310.9996
F1-Score0.98710.92830.98680.98600.96730.99980.99510.9998
Web AttackPrecision0.98710.88810.23610.90210.97941.00000.99341.0000
Recall0.93520.89290.94020.90630.97940.98920.96980.9720
F1-Score0.96.40.89050.37740.90420.97940.99460.98150.9858
BotPrecision1.00001.00000.57510.99300.60840.99730.97631.0000
Recall0.37130.37370.73620.34730.74590.99200.66040.9332
F1-Score0.54150.54410.64750.51460.67020.99460.78790.9654
InfiltrationPrecision0.00000.25000.83290.00001.00001.00001.00001.0000
Recall0.00000.14350.71440.00000.71450.85710.71430.7143
F1-Score0.00000.18230.76910.00000.83350.92310.83330.8333
HeartbleedPrecision0.00001.00001.00000.00001.00001.00001.00001.0000
Recall0.00001.00001.00000.00001.00001.00001.00001.0000
F1-Score0.00001.00001.00000.00001.00001.00001.00001.0000
Note: The bold values indicate the highest improvements for each traffic class.
Disclaimer/Publisher’s Note: The statements, opinions and data contained in all publications are solely those of the individual author(s) and contributor(s) and not of MDPI and/or the editor(s). MDPI and/or the editor(s) disclaim responsibility for any injury to people or property resulting from any ideas, methods, instructions or products referred to in the content.

