Abstract
To solve the problem of the limited capability of multimodal image feature descriptors constructed by gradient information and the phase consistency principle, a method of cumulative structure feature descriptor construction with rotation invariance is proposed in this paper. Firstly, we extract the direction of multi-scale and multi-direction feature point edges using the Log-Gabor odd-symmetric filter and calculate the amplitude of pixel edges based on the phase consistency principle. Then, the main direction of the key points is determined based on the edge direction feature map, and the coordinates are established according to the main direction to ensure that the feature point descriptor has rotation invariance. Finally, the Log-Gabor odd-symmetric filter calculates the cumulative structural response in the maximum direction and constructs a highly identifiable descriptor with rotation invariance. We select several representative heterogeneous images as test data and compare the matching performance of the proposed algorithm with several excellent descriptors. The results indicate that the descriptor constructed in this paper is more robust than other descriptors for heterosource images with rotation changes.
1. Introduction
For complex application scenarios such as inconsistent resolution, image blurring, and poor imaging quality, the existing infrared and visible image alignment techniques have deficiencies in accuracy and adaptability; so, the study of methods oriented to complex conditions has important theoretical value and practical significance [1]. Different modal images in multimodal image alignment, the conversion of heterogeneous source images to a unified coordinate system, and the fusion of their spatial and semantic information help to make up for the limitations of single-modal data, improving the comprehensiveness of the target perception and the accuracy of decision-making [2]. Current image matching algorithms are mainly classified into three categories: region-based, feature-based, and deep learning-based methods [3]. Among them, region-based methods are aligned by the similarity metric of local or whole regions of the image, but when dealing with visible and infrared images with large modal differences, they are less robust and prone to produce local extremes. Although deep learning-based methods have strong nonlinear modeling capability, they rely more on hardware resources and training samples and are difficult to achieve online update and real-time alignment [4,5].
In contrast, feature-based methods match by extracting key points and their descriptors in the image, have certain geometric and rotational invariance, and show good adaptability in multimodal image alignment. Chen Zhen et al. [6], in 2018, proposed the concept of the R-MI-rényi measure by combining mutual information and feature points, using the Harris corner point detector to extract the feature points in the image and combining the corner point function with Rényi mutual information as a similarity measure. Ye et al. [7], in 2019, proposed a fast and robust template matching for multimodal remote sensing image alignment framework, which includes two key components, Channel Features of Oriented Gradients and similarity metrics based on feature representations. Min et al. [8], in 2020, proposed a method for non-rigid infrared and visible image alignment by augmented affine transformation. The core idea of the algorithm is to transform the image alignment problem into a point set matching problem and complete the image alignment by constructing the feature point sets on the matched edge images. The results show that the method improves the robustness of the alignment. Li et al. [9], in 2021, proposed a constrained point feature-based method when performing infrared and visible image alignment. The main advantage of the method is that it uses a target detection algorithm to determine the region of interest and then selects the corner points as constraints, which reduces the computational complexity in the alignment and increases the stability of the matching. Liu et al. [10], in 2022, proposed a 2D/3D multimodal medical image alignment method based on normalized inter-correlation, introduced the correlation coefficients of the Laplace operator in the traditional normalized inter-correlation algorithm, and used a linear combination of Gaussian and Laplace operators to calculate the cosine similarity. Finally, the algorithm carried out the optimization of the Sobel operator by introducing the angle of the gradient vector pinch, which further improves the extraction of image features and matching. However, the current class of methods still faces challenges in two key aspects: low repeatable detection of homonymous feature points in multimodal images and insufficient similarity of constructed descriptors between different modalities to achieve accurate matching.
Consequently, we propose a descriptor construction method with rotational invariance and high discriminative power based on the systematic analysis of existing feature point detection and descriptor construction methods. The aim is to enhance the matching accuracy of heterogenous feature points in multimodal images. The experimental results show that the method exhibits good matching stability in heterosource images and effectively improves the accuracy and robustness of the alignment. This paper focuses on the core scientific issue of how to surmount challenges such as image structure blurring and inconsistent directional responses in multi-source heterogeneous image registration and construct a feature descriptor that combines rotation invariance and descriptive power. This issue is highly challenging from a theoretical perspective and has significant practical value, especially in key tasks such as the cross-modal fusion of visual information, target recognition, and scene understanding. The ability to construct robust features directly determines the quality of the subsequent matching and fusion.
2. Feature Point Description Algorithm
To address the two key challenges in heterogeneous image matching—namely, the low repeatability of homonymous points and the insufficient similarity of feature descriptors—this paper introduces a method based on cumulative structural similarity. The method is designed to enhance both the robustness of keypoint localization and the discriminability of descriptors across modalities.
2.1. Flow Chart
In this paper, we choose the feature-based algorithm (Figure 1) for heterogenous image matching. As the core step of image matching, constructing feature point descriptors requires making full use of feature point neighborhood information to construct feature vectors with distinguishability [11]. The image matching method proposed in this paper includes, firstly, extracting the multi-scale and multi-direction edge response of the image using a two-dimensional Log-Gabor odd-symmetric filter and obtaining the magnitude information by combining with the principle of phase consistency, secondly, constructing the histogram of the edge direction, accurately estimating the main direction of the feature points, and realizing the rotational invariance, thirdly, establishing a local coordinate system with the main direction and constructing a highly discriminative feature vector with cumulative structure descriptor, and fourthly, the nearest neighbor distance ratio criterion (NNDR) is used for initial matching, and the RANSAC algorithm is introduced to achieve geometric consistency constraints and improve the matching accuracy and robustness. The overall flow of the algorithm is given in Figure 2, which provides a structural reference for the subsequent method design.
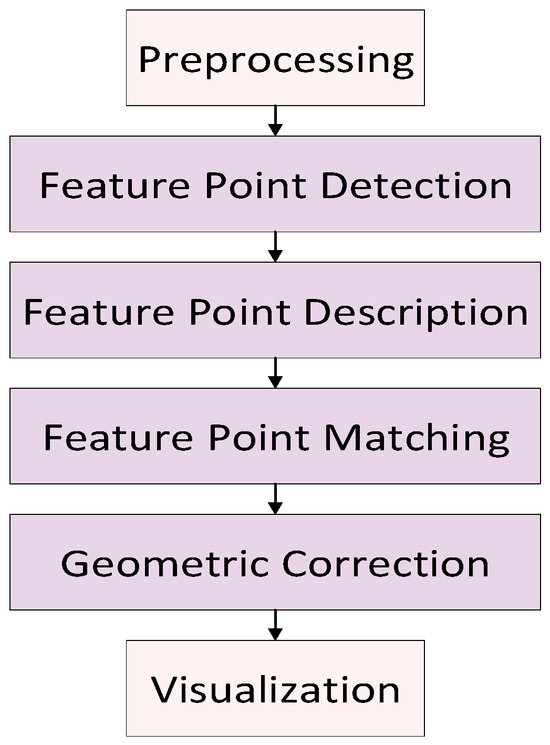
Figure 1.
Example of feature matching process using the proposed method.
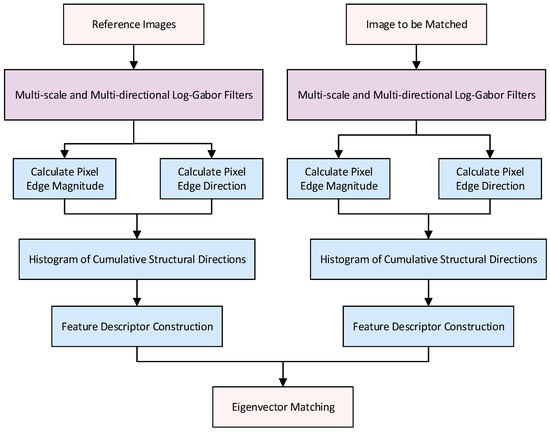
Figure 2.
Optical image matching flowchart.
2.2. Log-Gabor Filter
The two-dimensional Log-Gabor filter frequency domain form uses a polarity-separable two-dimensional Gaussian function in the frequency domain, which is obtained by multiplying the radial and angular components [12], and its functional representation is given as
where , and and denote the frequency and angle of the filter, respectively. denotes the direction; denotes the center frequency; k and regulate the bandwidth of the filter in the and directions, respectively.
The two-dimensional Log-Gabor filtering results are obtained by converting the filtering results to the spatial domain via the inverse Fourier transform:
where denotes spatial domain coordinates; denotes even-symmetric filters; denotes odd-symmetric filters.
The image is convolved using multi-scale and multi-directional Log-Gabor odd-symmetric filters and Log-Gabor even-symmetric filters .
where s and o denote the scale and direction of the filter; and denote the filtering results of the even-symmetric and odd-symmetric filters, respectively; denotes the response value of the pixel obtained by convolving the image with the Log-Gabor filter on the scale s and direction o.
To clarify the relationship between the frequency-domain Log-Gabor formulation and the spatial-domain orientation estimation, a computational flowchart is provided in Figure 3. This figure illustrates how the image undergoes multi-scale and multi-directional Log-Gabor filtering, followed by phase congruency amplitude computation and finally directional projection to construct the edge orientation histogram. This pipeline forms the core foundation for rotation-invariant descriptor construction.
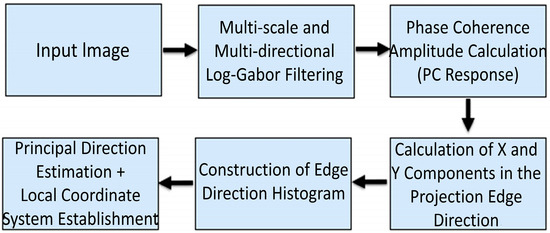
Figure 3.
Computational flow from Log-Gabor filtering to edge orientation histogram construction.
2.3. Edge Direction Histogram Construction
The traditional method of establishing a histogram of gradient directions to estimate the principal directions is only suitable for homologous images, while the estimation of the directions of heterologous images with nonlinear differences is not accurate. Therefore, there is a need to design feature point principal direction estimation methods that are specifically applicable to visible and infrared images, so they are rotationally invariant to optoelectronic images with rotational variations.
2.3.1. Amplitude of the Edge Where the Pixel Is Located
The human eye’s perception of image structural features mainly comes from the phase spectrum of the image. Phase information determines the feature expression of an image, and image feature extraction algorithms based on phase information are not affected by changes in image contrast and luminance; so, the theory of phase consistency has become an important idea for heterogenous image matching [13,14]. However, phase coherence has a strong response to the edges of the image, while for those pixels on the non-edge, the response is close to zero and susceptible to noise interference, and the descriptors do not have enough neighborhood information, resulting in a limited descriptive ability. In order to take full advantage of the phase coherence response to the edge structure, the results of the phase coherence response are used as the edge information magnitude, and the results of the multi-scale and multi-direction Log-Gabor filtering are calculated using the phase coherence model:
where denotes the frequency distribution weights; denotes the phase deviation function; denotes the noise interference; to prevent the denominator from being zero, denotes a very small value.
To improve noise resistance, especially in response to non-uniform noise interference in infrared images, we introduced a local signal-to-noise ratio (SNR) adaptive adjustment mechanism to replace the fixed noise threshold T. The specific definition is as follows:
Among them, represents the average amplitude within the local window centered on pixel , represents the standard deviation of the window, and to prevent small values with a denominator of 0, represents the adjustment coefficient (set to 1.5 in the experiment). The final phase consistency amplitude response is normalized using the updated to improve adaptability to local noise.
2.3.2. Orientation of the Edge Where the Pixel Is Located
The direction information of the feature points in the phase coherence map not only contains the edge structure of the image but also includes the information of the corner points, which are easily mixed with the strong response noise, leading to the lack of accuracy of the direction statistics. The two-dimensional Log-Gabor odd-symmetric filter conforms to the human visual system, and the filtering result is mainly the edge structure features with higher repetition on the image, whereby the direction with the most significant feature changes is easily expressed, and it is more suitable to be used for the feature extraction of images with different modalities [15,16]. The results of convolving the image with Log-Gabor odd-symmetric filters in multiple directions and scales are projected onto the horizontal (X-axis) and vertical (Y-axis) components, and the edge orientation information is computed as follows:
where range of [0, 2π], indicating the cumulative edge direction response values.
Using the edge magnitude A and direction obtained above, the edge direction histogram within the neighborhood is constructed for each feature point. Since there is a single mapping relationship between the orientation sequence values and the true values, analogous to the gradient orientation histogram computation method, the principal direction within the neighborhood of the feature point should be along the most significant edge directions. Using the sequence values of the maximum orientation response instead of pixels, the resulting orientation information is mapped onto the corresponding 36 orientation cells, where each cell has a size of 10 degrees and contains a total of 360 degrees. The orientation of each pixel is counted in a neighborhood centered on the edge feature point, and the size of the feature value is distance-weighted using a Gaussian weight window, so that pixels closer to the center of the neighborhood carry more weight. The direction of the edge where the pixel is located is closer to the one with the largest response, and in order to reduce the interference of the response from other directions while obtaining richer features of the edge structure, the direction of the peak of the histogram is determined as the main direction of the feature point, and a coordinate system is established based on the estimated main direction.
2.4. Feature Descriptor Construction
The description of target features should be able to maximize the capture of key information about the target, minimize redundancy, and be distinguishable and robust in applications. The image is divided into 4 × 4 sub-image blocks centered on the feature points, so the descriptors contain the pixel points around the key points that contribute to them. The edge direction of the local descriptive structure image does not change due to the scale of the image; in order to improve the matching recognition rate of the feature point descriptors and reduce the dimensionality of the descriptor vectors while decreasing the computation time required, the results obtained at different scales are summed and normalized by signal squaring to obtain the cumulative structural eigenvalues of the pixels:
The orientation information obtained for each pixel is used to construct a cumulative structural orientation histogram to count the distribution of pixel orientations. We normalized the feature point descriptors (making sure their mode length was 1) and truncated them to make full use of the feature point neighborhood information to get the final distinguishable 96-dimensional feature point descriptor vectors; then, we used this set of vectors to build the descriptor point descriptors for the key points to make them independent of changes in illumination and viewing angle. To improve the reproducibility of the method, this section modularizes the process of descriptor construction and presents the complete algorithm in the form of pseudocode (Algorithm 1).
| Algorithm 1: Rotational-invariant descriptor construction based on cumulative structural response. |
| Input: Grayscale image I; keypoint set K = {k1, k2, ..., kn} Output: Descriptor set D = {di, dz, ..., dn} 1: Preprocess image (grayscale normalization, histogram equalization) 2: For each keypoint ∈ K do 3: Apply multi-scale, multi-orientation Log-Gabor filters to obtain responses , θ(x,y) 4: Compute amplitude map A(x,y) using phase congruency 5: Calculate edge orientation map O(x,y) via directional projection 6: Extract a 16×16 pixel local patch centered at kᵢ 7: Construct a 36-bin orientation histogram weighted by A and Gaussian distance 8: Determine dominant orientation θ_dom as the peak of the histogram 9: Rotate the local patch by −θ_dom for rotation invariance 10: Divide the patch into 4×4 sub-regions (each 4×4 pixels) 11: For each sub-region: 12: Compute a 6-bin orientation histogram of cumulative response 13: Concatenate all histograms into a 96-dimensional descriptor dᵢ 14: Normalize and threshold dᵢ to enhance robustness 15: End For 16: Return D |
Compared with traditional descriptors like SIFT and HOG, our method offers four key innovations: 1. robust orientation estimation: uses Log-Gabor and phase congruency to resist brightness and modality variations; 2. enhanced structural encoding: combines dominant orientation projection with multi-scale response for better continuity and rotation handling; 3. cross-modal design focus: targets rotation-invariant matching under poor quality or modality gaps; 4. lightweight and interpretable: no training needed and is easy to deploy on edge devices. These innovations contribute to improved robustness and matching accuracy in heterogeneous image scenarios.
2.5. Eigenvector Matching
It has been shown that different similarity metrics do not significantly affect the matching results of some algorithms [17]. In this work, after the feature point descriptors were extracted, we selected appropriate similarity metrics for feature point matching in response to the similarity calculation requirements between different images. It should be pointed out that there are differences in the feature dimensions and variability that different metrics focus on when measuring the similarity of image features; so, the selection of matching methods should be weighed against the characteristics of specific algorithms and the actual situation of the data. For feature matching algorithms with strong robustness, even if different similarity metrics are used, the matching effect may be approximately the same; however, in some application scenarios with higher accuracy requirements or more complex interference, choosing the appropriate metric may have a key impact on the final matching performance. Based on this, this work adopted the NNDR criterion as the initial matching method for feature points and combined it with the RANSAC algorithm to perform fine matching, in order to further eliminate mis-matched pairs and to improve the accuracy and robustness of matching.
The NNDR method first traverses each feature point descriptor in the reference image as a matching object, calculates the Euclidean distance among all descriptors of the image to be matched, and finds the two feature points with the closest distance and the next closest distance . The NNDR method is based on the following conditions. A distance ratio threshold k is set, and the matching is considered to be established when the following conditions are satisfied.
Although the initial matching has been optimized by the ratio criterion, the SIFT algorithm itself matches based on the spatial properties of the local region, which may still introduce false matching points with similar spatial properties. To solve this problem, this paper further introduces the RANSAC algorithm to judge the correctness of matching point pairs from the perspective of global geometric consistency, in order to improve the overall matching accuracy. The basic process of RANSAC is as follows: n pairs of matching points are randomly selected from the initial set of matching points, which are used to estimate the transformation matrix between the images; this transformation is substituted into the remaining matching points for verification; and if the geometric transformation error is satisfied to be less than a set threshold, the matching point is considered as an inner point, otherwise, it is an outer point. The process is repeated N times, and the group with the highest number of interior points is finally selected as the final set of valid matching points.
3. Experimental Analysis
3.1. Experimental Data and Preprocessing
In this study, three sets of image data collected in natural scenes were selected as the experimental dataset. The images used were all taken in the actual environment without human intervention, covering different lighting conditions, perspective changes, and background interference, etc., with high authenticity and complexity, which can effectively verify the robustness and adaptability of the algorithm in practical applications. All of the image data were static images in the format of BMP or JPEG, and the resolution was uniformly adjusted to a size suitable for processing to ensure the processing speed and experimental comparability. In the image preprocessing stage, the greyscaling operation was uniformly performed to eliminate the interference of color information on the feature extraction process.
Histogram equalization is a method that tends to homogenize the grey level distribution of an image by adjusting it, thus pulling apart the grey level and enhancing the image contrast. The basic principle is to expand the region with high grey level probability density and compress the region with low density, so that each grey level can be more fully utilized. For the problem of concentrated grey level distribution and insufficient layering in infrared images, the contrast and detail clarity of the image can be significantly improved after using histogram equalization. Specifically, the method calculates the cumulative probability distribution based on the histogram of the original image and then generates a new grayscale mapping function to achieve the redistribution of grayscale values. The specific steps are as follows. Let the image pixels be , with a total of grey levels, and represents the number of pixels with grey level . The probability that the grey level occurs is
where . The discrete form of the function after its equalization can be expressed as
where . It can be seen that the grey value of each pixel after equalization can be obtained directly from the histogram of the original image.
The experimental results show that the histogram equalization method is simple and easy to implement and can effectively improve the overall visual quality of infrared images, which is of great significance in practice, as shown in Figure 4.
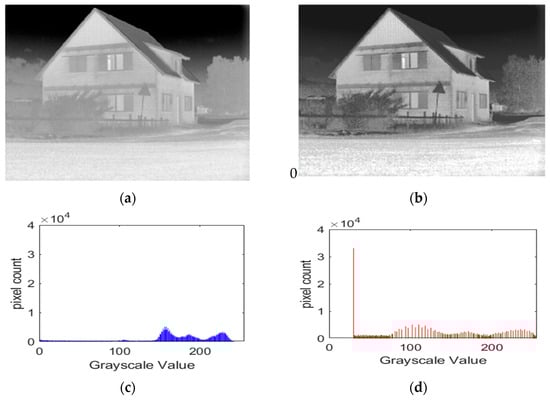
Figure 4.
Image preprocessing. (a) Raw grayscale image; (b) Grayscale map after equalization; (c) Histogram of the original grayscale; (d) Histogram of grayscale after equalization.
As shown in Figure 4, the original infrared image (Figure 4a) suffers from low contrast and poor detail visibility. After applying histogram equalization, the enhanced image (Figure 4b) exhibits improved structural clarity and brightness balance. The corresponding histograms (Figure 4c,d) demonstrate that the grayscale distribution becomes more uniform, leading to significantly enhanced contrast and clearer image details. These results confirm the effectiveness of the preprocessing step in improving the visual quality of infrared images.
3.2. Image Matching Experiment
The experimental operating system was Windows 10, the processor was Intel(R) Core(TM) i9-10900K (Intel Corporation, Santa Clara, CA, USA), the graphics card was NVIDIA RTX 3080 (NVIDIA Corporation, Santa Clara, CA, USA), and the operating memory was 64 GB. The development environment used was MATLAB R2022b (MathWorks Inc., Natick, MA, USA). The Image Processing Toolbox and Computer Vision Toolbox were mainly used for image processing, feature extraction, and matching operations. All experiments were conducted on a local computer to ensure the stability and reproducibility of the results. In this experiment, feature point matching and image fusion experiments were conducted for visible and infrared images in natural scenes. Three groups of representative scene data were selected for the experiment, each group of data included a visible image, an infrared image, and its fused image, and the results are shown in Figure 5, Figure 6, Figure 7, Figure 8, Figure 9 and Figure 10.
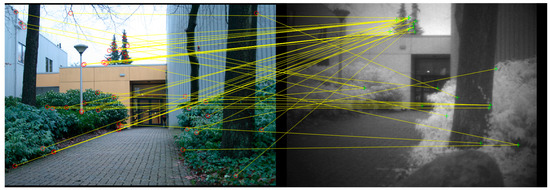
Figure 5.
Image feature point matching 1.
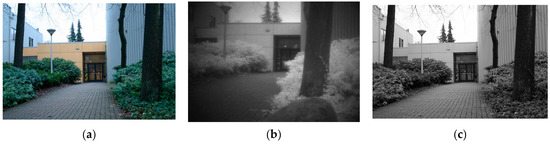
Figure 6.
Image fusion results from Figure 5. (a) Visible light images 1. (b) Infrared image 1. (c) Fusion image 1 (EN = 7.82, SSIM = 0.912).
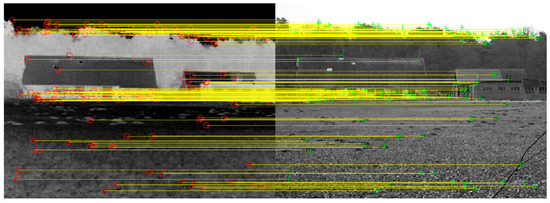
Figure 7.
Image feature point matching 2.
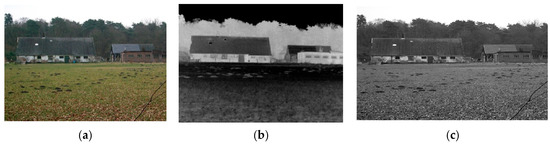
Figure 8.
Image fusion results from Figure 7. (a) Visible light images 2. (b) Infrared image 2. (c) Fusion image 2 (EN = 7.45, SSIM = 0.901).
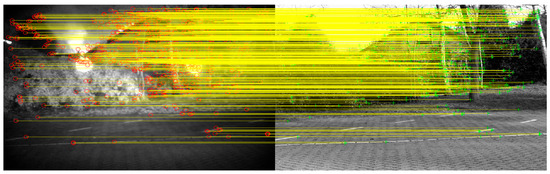
Figure 9.
Image feature point matching 3.
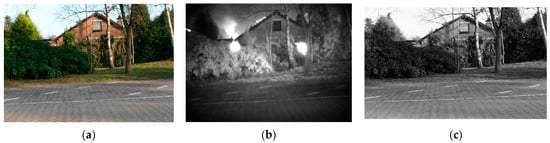
Figure 10.
Image fusion results from Figure 9. (a) Visible light images 3. (b) Infrared image 3. (c) Fusion image 3 (EN = 7.70, SSIM = 0.915).
From the feature point matching results in Figure 5, Figure 7 and Figure 9, it can be observed that a certain number of corresponding feature points can be successfully extracted between visible and infrared images using the algorithm in this paper. Although there are large differences in the texture details and luminance distribution between the visible and infrared images due to different imaging modalities, the experimental results show that a more accurate matching can be achieved through the optimized processing of grayscale normalization and feature extraction methods.
In the first set of experiments (Figure 6a,b), due to the obvious difference in the imaging characteristics of the infrared images, there are large content and texture differences between the visible and infrared images, resulting in deviations in the matching of some of the feature points (Figure 5), but the overall matching still maintains a high accuracy rate. The fusion result map (Figure 6c) shows good retention and enhancement of the main structure of the scene. In the second set of experiments (Figure 8a,b), the number of feature points is large and uniformly distributed, the matching effect is good (Figure 7), most of the feature points correspond correctly, and the fused image (Figure 8c) demonstrates the complementary information of the visible and infrared images. In the third set of experiments, there are strong changes in illumination and sparse texture in some areas of the image scene (Figure 10a,b), but the core area still maintains a good matching effect (Figure 9), and the fused image (Figure 10c) is able to retain the main structural information better. Combining the results of the three sets of experiments, it can be seen that the method adopted through this experiment can effectively achieve feature point matching and fusion between visible and infrared images with certain robustness and adaptability. The matching error is mainly concentrated in the low texture region or the region of extreme changes in illumination, and subsequent work can consider introducing multi-scale feature extraction, feature point screening optimization, and other methods to further improve the matching accuracy and fusion effect.
3.3. Experimental Analysis and Evaluation
Subjective and objective assessment criteria are two important measures of image alignment results [18,19]. Subjective assessment mainly relies on the visual reading effect of the human eye, which is relatively direct but affected by the knowledge and experience of the observer. Objective assessment through alignment accuracy, matching the correct rate and alignment time, and other indicators to measure the evaluation can effectively avoid the interference of human factors, to provide a better reference value of the performance comparison basis. In order to verify the effectiveness of the method in this paper, a variety of algorithms were selected as comparison benchmarks, and experiments were conducted on three sets of visible and infrared image data collected under natural scenes. The evaluation criteria included the comparison of the recognition rate, the comparison of the main direction estimation error, and the comparison of the alignment time consumed under different algorithms.
The recognition rate is the ratio of the number of correctly matched feature points to the total number of matched points, which reflects the robustness and accuracy of the algorithms in different scenes [20]. Table 1 demonstrates the recognition rate comparison between the method of this paper and the three algorithms on three sets of image data. SIFT [21] is a classic local feature matching method widely used in multimodal matching, with rotation and scale invariance. The structural similarity matching method proposed in Reference [22] is based on Log-Gabor edge response modeling and is representative in infrared and visible light image matching. Reference [23] designed a cumulative structural direction histogram to address image modality differences, representing a recent achievement in structural information fusion. These three methods respectively represent different strategies in traditional detection sub-modules, structural response modeling, and directional descriptor design, covering multiple comparison dimensions of the method proposed in this paper. To enhance the statistical reliability of the experimental conclusions, we repeated the test 10 times in each group and reported the mean and standard deviation of the recognition rate and main direction error. At the same time, to verify the robustness of the method described in this paper in high-noise environments, we added Gaussian white noise (mean = 0, variance = 0.01) to three sets of images and compared the changes in recognition rates under noise interference.

Table 1.
Recognition rate comparison.
As can be seen in Table 1, the method proposed in this paper achieves high recognition rates in all three datasets, especially in the case of large feature scale changes or more image noise, with better robustness and matching accuracy compared to the SIFT algorithm.
The principal direction estimation error is used to evaluate the stability of feature descriptors under rotational variations. A smaller error indicates stronger rotational robustness. Table 2 summarizes the average angular error (in degrees) of principal direction estimation across three heterogeneous image groups for four algorithms, along with their standard deviation and recognition performance under Gaussian noise.
Table 2.
Principal direction estimation error (in degrees).
Compared to traditional methods, the proposed approach yields a significantly lower principal direction estimation error across all test groups. This reflects its enhanced rotational invariance. Additionally, the method demonstrates high robustness under noise interference, as confirmed by its strong recognition performance in noisy conditions.
The alignment time is an important indicator of the computational efficiency of the algorithms. Table 3 lists the average running time of the two algorithms on three sets of images.
Table 3.
Registration time.
As can be seen from Table 3, the method in this paper maintains a high recognition rate while also having a fast alignment speed, which is suitable for practical applications in scenarios with high real-time requirements.
To evaluate the contribution of key components in our method, we performed an ablation study by selectively removing or replacing modules. Specifically, we tested the following variants: without rotation invariance: removed dominant direction alignment; without RANSAC: only used NNDR for matching; without phase congruency: replaced edge magnitude with gradient-based magnitude; without Log-Gabor filtering: replaced with Sobel filters. The recognition rates on the three image groups are shown in Table 4.
Table 4.
Recognition rate (%) under different module settings.
The results confirm that each module plays an important role. Removing rotation alignment or RANSAC significantly reduces the accuracy, while replacing Log-Gabor or phase-based features further degrades the performance, showing their effectiveness in cross-modal matching.
To enhance the comprehensiveness of the experimental evaluation, we additionally compared current representative end-to-end image matching deep learning models, including: LoFTR (Detector-Free Matching with Transformers, CVPR 2021); MatchFormer (Feature Matching with Transformers, CVPR 2022); SuperPoint (CVPR 2018, lightweight detection and description model); D2-Net (Dense & Deep Descriptor, CVPR 2019). The comparison experiments were conducted on the same hardware platform (Intel i7 + RTX 3080), with the following results:
The comparison results in Table 5 demonstrate that although recent transformer-based deep models achieve the highest matching accuracy, our proposed method still delivers competitive results with significantly lower computational requirements and no dependence on large-scale training datasets. This makes it particularly suitable for deployment in resource-constrained or real-time applications.
Table 5.
Performance comparison of different methods in heterogeneous image matching method.
4. Conclusions
Aiming at the problems of limited descriptor recognition ability and insufficient adaptation to rotational changes in heterogenous image matching, this paper proposes a heterogenous image matching fusion method based on cumulative structural similarity. By introducing Log-Gabor odd-symmetric filter to extract multi-scale and multi-direction edge information combined with the principle of phase consistency to calculate the edge magnitude, a robust edge orientation feature map is constructed. On this basis, a local coordinate system is established using principal direction estimation, and the rotational invariance of the feature point descriptors is achieved. Highly discriminative descriptors are further constructed by the cumulative structural response in the maximum direction, which effectively improves the accuracy and robustness of heterogenous image matching.
The proposed method is applicable to defense surveillance, remote sensing, smart security, and autonomous navigation, while showing limitations in low-texture or non-rigid deformation scenarios. Future work may explore deep learning integration to enhance adaptability. The experimental results show that the method in this paper achieves better matching performance than the traditional descriptors on several representative heterogenous image datasets, which verifies the practicality and promotion value of the proposed method under complex imaging conditions.
Author Contributions
Methodology, N.Z. and Z.W.; validation, S.Y. and Z.W.; investigation, N.Z.; writing—original draft preparation, S.Y., and Z.W.; writing—review and editing, N.Z. and Z.W. All authors have read and agreed to the published version of the manuscript.
Funding
This work was supported in part by Yantai City 2021 School-Land Integration Development Project Fund under Grant 1521001-WL21JY01 and the Science and Technology-Based Small and Medium Sized Enterprise Innovation Capacity Enhancement Project of Shandong Province under Grant 2023TSGC0823.
Institutional Review Board Statement
Not applicable.
Informed Consent Statement
Not applicable.
Data Availability Statement
The data presented in this study are available on request from the corresponding author. The data are not publicly available due to privacy or ethical restrictions.
Acknowledgments
The authors would like to thank all reviewers for their helpful comments and suggestions on this paper.
Conflicts of Interest
The authors declare no conflicts of interest.
References
- Liu, J.; Wu, G.; Liu, Z.; Wang, D.; Jiang, Z.; Ma, L.; Zhong, W.; Fan, X.; Liu, R. Infrared and Visible Image Fusion: From Data Compatibility to Task Adaption. IEEE Trans. Pattern Anal. Mach. Intell. 2024, 47, 2349–2369. [Google Scholar] [CrossRef] [PubMed]
- Liu, Q.; Wang, X. Bidirectional Feature Fusion and Enhanced Alignment Based Multimodal Semantic Segmentation for Remote Sensing Images. Remote Sens. 2024, 16, 2289. [Google Scholar] [CrossRef]
- Li, Y.; Liu, Y.; Su, X.; Luo, X.; Yao, L. Review of Infrared and Visible Image Registration. Infrared Technol. 2022, 44, 641–651. [Google Scholar]
- Che, K.; Lv, J.; Gong, J. Robust and Efficient Registration of Infrared and Visible Images for Vehicular Imaging Systems. Remote Sens. 2024, 16, 4526. [Google Scholar] [CrossRef]
- Liu, J.; Wu, Y.; Huang, Z. SMoA: Searching a Modality-Oriented Architecture for Infrared and Visible Image Fusion. IEEE Signal Process. Lett. 2021, 28, 1818–1822. [Google Scholar] [CrossRef]
- Chen, Z.; Yang, X.; Zhang, C.; Duan, X. Infrared and visible image registration based on R-MI-rényi measurement. J. Electron. Meas. Instrum. 2018, 1, 1–8. [Google Scholar]
- Ye, Y.; Bruzzone, L.; Shan, J.; Bovolo, F.; Zhu, Q. Fast and Robust Matching for Multimodal Remote Sensing Image Registration. IEEE Trans. Geosci. Remote Sens. 2019, 57, 9059–9070. [Google Scholar] [CrossRef]
- Min, C.; Gu, Y.; Yang, F.; Li, Y.; Lian, W. Non-Rigid Registration for Infrared and Visible Images via Gaussian Weighted Shape Context and Enhanced Affine Transformation. IEEE Access 2020, 8, 42562–42575. [Google Scholar] [CrossRef]
- Li, Q.; Han, G.; Liu, P.; Yang, H.; Wu, J. An Infrared-Visible Image Registration Method Based on the Constrained Point Feature. Sensors 2022, 21, 1188. [Google Scholar] [CrossRef]
- Liu, S.; Yang, B.; Wang, Y.; Tian, J.; Yin, L.; Zheng, W. 2D/3D Multimode Medical Image Registration Based on Normalized Cross-Correlation. Appl. Sci. 2022, 12, 2828. [Google Scholar] [CrossRef]
- Zhang, W.; Li, T.; Zhang, Y. LTFormer: A light-weight transformer-based self-supervised matching network for heterogeneous remote sensing images. Inf. Fusion 2024, 109, 102425. [Google Scholar] [CrossRef]
- Cao, F.; Shi, T.; Han, K.; Wang, P.; An, W. Log-Gabor filter-based high-precision multi-modal remote sensing image matching. Acta Geod. Cartogr. Sin. 2024, 53, 526–536. [Google Scholar]
- Li, J.; Zhou, R.; Ruan, Z. Research on the registration of infrared and visible images based on phase consistency and edge extreme points. IET Image Process. 2025, 19, e13317. [Google Scholar] [CrossRef]
- Wang, Q.; Gao, X.; Wang, F.; Ji, Z. Feature Point Matching Method Based on Consistent Edge Structures for Infrared and Visible Images. Appl. Sci. 2020, 10, 2302. [Google Scholar] [CrossRef]
- Yao, Q.; Song, D.; Xu, X.; Zou, K. Visual Feature-Guided Diamond Convolutional Network for Finger Vein Recognition. Sensors 2024, 24, 6097. [Google Scholar] [CrossRef]
- Lv, L.; Yuan, Q.; Li, Z. An algorithm of Iris feature-extracting based on 2D Log-Gabor. Multimed. Tools Appl. 2019, 78, 22643–22666. [Google Scholar] [CrossRef]
- Zhang, S. Infrared feature extraction and recognition technique for human motion posture based on similarity metric. Mil. Autom. 2025, 44, 35–40. [Google Scholar]
- Maksimović-Moićević, S.; Lukač zeljko, Ž.; Temerinac, M. Objective estimation of subjective image quality assessment using multi-parameter prediction. IET Image Process. 2019, 13, 2428–2435. [Google Scholar] [CrossRef]
- Guan, S.Y.; Wang, T.M.; Meng, C. A Review of Point Feature Based Medical Image Registration. Chin. J. Mech. Eng. 2018, 31, 76. [Google Scholar] [CrossRef]
- Xia, X.; Xiang, H.; Cao, Y.; Ge, Z.; Jiang, Z. Feature Extraction and Matching of Humanoid-Eye Binocular Images Based on SUSAN-SIFT Algorithm. Biomimetics 2023, 8, 139. [Google Scholar] [CrossRef]
- Zhu, D. SIFT algorithm analysis and optimization. In Proceedings of the 2010 International Conference on Image Analysis and Signal Processing, Zhejiang, China, 9–11 April 2010; pp. 415–419. [Google Scholar]
- Chen, X.; Shen, K.; Li, Y. Log-Gabor coefficient correlation structure and its application to image retrieval. Comput. Simul. 2022, 39, 180–185. [Google Scholar]
- Xie, X. Multimodal remote sensing image matching with cumulative structural feature description. Telecommun. Technol. 2022, 62, 1780–1785. [Google Scholar]
- Zhu, Z.; Song, X.; Cui, W.; Qi, F. A review of visible-infrared image fusion for target detection. Comput. Eng. Appl. 2025, 1–26, in press. [Google Scholar]
Disclaimer/Publisher’s Note: The statements, opinions and data contained in all publications are solely those of the individual author(s) and contributor(s) and not of MDPI and/or the editor(s). MDPI and/or the editor(s) disclaim responsibility for any injury to people or property resulting from any ideas, methods, instructions or products referred to in the content. |
© 2025 by the authors. Licensee MDPI, Basel, Switzerland. This article is an open access article distributed under the terms and conditions of the Creative Commons Attribution (CC BY) license (https://creativecommons.org/licenses/by/4.0/).