Article

A Novel Algorithm for Recovering Out-of-Service Loads in Smart Distribution Systems Following Exposure to Cyber-Attacks

by
Mohamed Goda
1,*,
Mazen Abdel-Salam
2,
Mohamed-Tharwat El-Mohandes
2 and
Ahmed Elnozahy
2
1
Electrical Engineering Department, October 6 University, Giza 12566, Egypt
2
Electrical Engineering Department, Assiut University, Assiut 71515, Egypt
*
Author to whom correspondence should be addressed.
Electronics 2025, 14(13), 2641; https://doi.org/10.3390/electronics14132641
Submission received: 20 April 2025 / Revised: 26 June 2025 / Accepted: 26 June 2025 / Published: 30 June 2025
(This article belongs to the Special Issue Cybersecurity for Smart Power Systems and Transmission Networks)

Abstract

An algorithm is proposed to recover out-of-service loads (OOSLs) in smart distribution systems (SDSs) after exposure to cyber-attacks (CAs) resulting in interruptions of in-service loads (INSLs). The proposed algorithm is implemented in three steps. The first step is based on building the SDS in matrix form to be data input to the proposed algorithm. The second step is concerned with classifying the SDS into three zones: the attacked zone, the primary neighbor zone, and the secondary neighbor zone. The third step is performing five maneuvering processes (MPs) to recover the OOSL without breaking the electric limitations (ELs). The ELs are related to the maximum branch current, the node voltage, the load priority, the radiality maintenance of the SDS, the minimum system total power loss, the instruction sequence of the automatic-communication-switches (ACS), and the minimum number of ACSs. The proposed algorithm was tested under a 70-bus SDS with four electric supply feeders. The proposed algorithm achieved supply recovery for all OOSLs with efficiency of 100% after the occurrence of a CA on a single or double ACS without breaking the ELs. The proposed algorithm succeeded in achieving supply recovery for 97.6%, 97.1%, and 96.4% of the OOSLs after the simultaneous occurrence of a CA on three, four, and five ACSs, respectively, without breaking the ELs. The advantages of the proposed algorithm are a lack of dependency on the system size, a short electric supply recovery time within the range of 190–199 ms, a lack of dependency on distributed generation (DG), and the achievement of self-healing in the SDS following a single and two simultaneous CAs, as well as almost achieving self-healing under exposure to three, four, and five simultaneous CAs.

1. Introduction

An SDS contains a high level of software that enables electrical components to be highly controllable, secure, and self-healing [1]. This software communicates with the control system, protection system, information technology components, operational technology components, advanced metering infrastructure, supervisory control and data acquisition (SCADA) components, measurement devices, distributed generation, and main electrical components. As the distribution system contains a lot of software, the probability of being exposed to hacking is high. CAs are one of the most important challenges that modern smart distribution systems face [2].
There are three directions in research related to CAs in SDSs. The first direction is concerned with how CAs affect SDSs. CAs can affect electrical components and protocol devices. The electrical components include generators, electric vehicles, transmission lines, transformers, and automatic controlled switches [3,4,5,6,7]. The protocol components include advanced metering systems, server infrastructure, routers, SCADA systems, wireless communication signals, and Internet of Things (IoT) technologies. Cyber-attacks in such systems often involve injecting false data to generate incorrect commands [8,9,10,11].
The second direction of research discusses the impact of CAs on SDSs, which can lead to the complete or partial shutdown of electricity distribution. Smart distribution systems are designed to optimize power delivery. A CA could disable optimization algorithms, leading to inefficient load balancing and overloading certain parts of the grid, while others remain partly loaded, with potential to cause local failures. Attackers could gain remote access to an SDS to manipulate equipment settings, disable monitoring, or make unauthorized changes. This could result in malfunctioning, the destruction of equipment, or the theft of data [12,13,14,15].
The third direction discusses how to block a chain of CAs in an SDS. Advanced firewalls are used to monitor and filter network traffic, protecting the grid from unauthorized access and potential threats. Systems are set up to detect and stop harmful or suspicious activity on a network. Segmenting the network into smaller, isolated parts can prevent the harm from spreading. For example, separating operational technology (OT) networks from information technology (IT) networks can localize the attacked area. Strong encryption is used to protect data transition between smart meters, substations, control centers, and other devices. This ensures that sensitive data cannot be intercepted or altered by attackers. The regular back-up of system configurations, critical data, and software is performed [16,17,18,19,20].
The current paper presents, for the first time, a new research direction toward the supply recovery of the OOSL following a CA hitting an SDS. To the authors’ knowledge, this may be the first work that addresses the supply recovery of the OOSL of an SDS exposed to a CA hitting the ACS, because the related research in the literature is limited.
In 2015, the power distribution network of Western Ukraine was cyber-attacked, causing 225 thousand households to be out of service for two hours [21]. In 2016, the power distribution network of Kyiv was attacked by hackers, leaving end-users without ES for six hours [22]. In 2014, a CA hacked South Korean power generation networks to interrupt the ES of 50 thousand end-users for 3 h [23]. In 2017, a CA was directed against Saudi Arabian power transmission systems, causing a supply interruption for 12 h [24]. In 2003, a blackout occurred in the United States and Canada due to large CAs causing a delusional fault in the utility systems, so the protection systems took incorrect actions [25].
The occurrence of CAs in SDSs hinders the self-healing of SDSs. The supply recovery of the OOSL following a CA is the responsibility of the recovery algorithm [26]. The difference between a fault and a CA imposed on an SDS is that a fault causes a faulty load and OOSL but the CA leaves only the OOSL [26]. 
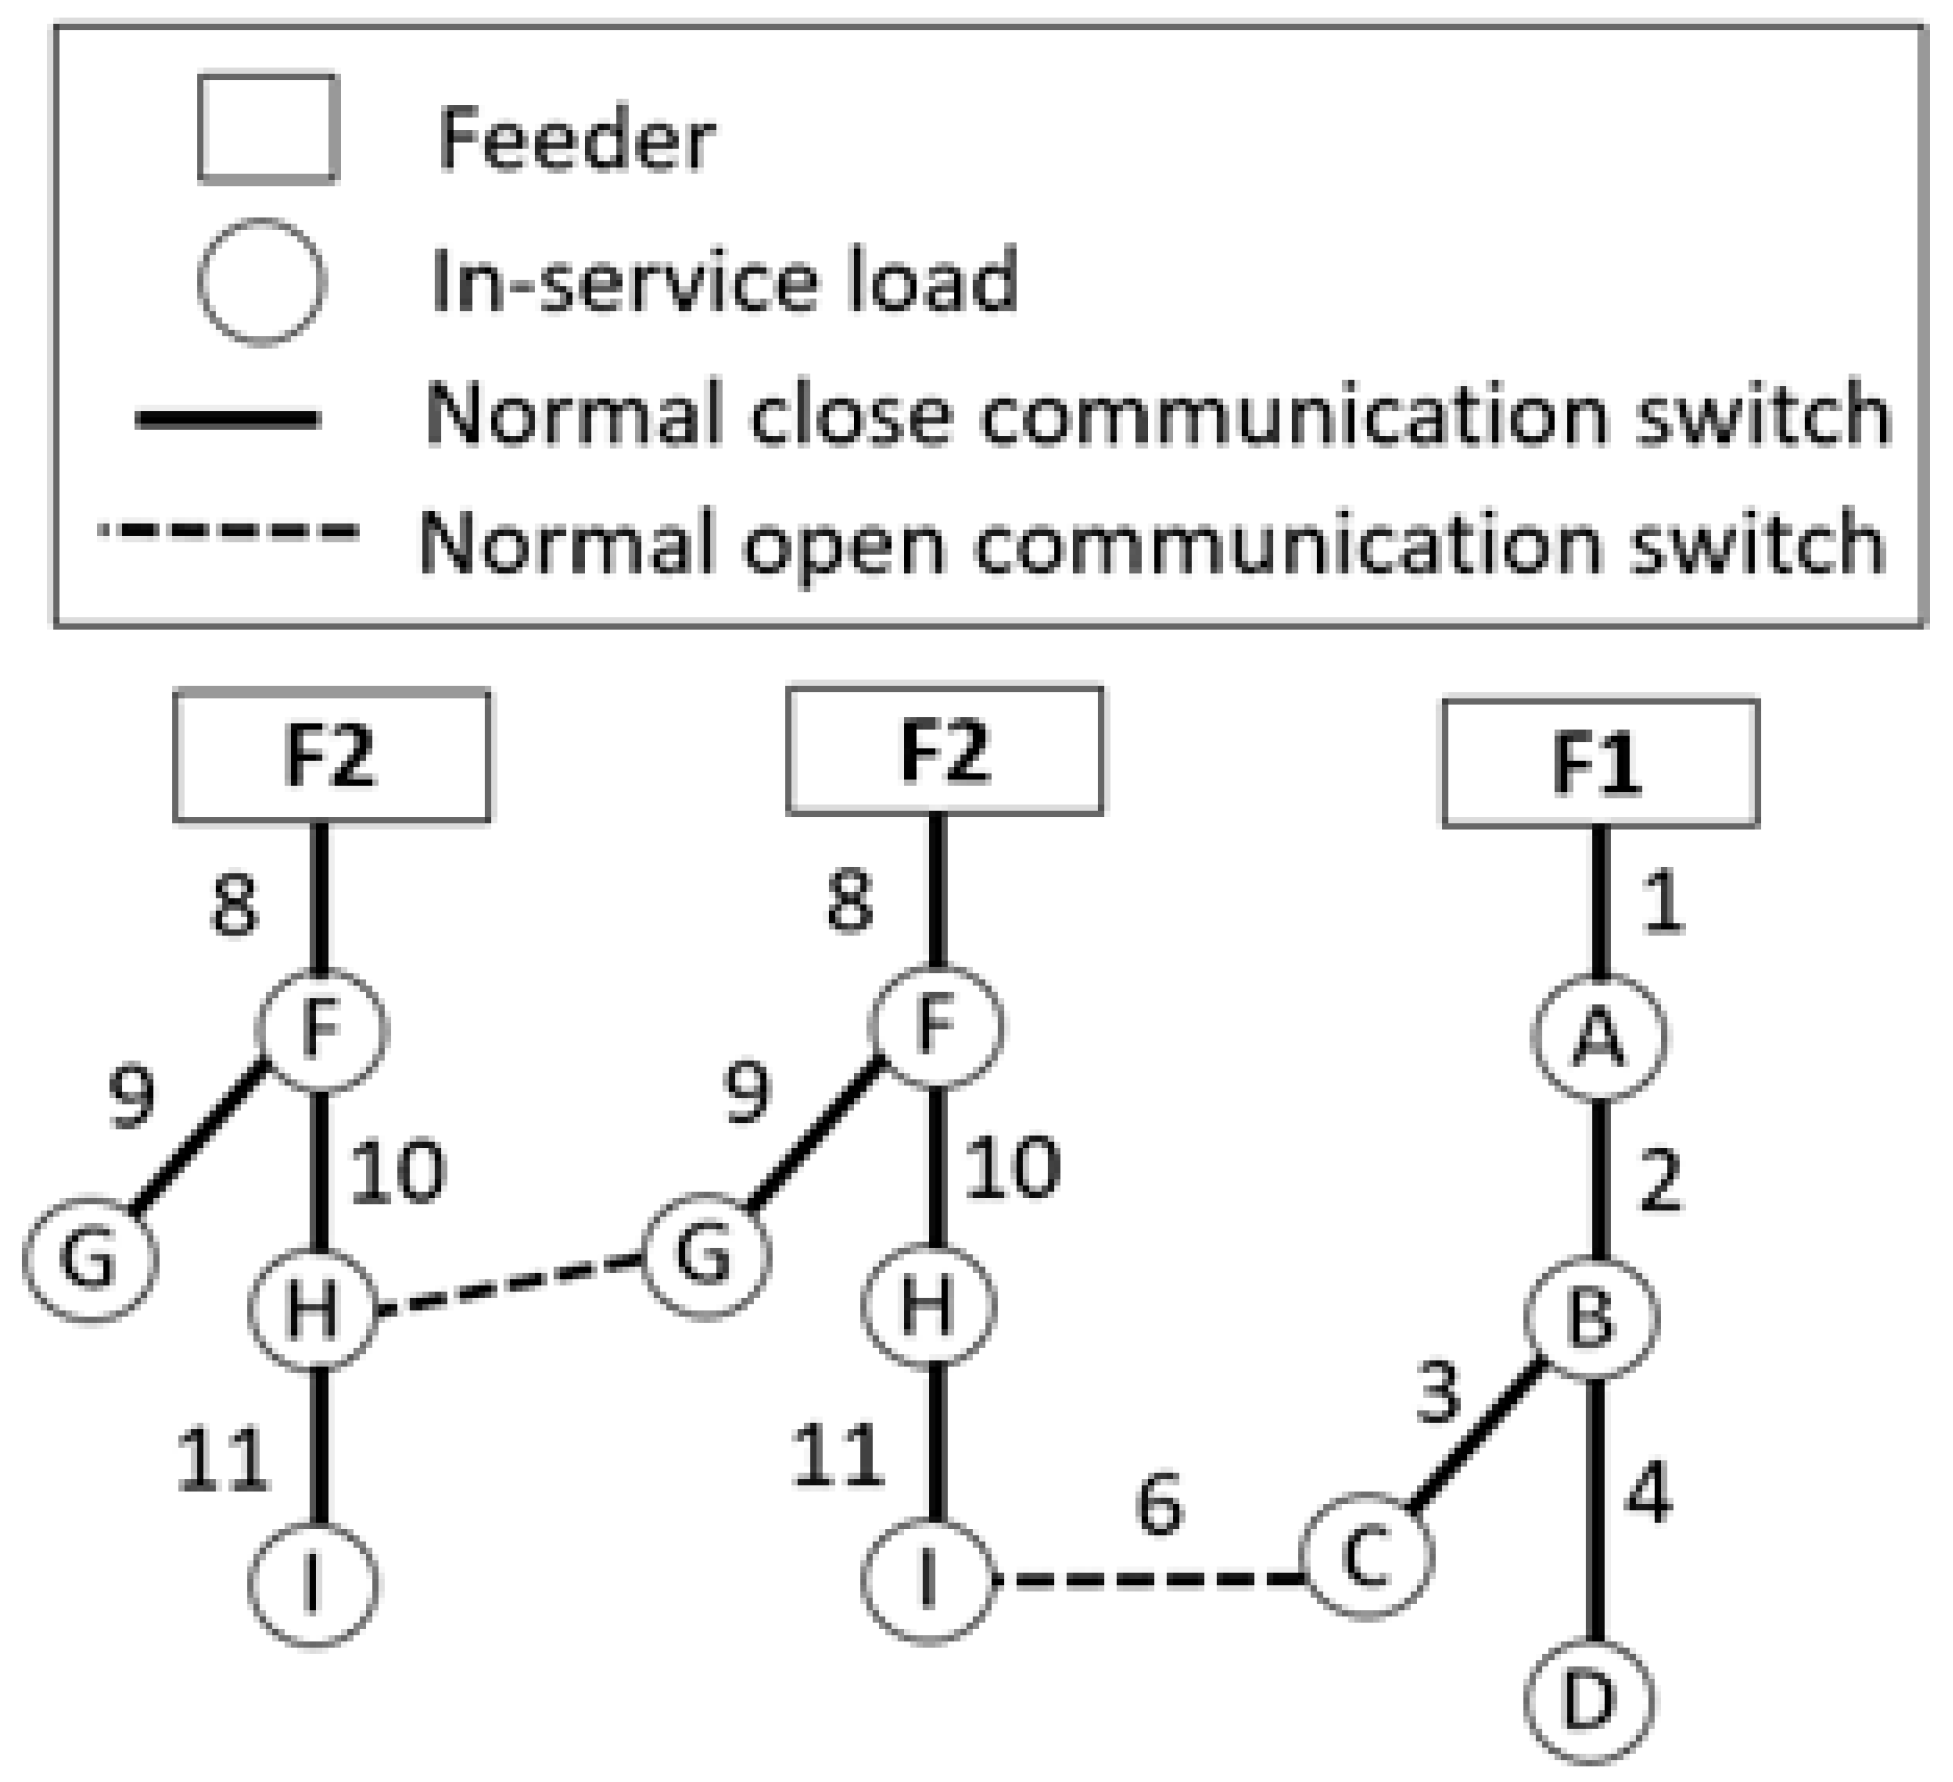
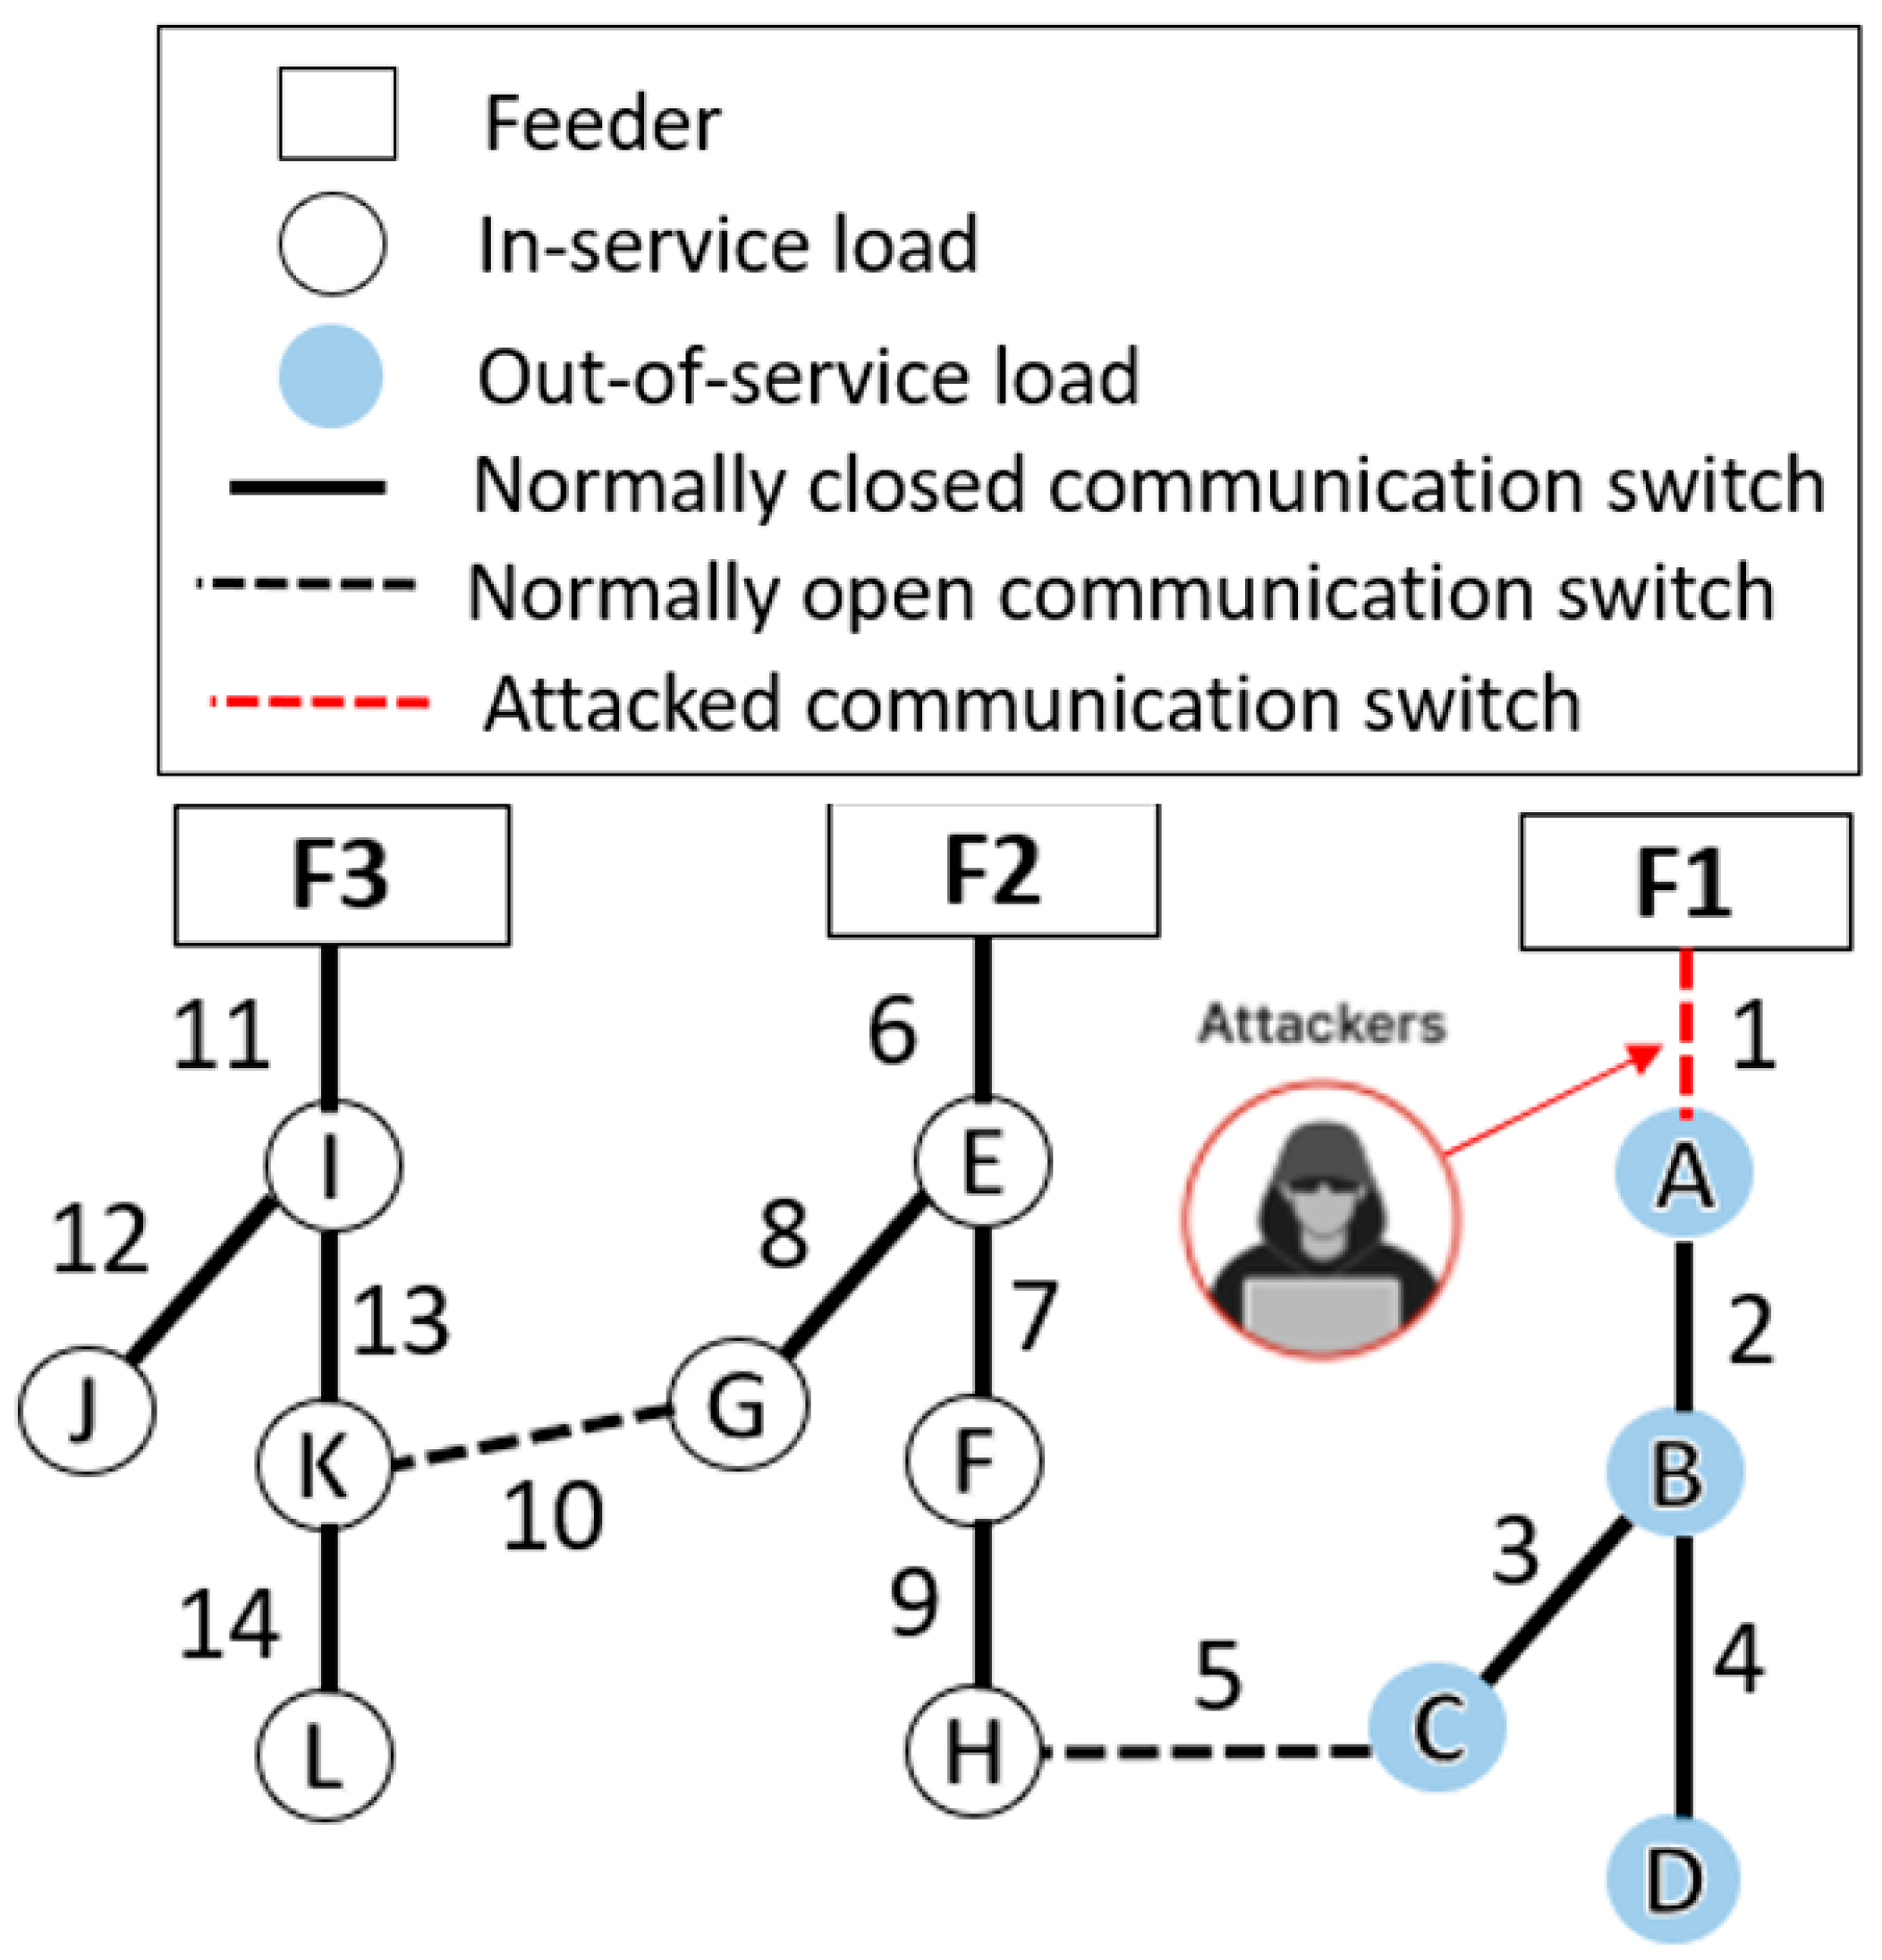
Figure 1 shows a 15-bus SDS with three electric supply feeders. A CA hits the SDS at ACS No. 1, causing the downstream loads from A through D to be OOSLs; see Figure 2. The objective of the proposed algorithm is to restore the ES for the OOSL without breaking the EL.
The proposed algorithm ultimately prevents hackers from achieving their goal to turn off the electrical distribution systems. The proposed algorithm adds to the software of the smart grid in rendering it more automated, secure, and self-healing. The proposed algorithm increases the resilience of distribution networks in exposure to cyber-wars, such as the one that occurred in 2025 when Pakistani hackers launched a CA to target Indian power systems. The proposed algorithm can be implemented in the control centers or intelligent electronic devices of the smart distribution system or in the resilience modules in the energy management system.
The reliability and resilience of a 39-bus and IEEE 30-bus system was enhanced by 22% [27] after experiencing a CA by enabling the system to recover from the threat. The number of maintenance personnel was increased after the occurrence of a CA to recover the ES for the OOSL [28]. The ability of the SDS to withstand a CA was enhanced by using a large number of electric vehicles as distributed generators to feed the OOSL after the occurrence of a CA [29]. A part of the outage area was restored after experiencing a CA by adding DG resources to support the smart distribution system against CAs [30]. An optimized algorithm based on mixed-integer linear programming was proposed to handle load interruptions following a CA. This algorithm was based on the philosophy of first fail first repair [31].
The originality and novelty of this paper are represented as follows:
(i).
A novel algorithm is proposed for the first time to recover the ES for the OOSL after the occurrence of a CA on an ACS in the SDS, regardless of whether the CA occurs on a single or multiple ACSs.
(ii).
The proposed algorithm takes into consideration the EL regarding (a) the maximum feeder current, (b) the voltage limits of each node, (c) the load priority, (d) the radiality maintenance of the SDS, and (d) the instruction sequence of the ACS, as well as minimizing their number and (f) achieving the minimum total system power loss.
(iii).
The proposed algorithm shows better performance irrespective of the (a) number of OOSLs, (b) system size, (c) operation with or without DGs, and (d) number of simultaneous CAs.
(iv).
The proposed algorithm shows better performance according to (a) the time of electric service recovery, (b) the ability to achieve self-healing, and (c) testing under single and simultaneous CAs.
The rest of the paper is organized as follows. Section 2 addressees the proposed algorithm. Section 3 contains the results obtained on applying the proposed algorithm to a 70-bus SDS with four electric supply feeders exposed to CAs. Section 4 contains the conclusions.

2. Proposed Algorithm

The novelty and originality of the proposed algorithm is based on achieving the self-healing goal after the occurrence of a single or simultaneous CAs hitting the ACS in the SDS, without breaking seven ELs. In this context, the goal of the proposed recovery algorithm is to guarantee the continuity of the ES to the OOSL following exposure to a CA as early as possible, without breaking the ELs, which are as follows.
Electric limitation 1 (EL1): This limitation is concerned with the maximum branch current and node voltage limits. It is forbidden to transfer loads in the maneuvering process to a branch if it becomes overloaded or the voltage limit is exceeded. The overloading causes an outage for all loads connected to the overloaded branch, without recovering the OOSL.
Electric limitation 2 (EL2): The proposed algorithm should guarantee that the system is radial after the maneuvering process (MP).
Electric limitation 3 (EL3): The proposed algorithm should take into consideration the load priority. For this reason, the recovery algorithm should first recover the OOSL with the highest priority index before those with lower priority.
Electric limitation 4 (EL4): The proposed algorithm should minimize the total system power loss by performing system reconfiguration.
Electric limitation 5 (EL5): The proposed algorithm should minimize the number of commanded ACSs when recovering the OOSL.
Electric limitation 6 (EL6): The proposed algorithm should take into consideration the sequence of the commanded ACSs.
Electric limitation 7 (EL7): The proposed algorithm should restore the OOSL upon the occurrence of simultaneous CAs. Multiple cyber-attacks can simultaneously target the same number of automatic communication switches. This means that each cyber-attack is responsible for changing the state of a single switch from closed to open, thereby disconnecting all downstream loads from the power supply. In other words, each CA hits only one automatic switch.
The proposed algorithm is based on three sequential steps as follows.
Step 1: This step is responsible for defining the data of the SDS to serve the proposed algorithm, regardless of the system size of the SDS, with/without DGs. This points to two advantages of the proposed algorithm: (a) independence from the system size and (b) independence from the DGs. It is worth mentioning that the proposed algorithm is independent of the complexity of the CAs because the implementation of the proposed algorithm occurs after the CA. The data should be defined for the proposed algorithm in matrix form, as shown in Figure 3. This matrix consists of three rows, and the number of columns is equal to the number of ACSs in the SDS. Each column consists of the switch connecting the upstream node and the downstream node. The switch is defined by its name and its status, e.g., C represents a closed status and O represents an open status. Figure 3 provides a representation of the 15-bus SDS that is shown in Figure 1 in matrix form, serving as data input for the proposed algorithm. For example, the first column represents a normally closed switch, No. 1, linking upstream node F1 to downstream node A. The second column represents a normally closed switch, No. 2, linking upstream node A to downstream node B.
Step 2: This step is responsible for dividing the SDS into three zones after the occurrence of a CA as follows.
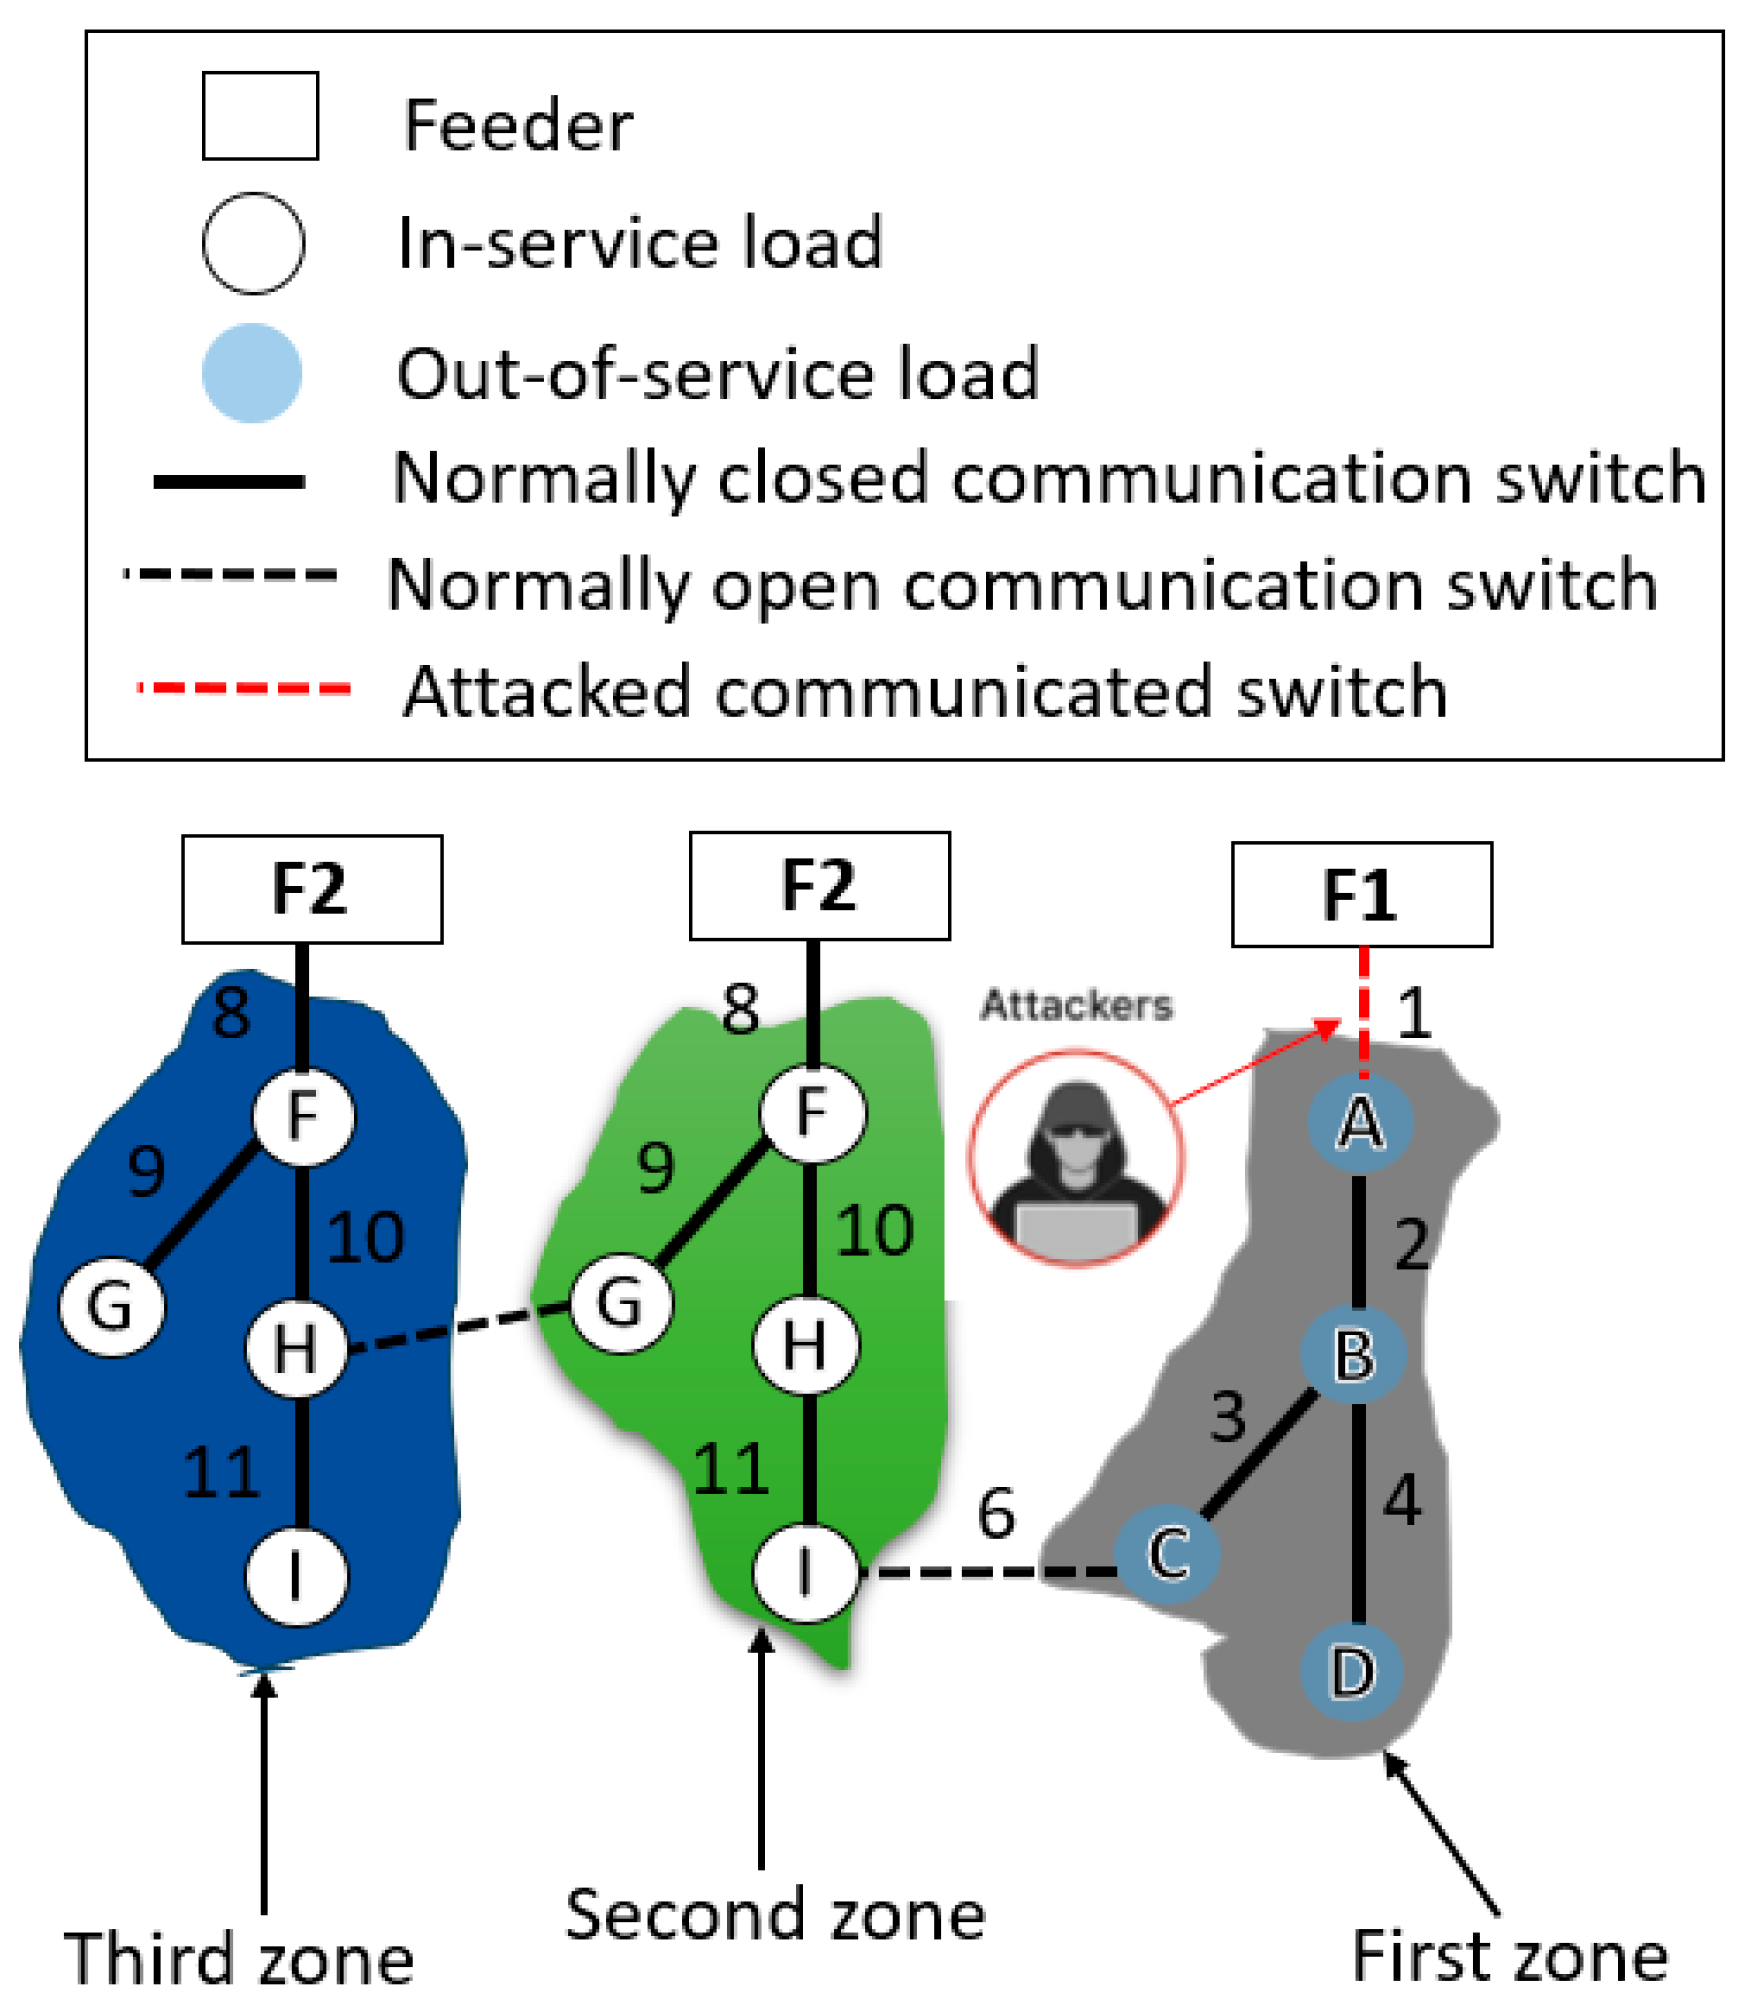
Step 2.1: “The attacked zone” includes the OOSL zone, which includes all downstream OOSLs, as sown in Figure 4.
Step 2.2: “The primary neighbor zone” accommodates loads that link directly to the attacked zone only through a normally open ACS, as shown in Figure 4. This normally open ACS is responsible for performing the first maneuvering process for automatic load transfer from the attacked zone to the primary neighbor zone.
Step 2.3: “The secondary neighbor zone” accommodates the loads that link the secondary neighbor zone through a normally open ACS (Figure 4) to perform the second maneuvering process, which is represented by redistributing the loads among the primary and secondary neighbor zones after breaking the EL related to the maximum feeder current in the first maneuvering process.
Step 3: This step is responsible for generating one feasible solution among several ones as follows.
Step 3.1: If there is more than one maneuvering process, the proposed algorithm performs the maneuvering process that feeds the highest-priority loads.
Step 3.2: The proposed algorithm arranges the ACS to feed the largest load first.
Step 3.3: If the proposed algorithm generates more than one feasible solution, the algorithm chooses the solution that achieves the following:
(i).
The minimum number of ACSs;
(ii).
The minimum power loss as estimated by a load flow study.
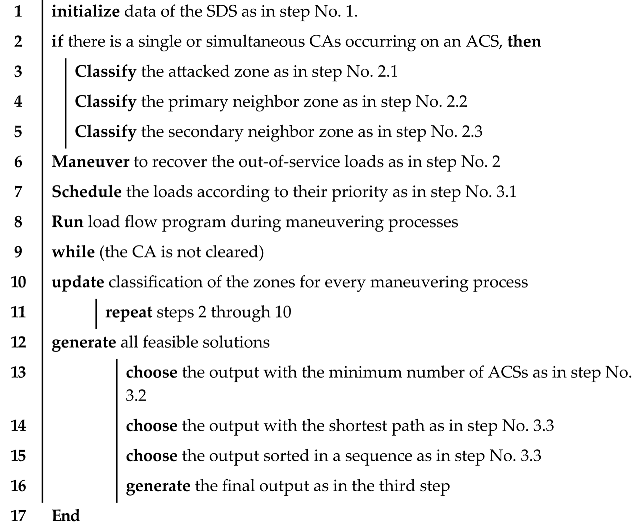
The steps of the proposed algorithm are described in Algorithm 1.
Algorithm 1: The steps of the proposed algorithm
Electronics 14 02641 i001

3. Results and Discussion

The proposed algorithm is based on achieving self-healing after the occurrence of a single or simultaneous CAs hitting the ACS in the SDS, without breaking seven ELs. 
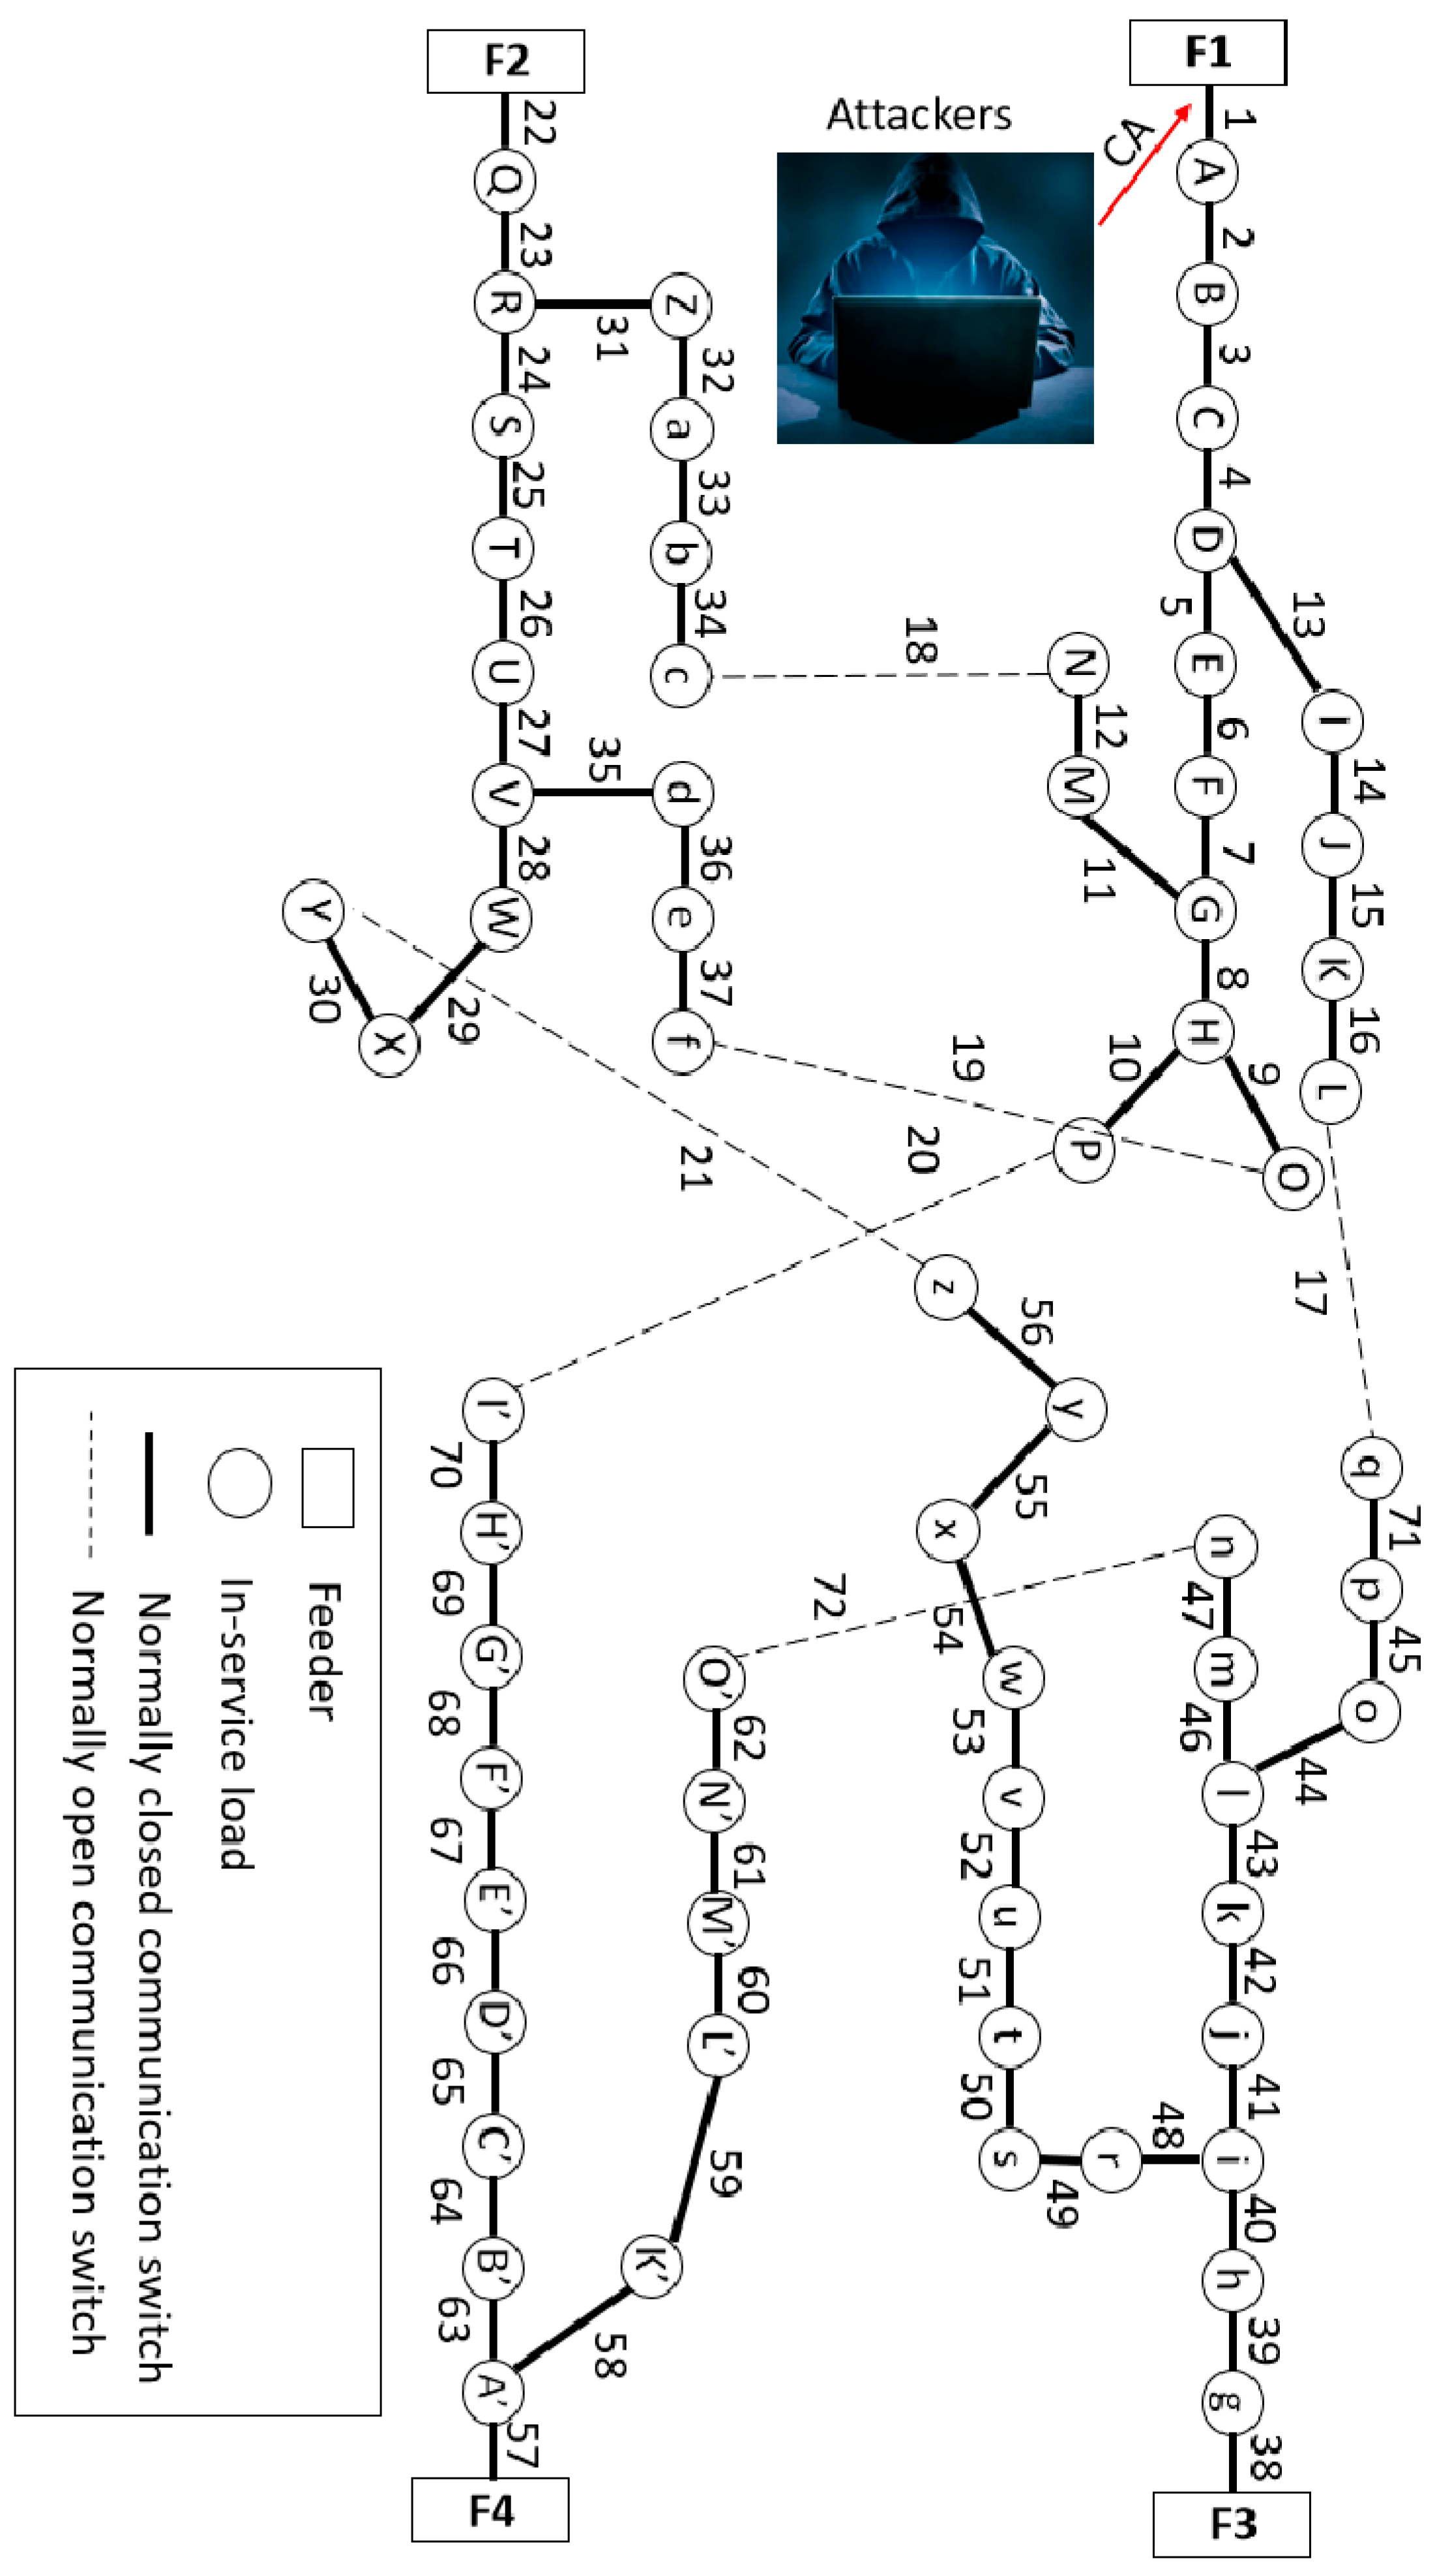
Figure 5 shows the SDS used for the testing of the proposed algorithm. This system consists of a 70-bus setup with four electric supply feeders. In power engineering terminology, tie and sectionalize switches are adopted. However, the terminology used here refers to these switches as normally open communication and normally closed communication switches, respectively. The circle represents the load, the solid line represents a normally closed ACS, and the dashed line represents a normally open ACS, while the rectangle represents the feeder. There is a priority index assigned to each load, i.e., high, medium, and low. It is worth mentioning that the efficiency of the proposed algorithm following the occurrence of a CA does not change according to the priority index of the load.
The performance of the proposed algorithm is evaluated as follows:
  • The recovery efficiency is equal to the ratio of the number of successful cases to the number of all possible cases.
  • The recovery time represents the time from the occurrence of the CA until the time of recovery of the OOSLs.
  • The following seven electric limitations (ELs) are satisfied:
    3.1 EL1 addresses the maximum branch current and node voltage limits.
    3.2 EL2 guarantees the maintenance of system radiality.
    3.3 EL3 considers the load priority.
    3.4 EL4 aims at minimizing the total system power loss.
    3.5 EL5 aims at minimizing the number of commanded ACSs.
    3.6 EL6 considers the sequence of the commanded ACSs.
    3.7 EL7 restores OOSLs with the occurrence of simultaneous CAs.

3.1. Electric Service Recovery in SDS Following Exposure to Single CA

The number of possible cases of a single CA is equal to 66. Table 1 shows the performance of the proposed algorithm under all possible cases of a single CA. The proposed algorithm achieves supply recovery for all OOSLs with efficiency of 100% after the occurrence of a CA on a single ACS, without breaking the ELs. For example, consider a single CA occurring at ACS No. 1, which results in disconnecting load nodes from A through P. The proposed algorithm generates feasible outputs in the sequence S W 13 O , S W 8 O , S W 18 C , S W 17 C , S W 20 C , which results in supply recovery for all OOSLs in 194 ms without breaking the ELs.
There are many infeasible solutions that the proposed algorithm does not generate. Among the infeasible solutions is S W 17 C , which breaks the EL related to the overloading of feeder F3, with the subsequent outage of its loads and without supply recovery of the OOSL from A through P. The second infeasible solution is S W 19 C , which breaks the EL related to the overloading of feeder F2, with a subsequent outage for its loads and without supply recovery of the OOSL from A through P. The third infeasible solution is S W 20 C , which breaks the EL related to the overloading of feeder F4, with a subsequent outage for its loads and without supply recovery of the OOSL from A through P. The fourth infeasible solution is S W 13 O , S W 8 O , S W 17 C , S W 20 C , S W 18 C , which leads to the breakage of the EL related to this sequence of ACSs. The fifth infeasible solution is S W 13 O , S W 7 O ,   S W 8 O , S W 17 C , S W 20 C , S W 18 C , S W 19 C ,   which breaks the EL related to minimizing the number of ACSs.
The proposed algorithm succeeds in recovering the OOSL in the SDS following exposure to a single CA for all 66 possible cases, with efficiency of 100%—see 
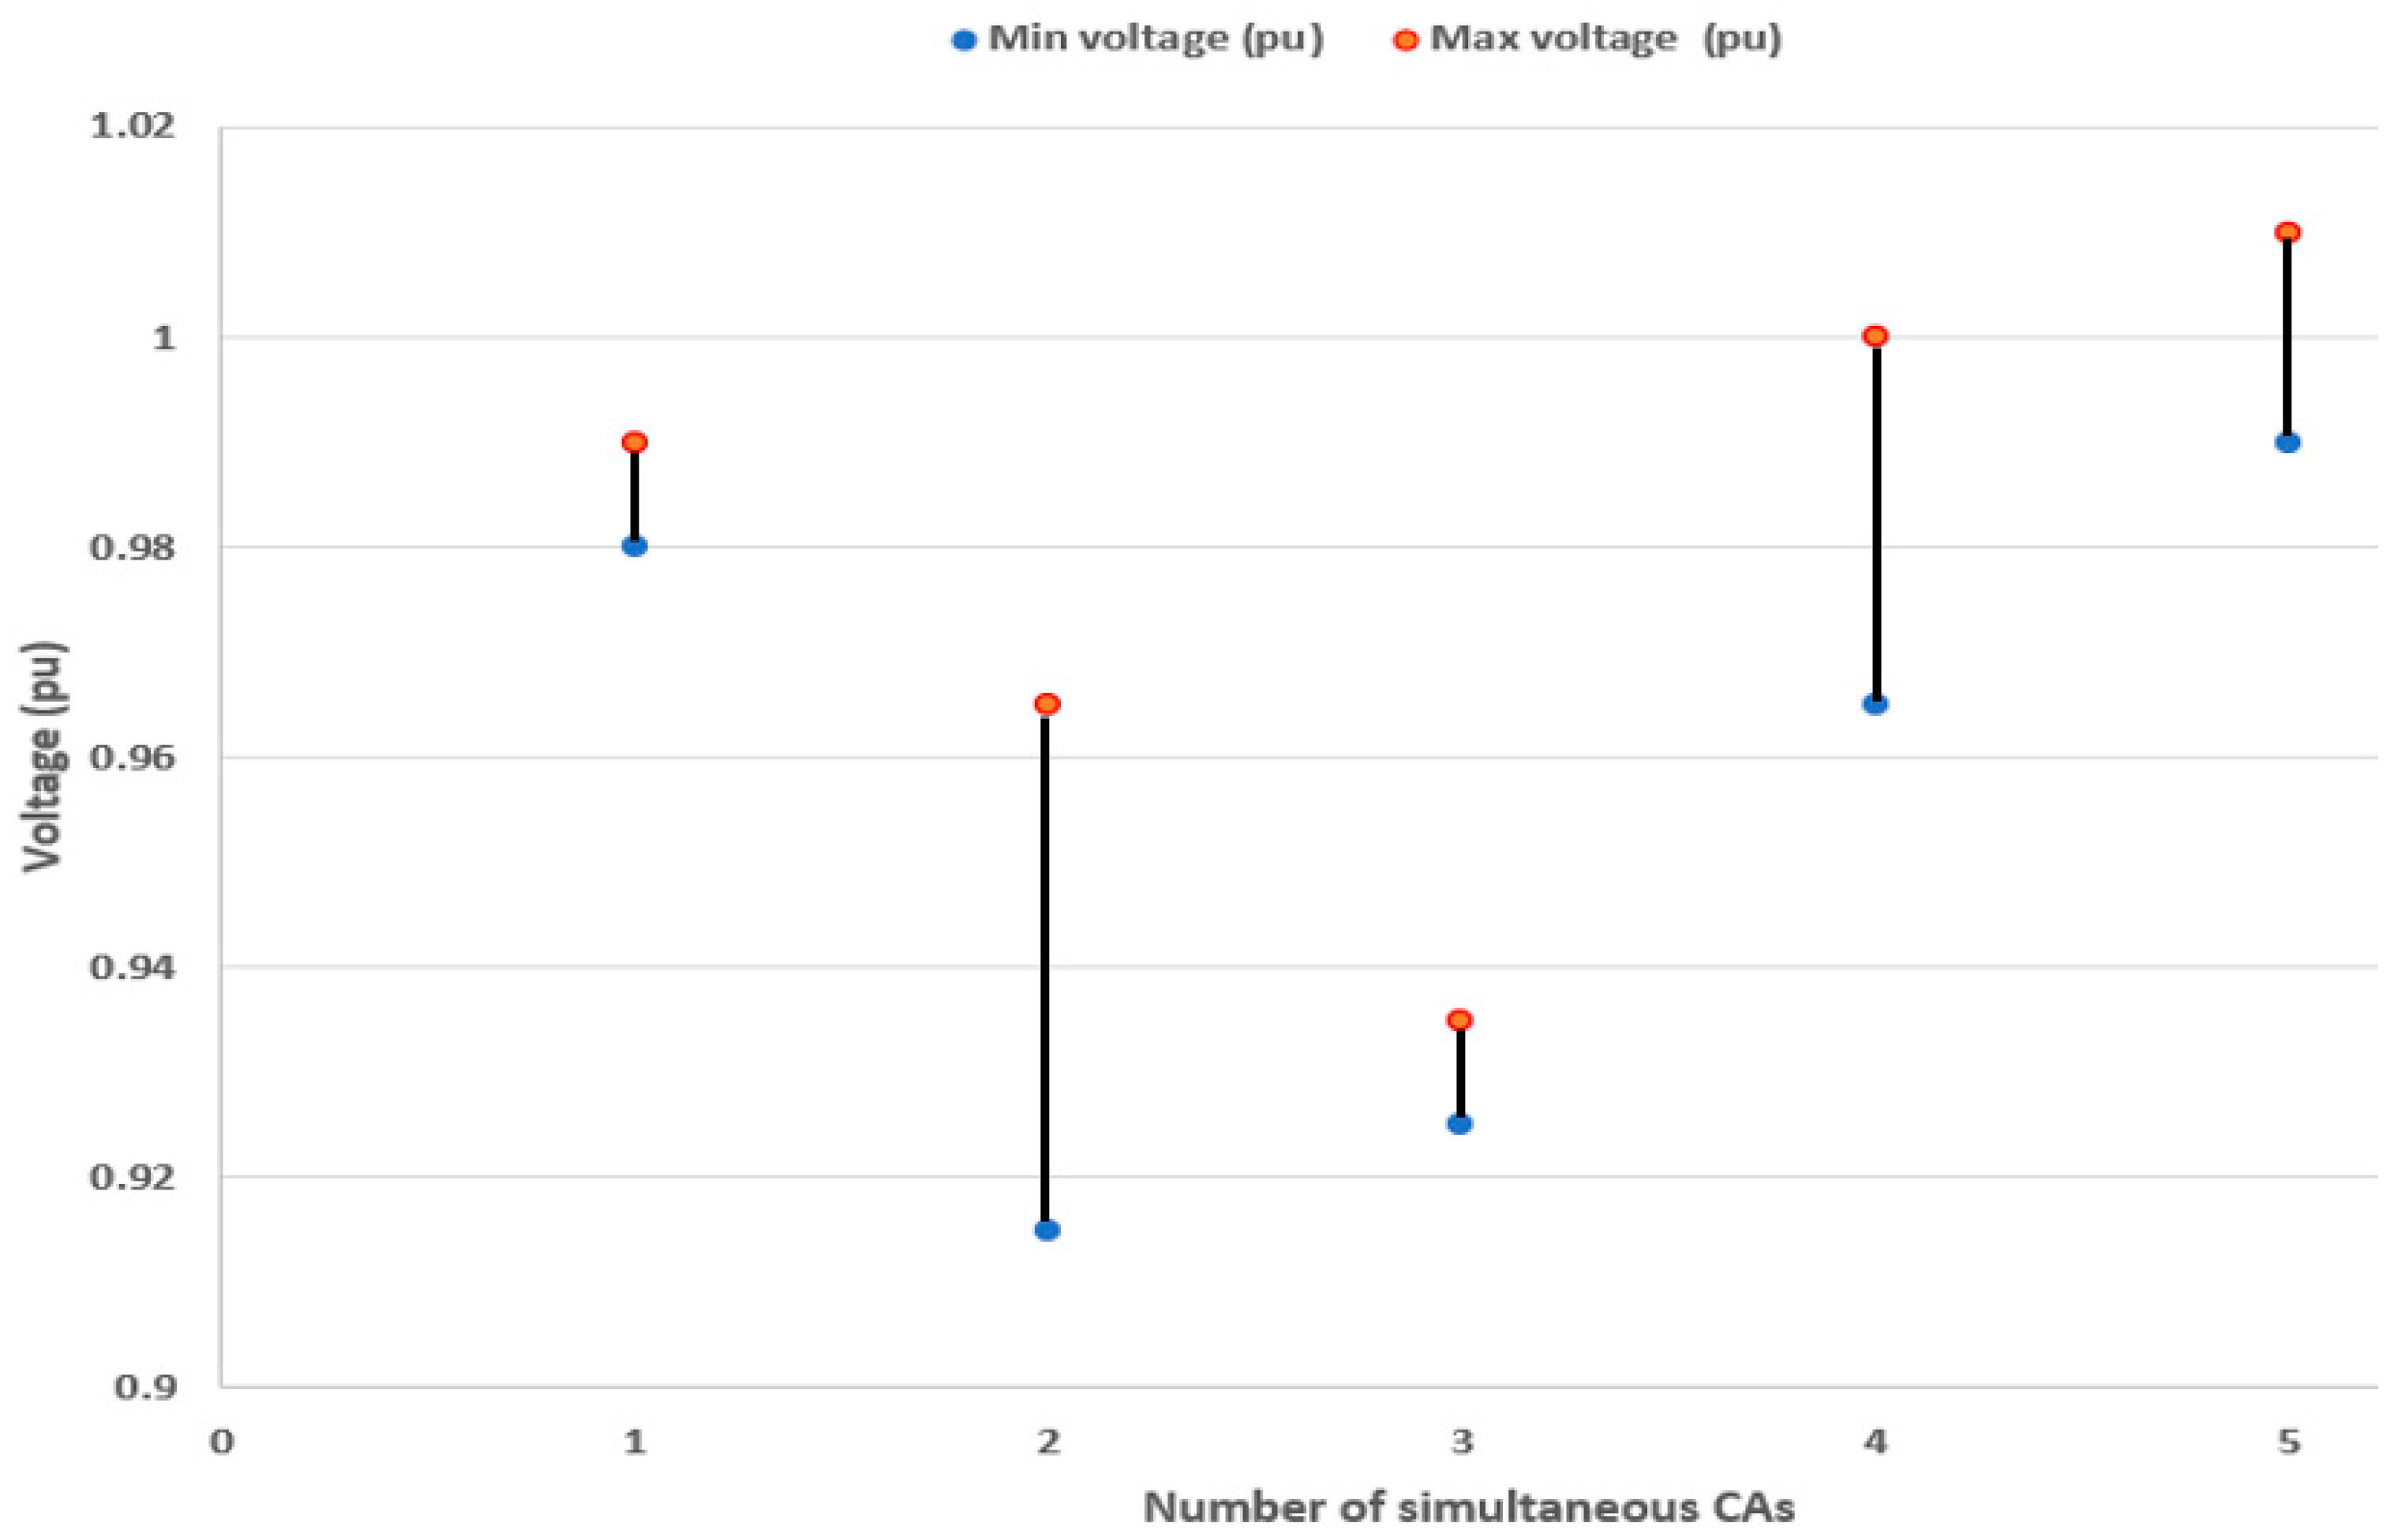
Table 2. The electric supply restoration time for each possible solution for a single CA lies within the range of 190–199 ms. The limit of the node voltage when applying the proposed algorithm following exposure to a single CA lies within the range of 0.98–0.99 pu—see 
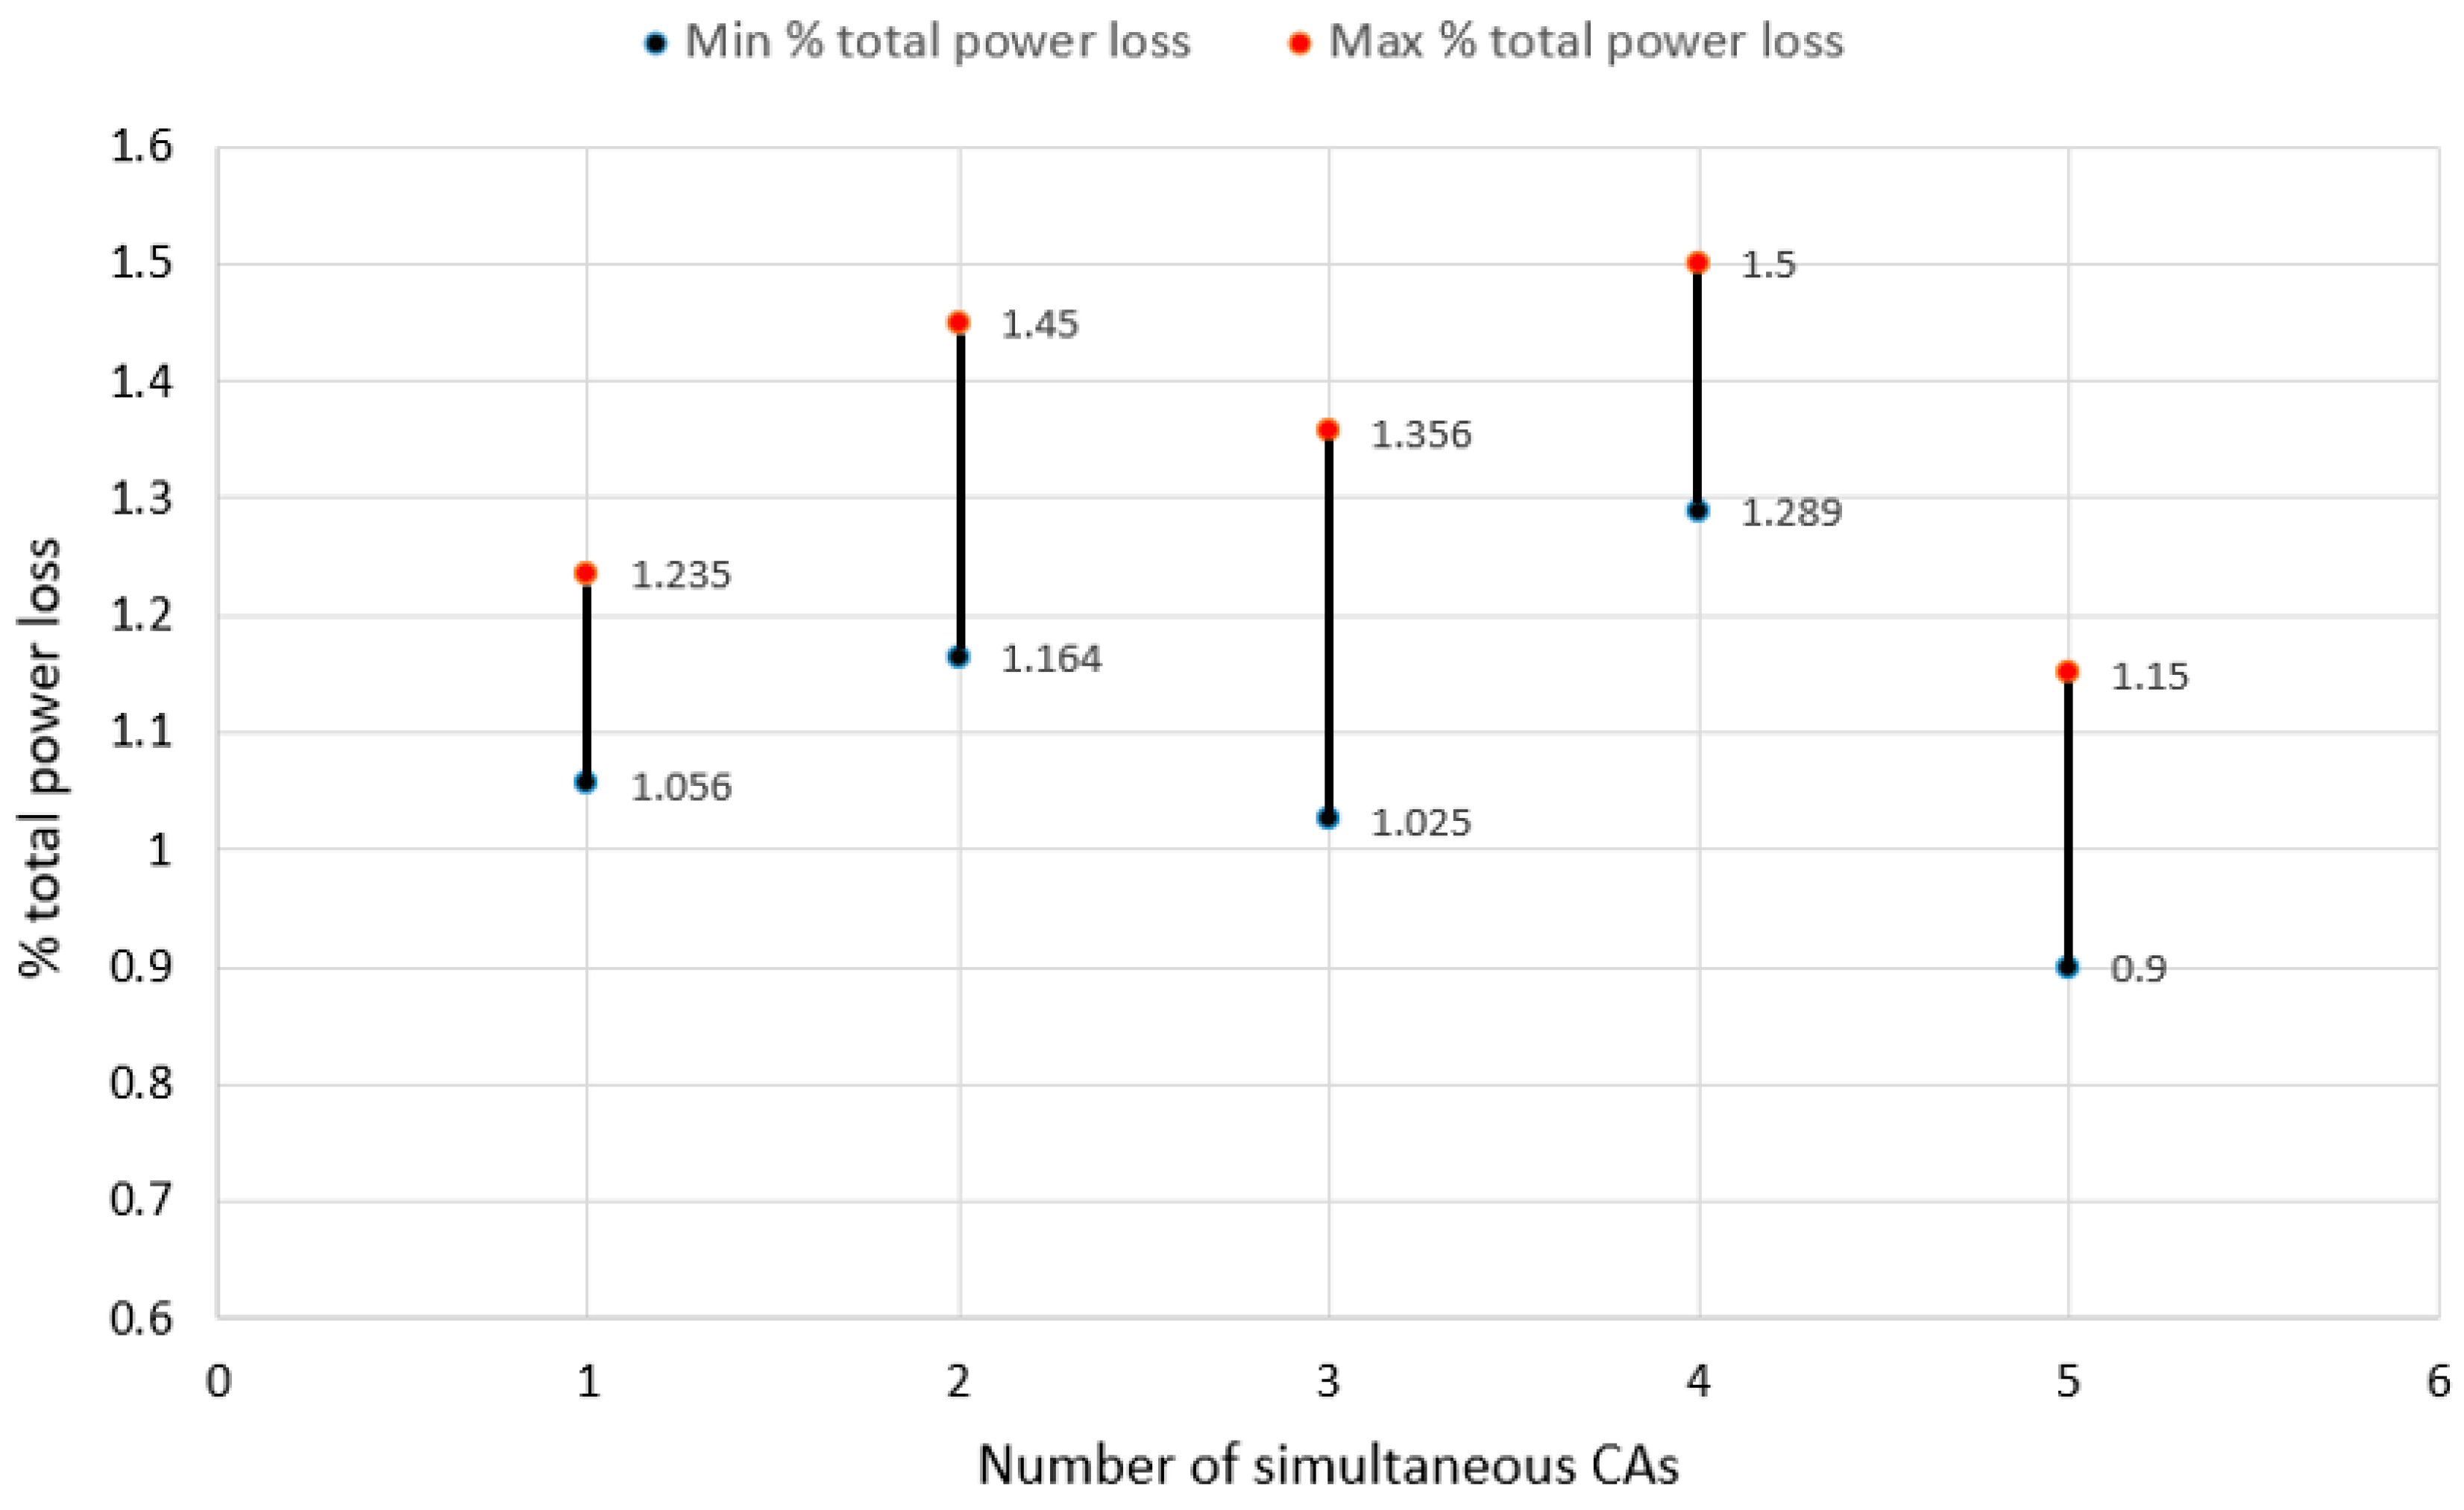
Figure 6. The total system power loss after applying the proposed algorithm following exposure to a single CA lies within the range of 1.056–1.235%. Such power loss is much smaller than that in a classical 70-bus SDS with four electric supply feeders [32]—see Figure 7.
It is worth mentioning that the cyber-attack will not hit switches 17 through 21 as these represent tie switches in the system, which are usually open ones. If the CA hits the tie switch to be closed, the system automatically opens a sectionalized switch to maintain the radiality of the system without intervention with the proposed algorithm.

3.2. Electric Service Recovery in SDS Following Exposure to Two Simultaneous CAs

For two simultaneous CAs, the number of possible cases is equal to 2145. Table 3 shows examples of the performance of the proposed algorithm when the SDS is exposed to two simultaneous CAs. The proposed algorithm achieves self-healing under all possible cases of exposure to two simultaneous CAs. The supply recovery time for each possible solution under two simultaneous CAs lies within the range of 190–199 ms. For two simultaneous CAs occurring at ACSs No. 1 and 32, the load nodes from A through P and from node a through node c are disconnected. The proposed algorithm generates a feasible output in the sequence S W 13 O , S W 59 O , S W 52 O , S W 20 C , S W 72 C , S W 17 C , S W 18 C , S W 21 C ,   which results in the supply recovery of all OOSLs in 197 ms, without breaking the ELs.
The proposed algorithm succeeds in recovering the OOSL in the SDS following exposure to two simultaneous CAs in all 2145 cases, with efficiency of 100%—see Table 2. Applying the proposed algorithm with exposure to two simultaneous CAs results in node voltages in the range of 0.915–0.965 pu—see Figure 6—and total system power losses within the range of 1.164–1.45%. Such power loss is much smaller than that in a classical 70-bus SDS with four electric supply feeders [32]—see Figure 7.

3.3. Electric Service Recovery in SDS Following Exposure to Three Simultaneous CAs

For three simultaneous CAs, the number of possible cases is equal to 45,760. Table 4 shows examples of the performance of the proposed algorithm when the SDS is exposed to three simultaneous CAs. The proposed algorithm achieves efficiency equal to 97.6% under all possible cases of exposure to three simultaneous CAs. The supply recovery time for each possible case of three simultaneous CAs lies in the range of 190–199 ms. For three simultaneous CAs occurring at ACSs No. 35, 54, and 44, the load nodes from d through f, from x through z, and from o through q are disconnected. The proposed algorithm generates a feasible output in the sequence S W 19 C , S W 17 C , S W 21 C , which results in the supply recovery of all OOSLs in 197 ms, without breaking the ELs.
The proposed algorithm succeeds in recovering the OOSL in the SDS following exposure to three simultaneous CAs in 44,662 cases among the total of 45,760, with efficiency of 97.6%—see Table 2. Applying the proposed algorithm with exposure to three simultaneous CAs results in node voltages in the range of 0.925–0.935 pu—see Figure 6—and total system power losses within the range of 1.025–1.356%, which is much smaller than that in a classical 70-bus SDS with four electric supply feeders [32]—see Figure 7.

3.4. Electric Service Recovery in SDS Following Exposure to Four Simultaneous CAs

For four simultaneous CAs, the number of possible cases is equal to 720,720. Table 5 shows examples of the performance of the proposed algorithm when the SDS is exposed to four simultaneous CAs. The proposed algorithm achieves efficiency equal to 97.1% under all possible cases of exposure to four simultaneous CAs. The supply recovery time for each possible case of four simultaneous CAs lies the range 190–199 ms. For four simultaneous CAs occurring at ACSs No. 9, 11, 45, and 54, the load nodes from M through O, from p through q, and from x through z are disconnected. The proposed algorithm generates a feasible output in the sequence S W 18 C , S W 17 C , S W 21 C , S W 19 C , which results in the supply recovery of all OOSLs in 190 ms, without breaking the ELs.
The proposed algorithm succeeds in recovering the OOSL in the SDS following exposure to four simultaneous CAs in 699,819 cases among the total of 720,720, with efficiency of 97.1%—see Table 2. The limit of the node voltage after applying the proposed algorithm under exposure to four simultaneous CAs lies within the range of 0.965–1.0 pu—see Figure 6—with a range of 1.289-1.5% for the total system power loss. Such power loss is much smaller than that in a classical 70-bus SDS with four electric supply feeders [32]—see Figure 7.

3.5. Electric Service Recovery in SDS Following Exposure to Five Simultaneous CAs

For five simultaneous CAs, the number of possible cases is equal to 8,936,928. Table 6 shows examples of the performance of the proposed algorithm when the SDS is exposed to five simultaneous CAs. The proposed algorithm achieves efficiency equal to 96.4% under all possible cases of exposure to five simultaneous CAs. The supply recovery time for each possible case of five simultaneous CAs lies in the range 190–199 ms. For five simultaneous CAs occurring at ACSs No. 32, 28, 62, 44, and 11, the load nodes from W through Y, from o through q, from M through N, and f and N are disconnected. The proposed algorithm generates a feasible output in the sequence S W 21 C , S W 72 C , S W 19 C , S W 17 C , S W 18 C , which results in the supply recovery of all OOSLs in 199 ms, without breaking the ELs.
The proposed algorithm succeeds in recovering the OOSL in the SDS following exposure to five simultaneous CAs in 8,615,199 cases among the total of 8,936,928, with efficiency of 96.4%—see Table 2. The limit of the node voltage after applying the proposed algorithm under exposure to five simultaneous CAs lies within the range 0.99–1.01 pu—see Figure 6—with a range of 0.9-1.15% for the total system power loss. Such power loss is much smaller than that in a classical 70-bus SDS with four electric supply feeders [32]—see Figure 7. Table 2 summarizes the efficiency of the proposed algorithm in recovering the OOSL in the SDS following exposure to a single and simultaneous CAs.
Table 7 shows a comparison between the proposed algorithm and other algorithms reported in the literature.

4. Conclusions

An algorithm is proposed to recover the electric supply for OOSLs in the SDS after exposure to a CA resulting in interruptions in the INSL. The proposed algorithm is based on three steps. The first step is based on building the SDS in matrix form. The second step is based on classifying the SDS into three zones: the attacked zone and the primary and secondary neighbor zones. The third step is based on obtaining five types of MP to recover the OOSL without breaking the ELs.
The proposed algorithm takes into consideration the ELs related to the maximum branch current, the nodes’ voltage, the load priority, the radiality maintenance of the SDS, the minimum total system power loss, and the instruction sequence of ACSs.
The proposed algorithm achieved self-healing after exposure to a single or double CAs without breaking the ELs when tested under a 70-bus SDS with four electric supply feeders.
The proposed algorithm succeeded in recovering the OOSLs in the investigated 70-bus SDS following exposure to a single CA in all 66 possible case studies, as well as in 2145 cases of exposure to two simultaneous CAs.
The proposed algorithm succeeded in recovering the OOSLs in the investigated 70-bus SDS following exposure to three simultaneous CAs in 44,662 cases out of 45,760, as well as in 699,819 cases out of 720,720 and 8,615,199 cases out of 8,936,928 of exposure to four and five simultaneous CAs, respectively.
The proposed algorithm achieved the recovery of the electric supply for three, four, and five ACSs exposed to CAs at efficiency values of 97.6%, 97.1%, and 96.4%, respectively, without breaking the ELs in the investigated 70-bus SDS.
The mathematical model, computational requirements, and integration of the proposed algorithm with the hardware components represent a research gap for future work. Implementing a defense algorithm against cyber-threats is also a task for future work.
In future research, the application of virtual bids [33] and mobile energy storage [34] in this context is also worth investigating.
Recommendations for future researchers include the integration of modern technology like artificial intelligence, machine learning, big data, and data mining within this research topic.
Challenges regarding merging the restoration algorithm with distribution power systems that contain hybrid switches, i.e., “manual and automatic” switches, should also be taken into consideration.

Author Contributions

Conceptualization, M.G. and M.-T.E.-M.; data curation, M.-T.E.-M.; formal analysis, M.A.-S.; methodology, M.A.-S.; resources, M.A.-S. and A.E.; software, M.G.; validation, M.A.-S. and A.E.; writing—original draft, M.G.; writing—review and editing, M.-T.E.-M. and A.E. All authors have read and agreed to the published version of the manuscript.

Funding

This research received no external funding.

Institutional Review Board Statement

Not applicable.

Informed Consent Statement

Not applicable.

Data Availability Statement

Dataset available on request from the authors.

Acknowledgments

The authors would like to express their sincere gratitude to the guest editor for the kind invitation to contribute to this Special Issue.

Conflicts of Interest

The authors declare that there are no conflicts of interest.

Nomenclatures

S(x, O)Switch with name x and with status open
S(y, C)Switch with name y and with status closed
S W x C Switch with name x and with status closed
S W y O Switch with name y and with status open
ESElectric service
OOSLOut-of-service load
CACyber-attack
ACSAutomatic communication switch
SDSSmart distribution system
ELElectric limitation
NONormally open
NCNormally closed
INSLIn-service load
DGDistributed generation
MPManeuvering process
RLRecovered load
SCADASupervisory control and data acquisition
OTOperational technology
ITInformation technology
IoTInternet of Things

References

  1. Rout, B.; Natarajan, B. Impact of cyber-attacks on distributed compressive sensing-based state estimation in power distribution grids. Int. J. Electr. Power Energy Syst. 2022, 142, 108295. [Google Scholar] [CrossRef]
  2. Pinto, S.J.; Siano, P.; Parente, M. Review of cybersecurity analysis in smart distribution systems and future directions for using unsupervised learning methods for cyber detection. Energies 2023, 16, 1651. [Google Scholar] [CrossRef]
  3. Hossain, E.; Roy, S.; Mohammad, N.; Nawar, N.; Dipta, D.R. Metrics and enhancement strategies for grid resilience and reliability during natural disasters. Appl. Energy 2021, 290, 116709. [Google Scholar] [CrossRef]
  4. Naderi, E.; Pazouki, S.; Asrari, A. A region-Based Framework for Cyberattacks Leading to Undervoltage in Smart Distribution Systems. In Proceedings of the 2021 IEEE Power and Energy Conference at Illinois (PECI), Urbana, IL, USA, 1–2 April 2021; pp. 1–7. [Google Scholar] [CrossRef]
  5. Wu, G.; Li, M.; Li, Z.S. Resilience-based optimal recovery strategy for cyber–physical power systems considering component multistate failures. IEEE Trans. Reliab. 2020, 70, 1510–1524. [Google Scholar] [CrossRef]
  6. Zhong, J.; Zhao, Y.; Li, Y.; Yan, M.; Peng, Y.; Cai, Y.; Cao, Y. Synergistic operation framework for the energy hub merging stochastic distributionally robust chance-constrained optimization and Stackelberg game. IEEE Trans. Smart Grid 2024, 16, 1037–1050. [Google Scholar] [CrossRef]
  7. Li, Z.; Shahidehpour, M.; Aminifar, F. Cybersecurity in distributed power systems. Proc. IEEE 2017, 105, 1367–1388. [Google Scholar] [CrossRef]
  8. Fang, Y.P.; Pedroni, N.; Zio, E. Resilience-based component importance measures for critical infrastructure network systems. IEEE Trans. Reliab. 2016, 65, 502–512. [Google Scholar] [CrossRef]
  9. Liu, C.C.; Bedoya, J.C.; Sahani, N.; Stefanov, A.; Appiah-Kubi, J.; Sun, C.C.; Zhu, R. Cyber–physical system security of distribution systems. Found. Trends® Electr. Energy Syst. 2021, 4, 346–410. [Google Scholar] [CrossRef]
  10. Wei, F.; Wan, Z.; He, H. Cyber-attack recovery strategy for smart grid based on deep reinforcement learning. IEEE Trans. Smart Grid 2019, 11, 2476–2486. [Google Scholar] [CrossRef]
  11. Edib, S.N.; Lin, Y.; Vokkarane, V.M.; Qiu, F.; Yao, R.; Zhao, D. Optimal PMU restoration for power system observability recovery after massive attacks. IEEE Trans. Smart Grid 2020, 12, 1565–1576. [Google Scholar] [CrossRef]
  12. Sang, M.; Ding, Y.; Bao, M.; Li, S.; Ye, C.; Fang, Y. Resilience-based restoration strategy optimization for interdependent gas and power networks. Appl. Energy 2021, 302, 117560. [Google Scholar] [CrossRef]
  13. Gellings, C.W. The Smart Grid: Enabling Energy Efficiency and Demand Response; River Publishers: Aalborg, Denmark, 2020. [Google Scholar]
  14. Zhang, P.; Mansouri, S.A.; Jordehi, A.R.; Tostado-Véliz, M.; Alharthi, Y.Z.; Safaraliev, M. An ADMM-enabled robust optimization framework for self-healing scheduling of smart grids integrated with smart prosumers. Appl. Energy 2024, 363, 123067. [Google Scholar] [CrossRef]
  15. Vaccaro, A. Self-Organizing Dynamic Agents for the Operation of Decentralized Smart Grids; IET: Stevenage, UK, 2024; pp. 1–128. [Google Scholar]
  16. Saini, S.; Beniwal, R.K.; Kumar, R.; Paul, R.; Saini, S. Modelling for improved cyber security in Smart distribution system. Int. J. Future Revolut. Comput. Sci. Commun. Eng. 2018, 4, 56–59. [Google Scholar]
  17. Fan, D.; Ren, Y.; Feng, Q.; Liu, Y.; Wang, Z.; Lin, J. Restoration of smart grids: Current status, challenges, and opportunities. Renew. Sustain. Energy Rev. 2021, 143, 110909. [Google Scholar] [CrossRef]
  18. Vozikis, D.; Darra, E.; Kuusk, T.; Kavallieros, D.; Reintam, A.; Bellekens, X. On the importance of cyber-security training for multi-vector energy distribution system operators. In Proceedings of the 15th International Conference on Availability, Reliability And Security, New York, NY, USA, 25–28 August 2020. [Google Scholar] [CrossRef]
  19. Huang, H.; Davis, K. Power System Equipment Cyber-Physical Risk Assessment Based on Architecture and Critical Clearing Time. In Proceedings of the 2018 IEEE International Conference on Communications, Control, and Computing Technologies for Smart Grids (SmartGridComm), Aalborg, Denmark, 29–31 October 2018; pp. 1–6. [Google Scholar] [CrossRef]
  20. Venkataramanan, V.; Srivastava, A.K.; Hahn, A.; Zonouz, S. Measuring and enhancing microgrid resiliency against cyber threats. IEEE Trans. Ind. Appl. 2019, 55, 6303–6312. [Google Scholar] [CrossRef]
  21. Case, D.U. Analysis of the Cyber-Attack on the Ukrainian Power Grid; Electricity Information Sharing and Analysis Center (e-ISAC): Washington, DC, USA, 2016; Volume 388, pp. 1–29. [Google Scholar]
  22. Macola, I.G. The Five Worst Cyberattacks Against the Power Industry Since 2014. 2020. Available online: https://www.power-technology.com/features/the-five-worst-cyberattacks-against-the-power-industry-since2014/ (accessed on 2 April 2020).
  23. Maghami, M.R.; Mutambara, A.G.O.; Gomes, C. Assessing cyber-attack vulnerabilities of distributed generation in grid-connected systems. Environ. Dev. Sustain. 2025, 1–27. [Google Scholar] [CrossRef]
  24. Saraswat, G.; Yang, R.; Liu, Y.; Zhang, Y. Analyzing the Effects of Cyberattacks on Distribution System State Estimation. In Proceedings of the 2021 IEEE Power & Energy Society Innovative Smart Grid Technologies Conference (ISGT), Washington, DC, USA, 16–18 February 2021; pp. 1–5. [Google Scholar] [CrossRef]
  25. Mokarim, A.; Gaggero, G.B.; Marchese, M. Impact analysis of cyber-attacks against energy communities in distribution grids. Electronics 2024, 13, 1709. [Google Scholar] [CrossRef]
  26. Goda, M.; Abdel-Salam, M.; Mohamed-Tharwat, E.M.; Elnozahy, A. A Multi-stage Algorithm Based on Data Structure to Deal Challenges Facing Electric-supply Restoration in Smart Grids. Results Eng. 2025, 27, 105467. [Google Scholar] [CrossRef]
  27. Rahiminejad, A.; Plotnek, J.; Atallah, R.; Dubois, M.A.; Malatrait, D.; Ghafouri, M.; Debbabi, M. A resilience-based recovery scheme for smart grid restoration following cyberattacks to substations. Int. J. Electr. Power Energy Syst. 2023, 145, 108610. [Google Scholar] [CrossRef]
  28. Zhao, J.; Wang, H.; Liu, Y.; Wu, Q.; Wang, Z.; Liu, Y. Coordinated restoration of transmission and distribution system using decentralized scheme. IEEE Trans. Power Syst. 2019, 34, 3428–3442. [Google Scholar] [CrossRef]
  29. Mousavinejad, E.; Yang, F.; Han, Q.L.; Ge, X.; Vlacic, L. Distributed cyber-attacks detection and recovery mechanism for vehicle platooning. IEEE Trans. Intell. Transp. Syst. 2019, 21, 3821–3834. [Google Scholar] [CrossRef]
  30. Chen, B.; Lv, H.; Li, Y.; Li, J. Sequential recovery of cyber–physical power systems with distributed generation. Electr. Power Syst. Res. 2025, 244, 111529. [Google Scholar] [CrossRef]
  31. Figueroa-Candia, M.; Felder, F.A.; Coit, D.W. Resiliency-based optimization of restoration policies for electric power distribution systems. Electr. Power Syst. Res. 2018, 161, 188–198. [Google Scholar] [CrossRef]
  32. Hong, Y.Y.; Lin, F.J.; Hsu, F.Y. Enhanced Particle Swarm Optimization-Based Feeder Reconfiguration Considering Uncertain Large Photovoltaic Powers and Demands. Int. J. Photoenergy 2014, 704839, 704839. [Google Scholar] [CrossRef]
  33. Li, Y.; Yu, N.; Wang, W. Machine learning-driven virtual bidding with electricity market efficiency analysis. IEEE Trans. Power Syst. 2021, 37, 354–364. [Google Scholar] [CrossRef]
  34. Xiao, D.; Sun, H.; Nikovski, D.; Kitamura, S.; Mori, K.; Hashimoto, H. CVaR-Constrained Stochastic Bidding Strategy For A Virtual Power Plant With Mobile Energy Storages. In Proceedings of the 2020 IEEE PES Innovative Smart Grid Technologies Europe (ISGT-Europe), The Hague, The Netherlands, 26–28 October 2020; pp. 1171–1175. [Google Scholar]
Figure 1. A 15-bus SDS with three feeders, F1 through F3, in a rectangular shape; the solid line represents the normally closed ACS, the dashed line indicates the normally open ACS, and the circle represents the INSL.
Electronics 14 02641 g001
Figure 2. Cyber-attack at ACS No. 1, which connects node F1 with node A, in a 15-bus SDS with three feeders, F1 through F3, represented in a rectangular shape. The solid black line represents the normally closed ACS, the dashed black line indicates the normally open ACS, the white circle represents the INSL, the blue circle indicates the OOSL, and the dashed red line represents an attacked ACS.
Electronics 14 02641 g002
Figure 3. Illustration of data definition of SDS for proposed algorithm.
Electronics 14 02641 g003
Figure 4. Division of the smart distribution system into three zones after the occurrence of a CA; the black zone represents the attacked zone, the green zone indicates the primary neighbor zone, and the blue zone represents the secondary neighbor zone.
Electronics 14 02641 g004
Figure 5. A 70-bus power distribution system with four electric supply feeders, F1 through F3, indicated with rectangles; the white circle represents the INSL, the solid line indicates a normally closed ACS, and the dashed line represents a normally open ACS.
Electronics 14 02641 g005
Figure 6. Voltage limits as predicted by the proposed algorithm following exposure to a single CA, as well as two, three, four, and five simultaneous CAs: for exposure to a single CA, the voltage lies within the range 0.98–0.99 pu; for exposure to two simultaneous CAs, it lies within the range 0.915–0.965 pu; for exposure to three simultaneous CAs, it lies within the range 0.925–0.935 pu; for exposure to four simultaneous CAs, it lies within the range 0.965–1.0 pu; and for exposure to five simultaneous CAs, it lies within the range 0.99–1.01 pu.
Electronics 14 02641 g006
Figure 7. Total system power loss as predicted by the proposed algorithm following exposure to a single CA, as well as two, three, four, and five simultaneous CAs: for exposure to a single CA, it lies within the range 1.056–1.235%; for exposure to two simultaneous CAs, it lies within the range 1.164–1.45%; for exposure to three simultaneous CAs, it lies within the range 1.025–1.356% pu; for exposure to four simultaneous CAs, it lies within the range 1.289–1.5%; and for exposure to five simultaneous CAs, it lies within the range 0.9–1.15%.
Electronics 14 02641 g007
Table 1. Performance of the proposed algorithm under all possible maneuvering processes following a single CA hitting the investigated 70-bus test system with four electric supply feeders.
Location of Attacked SwitchOOSLOutput of Proposed AlgorithmTest (ms)RLEL1EL2EL3EL4EL5EL6EL7
1A-P S W 13 O
S W 8 O
S W 18 C
S W 17 C
S W 20 C
194A-P
2B-P S W 5 O
S W 17 C
S W 19 C
190B-P
3C-P S W 6 O
S W 17 C
S W 18 C
191C-P
4D-P S W 5 O
S W 17 C
S W 19 C
191D-P
5E-H, O-P, N-M S W 18 C 193E-H, O-P, N-M
6F-H, O-P, N-M S W 19 C 197F-H, O-P, N-M
7G-H, O-P, N-M S W 20 C 196G-H, O-P, N-M
8H, O-P S W 20 C 196H, O-P
9O S W 19 C 197O
10P S W 20 C 190P
11M-N S W 18 C 190M-N
12N S W 18 C 197N
13I-L S W 17 C 198I-L
14J-L S W 17 C 195J-L
15K-L S W 17 C 195K-L
16L S W 17 C 196L
22Q-Z, a-f S W 25 O
S W 28 O
S W 18 C
S W 19 C
S W 21 C
196Q-Z, a-f
23R-Z, a-f S W 25 O
S W 28 O
S W 18 C
S W 19 C
S W 21 C
197R-Z, a-f
24S-Y, d-f S W 28 O
S W 19 C
S W 21 C
196S-Y, d-f
25T-Y, d-f S W 28 O
S W 19 C
S W 21 C
194T-Y, d-f
26U-Y, d-f S W 19 C 190U-Y, d-f
27V-Y, d-f S W 19 C 191V-Y, d-f
28W-Y S W 21 C 193W-Y
29X-Y S W 21 C 197X-Y
30Y S W 21 C 196Y
31Z, a-c S W 18 C 195Z, a-c
32a-c S W 18 C 196a-c
33b-c S W 18 C 197b-c
34C S W 18 C 190C
35d-f S W 19 C 194d-f
36e-f S W 19 C 190e-f
37F S W 19 C 191F
38g-z S W 41 O
S W 17 C
S W 21 C
195g-z
39h-z S W 41 O
S W 17 C
S W 21 C
197h-z
40i-z S W 41 O
S W 17 C
S W 21 C
190i-z
41j-q S W 17 C 192j-q
42k-q S W 72 C 193k-q
43l-q S W 17 C 197l-q
44o-q S W 17 C 193o-q
45p-q S W 17 C 193p-q
46m-n S W 72 C 197m-n
47n S W 72 C 199n
48r-z S W 21 C 197r-z
49s-z S W 21 C 190s-z
50t-z S W 21 C 192t-z
51u-z S W 21 C 193u-z
52v-z S W 21 C 195v-z
53w-z S W 21 C 195w-z
54x-z S W 21 C 195x-z
55y-z S W 21 C 196y-z
56Z S W 21 C 195Z
57A′-O′ S W 63 O
S W 20 C
S W 72 C
199A′-O′
58K′-O′ S W 72 C 198K′-O′
59L′-O′ S W 72 C 199L′-O′
60M′-O′ S W 72 C 196M′-O′
61N′-O′ S W 72 C 197N′-O′
62O′ S W 72 C 196O′
63B′-I′ S W 20 C 198B′-I′
64C′-I′ S W 20 C 198C′-I′
65D′-I′ S W 20 C 199D′-I′
66E′-I′ S W 20 C 190E′-I′
67F′-I′ S W 20 C 199F′-I′
68G′-I′ S W 20 C 196G′-I′
69H′-I′ S W 20 C 198H′-I′
70I′ S W 20 C 199I′
71q S W 17 C 192q
Table 2. Efficiency of the proposed algorithm in recovering the OOSL in the SDS following exposure to a single CA, as well as two, three, four, and five simultaneous CAs.
Number of Simultaneous CAs12345
Efficiency100%100%97.6%97.1%96.4%
Table 3. Performance of the proposed algorithm under samples of maneuvering processes following two simultaneous cyber-attacks hitting the investigated 70-bus test system with four electric supply feeders.
Locations of Attacked SwitchesOOSLOutput of Proposed AlgorithmTres (ms)RLEL1EL2EL3EL4EL5EL6EL7
1, 32A-P, a-c S W 13 O
S W 59 O
S W 52 O
S W 20 C
S W 72 C
S W 17 C
S W 18 C
S W 21 C
197A-P, a-c
52, 68v-z, G′-I′ S W 20 C
S W 21 C
196v-z, G′-I′
31, 13Z, a-c, I-L S W 18 C
S W 17 C
195Z, a-c, I-L
44, 45p-q S W 17 C 196p-q
35, 43d-f, m-q S W 44 O
S W 72 C
S W 19 C
S W 17 C
197d-f, m-q
Table 4. Performance of the proposed algorithm under samples of maneuvering processes following three simultaneous cyber-attacks hitting the investigated 70-bus test system with four electric supply feeders.
Locations of Attacked SwitchesOOSLOutput of Proposed AlgorithmTres (ms)RLEL1EL2EL3EL4EL5EL6EL7
35, 54, 44d-f, x-z, o-q S W 19 C
S W 17 C
S W 21 C
197d-f, x-z, o-q
50, 58, 8t-z, K′-O′, H-P S W 21 C
S W 72 C
S W 20 C
199t-z, K′-O′, H-P
28, 1, 32W-Y, A-P, a-c S W 13 O
S W 59 O
S W 52 O
S W 20 C
S W 72 C
S W 17 C
S W 18 C
S W 21 C
197W-Y, A-P, a-c
46, 36, 34m-n, e-f, c S W 72 C
S W 19 C
S W 18 C
190m-n, e-f, c
15, 50, 58K-L, t-z, K′-O′ S W 17 C
S W 21 C
S W 72 C
192K-L, t-z, K′-O′
Table 5. Performance of the proposed algorithm under samples of maneuvering processes following four simultaneous cyber-attacks hitting the investigated 70-bus test system with four electric supply feeders.
Locations of Attacked SwitchesOOSLOutput of Proposed AlgorithmTres (ms)RLEL1EL2EL3EL4EL5EL6EL7
9, 11, 45, 54M-O, p-q, x-z S W 18 C
S W 17 C
S W 21 C
S W 19 C
190M-O, p-q, x-z
62, 28, 1, 9O, W-Y, A-P, a-c S W 13 O
S W 19 C
S W 59 O
S W 52 O
S W 20 C
S W 72 C
S W 17 C
S W 18 C
S W 21 C
197O, W-Y, A-P, a-c4
29, 70, 44, 11x-y, I′-I′, o-q, M-N S W 21 C
S W 20 C
S W 17 C
S W 18 C
196x-y, I′-I′, o-q, M-N
71, 14, 8, 12I′, J-L, H, O-P, N S W 19 C
S W 17 C
S W 20 C
S W 18 C
193I′, J-L, H, O-P, N
60, 52, 5, 72M′-O′, v-z, E-H, M-P, q S W 21 C
S W 72 C
S W 19 C
S W 17 C
193M′-O′, v-z, E-H, M-P, q
Table 6. Performance of the proposed algorithm under samples of maneuvering processes following five simultaneous cyber-attacks hitting the investigated 70-bus test system with four electric supply feeders.
Locations of Attacked SwitchesOOSLOutput of Proposed AlgorithmTres (ms)RLEL1EL2EL3EL4EL5EL6EL7
37, 28, 62, 44, 11f, W-Y, O′, o-q, M-N S W 21 C
S W 72 C
S W 19 C
S W 17 C
S W 18 C
199f, W-Y, O′, o-q, M-N
15, 55, 8, 69, 46K-L, y-z, H, O-P, H′-I′, m-n S W 17 C
S W 19 C
S W 21 C
S W 20 C
S W 72 C
199K-L, y-z, H, O-P, H′-I′, m-n
45, 47, 56, 9 O, p-q, n, z S W 20 C
S W 72 C
S W 17 C
S W 19 C
S W 21 C
193O, p-q, n, z
53, 47, 10, 36, 16w-z, n, P, e-f, L S W 21 C
S W 72 C
S W 20 C
S W 19 C
S W 17 C
196w-z, n, P, e-f, L
14, 68, 50, 11, 61J-L, G′-I′, t-z, M-N, N′-O′ S W 20 C
S W 21 C
S W 17 C
S W 18 C
S W 72 C
194J-L, G′-I′, t-z, M-N, N′-O′
Table 7. A comparison between the proposed algorithm and other algorithms reported in the literature.
ReferenceContributionAdvantagesDisadvantages
[27]The study aimed to recover the out-of-service zones in the smart grid after experiencing a CA by ensuring the system’s recovery from the threat and removing the attack itself in a 39-bus and IEEE 30-bus setup.Enhanced the reliability and resilience by 22%.The authors did not take the electric limitations into consideration.
[28]The authors increased the number of personnel after a CA to recover the EC for the OOSL.The algorithm succeeds in guaranteeing the continuity of the supply after a single CA.The restoration time is high due to reliance on human intervention.
[29]The algorithm’s contribution is based on enhancing the ability of an SDS to withstand a CA by using large number of electric vehicles as distributed generators to feed the OOSL after a CA.The number of recovered OOSLs is increased with the help of electric vehicles and DGs.Dependence on high penetration level of distributed generators.
[30]The authors sought to recover a part of the outage area under a CA by adding DG resources to support the smart distribution system against CAs.The algorithm showed better performance regarding the reliability indices.Low performance in simultaneous CAs.
[31]The authors proposed an optimized algorithm based on mixed-integer linear programming to address load interruptions following a CA. The algorithm was based on the philosophy of first fail first repair. The results of the algorithm showed better performance as regards the number of recovered out-of-service loads.Violation of the electrical limitation related to load priority.
Proposed algorithmA novel algorithm is proposed for the first time to recover the ES to the OOSL after a CA on an ACS in the SDS, regardless of whether the CA occurs on a single ACS or multiple ACSs.The proposed algorithm showed better performance according to (a) the time of electric service recovery, (b) achieving self-healing, (c) testing under single and simultaneous CAs.
The proposed algorithm showed better performance irrespective of (a) the number of recovered OOSLs, (b) the system size, (c) operation with or without DGs.
The efficiency decreases when the number of simultaneous CAs increases.
Disclaimer/Publisher’s Note: The statements, opinions and data contained in all publications are solely those of the individual author(s) and contributor(s) and not of MDPI and/or the editor(s). MDPI and/or the editor(s) disclaim responsibility for any injury to people or property resulting from any ideas, methods, instructions or products referred to in the content.

