Article

Research on the Vibration Sensor Based on Microfiber Loop Resonator

by
Maciej Mojkowski
1,
Joanna E. Moś
2,*,
Joanna Korec-Kosturek
2 and
Karol A. Stasiewicz
2
1
Faculty of Mechatronics, Warsaw University of Technology, 1 Pl. Politechniki St., 00-661 Warsaw, Poland
2
Faculty of Advanced Technology and Chemistry, Military University of Technology, 2 Kaliskiego St., 00-908 Warsaw, Poland
*
Author to whom correspondence should be addressed.
Electronics 2025, 14(13), 2619; https://doi.org/10.3390/electronics14132619
Submission received: 26 May 2025 / Revised: 13 June 2025 / Accepted: 27 June 2025 / Published: 28 June 2025

Abstract

The aim of this article is to present the manufacturing and characterization possibilities of a vibration sensor based on a microfiber loop resonator, chosen in the context of developing low-cost sensor systems. The technological part of the article includes a description of the process for producing a microfiber loop resonator using the Fiber Optic Taper Element Technology setup, and the optimization of parameters, such as the diameter of the tapered optical fiber and the number of loop twists (ranging from 1 to 3). The experiments carried out included testing the sensors’ responses to vibrations and performing spectral analysis, during which the time responses of the proposed sensors were presented and analyzed. The Q-factors were calculated as 2.4 × 10³ for one twist, 3.8 × 10³ for two twists, and 4.1 × 10³ for three twists. The best results for sensing applications were obtained using a microfiber loop produced on a tapered optical fiber with a diameter of approximately 11 μm and two, three twists. The test results confirmed that the sensitivity (the highest power differences) of the microfiber loop resonator to vibrations was higher than a straight tapered optical fiber and increased with the decreasing fiber diameter and a higher number of twists. The main conclusion is that microfiber loop structures have potential in optical fiber sensor applications.

1. Introduction

Nowadays, optical-fiber-based structures are widely used in telecommunications, industry, and medicine, as well as for sensing various factors [1,2,3]. However, in most cases, they cannot be used in their original form and require modifications to enhance properties, such as sensitivity or selectivity. This has led to the development of structures like microfibers and nanofibers, whose diameters are comparable to or even smaller than the wavelength of light in a vacuum. Due to their compact size and high flexibility, micro- and nano-fibers serve as an excellent foundation for creating entirely new geometric structures, including microfiber resonators (MFRs) [4], among which the most commonly used are microloop resonators (MLR) [5,6], microknot resonators [7,8,9], and microcoil resonators [10]. MFRs enjoy unwavering popularity and have a broad range of applications, from sensing technologies [5,6,11,12] to higher-order harmonic generations [13,14]. They are especially popular as sensors for many physical parameters, such as vibration [15,16,17], temperature [5,8], refractive index [18,19], humidity [6,20,21], and magnetic field [22], etc.
Mostly, the MFRs are based on tapered optical fibers (TOFs), which are characterized by a long and uniform tapered waist region having a diameter of several micrometers (Figure 1) [23,24,25].
The use of TOFs as a basis for building a sensor has many advantages, which include a large evanescent field outside the fiber that is extremely sensitive to changes in external environmental parameters [26]. During the tapering process, when the optical fiber is elongated and the diameter of the fiber decreases, light can no longer be effectively guided inside the fiber’s core. When the fiber dimensions are small enough, the light leaks out of the structure and penetrates the surrounding medium. The distance that light can travel into the second medium is called the penetration depth, which depends on the refractive indices of the core and cladding, the incidence angle of the beam at the core–cladding boundary, and the wavelength [27,28]. Creating a loop from a TOF allows for a change in the properties of the propagating beam due to the formation of a coupling region connected with a high evanescent field. In this area, the wave propagating inside the microloop is coupled with the wave propagating in the self-coupling area [13,29,30]. As a result, a characteristic resonance spectrum is created, as shown in Figure 2 [31].
During the fabrication process of an MFR, several parameters, such as the radius of the microloop (R), the diameter of the TOF (2a), and the length of the coupling region (ΔL), must be considered (Figure 2). All of these have a significant impact on the sensitivity, detection limit, wide dynamic measurement range, and Q-factor [14,32]. The last of the mentioned parameters, called the Q-factor, is one of the most important factors describing MFR [4]. It is a measure of the strength of the damping in the resonator’s oscillations. To determine this parameter, the resonance wavelength (λres) and the full width at half maximum (FWHM) of the transmitted power are used (Figure 2). It is a ratio of λres and FWHM [25]. The higher the Q-factor, the narrower and more defined the resonance peak is, which leads to higher sensitivity and lower energy loss. Typical MFRs have a Q-factor in the range of 103 to 106 [4].
The MLR structure was first described theoretically by Sumesky in 2004 [33], who successfully used it as a temperature sensor two years later [5]. The MLR consists of a loop and a coupling region, held together by weak van der Waals and electrostatic forces [6], making this configuration highly unstable. The development of these structures has primarily focused on mechanical reinforcement, and to enhance stability, two methods were proposed. The first approach involves embedding the MLR in an additional material with a low refractive index (usually a polymer) [34,35], while the second relies on twisting the MLR (Figure 3), which increases the length of the coupling region [18,36]. As a result, the resonator modified by the second method can be considered as a Sagnac interferometer [36,37]. The optimization of those structures should also be considered in terms of losses [38].
This paper presents research on MLR based on TOFs. The structure is modified by a different number of twists (which is directly connected with the parameter ΔL and its value). The conducted measurements allow for the selection of a structure characterized by the optimal Q-factor. Additionally, resonance spectra for different structures of MLR and time studies are performed. The research demonstrates that after optimization of parameters, the MLR structure can be successfully utilized as a vibration sensor in future applications.

2. Materials and Methods

For the preparation of the vibration sensor containing MLR structures, the Fiber Optic Taper Element Technology (FOTET) was employed. It utilizes a low-pressure torch with a propane–butane–oxygen gas mixture as the heat source. A detailed description of the system is available in our previously published articles [39,40]. However, to summarize its main advantages, FOTET enables:
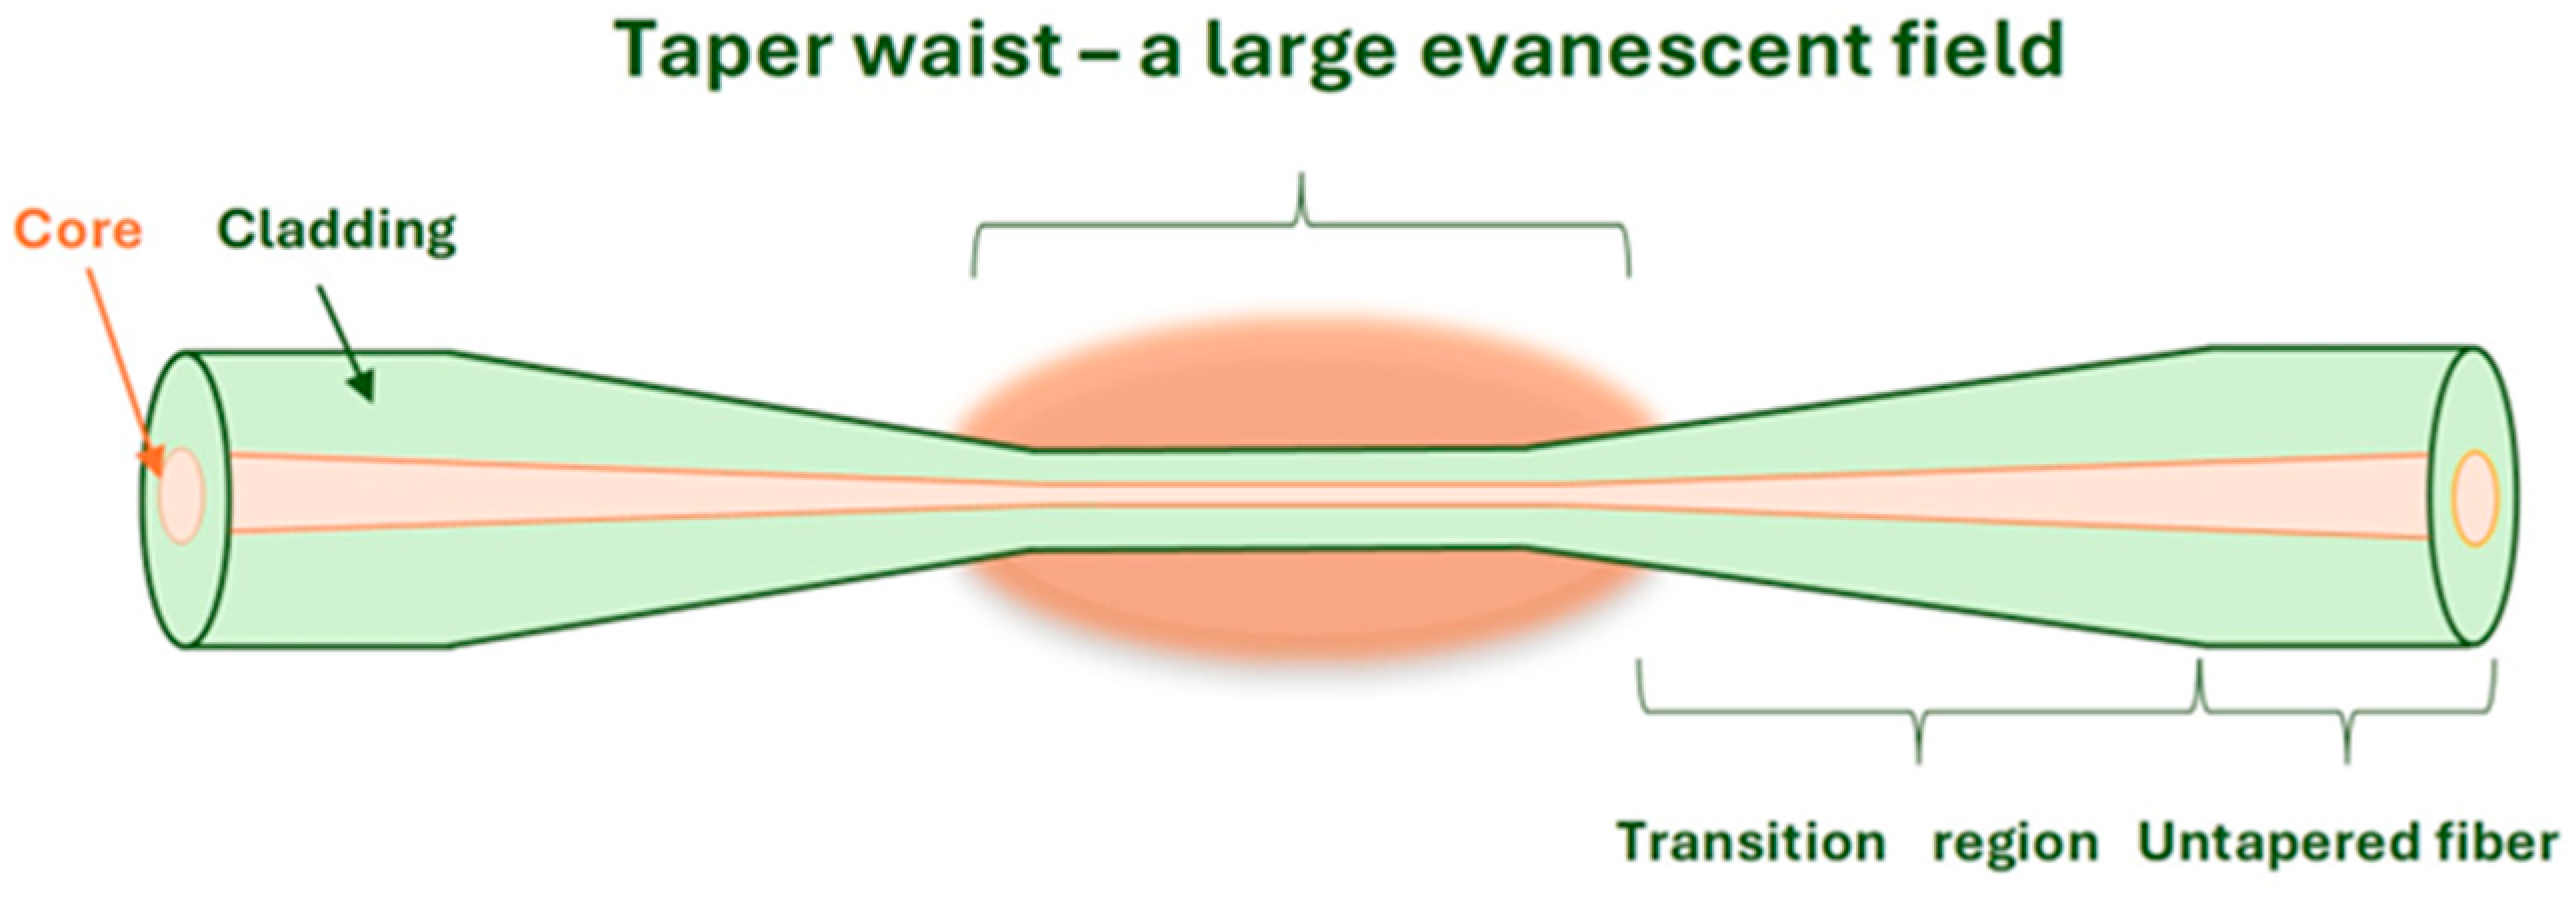
  • The production of various types of TOFs with micrometer-scale precision, characterized by different waist regions (long, short, or point-shaped), depending on the duration of the flame–fiber interaction.
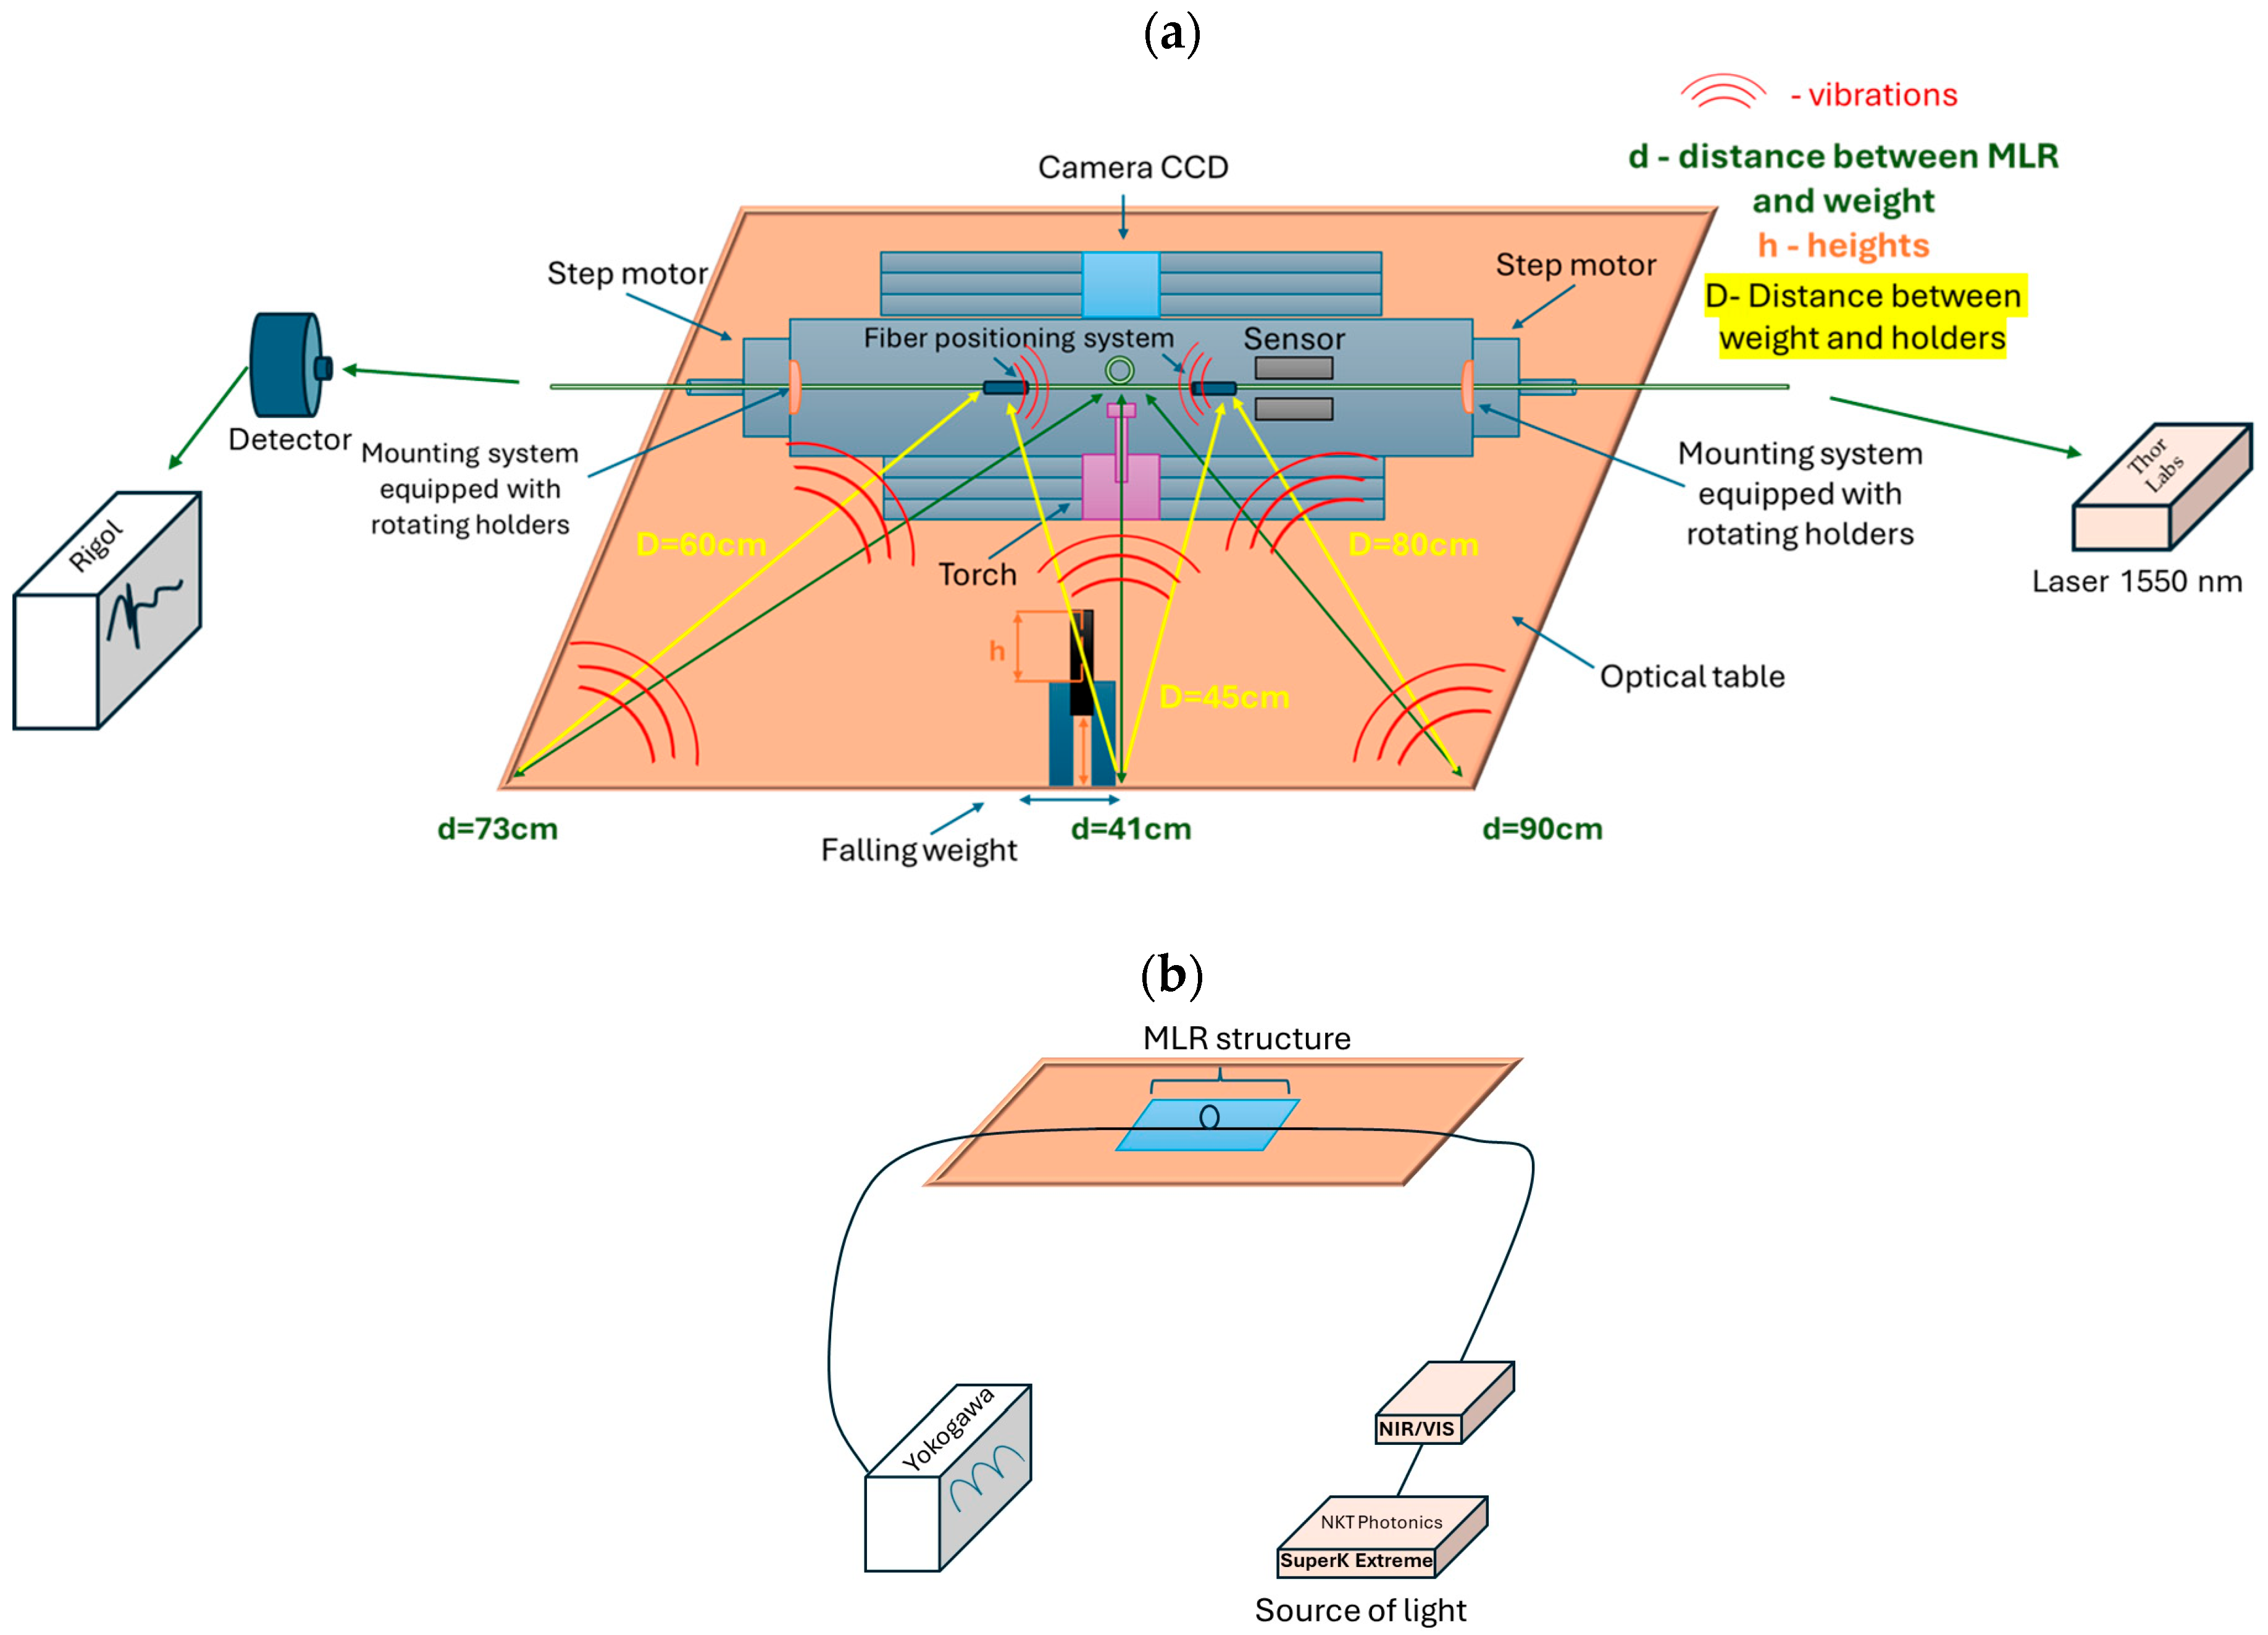
  • The fabrication of low-loss structures, with continuous loss monitoring during the elongation process made possible by additional equipment (from Thorlabs, Newton, MA, USA), including the S3FC1550 laser light source and the S144A detector operating in the 800–1700 nm wavelength range, connected to the PM300E power meter and display.
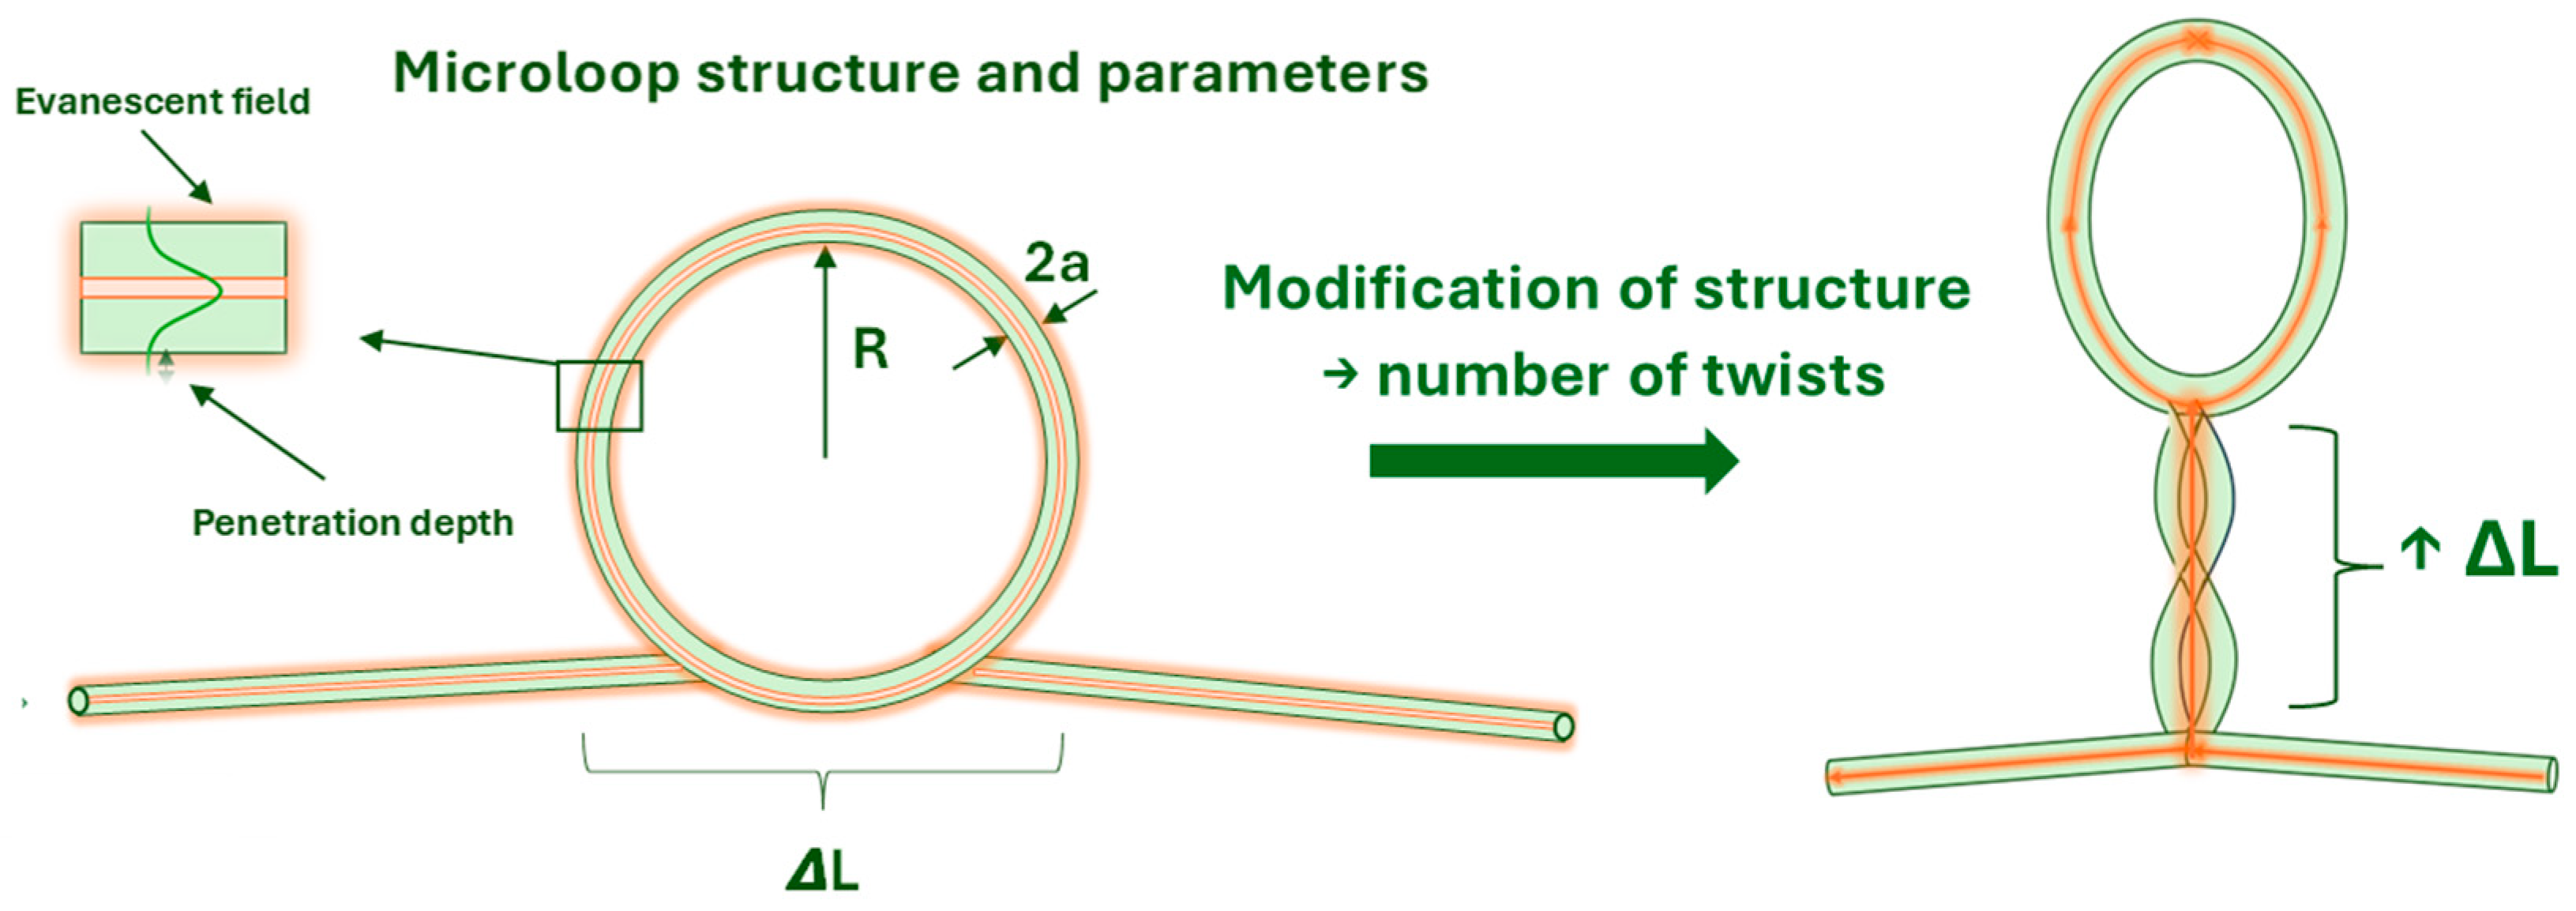
  • The rotation of the TOF and its direct integration into the MLR system with varying numbers of twists, thanks to movable motors (forward and backwards) and a fiber mounting system equipped with rotating holders.
The MLR structures were fabricated using the SMF-28 single-mode optical fiber from Corning (Corning, NY, USA). Key parameters of the fiber include a cut-off wavelength of 1260 nm, a mode field diameter of 8.8–9.6 µm at 1310 nm and 9.9–10.9 µm at 1550 nm, a core diameter of 8.2 µm, and a maximum attenuation of 0.32 dB/km at 1310 nm and 0.18 dB/km at 1550 nm [41]. This particular fiber was chosen due to its widespread use, affordability, and compatibility with single-mode operation in the telecommunications wavelength range—an important consideration, as most modern measurement and transmission systems are designed for this spectrum. For investigation and comparative analysis, two different fiber elongation parameters were selected: l1 = 20.1 ± 0.2 mm with a waist diameter of d1 = 14.7 ± 0.5 µm, and l2 = 25.1 ± 0.2 mm with a waist diameter of d2 = 10.9 ± 0.3 µm. All fabricated TOFs exhibited losses below 0.5 dB at 1550 nm. Additionally, the sensor was optimized with respect to the length of the coupling region, ΔL, which directly influences mode coupling, sensor performance, and overall structural stability. For comparison, MLRs with one (standard MLR structure), two, and three twists were selected. In the case of two and three twists, the coupling region is longer and light propagation is altered; however, the operating principle remains the same as that of a standard loop resonator. In all cases, light propagating through the TOF region generates an evanescent field. However, for configurations with more than one twist, when the light reaches the coupling region, a portion of it is coupled and guided along this region. Due to the reduced diameter of the TOF, the propagating wave splits into two beams upon reaching the loop, with each beam travelling in opposite directions. These beams propagate around the loop and, upon returning to the ΔL region, they interfere and recombine, resulting in an interference phenomenon based on the Sagnac effect [18,36]. In summary, the working principle of the vibration sensor is based on the generation of an evanescent field [25], the interference of light waves in a loop structure operating as a Sagnac interferometer [36], and the introduction of mechanical stresses in the MLR during vibration, which alters the light propagation parameters.
The manufacturing of the MLR structure involved three main steps:
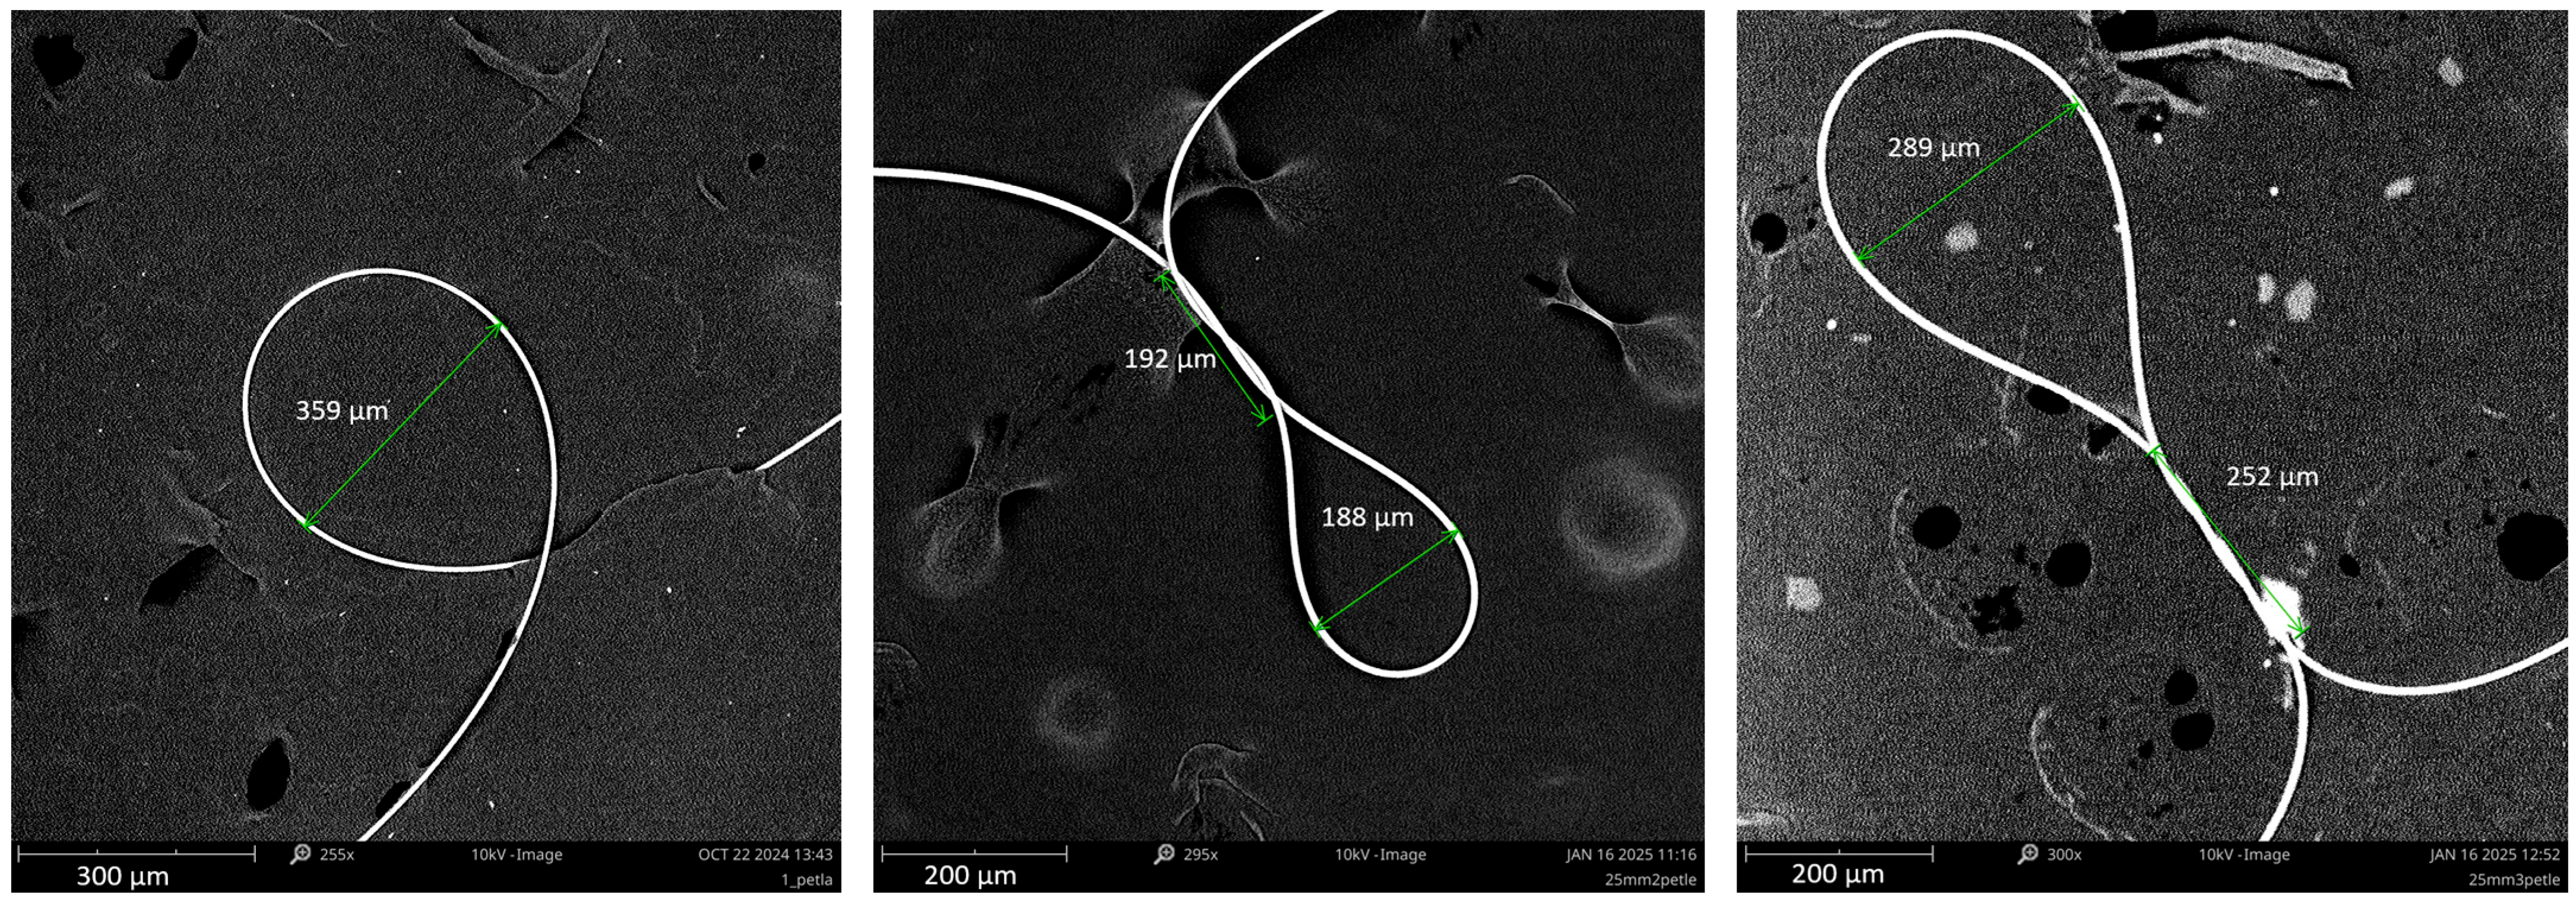
  • Step 1: The prefabricated TOF, mounted on the FOTET setup, was initially under tension. To release this tension, the stepper motors must be manually moved toward each other using micrometric screws that allow precise positioning.
  • Step 2: Once the optical fiber is no longer under tension, a loop can be formed using the rotatable fiber holders. These holders were gently rotated until the desired number of twists was achieved, and the loop was fully formed.
  • Step 3: Finally, the stepper motors were moved away from each other, again using micrometric screws, to minimize the loop size and achieve the optimal structure for sensing.
To mechanically stabilize and reinforce the MLR structure, it was secured onto a glass plate with a refractive index similar to that of the optical fiber approximately 1.46; Figure 4 [15]. Matching the refractive index of the glass substrate is important for minimizing additional optical losses. The refractive index of the surrounding medium is important due to the energy distribution in the TOF. If the refractive index is higher than the fiber, the losses increase (according to the principle of total internal reflection) [15]. The method used to secure the MLR structure did not introduce any measurable increase in loss.
The MLR structures with different numbers of twists, based on TOFs with a 25 mm elongation, are shown in Figure 5. Their parameters, such as the loop radius and coupling length ΔL, were measured using a scanning electron microscope, model G2, Phenom (Waltham, MA, USA).

3. Results

The investigation on the impact of geometrical dimensions (the TOF’s elongation and microfiber diameter) and number of twists on vibration sensor performance was divided into two parts: time-domain and spectral analysis.
To examine the sensor’s response to vibrations, the sensor was left mounted on the FOTET setup and exposed to vibrations. One end of the optical fiber was connected to a PDA10CS-EC detector, ThorLabs (Newton, MA, USA), which was linked to a digital oscilloscope DS7034, Rigol (Suzhou, China), while the other end was connected to a 1550 nm laser source, ThorLabs S3FC1550 (Newton, MA, USA). The measurement system is illustrated in Figure 6a. Vibrations were induced by dropping a 94 g weight onto the optical table. The shape of the weight was a cylinder (a metal post). After the weight was dropped onto the optical table, the FOTET setup, including its mounting holders, began to vibrate. These vibrations were then transmitted to the MLR structure (Figure 6a). To standardize measurements, the fall occurred at three different heights, h: 1, 7, and 14 cm, and the distance, d: 41, 73, and 90 cm, was measured from MLR to weight. A key aspect of the measurements is the way the vibrations spread. When analyzing the results, an important parameter is also the distance between the weight and the holders D. When the MLR is positioned directly in front of the falling weight, vibrations of equal intensity travel symmetrically toward both holders. In this case, the waves move in opposite directions, which can lead to interference. In contrast, when measurements are taken from opposite corners of the optical table, the holders are located at different distances from the point of impact. In this case, the wavefront reaches one holder before the other. In summary, the angle of measurement is also important to analyze a result.
Spectral measurements were carried out using the setup configuration presented in Figure 6b. The system included a high-power supercontinuum white light laser, model SuperK Extreme EXR-15 from NKT Photonics (Birkerød, Denmark), operating over the 400–2400 nm range, a SuperK SPLIT splitter (NIR/IR and VIS/NIR) from NKT Photonics, and an optical spectral analyzer model AQ6375 from Yokogawa (Tokyo, Japan), operating in the 1200–2400 nm range. Measurement in a wide range of light was provided to check and show the possibilities of working with manufactured devices for different wavelengths, as well as to observe the changes in propagation of light depending on MLR parameters.
The investigation into the influence of TOF elongation and the number of twists began with measuring the sensor’s sensitivity to vibrations, observed as time-domain voltage changes. Examples of the recorded time responses for the TOF with an elongation of l2 = 25 mm and the created MLR with one and two twists are shown in Figure 7. The black signal represents the original measurement obtained with the oscilloscope, and by a color line a smoothing function to remove noise from signals was applied. Initially, the TOF without the MLR structure (a straight) was tested as a reference. The corresponding results for the straight TOF are presented in Figure 7a (blue line). The results for MLRs with one twist (red line) and two twists (green line) are shown in Figure 7b and Figure 7c, respectively. A comparison of signal changes for TOFs elongated to approximately l1 = 20 mm and l2 = 25 mm, with and without MLRs, is provided in Table 1, Table 2, Table 3 and Table 4.
Based on the results presented above in Table 1, Table 2, Table 3 and Table 4, it can be concluded that a straight TOF exhibited a lower voltage difference to vibration compared to the MLR structure. The highest deviations of changes from the reference level were observed for the MLR structure fabricated from a TOF with an elongation of approximately 25 mm, which corresponded to the waist diameter of about 11 μm. The improved performance observed for the TOF with a smaller diameter was attributed to a stronger evanescent field and better mode coupling in the twisted region of the MLR. Additionally, the 25 mm TOF featured a longer taper waist, which ensured that the MLR structure was formed from a region with a uniform diameter. An increased number of twists led to enhanced voltage difference. However, the most significant difference was observed between one and two twists, while the improvement between two and three twists in most cases was negligible.
In addition, it should be noted that the process of manufacturing MRLs had a significant effect on the propagation losses that arose. By achieving a constriction within several tens of micrometers, it was possible to form loops with diameters comparable to those of standard optical fibers. In the ΔL region associated with the twist, the microfiber can coil with a curvature radius of several tens of micrometers. However, as the diameter of the taper was reduced, insertion losses caused by bending and light radiation increased significantly, reaching up to 3 dB. It should also be noted that at an elongation of 25 mm, the TOF became highly susceptible to mechanical damage.
After investigating the sensor’s sensitivity (the highest optical power difference) to vibration, the MLR structure created from the TOF with an elongation of l2 = 25 mm was selected for further spectral analysis due to its superior sensitivity. The performed spectral measurements allowed for the characterization of fabricated sensors and the determination of several parameters, such as free spectral range (FSR), FWHM, and Q-factor. The Q-factor was calculated as the ratio of the resonance wavelength to the FWHM. As observed in Figure 8, the FSR decreased with an increase in the number of twists, which was related to the decrease in the loop diameter. Regarding the Q-factor, the highest value was obtained for the sensor with three twists, reaching 4.1 × 10³, which was slightly higher than the value obtained for the sensor with two twists, 3.8 × 10³. The lowest Q-factor value obtained for the sensor with one twist confirmed that it had lower sensitivity and higher energy loss compared to the other sensors. Also, it can be noticed that the obtained resonance peaks were much more irregular. All calculations were performed within the wavelength range of 1225–1255 nm, which is near the cut-off region of the used fiber. However, it should be noted that the Q-factor was not dependent on the wavelength within this range. The obtained values of FWHM, FSR, Q-factor, and λres are summarized in Table 5.
In the article, the possibility of using MLR structures with different numbers of twists like a vibration sensor was presented. Further detailed investigations are necessary. In particular, more emphasis should be placed on studying the influence of the wave propagation direction along the optical table, which includes performing a significantly larger number of measurements at various distances, d, while maintaining constant angles of incidence. At this stage, the feasibility of fabricating a compact and low-cost sensor was demonstrated. This research could be regarded as a preliminary step toward future optimization and application.

4. Conclusions

In this article, we presented a microfiber loop resonator structure as a vibration sensor. A microfiber loop resonator was optimized in terms of tapered optical fiber parameters, such as elongation, taper waist diameter, and the length of the coupling region. The best results (the highest power differences) were obtained for a tapered optical fiber with an elongation of approximately 25 mm and a waist diameter of about 11 µm. The proposed sensor exhibited Q-factors of 2.4 × 10³ for one twist, 3.8 × 10³ for two twists, and 4.1 × 10³ for three twists. The increasing values of this parameter confirmed the higher sensitivity of loop structures with a greater number of twists. The most significant differences in signal variation were observed for the 25 mm taper compared to the 20 mm taper, particularly for two and three twists. However, these results were accompanied by a notable increase in insertion losses and reduced propagation power. Also, a straight 20 mm taper can be considered completely insensitive to the inflicted vibration, while the 25 mm tapered optical fiber showed a slight increase in signal deviation from the reference level.
The sensor demonstrated the possibilities of effective vibration detection capabilities. The use of simple materials and low-cost fabrication technology make this approach promising for further development. However, it is essential to focus on improving the sensor’s mechanical durability and reliability to meet commercialization standards.

Author Contributions

Conceptualization, K.A.S.; methodology, K.A.S.; formal analysis, M.M., K.A.S., J.E.M. and J.K.-K.; investigation, M.M., J.E.M., K.A.S. and J.K.-K.; data curation, M.M., K.A.S., J.K.-K. and J.E.M. writing—original draft preparation, J.E.M. and J.K.-K.; writing—review and editing, K.A.S.; visualization, J.E.M., M.M. and J.K.-K.; supervision, K.A.S. All authors have read and agreed to the published version of the manuscript.

Funding

This research was funded by the Program of the Republic of Poland—Research Grant MUT 1034, Project No. UGB 531-000031-W900-22.

Institutional Review Board Statement

Not applicable.

Informed Consent Statement

Not applicable.

Data Availability Statement

The data presented in this study are available on request from the corresponding author due to privacy.

Conflicts of Interest

The authors declare no conflicts of interest.

References

  1. Pura, P.; Szymański, M.; Dudek, M.; Jaroszewicz, L.R.; Marć, P.; Kujawińska, M. Polymer microtips at different types of optical fibers as functional elements for sensing applications. J. Light. Technol. 2015, 33, 2398–2404. [Google Scholar] [CrossRef]
  2. Dudek, M.; Kujawińska, M. Optonumerical method for improving functional parameters of polymer microtips. Opt. Eng. 2018, 57, 014101. [Google Scholar] [CrossRef]
  3. Kurzych, A.; Jaroszewicz, L. A Review of Rotational Seismology Area of Interest from a Recording and Rotational Sensors. Sensors 2024, 24, 7003. [Google Scholar] [CrossRef] [PubMed]
  4. Brambilla, G.; Xu, F.F.; Horak, P.; Jung, Y.; Koizumi, F.; Sessions, N.P.; Koukharenko, E.; Feng, X.; Murugan, G.S.; Wilkinson, J.S.; et al. Optical fiber nanowires and microwires: Fabrication and applications. Adv. Opt. Photonics 2009, 1, 107–161. [Google Scholar] [CrossRef]
  5. Sumetsky, M.; Dulashko, Y.; Fini, J.M.; Hale, A.; DiGiovanni, D.J. The microfiber loop resonator: Theory, experiment, and application. J. Light. Technol. 2006, 24, 242–250. [Google Scholar] [CrossRef]
  6. Zheng, Y.; Dong, X.; Zhao, C.; Li, Y.; Shao, L.; Jin, S. Relative Humidity Sensor Based on Microfiber Loop Resonator. Adv. Mater. Sci. Eng. 2013, 2013, 815930. [Google Scholar] [CrossRef]
  7. Chen, H.; Shao, Z.; Hao, Y.; Rong, Q. A high-frequency hydrophone using an optical fiber microknot resonator. Opt. Commun. 2019, 446, 77–83. [Google Scholar] [CrossRef]
  8. Yang, H.; Kong, L.; Li, L.; Wang, Y.; Li, X.; Wang, X.; Bo, Y.; Wang, Y.; Wei, Q.; Lu, X. Enhanced-sensitive dual microfiber knot resonators based sensor with vernier effect for simultaneous measurement of refractive index and temperature. Optik 2022, 250, 168350. [Google Scholar] [CrossRef]
  9. Zhang, Y.N.; Gao, J.; Xia, F.H.B.; Zhao, Y. Microfiber Knot Resonators: Structure, Spectral Properties, and Sensing Applications. Laser Photonics Rev. 2024, 18, 2300765. [Google Scholar] [CrossRef]
  10. Shen, T.H.; Wang, L.A. A Two-Layer Microcoil Resonator With Very High Quality Factor. IEEE Photonics Technol. Lett. 2014, 26, 535–537. [Google Scholar] [CrossRef]
  11. Wu, Y.; Zhang, T.; Rao, Y.J.; Gong, Y. Miniature interferometric humidity sensors based on silica/polymer microfiber knot resonators. Sens. Actuators B Chem. 2011, 155, 258–263. [Google Scholar] [CrossRef]
  12. Lee, Y.; Xu, Z.; Tan, S.; Fang, F. Recent advances in microfiber sensors for highly sensitive biochemical detection. J. Phys. D Appl. Phys. 2019, 52, 493002. [Google Scholar]
  13. Ismaeel, R.; Lee, T.; Ding, M.; Broderick, N.G.R. Nonlinear microfiber loop resonators for resonantly enhanced third harmonic generation. Opt. Lett. 2012, 37, 5121–5123. [Google Scholar] [CrossRef]
  14. Ismaeel, R.; Gouveia, M.A.L.T.; Codemard, C.A.; Brambilla, G. Enhanced Second Harmonic Generation in Microfiber Loop Resonators. In Proceedings of the 2013 Conference on Lasers and Electro-Optics—International Quantum Electronics Conference, Munich, Germany, 12–16 May 2013. [Google Scholar]
  15. Zhai, X.; Zhang, W.; Cui, J.; Huang, H.; Wang, Y.; Zhang, G.; Wang, R.; Yang, Y.; Wang, Y. Underwater acoustic sensor based on microfiber knot resonator. Opt. Fiber Technol. 2024, 84, 103711. [Google Scholar] [CrossRef]
  16. Huang, H.; Cui, J.; Zhang, W.; Zhang, G.; Wang, R.; Yang, Y.Y.; Wang, Y. A microfiber knot resonator for ultrasonic underwater detection. Opt. Fiber Technol. 2025, 91, 104152. [Google Scholar] [CrossRef]
  17. Liu, C.; Zhang, J.; Li, Q.; Su, L.; Fu, X.; Jin, W.; Bi, W.; Fu, G. Ultrasound detection based on optical tapered-knot resonator sensor. Sens. Actuators A. Phys. 2024, 396, 115214. [Google Scholar] [CrossRef]
  18. Sun, L.; Li, J.; Tan, Y.; Shen, X.; Xie, X.; Gao, S.; Guan, B.O. Miniature highly-birefringent microfiber loop with extremely-high refractive index sensitivity. Opt. Express 2012, 20, 10180–10185. [Google Scholar] [CrossRef]
  19. Xu, F.; Horak, P.; Brambilla, G. Optical microfiber coil resonator refractometric sensor. Opt. Express 2007, 15, 7888–7893. [Google Scholar] [CrossRef]
  20. Irawati, N.; Rahman, H.; Ahmad, H.; Harun, S. A PMMA microfiber loop resonator based humidity sensor with ZnO nanorods coating. Measurement 2017, 99, 128–133. [Google Scholar] [CrossRef]
  21. Yi, Y.; Jiang, Y.; Zhao, H.; Brambilla, G.; Fan, Y. High-Sensitivity Humidity Sensor Based on Microknot Resonator Assisted Agarose-Coated Mach-Zehnder Interferometer. J. Light. Technol. 2022, 40, 2191–2196. [Google Scholar] [CrossRef]
  22. Talataisong, W.; Ismaeel, R.; Masoudi, A.; Beresna, M.; Brambilla, G. Magnetic field sensor based on multi-port microcoil resonator. In Proceedings of the 25th International Conference on Optical Fiber Sensors, Jeju, Republic of Korea, 24–28 April 2017; Volume 1032309. [Google Scholar]
  23. Lakomski, M.; Guzowski, B.; Wozniak, A. Fabrication of ultra-long tapered optical fibers. Microelectron. Eng. 2020, 221, 111193. [Google Scholar] [CrossRef]
  24. Wang, Q.; Jing, J.-Y.; Wang, B.-T.; Li, S. Recent progress and applications of optical microfiber and nanofiber devices. Instrum. Sci. Technol. 2019, 47, 117–139. [Google Scholar] [CrossRef]
  25. Korec-Kosturek, J.; Moś, J.E. Advances in Optical Microfibers: From Fabrication to Functionalization and Sensing Applications. Materials 2025, 18, 2418. [Google Scholar] [CrossRef] [PubMed]
  26. Memon, S.F.; Ali, M.M.; Pembroke, J.T.; Chowdhry, B.S. Measurement of Ultralow Level Bioethanol Concentration for Production Using Evanescent Wave Based Optical Fiber Sensor. IEEE Trans. Instrum. Meas. 2018, 67, 780–788. [Google Scholar] [CrossRef]
  27. Stasiewicz, K.A.; Jakubowska, I.; Moś, J.E.; Kosturek, R.; Kowiorski, K. In-Line Gas Sensor Based on the Optical Fiber Taper Technology with a Graphene Oxide Layer. Electronics 2023, 12, 830. [Google Scholar] [CrossRef]
  28. Tian, Y.; Wang, W.; Wu, N.; Zou, X.; Wang, X. Tapered Optical Fiber Sensor for Label-Free Detection of Biomolecules. Sensors 2011, 11, 3780–3790. [Google Scholar] [CrossRef]
  29. Chen, G.Y. A Review of Microfiber and Nanofiber Based Optical Sensors. Open Opt. J. 2014, 7, 32. [Google Scholar] [CrossRef]
  30. Lee, T.; Broderick, N.G.R.; Brambilla, G. Resonantly enhanced third harmonic generation in microfiber loop resonators. J. Opt. Soc. Am. B 2013, 30, 505–511. [Google Scholar] [CrossRef]
  31. Luo, W.; Chen, Y.; Xu, F. Recent Progress in Microfiber-Optic Sensors. Photonic Sens. 2021, 11, 45–68. [Google Scholar] [CrossRef]
  32. Shi, L.; Xu, Y.; Tan, W.; Chen, X. Simulation of Optical Microfiber Loop Resonators for Ambient Refractive Index Sensing. Sensors 2007, 7, 689–696. [Google Scholar] [CrossRef]
  33. Sumesky, M. Optical fiber microcoil resonator. Opt. Express 2004, 12, 2303–2316. [Google Scholar] [CrossRef] [PubMed]
  34. Lou, N.; Jha, R.; Domínguez-Juárez, J.L.; Finazzi, V.; Villatoro, J.; Badenes, G.; Pruneri, V. Embedded optical micro/nano-fibers for stable devices. Opt. Lett. 2010, 35, 571–573. [Google Scholar] [CrossRef] [PubMed]
  35. Jali, M.H.; Rafis, R.H.R.A.; Johari, M.A.M.; Baharom, M.F.; Ahmad, A.; Yusof, H.H.M.; Harun, S.W. Optical Microfiber Sensor: A Review. J. Phys. Conf. Ser. 2021, 2075, 012021. [Google Scholar] [CrossRef]
  36. Chunyang, H.; Hui, D.; Xianli, L.; Shaofei, D. Temperature insensitive refractive index sensor based on single-mode micro-fiber Sagnac loop interferometer. Appl. Phys. Lett. 2014, 104, 181906. [Google Scholar] [CrossRef]
  37. Kurzych, A.; Jaroszewicz, L.; Kowalski, J. Development of Three-Axis Fibre-Optic Seismograph for Direct and Autonomous Monitoring of Rotational Events with Perspective of Historical Review. Sensors 2022, 22, 8902. [Google Scholar] [CrossRef]
  38. Shahal, S.; Duadi, H.L.Y.; Fridman, M. Complex Fiber Micro-Knots. Sensors 2018, 18, 1273. [Google Scholar] [CrossRef]
  39. Korec-Kosturek, J.; Stasiewicz, K.A.; Strzezysz, O.; Kula, P.; Jaroszewicz, L.R. Electro-Steering Tapered Fiber-Optic Device with Liquid Crystal Cladding. J. Sens. 2019, 2019, 1617685. [Google Scholar] [CrossRef]
  40. Mos, J.E.; Stasiewicz, K.A.; Matras-Postołek, K.; Jaroszewicz, L.R. Thermo-Optical Switching Effect Based on a Tapered Optical Fiber and Higher Alkanes Doped with ZnS:Mn. Materials 2020, 13, 5044. [Google Scholar] [CrossRef]
  41. Corning. Available online: https://www.corning.com/media/worldwide/coc/documents/Fiber/product-information-sheets/PI-1424-AEN.pdf (accessed on 6 February 2025).
Figure 1. A straight TOF, with a large evanescent field in the taper waist area.
Electronics 14 02619 g001
Figure 2. The MLR structure with its parameters and spectral changes.
Electronics 14 02619 g002
Figure 3. Modification of MLR by twisting.
Electronics 14 02619 g003
Figure 4. The manner of security of the MLR structure.
Electronics 14 02619 g004
Figure 5. The SEM pictures of MLR structures for different numbers of twists with measurement of the coupling and radius parameters.
Electronics 14 02619 g005
Figure 6. Scheme of measurement systems for (a) examining the sensor’s response to vibrations, top view on FOTET and manner of measurement, and (b) performing spectral analysis.
Electronics 14 02619 g006
Figure 7. Examples of time-domain measurements obtained using vibration sensors with a TOF length of l2 = 25 mm are presented, including: (a) a straight TOF (reference signal for the other sensors), (b) 1 twist, and (c) 2 twists. The signals were recorded under the impact of a mass dropped from various heights, h: 1, 7, and 14 cm, at a fixed horizontal distance of d = 41 cm.
Electronics 14 02619 g007
Figure 8. Resonance spectrum and parameters, FSR, FWHM, and λres, of MLR with (a) 1 twist, (b) 2 twists, and (c) 3 twists.
Electronics 14 02619 g008
Table 1. Determined signal changes using vibration sensors with a straight TOF, l1 = 20 mm and l2 = 25 mm, under the impact of a mass dropped from various heights, h: 1, 7, and 14 cm, at a horizontal distance of d: 41, 73, and 90 cm. All values of the received signal change in the table are given in mV.
A Straight TOFl1 = 20 mml2 = 25 mm
d (cm)417390417390
h (cm)
135.931.939.967.951.995.8
735.935.935.983.879.8103.8
1439.931.335.987.887.8103.8
Relative error < 10%.
Table 2. Determined signal changes using vibration sensors with a MLR structure with 1 twist for the length of TOF, l1 = 20 mm and l2 = 25 mm, under the impact of a mass dropped from various heights, h: 1, 7, and 14 cm, at a horizontal distance of d: 41, 73, and 90 cm. All values of the received signal change in the table are given in mV.
1 Twistl1 = 20 mml2 = 25 mm
d (cm)417390417390
h (cm)
151.935.955.951.943.971.8
767.947.975.971.963.991.8
1475.963.971.995.879.8103.8
Relative error < 10%.
Table 3. Determined signal changes using vibration sensors with a MLR structure with 2 twists for the length of TOF, l1 = 20 mm and l2 = 25 mm, under the impact of a mass dropped from various heights, h: 1, 7, and 14 cm, at a horizontal distance of d: 41, 73, and 90 cm. All values of the received signal change in the table are given in mV.
2 Twistsl1 = 20 mml2 = 25 mm
d (cm)417390417390
h (cm)
139.939.939.975.843.983.8
743.947.947.9115.871.9123.8
1451.959.951.9127.767.9123.8
Relative error < 10%.
Table 4. Determined signal changes using vibration sensors with a MLR structure with 3 twists for the length of TOF, l1 = 20 mm and l2 = 25 mm, under the impact of a mass dropped from various heights, h: 1, 7, and 14 cm, at a horizontal distance of d: 41, 73, and 90 cm. All values of the received signal change in the table are given in mV.
3 Twistsl1 = 20 mml2 = 25 mm
d (cm)417390417390
h (cm)
157.138.638.163.689.168.2
7124.6113.4106.193.6220.1130.3
14127.8133.6106.1111.4231.596.3
Relative error < 10%.
Table 5. Parameters used to calculate the Q-factor from the resonance spectrum and values of the Q-factor for different structures of MLR.
Number of Twists
123
FSR (nm)0.90.870.8
FWHM (nm)0.50.320.3
λres (nm)1229.21228.31252
Q-factor2.4 × 1033.8 × 1034.1 × 103
Disclaimer/Publisher’s Note: The statements, opinions and data contained in all publications are solely those of the individual author(s) and contributor(s) and not of MDPI and/or the editor(s). MDPI and/or the editor(s) disclaim responsibility for any injury to people or property resulting from any ideas, methods, instructions or products referred to in the content.

