Abstract
Efficient and accurate recognition of highway pavement cracks is crucial for the timely maintenance and long-term use of expressways. Among the existing crack acquisition methods, human-based approaches are inefficient, whereas carrier-based automated methods are expensive. Additionally, both methods present challenges related to traffic obstruction and safety risks. To address these challenges, we propose a fixed pan-tilt-zoom (PTZ) vision-based highway pavement crack recognition workflow. Pavement cracks often exhibit complex textures with blurred boundaries, low contrast, and discontinuous pixels, leading to missed and false detection. To mitigate these issues, we introduce an algorithm named contrast-enhanced feature reconstruction (CEFR), which consists of three parts: comparison-based pixel transformation, nonlinear stretching, and generating a saliency map. CEFR is an image pre-processing algorithm that enhances crack edges and establishes uniform inner-crack characteristics, thereby increasing the contrast between cracks and the background. Extensive experiments demonstrate that CEFR improves recognition performance, yielding increases of 3.1% in F1-score, 2.6% in mAP@0.5, and 4.6% in mAP@0.5:0.95, compared with the dataset without CEFR. The effectiveness and generalisability of CEFR are validated across multiple models, datasets, and tasks, confirming its applicability for highway maintenance engineering.
1. Introduction
The rapid expansion of expressway infrastructure in China has led to a substantial increase in total expressway mileage, reaching a staggering 171,000 km by 2023, as reported by the Ministry of Transport [1]. However, the complex external forces and internal stresses acting on expressways create significant challenges in maintaining this vast network, particularly in detecting and mitigating pavement degradations that threaten road longevity and functionality. Among these, pavement cracks are particularly prevalent and require timely detection to prevent further deterioration and minimize economic losses.
Felix, O. et al. revealed that with limited resources, an increasing amount of infrastructure but relatively fewer management resources, computer vision promises safer and more efficient pavement management [2]. Pavement crack recognition typically involves image collection followed by crack identification. Two primary image acquisition methods exist: manual and automated. Manual collection is time-consuming, labor-intensive, inefficient, and prone to errors while also posing safety risks. In contrast, automated methods significantly enhance detection efficiency and accuracy. Automated methods are gradually becoming mainstream and can be categorized into mobile and fixed types based on their image acquisition characteristics. Mobile methods rely on moving carriers, such as cars equipped with digital cameras [3], 3D line scanning laser systems [4], and ground-penetrating radar [5], to scan the road. However, such systems necessitate speed restrictions and traffic flow management, adversely affecting expressway traffic efficiency. Additionally, the instruments used are expensive and difficult to maintain, posing further challenges. Zhang, L. et al. [6], Zhu, J. et al. [7], and Li, Y. et al. [8] have explored using UAVs as mobile carriers for crack detection, which minimizes transportation disruptions. However, UAV-collected images often suffer from interference due to moving traffic, leading to discontinuous and incomplete datasets.
With the advancement of intelligent transportation systems (ITS), fixed pan-tilt-zoom (PTZ) camera-based roadside video monitoring has become an integral part of highway surveillance (Figure 1). Fixed PTZ cameras are strategically deployed at appropriate intervals along highways to ensure comprehensive pavement monitoring. Pavement data acquisition through roadside video surveillance is a fixed automated crack data acquisition method worth exploring, as it enables extensive road monitoring and prioritizes the capture of high-quality images of vulnerable highway sections. Moreover, this method offers advantages such as enhanced safety and zero impact on traffic flow.
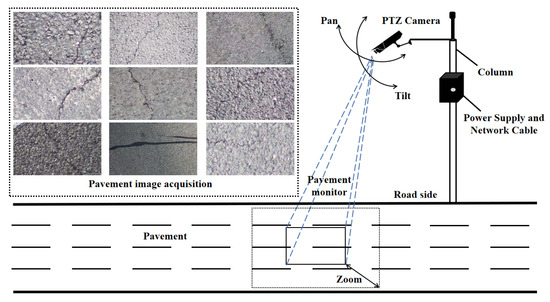
Figure 1.
Extensive pavement image acquisition based on the fixed PTZ camera alongside the road with the function of pan, tilt, and zoom.
Although there are many advantages to collecting pavement images based on fixed-PTZ vision, there are some drawbacks that we need to focus on, such as variable and complex imaging conditions, crack features not being easy to distinguish from the background texture of the pavement, etc., which will affect the performance of crack recognition. Therefore, how to solve these problems is the key point in our research.
After image acquisition, how to highlight crack features by image processing to reduce the learning difficulty of neural networks is still a challenge. Prior work employed gradient enhancement to emphasize crack edges, achieving an 87.7% mAP [9]. However, the method exhibited a high rate of missed detections attributed to the following reasons:
- Deep learning-based models typically excel at recognizing objects with well-defined shapes and structures, whereas cracks exhibit random and indistinct morphologies.
- Varying shooting angles and lighting conditions introduce randomly distributed road texture shadows in the images, causing visual confusion between cracks and the background (Figure 2a).
- In early-stage pavement cracking, discontinuous crack structures lead to ambiguous boundaries and increased misclassification (Figure 2b).
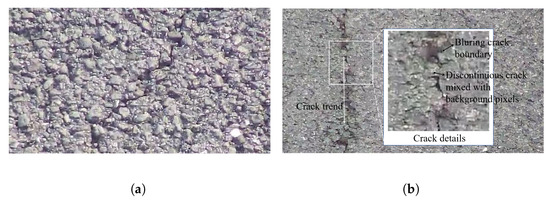
Figure 2.
Demonstration of some complicated crack. (a) Insignificant crack in the rough pavement with complicated texture shadows. (b) Discontinuous crack pixels are interspersed with background pixels in the crack orientation, and the crack boundaries are relatively blurred. Localized crack details in the white box were enlarged, and explanatory text has been included in the relevant places.
To address these limitations, we propose the contrast-enhanced feature reconstruction (CEFR) method. CEFR applies a three-step process: First, it performs a numerical transformation of image pixels based on comparison rules, focusing on reconstructing the nonlinear pixel distribution of the background and cracks under practical illumination while correcting the ambiguity between crack and background features. Second, CEFR applies nonlinear pixel stretching, further enhancing the contrast between cracks and the background; however, crack edges remain blurred. Finally, CEFR feature fusion is applied to restore information lost in previous processing, producing a high-contrast, reconstructed crack image. By reconstructing crack features while preserving their fundamental morphology, CEFR enables neural networks to learn more distinctive and accurate crack representations, improving recognition performance. The workflow for crack recognition is depicted in Figure 3. The original image is firstly pre-processed by CEFR, in which the image is sequentially transformed by comparison-based pixel transformation, nonlinear stretching, and feature extraction to finally obtain the CEFR feature salient map, and then the enhanced image is used as input into the object recognition network to obtain the final recognition result.
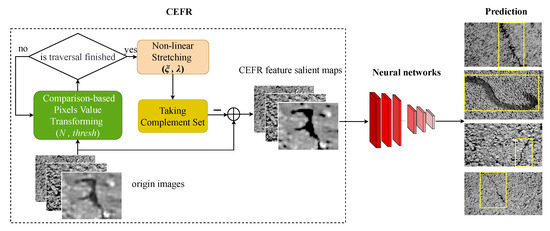
Figure 3.
CEFR-based crack recognition workflow. The original images is processed by CEFR and then transform to CEFR feature saliency map. The yellow rectangles in the prediction means the recognition result of neural networks.
The remainder of the paper is organized as follows: The section on “Related works” reviews current crack pre-processing techniques in highway pavement crack recognition. “Methodology” provides a detailed description of the CEFR algorithm. The section on “Experiments and Results” describes dataset preparation and model parameter settings, and evaluates the performance of CEFR in crack identification while verifying its generalization. The section on “Discussions” analyzes the experimental results and addresses existing challenges. Finally, “Conclusions” summarizes the key findings of this study.
2. Related Works
This section discusses studies on two key aspects of highway pavement crack recognition: crack pre-processing and crack recognition.
2.1. Review of Crack Pre-Processing
2.1.1. Crack Pre-Processing Based on Threshold Segmentation
The primary objective of threshold segmentation is to determine an appropriate threshold for distinguishing the target object from the background. The choice of threshold determines the segmentation quality, and extensive research has been conducted to optimize threshold selection. Otsu’s method [10] is a classical histogram-based threshold segmentation approach that selects a pixel value corresponding to the valley between the bimodal peaks in the histogram. However, for pavement crack images, such a threshold is often difficult to identify, leading to incomplete crack segmentation. To address this, Quan, Y. et al. [11] introduced a probability weighting factor to refine Otsu’s method, while Oliveira, H. et al. [12] employed a dynamic threshold and entropy-based method to detect potential crack pixels. However, these approaches remain constrained by the limitations of bimodal histograms. As pavement cracks have diverse edge characteristics, a single global threshold often fails to achieve accurate crack segmentation, making local thresholding a preferable alternative. Several studies have explored hybrid approaches to overcome the limitations of single-threshold segmentation. Chen, C. et al. [13] integrated global and local thresholding using maximum interclass deviation, while Wang, S. et al. [14] and Akagic, A. et al. [15] divided crack images into smaller regions, applying local thresholds to each segment. This method mitigates the shortcomings of single-threshold segmentation, yielding improved results. However, for large-scale crack recognition tasks, manual threshold selection is labor-intensive, whereas adaptive thresholding addresses this issue and improves the efficiency of threshold generation. Safaei, N. et al. [16] introduced an adaptive thresholding approach based on the Gaussian cumulative density function (CDF) to implement a weighted neighborhood pixels segmentation, while Peng, L. et al. [17] applied a comparison iteration method for adaptive threshold selection. Despite these advancements, threshold-based segmentation remains susceptible to errors when crack contrast is low or pavement textures are complex. Under such conditions, no single threshold can reliably achieve accurate segmentation, potentially distorting crack morphology and reducing identification accuracy.
2.1.2. Crack Pre-Processing Based on Transform Domains
Owing to the limitations of spatial-domain crack pre-processing, studies have sought solutions in the transform domain. Ma, C. et al. [18] applied fractional differentiation and wavelet transforms to enhance detail features while preserving most low-frequency information. However, on worn or rough road surfaces, this approach can amplify background texture shadows, distorting crack characteristics. Ying, L. et al. [19] divided images into multiple segments and applied the beamlet transform to extract cracks from images, while Sun, L. et al. [20] used multiscale wavelet transform to reconstruct crack images and reduce interference from background texture shadows. Hamici, Z. et al. [21] adopted a 2D dual-tree double-density wavelet transform to minimize the fine-texture noise of roads under complex illumination conditions. Sandra M. et al. [22] proposed an automatic image processing based on the Hough transform algorithm for pavement crack detection. Although effective, these methods require high-quality images and involve parameter tuning, rendering them less suitable for large-scale crack recognition.
2.1.3. Crack Pre-Processing Based on Filtering Technique
Filtering techniques have also been explored for crack pre-processing. Steerable filters, in particular, have gained significant attention. Li, S. et al. [23] and Liang, J. et al. [24] used steerable filters based on second-order bias derivatives of 2D Gaussian to capture crack edges and generate crack saliency maps. Similarly, Wang, W. et al. [25] used steerable filters based on local outlier factors to enhance crack–background contrast while suppressing noise. Sun, M. et al. [26] proposed an adaptive bilateral filter that adjusts parameters to highlight cracks while reducing noise interference. However, these filters often prioritize noise removal over crack enhancement, leading to unintended suppression of fine cracks, which may be mistakenly treated as noise and removed.
2.1.4. Other Crack Pre-Processing Methods
In addition to the aforementioned methods, several innovative approaches have been proposed for crack pre-processing. Sun, L. et al. [27] developed a weighted domain pixel method using eight-directional patterns to create a uniform background. Shao, C. et al. [9] employed gradient enhancement to emphasize crack edges, though this technique also enhances the edges of the background texture, leading to misidentification during crack recognition. Histogram equalization is another common crack pre-processing technique to improve image contrast. Ullah, A. et al. [28] designed a segmentation and edge detection method based on histogram adjustment, while Liu, J. et al. [29] combined contrast-limited adaptive histogram equalization (CLAHE) with standard histogram equalization (HE) to homogenize the histogram, enhance background similarity, and improve crack saliency. However, although this approach enhances contrast, it can also blur crack boundaries, rendering on-site positioning for repairs more challenging for expressway maintenance teams.
2.2. Review of Crack Recognition Methods
With the rapid advancement of artificial intelligence and computer vision, crack-recognition technology has become increasingly intelligent and efficient. Recently, novel crack recognition models have been proposed to enhance detection accuracy and robustness. For instance, Qu, Z. et al. [30] introduced a multiscale convolutional feature fusion module that enhances the ability of the neural network to refine crack-related features. Similarly, Li, B. et al. [31] developed a model that integrates grid-based classification with box-based detection, thereby enhancing crack recognition performance. To improve the detection of tubular structures, Qi, Y. et al. [32] proposed the dynamic snake convolution method, which accurately captures crack features.
The fusion of advanced models has also emerged as a promising research direction. Yao, H. et al. [33] explored the optimal integration of a self-attention mechanism into the YOLOv5 network, leading to significant performance improvements. Eshta R. et al. [34] combined an attention-based mechanism and multiscale feature fusion RetinaNet convolutional neural network to establish a crack detection workflow. Additionally, Xiang, X. et al. [35] incorporated transformer-based architectures into YOLOv5, enhancing its ability to detect long cracks more effectively. Zhu G. et al. [36] adopt a new type of hybrid attention blocks and residual blocks (RBs) to proposed an efficient, lightweight encoder–decoder network for automatically detecting pavement cracks. Ju H. et al. [37] proposed a crack-deep network, which is based on Faster Region Convolutional Neural Network (Fast-RCNN) architecture by embedding a sensitivity detection network parallel to the feature extraction Convolutional Neural Network (CNN). This method saves the step of image pre-processing and efficiently integrates the crack recognition process.
Although these methods have demonstrated promising results in crack recognition, they still struggle to handle crack images with blurred edges under complex backgrounds, such as those captured by fixed PTZ vision systems. Addressing this challenge remains a crucial area of research for further improving crack detection accuracy.
In conclusion, crack recognition faces significant challenges owing to complex pavement textures and discontinuous crack patterns, particularly under nonlinear illumination conditions. Variations in lighting, such as cloudy, foggy, sunny, or overcast conditions, introduce inconsistencies in crack appearance, severely impacting recognition accuracy. Consequently, robust crack recognition methods must account for these nonlinear lighting effects to ensure reliable performance on expressways.
2.2.1. Challenges in Pavement Crack Recognition Using Fixed PTZ Vision
Pavement crack recognition under fixed PTZ vision conditions is particularly challenging due to nonlinear lighting variations, including fluctuating light angles, varying intensities, and image noise caused by environmental factors such as dithering. In neural network-based crack recognition, two common limitations are missed detections and reduced accuracy, primarily due to the convolutional’s limited ability to learn nonlinear features effectively [9]. This necessitates the development of more robust techniques to improve crack recognition under complex illumination conditions.
2.2.2. Existing Approaches and Their Limitations
One notable approach to local feature extraction is the RATMIC descriptor, introduced by Huang et al. [38], which exhibits excellent performance in handling affine transformations and monotonic intensity changes. Shao, C. et al. [39] leveraged RATMIC for binary image transformation, partially mitigating the over-smoothing issue in the Canny algorithm. This method was followed by small-eigenvalue-based feature extraction, which effectively identified linear structures. However, despite its advantages, the combination of RATMIC and small-eigenvalue-based crack recognition has proven inadequate for highway pavement cracks. This is primarily due to the following reasons:
- Low Visibility of Cracks: crack pixels constitute only a small percentage of the overall image, rendering them difficult to distinguish from the background.
- Complex and Random Background Textures: cracks are often obscured by pavement textures, reducing detection effectiveness.
2.2.3. Contrast-Enhanced Feature Reconstruction
To overcome these limitations, this study proposes a contrast-enhanced feature reconstruction method designed to improve crack recognition performance using neural networks. By enhancing the visibility of crack features while preserving critical structural information, this approach significantly improves detection accuracy under complex illumination conditions.
3. Methodology
3.1. Comparison-Based Pixel Transformation of CEFR
Inspired by the affine transformations and monotonic intensity changes of the RATMIC descriptor, combined with the pixel distribution characteristics of the highway cracks. We believe that the expressway crack image belongs to a single-scene complex image, where “single” means that all the pixels belong to the pavement surface, all the pixel relationships belong to the pavement surface features, and the cracks also belong to the road surface; “Complex” means that the texture in the image is complex and the features are blurred. We want to optimize the pixel relationships to find a clear representation of the cracks in the fuzzy pavement features.
Crack feature representation is not only determined by the crack pixels but also by the background pixels adjacent to the crack boundaries. Both the internal characteristics of the crack region and the pixel relationships near the crack boundary are critical components of crack representation. CEFR-based reconstruction focuses on both individual pixel values and their spatial relationships within the crack image. By employing a sliding window method, CEFR reconstructs the image through pixel mapping, effectively transforming the spatial pixel relationships into a more robust structure in the transform domain. The comparison-based pixel transformation in CEFR is performed as follows: The crack images are fully scanned using an N × N scanning window in steps of N, moving from the top left corner to the bottom right corner (the transforming window moves from left to right in one row and then moves up and down to the next row until all pixels are traversed), as shown in Figure 4. Then we got the transforming map after the whole image traversing is finished.
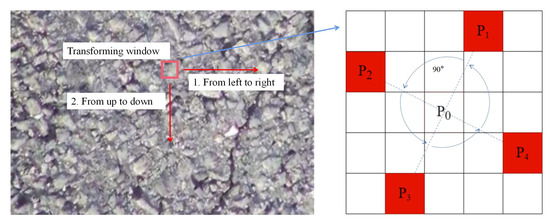
Figure 4.
“Comparison-based Pixel Transformation” of CEFR. The red arrow indicates the direction of traversal of the transforming window, and the blue arrow points to an enlarged view of the red transforming window. , , , denote the four position in one rotational comparison pixel group.
Suppose the resolution of an image is , so the whole image needs transforming windows; i denotes the serial number of the transforming window, . Within each transforming window, there are h groups of pixels participating in the rotational comparison, ; j denotes the serial number of the rotational comparison pixel group, , and in each group of rotational comparison pixels, n is used to identify the position of each pixel, . So we denote the pixel at each position in the transforming window as , and the center pixel of each transforming window is denoted as .
Taking the transforming window as an example, the center pixel is noted as , and the 8-neighborhood of a pixel around it can be divided into 2 groups of : , and , , respectively. In each rotational comparison pixel group, the initial position of is randomized, and the number of rotational comparison pixels in each group will be incremented around counterclockwise, as shown in Figure 5. For a transforming window, there are 6 groups of , , .
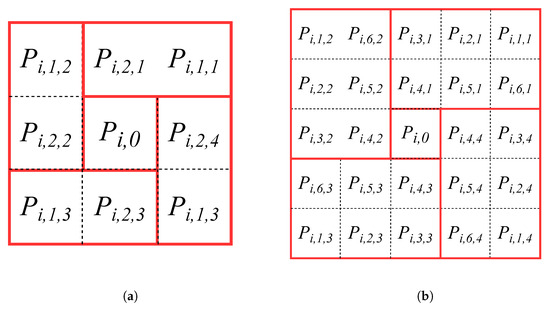
Figure 5.
Demonstration of different transforming window and rotational comparison pixel groups. (a) transforming window, two rotational comparison pixel groups. (b) transforming window, six rotational comparison pixel groups.
With each window, the central pixel and its neighboring pixels are transformed. Each is compared with the pixel positioned 90° counterclockwise around the window center . Specifically, after a 90° counterclockwise rotation around : 1. compared with ; 2. compared with ; 3. compared with ; 4. compared with .
Using this strategy, comparison-based pixel transformation is applied iteratively until all pixels, except the central pixel , have undergone transformation. Mathematically, this transformation is expressed as Equation (1).
where denotes the pixel value of in the original image, denote the pixel corresponding to in , mod is the modulation operation, and is an adjustable threshold for controlling the extent of value comparison between pixels.
For the central pixel , all feature information within the transformation window is incorporated to refine crack-related features. This ensures that serves as a representative element in the transformation process. The transformed pixel value of is computed as follows (Equation (2)):
where N is the size of the transformation window, is the central pixel in the transforming window. denote the pixel corresponding to in . k and l are nonzero values within the range . “comparison-based pixel transformation” is performed on original crack image I, as is shown in Figure 6a, then transformation map with reconstructed pixel distribution is obtained to the following nonlinear stretching of CEFR, as is shown in Figure 6b.
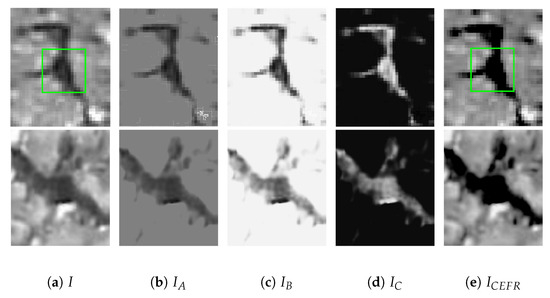
Figure 6.
Pixel-wise demonstration of localized crack processed by CEFR. Parameter settings: = 30, = 68. (a) Original crack. (b) Result of “comparison based pixel transformation”, transforming map . (c) Result of nonlinear stretching operation performed on . (d) Result of taking the complementary set operation of . (e) Result of feature fusion between and I. The green box in I and indicates the change in localized crack after CEFR processing.
3.2. Nonlinear Stretching of CEFR
High-contrast crack images enhance morphological pixel intensity, improve crack boundary detection, and enhance neural network-based crack recognition performance. Therefore, this subsection explores a method for obtaining high-contrast crack images. The distinction between cracked and background pixels depends on the magnitude of the pixel value step along crack boundary pixels. A larger pixel value step significantly improves the crack boundary differentiation. To achieve this, we propose a novel nonlinear pixel stretching approach, as defined in Equation (3), to enhance crack edges with pronounced pixel value steps (Figure 7):
where is the pixel value in , and is the pixel value in . controls the sensitivity of the nonlinear mapping; a larger results in more pronounced changes in the mapping output. controls the trend of the slope change; as increases, the contrast between the cracks and background in decreases.
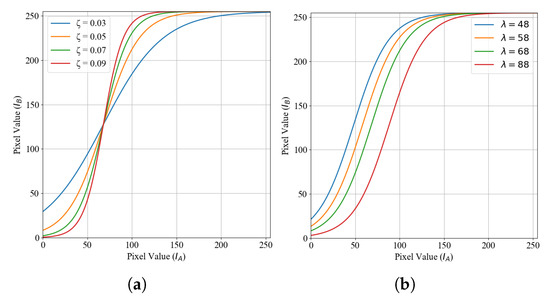
Figure 7.
Nonlinear stretching characteristics. (a) Characteristics of nonlinear stretching at different with fixed . (b) Characteristics of nonlinear stretching at different with fixed .
Nonlinear stretching is used to further increase the contrast of in order to obtain a clear edge of the crack. The principle is that the inner part of the crack usually shows low-value pixels, the background usually shows high-value pixels, and the pixels near the boundary usually belong to the medium–low value, and the clear boundary can be obtained by enlarging the difference of the pixels near the boundary.
According to the image, reflects the sensitivity of mapping stretching; the larger is, the pixel differences in the range of middle and low values will become larger after the mapping operation, but at the same time, it will make some crack pixels mistakenly mapped into high-value background pixels and also make some background pixels mistakenly mapped into the inner pixels of the cracks. Therefore, the rational control of the sensitivity of is conducive to preserving the integrity of the crack edge.
controls the trend of the slope of the mapping curve, and for the same , the larger is, the more pixels are mapped to lower-value pixels, but it may also lead to the enhancement of the background shadow texture, which interferes with the correct representation of the cracks.
As cracks occupy a smaller image portion than the background, their pixel values are typically lower, while background pixels have a broader intensity range owing to their diverse texture characteristics. In real-world crack images, excessive edge smoothing leads to blurred crack boundaries, rendering cracks harder to distinguish. The nonlinear mapping function increases the slope in low-intensity regions near crack edges, amplifying the intensity difference between cracks and background. For non-low-intensity pixel regions containing significant background information, the nonlinear mapping projects them to a higher intensity. As the pixel intensity increases, a large portion of the background pixels is eventually mapped to values close to 255, creating a more uniform background and reducing the complexity of background features. This results in (Figure 6c), where the background is simplified and crack contrast is maximized.
3.3. Generation of CEFR Feature Salient Map
For object recognition, we focus on enhancing positive sample features to improve crack feature quality through pre-processing. While prior steps refined crack edges and background, the inner crack region retained a more original pixel distribution. Achieving a uniform pixel distribution inside cracks is crucial for robust feature formation.
3.3.1. Feature Reconstruction Strategy
We assume that the ideal pixel distribution inside cracks follows a regular pattern based on lighting conditions, denoted as . However, real-world images contain motion blur resulting from adverse imaging conditions and other unfavorable factors, denoted as . As comparison-based pixel transformation and nonlinear stretching minimally affect inner crack pixels, the relationship between and the original image I follows Equation (4).
where and are the internal pixel distributions of the crack in the original image and , respectively. More importantly, the specific model of ideal pixel distribution and noise is unknown, rendering extracting optimal features from the original image particularly challenging. To address this, we adopted a novel approach for constructing pixels in the crack region, enhancing feature robustness and significance.
- Feature Embedding: crack features from are embedded into the original image I, such that the reconstructed crack edge features of converge with the original image to obtain , as shown in Equation (6).
belongs to the low-intensity pixel region; evidently, from the large number of images obtained, the pixel intensity range of the crack region does not exceed . Therefore, the result of Equation (6) becomes zero in the uint8 image format. Thus, even without knowing the ideal distribution model of cracks and noise in the original image, we can still transform the pixel distribution within cracks into a more uniform form. This reduces the feature complexity of the crack region while assigning it robust and distinctive crack features, as highlighted in the green box in Figure 6a,e. In summary, using Equations (7) and (8), all crack features are merged into the final CEFR feature saliency map, denoted as (Figure 6e).
3.3.2. CEFR-Based Crack Pre-Processing Results
After applying CEFR, four key enhancements are observed in pavement crack images (Figure 8):
- The crack pixel values become uniform, meaning all crack pixels are set to 0.
- The crack boundaries appear clearly discernible, generating a strong pixel value step and rendering the pavement background and cracks easily distinguishable.
- Blurring in the original crack image is eliminated, crack image dithering is suppressed, and the reconstructed crack image exhibits more robust pixel relationships. Hence, the useful information in the original crack image is clearly and fully preserved.
- Although the background texture shadows are also enhanced, they lack a clear directional trend, unlike cracks. This is due to their small size and non-aggregate distribution. Consequently, in CEFR-enhanced images, distinct differences exist between background texture shadows and cracks, ensuring that the background texture shadows do not interfere with crack feature representation.
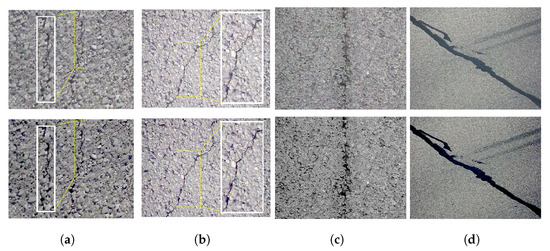
Figure 8.
Comparison between original cracks and those processed with CEFR. The first row shows the original crack images, and the second row shows results processed by CEFR with = 30, = 68. The localized fine crack detail in white boxes in (a,b) was enlarged to demonstrate the differentiation between original crack and CEFR-enhanced crack; (c) shows the effect of discontinuous fuzzy boundary cracks after CEFR enhancement; (d) shows the effect of repairing cracks after CEFR enhancement.
4. Experiment and Results
4.1. Data Preparation
Eight hundred seventy-eight pavement crack images are obtained by flipping and rotating the images of cracks collected from highways based on the fixed PTZ camera on G4/Jingshi Highway [40], named “Dataset based on the fixed-PTZ”, PTZD. The images are divided into a training set, a validation set, and a testing set based on an 8:1:1 ratio and formatted into a VOC dataset. The cracks are classified into four categories according to their direction: longitudinal crack, oblique crack, transversal crack, and repaired crack, as shown in Figure 9. The number of instances in each category is shown in Figure 10a. Among them, the resolutions of the repaired crack images are 1400 × 750, and the other crack images are between 585 × 303 and 1400 × 750. Note that rectangular box annotation is usually used in object recognition. For longitudinal and transversal cracks, the rectangular boxes can contain most of the crack information and only a small amount of background information. However, for oblique and repaired cracks, the proportion of crack information in the rectangular box is much lower than that of the background information. In such situations, neural networks will be distracted by too much background information in the annotation box; neural networks may learn the wrong crack features. Therefore, to minimize the interference from background information, we use multiple splitting annotations for oblique and repaired cracks, as shown in Figure 10b. R1 and R3 are the annotation boxes, and R2 and R4 are the background areas reduced by splitting annotations. There is no correlation between the size of the annotation box and the percentage of crack information inside the annotation box, but some background information can be removed by splitting the annotation. At the same time, experiments reveal that too many annotation boxes used on one crack will lead to severely missed detection. Therefore, we use 1–2 annotation boxes for splitting the annotation of oblique cracks and 2–4 annotation boxes for splitting the annotation of longer repaired cracks.
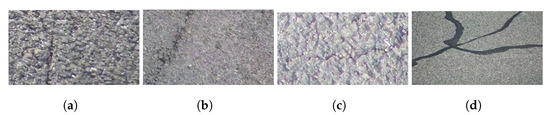
Figure 9.
Four categories of cracks in our work. (a) longitudinal crack. (b) oblique crack. (c) transversal crack. (d) repaired crack.
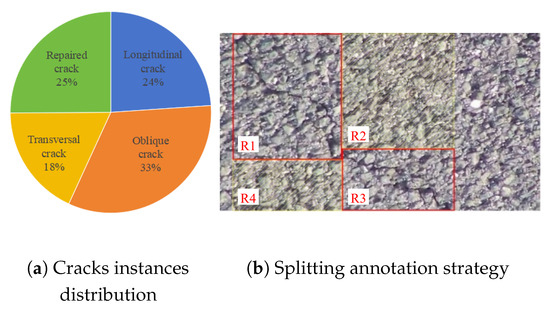
Figure 10.
Dataset information. (a) Instances number distribution of each type of crack. (b) Although splitting segmented labeling cannot change the percentage of cracks in the rectangular box, splitting segmented labeling can reduce the interference of background information in the R2 and R4 regions. R1 and R3 are the actual annotation boxes.
To validate the applicability of CEFR in other datasets and tasks, we randomly selected 350 images of 640 × 360 and 66 images of 480 × 320 from the public datasets Crack500 and CrackForest, respectively, to form the dataset CrackF. Furthermore, we used 1896 crack images and their segmentation labels from the public dataset Crack500 to validate the performance of CEFR in crack segmentation.
4.2. Experiment Model
The crack recognition technique used in the experiments is YOLOv5; compared with YOLOv3 [41], YOLOv5 has promising performance on speed and accuracy. Although higher versions of YOLO have been released, YOLOv5 is still the most classic advanced one-stage object detection algorithm, as the structures are shown in Figure 11. The backbone of the YOLOv5 network uses the C3 module incorporating the BottlenetCSP, which uses the idea of a residual network [42], which has a powerful feature extraction capability. The neck network part of YOLOv5 starts with a pyramid pooling layer (SPPF) module, which is capable of fusing multiscale feature layers. The overall neck network mainly uses the FPN + PAN structure, which adopts a multiscale fusion feature extraction strategy, and the detailed information of the target features is well preserved. The head network is in the final part of YOLOv5; three scales of features are generated, and we will get the final prediction result after post-processing, such as loss function calculation and Non-Maximum Suppression (NMS). YOLOv5 allows adjusting the width and depth of the network through the YAML file and also provides different activation functions, optimizers, and network components to adapt to different target detection tasks. Considering the computational expenses and speed, this paper uses the YOLOv5s model to conduct experiments.
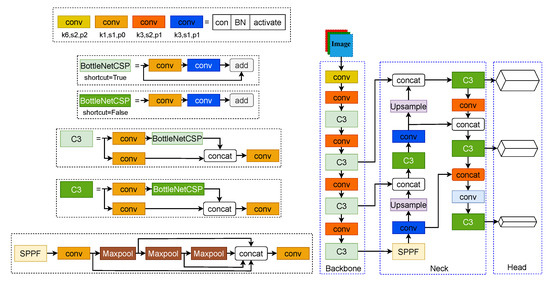
Figure 11.
Structure of YOLOv5 and its components.
4.3. Parameters Setting
The higher the threshold value in the CEFR mapping, the more background patterns are uniform. After extensive experimentation, it has been found that at a threshold of between 20 and 40, the ability to unify the background is ideal, as shown in Figure 12. In this paper, is chosen for conducting the following experiments in order to take into account the good ability to unify the background and to reduce the computational cost.
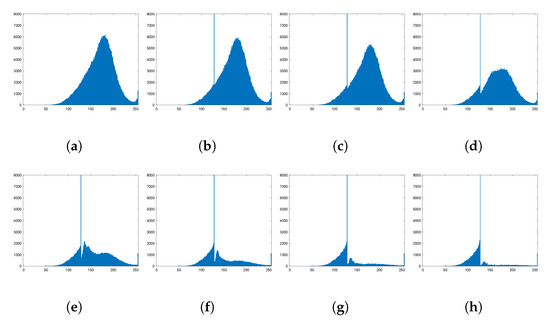
Figure 12.
Histogram graph of with different thresh from −20 to 40. The higher the increase, the more pixels are mapped to 128 to obtain a uniform background. (a) origin. (b) . (c) . (d) 0. (e) 10. (f) 20. (g) 30. (h) 40.
Excluding the extreme cases, we choose moderately sensitive nonlinear stretching curves with significant contrast-enhancing properties; therefore, is set to 0.05 to perform our experiments.
The training is performed with the YOLOv5s.pt pre-training weights, Adam optimizer, Lr0 = 0.001; the warm-up epoch are set to 10, max dataloader workers is set to 8, and a batch size of 16. The images are resized to 640 × 640. To overcome the subjectivity of human judgments during the annotation, label smoothing is applied with a value of 0.1. The preset training epoch is set to 10,000 to allow sufficient training for the neural network. To prevent overfitting, an early stopping mechanism is set to 100 epochs. The cache function is used for loading images into RAM to accelerate training.
In the experiments to validate the generality of the CEFR, the model configurations and hyper-parameters all use the official default settings and only change the epoch and batch size to satisfy the training convergence and hardware constraints.
4.4. Model Evaluation
In the object identification algorithm, measuring the performance of the algorithm is usually evaluated by indicators. In this paper, we mainly focus on the values of F1, mAP@0.5, and mAP@0.5:0.95; furthermore, precision and recall are also important to us.
Under certain Intersections of Union (IOUs) of the prediction box and bounding box, the prediction boxes can be divided into four categories: true positive , false positive , true negative , and false negative . Precision and recall can be calculated by Equations (9) and (10). However, we cannot distinguish whether performance is good or not by precision and recall, so we use F1 to comprehensively evaluate performance according to Equation (11).
Before calculating mean average precision (mAP), average precision (AP) needs to be calculated first. Under a given IOU, the prediction results of a category are ranked from highest to lowest based on confidence value, and the P–R curve is generated according to the corresponding precision and recall under each confidence value; then, the integrated area under the P–R curve is the AP value of this category. After we calculate the AP of each category, the average of all the APs is mAP. The mAP@0.5 means the AP is calculated under IOU = 0.5. The mAP@0.5:0.95 means the AP is calculated by averaging the AP values over a range of IOU thresholds from 0.5 to 0.95.
4.5. Experiment Results and Analysis
We conducted all experiments in the same experimental environment with the following configuration: Computer hardware: Intel(R) Xeon(R) Gold 6132 CPU @ 2.60 GHz, Nvidia Tesla V100 16 G; deep learning environment: CUDA 11.7, Python 3.8, and PyTorch 2.0.
All experiments followed a consistent procedure to obtain test results. The model parameters were set according to the above subsection. The training set was used for model training, and the neural network was fully trained using the early stop mechanism. The best weights were obtained on the validation set and later used on the test set to evaluate crack recognition performance. To benchmark the proposed method, we established a baseline using crack recognition performance on the original dataset (POD).
4.5.1. Effect of CEFR Parameter Settings on Crack Recognition Performance
To analyze the impact of CEFR parameter settings on crack recognition performance using YOLOv5, we pre-processed the original dataset with CEFR to generate feature salient map datasets by varying . Figure 13 illustrates the effects of CEFR feature saliency maps, while Figure 14 shows crack recognition test results. In Figure 12 and Figure 13, it was found that crack recognition is most effective when is around 68. However, visually, the cracks have a better contrast effect around = 88. Our experiments showed that most datasets processed with CEFR achieved better crack recognition than POD, with significant improvements in the three metrics F1, mAP@0.5, and mAP@0.5:0.95. The best performance was observed at . When , the slope of the nonlinear stretching function increased too slowly in low-intensity pixel regions, causing confusion between crack and background pixels, leading to feature loss and reduced performance.
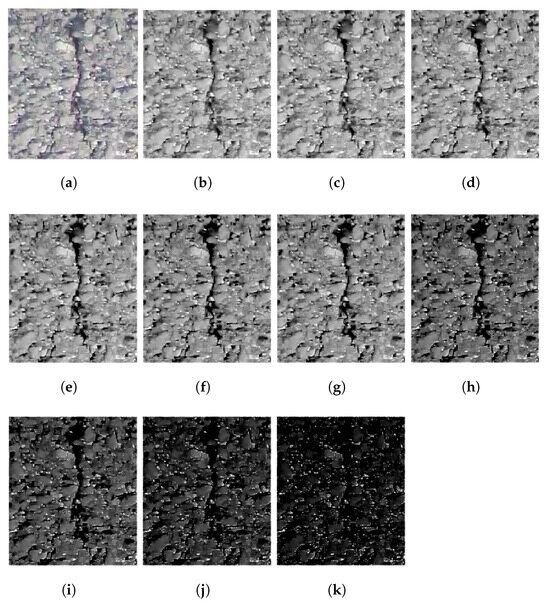
Figure 13.
Comparison of CEFR processing effect under varying with fixed , . (a) original image. (b) = 48. (c) = 58. (d) = 68. (e) = 78. (f) = 88. (g) = 98. (h) = 108. (i) = 118. (j) = 128. (k) = 138.
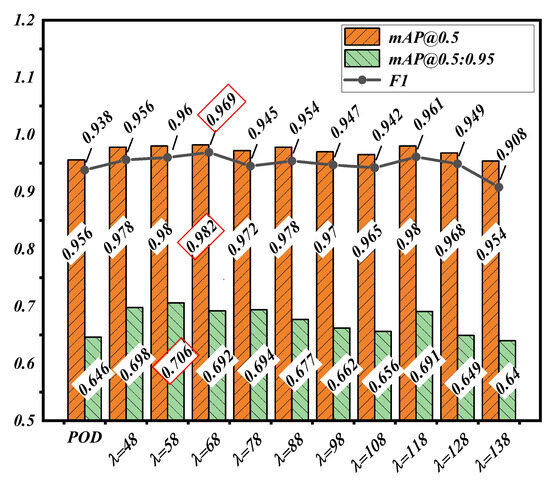
Figure 14.
Comparison of crack recognition performance between POD and enhanced dataset with different . The data with red boxes is the optimal performance.
4.5.2. Effect of CEFR Transforming Window Scale
We also tested neural network adaptability to different CEFR transforming window scales under the same model parameter configuration. The results of the test are listed in Table 1. The results indicate that crack recognition performance improves under all three scales compared with POD, with the best F1 and mAP@0.5 achieved under scale 3 and the best mAP@0.5:0.95 achieved under scale 7. Thus, we chose scale 3 for subsequent experiments.

Table 1.
Results under three CEFR transforming window scales. Experimental control variables: CEFR (, , ) + YOLOv5s + Hardswish.
4.5.3. Optimizing YOLOv5 for Crack Recognition
To further improve crack detection, we customized YOLOv5 by testing different activation functions on the PTZD dataset processed with CEFR. Table 2 shows that the hardswish activation function had the best expressiveness for our dataset.
Table 2.
Results under different activation function in YOLOv5. Experimental control variables: CEFR (N = 3, , , ) + YOLOv5s.
Based on the experimental results, the optimal CEFR parameter settings and YOLOv5 configuration were finalized:
- CEFR Parameters: , , , .
- YOLOv5 Configuration: Hard swish activation function.
Compared with the baseline POD, the F1, mAP@0.5, and mAP@0.5:0.95 values improved by 3.1%, 2.6%, and 4.6%, respectively. These results demonstrate significant enhancements in crack recognition performance. The classification performance for each category is presented in Table 3. Figure 15 illustrates the improved crack recognition. CEFR effectively suppressed overlapping prediction boxes due to weak feature contrast (Figure 15a,b,d,g). It also improved the recognition ability for cracks with discontinuous morphology and blurred boundaries (Figure 15a–c). Moreover, CEFR improved image quality by reducing overexposure and blurring to improve the recognition performance (Figure 15h–j). The average detection time was 12.7 ms per image, achieving real-time detection.
Table 3.
Each classification performance under optimal workflow. Experimental control variables: CEFR (N = 3, , , ), YOLOv5s + Hardswish.
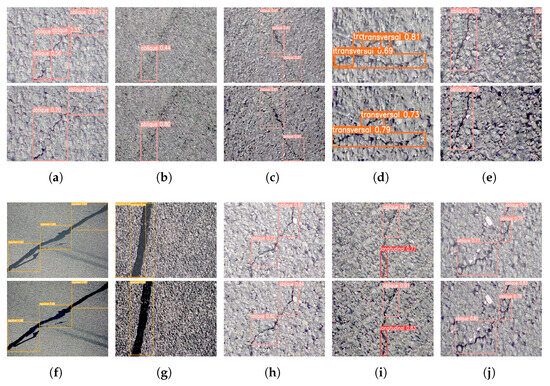
Figure 15.
Demonstration of cracking performance improvement. The first row is the POD of PTZD, and the second row is the performance of optimal crack recognition workflow. (a–c) Discontinuous and blurred boundary cracks; (d,e). Cracks under complicated pavement textures; (f,g) Repaired cracks; (h) Ordinary cracks; (i,j) Ordinary blurred cracks.
4.5.4. Comparison with Existing Methods
To validate the effectiveness of the proposed method under an optimal workflow, we performed an ablation study and compared it with the self-attention-based crack recognition method [33] and the crack pre-processing method combining HE with CLAHE [29], as shown in Table 4. The experimental results revealed that the CEFR-based pre-processing method significantly outperformed existing approaches in crack recognition performance. The training and validation curves for the experiments are shown in Figure 16.
Table 4.
Comparison of test results with other studies of crack recognition. Yao’s method [33], Liu’s method [29].
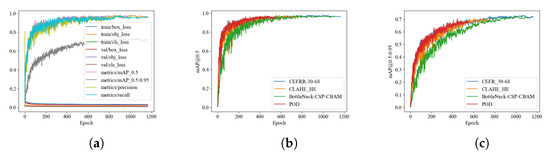
Figure 16.
Experiment results curves. (a) Training and validation curves of optimal workflow. (b,c) Comparison of mAP@0.5 and mAP@0.5:0.95 curves for optimal workflow, two advanced crack identification methods, and POD.
4.5.5. Generalisability of CEFR to Other Object Recognition Models, Datasets, and Tasks
To verify the superiority and generality of CEFR across various object recognition models, datasets, and tasks, we conducted additional experiments on 1. different object recognition models, 2. different datasets, and 3. other tasks (e.g., segmentation).
We trained RT-DETR, YOLOv8, and YOLOv5-DySnake on the PTZD dataset. Crack recognition performance improved across all models, with significant gains in mAP@0.5 and mAP@0.5:0.95, while the F1 score remained stable, indicating robust generalisability. Table 5 presents the results.
Table 5.
Performance of generalizability in other object recognition models and datasets. All models are deployed with official default configuration.
We trained YOLOv5 on the CrackF dataset. CEFR consistently enhanced crack recognition, improving all performance metrics. Table 5 presents the results.
To evaluate CEFR’s effectiveness in segmentation, we trained U-Net and DeepLabV3+ using the Crack500 dataset. We applied CEFR pre-processing to PTZD dataset images before segmentation (Figure 17). CEFR enhanced contrast, reducing feature discrepancies across datasets. As Crack500 and PTZD were acquired in different scenarios, models trained on Crack500 struggled on PTZD. However, CEFR-pre-processed PTZD images were successfully segmented, demonstrating its effectiveness. U-Net performance improved as CEFR made crack features more distinguishable (Figure 17b,e). DeepLabV3+ achieved finer segmentation, as CEFR enhanced crack–edge contrast, increasing segmentation accuracy (Figure 17c,f).
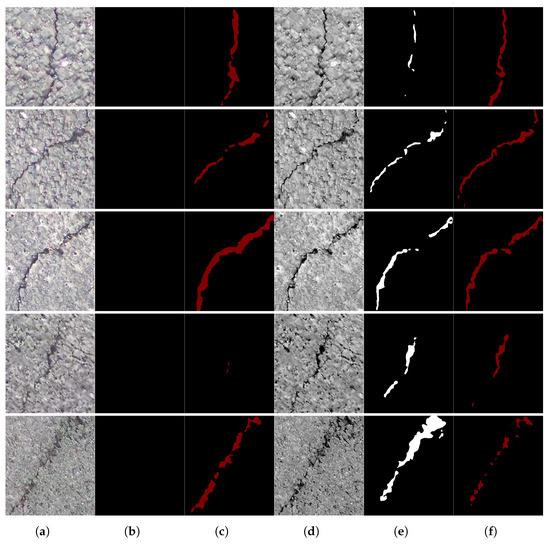
Figure 17.
Performance of the crack segmentation test in PTZD with the best weights of Unet and DeepLabV3+ trained in dataset Crack500. Columns (b,c) show the crack segmentation result of images without CEFR; and columns (d,e) show the crack segmentation result of images processed by CEFR. (a) Pic(W/O(CEFR)). (b) Unet. (c) DeepLabV3+. (d) Pic(W(CEFR)). (e) Unet. (f) DeepLabV3+.
From Table 5, we can conclude that CEFR effectively improves crack recognition across different models and datasets. For all tested models, CEFR-pre-processed datasets consistently improved crack detection performance. On the CrackF dataset, CEFR demonstrated strong practical applicability, significantly enhancing all performance metrics. For segmentation, CEFR successfully compensated for feature variations across datasets, enabling more accurate crack segmentation. Thus, CEFR is a powerful, generalizable tool for both object detection and segmentation tasks, significantly improving crack recognition accuracy and reliability.
5. Discussion
5.1. Contributions of the Paper
This paper proposes a robust and effective method for the reconstruction of crack features on highways. The practical significance and experimental results of CEFR are discussed herein.
For fixed PTZ-based expressway crack images, conventional methods have notable limitations: Threshold segmentation methods cannot handle cracks in complex textures. Histogram equalization enlarges background texture shadows, deteriorating image quality. Transform domain-based decomposition–reconstruction fails to distinguish between crack features and background textures, enhancing both simultaneously, thus leading to poor image readability.
In contrast, CEFR focuses on reconstructing cracks and their edges, ensuring robust, clear, and distinguishable features, suppressing overexposure and blurriness, mitigating complex background textures, and preserving background morphology while maintaining image readability, which is crucial for subsequent crack localization and repair. Additionally, CEFR requires minimal computational effort. With an Intel i5-11400, it takes only 0.03 s to process a image in Matlab 2019. The crack recognition performance significantly improved across various parameter selections, as validated on public datasets. This indicates that CEFR is not constrained by strict parameter tuning, rendering it a versatile and effective approach.
Effective expressway crack recognition is a crucial aspect of intelligent transportation systems. CEFR enhances the feasibility of automated highway inspection, paving the way for more efficient and intelligent infrastructure monitoring.
5.2. Limitations and Future Research
Despite its effectiveness, some limitations remain, requiring further optimization:
- Ground Truth Misalignment: In our experiments, labels were based on the original images and applied to both original and CEFR-enhanced images to maintain consistency. However, CEFR enhancement can reveal previously unclear cracks, causing bounding box coordinates to deviate from the ground truth. This may lead to higher leakage rates or reduced confidence levels in the enhanced dataset.
- Diverse Road Conditions and Scenarios: Expressway crack recognition involves various scenarios and complex operating conditions. A large-scale dataset with diverse crack samples is needed to enhance dataset completeness and improve the robustness of neural network prediction weights.
Future research should address these challenges by exploring adaptive labeling techniques to accommodate CEFR-enhanced images, expanding the dataset to cover a wider range of crack patterns and road conditions, and investigating real-time deployment strategies for CEFR-based highway monitoring.
6. Conclusions
We presented an effective approach for reconstructing crack images captured by fixed PTZ cameras, ensuring highly contrasting and distinct features. Our method enhances the crack region while retaining the background details, resulting in uniform feature patterns within cracks, a distinct crack boundary, and the reconstruction of highly readable images with improved quality. Through extensive experiments, we demonstrated that our approach:
- Effectively enhances crack images and improves expressway crack recognition performance under fixed-PTZ vision.
- Shows strong generalizability across different datasets and object detection models.
- Works effectively in crack segmentation tasks, further proving CEFR versatility.
- CEFR image pre-processing has less computational cost.
The above findings highlight CEFR’s potential for large-scale expressway pavement health monitoring using fixed PTZ cameras. In long-period pavement health monitoring, fixed PTZ cameras can observe the complete process of crack evolution, which is conducive to summarizing the laws, making protection plans for key and vulnerable sections in advance, and enhancing the service life of the road. On the other hand, the real-time pavement information obtained by fixed PTZ can provide data support for building intelligent transportation, contributing to the advancement of intelligent transportation infrastructure.
Author Contributions
Conceptualization, X.F. and C.S.; Methodology, X.F. and C.S.; Validation, X.F.; Formal analysis, X.F.; Resources, C.S.; Writing—original draft, X.F.; Writing—review & editing, X.F. and C.S.; Visualization, X.F.; Project administration, C.S.; Funding acquisition, C.S. All authors have read and agreed to the published version of the manuscript.
Funding
This research was funded by Hainan Provincial Natural Science Foundation of China No. 624RC480, and Scientific Research Foundation for Hainan University No. KYQD(ZR)-21013. The APC was funded by No. 624RC480.
Data Availability Statement
The raw data supporting the conclusions of this article will be made available by the authors on request.
Conflicts of Interest
The funders had no role in the design of the study; in the collection, analyses, or interpretation of data; in the writing of the manuscript, or in the decision to publish the results.
References
- mot.gov. Give Full Play to the Key Role of Investment to Promote the Overall Improvement of Economic Performance. 2023. Available online: https://www.mot.gov.cn/jiaotongyaowen/202303/t20230306_3769450.html (accessed on 6 March 2023).
- Obunguta, F.; Matsushima, K.; Susaki, J. Probabilistic management of pavement defects with image processing techniques. J. Civ. Eng. Manag. 2024, 30, 114–132. [Google Scholar] [CrossRef]
- Chun, P.-J.; Yamane, T.; Tsuzuki, Y. Automatic detection of cracks in asphalt pavement using deep learning to overcome weaknesses in images and GIS visualization. Appl. Sci. 2021, 11, 892. [Google Scholar] [CrossRef]
- Luo, W.; Liu, L.; Li, L. Measuring rutting dimension and lateral position using 3D line scanning laser and inertial measuring unit. Autom. Constr. 2020, 111, 103056. [Google Scholar] [CrossRef]
- Li, Y.; Liu, C.; Yue, G.; Gao, Q.; Du, Y. Deep learning-based pavement subsurface distress detection via ground penetrating radar data. Autom. Constr. 2022, 142, 104516. [Google Scholar] [CrossRef]
- Zhang, L.; Xu, W.; Zhu, L.; Yuan, X.; Zhang, C. Study on pavement defect detection based on image processing utilizing UAV. J. Phys. Conf. Ser. 2019, 1168, 042011. [Google Scholar] [CrossRef]
- Zhu, J.; Zhong, J.; Ma, T.; Huang, X.; Zhang, W.; Zhou, Y. Pavement distress detection using convolutional neural networks with images captured via UAV. Autom. Constr. 2022, 133, 103991. [Google Scholar] [CrossRef]
- Li, Y.; Ma, J.; Zhao, Z.; Shi, G. A Novel Approach for UAV Image Crack Detection. Sensors 2022, 22, 3305. [Google Scholar] [CrossRef]
- Shao, C.; Feng, X.; Li, J. Crack Detection and Measurement Using PTZ Camera–Based Image Processing Method on Expressways. J. Transp. Eng. Part B Pavements 2022, 148, 04022043. [Google Scholar] [CrossRef]
- Otsu, N. A threshold selection method from gray-level histograms. IEEE Trans. Syst. Man Cybern. 1979, 9, 62–66. [Google Scholar] [CrossRef]
- Quan, Y.; Sun, J.; Zhang, Y.; Zhang, H. The method of the road surface crack detection by the improved Otsu threshold. In Proceedings of the 2019 IEEE International Conference on Mechatronics and Automation (ICMA), Tianjin, China, 4–7 August 2019; IEEE: Piscataway, NJ, USA, 2019; pp. 1615–1620. [Google Scholar]
- Oliveira, H.; Correia, P.L. Automatic road crack segmentation using entropy and image dynamic thresholding. In Proceedings of the 2009 17th European Signal Processing Conference, Glasgow, UK, 24–28 August 2009; pp. 622–626. [Google Scholar]
- Chen, C.; Seo, H.; Jun, C.; Zhao, Y. A potential crack region method to detect crack using image processing of multiple thresholding. Signal Image Video Process. 2022, 16, 1673–1681. [Google Scholar] [CrossRef]
- Wang, S.; Tang, W. Pavement crack segmentation algorithm based on local optimal threshold of cracks density distribution. In Proceedings of the Advanced Intelligent Computing: 7th International Conference, ICIC 2011, Zhengzhou, China, 11–14 August 2011; Revised Selected Papers 7. Springer: Berlin/Heidelberg, Germany, 2012; pp. 298–302. [Google Scholar]
- Akagic, A.; Buza, E.; Omanovic, S.; Karabegovic, A. Pavement crack detection using Otsu thresholding for image segmentation. In Proceedings of the 2018 41st International Convention on Information and Communication Technology, Electronics and Microelectronics (MIPRO), Opatija, Croatia, 21–25 May 2018; IEEE: Piscataway, NJ, USA, 2018; pp. 1092–1097. [Google Scholar]
- Safaei, N.; Smadi, O.; Safaei, B.; Masoud, A. Efficient road crack detection based on an adaptive pixel-level segmentation algorithm. Transp. Res. Rec. 2021, 2675, 370–381. [Google Scholar] [CrossRef]
- Peng, L.; Chao, W.; Shuangmiao, L.; Baocai, F. Research on Crack Detection Method of Airport Runway Based on Twice-Threshold Segmentation. In Proceedings of the 2015 Fifth International Conference on Instrumentation and Measurement, Computer, Communication and Control (IMCCC), Qinhuangdao, China, 18–20 September 2015; pp. 1716–1720. [Google Scholar] [CrossRef]
- Ma, C.; Wang, W.; Zhao, C.; Di, F.; Zhu, Z. Pavement Cracks Detection Based on FDWT. In Proceedings of the 2009 International Conference on Computational Intelligence and Software Engineering, Wuhan, China, 11–13 December 2009; pp. 1–4. [Google Scholar] [CrossRef]
- Ying, L.; Salari, E. Beamlet transform-based technique for pavement crack detection and classification. Comput.-Aided Civ. Infrastruct. Eng. 2010, 25, 572–580. [Google Scholar] [CrossRef]
- Sun, L.; Qian, Z. Multi-scale wavelet transform filtering of non-uniform pavement surface image background for automated pavement distress identification. Measurement 2016, 86, 26–40. [Google Scholar] [CrossRef]
- Hamici, Z.; Obaidat, T.I.A.S. Pavement Images Denoising with Cracks Detection and Classification Using 2D Discrete Wavelet Transform and Savitzky-Golay Filters. In Proceedings of the 2019 IEEE International Conference on Signal and Image Processing Applications (ICSIPA), Kuala Lumpur, Malaysia, 17–19 September 2019; IEEE: Piscataway, NJ, USA, 2019; pp. 100–105. [Google Scholar]
- Matarneh, S.; Elghaish, F.; Al-Ghraibah, A.; Abdellatef, E.; Edwards, D.J. An automatic image processing based on Hough transform algorithm for pavement crack detection and classification. Smart Sustain. Built Environ. 2025, 14, 1–22. [Google Scholar] [CrossRef]
- Li, S.; Cao, Y.; Cai, H. Automatic pavement-crack detection and segmentation based on steerable matched filtering and an active contour model. J. Comput. Civ. Eng. 2017, 31, 04017045. [Google Scholar] [CrossRef]
- Liang, J.; Gu, X.; Chen, Y. Fast and robust pavement crack distress segmentation utilizing steerable filtering and local order energy. Constr. Build. Mater. 2020, 262, 120084. [Google Scholar] [CrossRef]
- Wang, W.; Li, H.; Wang, K.; He, C.; Bai, M. Pavement crack detection on geodesic shadow removal with local oriented filter on LOF and improved Level set. Constr. Build. Mater. 2020, 237, 117750. [Google Scholar] [CrossRef]
- Sun, M.; Zhao, H.; Li, J. Road crack detection network under noise based on feature pyramid structure with feature enhancement (road crack detection under noise). IET Image Process. 2022, 16, 809–822. [Google Scholar] [CrossRef]
- Sun, L.; Kamaliardakani, M.; Zhang, Y. Weighted neighborhood pixels segmentation method for automated detection of cracks on pavement surface images. J. Comput. Civ. Eng. 2016, 30, 04015021. [Google Scholar] [CrossRef]
- Ullah, A.; Sun, Z.; Elahi, H.; Afzal, F.; Khatoon, A.; Sayed, N.; Ahmad, I. Experimental and Numerical Research of Paved Microcrack Using Histogram Equalization for Detection and Segmentation. Math. Probl. Eng. 2022, 2022, 684983. [Google Scholar] [CrossRef]
- Liu, J.; Zhao, Z.; Lv, C.; Ding, Y.; Chang, H.; Xie, Q. An image enhancement algorithm to improve road tunnel crack transfer detection. Constr. Build. Mater. 2022, 348, 128583. [Google Scholar] [CrossRef]
- Qu, Z.; Cao, C.; Liu, L.; Zhou, D.Y. A deeply supervised convolutional neural network for pavement crack detection with multiscale feature fusion. IEEE Trans. Neural Netw. Learn. Syst. 2021, 33, 4890–4899. [Google Scholar] [CrossRef]
- Li, B.L.; Qi, Y.; Fan, J.S.; Liu, Y.F.; Liu, C. A grid-based classification and box-based detection fusion model for asphalt pavement crack. Comput.-Aided Civ. Infrastruct. Eng. 2023, 38, 2279–2299. [Google Scholar] [CrossRef]
- Qi, Y.; He, Y.; Qi, X.; Zhang, Y.; Yang, G. Dynamic snake convolution based on topological geometric constraints for tubular structure segmentation. In Proceedings of the IEEE/CVF International Conference on Computer Vision, Paris, France, 1–6 October 2023; pp. 6070–6079. [Google Scholar]
- Yao, H.; Liu, Y.; Li, X.; You, Z.; Feng, Y.; Lu, W. A detection method for pavement cracks combining object detection and attention mechanism. IEEE Trans. Intell. Transp. Syst. 2022, 23, 22179–22189. [Google Scholar] [CrossRef]
- Ranyal, E.; Sadhu, A.; Jain, K. Enhancing pavement health assessment: An attention-based approach for accurate crack detection, measurement, and mapping. Expert Syst. Appl. 2024, 247, 123314. [Google Scholar] [CrossRef]
- Xiang, X.; Wang, Z.; Qiao, Y. An improved YOLOv5 crack detection method combined with transformer. IEEE Sens. J. 2022, 22, 14328–14335. [Google Scholar] [CrossRef]
- Zhu, G.; Liu, J.; Fan, Z.; Yuan, D.; Ma, P.; Wang, M.; Sheng, W.; Wang, K.C. A lightweight encoder–decoder network for automatic pavement crack detection. Comput.-Aided Civ. Infrastruct. Eng. 2024, 39, 1743–1765. [Google Scholar] [CrossRef]
- Huyan, J.; Li, W.; Tighe, S.; Zhai, J.; Xu, Z.; Chen, Y. Detection of sealed and unsealed cracks with complex backgrounds using deep convolutional neural network. Autom. Constr. 2019, 107, 102946. [Google Scholar] [CrossRef]
- Huang, Z.; Kang, W.; Wu, Q.; Chen, X. A new descriptor resistant to affine transformation and monotonic intensity change. Comput. Vis. Image Underst. 2014, 120, 117–125. [Google Scholar] [CrossRef]
- Shao, C.; Ding, Q.; Luo, H.; Chang, Z.; Zhang, C.; Zheng, T. Step-by-step pipeline processing approach for line segment detection. IET Image Process. 2017, 11, 416–424. [Google Scholar] [CrossRef]
- Shao, C.; Zhang, L.; Pan, W. PTZ camera-based image processing for automatic crack size measurement in expressways. IEEE Sens. J. 2021, 21, 23352–23361. [Google Scholar] [CrossRef]
- Redmon, J.; Divvala, S.; Girshick, R.; Farhadi, A. You only look once: Unified, real-time object detection. In Proceedings of the IEEE Conference on Computer Vision and Pattern Recognition, Las Vegas, NV, USA, 27–30 June 2016; pp. 779–788. [Google Scholar]
- He, K.; Zhang, X.; Ren, S.; Sun, J. Deep residual learning for image recognition. In Proceedings of the IEEE Conference on Computer Vision and Pattern Recognition, Las Vegas, NV, USA, 27–30 June 2016; pp. 770–778. [Google Scholar]
Disclaimer/Publisher’s Note: The statements, opinions and data contained in all publications are solely those of the individual author(s) and contributor(s) and not of MDPI and/or the editor(s). MDPI and/or the editor(s) disclaim responsibility for any injury to people or property resulting from any ideas, methods, instructions or products referred to in the content. |
© 2025 by the authors. Licensee MDPI, Basel, Switzerland. This article is an open access article distributed under the terms and conditions of the Creative Commons Attribution (CC BY) license (https://creativecommons.org/licenses/by/4.0/).