Article

Mechatronic Anticollision System for Electric Wheelchairs Based on a Time-of-Flight Sensor

by
Wiesław Szaj
1,*,
Michał Wanic
1,
Wiktoria Wojnarowska
1 and
Sławomir Miechowicz
2
1
Department of Physics and Medical Engineering, Faculty of Mathematics and Applied Physics, Rzeszow University of Technology, Powstańców Warszawy 6, 35-959 Rzeszow, Poland
2
Department of Mechanical Engineering, The Faculty of Mechanical Engineering and Aeronautics, Rzeszow University of Technology, Powstańców Warszawy 8, 35-959 Rzeszow, Poland
*
Author to whom correspondence should be addressed.
Electronics 2025, 14(11), 2307; https://doi.org/10.3390/electronics14112307
Submission received: 16 April 2025 / Revised: 16 May 2025 / Accepted: 3 June 2025 / Published: 5 June 2025

Abstract

Electric wheelchairs significantly enhance mobility for individuals with disabilities, but navigating confined or crowded spaces remains a challenge. This paper presents a mechatronic anticollision system based on Time-of-Flight (ToF) sensors designed to improve wheelchair navigation in such environments. The system performs eight-plane 3D environmental scans in 214–358 ms, with a vertical field of view of 12.4° and a detection range of up to 4 m—sufficient for effective obstacle avoidance. Unlike existing solutions like the YDLIDAR T-mini Plus, which has a narrow vertical field of view and a longer detection range that may be excessive for indoor spaces, or the xLIDAR, which struggles with shorter detection ranges, our system balances an optimal detection range and vertical scanning area, making it especially suitable for wheelchair users. Preliminary tests confirm that our system achieves high accuracy, with a standard deviation as low as 0.003 m and a maximum deviation below 0.05 m at a 3-m range on high-reflectivity surfaces (e.g., white and light brown). Our solution offers low power consumption (140 mA) and USB communication, making it an energy-efficient and easy-to-integrate solution for electric wheelchairs. Future work will focus on enhancing angular precision and robustness for dynamic, real-world environments.

1. Introduction

According to the 2022 disability report commissioned by the World Health Organization (WHO), approximately 1.3 billion people, or about 16% of the global population, experience some form of disability. In the past decade, the number of people living with disabilities has increased by more than 270 million, a trend largely attributed to demographic and epidemiological changes, including the aging population in various countries [1]. Among those with disabilities, an estimated 65 million people worldwide rely on wheelchairs for mobility [2]. Given the growing demand for assistive mobility solutions, there is a critical need to advance wheelchair technology to better support the daily activities and autonomy of this population [3].
Although electric wheelchairs have significantly improved independence for people with mobility impairments, navigating in confined or crowded spaces presents unique challenges [3]. The risk of collisions with obstacles or pedestrians is a persistent concern, which can cause injuries and damage to the wheelchair and surrounding objects. This highlights the urgent need for advanced safety measures that can help users avoid collisions, thus reducing risks and improving mobility.
In recent years, research in the field of electric wheelchairs has made significant strides in improving user safety and independence [3]. A particularly crucial area of focus is the development of anticollision systems, which are essential for enhancing the experience of users, especially those with cognitive impairments or limited mobility. These systems employ various technologies to detect obstacles and prevent collisions, ultimately improving the overall user experience and autonomy of powered wheelchairs [4]. A significant emphasis in anticollision research involves the integration of advanced sensor technologies, which play a vital role in ensuring effective obstacle detection and avoidance.
The literature describes a variety of sensor technologies used in anticollision systems for electric wheelchairs. Commonly used sensors include LiDAR (Light Detection and Ranging), ultrasonic sensors, cameras, and vision sensors [3,5]. Table 1 highlights the key characteristics of such sensors.
Ultrasonic sensors emit sound waves and measure the time it takes them to return after jumping off obstacles. These sensors offer straightforward implementation and low cost; however, their limitations in accuracy and range can pose challenges in more complex environments. For example, ultrasonic sensors were utilized in a project by Rojas et al. [7], who combined these sensors with fuzzy logic to help wheelchair users navigate more easily and safely. Similarly, Luo [20] employed ultrasonic sensors to enhance anticollision systems, as did Derasari and Sasikumar [21]. Meanwhile, Njah [22] designed a smart wheelchair capable of detecting obstacles and navigating using both ultrasonic and infrared (IR) sensors. Furthermore, Safy et al. [23] discussed the integration of ultrasonic sensors in a smart wheelchair designed to support paraplegic patients, highlighting their role in maintaining a safe distance from obstacles, thus enhancing user safety and mobility. Ultrasonic sensors are commonly used for proximity detection and obstacle detection at close ranges [9]. However, their limitations in accuracy and detection range, particularly in more complex environments, have encouraged researchers to explore some alternatives. Among these, LiDAR sensors, which use laser light to create detailed and accurate maps of the environment, allowing for efficient obstacle detection, are particularly notable [15]. LiDAR offers high accuracy and effective obstacle identification over significant distances, although its cost and complexity present potential drawbacks.
LiDAR sensors have shown significant potential for obstacle perception and mapping in wheelchairs. They outperform ultrasonic sensors in terms of obstacle detection accuracy, making it a superior choice for service operations involving human interaction [5]. For example, Pacini [24] discussed the integration of LiDAR as a critical sensor, highlighting its role in detecting obstacles and assisting in navigation decisions. When combining LiDAR data with user input from a joystick, the system calculates optimal movement parameters to avoid collisions while following user commands, thus improving both safety and usability in dynamic environments. Moreover, Labbé and Michaud [25] created a LiDAR-based navigation system that integrated simultaneous localization and mapping (SLAM) methods. The system enabled the wheelchair to generate a real-time map of its surroundings and operate independently, facilitating effective obstacle avoidance. Even the authors of this work, in their previous research, have presented a mechatronic anticollision system that employs 2D LiDAR laser scanning to detect obstacles in real time, allowing for safe navigation in narrow spaces [16]. This approach not only enhances safety but also increases user independence by allowing users to navigate complex environments without constant assistance. Despite its advantages, the proposed solution has some limitations. Specifically, the system has large dimensions, is costly, and requires significant energy to operate, which aligns with the known drawbacks of 2D LiDAR, such as its high cost and system complexity. These limitations highlight the need for a more compact, cost-effective, and energy-efficient solution.
In light of these limitations, this study proposes a new solution to address the identified issues. The authors have decided to replace the 2D LiDAR with a Time-of-Flight (ToF) sensor. ToF sensors work by emitting a light signal, typically IR, and measuring the time it takes for the signal to reflect back after hitting an obstacle, allowing for accurate distance measurement [26]. Despite their limitations, such as sensitivity to environmental conditions like interference from sunlight or reflective surfaces [27], the ToF sensor has recently gained significant attention in research, particularly in applications for collision avoidance systems [28,29,30]. This may be due to its compact, cost-effective, and energy-efficient nature. Moreover, the ToF sensor was considered for a driving assistance system by Mihailidis et al. [31]. The researchers presented an early version of such a system and demonstrated the applicability of the ToF camera in a light-controlled indoor setting with various types of obstacles.
Both commercial and DIY solutions are available on the market for ToF-based sensing. Commercial systems, such as YDLIDAR [32], and DIY alternatives [33] offer various capabilities. However, these devices are not suitable for navigation and obstacle avoidance in wheelchairs. For instance, the YDLIDAR system does not detect objects located below or above the scanning plane, which can be a critical limitation for wheelchair users.
Due to the lack of suitable market solutions, it is necessary to develop a custom system that is both cost-effective and capable of detecting obstacles at various heights. An electric wheelchair presents unique challenges—it moves relatively slowly, and its users often have limited ability to precisely control the device and observe their surroundings. Navigating near obstacles, particularly in confined spaces, is especially difficult. Obstacles may appear at different heights, making it crucial to monitor the immediate surroundings across a wide range or focus attention on the direction of movement. Developing a custom solution and replacing the LiDAR sensor used in [16] should maintain high detection accuracy while improving the system’s practicality, cost-efficiency, and energy efficiency, ultimately ensuring safe and independent navigation in complex real-world environments.

2. Materials and Methods

2.1. Description of the Sensor

Our research focuses on the development of a ToF-based scanning system designed to map the environment surrounding wheelchair users. This system relies on the fundamental principle of measuring the time it takes for emitted light to travel to an object and reflect back to the sensor. The distance d is calculated using the following equation:
d = c · Δ T 2
where c represents the speed of light and Δ T denotes the time elapsed between light emission by the laser diode and its return to the sensor after reflection from an obstacle. However, directly measuring the flight time for numerous pixels within the sensor matrix presents a challenge because of its structure. An alternative approach involves measuring the phase shift of the modulated light emitted by the laser diode and reflected from the object [34]. This method allows for distance calculation based on the phase shift ( Δ φ ) and modulation frequency ( f m ):
d = c · Δ φ 4 · π · f m
The system utilizes a Time-of-Flight sensor, AFBR-S50MV85I (Broadcom Inc., San Jose, CA, USA), emitting laser light with a wavelength of 850 nm and an emission angle of 13° vertically and 6° horizontally. The reflection of light from the object is received by a matrix composed of 32 pixels arranged in four columns of 8 pixels, forming a hexagonal pattern with a size of 150 μm per pixel. The arrangement of these pixel columns, offset relative to each other (see sensor matrix on Figure 1), ensures spatial efficiency and uniform measurements while minimizing image artifacts. The field of view (FOV) of the matrix is 12.4° vertically and 5.4° horizontally. The key technical data for the sensor used are presented in Table 2.
The scanning area of a single scan depends on its distance from the sensor and the field of view for each axis, denoted h i (where i = v for the vertical axis or i = h for the horizontal axis). This relationship is described by the following equation:
h i = 2 · d · tan β i 2
where β i is the angle of view along the respective axis i. For this sensor, the angular FOV values are β v = 12.4 ° for the vertical axis and β h = 5.4 ° for the horizontal axis. The vertical visibility is 1.1 m at a distance of 5 m. The vertical and horizontal fields of view, as well as the scanning area, for various distances are presented in Table 3. Figure 1 illustrates the scanning area for a single measurement.
The visibility of approximately 1.1 m at a distance of 5 m covers a substantial portion of the height of an individual seated in a wheelchair. In the current version of the device, this has been deemed sufficient to validate the concept of using a Time-of-Flight sensor to create an environmental map. Further research should focus on achieving full height coverage, particularly addressing critical height points that should be measured directly even at short distances. This could be accomplished by mounting an additional sensor below the base sensor. Horizontal scan area visibility has been increased by the implementation of a sensor mounted on a rotating shaft. The obstruction of the scanning area by the wheelchair and the individual has been eliminated by mounting an additional sensor diagonally across the wheelchair.

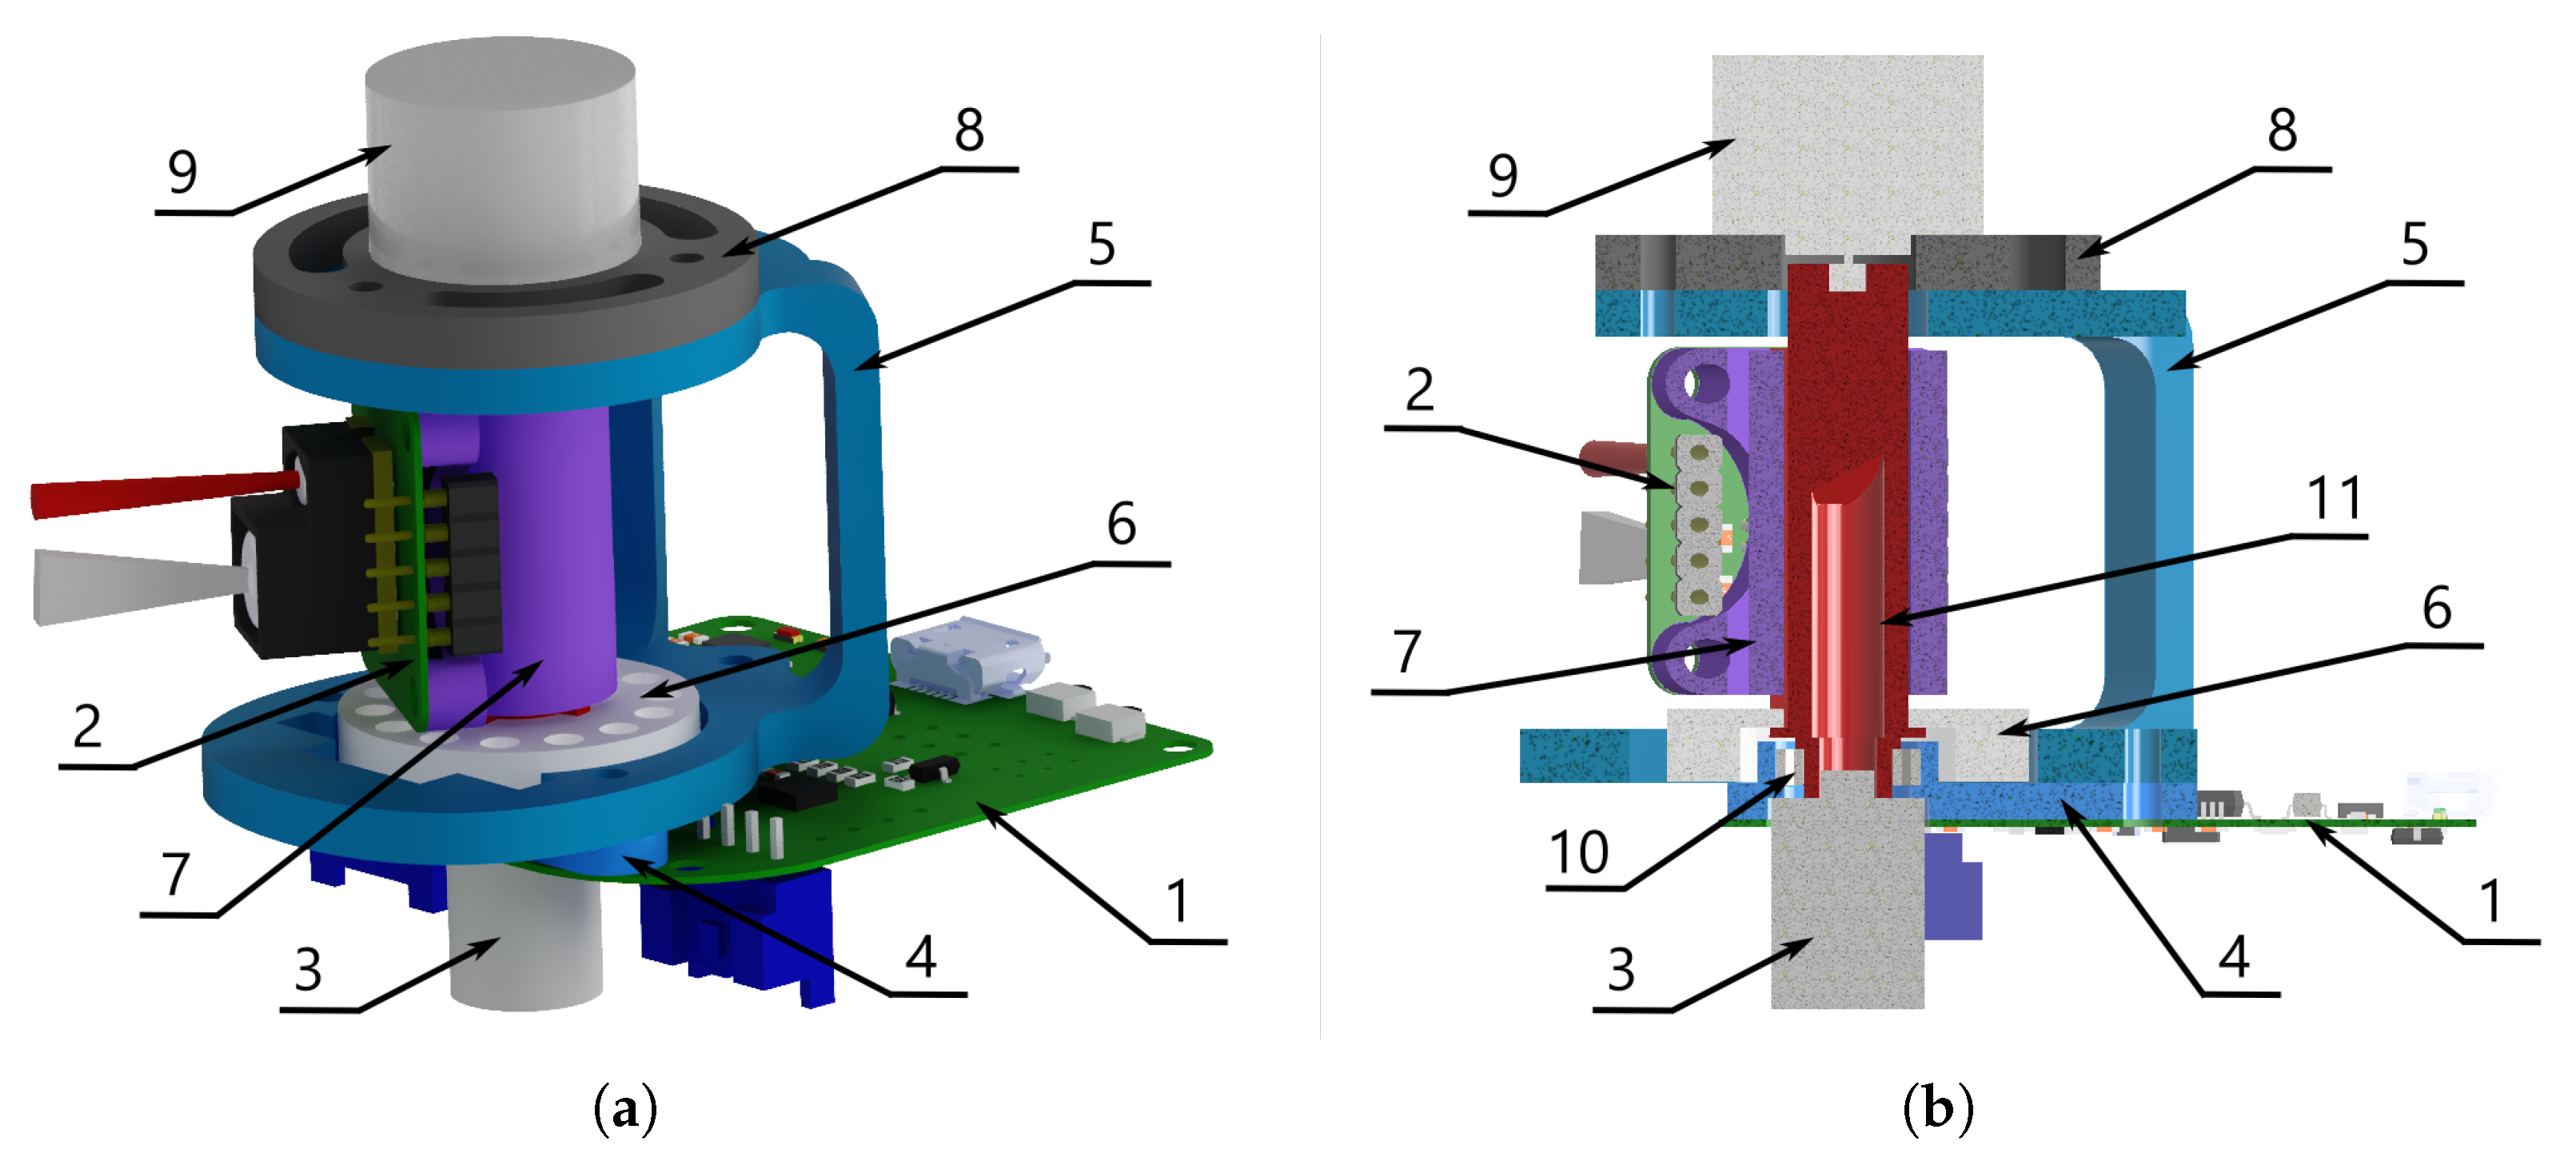
2.2. Design and Manufacturing

The designed device consists of several main components (Figure 2): a dedicated Printed Circuit Board (PCB) for electronic components and serving as a structural base, hereinafter referred to as the main board (Figure 2(1)); a dedicated PCB for the ToF sensor (Figure 2(2)); a slip ring (Figure 2(3)) enabling smooth communication between the stationary and rotating parts of the device; a mounting plate (Figure 2(4)) that secures the slip ring to the main board; a frame (Figure 2(5)) that forms the base for the moving part of the device; an encoder disc (Figure 2(6)) with embedded magnets, allowing for the determination of the position of the ToF sensor; the ToF mounting (Figure 2(7)), which serves as a base for mounting the ToF sensor; a stepper motor mounting element (Figure 2(8)), which allows for axial placement of the motor on the frame; the stepper motor (Figure 2(9)), which is responsible for rotating the ToF sensor; a bearing (Figure 2(10)), which allows for smooth rotary motion and defines a common axis with the stepper motor; and a shaft (Figure 2(11)) mounted on the stepper motor and bearing, which allows for the mounting of the ToF mounting, and due to its internal channel, safely routes the wires during device rotation.
Due to the low mass of the sensor and consequently the small inertia of the system, the selection of the stepper motor is not critical. A motor with an output torque (pull-out torque) of 980 μNm at a Slewing Frequency of 1200 PPS was used. The required rotation angle of the sensor comes from its configuration and the characteristics of the chosen stepper motor. The horizontal measurement angle of the sensor, a value of 5.4°, determines the maximum achievable position change that ensures coverage of the measured range. The stepper motor performs a 18° rotation during one step; therefore, a microstepping operation of 1/16 was implemented, resulting in a resolution of 1.125°/step. Taking these factors into account, a constant rotation angle of 5.625° (5 microsteps) was adopted. The placement of the encoder on the shaft allows for the determination of the sensor position using Hall sensors located on the main board.
Structural components such as the mounting plate, frame, encoder disc, ToF mounting, stepper motor mounting plate, and shaft were designed for 3D printing. Due to the specific application requirements of each component, different materials were selected. Elements not subjected to significant stress or elevated temperatures, such as the mounting plate, encoder disc, and ToF mounting, were manufactured from PLA (F3D Filament, Kraków, Poland). The frame, which serves as the stable support for the stepper motor, was made of PET-G (F3D Filament, Kraków, Poland). PET-G was selected for this component due to its better thermal resistance compared to PLA. This choice reduces the risk of deformation or softening under the potential heat generated by the motor. To ensure an optimal load distribution and facilitate scanning of at least 270° without structural obstructions, the base of the frame was printed at a 45° angle using organic supports. The stepper motor mounting plate was also made from PET-G (F3D Filament, Kraków, Poland) to mitigate the potential impact of heat accumulation from the motor. Although the exact temperature generated by the motor was not measured, it was anticipated that prolonged operation could lead to elevated temperatures, potentially softening the PLA. PET-G’s higher glass transition temperature ensures long-term structural stability. The shaft was 3D printed using Formlabs Standard Clear Resin (Formlabs Inc., Somerville, MA, USA) via stereolithography (SLA) to achieve a high-precision fit with the stepper motor. The resin material was selected for its ability to produce highly accurate, durable components with tight tolerances. Additionally, the shaft features protruding fins that increase the surface area for transmitting rotational torque to the ToF mounting, ensuring effective operation. The components made from PLA and PET-G were printed on a Prusa MK3S+ (Prusa Research, Prague, Czech Republic), while the resin printing was performed using a Form 2 (Formlabs Inc., Somerville, MA, USA).
The measuring device boasts compact dimensions of 40 mm in width, 50 mm in length, and 58 mm in height, including the stepper motor. Due to this, as well as its low weight of approximately 56 g, it can be mounted in virtually any location on a wheelchair.

2.3. Control System

The heart of the device is the STM32F401RCT6 processor (STMicroelectronics, Geneva, Switzerland), which is housed on a custom-designed PCB (main board). This board is connected via a slip ring and a special 3D-printed structure to the ToF sensor mounted on its dedicated PCB (ToF board). Communication between the sensor and the processor occurs through the Serial Peripheral Interface (SPI) bus. A stepper motor located at the top of the structure provides rotational movement and is controlled by a stepper motor driver via the Microcontroller Unit (MCU). This driver handles the microstepping operation. The speed control and number of steps are implemented using the microcontroller hardware counter. Hall sensors mounted on the main board enable the processor to determine the sensor position. As the sensor rotates, it passes through a zero point, triggering a sequence of signals from the Hall sensors. The processor communicates with a computer or an external device via a USB, which also serves as the power source for the entire system. This eliminates the need for an additional power supply. Due to the shared power supply for the stepper motor and the electrical components, including the Time-of-Flight (ToF) sensor, the PCBs were carefully designed. The power lines were routed independently, utilizing LC filters and linear regulators, and the ground planes were designed to limit the propagation of disturbances. During testing, no negative impact on measurement results was observed when comparing the PCB with the stepper motor to the one without it. A scanner block diagram can be found in Figure 3.
The scanner components were selected to minimize power consumption. The estimated current draw does not exceed 210 mA (sensor 33 mA, microcontroller, and other electronic components approximately 30 mA), with the stepper motor current limited to 100 mA. The microstepping operation results in a variable current value across the motor windings in successive sequences. The maximum value is estimated at 140 mA when both motor windings are supplied at approximately 70% of their rated current. This low power consumption allows the scanner to be powered directly from a USB port.

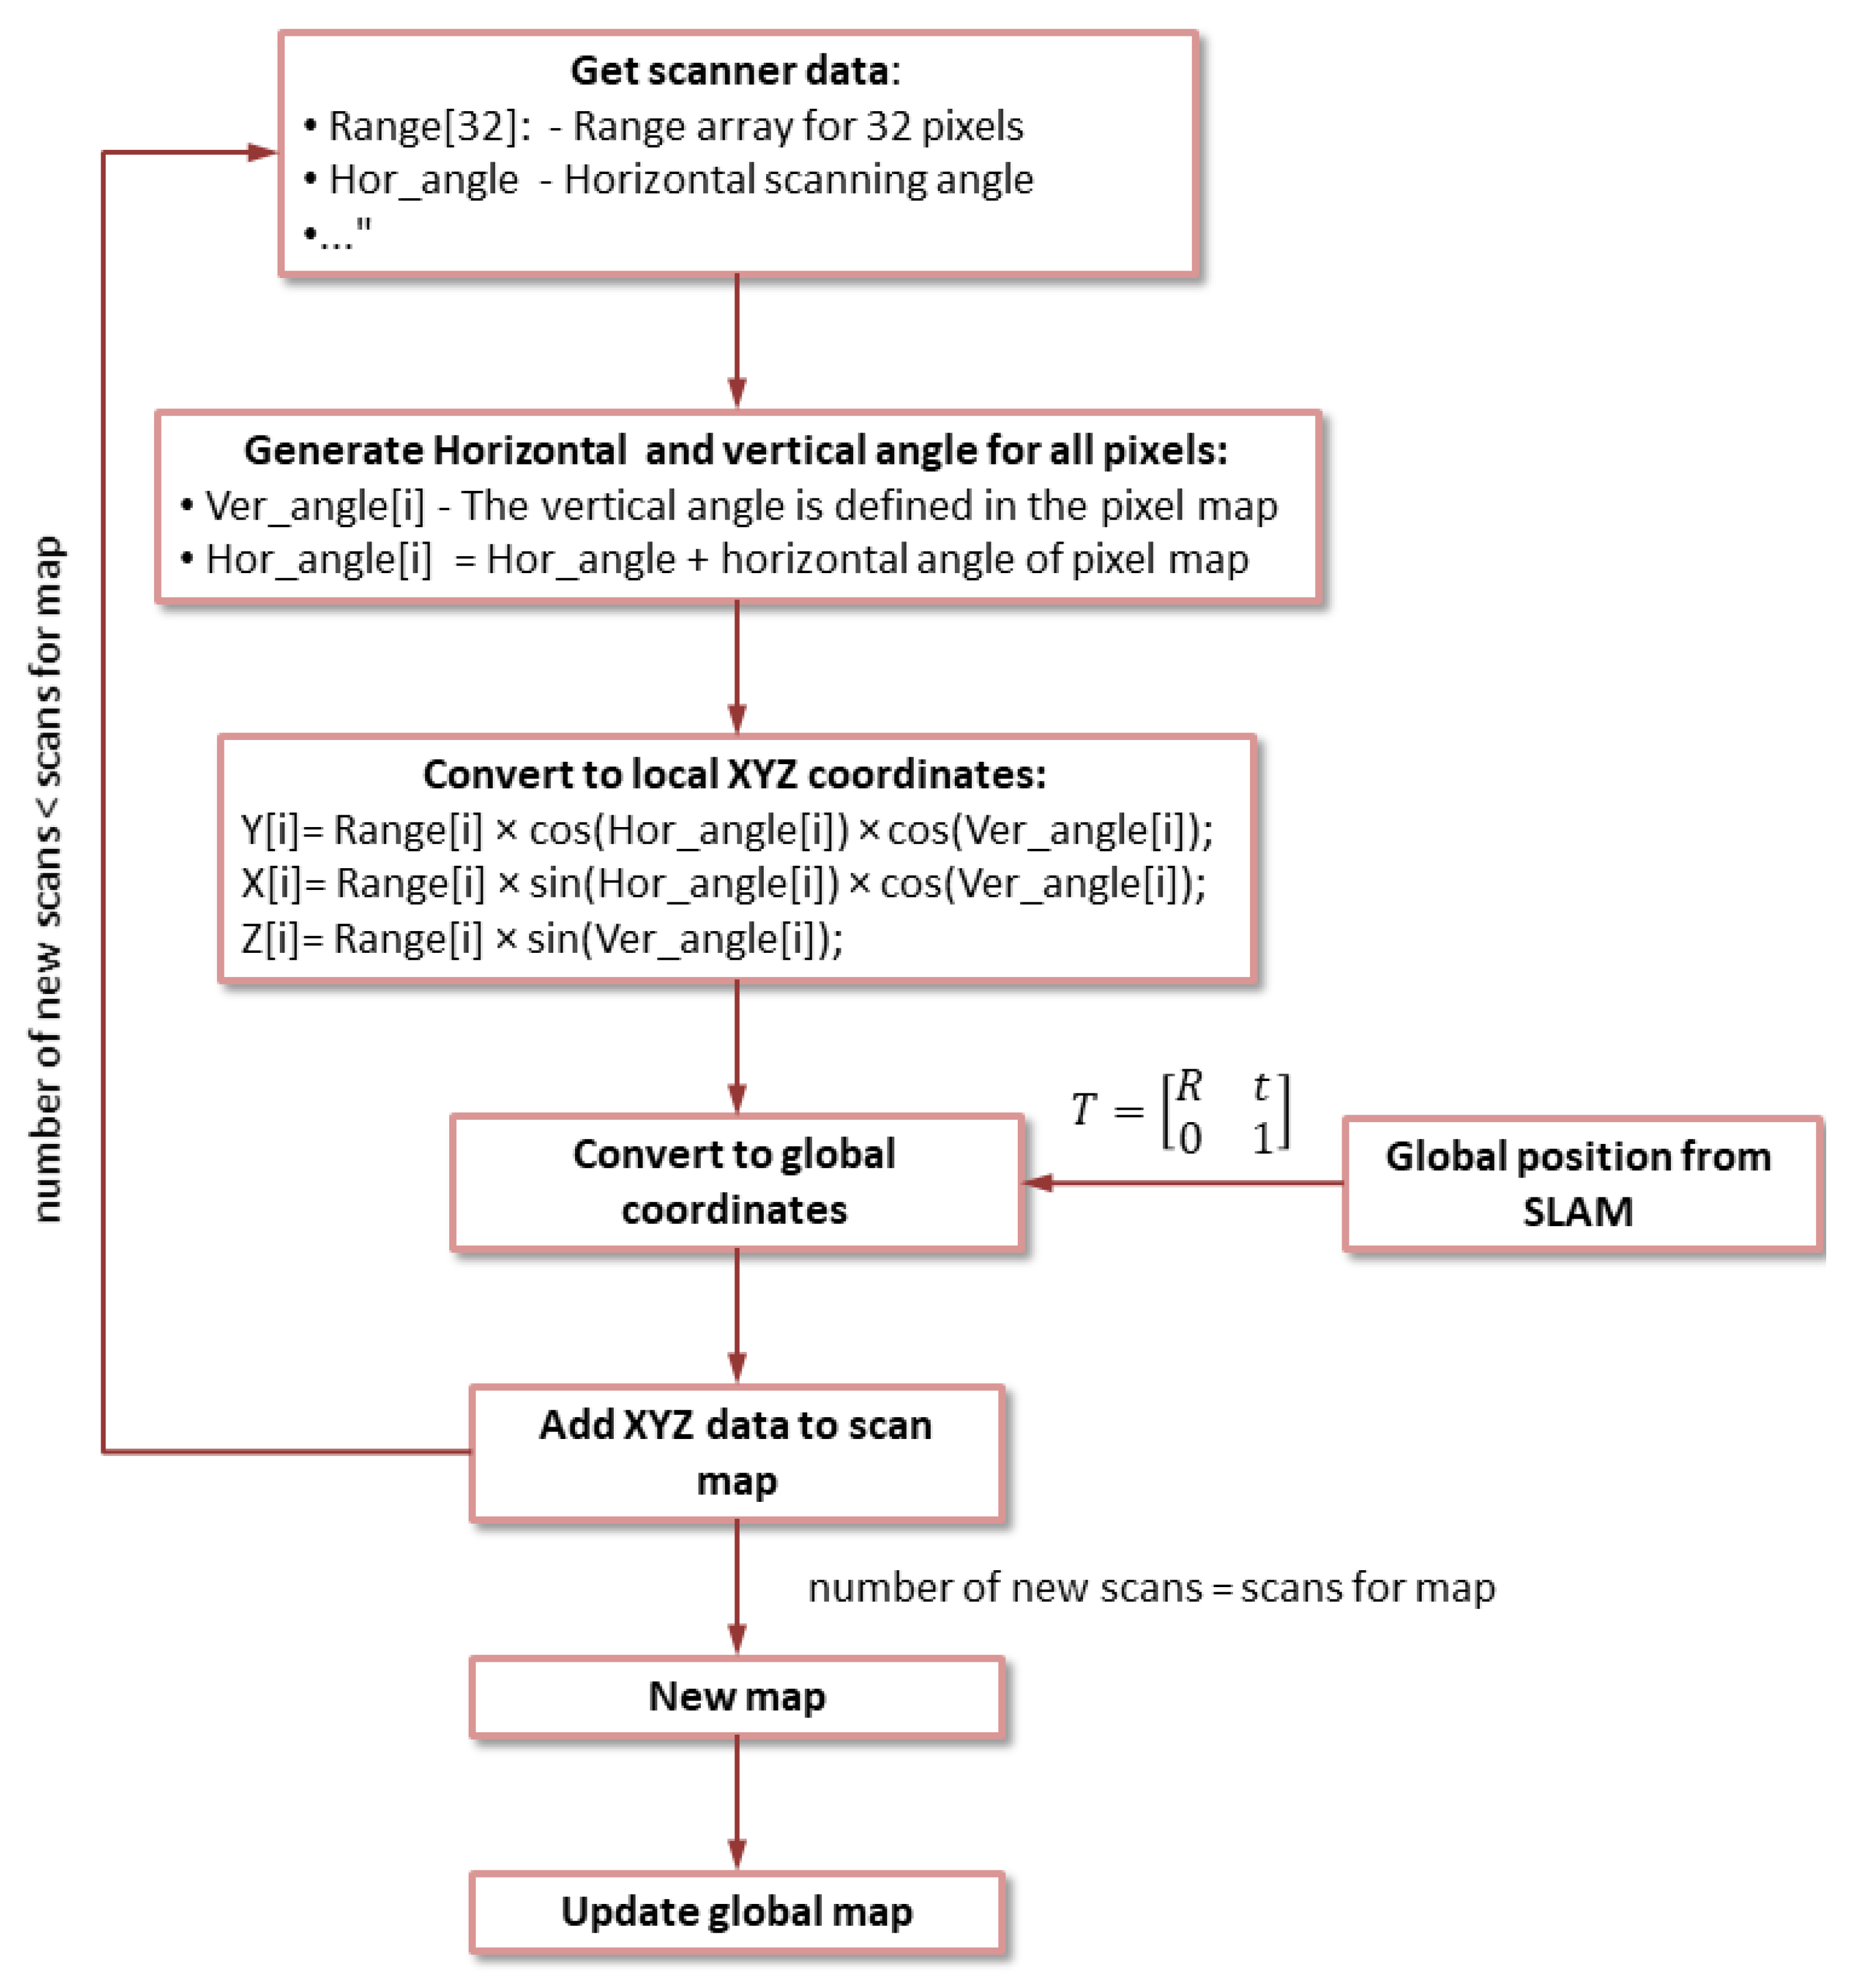
2.4. Data Acquisition

A single measurement provides distance information simultaneously from each of the 32 pixels in the sensor matrix, covering a vertical field of view of 12.4° and a horizontal field of view of 5.4°. The sensor automatically flags pixels that exceed predetermined thresholds. This occurs for both dark objects, which strongly absorb light, and bright objects, which strongly reflect the laser light illuminating the measured area. Furthermore, the sensor supplements the measurement data with contextual information (range, signal phase, signal amplitude, and status), creating a measurement package of 396 bytes in size. The package is received by the MCU via SPI communication operating at a frequency of 4 MHz, meaning the reception time for a single package is 0.792 ms. The microcontroller supplements the data with the current vertical angle for each pixel and the horizontal angle for the measurement matrix, as well as a timestamp. This prepared package, now 464 bytes in size, is transmitted via the USB port to the host device. In the worst-case scenario, with data generated every 1 ms, a throughput of 464 kB/s (3.712 Mb/s) is required. With the planned multiplication of sensors, the required throughput will further increase, making a USB an even more suitable choice due to its ability to facilitate the expansion of the device.
During a single measurement, the stepper motor is in a fixed position. After reading the measurement data, it is rotated at an angle of 5.625° and the next measurement is taken. The motor rotation frequency was experimentally determined to be 2.5 kHz. At higher frequencies, the phenomenon known as “step loss” was observed, resulting in an inaccurate determination of the sensor’s actual rotation angle. The time t r required for the motor to rotate through a desired angle α can be determined using the following formula:
t r = α α step · f step
where α s t e p is the rotation angle per step (1.125°/step) and f s t e p is the rotation frequency.
Using Equation (4), the sensor’s rotation time to the next measurement position (with an angle of 5.625°) is 2 ms. The ToF sensor has the possibility of increasing the measurement accuracy by extending the measurement time. The increase in accuracy is related to performing a larger number of intermediate integrations of the results. In the current version, a variable measurement time ( t p ) ranging from 1 to 4 ms is used. Taking into account the above and Equation (4), the time for one scan for a selected range α 1 is as follows:
t s = α 1 α r α r α step · f step + t p
where α r —the sensor rotation angle to the next position (5.625°); t p —the measurement time.
The estimated scan times for the 270° scanning range and t p = 1 ms and t p = 4 ms are 144 ms and 288 ms, respectively, and were confirmed during experiments. During a full scan rotation, the active scanning area covers 291.5°, while the inactive area covers 68.5°. This inactive area arises from the scanner design and may increase depending on its location in the wheelchair (Figure 4).
The device only performs measurements within the active scanning area. Transitioning through the inactive zone is achieved by a “jump” equivalent to the angle of the inactive zone. This shortens the time for a full rotation and reduces the amount of measurement data that the microcontroller must discard. Ultimately, the total scan time ( t t ) can be determined using the following equation:
t t = α 1 α r α r α step · f step + t p + 360 α 1 α step · f step
During the experiments, the scanning time for a full rotation, accounting for an effective inactive zone of 90°, ranged from 176 to 320 ms, which is slower than the estimation. The inactive zone was increased from the sensor’s intrinsic blind zone of 68.5° (as determined by its design, see Figure 4) to 90° to incorporate the additional constraints imposed by the device’s placement on the wheelchair (Figure 5).

3. Results

3.1. System Evaluation

The selection of a suitable mounting location for the scanner in a wheelchair is crucial. Several factors must be considered, including the following: potential interference with folding and unfolding the wheelchair, increased overall dimensions of the wheelchair, protruding elements, and user comfort. Optimal placement integrates the components of the system seamlessly with the wheelchair while maximizing the scanning angle. Additionally, given the conical field of view of the scanner, mounting it at mid-height of the wheelchair occupied by the user is essential. Taking into account these factors and the characteristics of the scanner design, the decision was made to mount two sensors: the first in front of the left armrest of the wheelchair and the second diagonally in the rear right (Figure 5a). This configuration reduces the active scanning area (yellow color on Figure 5b) to 270° for each sensor but simultaneously ensures that the inactive scanning areas are compensated for by overlapping fields of view (red color on Figure 5b). Depending on the wheelchair design, part of the measurement range can be obstructed; this area is indicated in the gray color in Figure 5b. Moving the mounting location slightly out of the wheelchair could achieve complete coverage. However, since the obstructed area is limited and protruding elements are more vulnerable to damage during maneuvers, especially in confined spaces, the scanners were mounted within the outline of the wheelchair.
Having established the optimal mounting configuration and sensor placement, the system’s performance must be evaluated in terms of accuracy and mapping procedure effectiveness. These evaluations are crucial to ensure the system meets the desired operational standards, ensuring reliability and accuracy in real-world applications.

3.1.1. Evaluation of System Accuracy

To evaluate the system’s accuracy, measurements were conducted by aiming the scanner at a flat surface at various reference distances from 0.5 to 4 m, performing a series of 100 measurements for each distance. From these measurements, the mean values obtained from the pixels were calculated as the actual distances to the obstacle. Detailed mean distance values and standard deviations for each pixel at the reference distance of 0.5 m, along with the tilt angles of individual pixels relative to the optical axis, are provided in Appendix A (Table A1 and Figure A1). Additionally, two other parameters were determined: the standard deviation (SD), which reflects the typical measurement error, and the maximum observed deviation from the mean value, representing the maximum measurement error. The mean value was further validated by conducting distance measurements using a laser rangefinder. The laser rangefinder was configured to measure the distance at the central point, ensuring that the conditions provided accurate reference measurements.
The measurements were conducted under natural daylight conditions, with typical sunlight and no supplementary lighting. The tests were performed on three distinct matte surfaces available in the laboratory: white, light brown, and black. The results for a single pixel located closest to the center of the field of view are presented in the Table 4.
The distance measurements obtained using a laser rangefinder confirmed that the mean values closely approximated the actual distance. Consequently, these mean values were accepted as the true distance measurements.

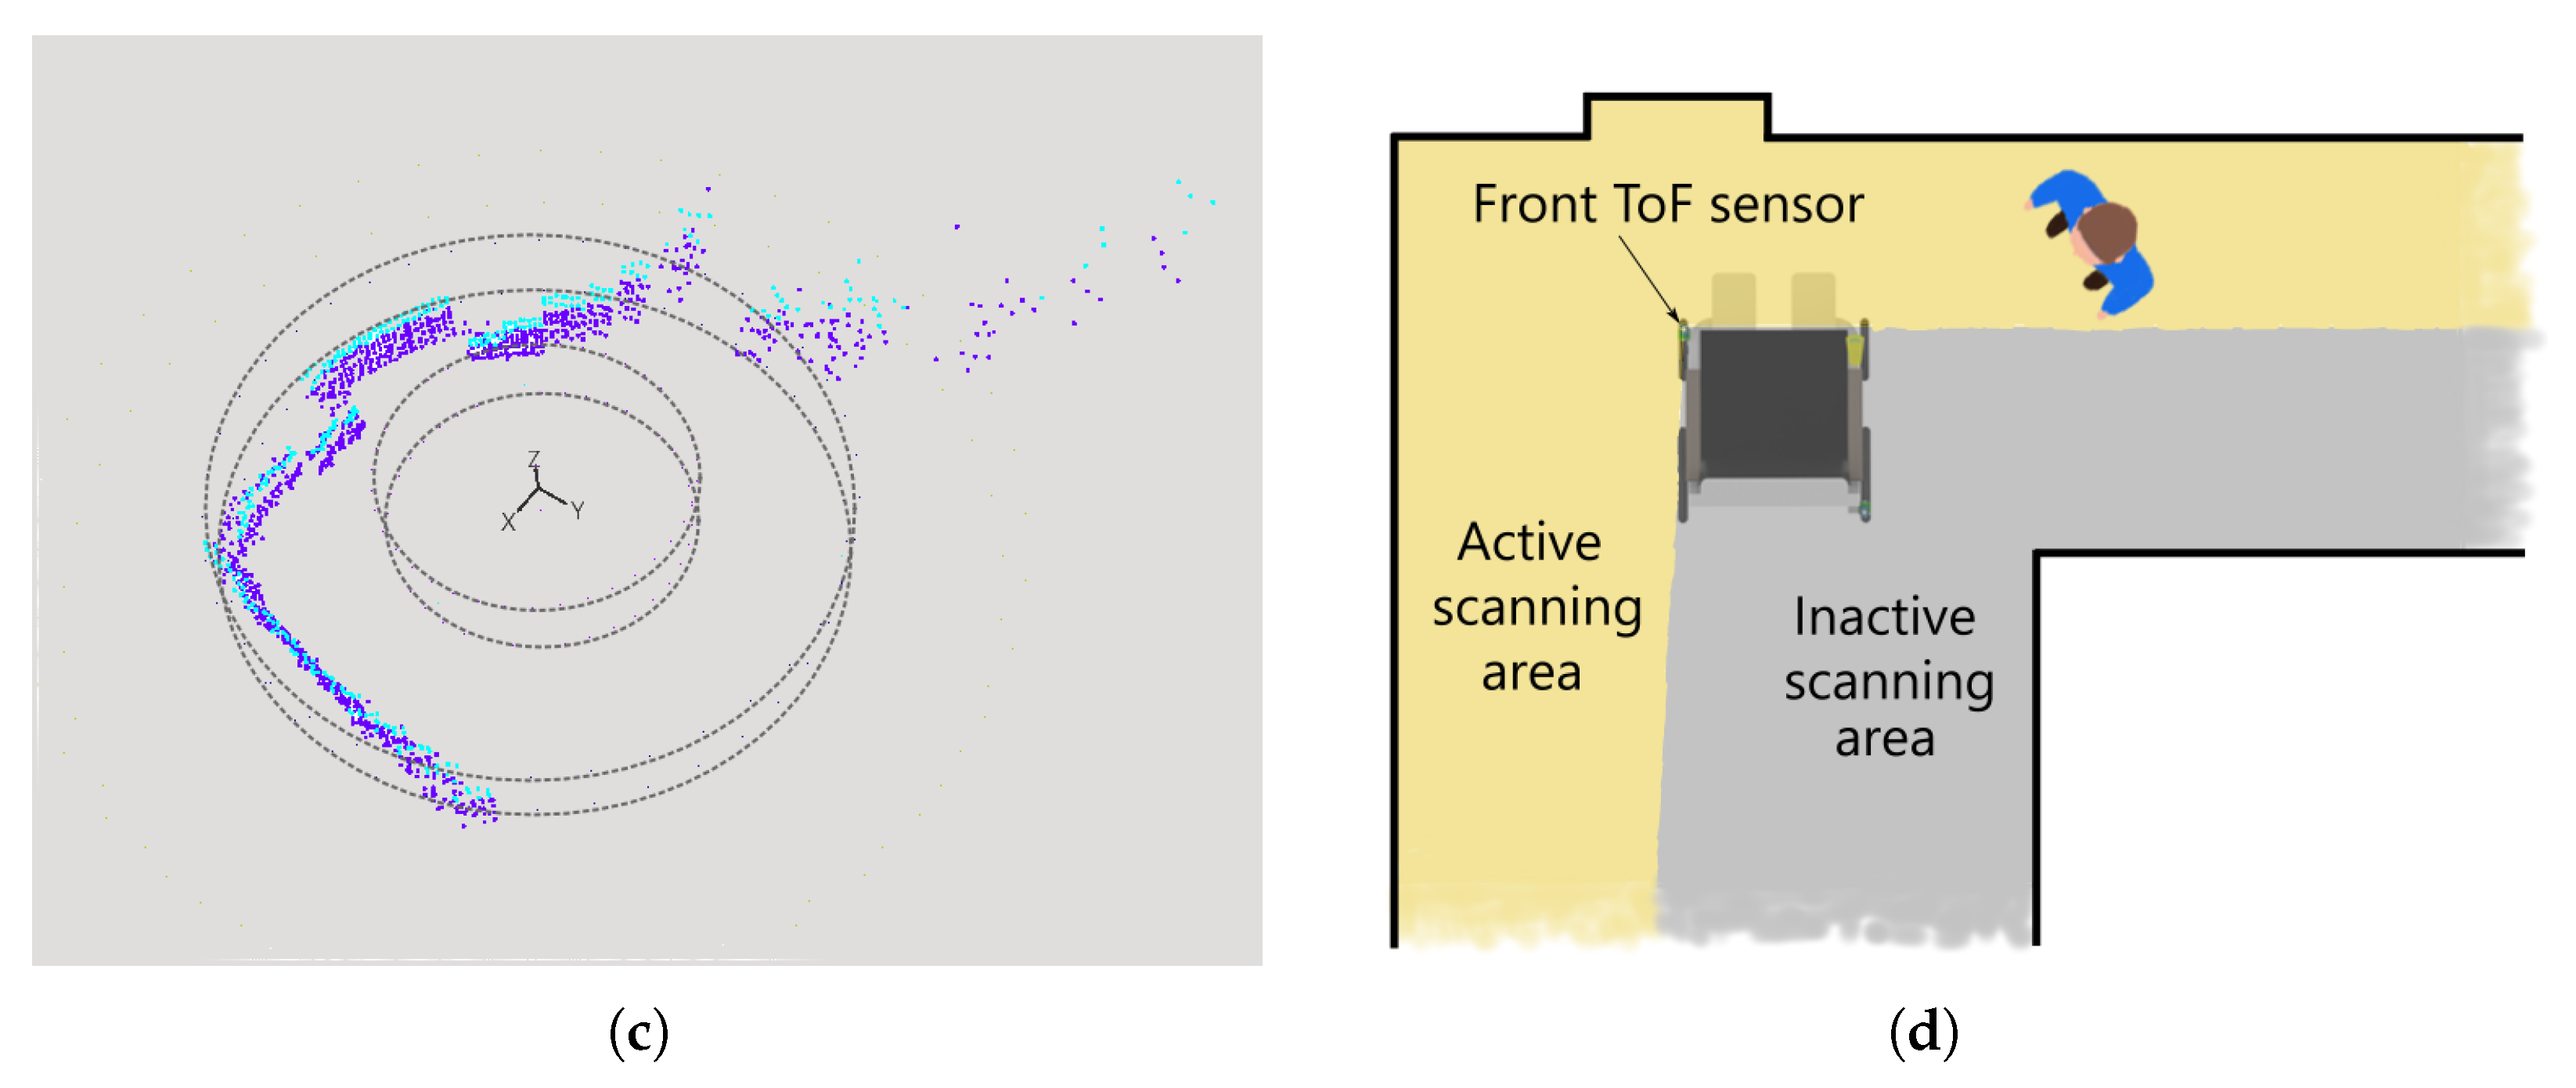
3.1.2. Evaluation of Mapping Procedure

The tests were conducted under real-world conditions using measurement data from the single scanner mounted on the left armrest of the wheelchair as shown in Figure 6. The wheelchair was positioned over 1 m in front of an obstacle and approximately 1.8 m from another obstacle on its left. The measurements were performed under static conditions, meaning that the wheelchair remained stationary throughout the data acquisition process. The captured image represents only data within a 270° field of view, collected from a single scanner. The scanner control was implemented on a laptop using dedicated software developed for this purpose in LabView v20.0.1 (National Instruments, Austin, TX, USA). This program allows for scanner operation management, the adjustment of selected operating parameters, data acquisition, and visualization as a point cloud. Due to the sequential nature of the measurements, the conversion of data into Cartesian coordinates was performed on the computer side.
The detailed process of 3D map generation from scanner data, including the computation of local XYZ coordinates and their transformation into global coordinates using SLAM, is described in Appendix B (see Figure A2). The subsequent stages of the mapping process are illustrated in Figure 7. Figure 7a shows the result of a single measurement, which is limited to the scanner’s field of view. Figure 7b,c demonstrate the accumulation of multiple measurements taken from different sensor positions, progressively building a more comprehensive environmental representation. Ultimately, the final result is a three-dimensional map of the environment, offering a detailed spatial reconstruction. Additionally, Figure 7d provides a schematic representation of the room where the experimental test was conducted.

4. Discussion

4.1. Analysis of the Results

The results of the system accuracy evaluation indicate that the sensor operated in dynamic mode, automatically adjusting the measurement parameters based on the distance. This can be observed from the variations in the measurement time and signal amplitude. For example, as the distance increased from 1.945 m to 2.411 m for the light brown surface, the amplitude increased from 217.5 to 247.4 (highlighted in gray in the Table 4). This change in signal amplitude is associated with the distance and the strength of the reflected signal reaching the sensor. Furthermore, an analysis of the measurement time reveals that the measurement time was longer for shorter distances, which resulted in higher accuracy. The measurement time was automatically determined by the sensor’s software.
Based on the results in Table 4, it can be concluded that the white surface exhibits low standard deviations and relatively small maximum deviations, indicating that the scanner performs well on this surface. The signal amplitude is also higher, contributing to more accurate measurements. For instance, at a distance of 1.945 m, the amplitude is 217.5, and at 2.411 m, it increases to 247.4. This increase in amplitude with distance helps maintain measurement reliability. In contrast, the brown surface shows slightly higher standard deviations and maximum deviations, particularly at distances greater than 2 m. Although the signal amplitude remains relatively stable, suggesting that the scanner performs consistently, minor fluctuations in measurements are observed as the distance increases. This is evident from the increase in maximum deviations, which rise with the distance (e.g., from 0.008 m at 0.521 m to 0.143 m at 3.892 m).
The black surface, however, demonstrates a significant reduction in signal amplitude, particularly at longer distances. At around 3 m, the amplitude becomes too low, resulting in a large number of erroneous measurements, as reflected by the substantial standard deviations and maximum deviations at distances such as 3.100 m and 4.040 m. This results in a reduced effective range of the sensor for black surfaces, limiting its accuracy to approximately 3 m.
Such results suggest that surface color and its reflective properties play a crucial role in the accuracy of the system. According to the general principles of ToF technology, the accuracy of measurements is influenced by the strength of the reflected IR signal, which varies depending on the material and color of the object’s surface [27]. This is consistent with the observation that the highest accuracy is achieved on white and light brown surfaces, which are characterized by higher reflectivity. These surfaces facilitate better signal reception, leading to more reliable measurements. In contrast, black surfaces, which absorb more light, result in weaker signals, thereby reducing measurement reliability and range.
The conducted measurements represent preliminary tests of the proposed solution, which showed promising results. The accuracy achieved within a range of 3 m is considered sufficient for the intended application in wheelchair navigation systems, where the movement speed is relatively low, and precise measurements beyond this range may not be critical. These preliminary results suggest that the sensor could be effective in assisting individuals using wheelchairs, providing reliable distance measurements within the operational range. Furthermore, they align with previous studies demonstrating the utility of ToF sensors in low-speed navigation tasks, such as robotic assistance systems and collision avoidance applications for mobility devices [28].
However, further studies will be required to assess the system’s performance under real-world conditions, taking into account variables such as dynamic movement, external light interference, and varying surface textures. In addition, a more comprehensive error analysis, including comparisons with other measurement methods, will be performed to assess the sensor’s reliability and accuracy in diverse environments. These studies will also help refine the system for wider deployment, ensuring that it meets the specific needs of wheelchair users in everyday scenarios.
However, when it comes to the results regarding the evaluation of the mapping procedure, it can be noted that when the wheelchair is in motion, distortions may occur in the acquired images. This occurs because each measurement frame is captured from a slightly different position relative to the surrounding objects. A similar issue was observed in [35]. To mitigate these distortions, an environment map was constructed sequentially by assembling successive measurements covering different sections of the scanned area within the sensor range.
These results confirm the effectiveness of the proposed mapping method, demonstrating its potential for real-time environmental scanning and autonomous navigation applications. The tests conducted with a single front-mounted scanner validated the scanning range of the sensor. At the same time, they confirmed the necessity of installing a second scanner at the rear diagonally as we had anticipated (see Figure 5).

4.2. Comparison to Previous Model

In our previous work [16], we employed RPLIDAR A1 (SLAMTEC, Shanghai, China) scanners mounted on custom-designed bases that allowed rotation along the pitch axis. Although this setup provided reliable data acquisition, it had several drawbacks in terms of size, weight, and power consumption. The entire assembly weighed 523 g and had dimensions of 125 × 80 × 140 mm. Due to the need to rotate the entire scanner, the system exhibited significant power consumption, reaching a peak of 14 W. A myRIO device (National Instruments, Austin, TX, USA) was used as the control system. Three scanners were placed on the wheelchair, allowing for a full scan of 360°. A complete scanner rotation took between 800 and 1600 ms for eight scanned planes.
In contrast, the current solution has reduced the number of scanners required to two. The adoption of a ToF sensor has eliminated the necessity for rotation along the pitch axis, thereby enabling the use of a low-power motor. This modification not only reduces the mechanical complexity but also improves energy efficiency. Furthermore, the use of custom-designed PCBs eliminated the need for an additional control system, leading to a more compact and integrated solution. The entire system was designed with low power consumption in mind, eliminating the need for auxiliary power supplies. Moreover, the reduction in the size and weight of the scanner assembly has contributed to an increase in the measurement speed for full rotation. A detailed comparison of the properties of both solutions is presented in Table 5.
These improvements not only enhance the practicality of the scanning system but also contribute to a more efficient and energy-conscious solution. By reducing the number of scanners and optimizing power consumption, the current design presents a more streamlined and cost-effective approach to achieve comprehensive environmental scanning.

4.3. Comparison with Existing Systems

The comparison with existing solutions is based on two systems: the commercial solution YDLIDAR T-mini Plus (YDLIDAR, EAI Technology Co., Ltd., Chengdu, China) [32] and the DIY solution represented by the xLIDAR project [33]. The YDLIDAR T-mini Plus belongs to the same family as the RPLIDAR A1 previously utilized in our research, while xLIDAR presents an intriguing approach to low-cost scanning systems. A comparison of the main features of these systems is presented in Table 6.
The application of distance sensors on an electric wheelchair for the purpose of creating a specific environmental map demands that the sensor should measure the distance to obstacles located several meters from the wheelchair to allow for a sufficient reaction time for safe maneuvering. The YDLIDAR T-mini Plus enables measurements of up to 12 m (under favorable conditions) and up to 4 m in less favorable conditions. In contrast, the xLIDAR solution allows for measurements of only up to 1 m, which significantly complicates its use for obstacle avoidance.
Our solution, with a sensing range of 3–4 m, facilitates a smooth adjustment of the wheelchair’s speed in response to obstacles. The selection of a 3–4 m sensing range was based on an analysis of the worst-case stopping distance of a powered wheelchair traveling at a maximum speed of 6 km/h (1.67 m/s). The assumption of a maximum speed of 6 km/h aligns with the classification of a medium-speed electric wheelchair according to Japanese Industrial Standards (JIS) [36]. Considering a typical system response delay of 200 ms, a powered wheelchair travels approximately 0.33 m before braking begins. Assuming a deceleration in the range of 0.93 to 2.2 m/s2, as experimentally observed by Ikeda et al. [36], the total stopping distance falls between 0.89 and 1.72 m. Thus, a detection range of 4 m provides a safety margin of more than twice the expected maximum stopping distance, ensuring sufficient time for obstacle detection and safe braking, even when facing unexpected small or low-profile obstacles. Extending the sensing range beyond 4 m offers limited practical benefits in typical indoor environments, whereas reducing it below 3 m would significantly compromise safety.
A very important factor is the vertical scanning area, as many obstacles that pose a threat to individuals in wheelchairs are located at head height or just above the ground surface (such as curbs and stairs). Mounting the sensor near the head or at the height of the wheel requires specialized construction and complicates everyday use, such as folding the wheelchair for transport. The YDLIDAR T-mini Plus has a narrow vertical field of view, which necessitates the installation of multiple sensors at different heights or the movement of the entire scanner. The same issue arises with the xLIDAR, which employs sensors designed for 1D measurements. Our solution, with its wide vertical field of view, allows for coverage of a significant area. In addition, the scanner can be easily expanded with additional sensors, slightly increasing its size.
The communication interface of the device should be integrated with the power supply system to reduce the number of wires required for connection. The YDLIDAR T-mini Plus utilizes serial communication, while the xLIDAR employs the I2C interface, which is not specifically designed for wired connections, and the additional control wires further complicate the solution. Our approach utilizes USB communication, which represents the most versatile solution.
Since electric wheelchairs operate on battery power, the scanners employed should have minimal energy consumption. The YDLIDAR T-mini Plus consumes approximately 450 mA, which represents a relatively high current demand, especially compared to our proposal (approximately 140 mA). The xLIDAR also has a comparable low power requirement; although there is no official information available, based on the components used, we estimate its consumption to be around 160 mA.
The YDLIDAR T-mini Plus offers a good measurement range, relatively low cost, and reliable communication; however, its narrow vertical field of view and high energy consumption indicate that it is not the best solution for an electric wheelchair. The xLIDAR presents an interesting approach to area scanning, but it is not suitable for constructing an environmental map for a wheelchair.
Our solution incorporates features that are essential for wheelchair environmental mapping systems. It offers an optimal obstacle detection range, a wide vertical field of view, USB-based power and communication, low power consumption, and a modest cost. We also plan to conduct further tests of our solution to enable a more accurate verification of measurement precision in diverse environments.
The comparison presented was conducted between solutions known to the authors. However, it is important to note that there may be other solutions available on the market that the authors are not aware of. The rapid development of technology and constant introduction of new products could mean that additional systems with similar or even improved features exist, which were not included in this analysis.

4.4. Limitations

The presented results reflect an initial evaluation of the proposed system under controlled laboratory conditions. The current findings provide a foundation for applying the proposed system in real-world assistive mobility scenarios, particularly for wheelchair navigation. The performance of the ToF sensor, characterized by a scanning time of 144–288 ms for a 270° scan and reliable distance measurements in controlled conditions, demonstrates its potential for obstacle detection in low-speed environments (e.g., 1 to 2 m/s, typical for wheelchair users). However, several limitations have been identified that may affect its performance in real-world environments:
  • Limited vertical field of view: The current sensor setup offers a vertical field of view of only 12.4°, which may result in missing low-lying obstacles (for example, curbs) or overhead hazards.
  • Susceptibility to environmental conditions: Real-world factors such as dynamic lighting, reflective or transparent surfaces, and multiple reflections have not yet been fully evaluated. These factors may significantly affect distance measurement reliability.
  • Reduced accuracy on low-reflectivity surfaces: Preliminary tests show a decreased measurement accuracy for dark objects beyond 3 m, which limits the detection of black clothing or furniture in environments with such objects.
  • Motion-induced distortions and latency: The current system has not yet been quantitatively tested for distortions during motion or delays in response to fast-moving obstacles, both of which are critical for real-time navigation.
  • Variable performance due to Dynamic Configuration Adaptation (DCA) mode: The initial static sensor configuration proved inadequate in challenging scenarios—such as dark or reflective surfaces or objects at extreme distances—where measurements suffered from pixel saturation or weak return signals. To address this, the system employs DCA. This mechanism dynamically adjusts sensor parameters (e.g., integration depth, gain, and output power) to optimize measurement quality under difficult conditions. While DCA enhances robustness, it introduces variability in scanning time, potentially affecting real-time responsiveness.
  • Encoder inaccuracies: The current system relies on encoder-based position determination using a stepper motor, assuming accurate and repeatable sensor positioning (see Section 2.3). However, at higher rotational speeds, the stepper motor is prone to step loss, which introduces angular inaccuracies during scanning. This issue becomes more pronounced during partial scans—used to track nearby or moving obstacles—where full rotations are skipped and the step counter is not reset. Over time, accumulated step loss without periodic recalibration degrades angular precision, negatively affecting obstacle localization and the overall reliability of real-time navigation.
  • Lack of user-level integration: The current system evaluation is limited to a technical validation of the system’s core components, including 3D mapping, measurement accuracy, and hardware design. No user interaction studies or wheelchair integration tests have been conducted.
These limitations will be addressed in future stages of system development through expanded testing, hardware improvements, and user-centered design approaches.

4.5. Future Work

Building on the identified limitations, the next phase of research and development will focus on the following areas:
  • Sensor augmentation: To expand the vertical field of view of the system (currently 12.4°) and improve the detection of obstacles such as low curbs and overhead objects, additional ToF sensors will be integrated in the next development phase. The USB-based architecture of the system enables seamless sensor expansion without major hardware modifications, supporting broader coverage in diverse environments, such as homes, hospitals, shopping centers, and outdoor pathways. These enhancements will undergo real-world testing to validate their effectiveness for assistive mobility applications.
  • Motion-related performance evaluation: Comprehensive tests will be conducted to quantify motion-induced distortions, system latency, and accuracy in dynamic scenarios with moving obstacles. These evaluations will provide essential metrics to ensure robust real-time operation in real-world environments. Further details on the planned test scenarios will be reported in subsequent studies.
  • Improved detection of dark surfaces: The system will be enhanced using additional sensors and optimized signal processing algorithms to increase the robustness against low-reflectivity surfaces. Dedicated experiments will be conducted under varied lighting conditions.
  • Dynamic Configuration Adaptation (DCA) validation: Real-world performance of DCA will be evaluated in varied environments such as crowded indoor spaces and outdoor settings, focusing on the trade-off between reliability and scanning time.
  • Encoder system redesign: The encoder will be redesigned to improve position tracking accuracy. Detailed analysis will be conducted to assess angular errors and their impact on overall surveying precision.
  • Integration with collision avoidance systems: The device will be integrated with an advanced collision avoidance system, such as the one proposed by Pieniążek and Szaj [37], which we intend to further develop into an autonomous solution. This integration will enable the avoidance of predictive obstacles using motion control algorithms, enhancing both safety and user experience.
  • Usability and interface development: Future versions will prioritize user-centered design. This includes intuitive control interfaces, automatic obstacle response (slowing/stopping), and potential autonomous navigation functionalities. The system will be optimized for compact integration on wheelchairs, ensuring it is lightweight and non-intrusive.
  • Long-term validation and benchmarking: Following this preliminary study, extended testing will be conducted in both controlled and real-world environments under varied conditions (e.g., lighting scenarios) to evaluate long-term performance stability. In addition, a comparative evaluation with alternative sensing solutions will be performed to benchmark the accuracy, latency, and robustness of the system.
These efforts aim to transition the current prototype into a practical and reliable assistive navigation solution for wheelchair users and similar mobility platforms.

5. Conclusions

This research presents a compact, energy-efficient ToF-based obstacle detection system designed to navigate electric wheelchairs in confined indoor spaces. Since large measurement ranges offered by traditional laser scanners are often unnecessary in such environments, our system focuses on short-range accuracy and efficient obstacle identification within a 3 m radius. As a result, the proposed system serves as a viable alternative for indoor mobility assistance.
The experimental results validate the design, showing reliable detection on light-colored surfaces, while accuracy decreases on dark surfaces, a known ToF limitation. Compared to our previous system [16], the new design is smaller, lighter, more energy efficient, simpler to control, and powered via USB. Although the vertical field of view is narrow (12.4°), it can be extended by adding more sensors to enhance coverage. Compared to existing solutions, our system balances vertical detection, range accuracy, and power efficiency—surpassing YDLIDAR T-mini Plus and DIY xLIDAR in key aspects—making it suitable for real-world wheelchair use.
Additionally, the experiments confirmed that using an encoder for angular positioning—by resetting at the starting point—is more reliable than relying on motor steps alone. Although some angular inaccuracy remains, this issue can be mitigated by focusing control and scanning efforts on areas of interest near the wheelchair, where obstacles are more likely to pose a threat.
Despite encouraging results, limitations remain—such as a narrow vertical field of view, reduced accuracy on dark surfaces, and sensitivity to environmental conditions. Future work will focus on sensor expansion, improved algorithms, dynamic testing, and integration with collision avoidance and user-friendly interfaces. These developments aim to transform the current prototype into a robust, practical solution for assistive mobility in diverse and dynamic indoor spaces.

Author Contributions

Methodology, W.S. and M.W.; software, W.S.; validation, W.S. and M.W.; formal analysis, W.S.; investigation, W.S., M.W. and W.W.; resources, W.W.; data curation, W.S.; writing—original draft preparation, W.S., W.W. and M.W.; writing—review and editing, W.S., M.W., W.W. and S.M.; visualization, W.W. and M.W.; supervision, S.M.; project administration, W.S. All authors have read and agreed to the published version of the manuscript.

Funding

This research received no external funding.

Data Availability Statement

The raw data supporting the conclusions of this article will be made available by the authors on request.

Conflicts of Interest

The authors declare no conflicts of interest.

Abbreviations

The following abbreviations are used in this manuscript:
DCADynamic Configuration Adaptation
FOVField of View
IRInfrared
LiDARLight Detection and Ranging
MCUMicrocontroller
PCBPrinted Circuit Board
SLAMSimultaneous Localization and Mapping
SPISerial Peripheral Interface
ToFTime of Flight
WHOWorld Health Organization

Appendix A

To provide a comprehensive evaluation of the ToF sensor’s accuracy across different surfaces, we conducted preliminary tests under controlled environmental conditions: daylight illumination and three matte surface colors (white, brown, and black). Measurements were performed at various reference distances from 0.5 to 4 m, as determined by a laser rangefinder with a measurement accuracy of ±2 mm, which served as the ground truth for error computation. However, precisely determining the sensor’s surface position relative to the rangefinder introduces a systematic error of approximately ±5 mm. Additionally, the laser beam may not precisely target the surface area corresponding to the selected pixel, an error that increases with distance. Consequently, we adopted the mean values obtained from the pixels as the actual distances, using the laser rangefinder to verify that these values fall within a ±1 cm range. Errors were calculated as the difference between the ToF sensor measurements for pixel 21 (designated as the reference pixel closest to the optical axis) and the corresponding laser rangefinder data.
Table A1 reports the mean distance values and standard deviations for each pixel (0 to 31) at a reference distance of 1 m for the white, brown, and black matte surfaces. Pixel 21, designated as the reference pixel closest to the optical axis, was selected for primary accuracy verification due to its minimal tilt angle, while other pixels exhibit increased measured distances due to their larger tilt angles relative to the optical axis, as discussed in the main text.
Figure A1 illustrates the vertical and horizontal tilt angles of the individual pixels relative to the optical axis of the ToF sensor. The optical axis does not pass through the center of the matrix, leading to an asymmetric distribution of tilt angles across the pixel array, which contributes to the observed increase in measured distances for pixels farther from the optical axis, particularly at larger distances from the surface. The pixel arrangement is further detailed in the updated Figure 1 in the main text.
Table A1. Mean distance values and standard deviations for all the pixels (0–31) of the ToF sensor, measured on white, brown, and black matte surfaces at a reference distance of 0.5 m under daylight conditions. Highlighted row corresponds to the pixel nearest to the optical axis.
WhiteBrownBlack
Pixel
Number
Mean
Value
[m]
SD
[m]
Mean
Value
[m]
SD
[m]
Mean
Value
[m]
SD
[m]
00.5410.0040.5380.0030.5710.012
10.5340.0040.5300.0030.5540.012
20.5020.0050.5260.0030.5520.011
30.4790.0030.5180.0030.5430.009
40.5360.0040.5360.0040.5580.015
50.5310.0040.5220.0030.5530.012
60.5070.0080.5170.0060.5600.021
70.4860.0040.5210.0040.5330.014
80.5350.0040.5280.0030.5530.010
90.5250.0050.5110.0050.5510.024
100.5150.0090.5190.0110.5720.035
110.4870.0040.5260.0070.5510.016
120.5270.0030.5220.0020.5500.008
130.5190.0060.5140.0050.5460.016
140.5210.0090.5280.0120.5880.039
150.4860.0040.5190.0060.5600.018
160.5280.0040.5210.0030.5470.008
170.5220.0050.5080.0040.5480.014
180.5130.0090.5080.0100.5770.029
190.4820.0050.5260.0120.5700.027
200.5270.0030.5180.0030.5470.008
210.5190.0050.5020.0040.5450.016
220.5060.0060.5090.0040.5450.016
230.4810.0050.5130.0060.5530.017
240.5270.0040.5160.0020.5500.009
250.5230.0040.5090.0030.5840.010
260.5120.0040.5140.0030.5610.014
270.4870.0040.5130.0030.5500.011
280.5230.0050.5120.0030.6790.009
290.5280.0040.5150.0030.5630.013
300.5080.0070.5110.0040.6070.010
310.4840.0040.5120.0030.5510.010
Figure A1. Angular orientation of the ToF sensor pixels. The figure shows the vertical and horizontal angles of each pixel relative to the central pixel, illustrating the impact on the measured distances.
Electronics 14 02307 g0a1

Appendix B

The process of 3D map generation (see Figure A2) starts with acquiring scanner data and then computing the horizontal and vertical angles to convert the data into local XYZ coordinates. These coordinates are transformed into global coordinates using the SLAM-provided position. The resulting data is used to create a new local scan map, which is subsequently integrated into the global map.
Figure A2. Block diagram of the 3D map generation process using scanner data and global position information from SLAM.
Electronics 14 02307 g0a2

References

  1. World Health Organization. Global Report on Health Equity for Persons with Disabilities; License: CC BY-NC-SA 3.0 IGO; World Health Organization: Geneva, Switzerland, 2022. [Google Scholar]
  2. Labbé, D.; Mortenson, W.B.; Rushton, P.W.; Demers, L.; Miller, W.C. Mobility and participation among ageing powered wheelchair users: Using a lifecourse approach. Ageing Soc. 2018, 40, 626–642. [Google Scholar] [CrossRef]
  3. Sahoo, S.K.; Choudhury, B.B. A review on smart robotic wheelchairs with advancing mobility and independence for individuals with disabilities. J. Decis. Anal. Intell. Comput. 2023, 3, 221–242. [Google Scholar] [CrossRef]
  4. Erturk, E.; Kim, S.; Lee, D. Driving Assistance System with Obstacle Avoidance for Electric Wheelchairs. Sensors 2024, 24, 4644. [Google Scholar] [CrossRef] [PubMed]
  5. Orozco-Magdaleno, E.C.; Cafolla, D.; Castillo-Castañeda, E.; Carbone, G. A hybrid legged-wheeled obstacle avoidance strategy for service operations. SN Appl. Sci. 2020, 2, 329. [Google Scholar] [CrossRef]
  6. Habib, M.K. Real Time Mapping and Dynamic Navigation for Mobile Robots. Int. J. Adv. Robot. Syst. 2007, 4, 35. [Google Scholar] [CrossRef]
  7. Rojas, M.; Ponce, P.; Molina, A. A fuzzy logic navigation controller implemented in hardware for an electric wheelchair. Int. J. Adv. Robot. Syst. 2018, 15. [Google Scholar] [CrossRef]
  8. Okonkwo, C.; Awolusi, I. Environmental sensing in autonomous construction robots: Applicable technologies and systems. Autom. Constr. 2025, 172, 106075. [Google Scholar] [CrossRef]
  9. Dahmani, M.; Chowdhury, M.E.H.; Khandakar, A.; Rahman, T.; Al-Jayyousi, K.; Hefny, A.; Kiranyaz, S. An Intelligent and Low-Cost Eye-Tracking System for Motorized Wheelchair Control. Sensors 2020, 20, 3936. [Google Scholar] [CrossRef]
  10. Mulyanto, A.; Borman, R.I.; Prasetyawana, P.; Sumarudin, A. Implementation 2d lidar and camera for detection object and distance based on ros. JOIV Int. J. Inform. Vis. 2020, 4, 231–236. [Google Scholar] [CrossRef]
  11. Chandran, N.K.; Sultan, M.T.H.; Łukaszewicz, A.; Shahar, F.S.; Holovatyy, A.; Giernacki, W. Review on Type of Sensors and Detection Method of Anti-Collision System of Unmanned Aerial Vehicle. Sensors 2023, 23, 6810. [Google Scholar] [CrossRef]
  12. Sui, J.; Yang, L.; Zhang, X.; Zhang, X. Laser Measurement Key Technologies and Application in Robot Autonomous Navigation. Int. J. Pattern Recognit. Artif. Intell. 2011, 25, 1127–1146. [Google Scholar] [CrossRef]
  13. Adams, M.; Wijesoma, W.; Shacklock, A. Autonomous navigation: Achievements in complex environments. IEEE Instrum. Meas. Mag. 2007, 10, 15–21. [Google Scholar] [CrossRef]
  14. Wu, Z.; Meng, Z.; Xu, Y.; Zhao, W. A Vision-Based Approach for Autonomous Motion in Cluttered Environments. Appl. Sci. 2022, 12, 4420. [Google Scholar] [CrossRef]
  15. Lopac, N.; Jurdana, I.; Brnelić, A.; Krljan, T. Application of Laser Systems for Detection and Ranging in the Modern Road Transportation and Maritime Sector. Sensors 2022, 22, 5946. [Google Scholar] [CrossRef]
  16. Szaj, W.; Fudali, P.; Wojnarowska, W.; Miechowicz, S. Mechatronic Anti-Collision System for Electric Wheelchairs Based on 2D LiDAR Laser Scan. Sensors 2021, 21, 8461. [Google Scholar] [CrossRef]
  17. Delmas, S.; Morbidi, F.; Caron, G.; Albrand, J.; Jeanne-Rose, M.; Devigne, L.; Babel, M. SpheriCol: A Driving Assistance System for Power Wheelchairs Based on Spherical Vision and Range Measurements. In Proceedings of the 2021 IEEE/SICE International Symposium on System Integration (SII), Iwaki, Japan, 11–14 January 2021; IEEE: Piscataway, NJ, USA, 2021; pp. 505–510. [Google Scholar] [CrossRef]
  18. Patar, M.; Ramlee, N.; Mahmud, J.; Lee, H.; Hanafusa, A. Cost-Effective Vision based Obstacle Avoidance System integrated Multi Array Ultrasonic sensor for Smart Wheelchair. Int. J. Recent Technol. Eng. 2019, 8, 6888–6893. [Google Scholar]
  19. Rifath Ahamed, E.; Muthukrishnan, R.; Karthik, S.; Vijayakumar, G.; Salman Hari, A.; Vinoth Kumar, M. Vision Controlled Motorised Wheelchair. Int. J. Res. Appl. Sci. Eng. Technol. 2023, 11, 7–17. [Google Scholar] [CrossRef]
  20. Luo, H.; Cao, X.; Dong, Y.; Li, Y. Simulation and experimental study on the stability and comfortability of the wheelchair human system under uneven pavement. Front. Bioeng. Biotechnol. 2023, 11, 1279675. [Google Scholar] [CrossRef]
  21. Derasari, P.M.; Sasikumar, P. Motorized Wheelchair with Bluetooth Control and Automatic Obstacle Avoidance. Wirel. Pers. Commun. 2021, 123, 2261–2282. [Google Scholar] [CrossRef]
  22. Njah, M. Safety Wheelchair Navigation System. J. Microcontroll. Eng. Appl. 2020, 7, 6–11. [Google Scholar]
  23. Safy, M.; Metwally, M.; Thabet, N.E.; Ahmed Ibrahim, N.; Abo El ELa, G.; Bayoumy, A.; Ashraf, M. Low-cost Smart wheelchair to support paraplegic patients. Int. J. Ind. Sustain. Dev. 2022, 3, 1–9. [Google Scholar] [CrossRef]
  24. Pacini, F.; Dini, P.; Fanucci, L. Design of an Assisted Driving System for Obstacle Avoidance Based on Reinforcement Learning Applied to Electrified Wheelchairs. Electronics 2024, 13, 1507. [Google Scholar] [CrossRef]
  25. Labbé, M.; Michaud, F. RTAB-Map as an open-source lidar and visual simultaneous localization and mapping library for large-scale and long-term online operation. J. Field Robot. 2018, 36, 416–446. [Google Scholar] [CrossRef]
  26. Horaud, R.; Hansard, M.; Evangelidis, G.; Ménier, C. An overview of depth cameras and range scanners based on time-of-flight technologies. Mach. Vis. Appl. 2016, 27, 1005–1020. [Google Scholar] [CrossRef]
  27. Hansard, M.; Lee, S.; Choi, O.; Horaud, R. Characterization of Time-of-Flight Data. In Time-of-Flight Cameras; Springer: London, UK, 2012; pp. 1–28. [Google Scholar] [CrossRef]
  28. Romero-Godoy, D.; Sánchez-Rodríguez, D.; Alonso-González, I.; Delgado-Rajó, F. A low cost collision avoidance system based on a ToF camera for SLAM approaches. Rev. Tecnol. Marcha 2022, 35, 137–144. [Google Scholar] [CrossRef]
  29. Naveenkumar, G.; Suriyaprakash, M.V.; Prem Anand, T.P. Autonomous Drone Using Time-of-Flight Sensor for Collision Avoidance. In Intelligent Communication Technologies and Virtual Mobile Networks; Springer Nature: Singapore, 2023; pp. 57–73. [Google Scholar] [CrossRef]
  30. Arditti, S.; Habert, F.; Saracbasi, O.O.; Walker, G.; Carlson, T. Tackling the Duality of Obstacles and Targets in Shared Control Systems: A Smart Wheelchair Table-Docking Example. In Proceedings of the 2023 IEEE International Conference on Systems, Man, and Cybernetics (SMC), Honolulu, HI, USA, 1–4 October 2023; IEEE: Piscataway, NJ, USA, 2023; pp. 4393–4398. [Google Scholar] [CrossRef]
  31. Mihailidis, A.; Elinas, P.; Boger, J.; Hoey, J. An Intelligent Powered Wheelchair to Enable Mobility of Cognitively Impaired Older Adults: An Anticollision System. IEEE Trans. Neural Syst. Rehabil. Eng. 2007, 15, 136–143. [Google Scholar] [CrossRef]
  32. YDLIDAR. YDLIDAR G4 360° Laser Scanner. 2024. Available online: https://www.ydlidar.com/products/view/27.html (accessed on 24 February 2025).
  33. Hackaday. XLidar Is a Merry-Go-Round of Time-of-Flight Sensors. 2018. Available online: https://hackaday.com/2018/06/29/xlidar-is-a-merry-go-round-of-time-of-flight-sensors/ (accessed on 24 February 2025).
  34. Broadcom Inc. Time-of-Flight Sensor Module for Distance and Motion Measurement; Datasheet for AFBR-S50MV85I Sensor; Broadcom Inc.: San Jose, CA, USA, 2022. [Google Scholar]
  35. Szaj, W.; Pieniazek, J. Vehicle localization using laser scanner. In Proceedings of the 2020 IEEE 7th International Workshop on Metrology for AeroSpace (MetroAeroSpace), Pisa, Italy, 22–24 June 2020; IEEE: Piscataway, NJ, USA, 2020; pp. 588–593. [Google Scholar]
  36. Ikeda, T.; Araie, T.; Kakimoto, A.; Takahashi, K. Development of Compact and Lightweight Stand-up Powered Wheelchair—Fall Risk Analysis When at Rest and Decelerating. Int. J. Model. Optim. 2019, 9, 329–333. [Google Scholar] [CrossRef]
  37. Pieniazek, J.; Szaj, W. Augmented wheelchair control for collision avoidance. Mechatronics 2023, 96, 103082. [Google Scholar] [CrossRef]
Figure 1. Diagram of the Time-of-Flight (ToF) sensor illustrating the scanning range and how the detectable area changes with distance.
Electronics 14 02307 g001
Figure 2. (a) Prototype design of Time-of-Flight (ToF) device. (b) Sectional view of the ToF device prototype. A compact and modular prototype featuring two PCB boards (main board (1); ToF board (2)), slip ring (3), mounting plate (4), frame (5), encoder disc (6), ToF mounting (7), stepper motor mounting plate (8), stepper motor (9), bearing (10), and shaft with internal cables channel (11).
Electronics 14 02307 g002
Figure 3. Functional block diagram of the ToF scanner showing key components and signal flow.
Electronics 14 02307 g003
Figure 4. (a) The Time-of-Flight device mounted on a custom holder positioned in front of the left armrest. (b) Top-down view highlighting the active (yellow) and inactive (gray) scanning areas.
Electronics 14 02307 g004
Figure 5. (a) Visualization of the placement of two Time-of-Flight scanners on a wheelchair. (b) Top-down view of the wheelchair with marked zones: active scanning (yellow), dual scanning (red), and inactive (gray).
Electronics 14 02307 g005
Figure 6. Wheelchair equipped with a mounted Time-of-Flight scanner used in experimental research.
Electronics 14 02307 g006
Figure 7. Sequence of images illustrating the process of generating an environment map based on data acquired from a single ToF scanner. In panels (ac), the color of each dot reflects the position of the measured point relative to the scanner: lighter dots correspond to points located above the scanner, while darker ones represent points below its level. Dashed circles in panels (ac) indicate scanning ranges at distances of 1 m and 2 m from the device, with pairs of circles representing the boundaries of the scanned area. (a) Single measurement. (b) Accumulating data from the ToF sensor. (c) Environmental map after one full scan. (d) Schematic representation of the room where the test scans were carried out.
Electronics 14 02307 g007aElectronics 14 02307 g007b
Table 1. Characteristics of sensors used in anticollision systems for wheelchairs.
Sensing TechnologyStrengthsWeaknessesSource
Ultrasonic sensorReduced impact due to reflecting surface
Unaffected by dust and other optical obstructions
Suitable for environments with variable light conditions
Low resolution
Decreased accuracy at long ranges
Affected by temperature changes
Blind to objects that are extremely close
[6,7,8,9]
LiDARHigh precision
Comprehensive 3D point cloud generation
Long range coverage
Generating data in real time
Suitable for dark environment
Unaffected by temperature changes
Unaffected by acoustic interference
High cost
Data analysis with high computing power
Not energy efficient
Direct laser exposure may damage the eye
Sensitive to environmental factors, like reflections and dust
[5,10,11,12,13,14,15,16]
CamerasCost-effectiveness
Real-time visual feedback
Limited effectiveness in low-light condition
Difficulty in accurately detecting transparent or reflective surfaces
Vulnerability to occlusions
Dependence on computational resources for image processing
[17,18,19]
Vision sensorsIntegrated image processing
Real-time operation
Compact design
High detection precision
High cost
Limited field of view
Potential issues with transparent or reflective surfaces
Lighting dependency
Possible processing delays
[8,19]
Table 2. Specification of the Time-of-Flight sensor AFBR-S50MV85l [34].
ParametersValues
Single voltage supply5 V
Typical current consumption33 mA
Integrated laser light source850 nm
Typical optical peak output power40 mW
Typical optical average output power<0.6 mW
Field of view per pixel1.55° × 1.55°
Dimensions of pixel0.15 mm
Shape of pixelhexagonal
Numbers of pixels32 pixels
Field of view, typical12.4° × 5.4°
Transmitter beam13.0° × 6.0°
Typical distance range up to5 m
Measurement rates of up to1 kHz (32 pixels)
Table 3. Vertical and horizontal scanning ranges of the sensor as a function of distance (calculated based on Equation (3)).
Distance d [m]Horizontal FOV h h
( β h = 5.4 ° ) [m]
Vertical FOV h v
( β v = 12.4 ° ) [m]
Scanning Area [m2]
10.090.220.02
20.190.430.08
30.280.650.18
40.380.870.33
50.471.090.51
Table 4. Measurement results on different surfaces.
SurfaceMean Value
[m]
SD
[m]
Max Deviation
[m]
Amplitude
[−]
Time
[μs]
White0.4860.0040.011255.64592
0.9600.0060.023235.84614
1.4100.0090.023191.14614
1.9350.0110.035180.12920
2.4450.0140.041267.21828
2.9800.0200.055190.81280
3.4400.0200.063178.81280
3.9490.0290.069197.61280
Light brown0.5210.0030.008423.54616
1.4180.0150.038120.01544
1.9450.0130.041217.51280
2.4110.0190.047247.41280
3.0090.0260.079197.41281
3.3620.0440.128108.51285
3.8920.0530.14378.81280
Black0.5600.0180.034137.81236
0.9310.0660.17439.61235
1.5780.1220.58029.11235
1.9000.1400.36716.81281
2.4410.1730.47614.81281
3.100----
4.040----
Table 5. Comparison of scanners RPLIDAR A1 [16] and ToF.
FeatureScanner with RPLIDAR A1Scanner with ToF Sensor
Scanner size [mm]125 × 80 × 14040 × 50 × 58
Weight [g]253 g (scanner) + 180 g motor + 90 g balancing14 g motor
56 g total
Approximate power consumption300 mA scanner 600 mA
motor (4.5 W)
Maximum power consumption up to 14 W
140 mA (0.7 W)
360° scanning time100–200 ms per rotation
(1 scanning plane)
8 planes (800–1600 ms for eight planes)
214 ms and 358 ms
(for eight planes)
Measurement range [m]6 m (depending on the scanner used)5 m
Number of scanners on the platform32
Control systemmyRIOSTM32F401RCT6
Power supply methodRequires an additional power sourceUSB-powered, no additional power source required
Table 6. Comparison of the developed solution with YDLIDAR T-mini Plus and xLIDAR (DIY) [32,33].
FeatureDeveloped SolutionYDLIDAR T-mini PlusxLIDAR (DIY)
Detection RangeUp to 4 m, optimal
for wheelchairs.
Up to 12 m, more than needed.Up to 1 m, insufficient for wheelchairs.
Vertical FOVHigh vertical FOV 12.4°. Detects obstacles at various heights, which is crucial for
wheelchair users.
Very small vertical FOV 1.5°. Scans in a horizontal plane; does not detect objects below or above the scanning plane.Very small vertical FOV; sensor designed for 1D measurement.
Communication InterfacePowered and controlled via USB.Standard communication interface—UART.Uses I2C interface and additional signals connections.
Power usage140 mA450 mA160 mA—estimation
CostDesigned with cost-efficiency in mind, making it an attractive solution for wheelchair users.Cost varies depending on the model and supplier; may be higher than DIY solutions but offers professional support and warranty.Budget-friendly DIY solution; however, potential additional costs may arise from the need for specialized tools or components and the time spent on assembly and calibration.
Disclaimer/Publisher’s Note: The statements, opinions and data contained in all publications are solely those of the individual author(s) and contributor(s) and not of MDPI and/or the editor(s). MDPI and/or the editor(s) disclaim responsibility for any injury to people or property resulting from any ideas, methods, instructions or products referred to in the content.

