Article

Enhancing Island Energy Resilience: Optimized Networked Microgrids for Renewable Integration and Disaster Preparedness

SDU Center for Energy Informatics, The Maersk Mc-Kinney Moller Institute, The Faculty of Engineering, University of Southern Denmark, DK-5230 Odense, Denmark
*
Author to whom correspondence should be addressed.
Electronics 2025, 14(11), 2186; https://doi.org/10.3390/electronics14112186
Submission received: 20 March 2025 / Revised: 24 May 2025 / Accepted: 26 May 2025 / Published: 28 May 2025

Abstract

:
Island communities that depend on mainland grid connections face substantial risks when natural disasters sever undersea or overhead cables, often resulting in long-lasting outages. This paper presents a comprehensive and novel two-part methodological framework for enhancing the resilience of these communities through networked microgrids that interconnect local renewable energy resources and battery storage. The framework integrates techno-economic capacity optimization using HOMER Pro with agent-based simulation in AnyLogic to determine cost-effective solar and storage capacities and to model dynamic real-time dispatch under varying conditions. Six island communities across three Indonesian provinces serve as illustrative case studies, tested under best-case and worst-case disruption scenarios that reflect seasonal extremes of solar availability. Simulation results reveal that isolated expansions of PV and battery storage can ensure critical residential loads, though certain islands with limited resources continue to experience shortfalls. By contrast, networked microgrids enable surplus power transfers between islands, significantly reducing unmet demand and alleviating the need for large-scale, individual storage. These findings demonstrate the significant potential of clustered microgrid designs to improve reliability, lower operational costs, and facilitate secure energy supply even during prolonged cable outages. The proposed framework offers a scalable roadmap for deploying resilient microgrid clusters in remote regions, with direct policy implications for system planners and local stakeholders seeking to leverage renewable energy in high-risk environments.

1. Introduction

Island communities worldwide encounter significant barriers in achieving reliable and affordable electricity supply, largely because they depend on undersea or overhead cables connecting them to the mainland grid. When a severe storm, earthquake, or other disruptive event damages these cables, extended power outages commonly follow, with serious consequences for public health, economic livelihoods, and overall resilience. Recent analyses of island microgrids highlight the continued reliance on diesel-based generation, along with limited backup capacity to handle sudden disconnections [1,2,3]. In Indonesia specifically, dozens of small islands frequently suffer from protracted restoration times after natural disasters, worsening losses, and limiting economic growth [4,5,6]. These challenges underscore the urgent need for local generation sources, energy storage, and effective planning that can sustain critical loads under difficult conditions.
Despite the recognized potential of solar energy in tropical archipelagos, many remote areas remain hesitant to adopt large-scale photovoltaic (PV) systems due to capital costs and concerns over intermittency [7,8,9]. Battery storage offers a crucial buffer, yet sizing these systems properly requires detailed modeling of daily and seasonal load patterns, renewable resource fluctuations, and cost trade-offs. Similar research shows that interconnecting multiple island microgrids—forming a “networked” system—can improve resource-sharing efficiencies and reduce the total required storage. However, the benefits of such networking vary widely based on actual load matching, cable capacity, and the alignment of renewable generation [10,11,12].
Existing work on multi-microgrid resilience largely focuses on either steady-state optimization or high-level planning measures. Many robust optimization or stochastic scheduling frameworks analyze new generation capacities but do not always incorporate real-time operational dynamics using agent-based simulation [1,3,13]. Conversely, studies that employ agent-based modeling to capture island-level complexities often rely on simplified assumptions regarding renewable sizing or dispatch constraints [4,14]. This methodological gap limits the capacity to fully evaluate how best to allocate solar resources, battery storage, and possible inter-island linkages to mitigate cable disruptions. Furthermore, most research treats average or single-peak conditions rather than explicitly contrasting the microgrids’ performance in best-case versus worst-case resource windows. These gaps leave policymakers and planners uncertain about the actual reliability of proposed designs under extreme conditions.
In this context, Indonesian island systems present a strong case for resilience-focused microgrid development due to their diverse geographical landscapes, seasonal solar variability, and predominant reliance on diesel-based power generation. A key challenge arises: how can planners ensure the reliability of critical loads by leveraging abundant solar resources while considering the potential for cable outages that may persist for days or even weeks? Addressing this requires a strategic approach that integrates local renewable generation, energy storage, and networked microgrid configurations to enhance system robustness under prolonged disruptions.
The main aim of this paper is to investigate how renewable expansion, battery storage, and networked microgrid configurations can collectively boost resilience during extended cable disruptions in Indonesian island communities. The approach combines a techno-economic capacity optimization tool (HOMER Pro) with an agent-based simulation platform (AnyLogic), creating a two-part methodology. First, HOMER Pro determines the optimal scales of PV and battery systems based on life-cycle costs and load profiles. Second, an agent-based model simulates real-time dispatch, subject to load prioritization, dynamic weather changes, and networked power exchanges, both under favorable (“best case”) and severe (“worst case”) conditions. The comprehensive scenario design, which separates peak renewable weeks from deficit periods, represents a novel feature. While previous literature demonstrates partial elements of this framework, the integration of high-fidelity agent-based dispatch with systematically calculated capacity expansions, tested across multiple time frames, is unique. These enhancements reveal emergent system behaviors typically overlooked in conventional optimization or static analysis [15,16,17].
Another key novelty lies in the focus on multiple island clusters, reflecting real conditions in remote Indonesian provinces where interconnected microgrids can unlock additional efficiencies by sharing surplus power. This paper’s scenario-based results outline how synergy among islands, or a lack of it, influences the ability to fulfill critical loads under prolonged outages [1,4]. The analysis clarifies the cost and reliability implications of standalone versus networked configurations, bridging the knowledge gap on how to deploy large-scale solar and storage solutions that retain value even in the absence of mainland power.
The remainder of this paper is organized as follows. Section 2 reviews relevant literature on multi-microgrid resilience, renewable integration, and agent-based methods, clarifying the contributions of this study relative to prior works. Section 3 explains the methodological framework, detailing data acquisition, agent-based simulation, HOMER Pro optimization, and scenario analyses. Section 4 describes the case study, focusing on six Indonesian islands and highlighting the demographic and infrastructural attributes that shape local energy demands. Section 5 lays out the scenario design, setting out best- and worst-case timeframes to capture seasonal extremes. Section 6 presents simulation and optimization results, including unmet demand patterns, networked microgrid benefits, and resource surpluses. Section 7 discusses these findings in the context of existing research, identifying both alignments and new insights. Finally, Section 8 concludes the paper by summarizing key outcomes, methodological innovations, and avenues for future investigation.

2. Literature Review

The literature review examines existing research on networked microgrids and their role in enhancing energy resilience, with a particular focus on island communities vulnerable to prolonged power disruptions. It also discusses prevalent modeling approaches and their application in microgrid coordination and resilience enhancement. Furthermore, the review identifies important gaps in the current literature, emphasizing the need for integrated simulation–optimization frameworks that comprehensively address both planning and real-time operational challenges under extreme outage scenarios.

2.1. Background on Networked Microgrids and Multi-Microgrid Clusters

Islanded and microgrid power systems often struggle with high capital and operational costs, and furthermore, they are susceptible to disruptions and limited reserve capacity due to weak or absent interconnections [18,19]. Recent advances in microgrid (MG) technology have positioned small-scale power networks as effective solutions for enhancing local energy independence and mitigating supply uncertainties. In this context, networked or clustered microgrids—where multiple MGs are coordinated under a unifying operational framework—have gained significant attention for their potential to bolster resilience and reduce reliance on centralized power grids [1,10,20].
A growing body of literature has explored the evolution of multi-microgrid clusters. Researchers have focused on various aspects of their design and operation, including robust optimization [1], real-time scheduling [10], two-layer or hierarchical strategies [20], and multi-energy system integration [21]. Many of these studies underscore that clustering multiple MGs, whether in a cooperative or competitive arrangement, can leverage shared resources (e.g., renewable energy technologies, storage systems) to more reliably satisfy local demand [2,7,15,22,23]. However, the complexity of aligning diverse interests, managing system uncertainties, and guaranteeing reliable power supply calls for sophisticated modeling and control strategies [11,24,25,26].
For remote or island environments, the concept of networked microgrids has particular relevance. By interlinking geographically nearby MGs or island-based sites, stakeholders can share generation surplus or storage capacity and improve local energy autonomy under normal and extreme conditions [4,27]. Recent developments in robust multi-objective optimization [16], two-stage resiliency planning [28], and flexible, cooperative approaches [29] highlight how multi-microgrids can form an effective buffer against widespread outages. This discussion aligns well with the core problem addressed in the present study: namely, that island communities remain vulnerable to network disruptions if their microgrids are not adequately sized, integrated, or operated to endure cable failures.

2.2. Approaches to Modeling, Optimization, and Control

A variety of frameworks have emerged in the literature to model and optimize multi-microgrid systems. Robust optimization stands out as one of the leading methods, aiming to account for uncertainties in load profiles, renewable generation, and market prices [1,21,30]. Several robust formulations employ min-max-min or two-stage structures to hedge against worst-case scenarios [10,13,26,31]. Others refine robust strategies by blending them with stochastic approaches, offering adaptive or distributionally robust mechanisms that handle multi-dimensional uncertainties [3,4,32]. In multi-microgrids, these robust frameworks must also incorporate inter-MG power exchanges and dispatchable generation scheduling to ensure coordinated and economical operations [33,34].
In parallel, game-theoretic methods have gained traction for multi-microgrid energy scheduling. Stackelberg and Nash game approaches [8,15,35] allow distributed participants—such as individual MGs—to optimize their local objectives while adhering to global constraints. These methods offer a balanced perspective on cooperative and competitive behaviors, especially in settings that lack a single central authority [14,17]. Additionally, hierarchical and distributed control architectures, such as the alternating direction method of multipliers (ADMM) and consensus-based schemes [2,36,37], have emerged to address scalability, data privacy, and real-time operational challenges. Such approaches facilitate local decision-making, relieving the burden on a single central coordinator and better reflecting real-world conditions [5,12,38,39,40].
Some studies integrate advanced control paradigms, such as Lyapunov-based control [11], data-driven predictive techniques [22], and artificial intelligence frameworks (e.g., adaptive neuro-fuzzy controllers) [41,42]. These controls aim to improve system stability under uncertain or variable conditions while respecting voltage/frequency constraints in networked microgrids [43,44]. In many instances, multi-level or bi-level coordination is used to distinguish local MG decisions from network-level oversight [9,28,45]. Such partitioning proves essential in complex multi-energy systems, where electric, thermal, and even hydrogen-based resources must be co-optimized [24,34].

2.3. Demand Response and Shared Energy Storage

The high integration of intermittent renewable energy sources, such as solar photovoltaics and wind, frequently leads to mismatches between supply and demand, especially in island or weak grid settings. Demand-side management and shared energy storage are two prominent solutions proposed in recent research to mitigate these imbalances [7,8,10,21]. Demand response (DR) programs allow end-users to adjust consumption profiles in response to real-time or day-ahead price signals, thereby increasing system flexibility [14,15,35]. Various models have embedded DR constraints to reduce peak loads and enhance the cost-effectiveness of multi-microgrid scheduling [17,32,46]. In particular, incentive-based DR shapes user participation through tariff adjustments and load prioritization, ensuring critical demands remain uninterrupted [8,47].
Energy storage is another vital tool for strengthening microgrid autonomy and resilience. Many investigations emphasize the role of shared or “centralized” energy storage assets to serve multiple MGs simultaneously [1,21,26,31]. Such a model distributes capital costs across stakeholders and can increase the utilization rate of the batteries or other storage devices [34,48]. Several works incorporate the concept of shared energy storage stations that manage the charging and discharging schedules in a coordinated way, using robust optimization [21], Stackelberg game frameworks [15], or multi-level scheduling [6]. The synergy between DR and energy storage is further underlined by research on battery sizing and operational constraints, highlighting how expanded local storage capacity enables advanced control schemes that flatten demand spikes [33,49,50]. However, achieving a cost-optimal balance between energy storage capacity and DR-based strategies remains a significant challenge, particularly for remote microgrid clusters [17,51].

2.4. Resilience-Focused Studies in Multi-Microgrid Environments

Resilience has become a central theme in networked microgrid research, with a growing emphasis on strategies that maintain reliable power supply during extreme events such as hurricanes, cyber-attacks, or natural disasters [2,11,28,41,52,53]. Approaches to resilience vary widely, from distributed robust voltage/frequency control [5,22,51] to the coordination of renewable sources and mobile electric vehicles for emergency support [54]. Several works define resilience quantitatively by measuring the ability to serve critical loads under adversarial conditions [28,38], while others propose reconfiguration strategies that isolate faulted segments and maintain supply to essential facilities [9,55].
Research on microgrid clusters under extreme scenarios focuses on line outages, energy storage operation, and flexible topological rearrangements [28,39]. Many studies highlight multi-stage optimization or multi-period operational planning, where a first layer deals with nominal conditions, and a second layer addresses abnormal events or worst-case failures [3,24,29,33]. Cyber-resilience also emerges as a critical theme, driven by the expanded use of communication networks in advanced microgrid controllers [22,52,53]. Here, robust or fault-tolerant control mechanisms attempt to secure power sharing among multiple MGs despite data corruption [2,42].
In island communities, resilience is paramount because external grid connections can be unreliable or may be entirely unavailable during severe disruptions. Consequently, the interplay of interlinked MGs, local generation, and flexible energy management becomes a vital research focus, especially for ensuring the continuous operation of critical loads [32,38,49]. The common thread across these works is that bridging local generation deficits with surplus resources from neighboring MGs can significantly shorten or even eliminate outages during disruptions [1,6,10].

2.5. Gaps in the Literature and Research Motivation

Although numerous studies have explored robust optimization, collaborative scheduling, and resilience in multi-microgrid clusters, several limitations remain that inform the scope of the present paper. First, many works assess performance primarily under normal operating conditions or simplified outage events, often without detailing how microgrids behave when actual power cables to the mainland are destroyed or offline for extended periods [1,30,35]. While some references propose robust dispatch strategies for line failures within local distributions [3,5], there is comparatively less attention to explicit, prolonged cable disruptions for island-based microgrids that rely heavily on mainland power [4,20].
Second, the dynamic interactions in networked microgrids are often captured by abstract optimization or power flow models but less frequently by agent-based simulations that reflect behavioral and operational complexities over time [14,27]. Few frameworks integrate agent-based tools with established energy system software (e.g., HOMER Pro(3.18.3)) to provide a holistic assessment of system performance under emergent conditions [10,33]. Third, although many authors examine the effects of demand response, the role of multi-hour or multi-day disruptions and the availability of battery storage is not always explicitly addressed in a real-time context [7,21].
Finally, certain resilience strategies rely on large-scale energy storage or expensive infrastructure expansions, which may not be feasible for small island communities with limited financial resources [6,31]. This underscores the practical importance of exploring microgrid clustering as a means to share resources cost-effectively while guaranteeing critical load supply under disaster scenarios. The present study aims to fill these gaps by proposing a comprehensive simulation–optimization framework capable of analyzing both the normal and extreme states of island-based microgrids when mainland cable disruptions occur.

2.6. Summary and Literature Comparison

Table 1 provides a summary of selected representative works that emphasize robust scheduling, shared energy storage, demand response, and resilience in multi-microgrid clusters. Each reference is contextualized according to its main research objectives, methodological approaches, and key findings.
Table 2 highlights key comparative features across these publications, focusing on whether the studies address prolonged grid disconnections, the scope of resilience strategies (e.g., robust vs. stochastic vs. game-theoretic), and whether they integrate agent-based or real-time simulation methods.
The references converge on the necessity for coordinated operations, robust or stochastic optimization, and advanced control systems to manage the unpredictability of renewable energy and demand. Nevertheless, most focus either on grid-tied scenarios or on less critical outages within localized feeders, stopping short of addressing long-term disconnections relevant to small, remote islands. Moreover, although some studies blend advanced control with simulation to capture microgrid dynamics, the direct integration of agent-based approaches with established optimization software is seldom addressed in detail.

3. Methodological Framework for Resilient Networked Microgrids: Simulation, Optimization, and Operational Strategies

This section provides a comprehensive methodological framework for assessing and enhancing the resilience of networked microgrids in island communities. The approach integrates agent-based simulation and energy systems optimization to capture local production, consumption, and inter-island energy exchange under emergency scenarios. The methodology is divided into multiple sub-sections to ensure clarity and depth, reflecting the sequential phases from data gathering to final analysis. Where relevant, additional references from prior studies on robust multi-microgrid scheduling and resilience are incorporated.

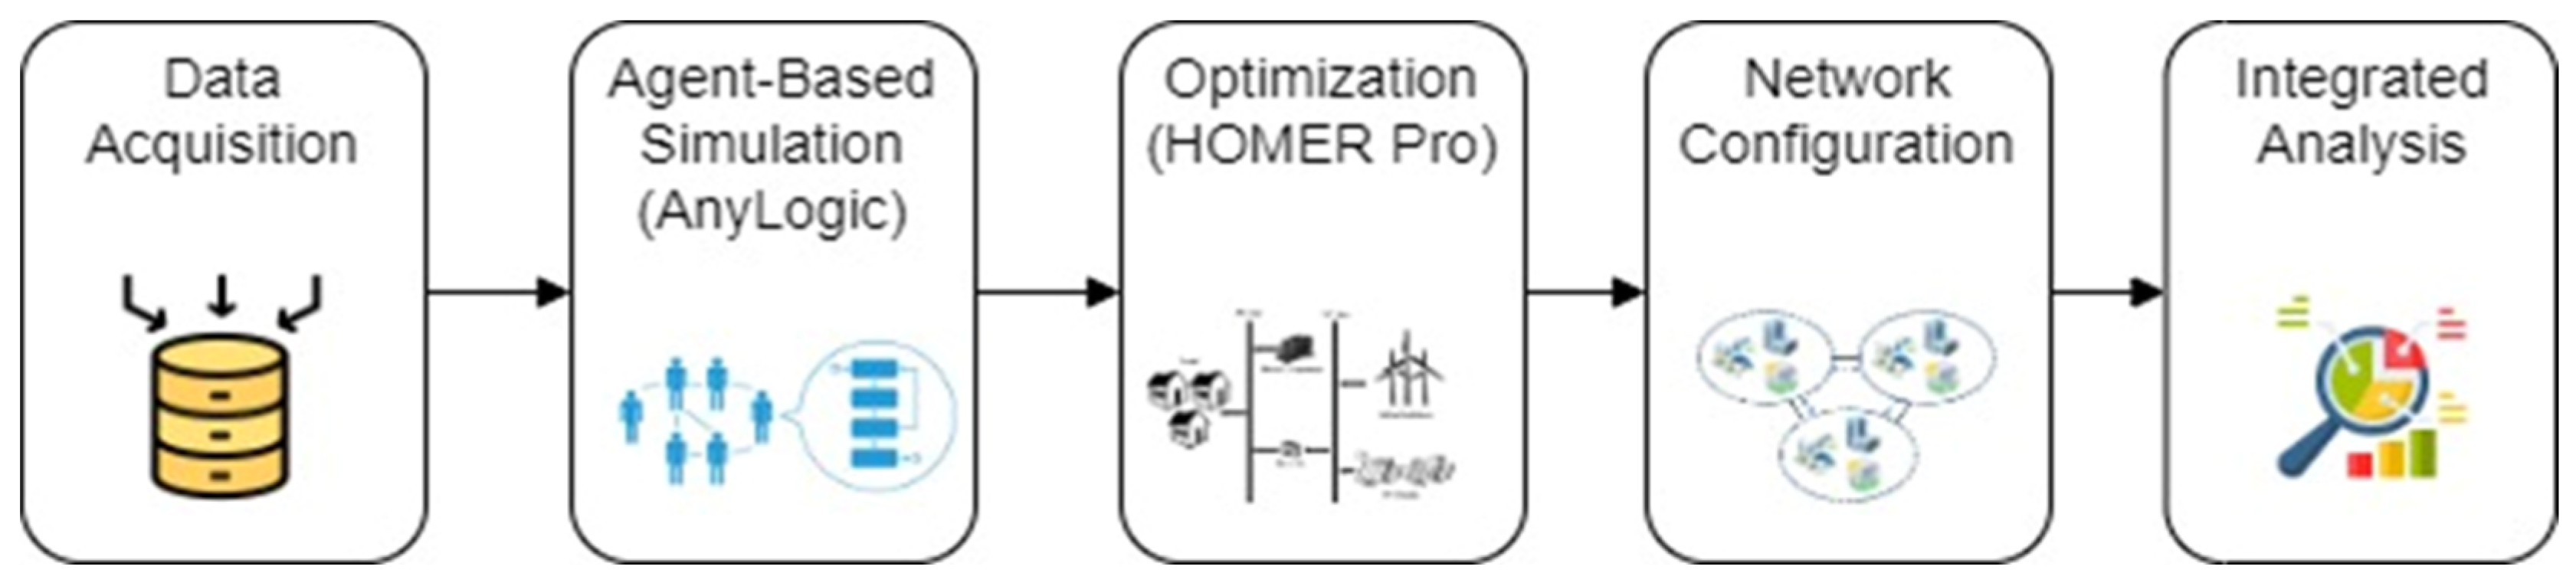
3.1. Overview of the Methodological Approach

The framework combines simulation and optimization tools to replicate the behavior of isolated and networked microgrid systems during a mainland cable disruption. The methodology is structured into distinct phases, namely data acquisition and preprocessing, agent-based simulation using AnyLogic, renewable energy optimization with HOMER Pro, and the modeling of networked microgrid configurations. By linking these phases, the study evaluates both the technical performance and economic feasibility of multiple operational strategies. This approach supports the main research objective of reinforcing energy security through resilient networked microgrid setups. Similar hybrid methodologies—where agent-based models are coupled with optimization or robust dispatch tools—have been proposed in related work to capture emergent phenomena in real time while ensuring global cost minimization [1,2,7].
Numerous methods are available for microgrid modeling, such as steady-state power flow, time-series load forecasting, and agent-based simulations. Traditional power flow tools have strengths in detailed electrical analysis but often cannot fully represent real-time decision-making or inter-agent interactions during emergencies [10]. Statistical load prediction methods are useful for demand forecasting but lack the ability to capture the adaptive behaviors of individual system actors under stressful conditions [14]. In contrast, agent-based simulation makes it possible to model the heterogeneity of local producers and consumers (prosumers) and how they respond to dynamic triggers such as cable outages or resource shortfalls [22,47]. Renewable energy expansion and battery storage sizing, conversely, require a comprehensive optimization perspective; hence, HOMER Pro was selected for its capability to model hybrid systems while balancing technical feasibility and economic metrics [10,24,35]. The integrated framework ensures that detailed, emergent agent behaviors and global system optimization are co-represented in one methodological pipeline.
Figure 1 illustrates a simplified flowchart of the methodological framework. The process begins with data acquisition and demand profiling, including symbolic regression to generate time-varying load curves. These inputs are used in parallel by the agent-based simulation in AnyLogic and the techno-economic optimization in HOMER Pro. The outputs guide network configuration and scenario analysis, ultimately yielding resilience performance metrics such as unmet demand and surplus generation under best- and worst-case disruption conditions.

3.2. Detailed Methodological Implementation

3.2.1. Data Acquisition and Preprocessing

Accurate representation of electricity demand and existing generation capacity is critical for both the simulation and optimization phases of this study. This section describes how raw population and energy data were collected, processed, and categorized into residential, commercial, and industrial demands. The final result is a set of refined hourly load profiles for each island microgrid, reflecting realistic daily and seasonal variations. Several works on remote microgrids emphasize the necessity of such tailored load profiles to ensure robust capacity planning and operational scheduling [1,3,14,40]. The subsections below detail the data collection methodologies, the symbolic regression-based modeling of demand fluctuations, and the sector-specific breakdown.

Demand Data Gathering and Baseline Capacities

The research team obtained population statistics, baseline electricity consumption figures, and generation capacities from provincial and local utility reports. These figures were then scaled to align with the unique geographic and demographic attributes of each island, similar to techniques employed in other studies on islanded energy systems [2,17,27]. The baseline data included the total annual electricity consumption in kWh per person, often referred to as Pbase.
In parallel, installed generation capacities were identified from regional sources to account for existing diesel generators and any available renewable resources. As indicated in similar rural electrification assessments, scaling these broader provincial data to specific islands ensures that subsequent simulations and optimizations reflect localized constraints and opportunities [21,30]. Once the initial datasets were collected, an iterative cleaning and validation process checked for internal consistency, such as matching population growth estimates to the reported annual load growth.

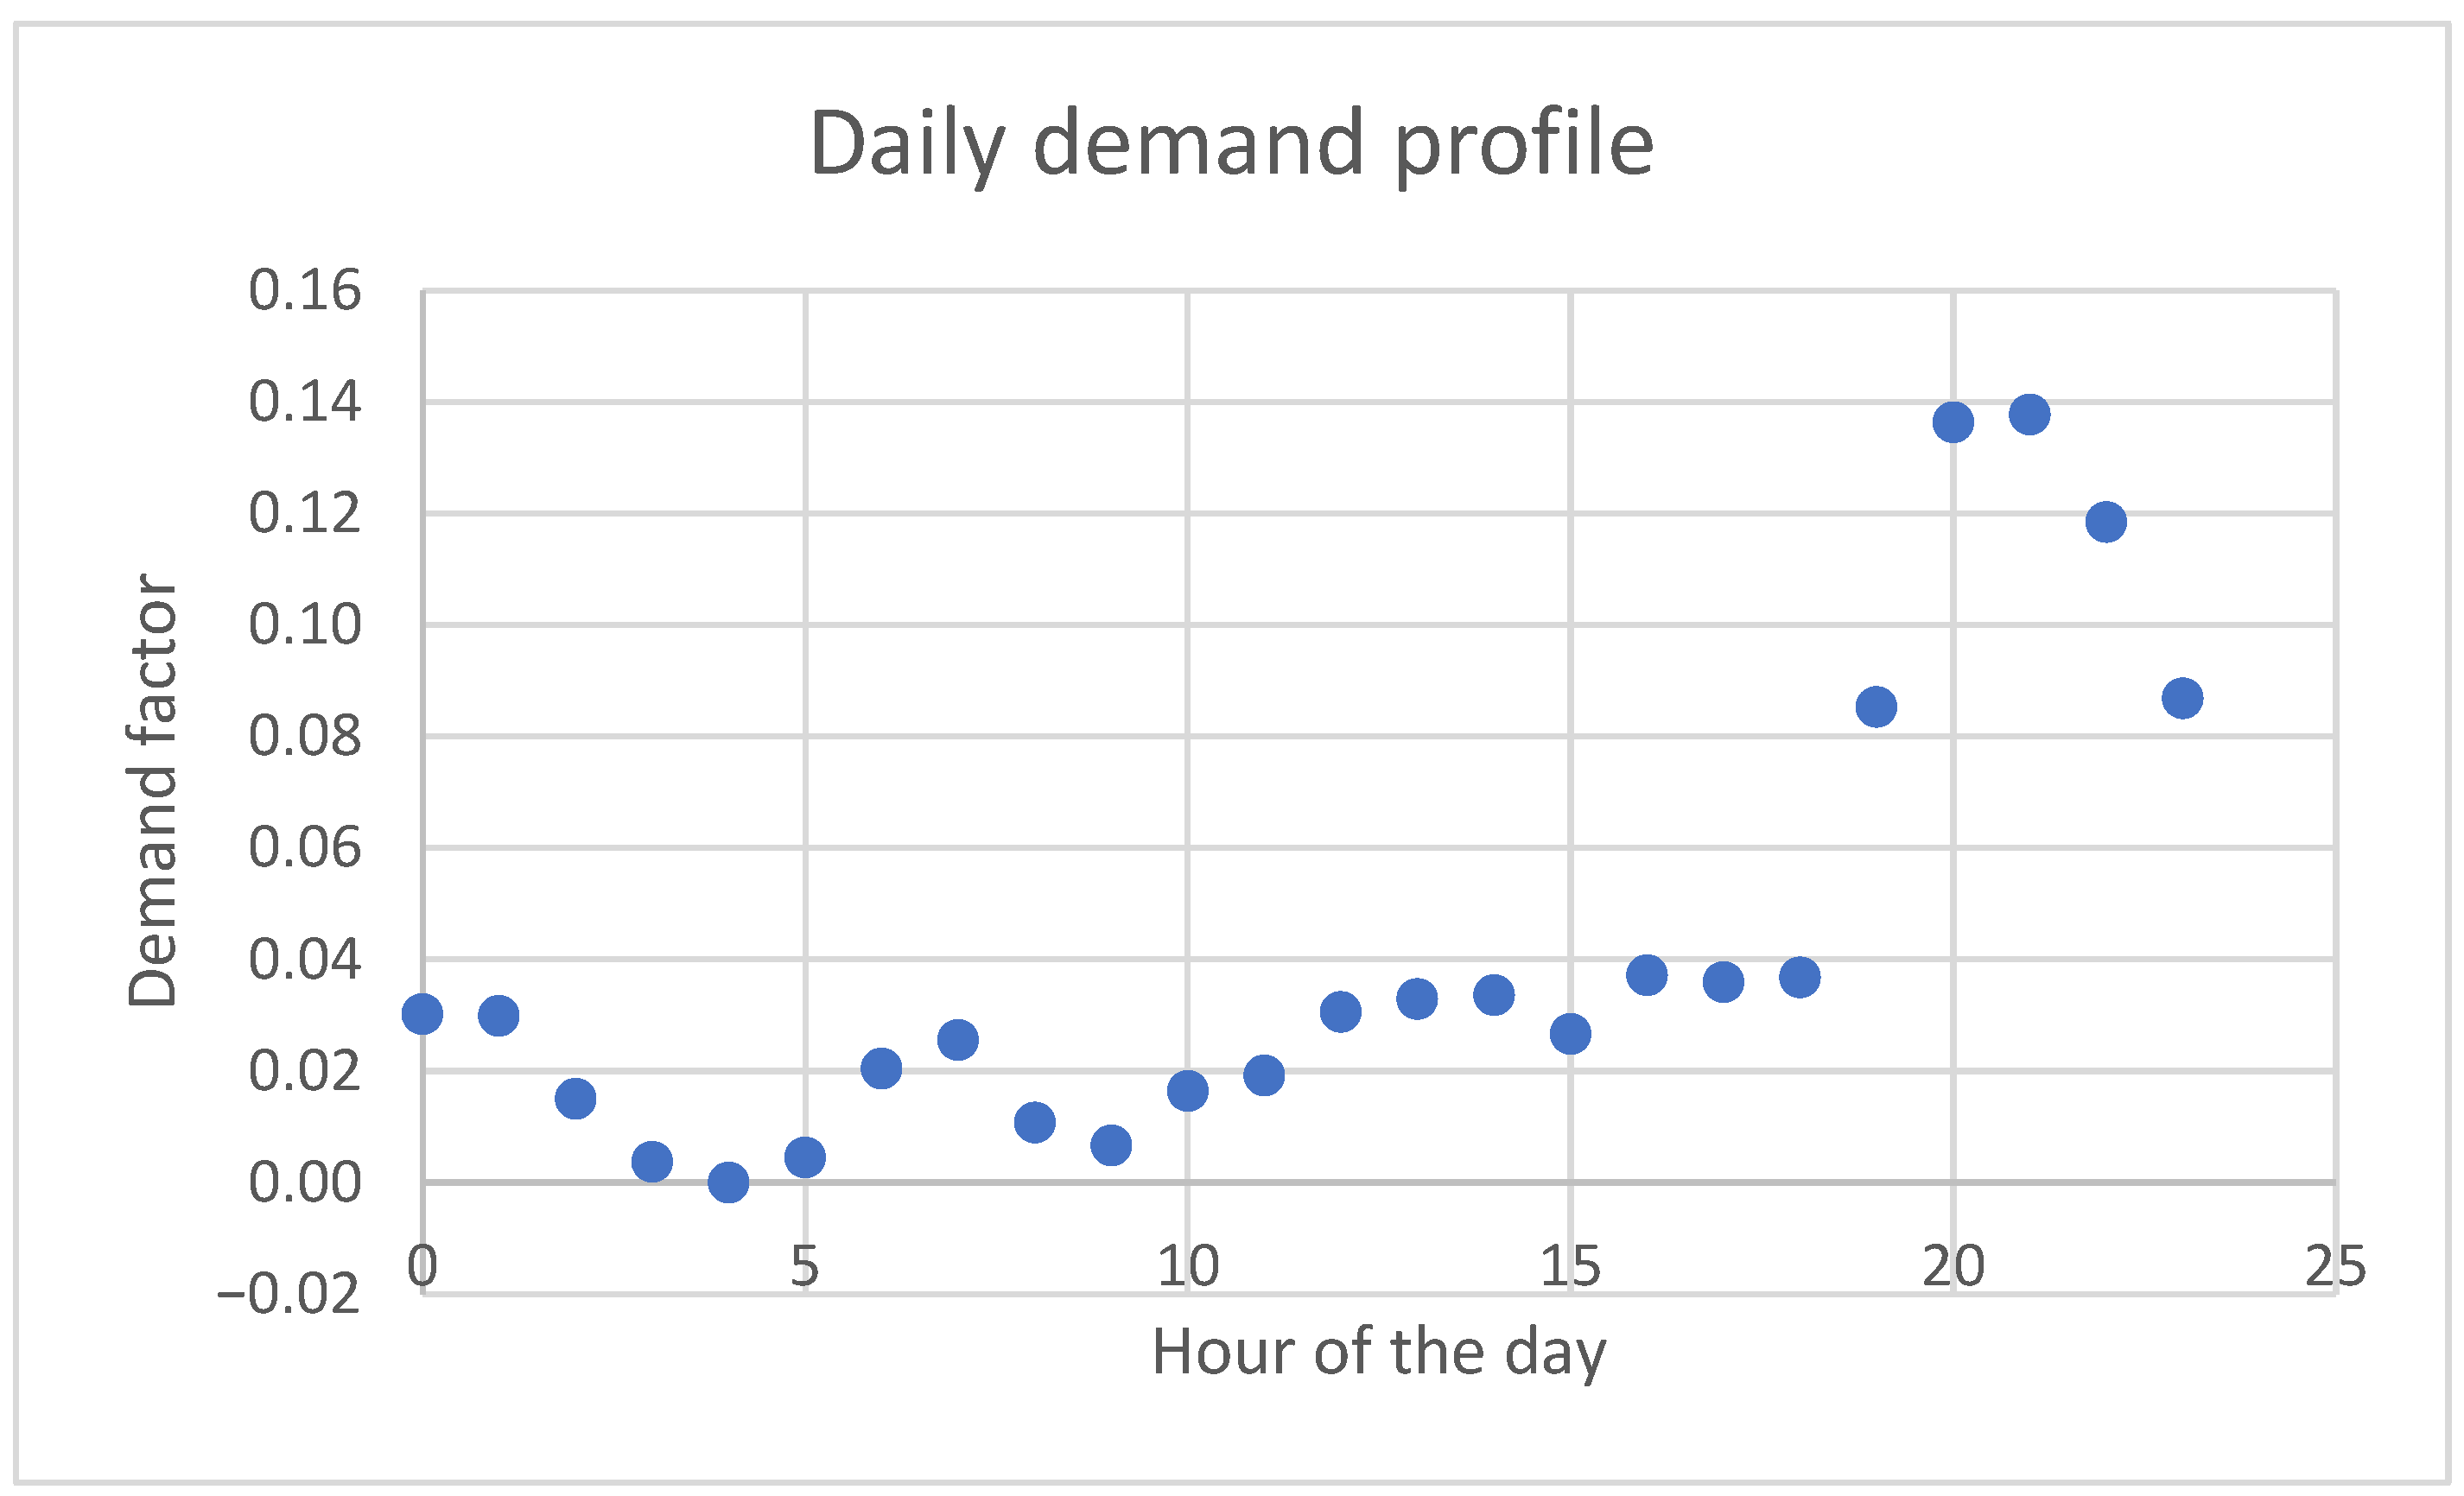
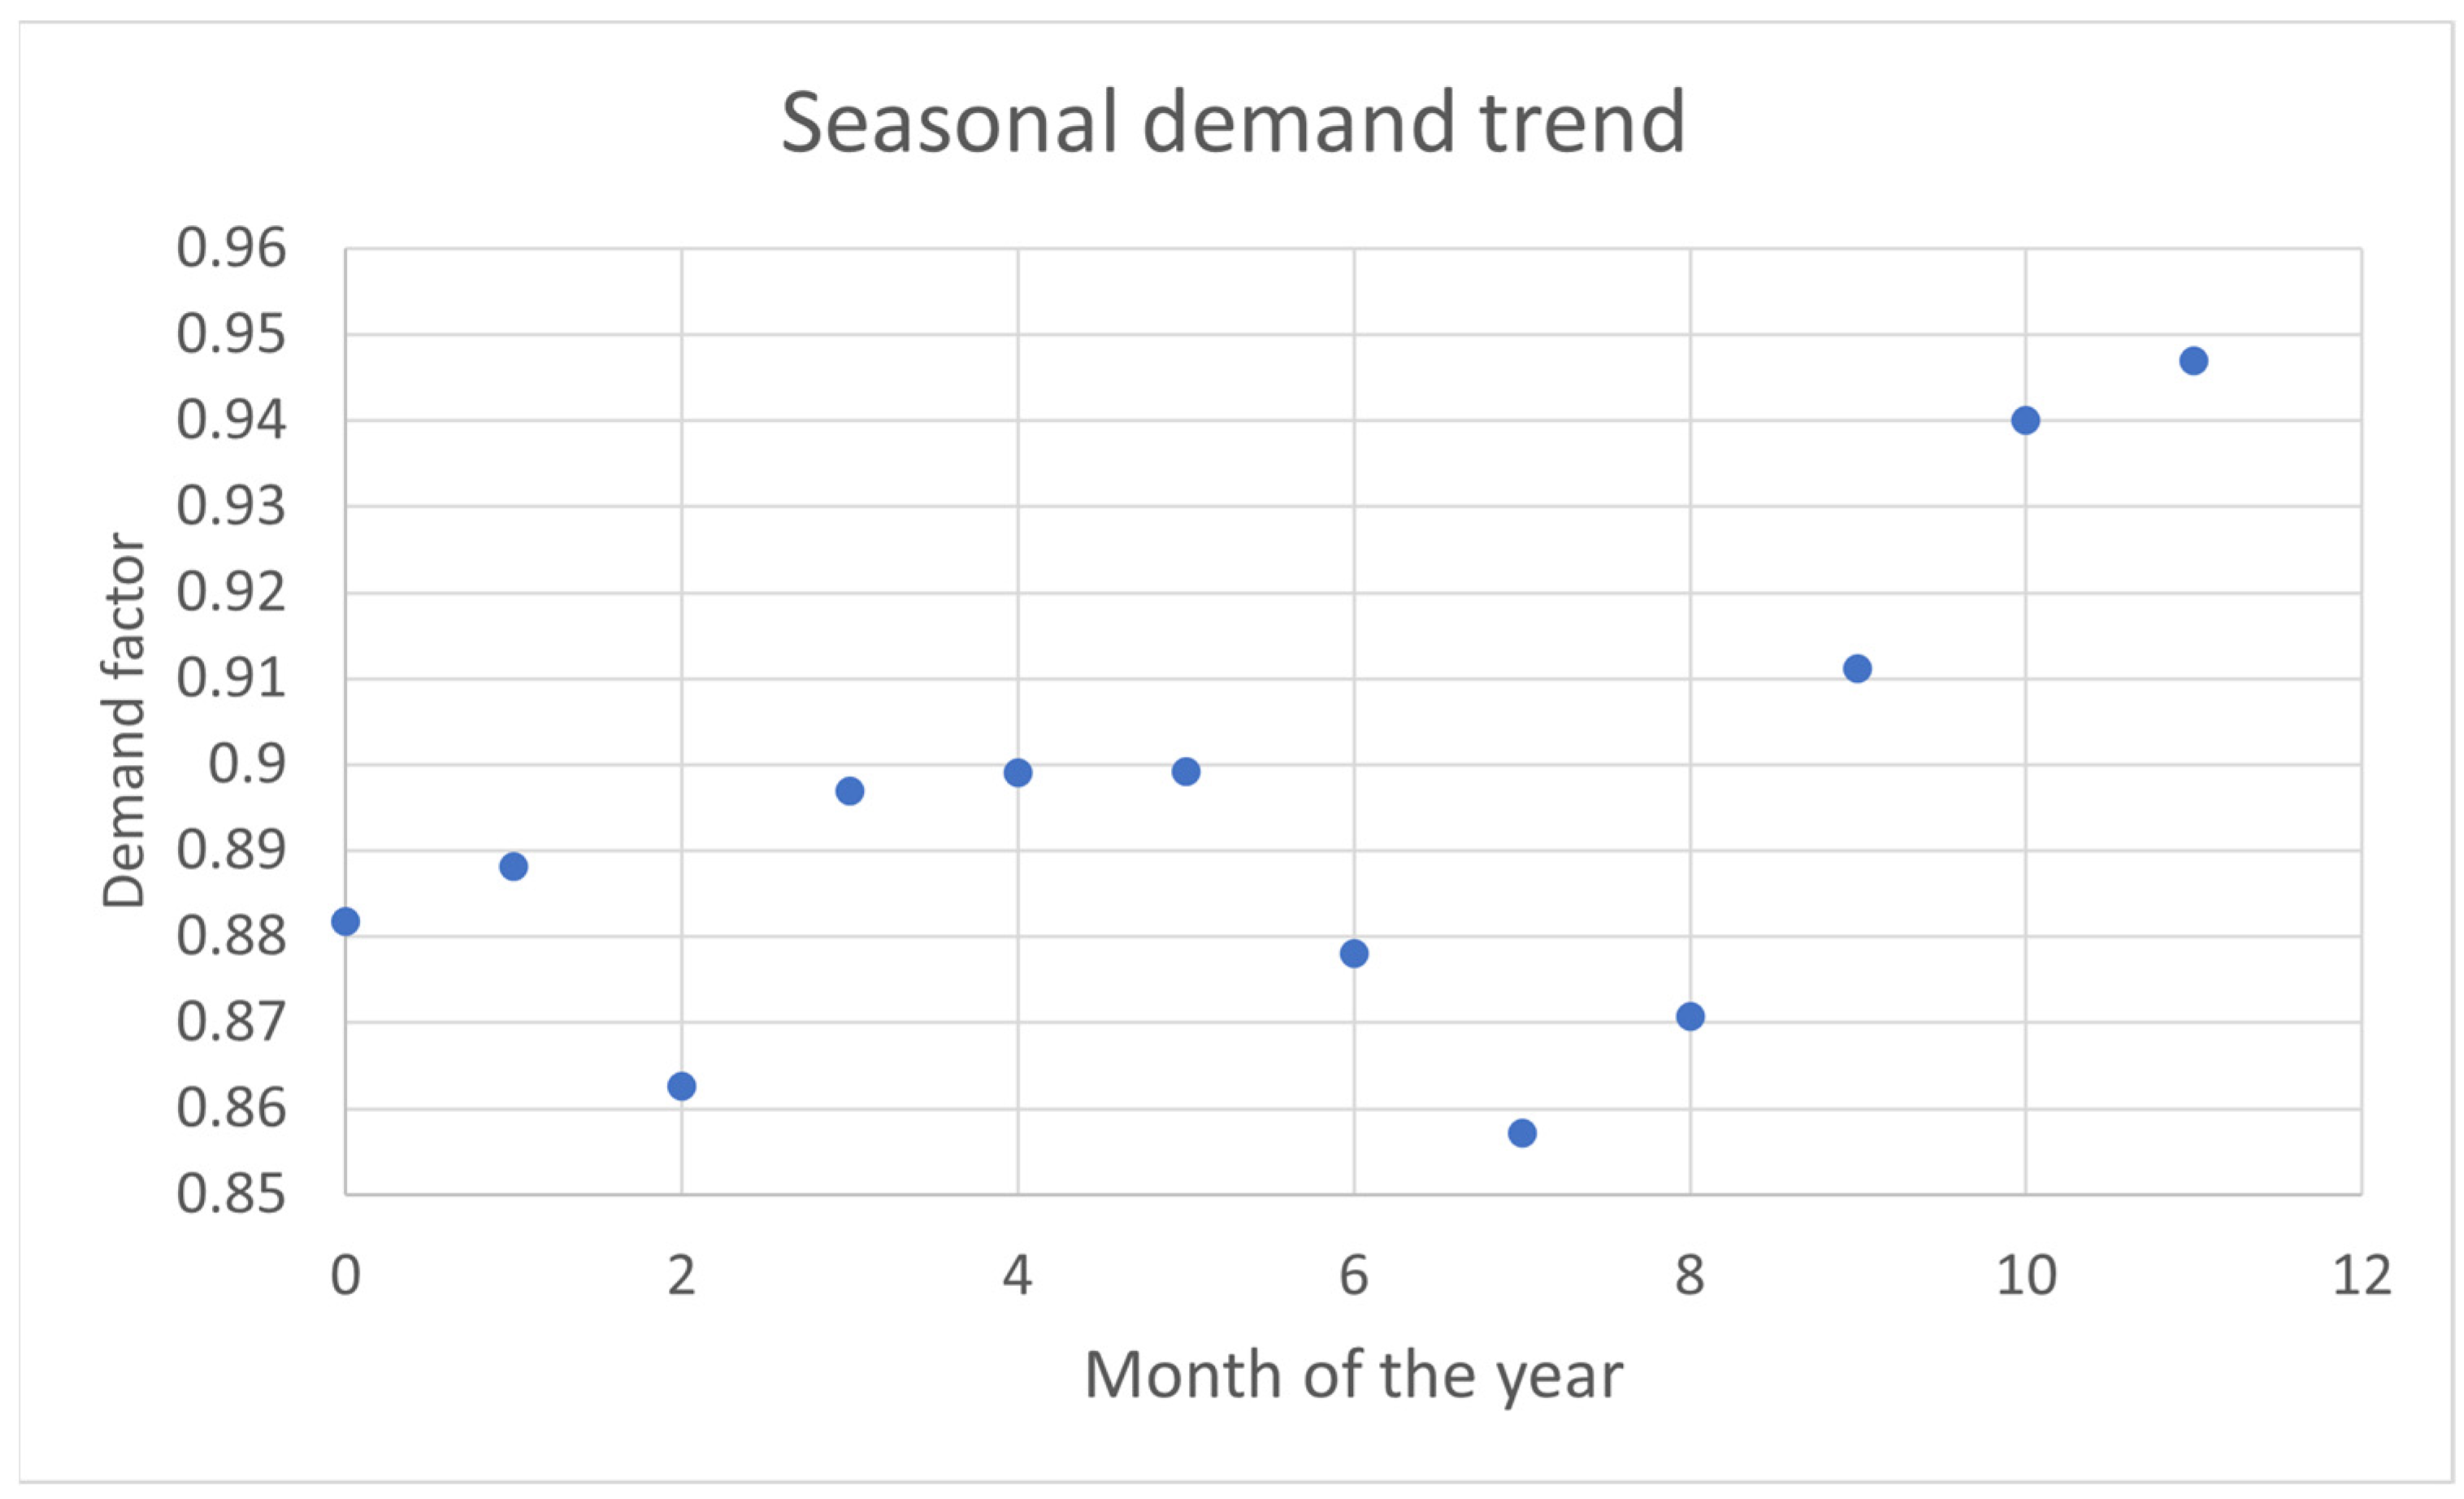
Symbolic Regression for Daily and Seasonal Demand Variations

To capture the dynamic nature of load profiles, the study employed symbolic regression to derive two distinct functions: one modeling daily consumption patterns and another capturing broader seasonal or long-term trends. Equation (1) encapsulates the daily factor fdaily.h as a function of the hour of the day, h:
f d a i l y . h = 0.0002069134432512164 ( ( c o s ( h ) ( 4.40962543108239 ( 1.671513834533342 + h ) )   56.35705570776371 + a b s ( ( h 11.54785004093264 ) ( 11.20245260761041   + 1.128090790368849 h ) ) ) ( c o s ( 0.9360739440901147 ( 0.5891541106654462   + h ) ) + 0.5754413858676333 ) + ( 29.4579531935614 t a n ( h 0.9854594746652385 )   + ( h ( 6.660383604492377 + h ) ) ) )
Figure 2 illustrates this function’s shape over 24 h, revealing higher usage during morning and evening peaks with a midday plateau in certain regions. The exact function originates from best-fit symbolic regression algorithms that systematically explore potential functional forms, a practice increasingly adopted in microgrid demand modeling to accommodate nonlinearities [3,22,48]. This profile applies and repeats every day of the year.
Seasonal load changes, denoted ftrend.m,y, are derived as a function of month m and year y. Equation (2) provides the final expression:
f t r e n d . m , y = 0.6154838398677742 + ( ( 0.003959457917872473 ( 8.946137054575674 / c o s ( ( ( y 2015 )   12 ) ) ) + ( ( ( y 2015 ) 12 + m ) m c o s ( 0.8599269629643008   m ) ) ) / ( 235.1962758077345 ( ( m 4.139499605763164 ) ( t a n ( m   ( 1.570101441677719 + ( ( y 2015 ) 12 + m ) ) ) 2.547108606991488 c o s ( ( ( y   2015 ) 12 + m ) / ( 0.006681551363314628 ) ) 1.679908999755826 ) ) ) )
Figure 3 depicts this seasonal variation, reflecting higher or lower demand months likely tied to climate, tourism, or agricultural cycles. These refined functions enable the simulation framework to incorporate both diurnal and inter-month fluctuations, an approach consistent with data-driven microgrid analyses in other isolated communities [23,34,41]. Note that the variation corresponds to the year 2020, i.e., y = 2020 in Equation (2).

Sector-Based Load Breakdown

After determining the overall demand curve, the total load at any hour is subdivided among three key sectors: residential, commercial, and industrial. Many studies have noted that island-based communities feature varied energy consumption profiles that depend on local socio-economic conditions [7,29,32]. However, sector-specific data for the case study regions is often limited. Consequently, the methodology employs national-level distributions of electricity consumption as an approximation, consistent with prior microgrid planning approaches for developing regions [1,9,35].
Residential demand constitutes 49.83% of the total load, commercial (including business, social services, and government buildings) makes up 28.64%, and industrial demand accounts for the remaining 21.53%. Equation (3) defines the final load Pi,m,y,h,t for sector t at island i during year y, month m, and hour h:
P i , m , y , h , t = P b a s e 365 d a y y r 24 h d a y N p o p . i ( f t r e n d . m , y + f d a i l y . h ) D S t
Here, Pbase is the annual per capita consumption, Npop.i is the population of island i, and DSt is the demand share of sector t. This breakdown method ensures that each hour’s total load is apportioned among sectors proportionally, maintaining internal consistency and comparability across diverse islands.
By applying Equations (1)–(3), the preprocessing phase yields time-series load data that reflect local demographic scales, daily patterns, and annual trends. These data are then fed into the simulation (AnyLogic) and optimization (HOMER Pro) modules. Extensive prior research has validated the importance of robust load characterization for realistic microgrid modeling, particularly under conditions of high renewable penetration or limited grid support [2,17,31]. The methodology thus lays a strong foundation for subsequent analyses of resilience, economics, and system-level performance.

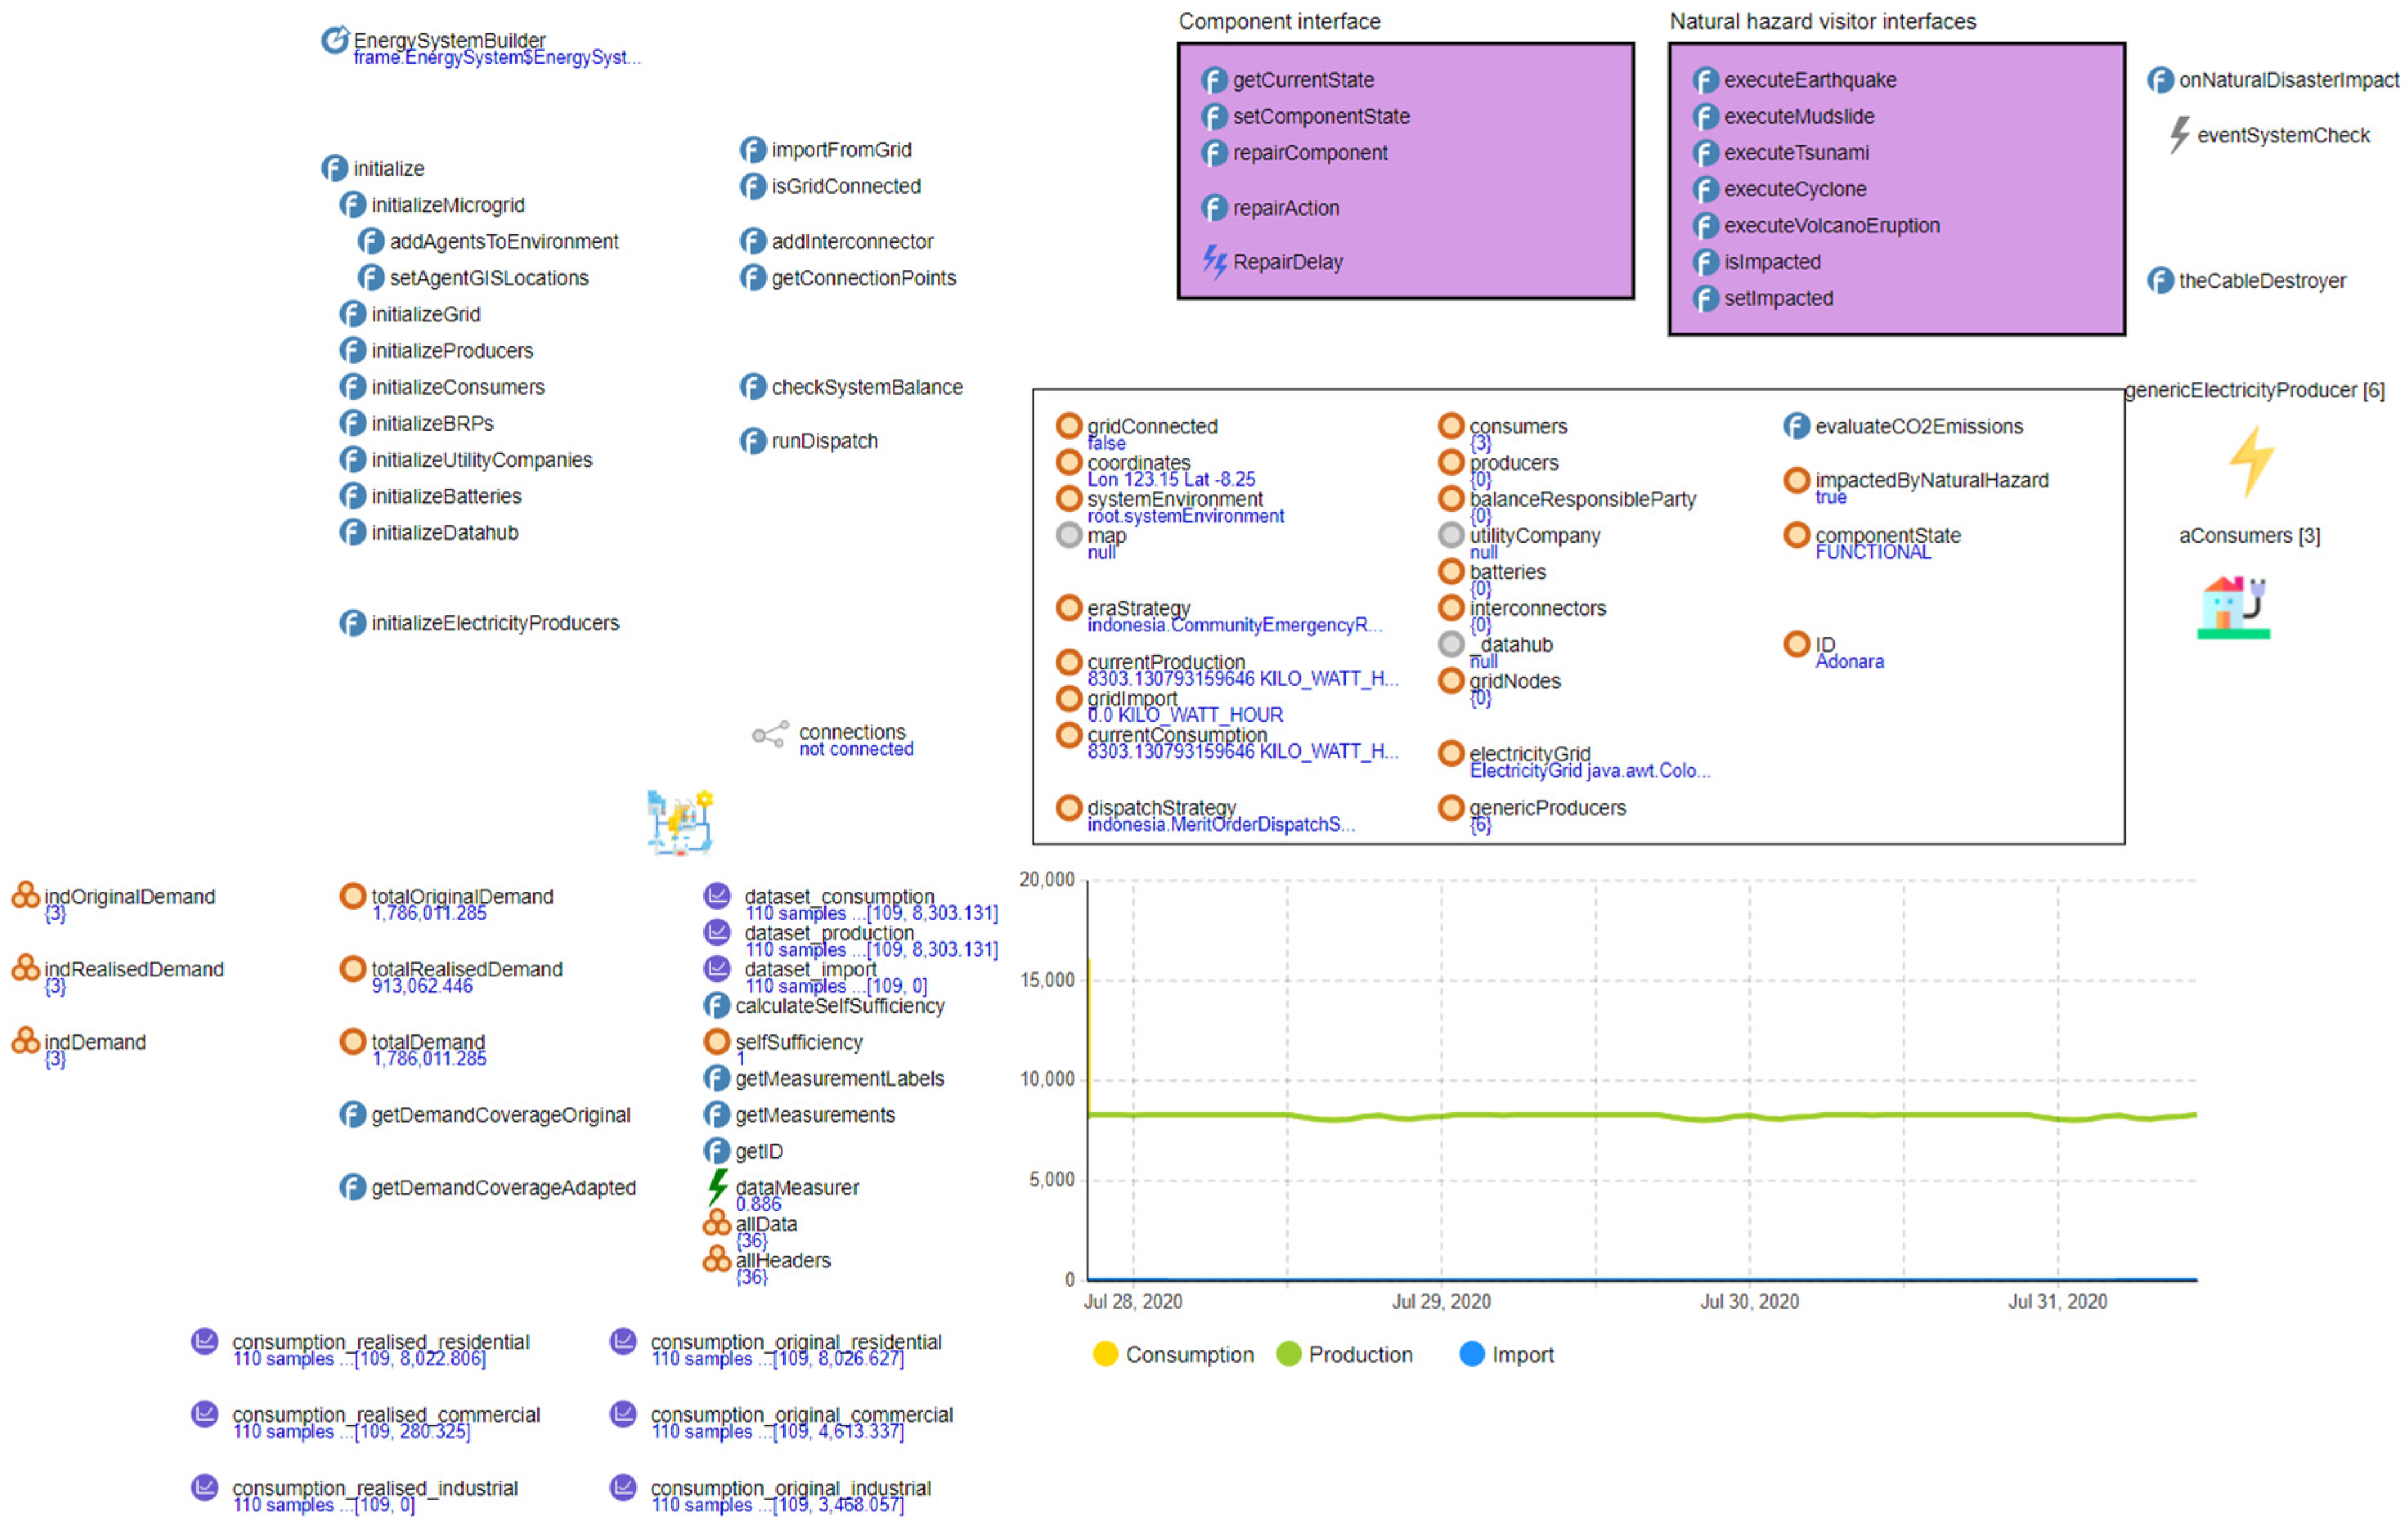
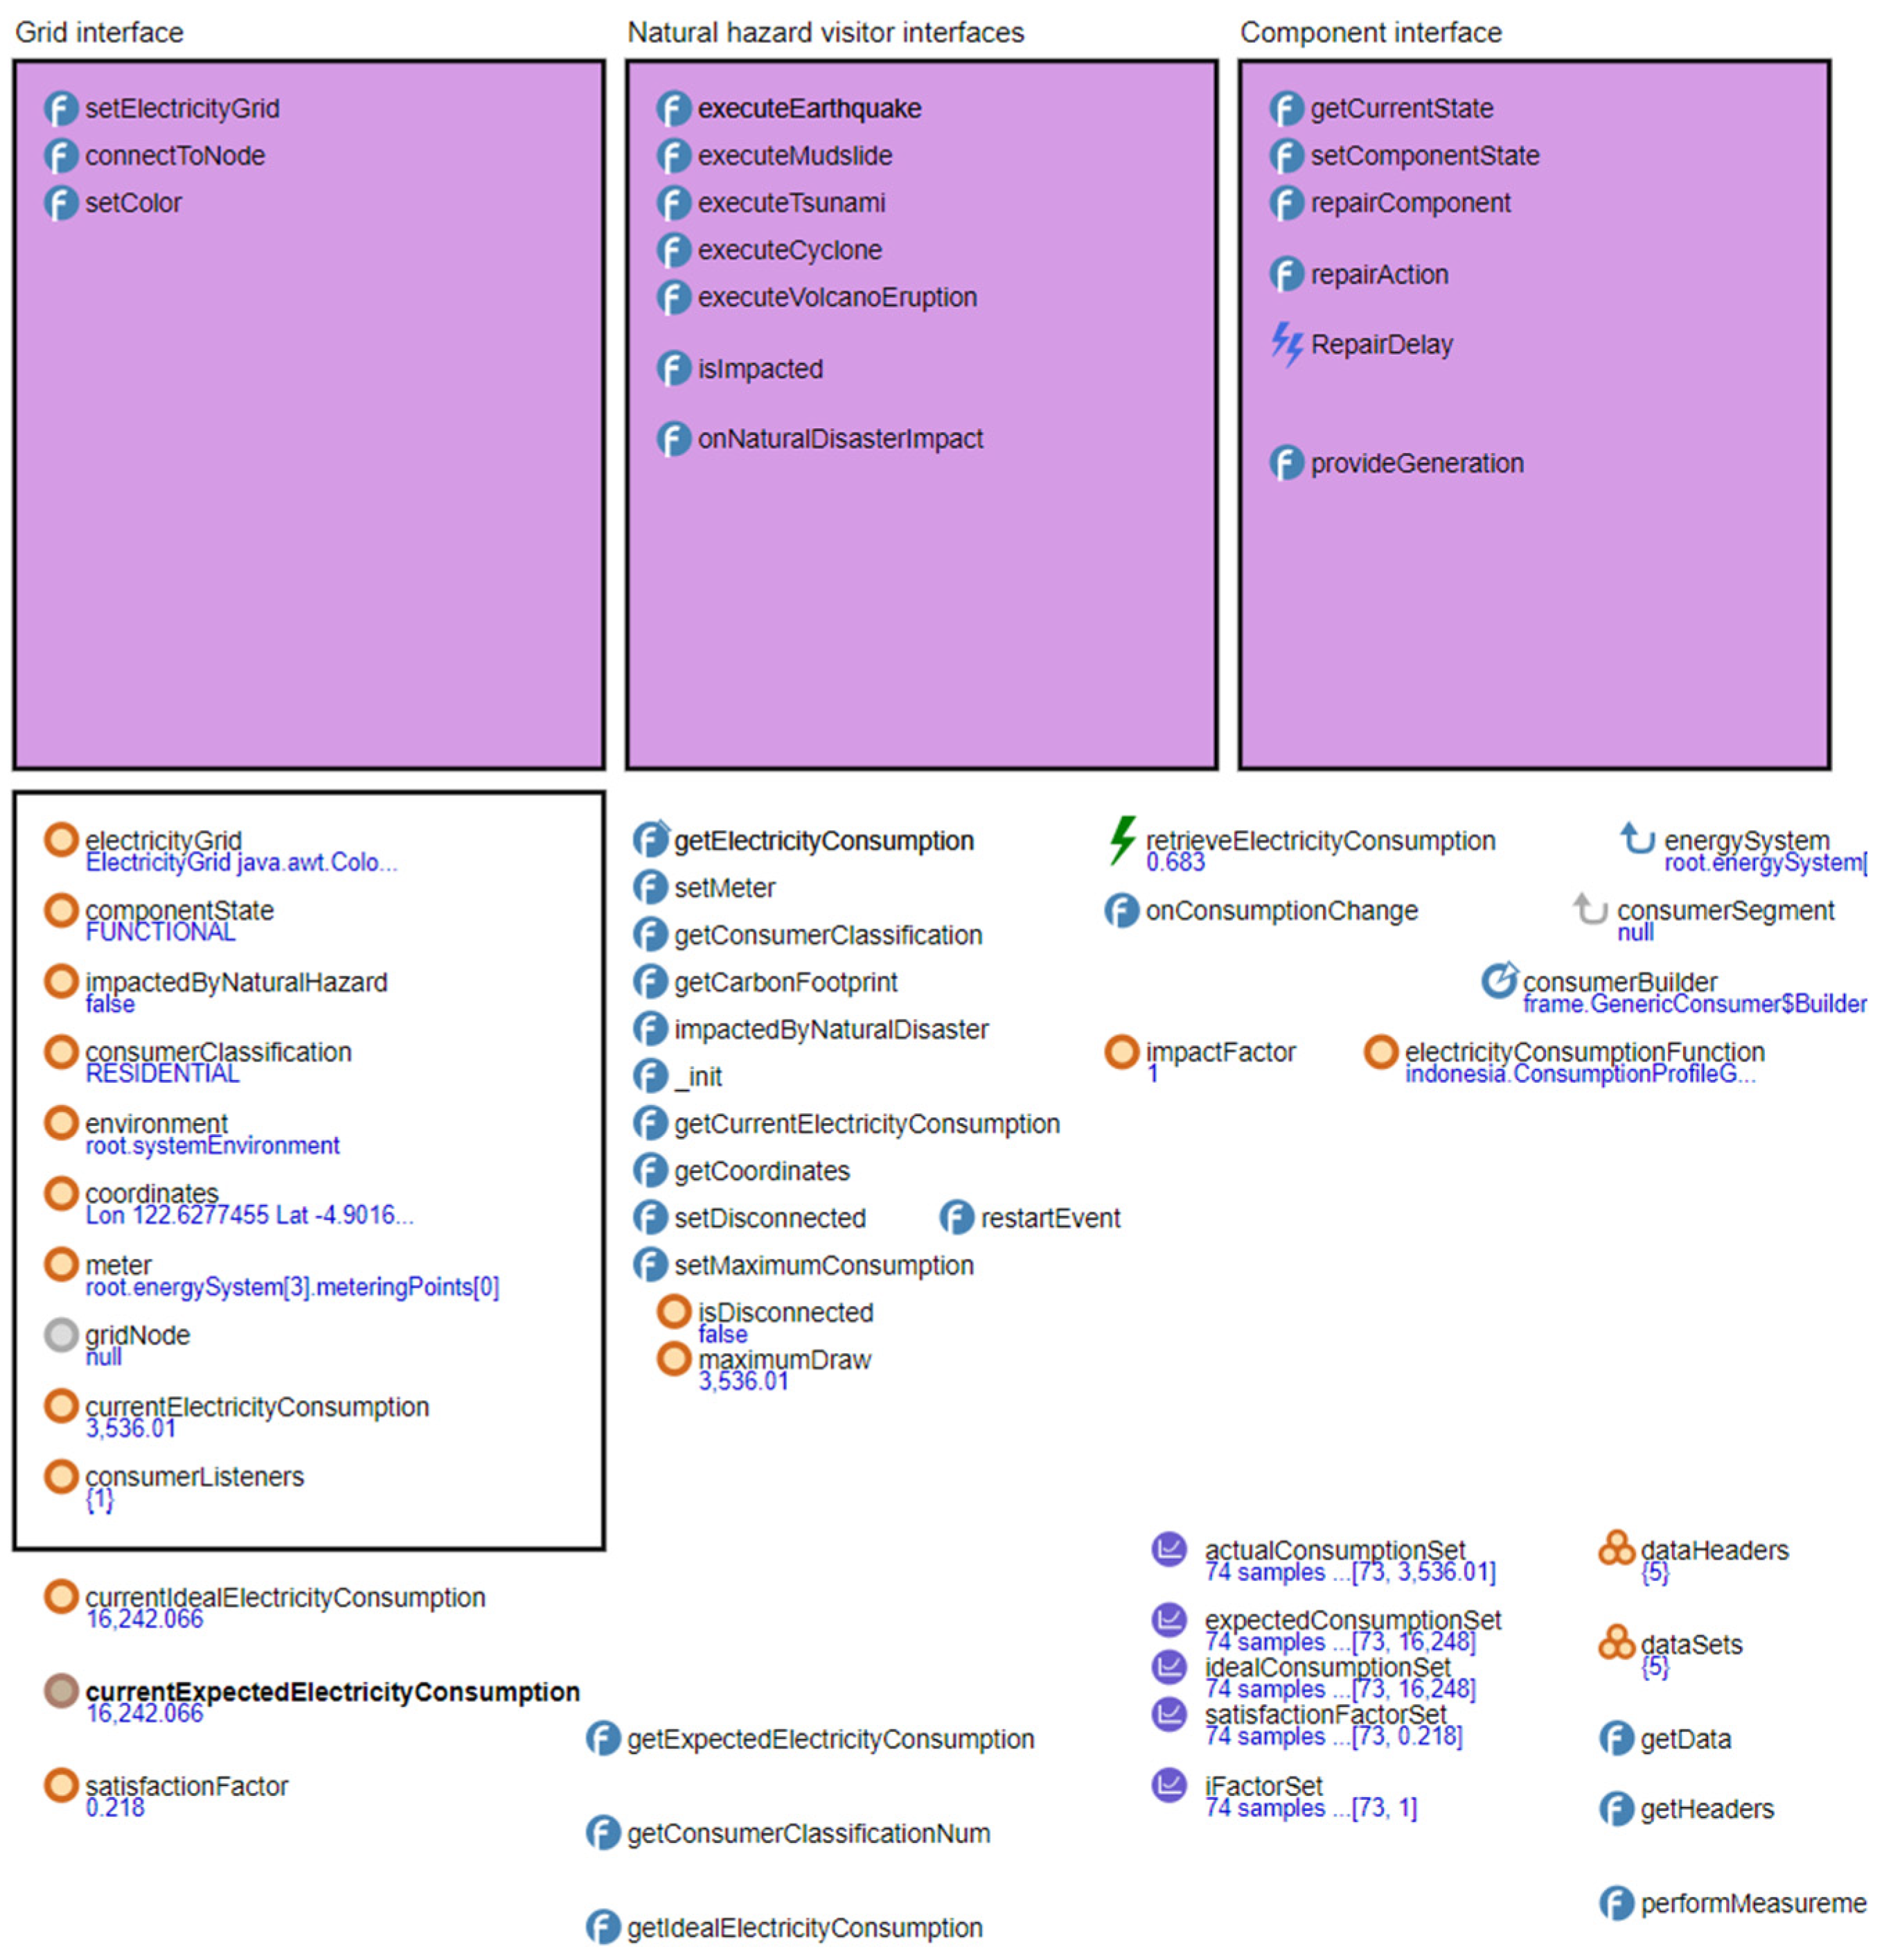
3.2.2. Agent-Based Simulation Using AnyLogic

Once the demand and resource data are prepared, the agent-based simulation module in AnyLogic is employed to represent each island microgrid. The model defines critical entities, namely the system environment, energy system, energy producer, and energy consumer. Figure 4 shows the schematic of the Energy System agent, which encapsulates both energy production and consumption in real time.
During each simulation run, the agent-based environment manages generation dispatch, prioritizes load categories, and captures emergent system behaviors under a cable outage lasting one week (a typical post-disaster recovery interval reported for remote islands [32,38]). This approach allows the detection of time-varying phenomena such as ramping issues, fast depletion of storage, and any resource-sharing policies, aligning with prior agent-based frameworks in the microgrid literature [22,46]. The simulation also enforces a merit-order dispatch mechanism, ensuring residential demand is served first, followed by commercial loads, and then industrial loads if resources remain available.
Figure 4 provides a view of the energy system agent type, which contains separate populations of producer agents (Figure 5) and consumer agents (Figure 6). Producer agents may rely on diesel generators, photovoltaic systems, or other distributed generators. Subclasses of producers exist for technologies subject to intermittent availability (e.g., solar), consistent with prior agent-based microgrid studies that employ inheritance-based modeling. Consumer agents are categorized by a consumer classification parameter, thereby implementing the priority-based load curtailment strategy.

3.2.3. Optimization of Renewable Generation and Storage with HOMER Pro

In parallel with agent-based simulation, the HOMER Pro platform is employed to ascertain the optimal sizing and operational schedules for PV and battery storage systems. The objective is to ensure that microgrids can sustain critical loads during mainland cable disruptions, which aligns with findings emphasizing robust battery capacity sizing in uncertain or islanded scenarios [1,26,31].
HOMER Pro simulates numerous configurations of distributed energy resources and calculates Net Present Cost (NPC), Levelized Cost of Energy (LCOE), Renewable Fraction, and Battery Autonomy for each design. The chosen PV module is a generic flat-plate PV, and the selected storage device is a generic 1 kWh lead acid battery, which has been validated in earlier microgrid optimization studies [10]. Figure 7 (HOMER Pro Output) provides an example of the recommended capacities for PV arrays and batteries in a particular island system.
The optimization aims to guarantee reliable supply for top-priority (residential) loads under worst-case disruption conditions. Typical performance parameters include a DC operating efficiency of 95% for PV modules and a round-trip efficiency of around 80% for lead–acid batteries. By simulating different project lifespans, load profiles, and local solar irradiation data, HOMER Pro identifies economically viable designs that also maintain robust supply for emergencies [30,34]. The selected capacities from HOMER Pro are subsequently integrated into the AnyLogic simulation to analyze real-time energy dispatch outcomes under both normal and disrupted states.

3.2.4. Network Microgrid Configuration and Operational Strategies

This subsection describes how individual microgrids can be interconnected to form a networked configuration, allowing surplus power in one microgrid to offset deficits in another. In this study, the assumption of unlimited interconnection capacity between proximate islands is employed to highlight the potential advantages of resource sharing. Several research efforts have shown that interconnecting microgrids with high renewable penetration can reduce overall operational costs, improve resiliency, and effectively manage uncertainties related to renewable output [2,7,9,29]. Figure 8 illustrates the schematic of this networked layout, where multiple microgrids can trade power under normal and emergency conditions.

Local Renewable Generation and Storage Expansion

One pivotal strategy for enhancing islanded microgrids is to increase local power generation capacity. PV systems are widely recognized as suitable for tropical island communities due to abundant solar resources, low land-use constraints, and fuel independence [1,3,27]. However, PV output is inherently variable and confined to daylight hours. To maintain continuity of supply, grid-scale battery storage is integrated to store surplus solar power during the day for nighttime use, stabilize short-term output fluctuations, and serve as a backup during system failures [7,37].
The HOMER Pro optimization engine identifies optimal PV and battery capacities by simulating different configurations to minimize NPC and LCOE. The resulting system parameters, including recommended kW of PV and kWh of storage, are transferred to the AnyLogic simulation platform. This approach ensures that the microgrids can fully meet critical (residential) loads during a simulated mainland cable disruption. Prior studies have demonstrated that right-sizing local generation and storage can reduce unmet demand and diesel consumption, particularly in remote regions with limited backup options [14,21,50].
Equation (4) below provides a simplified representation of the daily state-of-charge (SOC) balance in the storage system, where ESOC.t represents the stored energy at time t. The terms Pcharge.t and Pdischarge.t denote the charging and discharging power flows, and η is the round-trip efficiency of the battery. Although HOMER Pro handles these calculations internally, such an equation clarifies the inherent trade-off between daytime charging and nighttime usage:
E S O C . t = E S O C . t 1 + η · P c h a r g e . t ( P d i s c h a r g e . t η )
This storage dynamic is critical for assessing how effectively the system can leverage PV generation to cover evening and peak loads. By ensuring that essential residential demand is given top priority, the optimization framework safeguards basic services under the wide range of conditions simulated in AnyLogic [10,23,49].
While Section Local Renewable Generation and Storage Expansion describes the approach to sizing additional PV and battery capacity, the quantitative assessment of how these expansions enhance resilience is presented in Section 6.2.3. Figures 15–18 illustrate the time-series load balancing under worst- and best-case weeks with expanded capacity, and Table 11 reports the corresponding unmet-demand reductions for critical loads, directly demonstrating the resilience gains from PV + storage deployment.

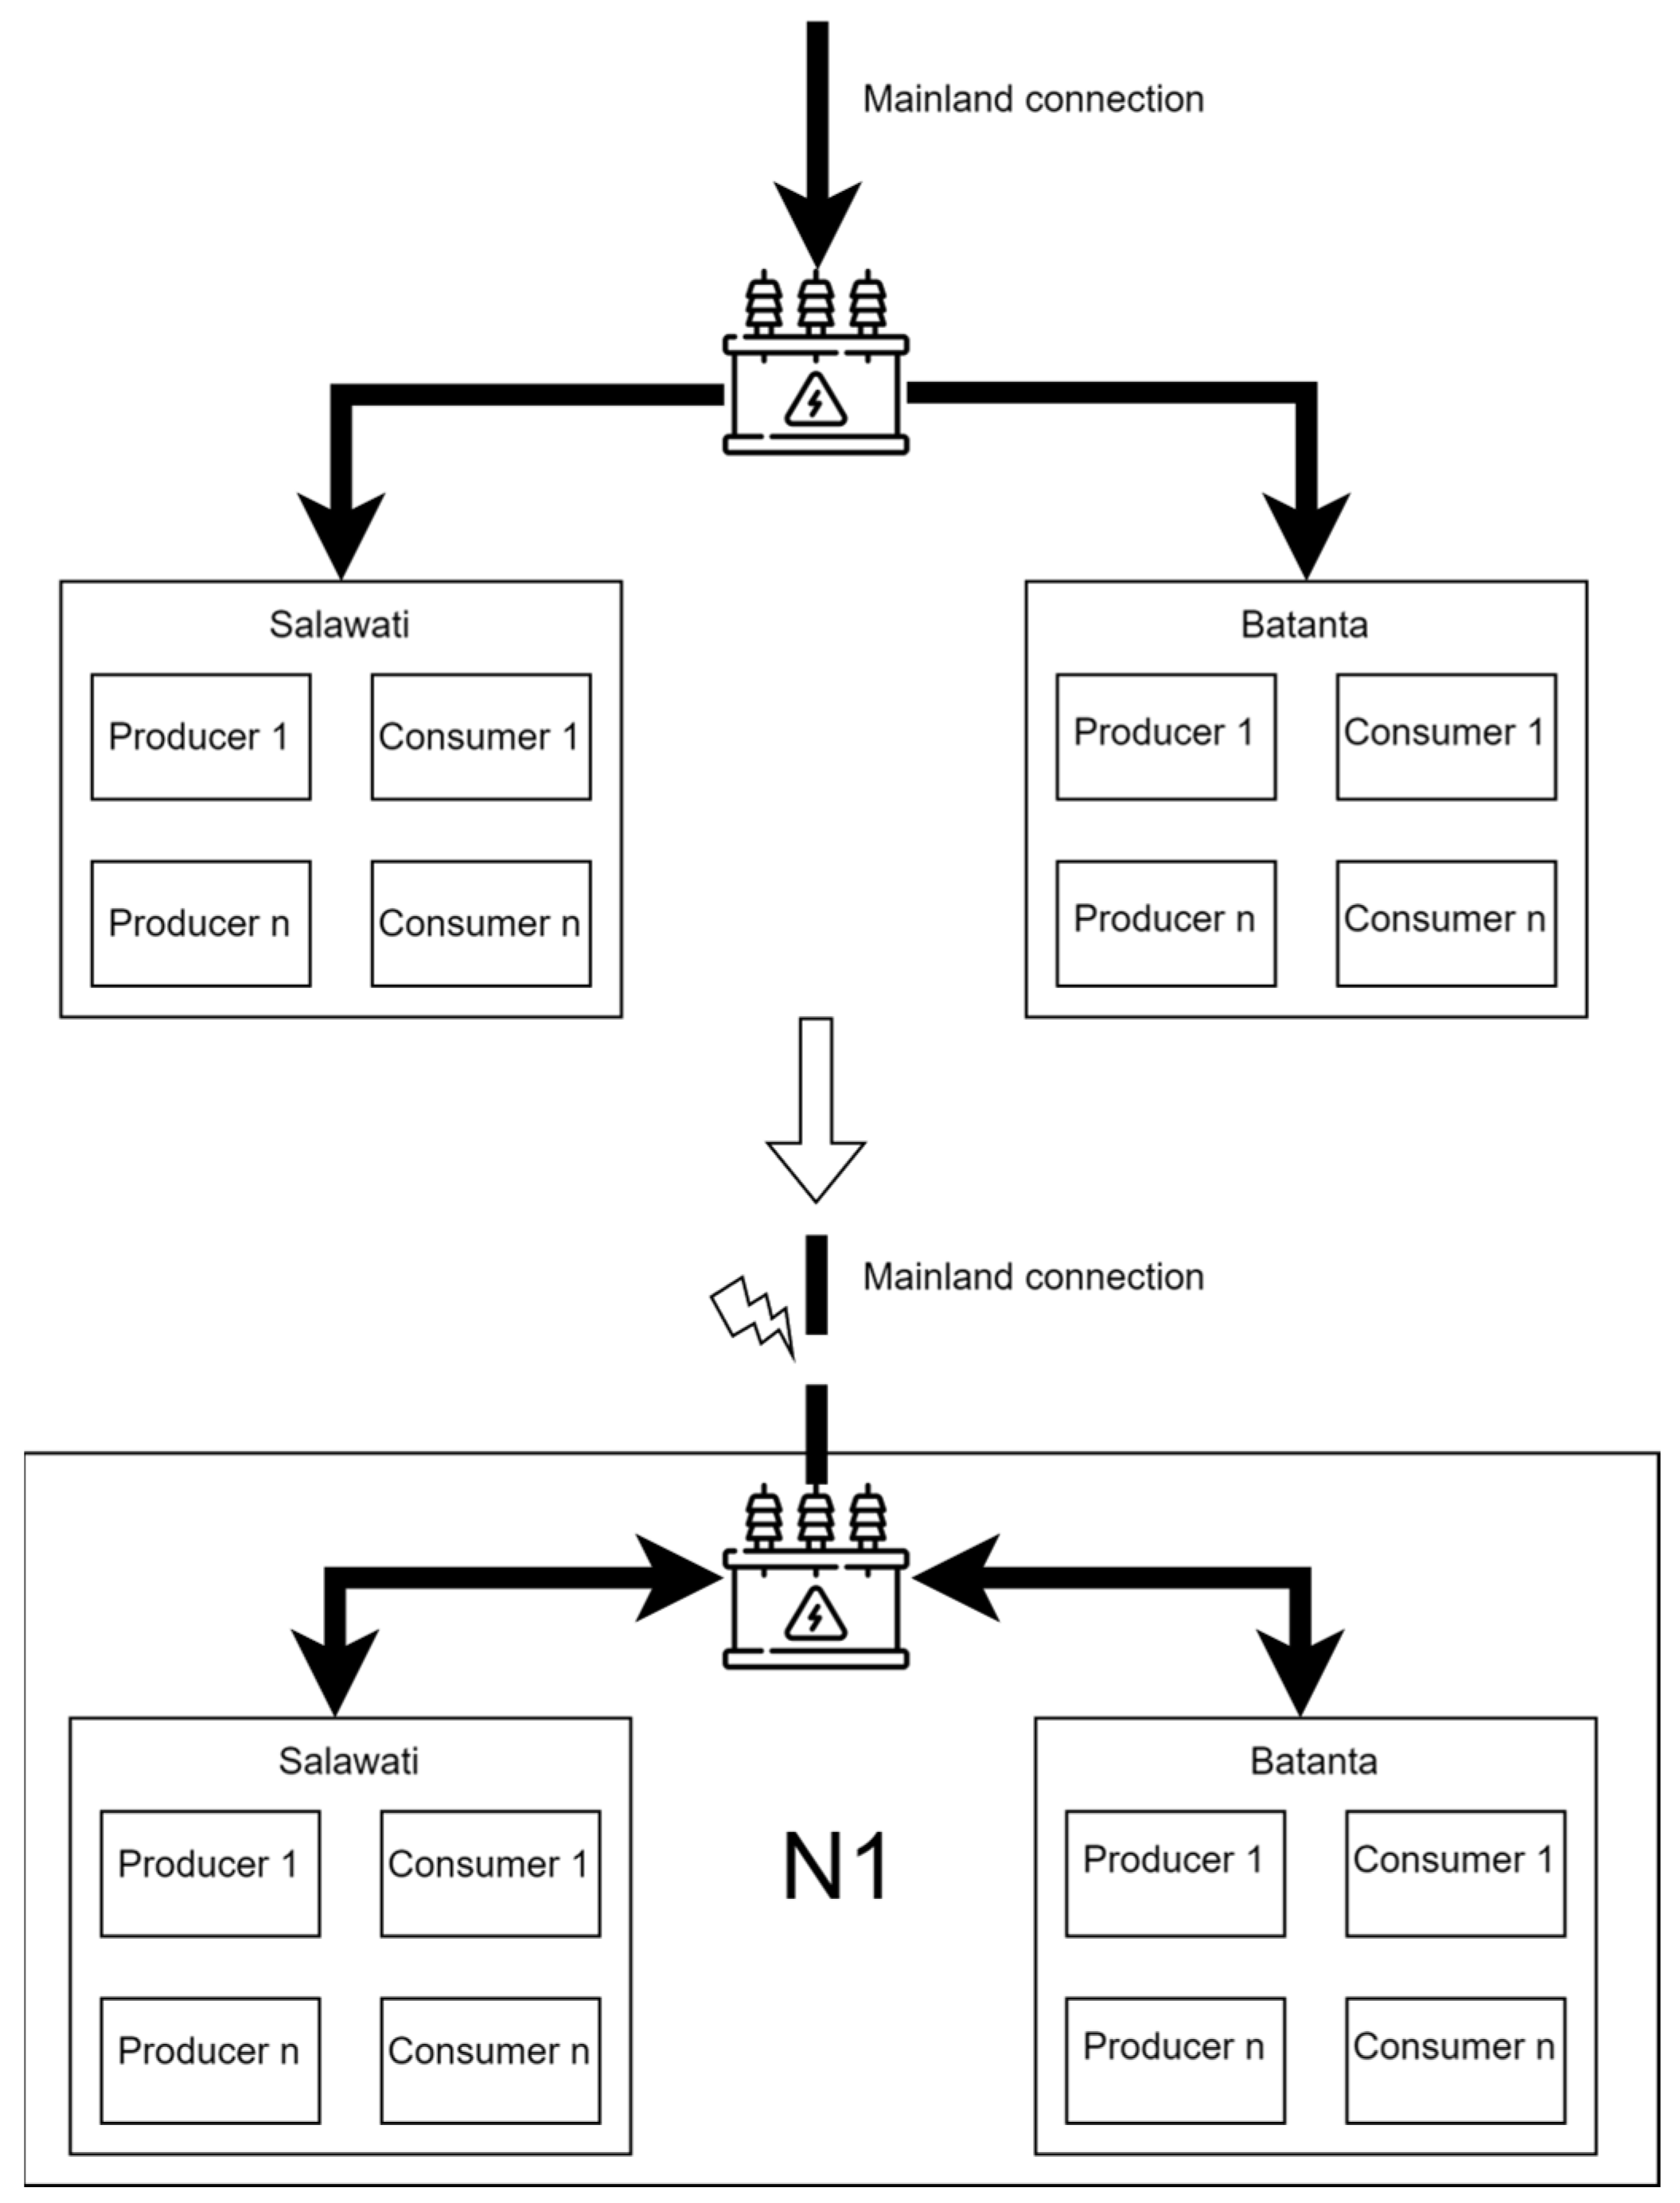
Networked Microgrids for Power Sharing

Local generation and storage upgrades can significantly enhance resilience, but they do not fully exploit the advantages of inter-island cooperation. An alternative or complementary approach is to interconnect neighboring microgrids, enabling real-time power exchanges [2,6,34]. In a networked setting, islands with surplus renewable generation can immediately supply energy to those experiencing shortages. This flexibility can reduce or defer the need for large battery installations on each island microgrid, potentially lowering capital costs while improving overall supply reliability.
For the case study islands, the networked topology is defined by their geographical proximity and existing distribution infrastructure. Surplus electricity flow is modeled as a direct exchange among microgrids under the simplifying assumption that the interconnection capacity is unconstrained. Although this assumption omits line losses and congestion, it captures the strategic importance of sharing renewable overproduction and balancing the collective load. Future work may incorporate more detailed line-limit models or dynamic reconfiguration strategies for improved realism [9,11,20].
The benefits of networked microgrids often include higher renewable utilization, greater system inertia, and minimized reliance on diesel. However, the extent of these benefits depends on how effectively each microgrid coordinates dispatch and reserves. Studies have shown that cooperative control mechanisms or distributed robust optimization can maximize power-sharing effectiveness, but real-world deployments often face institutional and regulatory hurdles [1,2,7].

Merit-Order Dispatch for Load Prioritization

Regardless of whether individual islands operate in isolation or form a larger network, a systematic method is needed to prioritize electricity demand when resources are limited. This study employs a merit-order dispatch mechanism that ranks demand categories by criticality. Residential loads, which encompass lighting, refrigeration, and other essential services, are satisfied first. Commercial loads follow, including offices and public buildings whose temporary curtailment is less detrimental. Industrial loads, considered the least critical, are curtailed first under capacity constraints.
A corresponding generation hierarchy is also enforced, activating renewable sources first (particularly PV), then other available renewables such as hydro or biomass, and finally fossil-fueled generators. The underlying rationale is to minimize fuel costs and emissions by prioritizing renewable power whenever it is available [10,14,38]. Formally, the dispatch logic enforces inequalities that ensure the assigned resources do not exceed the cumulative supply from priority generators. If resource deficits occur, the system responds by shedding the lower-priority loads for the duration of the shortfall.
The AnyLogic simulation engine implements these priority rules in real time. For each timestep, the total supply is matched against load categories in descending order of importance. By integrating this algorithm into the dynamic simulation, emergent conditions—such as a sudden solar drop or generator failure—can be handled seamlessly, consistent with advanced microgrid frameworks [4,35,57]. This dispatch approach remains valid in both standalone and networked modes, though networked scenarios provide additional capacity for covering high-priority loads across multiple islands.

Integration with Simulation and Optimization Models

The final component in the operational strategy design is to unify HOMER Pro’s capacity recommendations with the real-time simulation in AnyLogic. After HOMER Pro identifies optimal PV and battery capacities under economic and technical constraints, these sizing decisions are transferred to the agent-based environment. AnyLogic then executes day-to-day dispatch, adhering to the merit-order prioritization for loads and generation resources. In a networked configuration, the model enforces power exchange constraints between microgrids, reflecting the assumption that interconnections permit nearly instantaneous sharing of surplus.

3.2.5. Scenario Analysis and Key Assumptions

The final methodological phase undertakes a structured scenario analysis to evaluate how the proposed strategies—standalone microgrids with enhanced local generation versus networked microgrids—perform under varying cable disruption events. A spreadsheet-based time-series model cross-verifies the match between HOMER Pro’s planned capacities and AnyLogic’s real-time operations, ensuring consistency between optimized designs and agent-based dispatch. Similar multi-layer validations are common in microgrid studies, where researchers seek to confirm that solutions identified by cost-minimizing algorithms remain resilient in live operational contexts [11,17,30].
The first dimension of scenario testing involves best-case and worst-case conditions for solar availability. The best-case scenario assumes ample sunlight, enabling PV systems to charge batteries fully. In contrast, the worst-case scenario features reduced solar irradiance, forcing the microgrids (isolated or interconnected) to depend more heavily on diesel or on power exchanges within the networked cluster. These contrasting scenarios reveal how resource adequacy and economic performance shift when external conditions change—a vital aspect of remote or disaster-prone island grids [4,20,33].
A second dimension focuses on metrics such as unmet demand, backup fuel consumption, and battery utilization. The time-series validation checks whether each microgrid can maintain supply for critical loads (residential) in both normal and disrupted states. For networked microgrids, it also tracks how surplus power flows among islands, demonstrating whether shared operations significantly curtail overall shortfalls [2,23,28].
Three key simplifying assumptions limit the scope of this case study. First, cable disruptions are treated as total failures, meaning no partial capacity remains during the outage. Second, unlimited transmission capacity is assumed between interlinked islands, ignoring real-world feeder constraints and losses [8,9,16]. Third, consumer loads are static beyond predefined load priorities, an approximation that excludes adaptive demand response. Future investigations can add congestion constraints, partial cable recovery times, or advanced game-theoretic demand response to reflect more realistic operating conditions [3,7,55].
By acknowledging these limitations, the scenario analyses still demonstrate how a networked microgrid design can yield marked advantages in both cost and reliability. Drawing from both agent-based simulation and an established optimization tool, the methodology provides robust evidence regarding the trade-offs in local-only versus networked renewable expansions. The subsequent results section builds on these analyses, highlighting how microgrid islands fare under varying resource conditions and underscoring the scalability of such approaches for other remote island clusters.

4. Case Study Setup and Context: Networked Microgrids in Indonesian Island Communities

This section presents the case study that forms the empirical foundation of the research. Six islands spanning three Indonesian provinces were chosen to evaluate how networked microgrids can enhance energy resilience and reliability under disruptive conditions. The dataset encompasses population, economic, and geographical indicators, along with energy-specific variables such as demand profiles, existing generation capacities, and weather data. These islands collectively offer diverse demographic and operational contexts that reflect the broader challenges of remote electrification in Indonesia. Similar multi-island or multi-microgrid analyses have been highlighted in previous literature, where geographical and infrastructural diversity is critical for validating resilient system designs [1,6,9,16,21,55].

4.1. Rationale for Site Selection

Indonesia has thousands of inhabited islands, many of which rely heavily on limited and often unreliable power infrastructures. According to recent assessments, remote islands commonly face high diesel import costs, insufficient generation capacities, and frequent outages [14,30,43]. The islands in this study were chosen because they exhibit varying population sizes, socio-economic conditions, and degrees of renewable energy potential, thereby illustrating how local factors influence the feasibility and performance of networked microgrids. By focusing on three provinces—West Papua, Southeast Sulawesi, and East Nusa Tenggara—this case study provides insights into distinct regional conditions. Selecting islands from different parts of the archipelago also allows a comparative assessment of how climate, resource availability, and load characteristics affect resilience strategies.
Figure 9 shows the locations of these six islands, grouped into three networked systems (N1, N2, and N3). The subsequent subsections detail key demographic and energy statistics for each island pair, emphasizing how existing diesel-based networks can be supplemented by solar and geothermal resources, among others [2,8,26]. The island clusters exemplify settings where microgrid expansions can substantially reduce vulnerability to main grid disruptions.

4.2. Overview of Island Groups and Regional Characteristics

Table 3 summarizes the general properties of each island, including their populations and provincial affiliations. Although the six islands differ in size and local economy, all face common barriers, such as high diesel reliance and limited infrastructure investment. Studies on Indonesian island electrification indicate that system performance can improve markedly by integrating renewable resources and storage, especially in the context of multi-microgrid sharing [1,3,34].
Group 1 (N1: Salawati and Batanta): The province of West Papua, encompassing a large geographic area with numerous small islands, is characterized by moderate but growing demand. Many local grids operate on diesel generation with an emerging interest in solar and small hydro. Salawati covers roughly 1623 km2 with a population of 8739, whereas Batanta encompasses 479.5 km2 with about 3239 inhabitants [62,63]. Both islands exhibit low electrification rates and rely on expensive diesel imports [64]. Their relatively close proximity makes them strong candidates for forming an interconnected microgrid cluster.
Group 2 (N2: Buton and Muna): Southeast Sulawesi has historically relied on coal-fired generation, though smaller islands have turned to diesel and occasional renewables for local power [65,66]. Buton’s installed capacity is about 30 MW with a peak load of approximately 33 MW, while Muna operates around 4.7 MW of installed capacity for a peak load of 4.2 MW. Such disparities suggest potential benefits in sharing resources, especially if new solar or other renewables can be economically introduced.
Group 3 (N3: Lembata and Adonara): East Nusa Tenggara faces particular challenges from long dry seasons and high temperatures, conditions that demand more robust infrastructure and often higher generation costs [67,68,69]. Lembata and Adonara exhibit high dependence on imported diesel (over 90% of the power supply mix in certain districts). This scenario underscores the urgent need for integrating solar, geothermal, or battery-based storage. Their adjacency allows for a potential microgrid cluster that can share generation surpluses and reduce overall shortages.

4.3. Electricity Infrastructure and Resource Assessments

Table 4 lists provincial-level generation capacities for solar, geothermal, hydro, steam, diesel, and diesel–gas technologies. These numbers were proportionally downscaled to match individual island populations, yielding capacity estimates for each island system shown in Table 5. This estimation approach is common in multi-microgrid feasibility studies where direct data on smaller systems is scarce [17,21,30].
These values reveal a continuing dominance of diesel-based capacities in all three provinces, which is consistent with prior analyses of remote Indonesian grid systems [30,50]. However, there are also appreciable solar and geothermal prospects in specific locations (particularly in East Nusa Tenggara), supporting the rationale for increased renewable penetration within microgrid architectures.

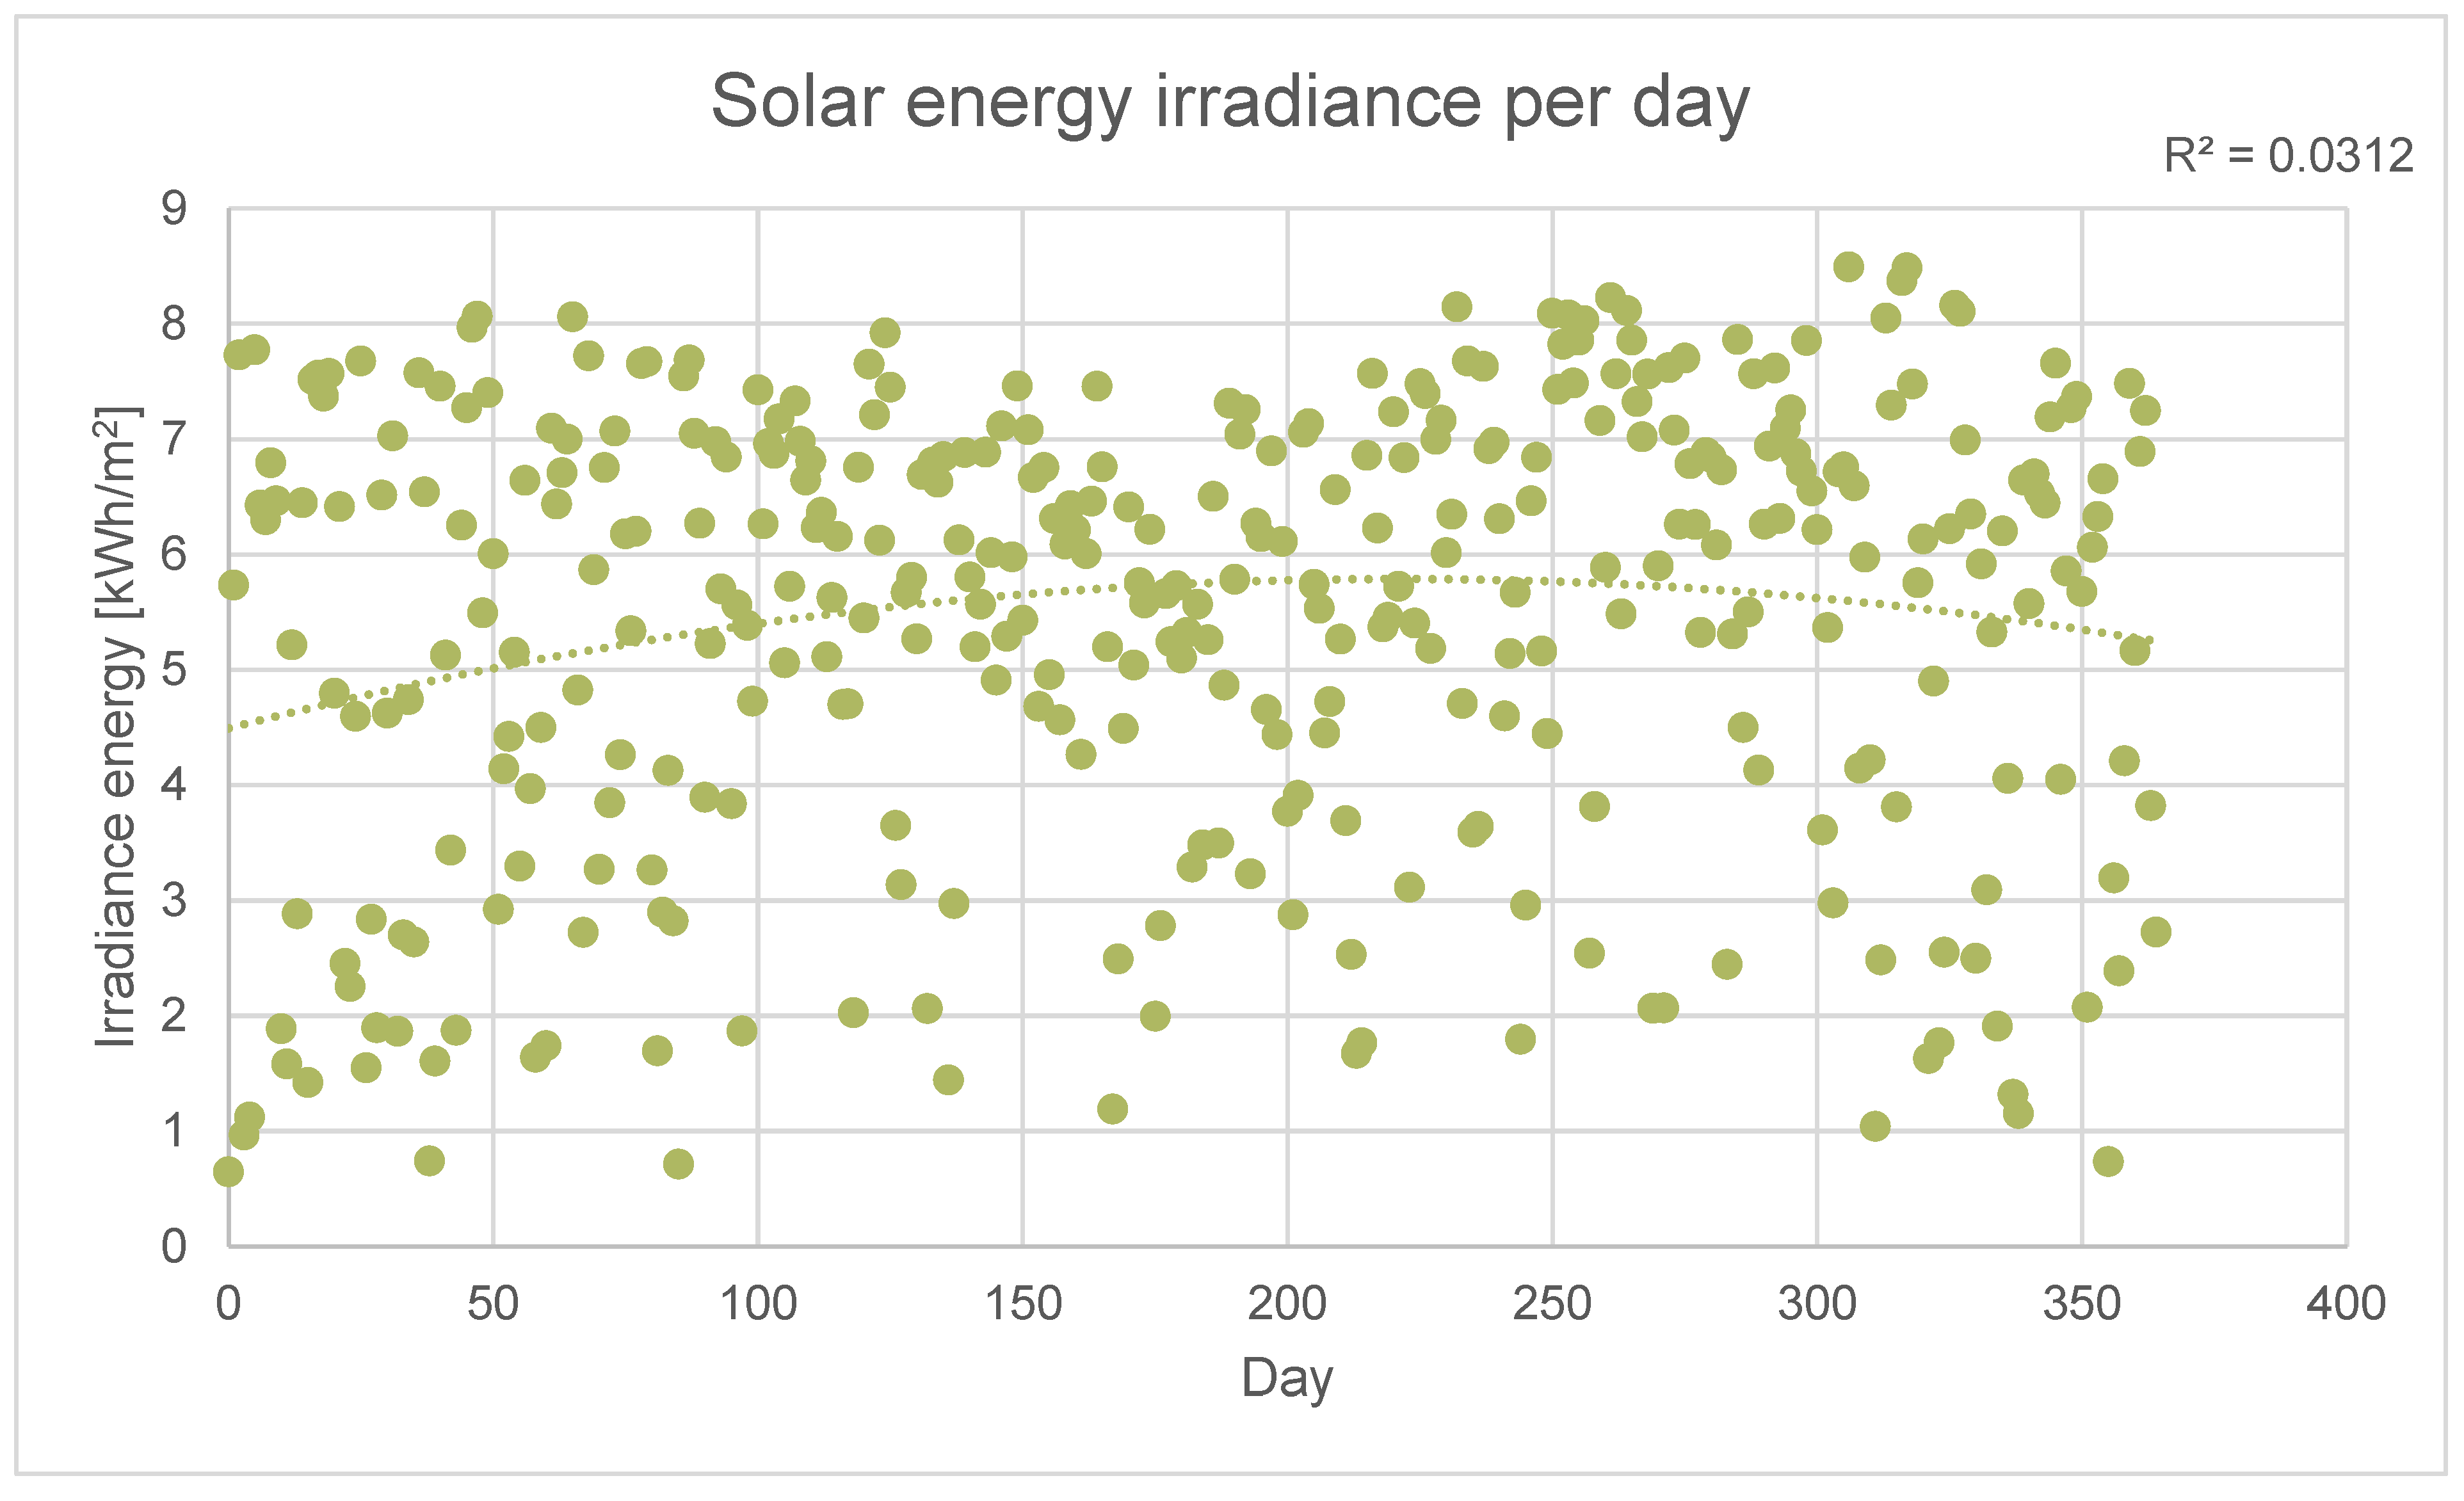
4.4. Load Profiles and Solar Irradiation Data

Accurate load profiles are vital for agent-based simulation and energy system optimization. As indicated in the methodological framework, a base load of 1173 kWh per person per year was used, then scaled and shaped with symbolic regression functions to capture daily and seasonal variations. Historical hourly demand data from 2015 to 2021 helped refine the profiles. The resulting profiles were divided into residential, commercial, and industrial sectors, consistent with typical Indonesian load mixes in remote microgrids [3,34,40].
Figure 10 presents an illustrative daily solar irradiation profile, which was also collected as hourly data over the course of a year. The data demonstrates generally favorable solar conditions across these provinces, though seasonal shifts and periodic cloud cover can cause variability. The solar resource input is a key determinant in sizing photovoltaic capacity in HOMER Pro, especially under island conditions where grid backup is limited or nonexistent [27,33,37].

4.5. Integration with Simulation and Optimization Platforms

The compiled dataset—encompassing demand, generation, and weather factors—serves as input for both AnyLogic (agent-based simulation) and HOMER Pro (capacity optimization). In AnyLogic, each island system is modeled as a distinct microgrid agent with its own demand trajectories, conventional generation, and renewable resource constraints [12,14,57]. HOMER Pro uses the same data to evaluate various renewable and storage configurations, returning optimal solutions in terms of NPC, LCOE, and resource adequacy [3,21].
This dual-platform approach allows a holistic examination of both the techno-economic feasibility of recommended system expansions (HOMER Pro) and the granular dispatch behavior of the microgrids under different disruption scenarios (AnyLogic). The synergy of these models is aligned with best practices identified in recent multi-microgrid studies, where integrated simulation–optimization can effectively identify cost-minimal yet operationally robust designs [1,8,9].
The Indonesian island systems described here illustrate the complexities of powering remote communities, including significant reliance on diesel, expensive fuel logistics, and uneven demand–supply balances. The diversity in population size, geographic conditions, and resource availability underscores the need for flexible microgrid strategies that incorporate local renewables, storage, and inter-island networking. The data prepared for these six islands provides a credible foundation for a comparative analysis of how isolated versus networked microgrids fare when mainland cable fails. By combining the geographical and demographic details summarized above with the load and resource models, the subsequent simulation and optimization exercises can yield actionable insights on how best to design and operate resilient, low-carbon microgrids in remote island contexts [6,11,31].

5. Scenario Design and Experimental Setup for Evaluating Microgrid Resilience

This section also presents the structured scenario design used to investigate how networked microgrids respond to extended power outages triggered by natural disasters. The approach quantifies performance differences under high and low renewable availability, both in standalone microgrids and in interlinked (networked) configurations. Similar scenario-based strategies have been employed in other multi-microgrid studies to assess the impact of operational methods on reliability, cost, and renewable penetration [1,4,9,34]. The following subsections detail the rationale, identification of representative best- and worst-case weeks, configuration of scenarios, and expected outcomes.

5.1. Scenario Approach

The main objective of the scenario design is to compare how microgrids, when decoupled from the mainland, behave under contrasting renewable resource conditions. A well-defined temporal scope identifies periods when renewable generation is plentiful (best case) and when generation deficits are pronounced (worst case). By overlaying these resource patterns on top of different microgrid strategies—standalone versus networked—researchers can observe whether resource sharing and storage expansions effectively reduce unmet demand. The scenario-driven approach thereby clarifies the interplay among seasonal solar variability, storage operation, load prioritization, and the presence or absence of inter-island connections [2,3,17].

5.2. Identification of Best-Case and Worst-Case Disruption Weeks

A full-year preliminary simulation was conducted to calculate the net energy balance for each microgrid on a weekly basis. The net energy balance, shown conceptually in Equation (4), compares total generation Gw and total load Lw over each week w:
E B w = G w L w
A positive energy balance indicates surplus generation, whereas a negative value indicates a deficit that must be met by nonrenewable sources or lead to unmet demand. Computing EBw for all 52 weeks allowed the selection of one week with the highest surplus (best case) and one week with the greatest deficit (worst case). These represent extremes that reveal system vulnerability under varying solar and load conditions, following methods used in other multi-microgrid analyses [12,23,32].
Table 6 summarizes the start dates and net energy balances for each microgrid in both the best- and worst-case weeks. The data confirm that best-case weeks generally coincide with periods of ample solar irradiance in December, while worst-case conditions occur between July and August when cloud cover and seasonal factors reduce PV output.
The two weeks selected for each microgrid are used to simulate a hypothetical one-week cable disruption, reflecting typical recovery times observed in remote island communities [1,17,42]. This disruption is assumed to be total, implying no partial or intermittent reconnection throughout the week.

5.3. Scenario Configuration and Structures

To capture a range of conditions, each microgrid system is tested under four main scenario variants. Two time-related scenarios (best-case vs. worst-case weeks) are crossed with two network-related scenarios (standalone vs. networked). This structure yields a 2 × 2 matrix of experimental setups, as shown in Table 7.
Each of these scenarios is then tested under two system states: (1) the current conditions with existing PV and storage and (2) expanded PV and battery capacity as recommended by HOMER Pro. By overlaying the capacity expansions onto each scenario, the study analyzes whether additional storage and solar capacity can mitigate unmet demand in both isolated and interconnected modes.

5.4. Experimental Setup and Key Parameters

Each scenario is modeled for a seven-day period corresponding to the identified best- or worst-case weeks, consistent with earlier multi-microgrid resilience studies [34,38]. The AnyLogic agent-based simulation runs at an hourly timestep, tracking real-time supply–demand balances, battery state of charge, and dispatch decisions. If networked, islands can exchange surplus energy through unlimited interconnections.
Table 8 presents the key parameters influencing scenario outcomes. These include PV intermittency, storage capacities and efficiencies, load profiles for residential, commercial, and industrial sectors, and the exact timing of cable disconnection. By incorporating these variables in a consistent and transparent manner, the study reveals how each microgrid configuration reacts to supply shortages and the potential for inter-microgrid resource sharing.
Past work has shown that changing any one of these parameters can significantly shift outcomes, particularly under worst-case renewable availability [4,6,8].

6. Simulation Results and Analysis of Microgrid Performance

This section presents the simulation and optimization results for the study’s microgrid configurations under different scenarios, operational strategies, and levels of renewable energy integration. The discussion is organized to highlight the following key aspects: (1) PV and battery sizing derived from HOMER Pro, (2) scenario-based demand–supply balance in both standalone and networked microgrids, (3) comparisons of unmet demand across best- and worst-case conditions, and (4) surplus generation patterns.

6.1. Optimal PV and Battery Capacities

An initial stage of the analysis utilized HOMER Pro to determine how much PV and storage each microgrid would require to reliably meet local demand during extended outages. Table 9 summarizes the resulting PV and battery capacities, illustrating that microgrids in all three networks (N1, N2, N3) may need substantial solar and storage investments to reduce unmet demand under worst-case conditions. The recommended installations reflect seasonal solar patterns, local load requirements, and the presence or absence of network connections.
In examining these results, it is evident that networked microgrids potentially share resources, thereby lowering the large capacity requirements if islands can export surplus to neighbors. However, when each microgrid is treated as self-sufficient (standalone), the optimization prescribes more extensive battery installations to buffer intermittent solar output.

6.2. Scenario-Based Demand-Supply Balance

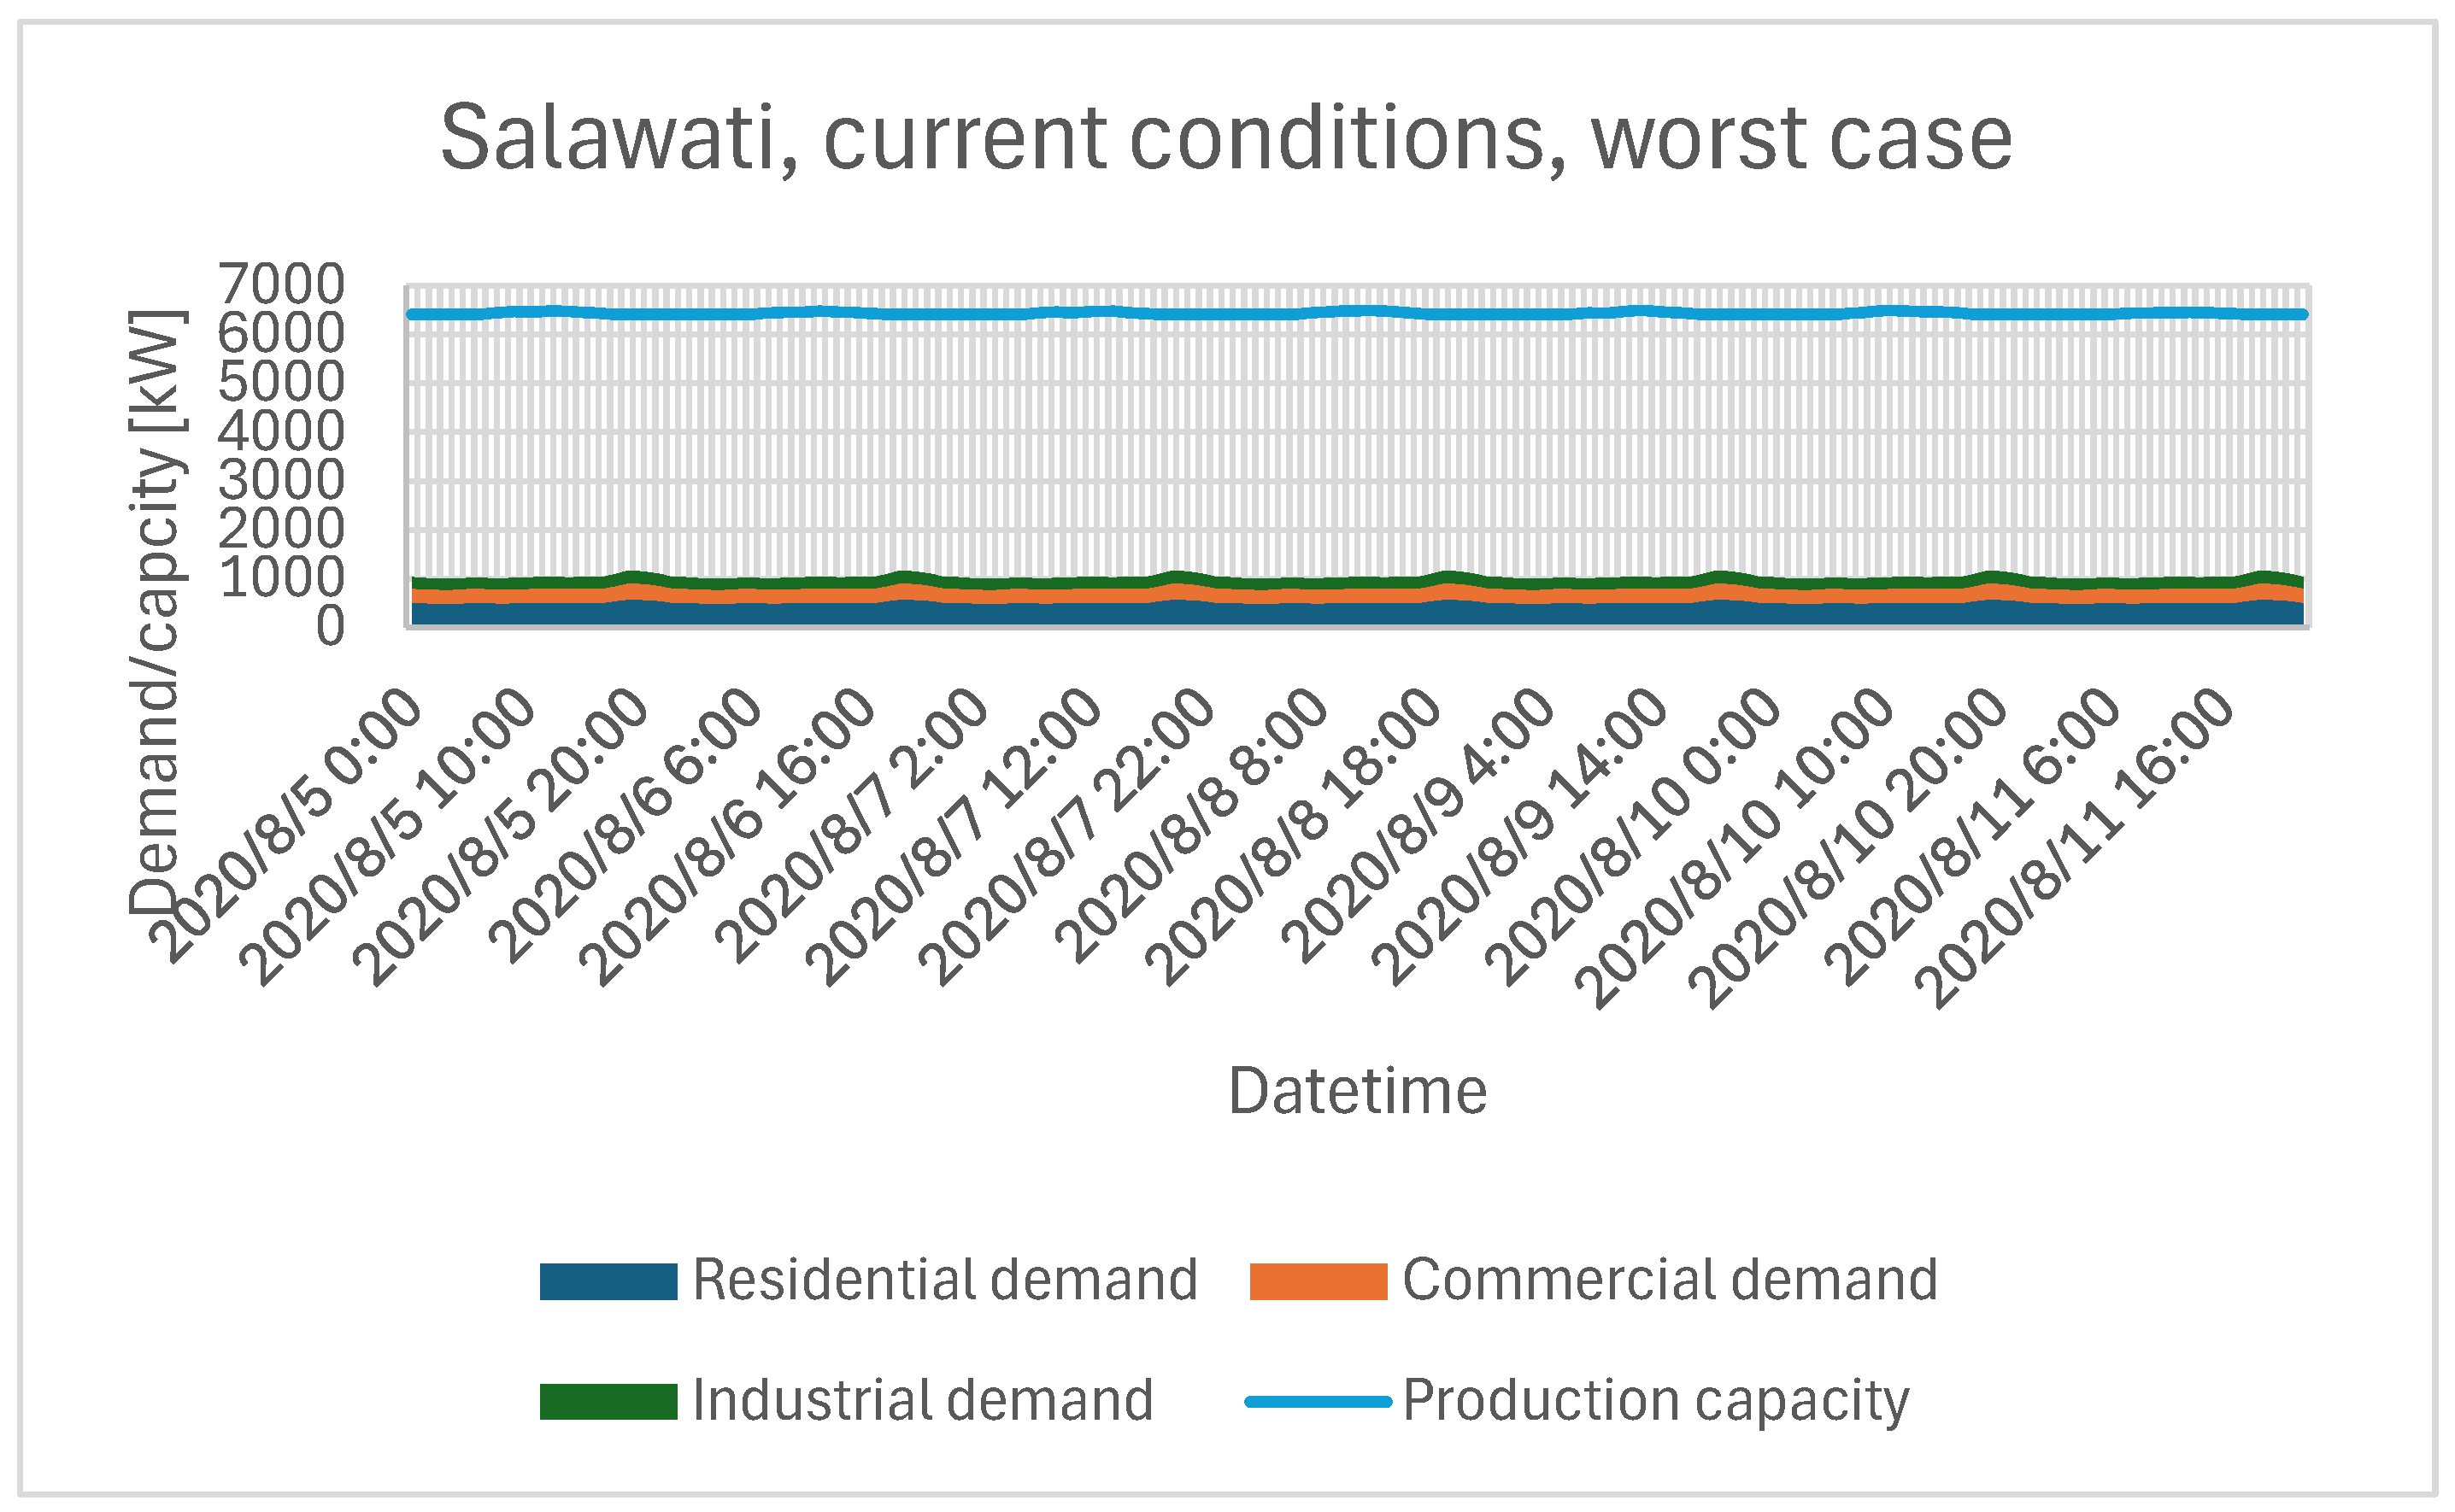
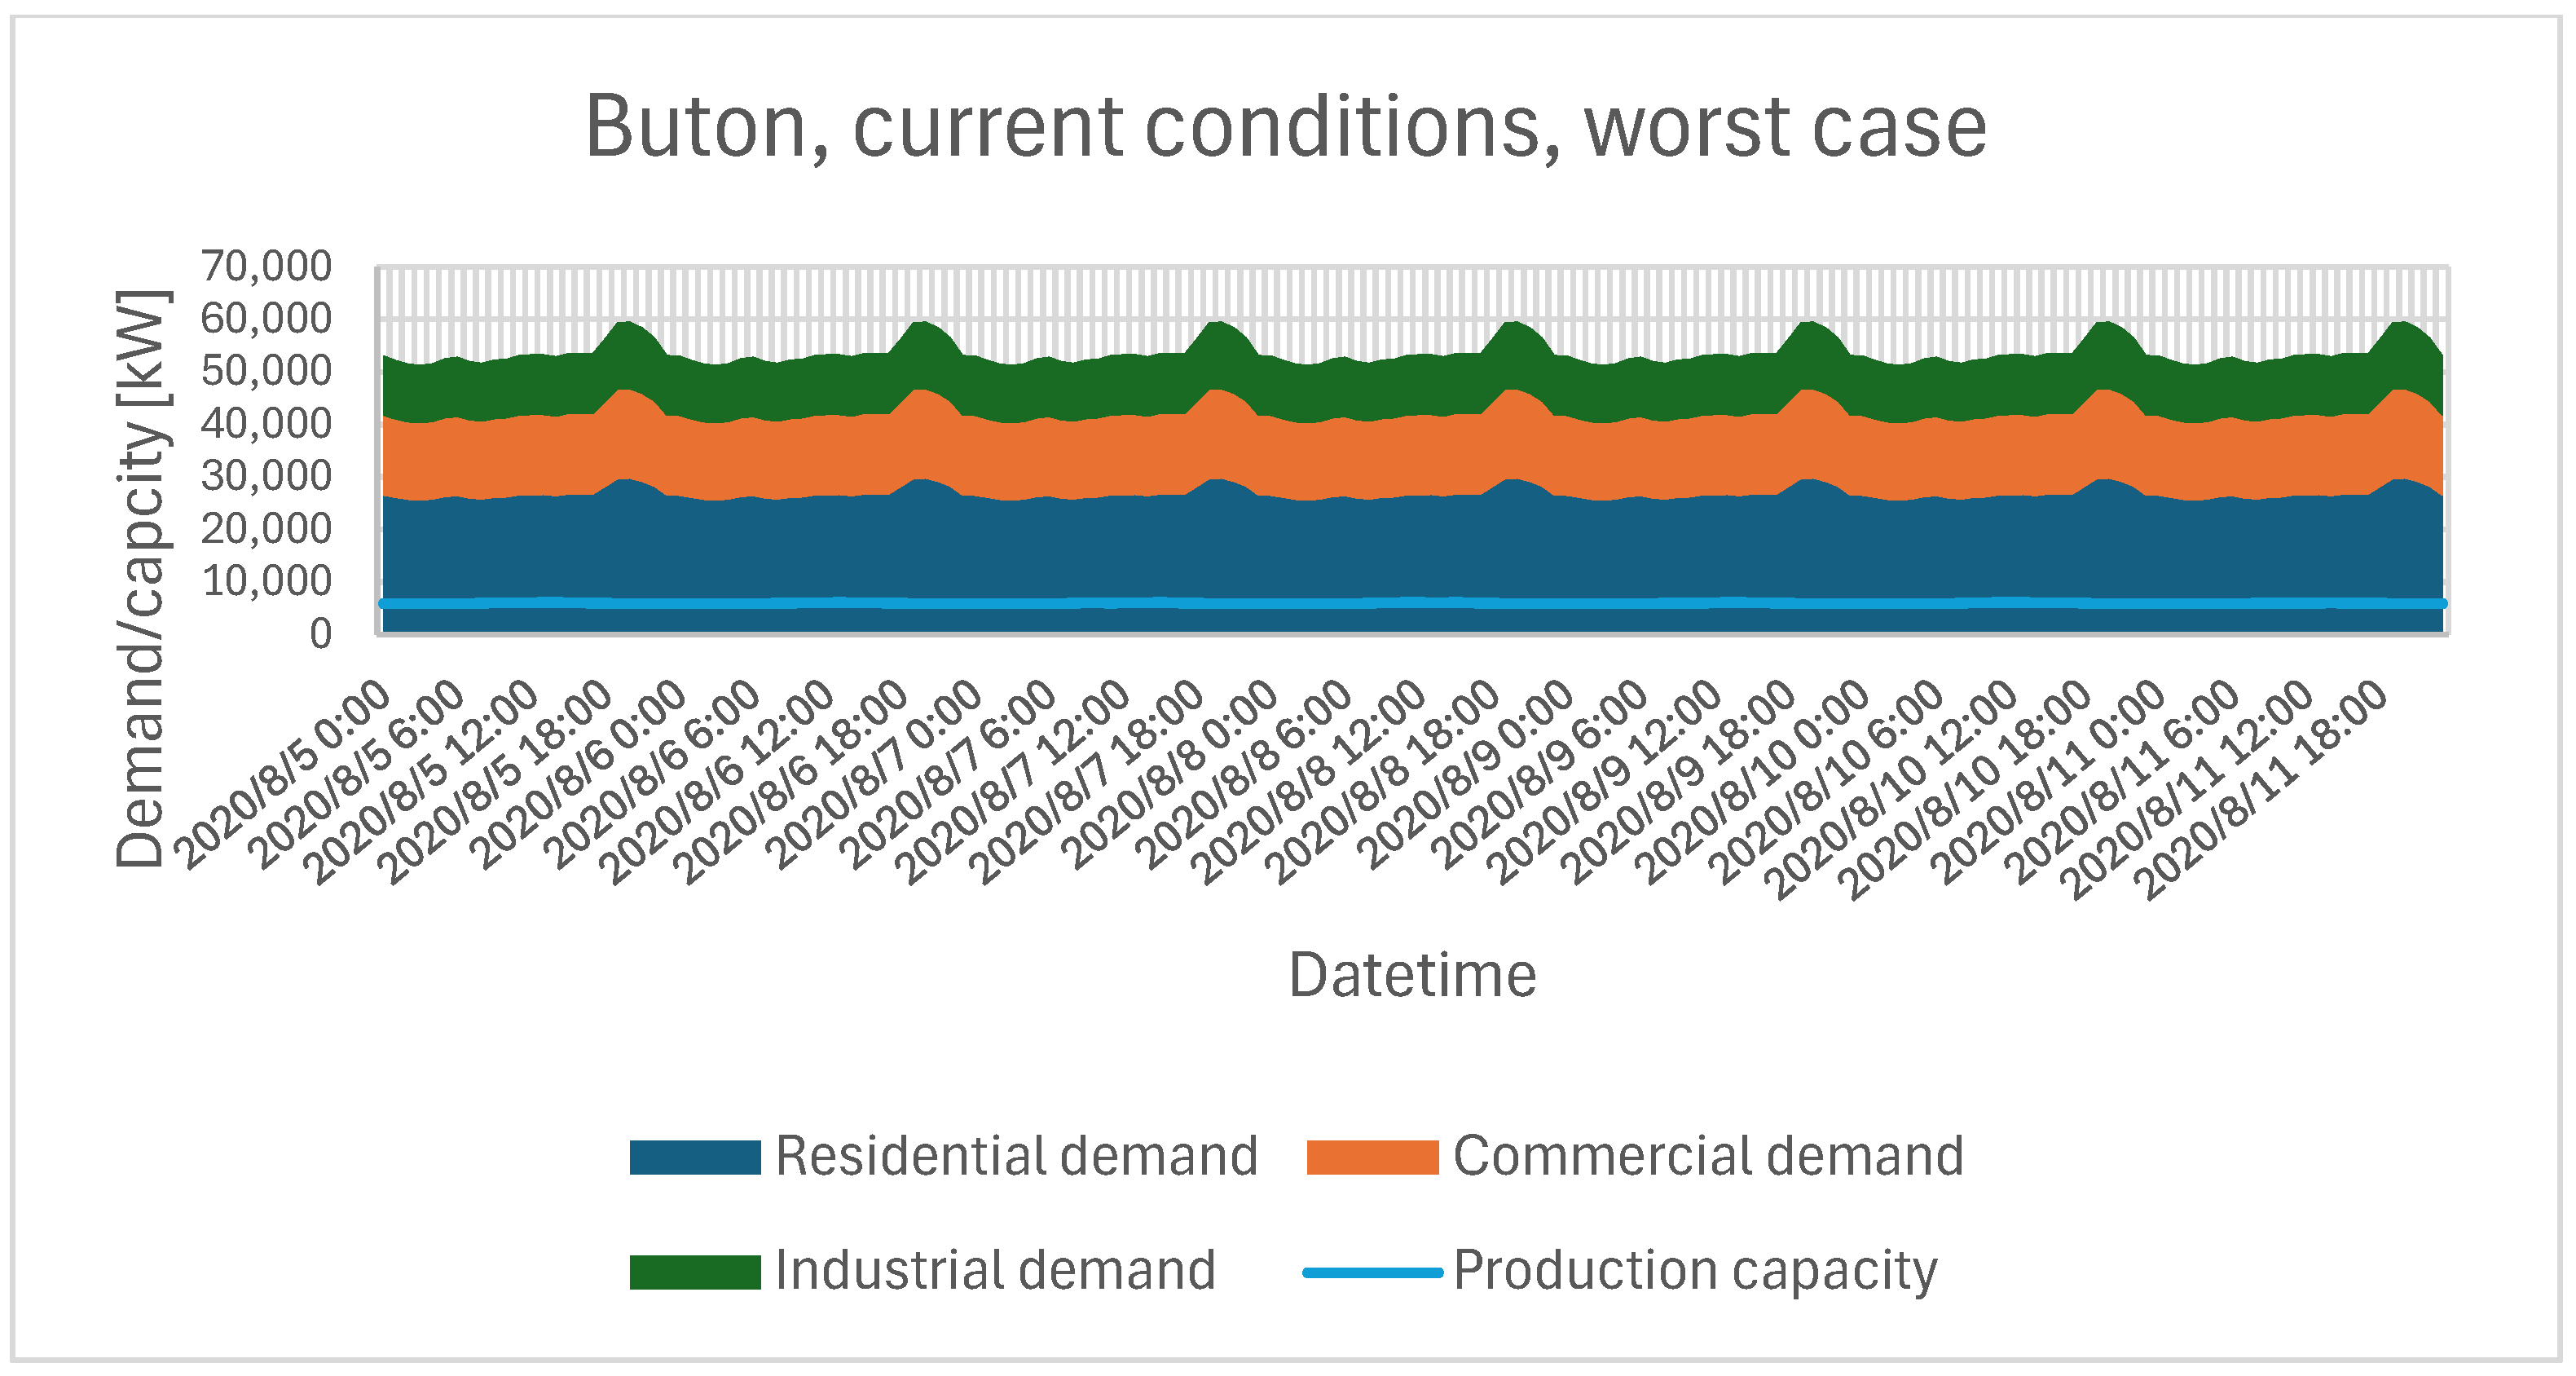
6.2.1. Performance Under Current Conditions (Business as Usual)

In the first set of simulations, all microgrids retained their existing capacities (no additional PV or battery). The worst-case scenario from 5–11 August 2020 was selected to highlight each island’s vulnerabilities. Figure 11 and Figure 12 show stacked time-series representations of load and available generation for Salawati and Buton, respectively.
Figure 11 reveals that Salawati maintains a large surplus, with generation consistently exceeding demand by a factor of approximately six. This finding suggests that Salawati could serve as a major electricity exporter to nearby islands if an interconnection is established. Conversely, Figure 12 for Buton demonstrates persistent deficits throughout the simulation period. The heavy reliance on diesel generation, coupled with high loads and no renewables, results in insufficient supply to meet even critical demand.
These baseline simulations highlight the stark variability among islands. Salawati and Batanta operate with surplus energy, while Buton and Muna exhibit pronounced shortfalls. Lembata and Adonara (not shown in these figures) fall somewhere in between. The case underscores the broader potential benefits of networked microgrids in balancing resources when islands have asymmetric supply–demand profiles.

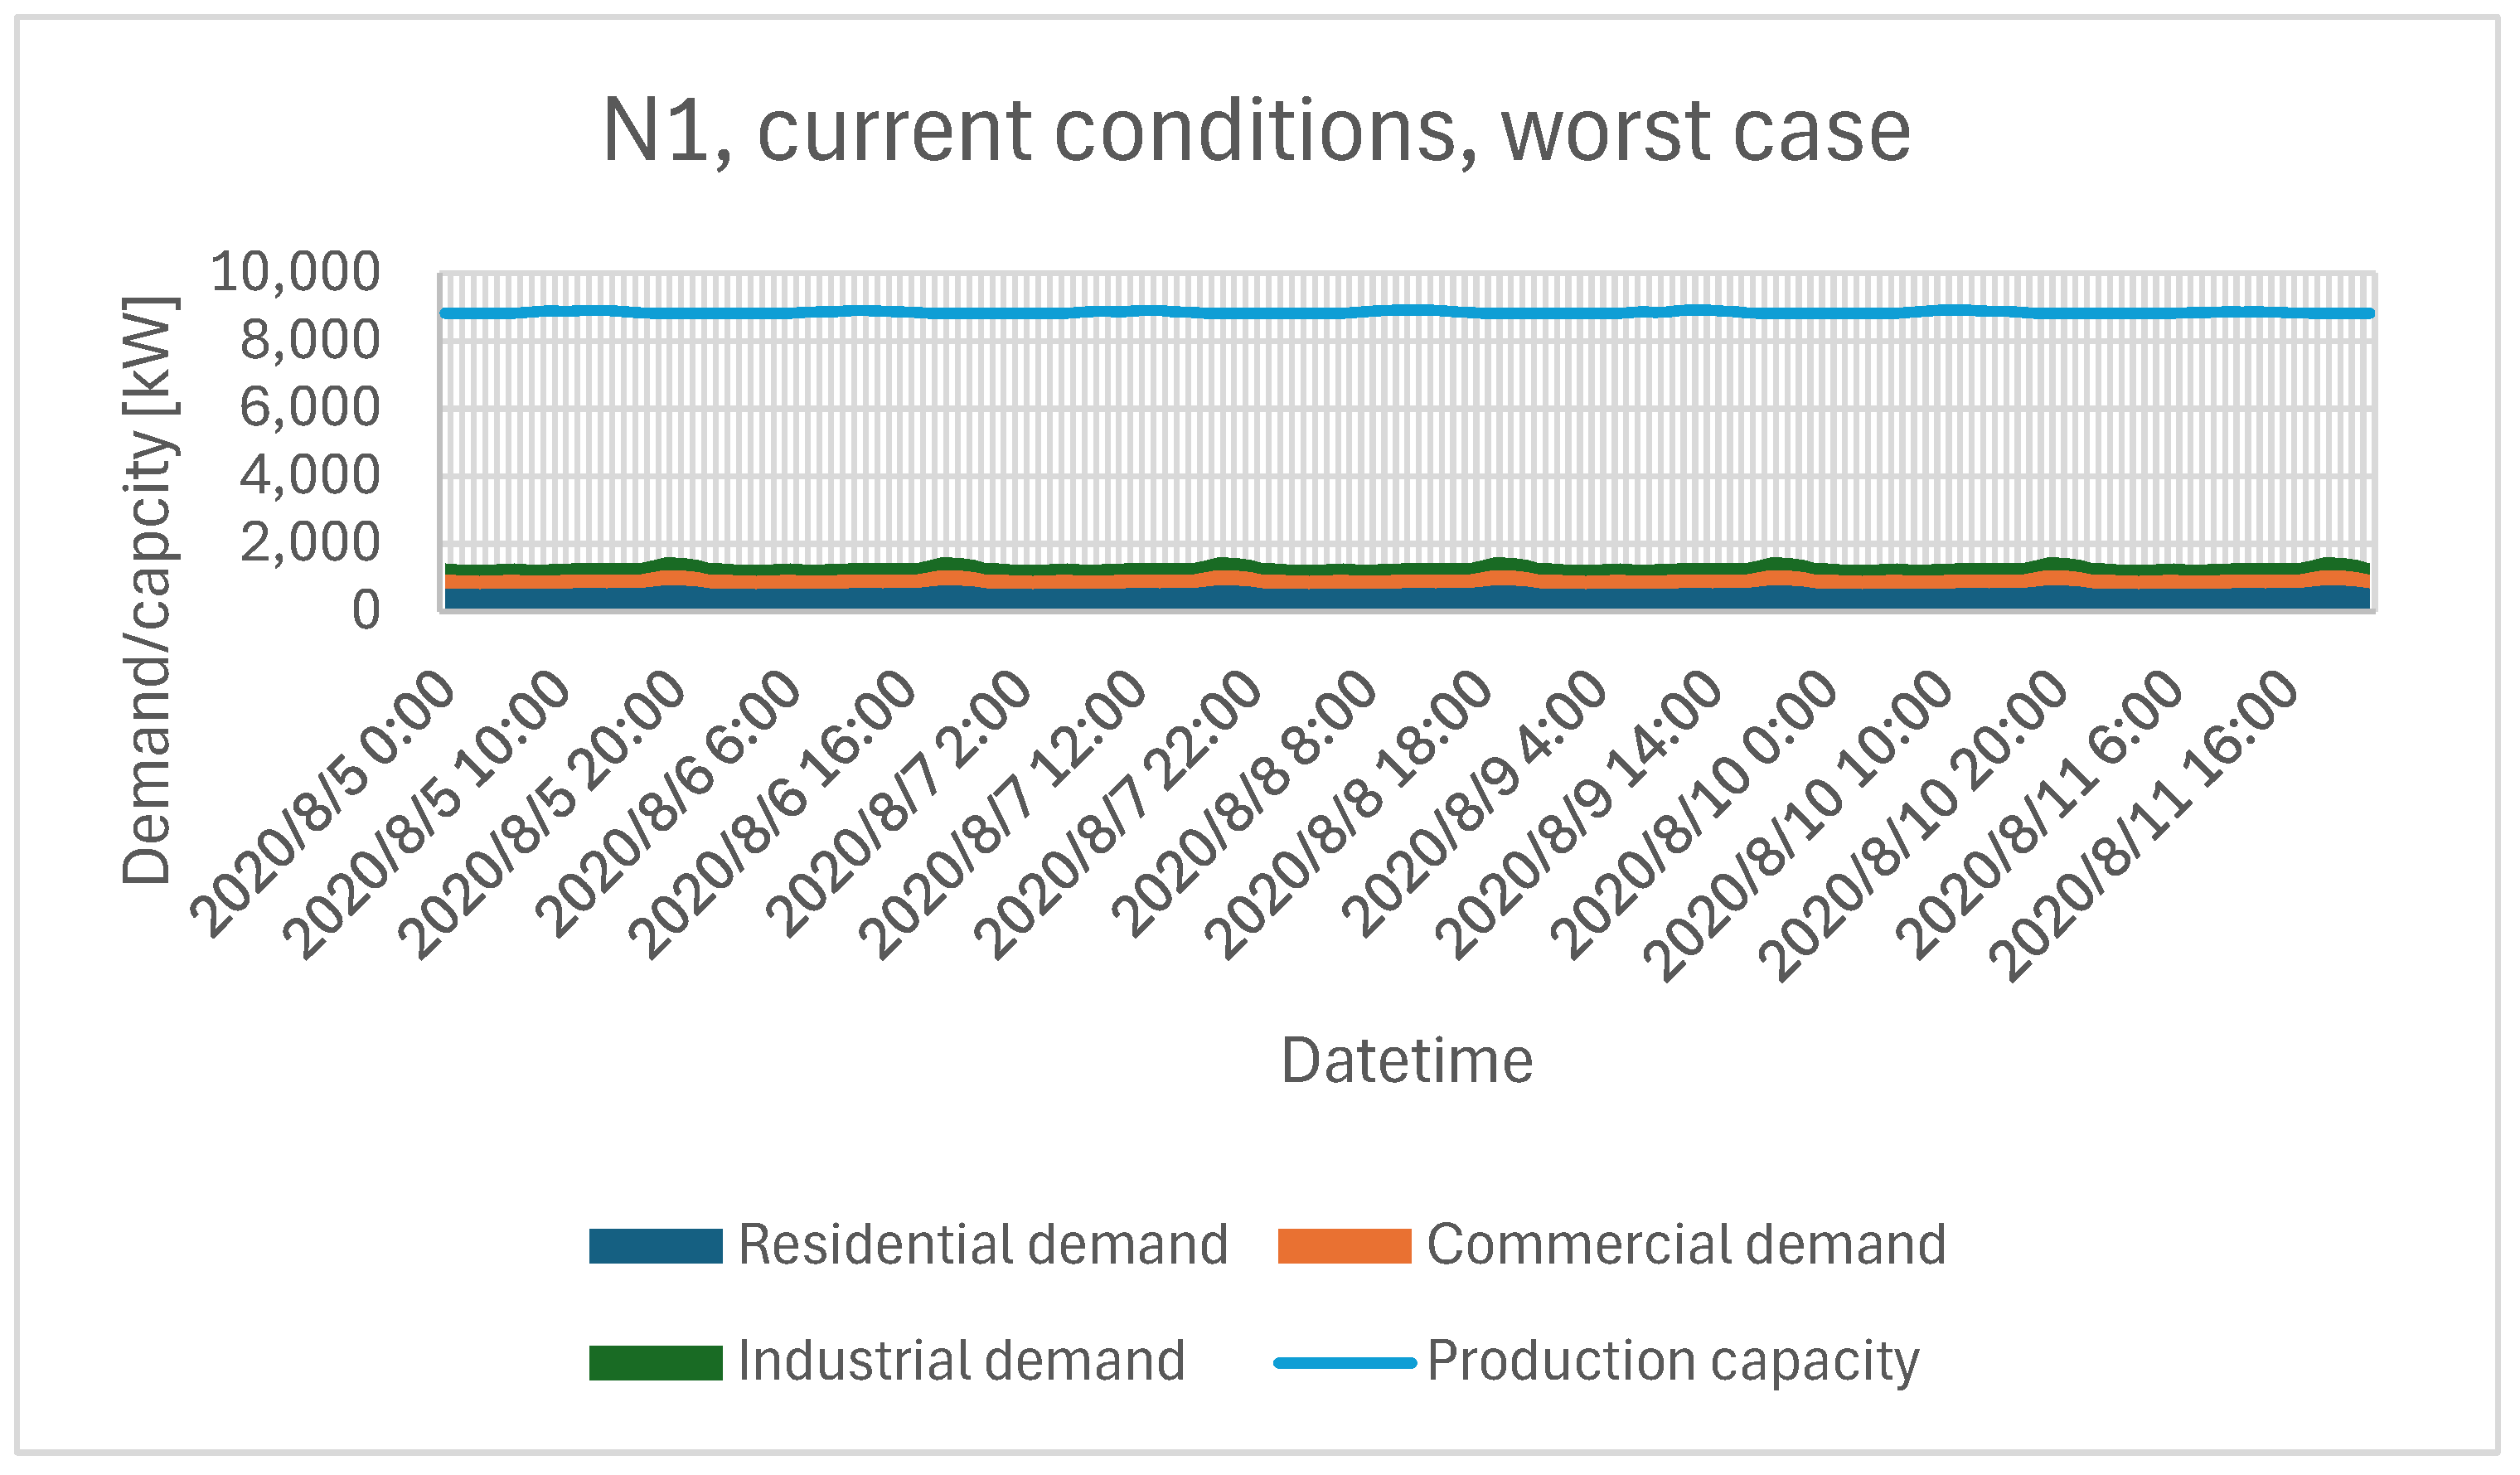
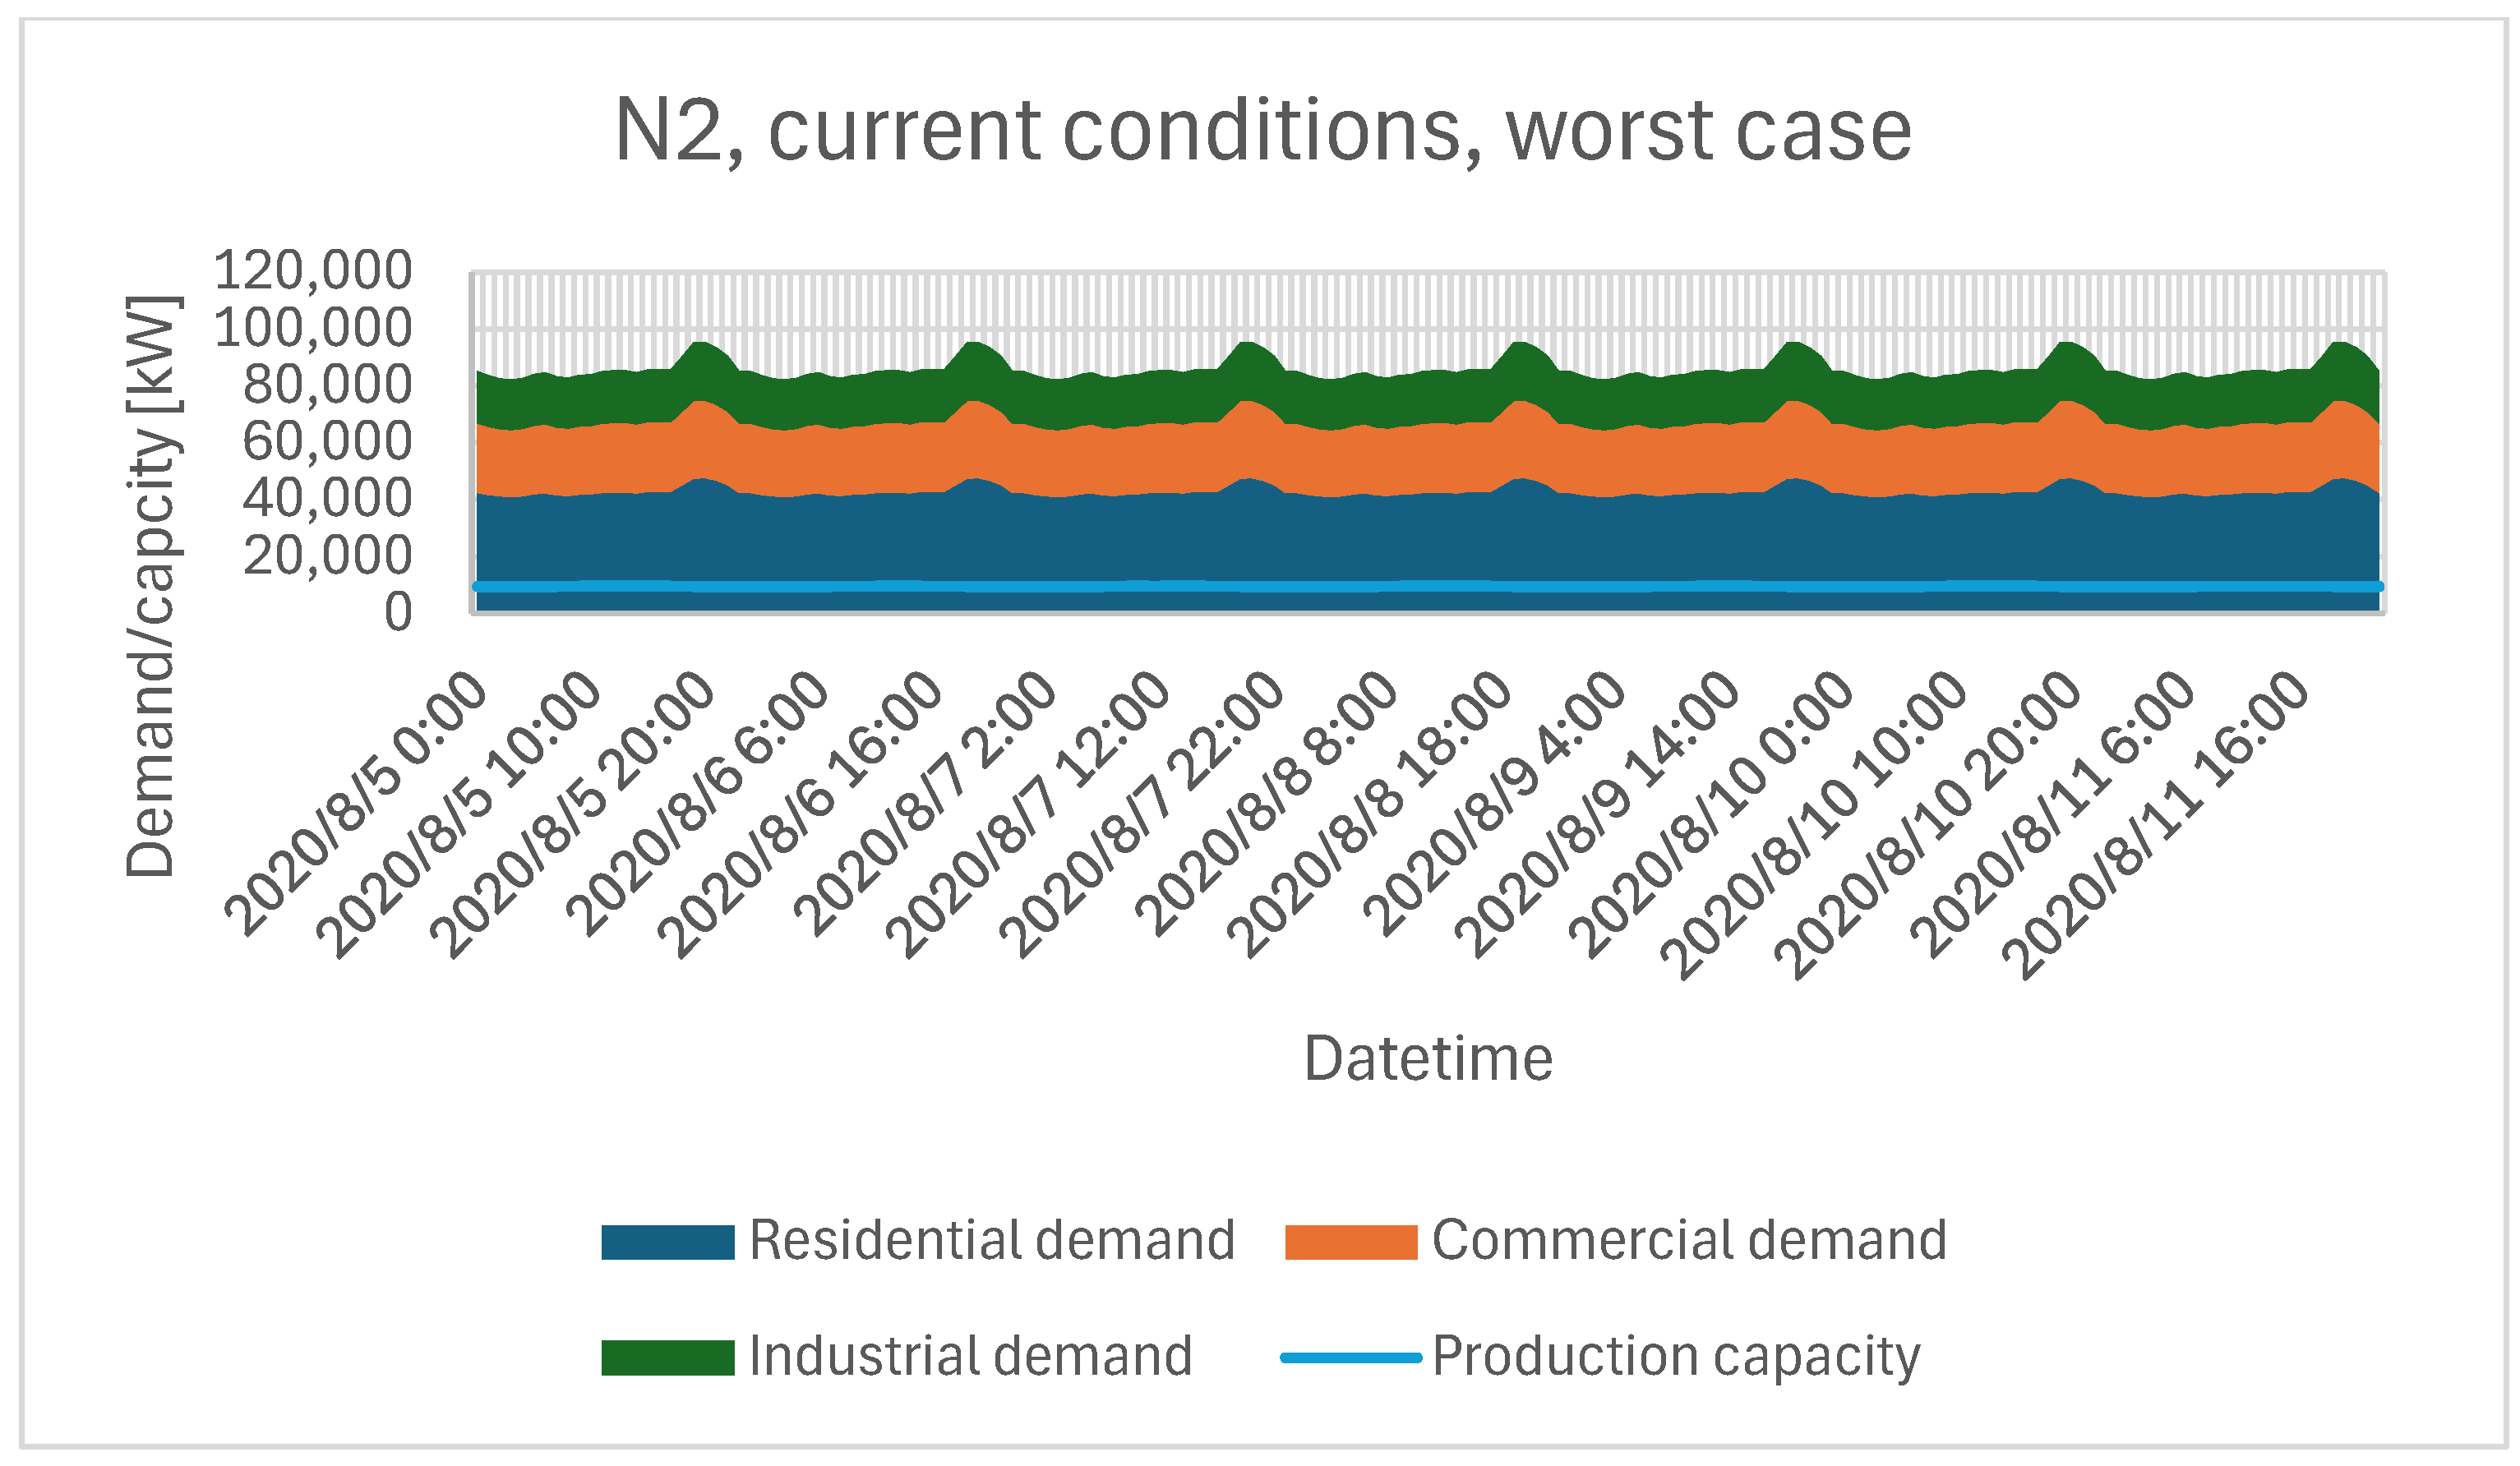
6.2.2. Impact of Networked Microgrid Configuration

Subsequent simulations introduced inter-island energy exchange to observe whether surpluses in one location could offset deficits elsewhere. Figure 13 and Figure 14 illustrate how N1 (Salawati–Batanta) and N2 (Buton–Muna) responded to the worst-case scenario under networked conditions.
N1 experiences minimal or no unmet demand because Salawati’s surplus easily compensates for Batanta’s smaller energy requirements. By contrast, N2 continues to record shortfalls, even though Muna can draw upon Buton’s available generation. The combined capacity is insufficient to fully cover peak loads, leading to unmet demand. This finding suggests that network topologies, while beneficial, cannot resolve supply deficits unless additional renewable capacity is introduced.

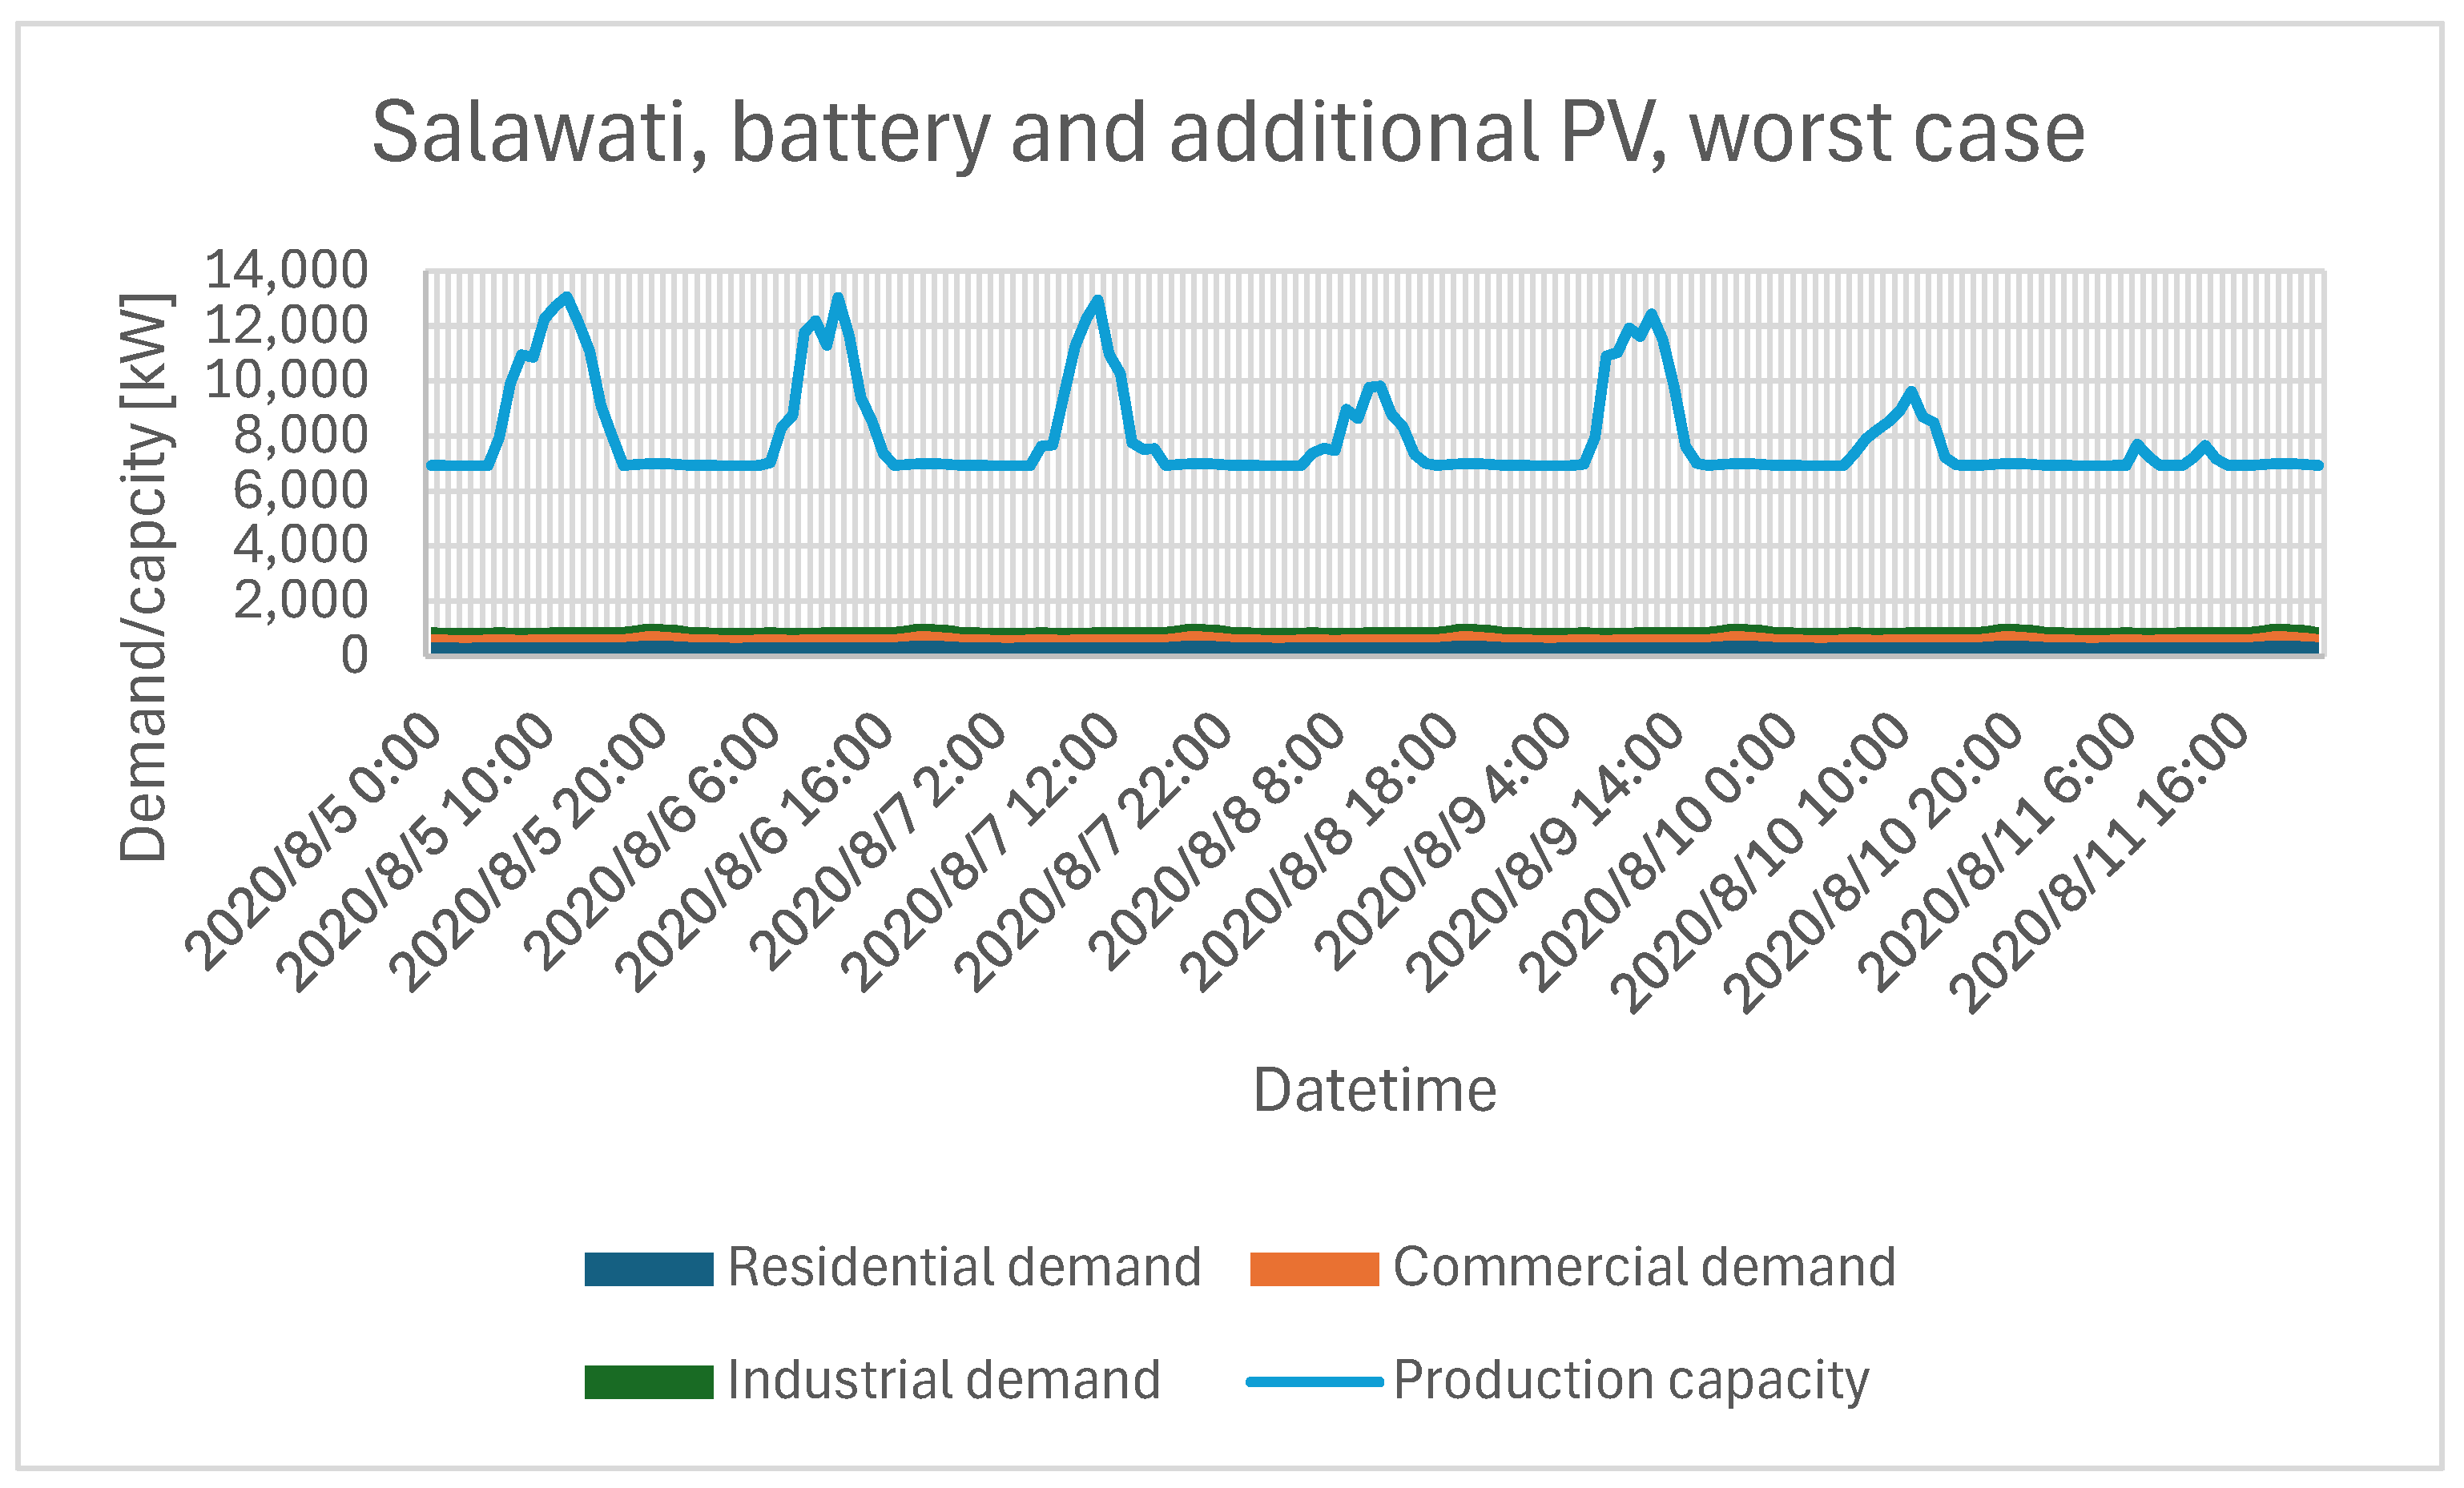
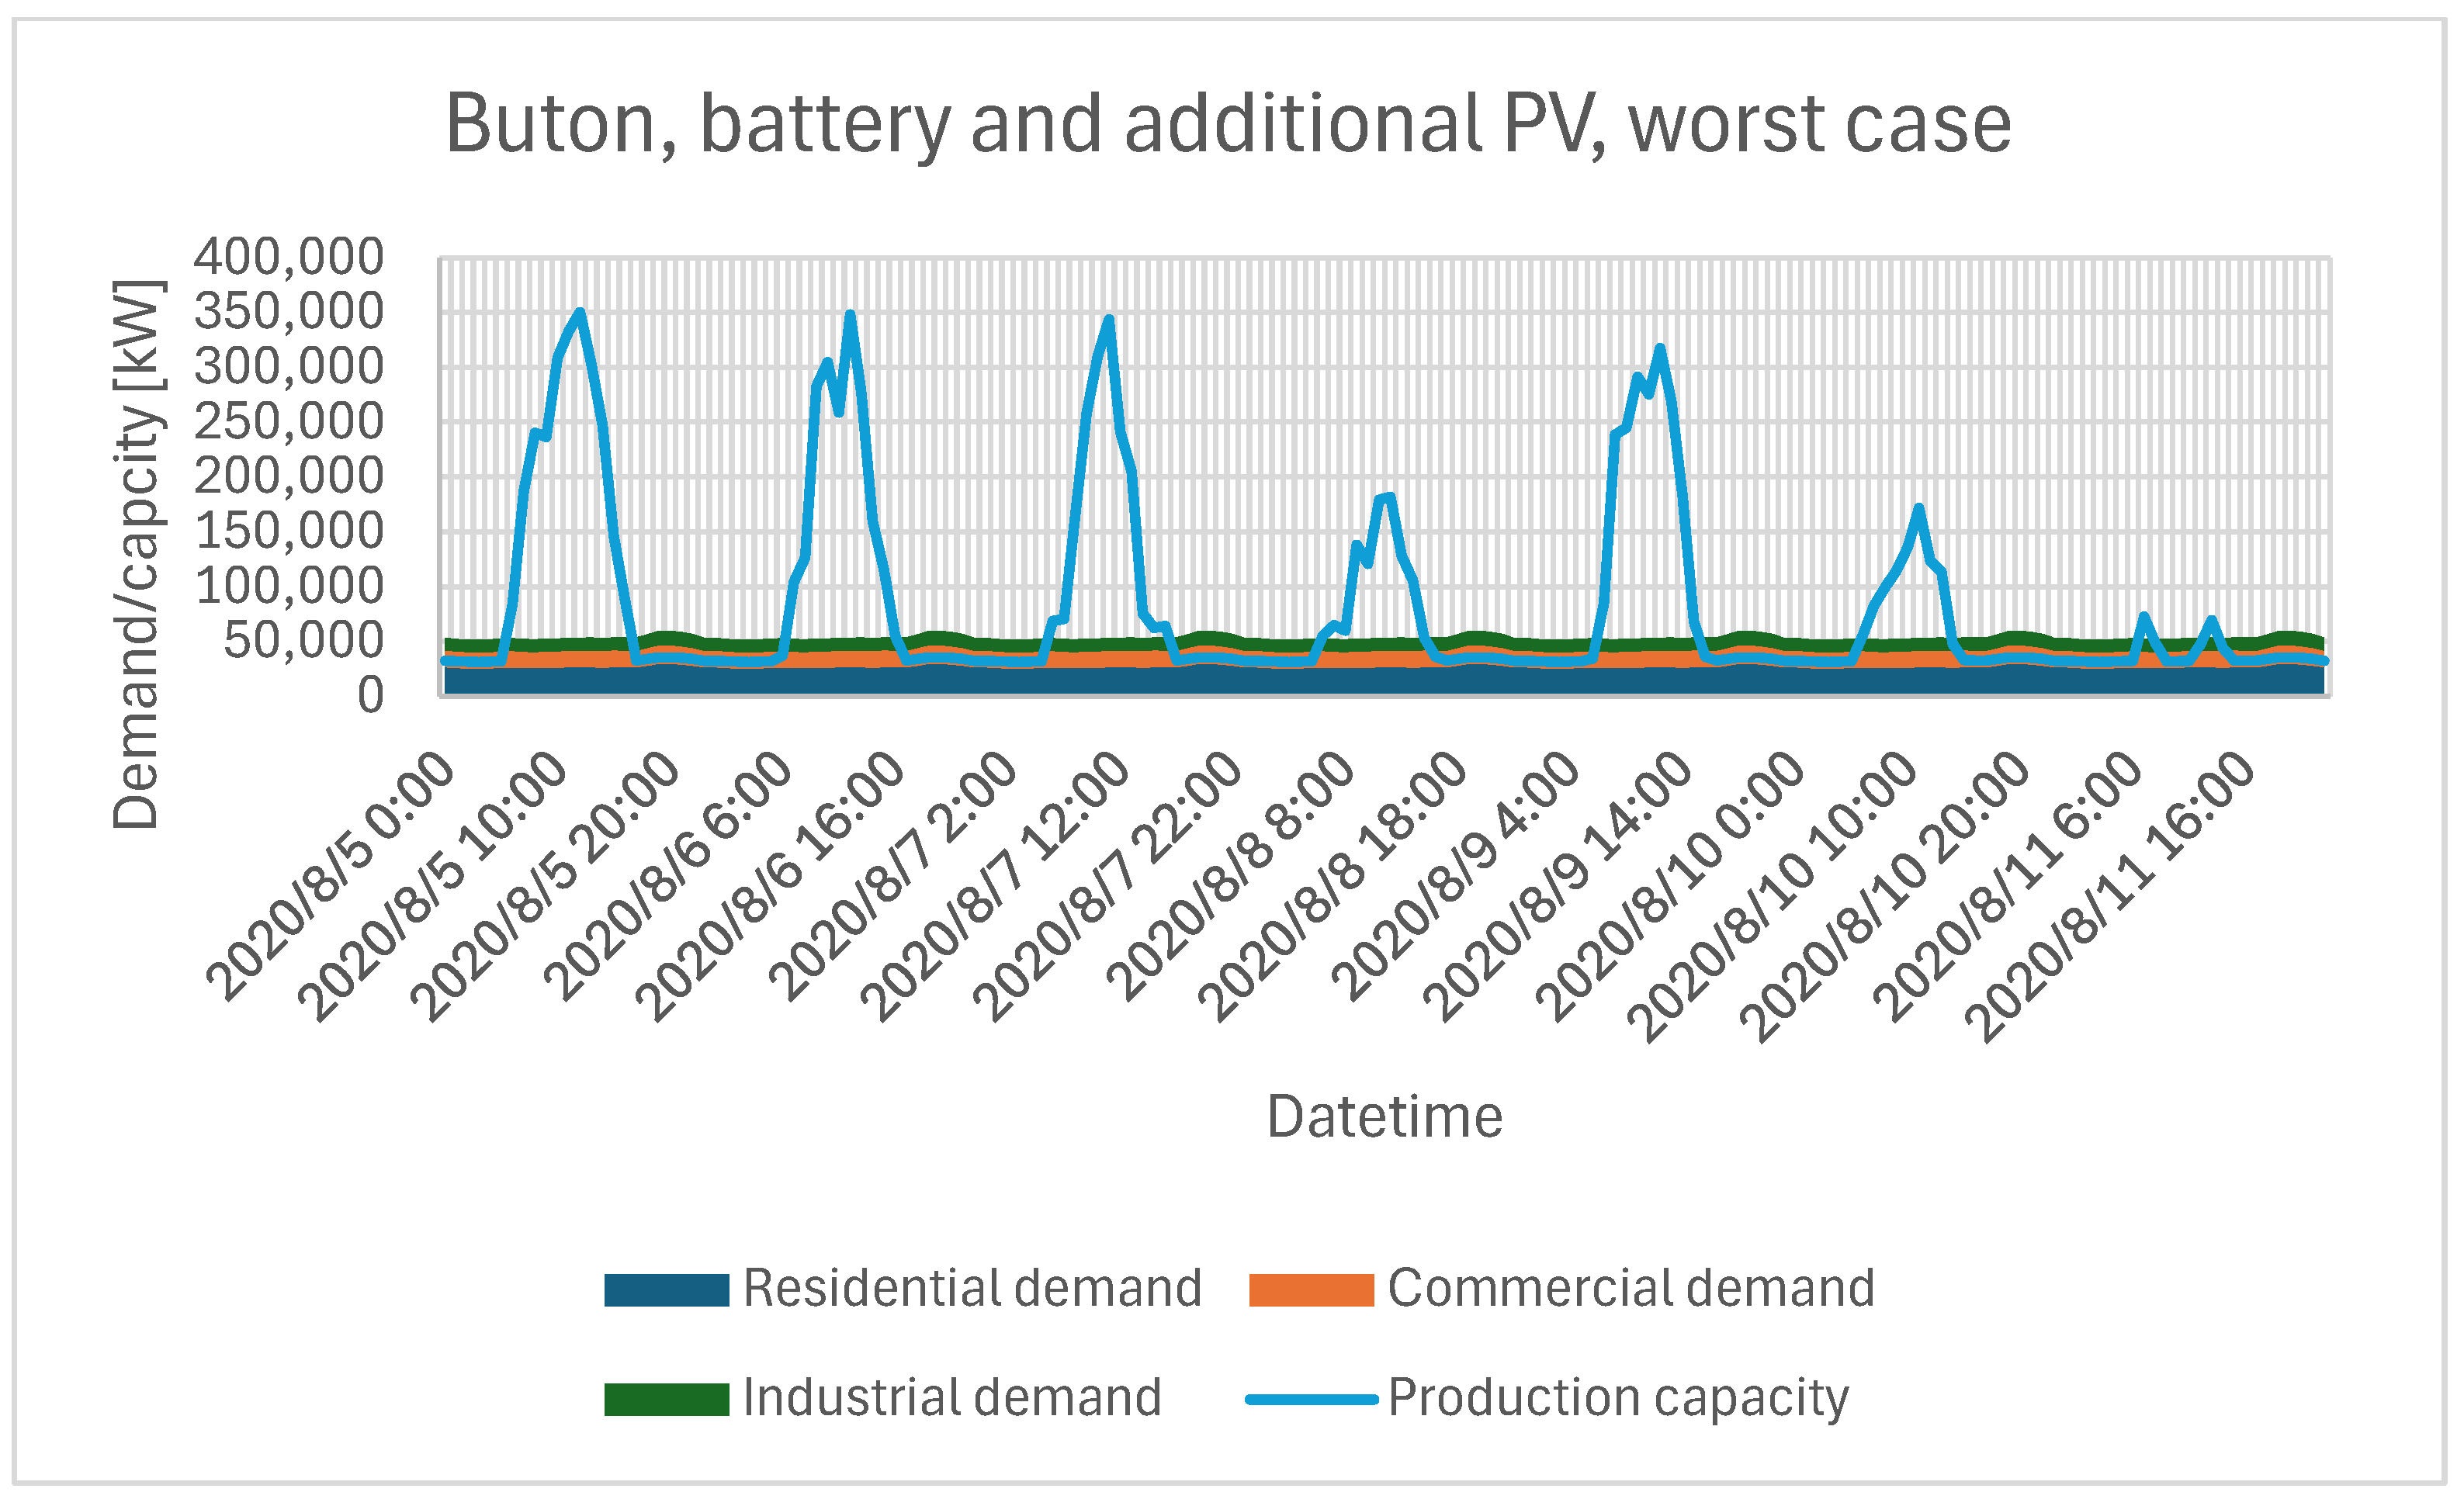
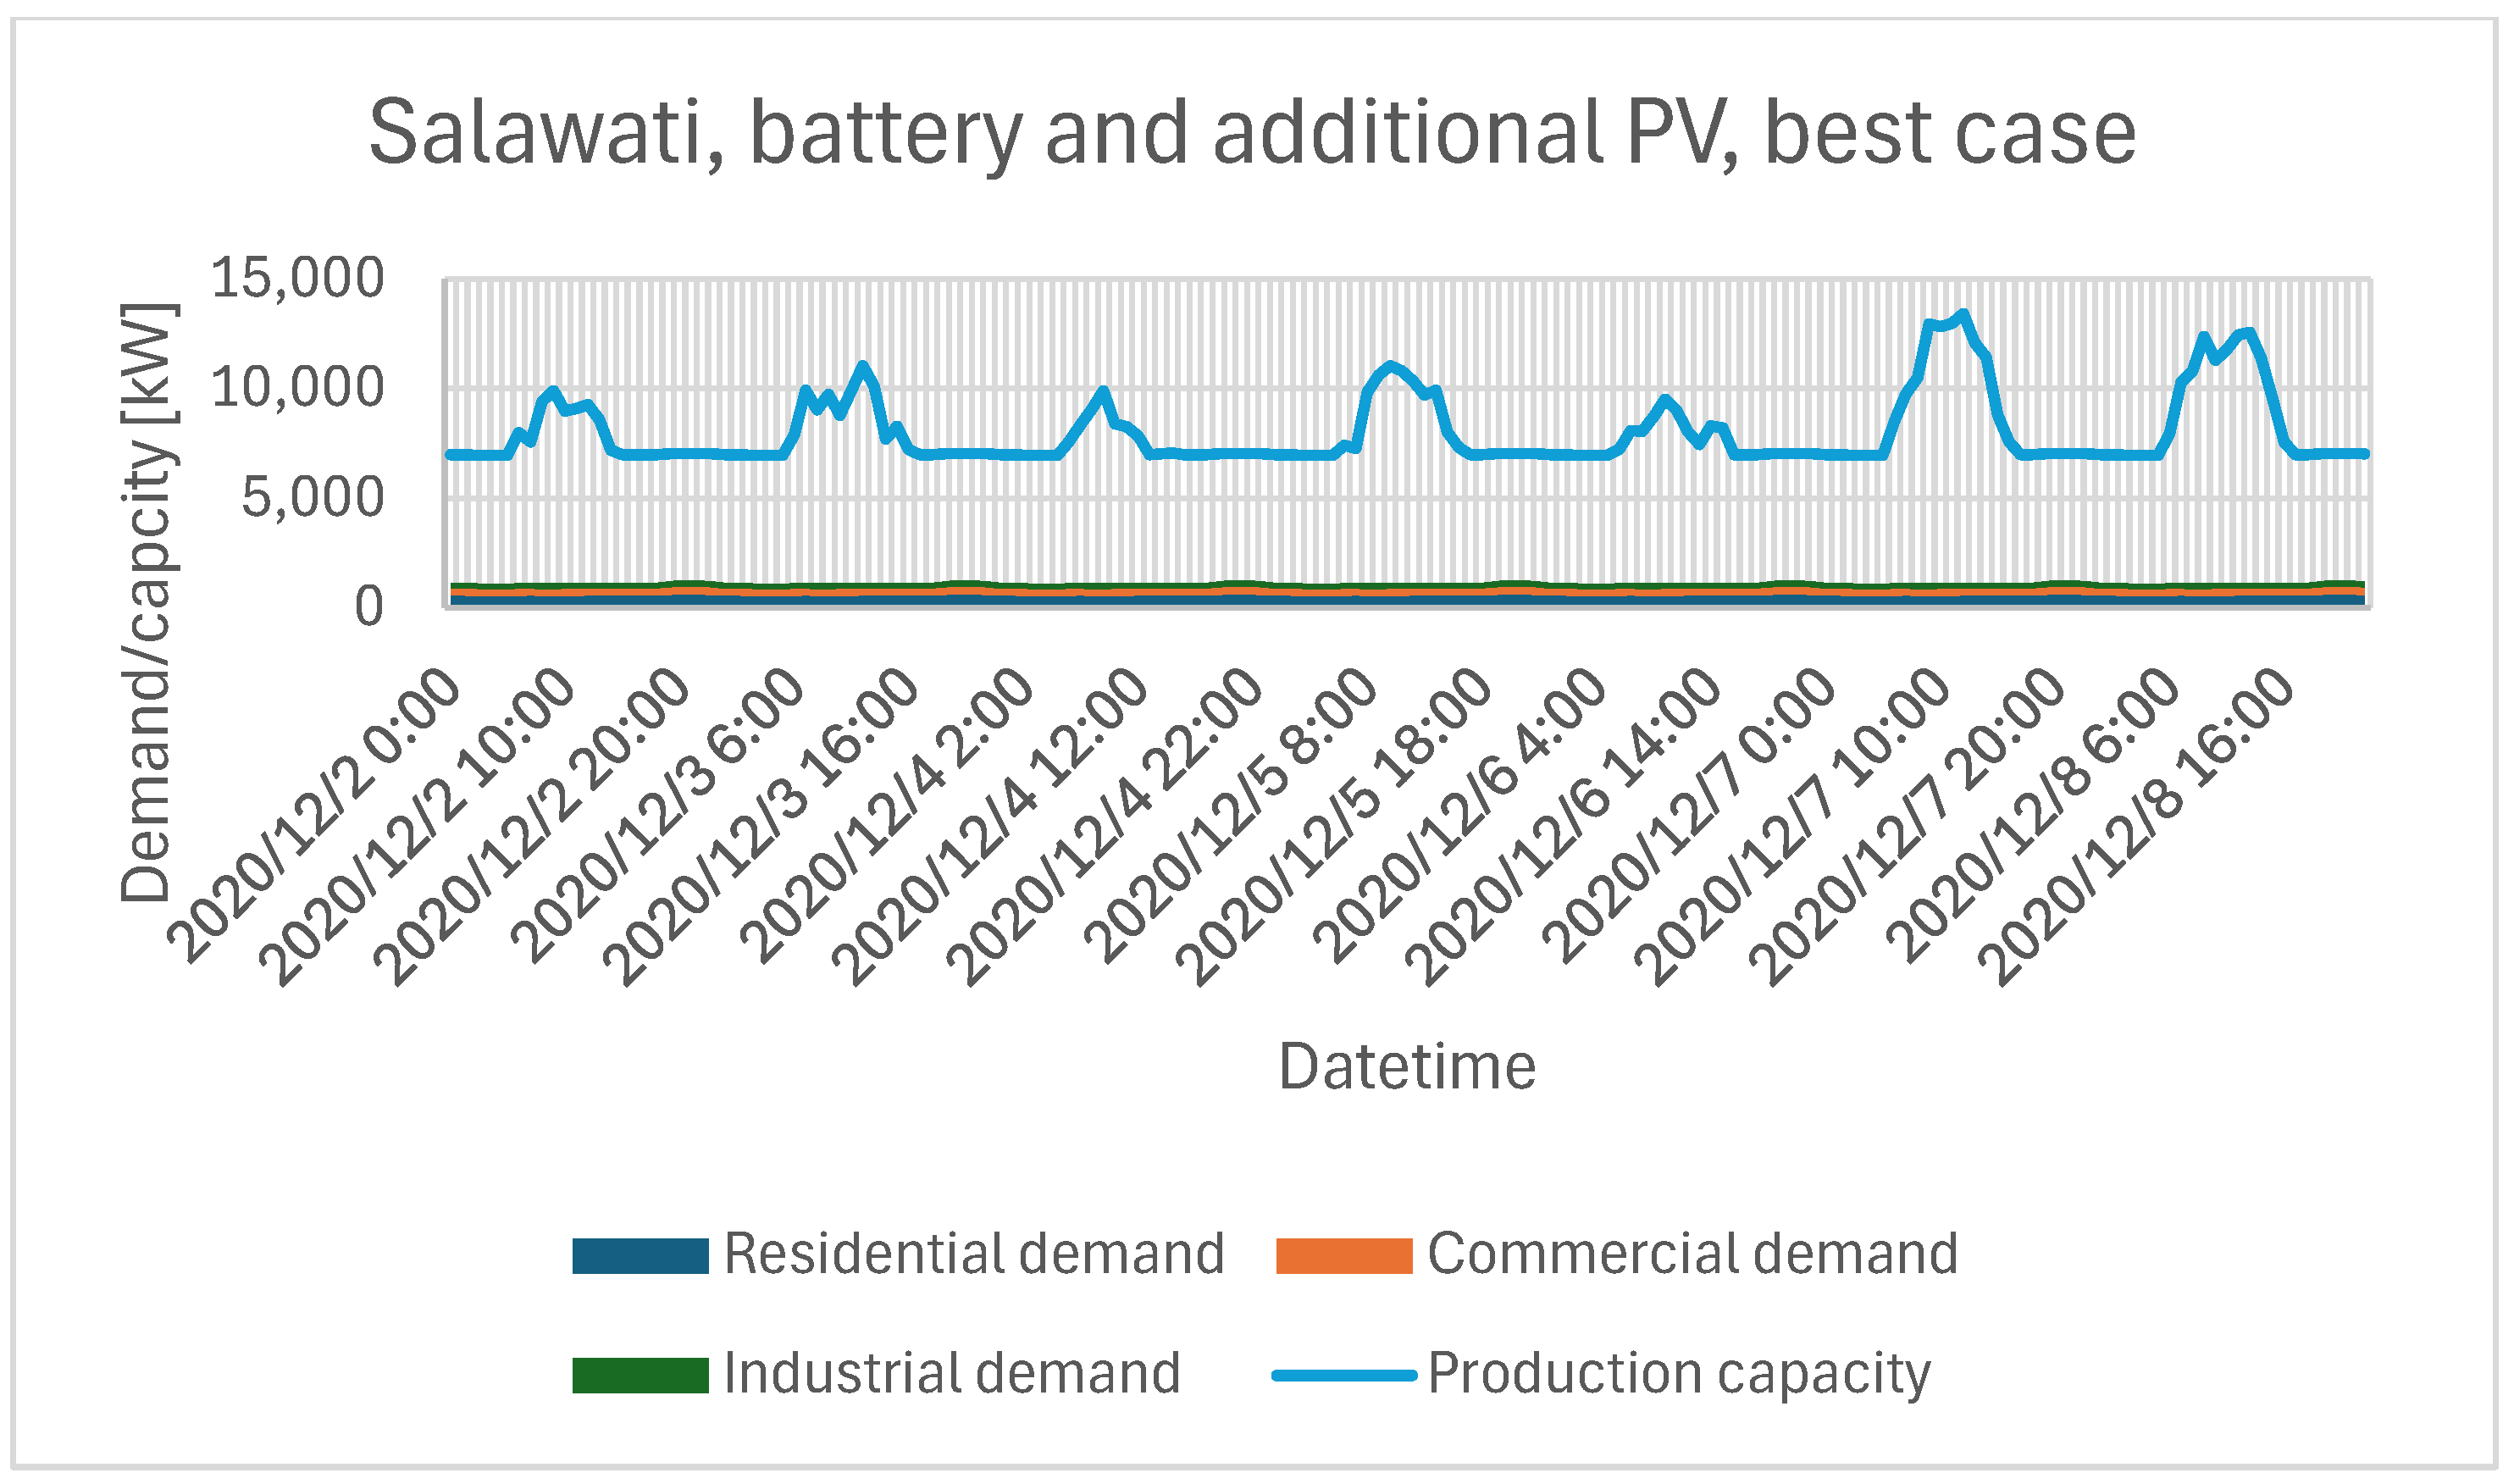
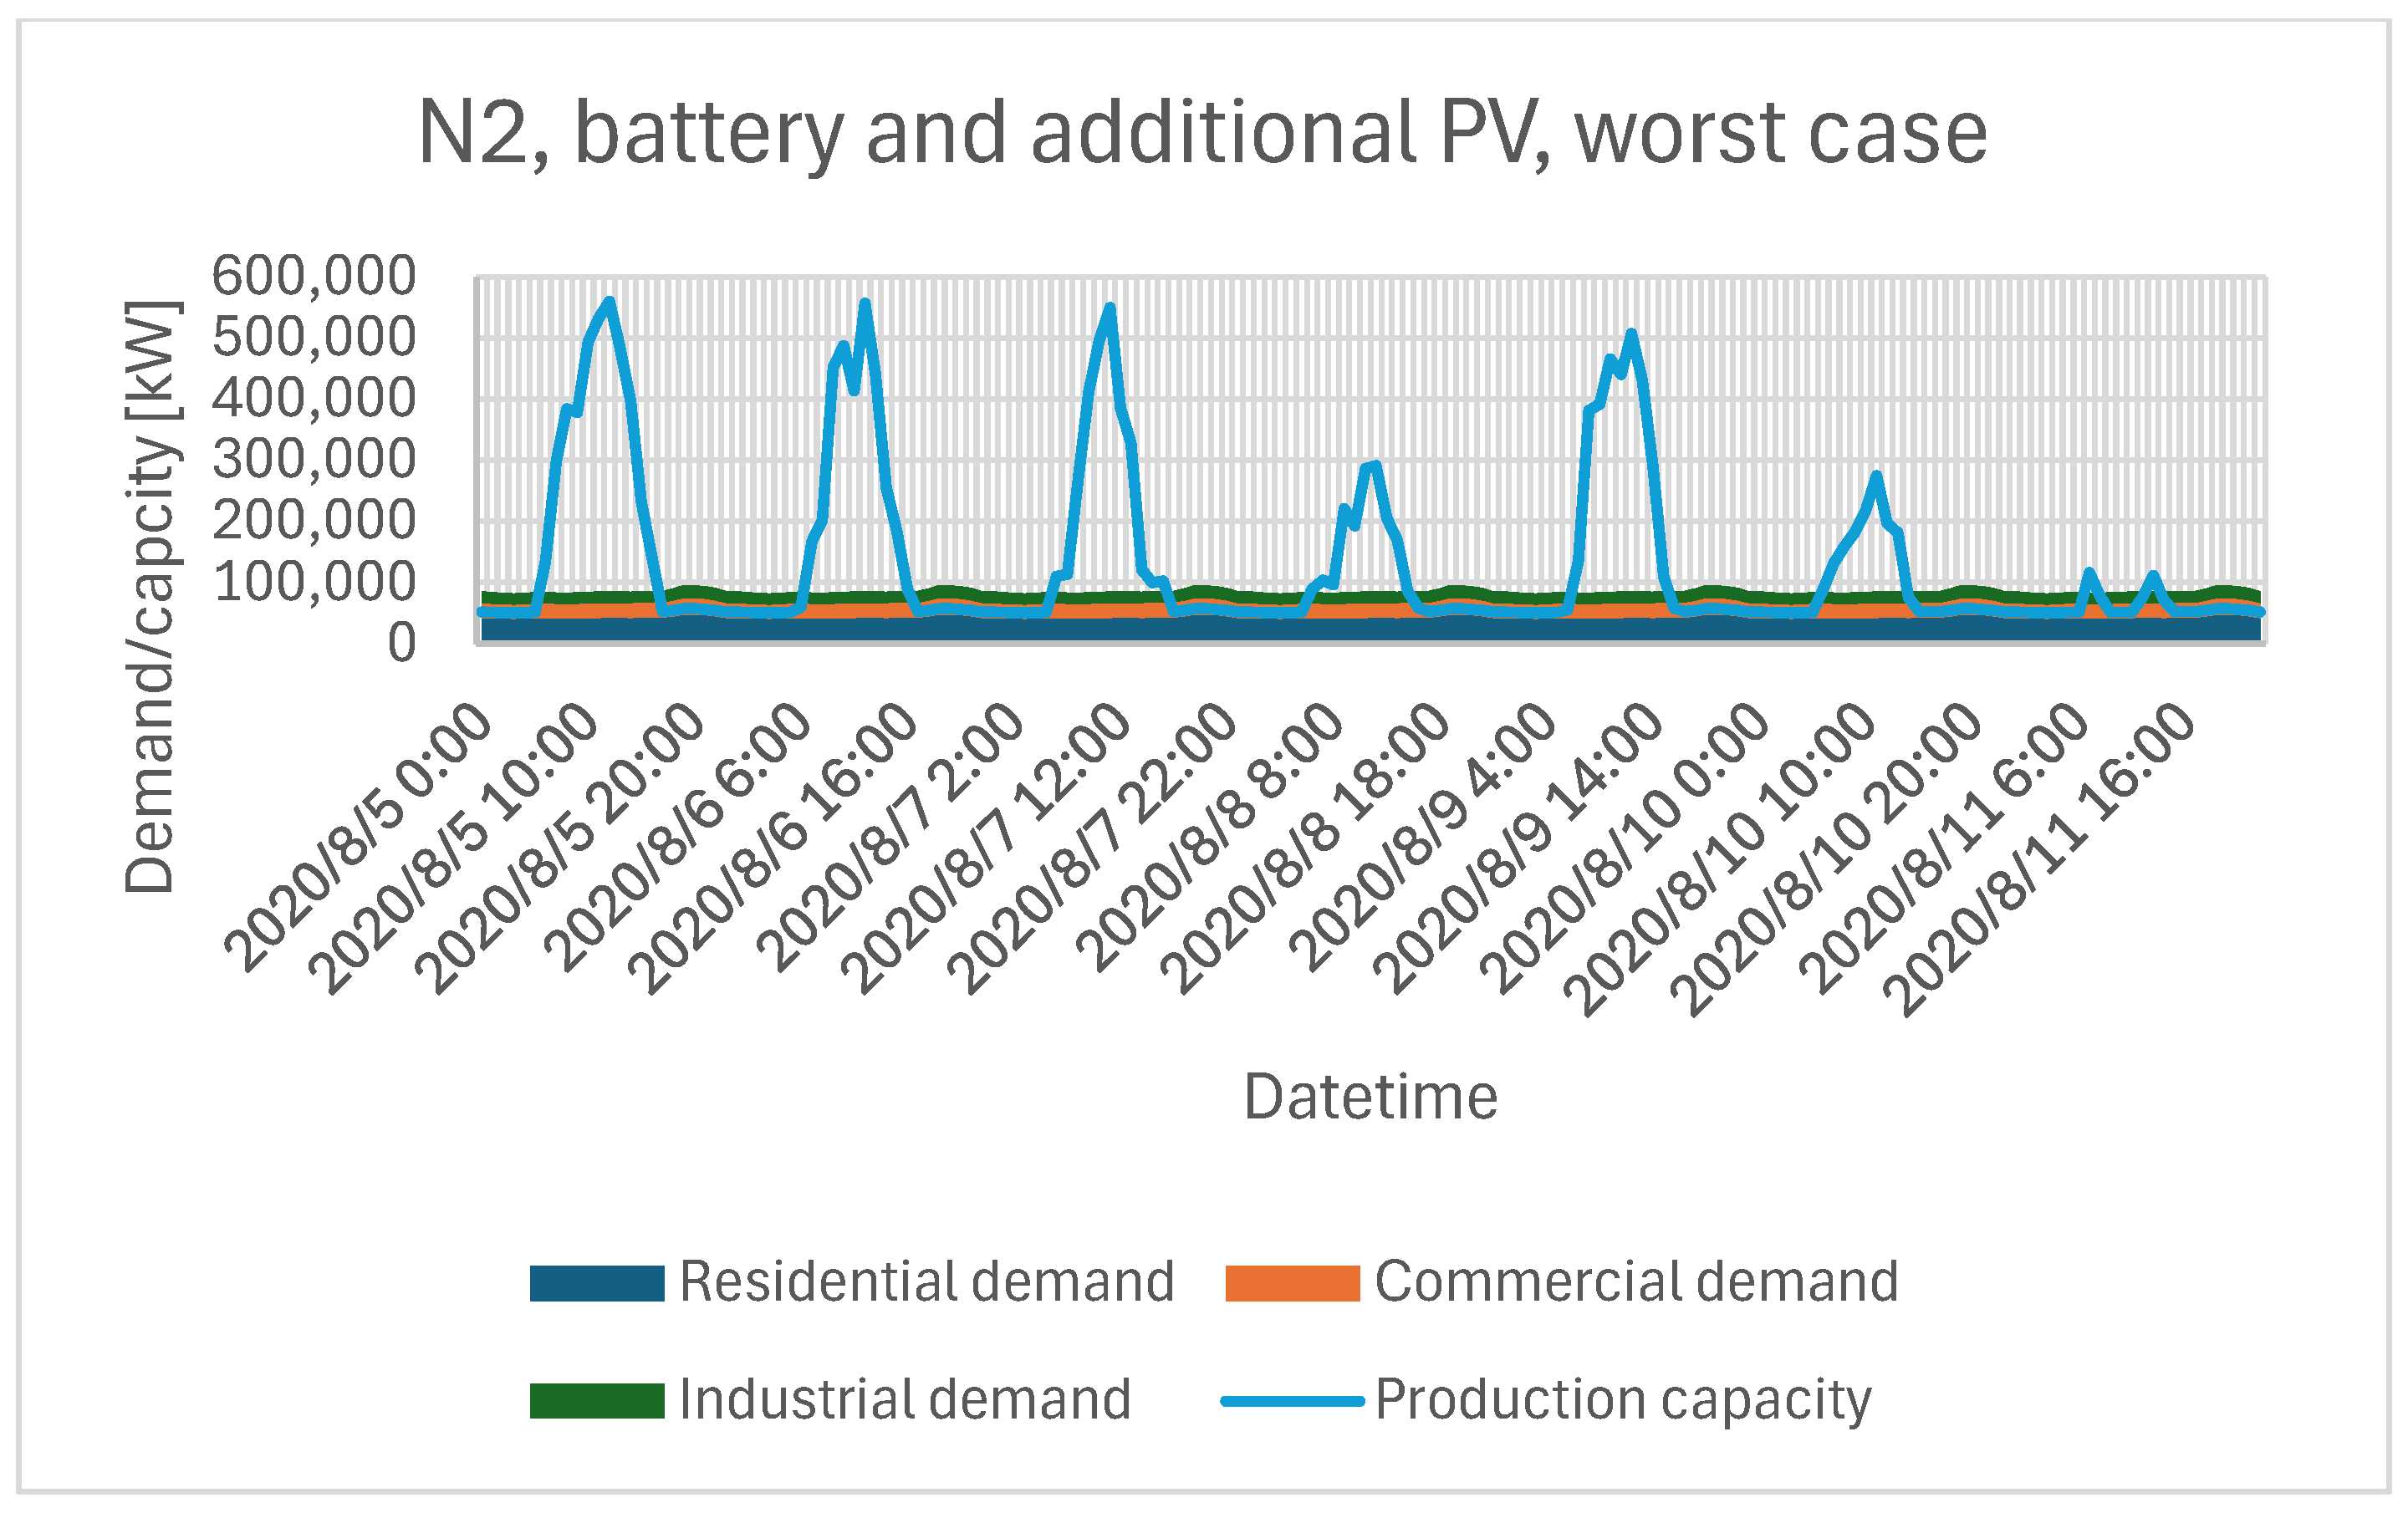
6.2.3. Effect of PV and Battery Expansion

With the HOMER Pro-derived capacity expansions in place, a second round of simulations tested whether incremental PV and storage could further minimize or eliminate outages. Figure 15, Figure 16, Figure 17 and Figure 18 display time-series load balancing for Salawati and Buton in worst- and best-case windows. In general, Salawati’s surplus becomes even more pronounced, reflecting how additional solar capacity remains underutilized if local demand is relatively low. Meanwhile, Buton shows a dramatic decrease in unmet demand once it installs higher PV and battery capacities. This analysis shows that increasing PV and battery capacities can eliminate or sharply reduce unmet demand for residential, commercial, and industrial loads—concrete evidence of the resilience benefits of PV + storage expansion.
Although most of the microgrids benefit substantially from these capacity upgrades, certain systems, such as N2, still experience shortfalls at peak periods. Figure 19, showing the worst-case week in the enhanced N2 system, indicates that rising loads periodically outpace the combined solar–storage output, resulting in partial unmet demand. This shortfall hints that more advanced scheduling methods or supplementary generation (e.g., biomass, wind, or micro-hydro) may be necessary in high-demand islands.

6.3. Comparative Analysis of Scenario Outcomes

6.3.1. Unmet Demand and Load Coverage

Table 10 and Table 11 provide a quantitative breakdown of unmet demand for residential, commercial, and industrial loads in worst-case and best-case scenarios, respectively. Notably, Salawati and Batanta achieve zero unmet demand in both scenarios, whether isolated or networked. In contrast, Buton and Muna display high levels of unmet demand without PV and battery upgrades, signaling an urgent need for renewable integration.

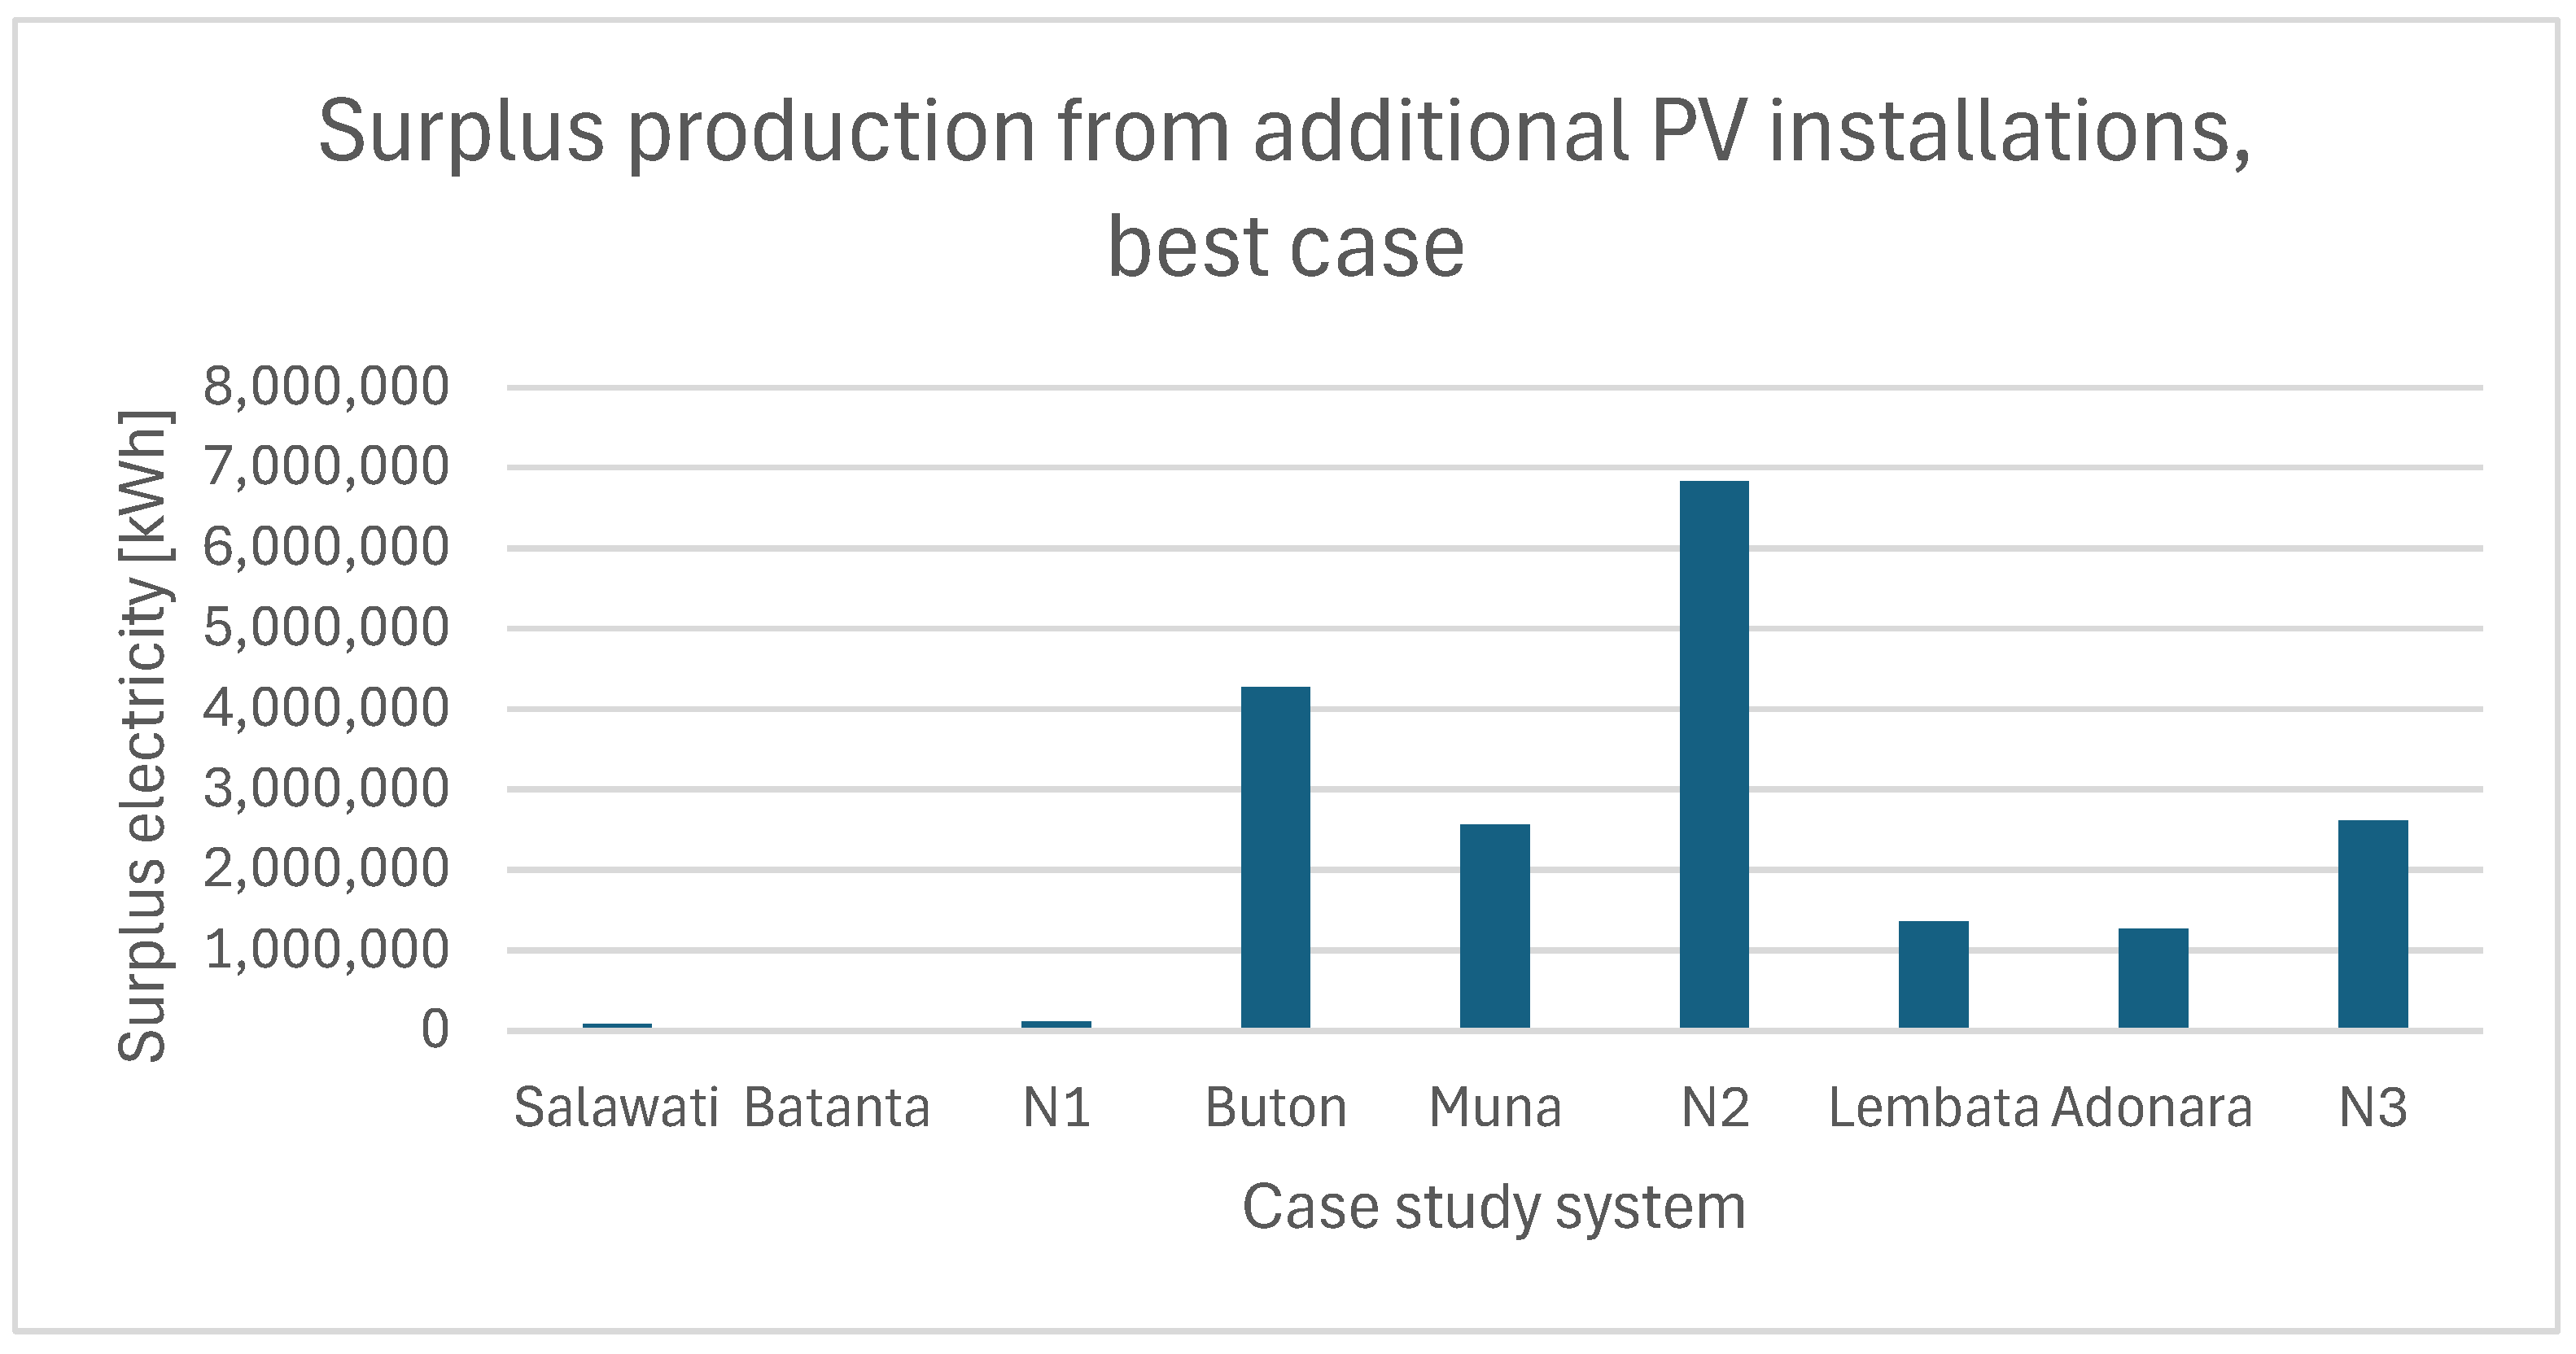
6.3.2. Surplus Generation and Resource Utilization

In microgrids with large-scale PV, surplus energy exceeding real-time consumption frequently emerges, particularly during midday peaks. Figure 20 quantifies the total surplus generation across selected systems. N2, for instance, exhibits approximately 6.8 GWh of unused energy in the best-case week, pointing to potential inefficiencies if demand-side management or additional storage is not introduced. Converting surplus energy to other forms (e.g., hydrogen or pumped hydro) or exporting it to the main grid (if available) are strategies that future work could explore to enhance overall utilization.
Systems like N1 show lower surplus because shared loads between Salawati and Batanta efficiently absorb most of the renewable output. This finding highlights how carefully planned networked configurations reduce wasted solar resources, a result that aligns with prior research emphasizing synergy benefits in interconnected microgrids.

7. Discussion

This section interprets the principal findings in light of existing work on microgrid resilience, renewable energy integration, and networked operational paradigms. The results described in the preceding sections demonstrate that carefully sized solar and storage deployments, combined with inter-island connections, can markedly reduce unmet demand and enhance overall system reliability. The discussion below underscores how these outcomes align or diverge from past studies on multi-microgrid architectures while highlighting this paper’s unique contributions to methodology and application.

7.1. Comparative Insights on Renewable Integration and Storage

The simulation outcomes indicate that expanding PV capacity alongside significant battery storage is essential for islands facing frequent and prolonged disruptions. In particular, microgrids such as Buton and Muna displayed high unmet demand unless equipped with a robust combination of PV and energy storage. This conclusion is consistent with earlier research emphasizing that remote communities must rely on local renewable generation to minimize diesel consumption and strengthen supply security [1,3,16]. Multiple references likewise show that large-scale battery banks provide a critical buffer against solar intermittency, although this can lead to overcapacity when weather conditions are favorable [2,26,37].
A distinguishing aspect of the current analysis is the explicit testing of best- and worst-case weeks for each island, capturing the full seasonal volatility of solar resources. Unlike several prior studies that used average or single-peak demand curves, the present model more thoroughly isolates conditions under which high renewable availability yields significant surpluses and conditions under which local generation cannot meet essential loads [4,6,7]. This approach reveals how the interplay of PV and battery sizing influences real-time load coverage, particularly in isolated configurations. The presence of large, underutilized surpluses in certain weeks underscores the importance of demand-side management or alternative energy applications for improved resource utilization, a theme likewise recognized in references addressing multi-energy systems [8,9,21].

7.2. Effects of Networked Microgrid Operation and Resource Sharing

Several islands, such as Salawati, produce persistent generation surpluses, which could balance out the deficits observed in other locations, such as Buton. The scenario analyses demonstrated that networked microgrids help redistribute surplus electricity effectively, validating findings from earlier multi-microgrid studies that highlight the mutual gains from inter-island coordination [12,15,32]. However, the potential advantage of interconnection depends on the absolute availability of resources within the cluster. In the case of N2, even networked operation was insufficient to address high peak loads without supplementary solar capacity, aligning with prior conclusions that resource sharing cannot compensate for a fundamental lack of generation [3,7].
Additionally, the analysis highlights how network configurations can lower the overall battery requirements for a cluster by pooling resources, enabling one island’s surplus to cover another island’s peak. This outcome resonates with works that attribute cost reductions to synergy effects, where distributed renewable production sites alleviate the need for standalone redundancy [1,14,50]. At the same time, the indefinite assumption of unlimited transmission capacity remains a simplification that researchers have advised refining in future investigations [2,4]. The current findings confirm how partial or limited interconnection could reduce these benefits, supporting the idea that reliable or flexible power lines are fundamental for gaining the advantages of networked microgrids [9,55].

7.3. Alignment and Distinctions from Existing Literature

Several previous publications have integrated simulation and optimization to investigate microgrid resilience, often using robust or stochastic methods [17,23,34]. The present study’s agent-based modeling in AnyLogic, combined with the techno-economic optimization in HOMER Pro, offers a detailed representation of real-time load coverage along with a thoroughly evaluated economic design. By capturing dynamic events, such as the sudden outage of the mainland cable, and analyzing outcomes under both best- and worst-case solar conditions, the methodology more closely approximates actual island emergencies [6,11,37].
Unlike certain analyses that adopt only day-ahead or robust optimization frameworks, this research leverages agent-based dispatch logic to expose emergent phenomena, including ramping deficits or momentary storage shortfalls [10,30]. The results thus highlight not merely feasibility but also the extent of load curtailment and resource waste at sub-daily scales. This approach is particularly valuable in remote contexts with limited system inertia, a key focus of studies that examine how small islands must handle rapid changes in supply and demand [31,38].
The study also points to potential expansions, for instance, incorporating demand-side response or alternative generation sources like wind or biomass. The presence of sustained unmet demand in N2’s worst-case scenario suggests that more sophisticated dispatch coordination or multi-energy integration—strategies examined in some works—might further enhance reliability [1,3,8]. Nonetheless, the thorough demonstration of synergy between local PV and battery expansions with inter-island networking contributes an additional perspective to the existing research, offering a step toward a more holistic microgrid planning paradigm.

7.4. Novelty and Scientific Contributions

The key novelty lies in the rigorous, multi-phase modeling approach that combines data-driven load generation, HOMER Pro optimization for renewable and storage sizing, and agent-based dynamic simulation of interconnected microgrids. Earlier investigations often adopt one of these approaches in isolation, potentially overlooking emergent operational behaviors or ignoring optimization trade-offs [7,34,40]. By systematically embedding recommended capacities into a real-time simulation, this paper bridges that gap, providing a cohesive view of how expansions in PV and battery storage translate to tangible improvements under realistic island conditions.
Furthermore, the study’s emphasis on best- and worst-case solar weeks for each island, rather than generalized mean conditions, clarifies how microgrids perform at the extremes of resource availability. While earlier resilience-oriented publications frequently concentrate on single-peak or average load conditions [4,17], the present work uncovers mismatches in the timing and magnitude of surpluses and deficits. This nuance not only underscores the essential role of large-scale batteries but also validates how networking can reduce stranded energy and help critical loads remain served.
In addition, the findings highlight that high-penetration PV islands (such as Salawati) can play the role of energy “exporters” in a cluster, substantially improving system-wide reliability. This insight aligns partially with existing multi-microgrid frameworks but offers a fresh lens on how strong solar islands can compensate for resource-limited counterparts, potentially lowering overall capital expenditure in a multi-island system [8,15,51]. The integrated methodology and the detailed scenario-based results thus represent both a methodological expansion and a new application in the context of Indonesian island electrification.
Overall, the analysis confirms that high solar integration and strategic inter-island links can significantly enhance power reliability for remote communities vulnerable to extended cable disruptions. Comparisons with the literature show consistency in the efficacy of local renewables and shared networks, but the multi-scenario exploration, agent-based dispatch modeling, and emphasis on real-time synergy distinguish this study’s scientific contribution. The subsequent section explores the broader implications for system design and policy, along with opportunities for extending the framework to incorporate dynamic line limits and advanced demand-side measures.

8. Conclusions

This study examined how localized renewable generation, battery storage, and networked microgrid configurations can strengthen the resilience of island communities subject to severe cable disruptions. By integrating agent-based simulation in AnyLogic with techno-economic capacity optimization in HOMER Pro, the research provided an in-depth exploration of microgrid performance in both standalone and interconnected modes under best-case and worst-case scenarios. The main findings reveal that strategic expansions of PV capacity and battery storage can eliminate or sharply reduce unmet demand for high-priority loads. Further, inter-island power sharing was shown to improve overall resource allocation, especially in clusters where surplus-producing islands could offset deficits in energy-deficient zones. These results confirm and extend the existing literature on multi-microgrid architectures, thereby advancing the quantitative understanding of how renewable integration and system design bolster supply security.
Several conclusions arise from the scenario-based analyses. First, reliable coverage of residential loads in crisis conditions depends heavily on adequate local renewables and storage. Microgrids lacking these resources experienced significant deficits, confirming previous findings that robust energy autonomy requires both generation capacity and storage solutions. Second, networked microgrids reduce redundant capacity by tapping surpluses from resource-rich islands. The agent-based approach, however, offered novel insights into dynamic curtailments, ramp constraints, and transient load imbalances. In contrast to standard dispatch or optimization alone, the combined methodology revealed emergent phenomena unique to real-time interactions of generation, storage, and load priorities. These methodological advances constitute the research’s principal scientific contribution.
From a practical standpoint, the presented framework highlights that local solar and batteries, even if initially expensive, can significantly lessen dependence on diesel and mitigate protracted power outages. The case studies emphasize that certain islands, such as Salawati, can act as net exporters to their microgrid peers, offering pathways to more cost-effective regional solutions that avoid installing large-scale storage on each island. Policymakers and local utilities may thus consider cooperative procurement of generation and storage assets, reinforcing transmission lines among nearby islands to unlock these economies of scale. More detailed coordination, including scheduling, dynamic line limits, and real-time exchange prices, can further optimize the cluster-wide operation. For many developing regions with widely spread island communities, these findings underscore the transformative role of networked microgrids in upgrading rural electrification portfolios.
Despite its comprehensive structure, the analysis incorporated a set of simplifying assumptions. The unlimited interconnection capacity between islands may overestimate the benefits of power sharing since realistic line constraints or transmission losses were not modeled. Similarly, consumer loads were kept static outside of merit-order load shedding, overlooking potential demand response measures or elastic price signals that might further reduce unmet demand. The absence of detailed cost modeling around distribution infrastructure or interconnection expansions also limits the assessment of capital expenditure to the generation and storage assets. Lastly, the research focused primarily on solar resources, with no explicit treatment of additional renewables or combined heat and power units that may offer complementary output profiles.
Several improvements could be explored in subsequent work. Future studies may refine the network model by implementing realistic line capacities, electrical losses, or dynamic reconfiguration to identify bottlenecks and assess how partial interconnections affect cluster performance. Introducing demand-side flexibility through direct load control or real-time pricing strategies could reveal how consumer participation further stabilizes system operations under adverse weather conditions. Researchers might also explore multi-energy systems that couple electricity with heating, cooling, or hydrogen production, thereby enabling more effective utilization of surplus renewable output. Beyond the scope of Indonesian islands, the integrated simulation–optimization framework could be tailored to other remote or high-risk regions where networked microgrids have the potential to improve resilience and encourage greater renewable penetration.

Author Contributions

Conceptualization, Z.G.M. and B.N.J.; Data curation, M.V. and L.C.; Formal analysis, M.V., L.C. and J.D.B.; Funding acquisition, Z.G.M. and B.N.J.; Investigation, Z.G.M., M.V., L.C. and J.D.B.; Methodology, Z.G.M., M.V., L.C., J.D.B. and B.N.J.; Project administration, Z.G.M. and B.N.J.; Resources, Z.G.M.; Software, M.V., L.C. and J.D.B.; Supervision, Z.G.M. and B.N.J.; Validation, Z.G.M., M.V., L.C., J.D.B. and B.N.J.; Visualization, Z.G.M., M.V. and L.C.; Writing—original draft, Z.G.M., M.V., L.C. and J.D.B.; Writing—review and editing, Z.G.M. and B.N.J. All authors have read and agreed to the published version of the manuscript.

Funding

This research is part of the TECH-IN project (Project title: Microgrid Technologies for Remote Indonesian Islands, 2021–2024) funded by Danida Fellowship Centre, Denmark.

Data Availability Statement

The data utilized in this study originates from a combination of publicly available sources, computational modeling, and simulation-generated outputs. Due to licensing restrictions of HOMER Pro and AnyLogic and proprietary constraints on certain simulation outputs, raw simulation datasets and optimization results are available upon request from the corresponding author. Publicly available datasets referenced in this study can be accessed through cited government and institutional repositories.

Conflicts of Interest

The authors declare no conflicts of interest.

Abbreviations

The following abbreviations are used in this manuscript:
PVPhotovoltaic
MGMicrogrid
NMGNetworked Microgrid
DRDemand Response
NPCNet Present Cost
LCOELevelized Cost of Energy
CCHPCombined Cooling, Heating, and Power
ADMMAlternating Direction Method of Multipliers
MILPMixed-Integer Linear Programming
MIQPMixed-Integer Quadratic Programming
EMSEnergy Management System
DeePCData-enabled Predictive Control
VCGVickrey-Clarke-Groves
HFCVsHydrogen Fuel Cell Vehicles
ANFISAdaptive Neuro-Fuzzy Inference System
H∞H-infinity (robust control design)
MPCModel Predictive Control
BESSBattery Energy Storage System
H2Hydrogen (chemical symbol)
CCGColumn-and-Constraint Generation
PEMProbabilistic Energy Management (commonly used in literature)
QAROQuantile-based Adaptive Robust Optimization (inferred)
TRO(TRO method—a robust optimization approach; specific full name not provided)
P2PPeer-to-Peer
LFCLoad Frequency Control
VSMVirtual Synchronous Machine
SPBO(Modified SPBO—an optimization approach; full name not explicitly defined)
KKTKarush-Kuhn-Tucker
ESOCEnergy Storage State-of-Charge
WOA-SOCPWhale Optimization Algorithm—Second-Order Cone Programming

References

  1. Yu, J.; Bao, S.; Li, S.; Wu, H.; Li, H. Robust Optimization of Multi-Microgrid Systems In Cchp Regions Considering Self-Built Shared Energy Storage Station. Taiyangneng Xuebao/Acta Energiae Solaris Sin. 2025, 46, 503–513. [Google Scholar] [CrossRef]
  2. Zhang, H.; Wang, X.; Li, Y.; Li, J. Distributed Robust Optimization of Multi-Energy Microgrid Clusters. In Proceedings of the 2024 4th International Conference on Energy Engineering and Power Systems (EEPS), Hangzhou, China, 9–11 August 2024; pp. 472–477. [Google Scholar]
  3. Ji, S.; Liu, Y.; Wu, S.; Li, X. Resilience Improvement of Microgrid Cluster Systems Based on Two-Stage Robust Optimization. Energies 2024, 17, 4287. [Google Scholar] [CrossRef]
  4. Shi, Z.; Zhang, T.; Liu, Y.; Feng, Y.; Wang, R.; Huang, S. Energy management of multi-microgrid system with renewable energy using data-driven distributionally robust optimization. Int. J. Green Energy 2024, 21, 2699–2711. [Google Scholar] [CrossRef]
  5. Wang, H.; Tang, T.; Wang, W.; Zhang, Y.; Tang, Y.; Sun, F. Distributed Voltage and Frequency Cooperative Control for Isolated Microgrid Cluster Based on Adaptive Artificial Neural Network. J. Power Supply 2023, 21, 105–114. [Google Scholar] [CrossRef]
  6. Ediriweera, W.E.P.S.; Lidula, N.W.A. Adaptive Load Shedding Technique for Energy Management in Networked Microgrids. In Proceedings of the 2023 IEEE 17th International Conference on Industrial and Information Systems (ICIIS), Peradeniya, Sri Lanka, 25–26 August 2023; pp. 465–470. [Google Scholar]
  7. Xu, Y.; Zhang, S.; Zhang, T.; Wang, L.; Mi, L. Multi-microgrid-prosumer Group Adaptive Robust Distributed Collaborative Optimization Based on Triple Game. Dianwang Jishu/Power Syst. Technol. 2024, 48, 4143–4156. [Google Scholar] [CrossRef]
  8. Chen, Z.; Fan, F.; Tai, N.; Hu, Y.; Li, R. Coordinated Energy Dispatch and Flexibility Support for Microgrid Cluster Using Rule-Based Stackelberg Gaming Approach. IEEE Trans. Ind. Appl. 2024, 60, 1564–1575. [Google Scholar] [CrossRef]
  9. Ghadimi, M.; Moghaddas-Tafreshi, S.M. Enhancing the economic performance and resilience in a multi-area multi-microgrid system by a decentralized operation model. Electr. Power Syst. Res. 2023, 224, 109692. [Google Scholar] [CrossRef]
  10. Wu, N.; Wang, Z.; Li, X.; Lei, L.; Qiao, Y.; Linghu, J.; Huang, J. Research on real-time coordinated optimization scheduling control strategy with supply-side flexibility in multi-microgrid energy systems. Renew. Energy 2025, 238, 121976. [Google Scholar] [CrossRef]
  11. Tan, S.; Xie, P.; Guerrero, J.M.; Vasquez, J.C.; Alcala, J.M.; Carreno, J.E.M.; Guerrero-Zapata, M. Lyapunov-Based Resilient Cooperative Control for DC Microgrid Clusters Against False Data Injection Cyber-Attacks. IEEE Trans. Smart Grid 2024, 15, 3208–3222. [Google Scholar] [CrossRef]
  12. Schneider, K.P.; Sun, X.; Tuffner, F.K. Adaptive Load Shedding as Part of Primary Frequency Response to Support Networked Microgrid Operations. IEEE Trans. Power Syst. 2023, 39, 287–298. [Google Scholar] [CrossRef]
  13. Liu, Y.; Dou, Z.; Wang, Z.; Guo, J.; Zhao, J.; Yin, W. Optimal Configuration of Electricity-Heat Integrated Energy Storage Supplier and Multi-Microgrid System Scheduling Strategy Considering Demand Response. Energies 2024, 17, 5436. [Google Scholar] [CrossRef]
  14. Aly, M.; Mohamed, E.A.; Ahmed, E.M. Boosting Frequency Stability in Multi-Microgrid Systems with an Innovative Dual-Hybrid Fractional Control Scheme Integrating Demand Response. IEEE Access 2024, 12, 175304–175327. [Google Scholar] [CrossRef]
  15. Zhang, H.; Wang, X.; Li, Y.; Li, J. Optimal Strategy of Multi-microgrid System Stackelberg Game Operation Considering Photovoltaic Consumption and Integrated Demand Response. In Proceedings of the 2024 IEEE International Conference on Energy Internet (ICEI), Zhuhai, China, 1–3 November 2024; pp. 472–477. [Google Scholar]
  16. Qin, D.; Wang, C.; Liu, Y.; Wu, R.; Hou, D.; Huang, W.; Chen, L. Consensus-Based Coordinated Control of Flexible Interconnected DC Microgrid Clusters. Energies 2024, 17, 43. [Google Scholar] [CrossRef]
  17. Alamir, N.; Kamel, S.; Jurado, F.; Abdelkader, S.M. Stochastic Energy Management Framework for Multi-Microgrid with Demand Response and Battery Storage. In Proceedings of the 2024 International Conference on Artificial Intelligence, Computer, Data Sciences and Applications (ACDSA), Victoria, Seychelles, 1–2 February 2024; pp. 1–6. [Google Scholar]
  18. Weslie, S.K.S.; Saifuddin, M.R.; Panda, G.; Naayagi, R.T. Microgrid in Grid-Tied and Islanded Mode: Asset Configuration and Operating Cost Optimization. In Sustainable Energy and Technological Advancements; Springer Nature: Singapore, 2023; pp. 171–181. [Google Scholar]
  19. Shufian, A.; Hoque, M.J.-A.-M.; Kabir, S.; Mohammad, N. Optimized Performance and Economic Assessment for Hybrid Island Microgrid System Considering Uncertainties. Technol. Econ. Smart Grids Sustain. Energy 2022, 7, 32. [Google Scholar] [CrossRef]
  20. Moazzen, F.; Hossain, M.J. A two-layer strategy for sustainable energy management of microgrid clusters with embedded energy storage system and demand-side flexibility provision. Appl. Energy 2025, 377, 124659. [Google Scholar] [CrossRef]
  21. Zhao, J.; Tao, L.; Zhao, W.; Sun, H. Optimization of Shared Energy Storage Capacity for Multi-microgrid Operation with Flexible Loads and Economic Dispatch. In World Hydrogen Technology Convention; Springer Proceedings in Physics; Springer Nature: Singapore, 2023; Volume 394, pp. 63–80. [Google Scholar]
  22. Yu, W.; Tang, Z.; Xiong, W. Distributed robust data-enabled predictive control based voltage control for networked microgrid system. Electr. Power Syst. Res. 2024, 231, 110360. [Google Scholar] [CrossRef]
  23. Yassim, H.M.; Abdullah, M.N.; Gan, C.K.; Ahmed, A.; Tee, W.H.; Azmi, A. Hierarchical Energy Management Strategy for an Islanded Networked Microgrid Considering Flexible Inter-Microgrid Power Exchange. In Proceedings of the 2024 IEEE Sustainable Power and Energy Conference (iSPEC), Kuching, Sarawak, Malaysia, 24–27 November 2024; pp. 1–6. [Google Scholar]
  24. Wang, M.; Xu, Y.; Dong, H.; Xiang, Y.; Fan, W. Scheduling optimization of multi-microgrid cooperative alliance considering demand response. Electr. Meas. Instrum. 2024, 61, 157–164. [Google Scholar]
  25. Sun, H.; Zou, H.; Jia, J.; Shen, Q.; Duan, Z.; Tang, X. Master–Slave Game Optimization Scheduling of Multi-Microgrid Integrated Energy System Considering Comprehensive Demand Response and Wind and Storage Combination. Energies 2024, 17, 5762. [Google Scholar] [CrossRef]
  26. Siqin, T.; He, S.; Hu, B.; Fan, X. Shared energy storage-multi-microgrid operation strategy based on multi-stage robust optimization. J. Energy Storage 2024, 97, 112785. [Google Scholar] [CrossRef]
  27. Seyednouri, S.R.; Safari, A.; Quteishat, A.; Younis, M.A.; Salehi, J.; Najafi, S.; Taghizadegan, N. Stochastic energy management of a multi-microgrid system with battery/supercapacitor energy storages considering demand response and transactive energy. Renew. Energy Focus 2024, 48, 100531. [Google Scholar] [CrossRef]
  28. Oh, B.C.; Son, Y.G.; Zhao, D.; Singh, C.; Kim, S.Y. A Bi-Level Approach for Networked Microgrid Planning Considering Multiple Contingencies and Resilience. IEEE Trans. Power Syst. 2024, 39, 5620–5630. [Google Scholar] [CrossRef]
  29. Meng, X.; You, Z.; Zhang, M.; Shao, B. Distributed Hierarchical Cooperative Control and Stability Analysis of Flexible Interconnected Microgrid Cluster Via Back-to-Back Converters. Diangong Jishu Xuebao/Trans. China Electrotech. Soc. 2024, 39, 7917–7932. [Google Scholar] [CrossRef]
  30. Wang, Z.; Zhao, Y.; Wang, J.; He, S.; Tang, W. Optimization strategy for load demand response of microgrid clusters based on improved artificial hummingbird algorithm. J. Phys. Conf. Ser. 2024, 2896, 012070. [Google Scholar] [CrossRef]
  31. Li, H.; Han, Y. Data-driven distributionally robust collaborative optimization operation strategy for a multi-microgrid based on LSTM-CGAN. Dianli Xitong Baohu Yu Kongzhi/Power Syst. Prot. Control 2024, 52, 133–148. [Google Scholar] [CrossRef]
  32. Huang, D.; Lü, J.; Shi, S.; Li, Y.; Fu, W.; Wang, X. Optimal operation of island microgrid clusters considering demand response. Dianli Xitong Baohu Yu Kongzhi/Power Syst. Prot. Control 2024, 52, 88–98. [Google Scholar] [CrossRef]
  33. Deng, P.; Qian, J.; Zhang, R.; Wu, Q.; Shi, Y. Optimization Scheduling for Microgrid Clusters: A Robust Game Theory-Based Method with Shared Energy Storage. In Proceedings of the 2024 7th International Conference on Energy, Electrical and Power Engineering (CEEPE), Yangzhou, China, 26–28 April 2024. [Google Scholar]
  34. Ge, H.; Zhu, Y.; Zhong, J.; Wu, L. Day-ahead optimization for smart energy management of multi-microgrid using a stochastic-robust model. Energy 2024, 313, 133840. [Google Scholar] [CrossRef]
  35. Chen, C.; Xie, S.; Zhang, Y.; Wu, Q. Pricing strategy of distributed multi-microgrid distribution system considering flexible resource. Dianli Zidonghua Shebei/Electr. Power Autom. Equip. 2024, 44, 116–123. [Google Scholar] [CrossRef]
  36. Alamir, N.; Kamel, S.; Hashim, F.A.; Bouaouda, A.; Safaraliev, M.; Abdelkader, S.M. Optimizing Two-stage Energy Management in renewable-based Multi-Microgrid using a Modified Student Psychology-Based Optimization with Demand Response and Hydrogen Storage. Int. J. Hydrogen Energy 2024, 63, 696–719. [Google Scholar] [CrossRef]
  37. Alamir, N.; Kamel, S.; Abdelkader, S.M.; Jurado, F. Probabilistic Energy Management of Multi-Microgrid Considering Demand Response and Energy Storage System. In Proceedings of the 2024 4th International Conference on Electrical, Computer, Communications and Mechatronics Engineering (ICECCME), Male, Maldives, 4–6 November 2024; pp. 1–6. [Google Scholar]
  38. Sun, K.; Chen, W.; Chen, J.; Yin, W. A resilience enhancement strategy for multi-microgrid in extreme scenarios based on electric vehicles. Dianli Xitong Baohu Yu Kongzhi/Power Syst. Prot. Control 2023, 51, 53–65. [Google Scholar] [CrossRef]
  39. Shi, Z.; Zhang, T.; Liu, Y.; Feng, Y.; Wang, R.; Huang, S. Optimal design and operation of islanded multi-microgrid system with distributionally robust optimization. Electr. Power Syst. Res. 2023, 221, 109437. [Google Scholar] [CrossRef]
  40. Liu, R.; Liu, Y.; Xu, L.; Li, Z.; Li, X. Multi-microgrid System Collaborative Optimization Strategy Considering Distributed Demand Response. Dianli Jianshe/Electr. Power Constr. 2023, 44, 72–83. [Google Scholar] [CrossRef]
  41. Rao, S.; Kumar, Y.V.P.; Amir, M.; Ahmad, F. An Adaptive Neuro-Fuzzy Control Strategy for Improved Power Quality in Multi-Microgrid Clusters. IEEE Access 2022, 10, 128007–128021. [Google Scholar] [CrossRef]
  42. Afzal, M.Z.; Aurangzeb, M.; Iqbal, S.; Rehman, A.U.; Kotb, H.; AboRas, K.M.; Elgamli, E.; Shouran, M. A Resilience-Oriented Bidirectional ANFIS Framework for Networked Microgrid Management. Processes 2022, 10, 2724. [Google Scholar] [CrossRef]
  43. Li, Z.; Shahidehpour, M.; Nassif, A.B.; Kushner, D.; Paaso, A.; Bahramirad, S. Networked Microgrid Design and Operation for Enhancing the Grid Resilience in Extreme Conditions. In Proceedings of the 2023 IEEE Power & Energy Society General Meeting (PESGM), Orlando, OL, USA, 16–20 July 2023; pp. 1–5. [Google Scholar]
  44. Li, X.; Wang, M. Robust Optimal Scheduling of Multi-microgrid and Bidding Strategy of VCG Mechanism Considering Renewable Energy-load Uncertainty. Dianwang Jishu/Power Syst. Technol. 2023, 47, 2330–2343. [Google Scholar] [CrossRef]
  45. Karimi, H.; Jadid, S. A collaborative hierarchal optimization framework for sustainable multi-microgrid systems considering generation and demand-side flexibilities. Sustain. Energy Grids Netw. 2023, 35, 101087. [Google Scholar] [CrossRef]
  46. Gao, J.; Shao, Z.; Chen, F.; Chen, Y.; Lin, Y.; Deng, H. Distributed robust operation strategy of multi-microgrid based on peer-to-peer multi-energy trading. IET Energy Syst. Integr. 2023, 5, 376–392. [Google Scholar] [CrossRef]
  47. Feng, F.; Xin, D. Robust Optimization for Energy Transactions in Microgrid Cluster (MC) Considering Electric Vehicle (EV). In Proceedings of the 2023 International Conference on Power Energy Systems and Applications, ICoPESA 2023, Nanjing, China, 24–26 February 2023; pp. 312–321. [Google Scholar]
  48. Feng, F.; Du, X.; Si, Q.; Cai, H. Operation optimization of distributed multi-energy multi-microgrid considering system robustness. Energy Explor. Exploit. 2023, 41, 1085–1106. [Google Scholar] [CrossRef]
  49. Chen, Y.; Chen, J.; Zhang, Y. Adjustable Robust Optimal Dispatch of Microgrid Cluster with SESS Considering Uncertain Renewable Energy and Load. In Proceedings of the Lecture Notes in Electrical Engineering; Springer Nature: Singapore, 2022; pp. 322–332. [Google Scholar]
  50. Wu, Q.; Xie, Z.; Ren, H.; Li, Q.; Yang, Y. Optimal trading strategies for multi-energy microgrid cluster considering demand response under different trading modes: A comparison study. Energy 2022, 254, 124448. [Google Scholar] [CrossRef]
  51. Shaker, A.; Bozorg, M.; Safari, A.; Najafi-Ravadanegh, S. An Adaptive Emergency Approach for Hybrid Networked Microgrids Resilience. IEEE Access 2022, 10, 103164–103175. [Google Scholar] [CrossRef]
  52. Jena, S.; Padhy, N.P.; Srivastava, A. Resilient Economical Operation of DC Microgrid Clusters with Heterogeneous Sources. In Proceedings of the 2022 IEEE 10th Power India International Conference, PIICON, New Delhi, India, 25–27 November 2022. [Google Scholar]
  53. Jena, S.; Padhy, N.P.; Guerrero, J.M. Cyber-Resilient Cooperative Control of DC Microgrid Clusters. IEEE Syst. J. 2022, 16, 1996–2007. [Google Scholar] [CrossRef]
  54. Ali, A.Y.; Hussain, A.; Baek, J.W.; Kim, H.M. Optimal Operation of Networked Microgrids for Enhancing Resilience Using Mobile Electric Vehicles. Energies 2021, 14, 142. [Google Scholar] [CrossRef]
  55. Kavousi-Fard, A.; Wang, M.; Su, W. Stochastic Resilient Post-Hurricane Power System Recovery Based on Mobile Emergency Resources and Reconfigurable Networked Microgrids. IEEE Access 2018, 6, 72311–72326. [Google Scholar] [CrossRef]
  56. Ghodsi, M.R.; Tavakoli, A.; Samanfar, A. A Robust Controller Design for Load Frequency Control in Islanded Microgrid Clusters. Int. Trans. Electr. Energy Syst. 2022, 2022, 4218067. [Google Scholar] [CrossRef]
  57. Chen, Z.; Tai, N.; Hu, Y.; Li, R. Flexibility Auxiliary Service of Microgrid Cluster Based on Stackelberg Electricity Price Optimization. In Proceedings of the I and CPS Asia 2022-2022 IEEE IAS Industrial and Commercial Power System Asia, Shanghai, China, 8–11 July 2022; pp. 1674–1679. [Google Scholar]
  58. Zhang, Y.; Yang, H.; Wang, P. The Voltage Stabilizing Control Strategy of Off-Grid Microgrid Cluster Bus Based on Adaptive Genetic Fuzzy Double Closed-Loop Control. J. Electr. Comput. Eng. 2021, 2021, 5515362. [Google Scholar] [CrossRef]
  59. Shaker, A.; Safari, A.; Shahidehpour, M. Reactive Power Management for Networked Microgrid Resilience in Extreme Conditions. IEEE Trans. Smart Grid 2021, 12, 3940–3953. [Google Scholar] [CrossRef]
  60. Lai, J.; Lu, X.; Wang, F. Bilevel Information-Aware Distributed Resilient Control for Heterogeneous Microgrid Clusters. IEEE Trans. Ind. Appl. 2021, 57, 2014–2022. [Google Scholar] [CrossRef]
  61. Hu, W.; Wu, Z.; Lv, X.; Dinavahi, V. Robust Secondary Frequency Control for Virtual Synchronous Machine-Based Microgrid Cluster Using Equivalent Modeling. IEEE Trans. Smart Grid 2021, 12, 2879–2889. [Google Scholar] [CrossRef]
  62. Wikipedia. Salawati. Available online: https://en.wikipedia.org/wiki/Salawati (accessed on 23 October 2024).
  63. Wikipedia. Raja Ampat Islands. Available online: https://en.wikipedia.org/wiki/Raja_Ampat_Islands (accessed on 8 April 2024).
  64. Bawan, E.K.; Al Hasibi, R.A. The role of renewable energy resources in generation expansion planning and GHG emission reduction: A case study of West Papua. In Proceedings of the 4th International Conference on Sustainable Innovation 2020–Technology, Engineering and Agriculture (ICoSITEA 2020), Yogyakarta, Indonesia, 13–14 October 2020. [Google Scholar]
  65. Putranto, L.M.; Budi, R.F.S.; Novitasari, D. Generation expansion planning with a renewable energy target and interconnection option: A case study of the Sulawesi region, Indonesia. Renew. Sustain. Energy Rev. 2023, 183, 113489. [Google Scholar] [CrossRef]
  66. Novitasari, D.; Sarjiya; Hadi, S.P.; Budiarto, R.; Budi, R.F.S. Climate Changes Impact on Solar Photovoltaic in Tropical Islands, Case Study: Sulawesi Island. In Proceedings of the 2024 International Conference on Technology and Policy in Energy and Electric Power (ICTPEP), Bali, Indonesia, 3–5 September 2024; pp. 291–296. [Google Scholar]
  67. Kuswanto, H.; Hibatullah, F.; Soedjono, E.S. Perception of weather and seasonal drought forecasts and its impact on livelihood in East Nusa Tenggara, Indonesia. Heliyon 2019, 5, e02360. [Google Scholar] [CrossRef]
  68. Sambodo, M.T.; Fuady, A.H.; Negara, S.D.; Handoyo, F.W.; Mychelisda, E. Electricity Access and Community Welfare in Indonesia; Springer: Berlin/Heidelberg, Germany, 2021. [Google Scholar]
  69. Ilmi, M.M.; Maryanti, E.; Nurdini, N.; Setiawan, P.; Kadja, G.T.M.; Ismunandar. A multianalytical investigation of the physicochemical properties of white rock art pigments at the Nali and Tene Koro sites, Lembata, East Nusa Tenggara, Indonesia. J. Archaeol. Sci. Rep. 2022, 41, 103326. [Google Scholar] [CrossRef]
Figure 1. Flowchart of the methodological framework.
Electronics 14 02186 g001
Figure 2. Daily demand profile factors showing the symbolic regression-based function fdaily.h and illustrating a typical peak in the evening.
Electronics 14 02186 g002
Figure 3. Seasonal demand trend factors for 2020, showing the symbolic regression-based function ftrend.m2020.
Electronics 14 02186 g003
Figure 4. View of the components in the energy system agent, showing the real-time simulation aspects, including the consumers and generic electricity producer populations.
Electronics 14 02186 g004
Figure 5. Components in the energy producer agent, highlighting the fuel type parameter that determines the generation technology, e.g., diesel.
Electronics 14 02186 g005
Figure 6. Components in the energy consumer agent.
Electronics 14 02186 g006
Figure 7. HOMER Pro optimization output for additional PV and battery capacities. These display recommended system capacities and operational schedules.
Electronics 14 02186 g007
Figure 8. Schematic diagram of microgrids under normal operation (top) and under networked microgrid configuration under emergency conditions (bottom).
Electronics 14 02186 g008
Figure 9. Locations of the case study islands. This illustrates the three island pairs forming the networked systems N1, N2, and N3.
Electronics 14 02186 g009
Figure 10. Daily solar irradiation profile at the microgrid locations.
Electronics 14 02186 g010
Figure 11. Stacked time-series demands and available generation for Salawati (worst-case scenario).
Electronics 14 02186 g011
Figure 12. Stacked time-series demands and available generation for Buton (worst-case scenario).
Electronics 14 02186 g012
Figure 13. Stacked time-series demands and available generation for N1 (worst-case scenario).
Electronics 14 02186 g013
Figure 14. Stacked time-series demands and available generation for N2 (worst-case scenario).
Electronics 14 02186 g014
Figure 15. Load balancing with PV and battery expansion in Salawati (worst case).
Electronics 14 02186 g015
Figure 16. Load balancing with PV and battery expansion in Buton (worst case).
Electronics 14 02186 g016
Figure 17. Load balancing with PV and battery expansion in Salawati (best case).
Electronics 14 02186 g017
Figure 18. Load balancing with PV and battery expansion in Buton (best case).
Electronics 14 02186 g018
Figure 19. Time-series demands and available production in N2 (worst-case week with additional PV and battery).
Electronics 14 02186 g019
Figure 20. Total surplus energy from PV generation.
Electronics 14 02186 g020
Table 1. Summary of key studies on multi-microgrid clusters.
Ref.Main ObjectiveApproach/MethodKey Findings
[1]Robust optimization in CCHP-based MGTwo-stage robust optimization; shared storageImproves system’s risk resistance under uncertainties
[2]Distributed robust optimizationADMM-based robust schedulingMinimizes operational costs under uncertain prices
[3]DRO-based energy management in MMGATC + CCG with scenario generationDecreases cost by ~2.98% compared with robust methods
[4]Data-driven distributionally robustBi-level approach with ATC decompositionMinimizes uncertainty in large-scale MG integration
[5]Voltage/frequency control in MG clusterAdaptive ANN-based approachReal-time distributed solutions for stable operation
[6]Adaptive load shedding for resilienceReal distribution system test with 2 MGsMinimizes load drop, fosters reliability under faults
[7]Multi-game energy tradingStackelberg + cooperative game; robust modelMinimizes social costs while ensuring synergy
[8]Distributed robust game for multi-MGSubproblem decomposition + ADMMIntegrates ESS and DR to balance cost and risk
[9]Decentralized multi-area MMSMPC-based approach for normal and extreme opsEnhances resilience in sub-regional microgrid clusters
[10]Real-time coordinated schedulingMulti-MG complementation; flexible supply sideAchieves stable ops and full integration of renewables
[11]Lyapunov-based resilient controlMicrogrid cluster stability analysisAchieves voltage/power sharing under cyber-attacks
[12]Adaptive load shedding in networked MGGrid-friendly approach with embedded controlsImproves frequency response in dynamic MG conditions
[13]Electricity-heat integrated storageBi-level optimization for multi-MG systemsMaximizes multi-agent profits and curtails system cost
[14]Dual-hybrid fractional LFC approachDR integration with advanced fractional controlImproves frequency stability in multi-MG environment
[15]Multi-MG Stackelberg game operationOne-leader, multi-follower model; DR incentivesEnhances PV consumption and user incentives
[16]High renewable integration in MGGEP with renewable targets in SulawesiDemonstrates load–resource matching under constraints
[17]Techno-economic DR in multi-MGQARO approach with point estimationEnhances reliability, cuts operational cost
[20]Two-layer strategy for MG clustersLayered MIQP; spinning reserve optimizationReduces operational costs and emissions
[21]Shared energy storage capacityTwo-level optimization; WOA-SOCP algorithmImproves wind/solar utilization by up to 96.53%
[22]Distributed robust DeePC voltage ctrData-enabled predictive control (DeePC)Addresses voltage violation in NMG with uncertain DER
[23]Hierarchical EMS for islanded NMGMerit-order dispatch; cost minimizationDecreases cost by >36% in normal and abnormal modes
[24]Scheduling in multi-MG allianceMaster-slave game with DR pricingReduces cost for both MG alliance and users
[25]Stackelberg game in multi-MG systemComprehensive DR model for schedulingBalances upper-level MG aggregator, lower-level users
[26]Multi-stage robust for shared storage4-layer optimization with scenario iterationIncreases reliability with minimal cost trade-off
[27]Stochastic energy managementBattery/supercapacitor synergy; MILP modelImproves reliability; 7.5% cost reduction for MGs
[28]Bi-level approach for multiple contingenciesMILP for gas-electric integrated systemEnhances power grid resilience with microgrid assets
[29]Distributed hierarchical controlBack-to-back converters; layered approachImproves MG consumption of distributed generation
[30]Load DR strategy with hummingbird GALow-carbon dispatch with flexible clusteringAchieves cost reduction and carbon emission cuts
[31]Multi-stage robust optimizationMin-max-max-min approach with scenario setsShared ESS lowers demand response and user costs
[32]Stochastic multi-MG with DR and BESSPEM + QARO approach for cost and reliabilityOperating costs lowered, reliability index improved
[33]Two-stage energy management with H2MSPBO approach with DR and hydrogen storageNotable cost savings; peak load reduction improved
[34]Probabilistic EM of multi-MG systemVarious algorithms for cost optimizationBESS and HESS yield robust solutions and improved benefits
[35]Day-ahead scheduling in multi-MGBi-level with HFCVs and EVPLs, robust approachDecentralized model for data privacy and cost saving
[36]Modified SPBO for multi-MG EMTwo-stage multi-objective optimizationAchieves better solution diversity and cost efficiency
[37]Probabilistic EM with HESS and DRPEM technique for load/RES uncertaintiesDR effectively addresses peak demands in multi-MG
[38]EV-based resilience enhancementTwo-stage approach with MG cluster synergyMinimizes load shedding, ensures critical load supply
[39]Distributionally robust islanded MGTwo-stage design/operation with scenario setsReduces mismatch with uncertain renewable generation
[40]Multi-MG collaborative optimizationDistributed DR mechanism with transactionPromotes cost savings and clean energy consumption
[41]Adaptive neuro-fuzzy control for PQProposed integrated cluster-level solutionImproves voltage stability and THD under high load
[42]Bidirectional ANFIS for resiliencePV-wind-battery synergy; mode-specific controlBoosts reliability and dynamic performance in island MGs
[43]NMG design for extreme conditionsReconfiguration and dynamic islanding approachEnsures faster system restoration in disasters
[44]Multi-MG robust scheduling with VCGTwo-stage robust model with net load smoothingImproves local new energy consumption, lowers cost
[45]Collaborative tri-stage planningCooperative game + MG synergyGains in total cost minimization, improved flexibility
[46]Distributed robust P2P multi-energyTRO method + Nash bargainingAchieves fair benefit distribution, improved synergy
[47]EV-based robust multi-MG dispatchTwo-stage with KKT transformations, C and CG methodAchieves better load smoothing, cost reduction
[48]Multi-energy multi-MG with carbon tradeDecentralized robust scheduling, Kalman filterAttains low-carbon ops while ensuring data privacy
[49]Adjustable robust scheduling with SESSIntroduction of parameter Γ for robust CTRDecreases cost and energy reserve capacity effectively
[50]Multi-MG trading with DR integrationComparison of direct vs. intermediary modesDirect trading yields higher benefits but lower self-sufficiency
[51]Adaptive emergency approach for resilience3-stage approach; resilient operating zoneEnsures dynamic security post-event, prevents DER trip
[52]Resilient DC MG cluster operationConsensus-based approach; real-time digital simMaintains global economic operation, mitigates intrusions
[53]Cyber-resilient control in DC MGModel-independent detection + mitigationSecures MG clusters from false data injection
[56]mu-synthesis for MG LFC robust controlVirtual inertia controller designImproves power damping in islanded MG clusters
[57]Flexibility service with StackelbergDay-ahead ops for multi-MG aggregatorIncreases synergy from microgrid-based ramping product
[58]Adaptive genetic fuzzy double loopOff-grid voltage stabilizing controlAchieves fast dynamic response, strong anti-disturbance
[59]Reactive power management in NMG resilienceTwo-stage model for islanded scenariosEnhances stable ops in low-inertia MG clusters
[60]Bilevel info-aware control in MG clusterResilient distributed approach with noiseAchieves robust load sharing under measurement errors
[61]Robust secondary frequency control in VSM-based MGEquivalent SG model with H∞ designProvides distributed inertial support, improved frequency
Table 2. Comparative analysis of core themes in multi-microgrid literature.
Feature/Reference RangeObservationsRef.
Prolonged Cable OutageMost works concentrate on partial line outages; only a few investigate extended disruptions.[6,9,28,38,59]
Resilience-FocusedEmphasis on robust or hierarchical schemes to handle worst-case events in islanded or NMG scenarios.[1,2,3,11,28,38,51,59]
Shared Energy StorageImproved resource utilization and cost-sharing; sizing complexities remain.[1,21,26,33,34,49]
Demand ResponseIntegrates load-side flexibility, but magnitude of DR potential in island MGs is less explored.[8,15,17,24,32,35]
Game-Theoretic ApproachStackelberg and cooperative games are popular for distributed MG co-optimization.[7,14,15,24,35,45]
Agent-Based SimulationTypically combined with advanced or AI-based control, but less used in integrated resilience frameworks.[12,14,41,42,46,52]
HOMER or Dedicated EMS ToolsEmployed mainly for capacity planning; real-time synergy with multi-MG dispatch is still evolving.[10,27,30,37,40]
Table 3. General properties of the case study systems.
SystemGroupPopulationProvinceProvince Total Population
Salawati18739UIW Papua and West Papua561,403
Batanta13239
N1111,978
Buton2447,408UIW S, SE and W Sulawesi2,743,574
Muna2268,140
N22715,548
Lembata3141,400UIW East Nusa Tenggara5,569,068
Adonara3132,345
N33273,745
Bolded values indicate aggregated network-level systems (N1, N2, N3), not individual islands.
Table 4. Installed electricity production capacities in provinces.
ProvinceSolar [MWp]Geothermal [MW]Hydro [MW]Steam [MW]Diesel [MW]DieselGas [MW]
UIW Papua and West Papua4.60.029.80.0187.2200.1
UIW S, SE and W Sulawesi1.20.00.00.036.20.0
UIW East Nusa Tenggara4.012.55.347.0165.0119.4
Table 5. Estimated installed electricity production capacities in community and networked microgrids.
SystemSolar [kWp]Geothermal [kW]Hydro [kW]Steam [kW]Diesel [kW]DieselGas [kW]
Salawati70.310458.9028793078
Batanta26.370172.1010801154
N196.700631.0039594233
Buton197.300059000
Muna118.300035360
N2315.600094360
Lembata 101.1317.4134.1119341903033
Adonara 94.62297.2125.5111739232840
N3195.7614.6259.6231181145872
Bolded values indicate aggregated network-level systems (N1, N2, N3), not individual islands.
Table 6. Identification of best-case and worst-case disruption weeks.
SystemBest-Case Start DateBest-Case Balance (MWh)Worst-Case Start DateWorst-Case Balance (MWh)
Salawati2020-12-02991.72020-07-29990.5
Batanta2020-12-02371.92020-07-29371.5
Buton2020-12-02−36272020-08-12−3631
Muna2020-12-02−21742020-08-12−2176
Lembata2020-12-0232.122020-08-1230.45
Adonara2020-12-0230.072020-08-1228.51
N12020-12-0213642020-07-291362
N22020-12-02−58012020-08-12−5806
N32020-12-0262.192020-08-1258.97
Table 7. Experimental scenario matrix.
ScenarioStandalone MicrogridNetworked Microgrid
Best-Case (High Renewable Generation)Evaluates an island microgrid under surplus conditionsInvestigates resource sharing under high PV output
Worst-Case (Low Renewable Generation)Evaluates an island microgrid under deficit conditionsInvestigates resource sharing under poor PV output
Table 8. Key input parameters for scenario simulation.
ParameterValue or RangeNotes
PV Output VariabilityHourly solar data from real measurementsGuides renewable output in best- vs. worst-case weeks
Battery Capacity(Existing or Expanded) from HOMER ProReflects either baseline or optimized sizing
State-of-Charge Constraints0–100% with set ramp ratesEnsures realistic storage operation
Demand ProfilesResidential, commercial, and industrial sharesSymbolic regression-based daily + seasonal variations
Disconnection Duration7 daysRepresents a typical outage/recovery window
InterconnectionsNone or unlimited (standalone vs. networked)Simplifies resource sharing but omits real line limits
Merit-Order DispatchPriority-based (residential > commercial > industrial)Reduces load progressively under constrained supply
Table 9. Optimized PV and battery capacities for community and networked microgrids.
SystemPV [kWp]Battery [kWh]
Salawati889149,166
Batanta333418,438
N112,22467,604
Buton460,5252,546,843
Muna276,0021,526,372
N2736,5274,073,216
Lembata 145,546804,911
Adonara 136,282753,679
N3281,8281,558,591
Bolded values indicate aggregated network-level systems (N1, N2, N3), not individual islands.
Table 10. Worst-case scenario—unmet demand (%).
Unmet Residential Demand [%]Unmet Commercial Demand [%]Unmet Industrial Demand [%]
No PV/BatteryPV/BatteryNo PV/BatteryPV/BatteryNo PV/BatteryPV/Battery
Salawati0.00.00.00.00.00.0
Batanta0.00.00.00.00.00.0
N10.00.00.00.00.00.0
Buton77.80.0100.046.7100.077.1
Muna77.80.0100.046.7100.077.1
N277.80.0100.046.7100.077.1
Lembata0.70.090.23.0100.02.0
Adonara0.70.090.23.0100.02.0
N30.70.090.23.0100.02.0
Bolded values indicate aggregated network-level systems (N1, N2, N3), not individual islands.
Table 11. Best-case scenario—unmet demand (%).
Unmet Residential Demand [%]Unmet Commercial Demand [%]Unmet Industrial Demand [%]
No PV/BatteryPV/BatteryNo PV/BatteryPV/BatteryNo PV/BatteryPV/Battery
Salawati0.00.00.00.00.00.0
Batanta0.00.00.00.00.00.0
N10.00.00.00.00.00.0
Buton79.90.0100.047.3100.073.4
Muna79.90.0100.047.3100.073.4
N279.90.0100.047.3100.073.4
Lembata4.60.0100.00.0100.010.3
Adonara4.60.0100.00.0100.010.3
N34.60.0100.00.0100.010.3
Bolded values indicate aggregated network-level systems (N1, N2, N3), not individual islands.
Disclaimer/Publisher’s Note: The statements, opinions and data contained in all publications are solely those of the individual author(s) and contributor(s) and not of MDPI and/or the editor(s). MDPI and/or the editor(s) disclaim responsibility for any injury to people or property resulting from any ideas, methods, instructions or products referred to in the content.

