Article

Stability Analysis of a Receiving-End VSC-HVDC System with Parallel-Connected VSCs

1
Electric Power Research Institute, State Grid Jiangsu Electric Power Co. Ltd., Nanjing 211103, China
2
School of Electrical Engineering, Southeast University, Nanjing 210096, China
3
State Grid Jiangsu Electric Power Co. Ltd., Nanjing 211103, China
*
Author to whom correspondence should be addressed.
Electronics 2025, 14(11), 2178; https://doi.org/10.3390/electronics14112178
Submission received: 24 April 2025 / Revised: 22 May 2025 / Accepted: 26 May 2025 / Published: 27 May 2025

Abstract

:
Voltage source converter-based high-voltage direct current (VSC-HVDC) systems integrated into weak AC grids may exhibit oscillation-induced instability, posing significant threats to power system security. With increasing structural complexity and diverse control strategies, the stability characteristics of VSC-HVDC system require further investigation. This paper focuses on the stability of a receiving-end VSC-HVDC system consisting of a DC voltage-controlled VSC parallel-connected to a power-controlled VSC, under various operating conditions. First, small-signal models of each subsystem were developed and a linearized full-system model was constructed based on port relationships. Then, eigenvalue and participation factor analyses were utilized to evaluate the influence of control strategy, asymmetrical grid strength, power flow direction, and tie line on the system’s small-signal stability. A feasible short-circuit ratio (SCR) region was established based on joint power–topology joint, forming a stable operating space for the system. Finally, the correctness of the theoretical analysis was validated via MATLAB/Simulink time-domain simulations. Results indicate that, in comparison to the power control strategy, the DC voltage control strategy was more sensitive to variations in the AC system and demands a strong grid, and this disparity was predominantly caused by the DC voltage control. Furthermore, the feasible region of the short-circuit ratio (SCR) diminished with the increase in the length of the tie-line and alterations in power flow direction under the mutual-support power mode, leading to a gradual reduction in the system’s stability margin.

1. Introduction

By means of flexible control over their converters, VSC-HVDC systems can achieve rapid power flow reversal, ensuring stable power transmission and optimized power distribution, thereby promoting efficient energy utilization and low-carbon development. Consequently, they have been widely applied in fields such as power grid integration of renewable energy and interconnection of multi-regional systems [1,2,3,4,5]. However, as typical power electronic conversion devices, voltage source converter (VSCs) exhibit dynamic characteristics that significantly influence system stability [6,7]. In recent years, oscillation incidents in VSC-HVDC systems have occurred frequently in various regions globally, posing severe threats to the safe and stable operation of power systems.
Owing to their increasingly complex and variable operating conditions, oscillation-induced instability has emerged as a critical issue constraining the development of VSC-HVDC systems [8]. To address the issue, the impact of phase-locked loop (PLL) parameters, grid strength, and current inner-loop parameters on system stability have been analyzed in previous research [9] where the frequency-domain model including PLL, current inner loops, and grid impedance was established. Researchers [10] have pointed out that AC/DC converter stability heavily relies on the DC-link voltage, and virtual inertia has been employed to mitigate rapid changes in DC-link voltage, achieving stable and reliable grid operation. An equivalent single-input single-output model of VSC-HVDC connected to a weak grid was developed [11] in order to analyze the coupling interaction between PLL bandwidth and power control loops. Through eigenvalue analysis, the controller bandwidth stability boundaries for VSCs connected to extremely weak grids have been quantified [12], exploring the interaction between inner and outer control loops. Furthermore, the impact of inner control parameters and SCR on system stability has been analyzed [13] by establishing an AC impedance model of a VSC-HVDC system. The results indicated that as SCR decreased, the eigenvalues of the impedance matrix approached critical points, thereby leading to a degradation in system stability.
The aforementioned studies primarily analyzed the influence of system and control parameters on the stability of single converter systems, and the impact of the strong coupling between control loops among multiple converters needs further consideration. The dynamic interactions between different VSCs have been investigated [14] using frequency-domain analysis and equations of motion, revealing the impact of different droop coefficients on system dynamic characteristics by analyzing discrepancies in equivalent damping and inertia coefficients. In terms of the interactive coupling effects between converters, participation factor analysis was adopted [15,16] to quantitatively assess the contribution of state variables from different converters in dominant oscillation modes. The results indicated that controller state variables directly related to DC-side electrical quantities contributed significantly, proving that interactions among converters degraded the system’s stability margins. However, the research scenarios of the above studies were limited to VSC-HVDC systems with single control strategies. Regarding the stability analysis of VSC-HVDC systems with multiple control strategies, the impact of different control strategies and power flow reversal on the small-signal stability of a four-terminal VSC-HVDC system was investigated [17] by employing modal analysis. The results indicated that reversal of the power flow increased the risk of oscillation-induced instability. Combining grid-forming control with typical DC voltage droop control, there exists a mode of low-frequency harmonic instability in the MTDC system [18] under the interactions between the converters with different control strategies.
The existing literature primarily employs power-weighted averaging methods [19,20,21] or parameter aggregation identification approaches [22,23] to equivalently represent multiple VSCs as a single aggregated model, thereby neglecting the differential impacts imposed by heterogeneous control strategies. In contrast, the dual-receiving-end VSC-HVDC system investigated in this paper originates from the Baihetan–Jiangsu ultra-high voltage hybrid cascaded HVDC transmission practical project [24], adopting a parallel VSC architecture combining DC voltage control and active/reactive power control. Conventional multi-terminal HVDC or multi-infeed HVDC systems exhibit electrical topology configurations with singular coupling exclusively on either the DC or AC side, whereas the investigated system demonstrates strong bilateral coupling characteristics across both AC and DC sides. Considering the divergences in converter control strategies and electrical topologies between existing research and the system investigated in this paper, prior analytical conclusions exhibit limited applicability in explaining the oscillation mechanisms within the specific engineering configuration.
By conducting modeling and mechanistic analysis of a dual-receiving-end VSC-HVDC system that rigorously incorporates practical engineering constraints, this paper aims at elucidating oscillation characteristics under diversified control strategies and delivering practical operational guidance for enhancing stability. The principal contributions are summarized as follows:
  • A small-signal model of dual-receiving-end VSC-HVDC system connected to asymmetric weak grids is established, clarifying the interactive coupling relationships between AC network, control system, and DC-link;
  • The influence of control strategy, asymmetrical grid strength, power flow direction, and tie line on the small-signal stability is analyzed, and a feasible SCR region constrained by power and topology is formed, providing guidance for dynamic adjustment of system parameters;
  • Based on various influencing factors, a variety of operating conditions are constructed to validate the effectiveness of the feasible SCR region.
The remainder of this paper is organized as follows. The topology and control strategies of the dual-receiving-end VSC-HVDC system are analyzed in Section 2. Section 3 establishes and validates the system’s small-signal model. In Section 4, the impact patterns of critical parameters on the small-signal stability of system are investigated, and the feasible SCR region constrained by multiple factors is constructed. Finally, the conclusions are drawn in Section 5.

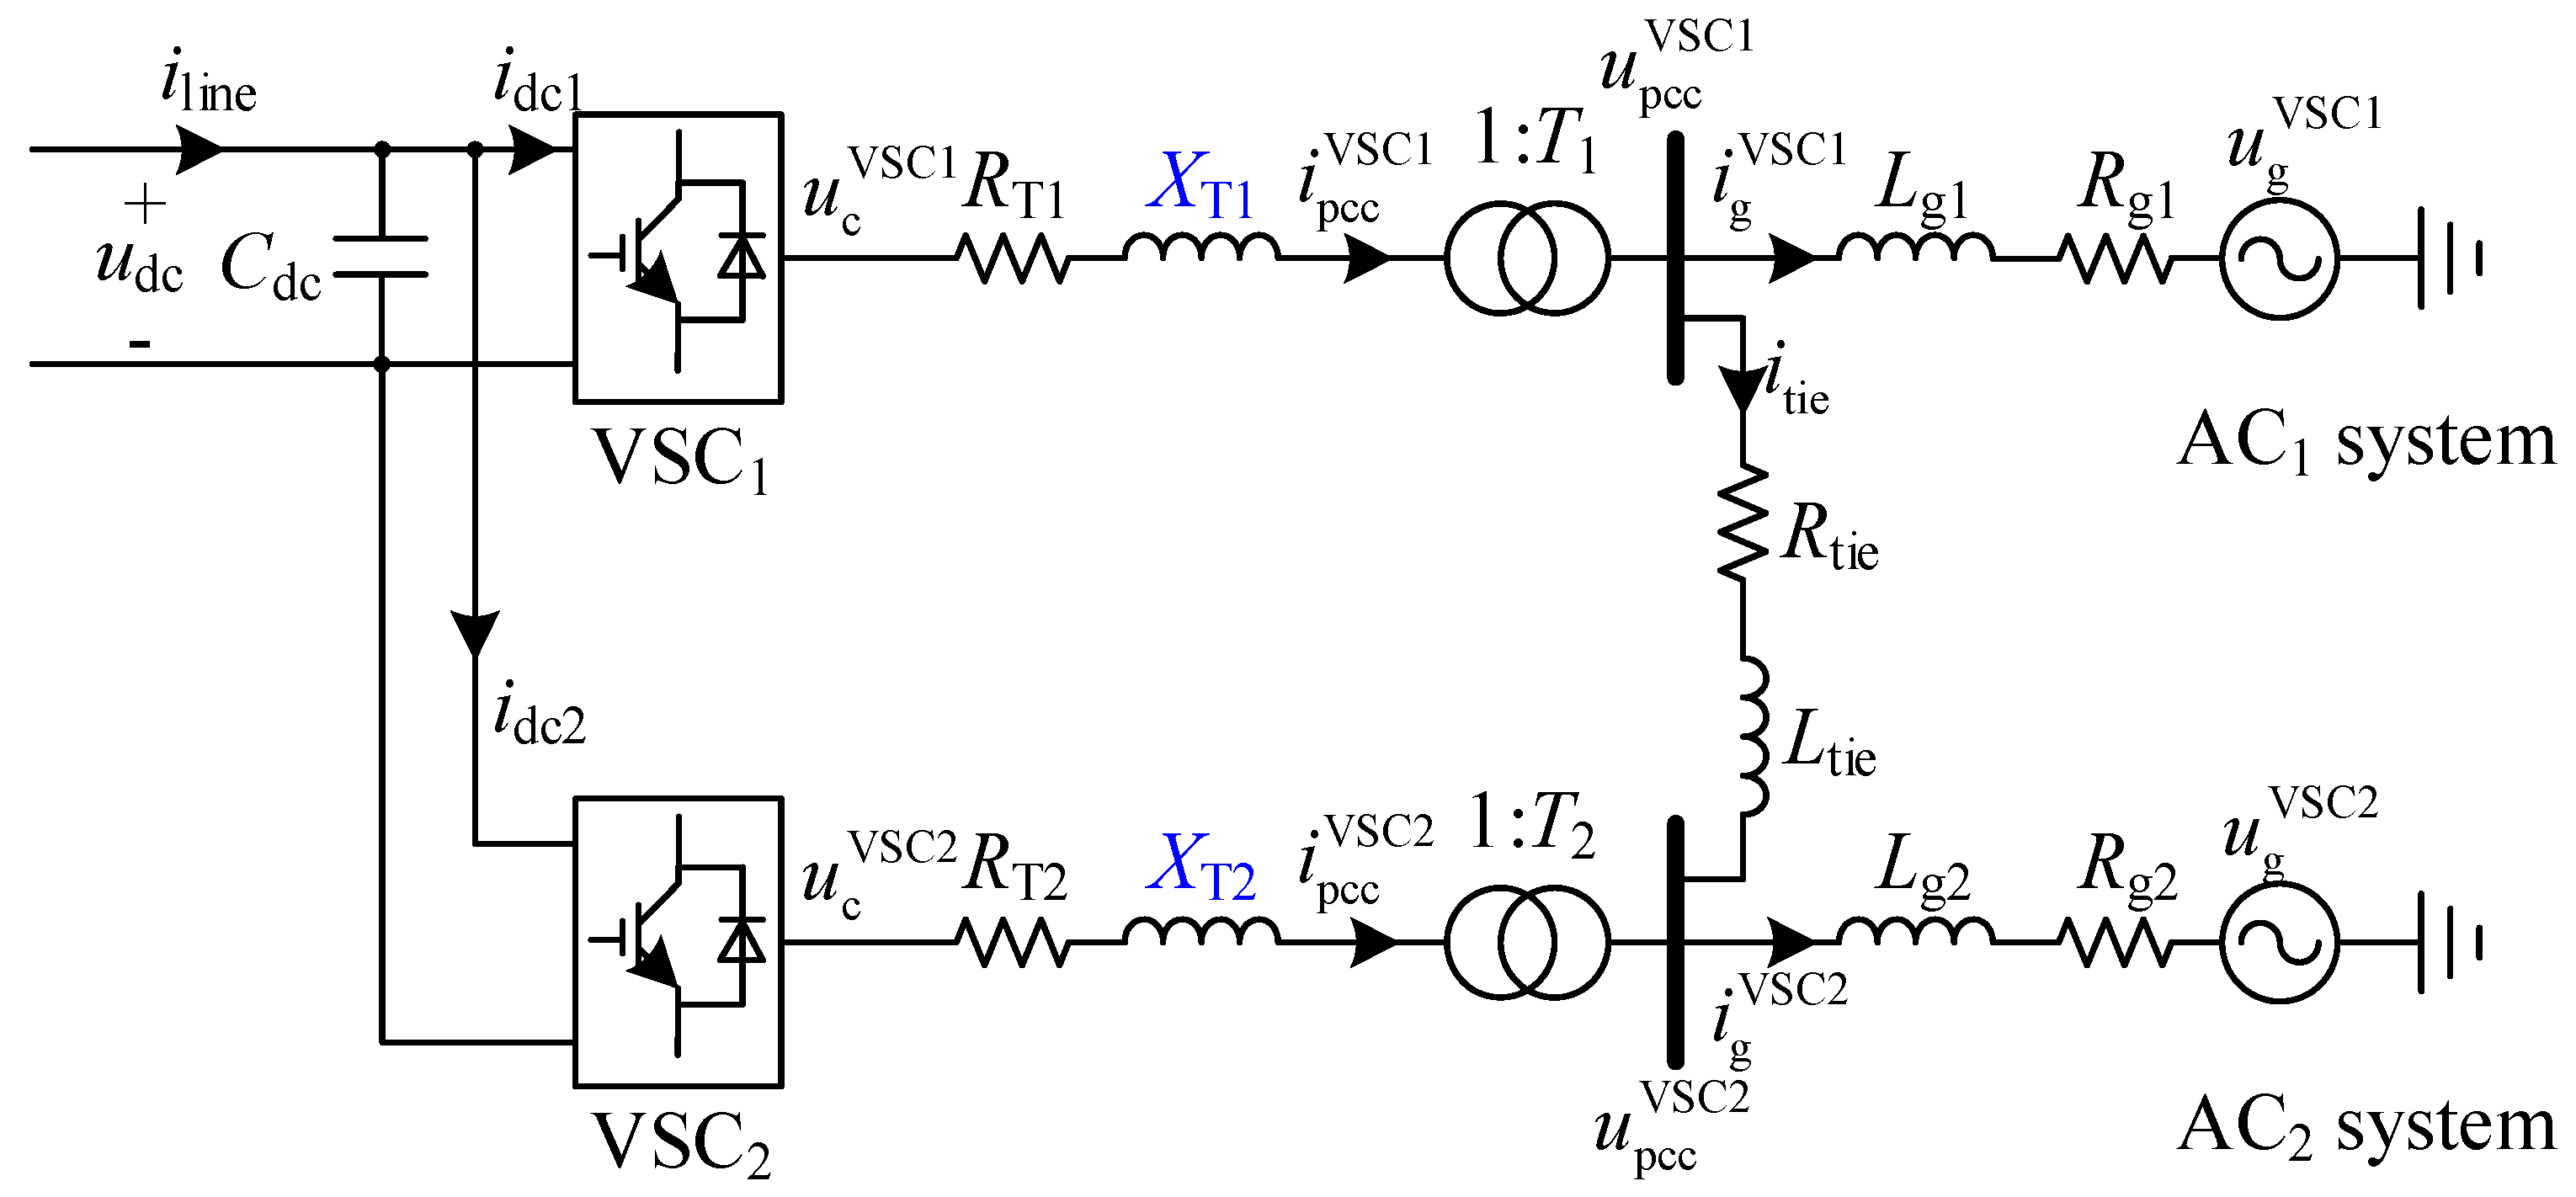
2. Structure and Controller of Dual-Receiving-End VSC-HVDC System

The main circuit of a dual-receiving-end VSC-HVDC system is shown in Figure 1. The system’s topology features VSC1 and VSC2 connected in parallel on the DC side through a common DC bus, with the AC sides connected to two different AC systems (AC1 and AC2). AC1 and AC2 are interconnected through a tie line. VSC1-HVDC employs DVC to support the DC bus voltage udc, with corresponding variables denoted by i = 1. VSC2-HVDC adopts PQC to ensure stable power transmission, with corresponding variables denoted by i = 2. The DC ports stabilize udc through a DC capacitor Cdc, and the AC ports connects to the AC systems through transformers Ti. Variables such as u c VSC i , idci, and i pcc VSC i represent AC port voltage, DC current, and AC current of VSC, respectively, while u pcc VSC i stands for the voltages at point of common coupling (PCC). The DC transmission line current is represented by iline. The equivalent electromotive force and grid-side current of the AC system are denoted by u g VSC i and i g VSC i , respectively. The current of the tie line is represented by itie, while Rgi and Lgi stand for the equivalent resistance and inductance of the AC system, respectively, characterizing the grid strength. The resistance and inductance of the tie line are denoted by Rtie and Ltie, respectively, while RTi and LTi represent the leakage resistance and inductance of Ti, respectively. Additionally, VSC2-HVDC is equipped with a mutual-support power mode, characterized by reversed active power transmission direction, providing power support to AC1.
The control architecture of the dual-receiving-end VSC-HVDC system is presented in Figure 2. Both VSC1-HVDC and VSC2-HVDC employ current vector control (VCC), with k pi VSC i and k ii VSC i representing the proportional and integral coefficients, respectively. The proportional and integral coefficients of the DC voltage outer loop are denoted by kpv and kiv, respectively, while kpac and kiac represent the proportional and integral coefficients of the power outer loop, respectively. The controller outputs modulation signals m d VSC i and m q VSC i in a dq rotating reference frame, which are transformed to the three-phase stationary coordinate system via inverse Park transformation and then modulated by sinusoidal pulse width modulation (SPWM) to generate the converter’s AC port voltage. In addition, the synchronous reference frame PLL (SRF-PLL) is utilized, with θ pll VSC i and ω0 representing the phase tracked by PLL and the rated angular frequency, respectively. The proportional and integral coefficients of the PLL controller are denoted by k ppll VSC i and k ipll VSC i , respectively.
In this paper, subscripts abc, dq, and xy denote variables in the three-phase stationary coordinate system, dq rotating reference frame, and xy coordinate system, respectively. Uppercase letters and the superscript ^ represent steady-state values and small-signal quantities of variables, respectively. Bold type denotes vectors, and the symbol s represents the Laplace operator.
The following assumptions are stated prior to conducting modeling and analysis:
  • The delays in the modulation process and sampling are neglected. This is because the modulation and sampling frequencies are typically much higher, mainly influencing the system’s high-frequency behavior, with limited effect on the 10–100 Hz frequency band that is the focus of this study [25];
  • Since the power loss of the converter typically accounts for approximately 1% of its rated capacity, it is neglected in this study. Accordingly, the AC-side power of the VSC is assumed to be equal to its DC-side power [26];
  • In the process of system modeling, the external characteristics of the receiving-end VSC-HVDC system serve as the main concern in this paper. As a result, its internal dynamic characteristics are neglected, and a two-level VSC is employed as a substitute for MMC [27].

3. Small-Signal Modeling

In this section, linearized state-space models for the controller, AC network, and DC-link subsystems are first established, based on the dynamic equations of the dual-receiving-end VSC-HVDC system. Subsequently, the subsystem models are combined to obtain a linearized closed-loop transfer function model, whose validity is verified through time-domain simulations. The AC part of the system is modeled in the xy coordinate system, while the controller part is modeled in the dq rotating reference frame for compatibility with VCC.

3.1. Small-Signal Modeling of AC Network

The dynamic equations of the AC port for the VSC grid can be expressed by Equation (1), where, i = 1, 2; i gxy VSC 1 = i pccxy VSC 1 / T 1 i tiexy , i gxy VSC 2 = i pccxy VSC 2 / T 2 + i tiexy .
d i pccx VSC i / d t = u cx VSC i u pccx VSC i / T i R Ti i pccx VSC i + ω 0 L T i i pccy VSC i / L T i d i pccy VSC i / d t = u cy VSC i u pccy VSC i / T i R T i i pccy VSC i ω 0 L T i i pccx VSC i / L T i d i gx VSC i / d t = u pccx VSC i u gx VSC i R g i i gx VSC i + ω 0 L g i i gy VSC i / L g i d i gy VSC i / d t = u pccy VSC i u gy VSC i R g i i gy VSC i ω 0 L g i i gx VSC i / L g i
According to Formula (1), the VSC output current i pccxy VSC i and the system current i gxy VSC i are selected as state variables X AC i , and the VSC output voltage u cxy VSC i and PCC voltage u pccxy VSC i as input variables U AC i ; the small-signal model of the AC network can be described as follows:
Δ X ˙ AC i = A AC i Δ X AC i + B AC i Δ U AC i Δ Y AC i = C AC i Δ X AC i + D AC i Δ U AC i
where:
A AC i = R Ti ω 0 L T i 0 0 ω 0 L T i R Ti 0 0 0 0 R g i ω 0 L g i 0 0 ω 0 L g i R g i , B AC i = 1 0 1 0 0 0 0 1 0 1 0 0 0 0 1 0 1 0 0 0 0 1 0 1 , C AC i = 1 0 0 0 0 1 0 0 0 0 1 0 0 0 0 1 , D AC i = 0 4 × 6
Similarly, by defining the tie line current i tiex and i tiey as the state variable X tie , and the PCC voltages of AC1 and AC2, namely u pccxy VSC 1 and u pccxy VSC 1 , as the input variable U tie , the linearized model of the tie line is obtained as follows:
d i tiex / d t = u pccx VSC 1 u pccx VSC 2 R tie i tiex + ω 0 L tie i tiey / L tie d i tiey / d t = u pccy VSC 1 u pccy VSC 2 R tie i tiey ω 0 L tie i tiex / L tie
Δ X ˙ tie = A tie Δ X tie + B tie Δ U tie Δ Y tie = C tie Δ X tie + D tie Δ U tie
where A tie = R tie ω 0 L tie ω 0 L tie R tie , B tie = 1 0 1 0 0 1 0 1 , C tie = 1 0 0 1 , D tie = 0 2 × 4

3.2. Small-Signal Modeling of DC-Link

The dynamic equation of the DC port for the dual-receiving-end VSC-HVDC system can be given by Equation (5), as follows:
d u dc / d t = i line i dc 1 i dc 2 / C dc
Neglecting VSC losses, the AC side power equals the DC side power, as follows:
u dc i dc i = 3 2 u cd VSC i i pccd VSC i + 3 2 u cq VSC i i pccq VSC i u cdq VSC i = u dc 2 m dq VSC i
The small-signal model of DC-link can be derived as Equation (7) via the linearization of Equations (5) and (6).
p u ^ dc = i ^ line 3 4 C dc i = 1 2 M dq VSC i , T i ^ pccdq VSC i + I pccdq VSC i , T m ^ dq VSC i

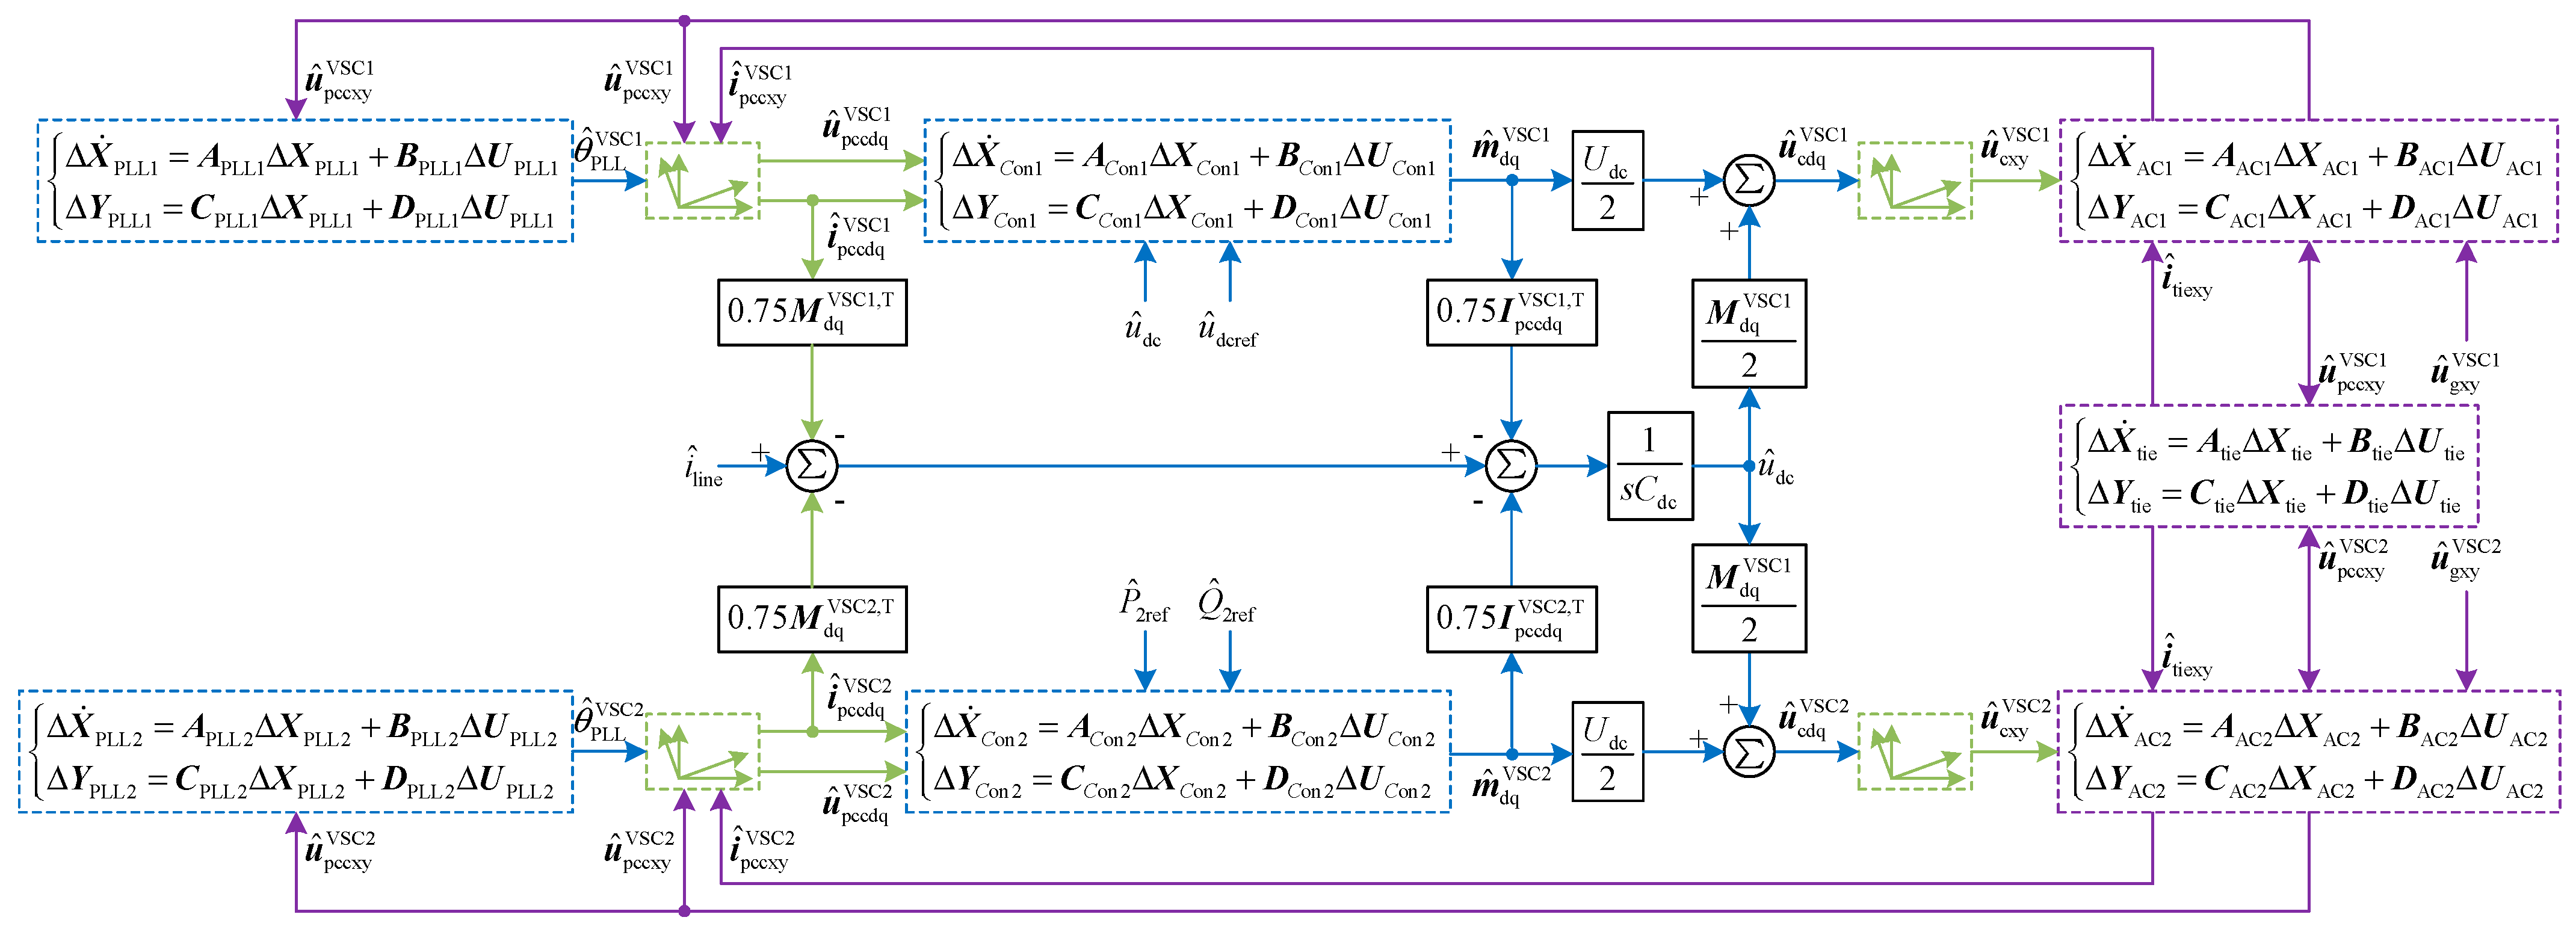
3.3. Small-Signal Modeling of Controller

The dynamic equations and output equations of the controller are given by Equations (8) and (9), respectively, where i = 1, 2; x od VSC 1 , x odq VSC 2 and x idq VSC i denote state variables of the controller. Take the controller of VSC1 as an example, the input and output variables are UCon1 = [ u pccdq VSC 1 , T , i pccdq VSC 1 , T , udc, udcref, i pccqref VSC 1 ]T and YCon1 = m dq VSC 1 , respectively.
d x od VSC 1 / d t = k pv u dc u dcref d x od VSC 2 / d t = k iac P 2 ref P VSC 2 d x oq VSC 2 / d t = k iac Q 2 ref Q VSC 2 d x id VSC i / d t = k ii VSC i i pccdref VSC i i pccd VSC i d x iq VSC i / d t = k ii VSC i i pccqref VSC i i pccq VSC i
i pccdref VSC 1 = x od VSC 1 + k pv u dc u dcref i pccdref VSC 2 = x od VSC 2 + k pac P 2 ref P VSC 2 i pccqref VSC 2 = x oq VSC 2 + k pac Q 2 ref Q VSC 2 m d VSC i = x id VSC i + k pi VSC i i pccdref VSC i i pccd VSC i + u pccd VSC i ω 0 L T i i pccq VSC i m q VSC i = x iq VSC i + k pi VSC i i pccqref VSC i i pccq VSC i + u pccq VSC i + ω 0 L T i i pccd VSC i
The small-signal models of the controller can be derived as below through the linearization of Equations (8) and (9):
Δ X ˙ C on i = A C on i Δ X C on i + B C on i Δ U C on i Δ Y C on i = C C on i Δ X C on i + D C on i Δ U C on i
The dynamic equations of PLL can be expressed by Equation (11), where, i = 1, 2; θ pcc VSC i = arctan ( u pccy VSC i / u pccx VSC i ), and x PLL VSC i stands for the state variables of PLL:
d x PLL VSC i / d t = k iPLL VSC i θ pcc VSC i θ PLL VSC i d θ PLL VSC i / d t = x PLL VSC i + k pPLL VSC i θ pcc VSC i θ PLL VSC i
The input variables and output variables are UPLLi = u pccxy VSC i and yPLL = θ PLL VSC i , respectively. The small-signal model of PLL can be derived as Equation (12) via the linearization of (11), as follows:
Δ X ˙ PLL i = A PLL i Δ X PLL i + B PLL i Δ U PLL i Δ y PLL i = C PLL i Δ X PLL i + D PLL i Δ U PLL i
The transformation equations between the dq rotating reference frame and xy coordinate system are given by (13), where x represents electrical quantities such as voltage, current, and modulation signals, as follows:
x x = cos θ PLL x d sin θ PLL x q x y = sin θ PLL x d + cos θ PLL x q

3.4. Interconnection of Subsystem Models

Interconnecting the small-signal models of each subsystem yields the linearized model of the whole system, as presented in Equation (14) where ∆X stands for the state variables of the whole system, which is an 18 × 1 vector, and ∆U = [ u ^ dcref , i ^ pccqref VSC 1 , P ^ 2 ref , Q ^ 2 ref , i ^ line , u ^ xy g 1 , T , u ^ xy g 2 , T ]T, containing the input variables. In addition, A and B denote the state matrix and the input matrix, respectively.
Δ X ˙ = A Δ X + B Δ U
The graphical representation of Equation (14) is shown in Figure 3. Regarding control strategies, it is noted that different control strategies exhibit differentiated regulation capabilities for modulation signals, and this difference, combined with DC voltage, jointly affects the AC port voltage of VSC1 and VSC2. Regarding the DC link, the dynamic response characteristics of udc exhibit strong dynamic interaction with the modulation signals and AC currents of the converter, and this interaction is simultaneously influenced by the control strategies. Additionally, different control strategies produce coupling through the common DC link, leading to interaction coupling between the DVC and PQC during system operation. Regarding the tie line model, this reveals an energy exchange mechanism between the AC1 and AC2 subsystems, where coupling strength exhibits an inverse correlation with the tie line length. Notably, structural asymmetry in grid topology induces dynamic interactions via the tie line, potentially reducing phase margin and destabilizing the system, which warrants rigorous modal analysis.
In conclusion, the dual-receiving-end VSC-HVDC system is characterized by highly dynamic interaction. In this context, VSC1-HVDC and VSC2-HVDC are endowed with distinctive operating characteristics through the implementation of differentiated control strategies, while being dynamically coupled through interactions mediated by the DC-side capacitor and AC tie line, thereby amplifying the complexity of the system responses. As a result, the stability of the system is not dictated by a single control strategy but rather by the collective influence of DVC and PQC, manifesting disparities compared with VSC-HVDC systems operating under single control strategies.

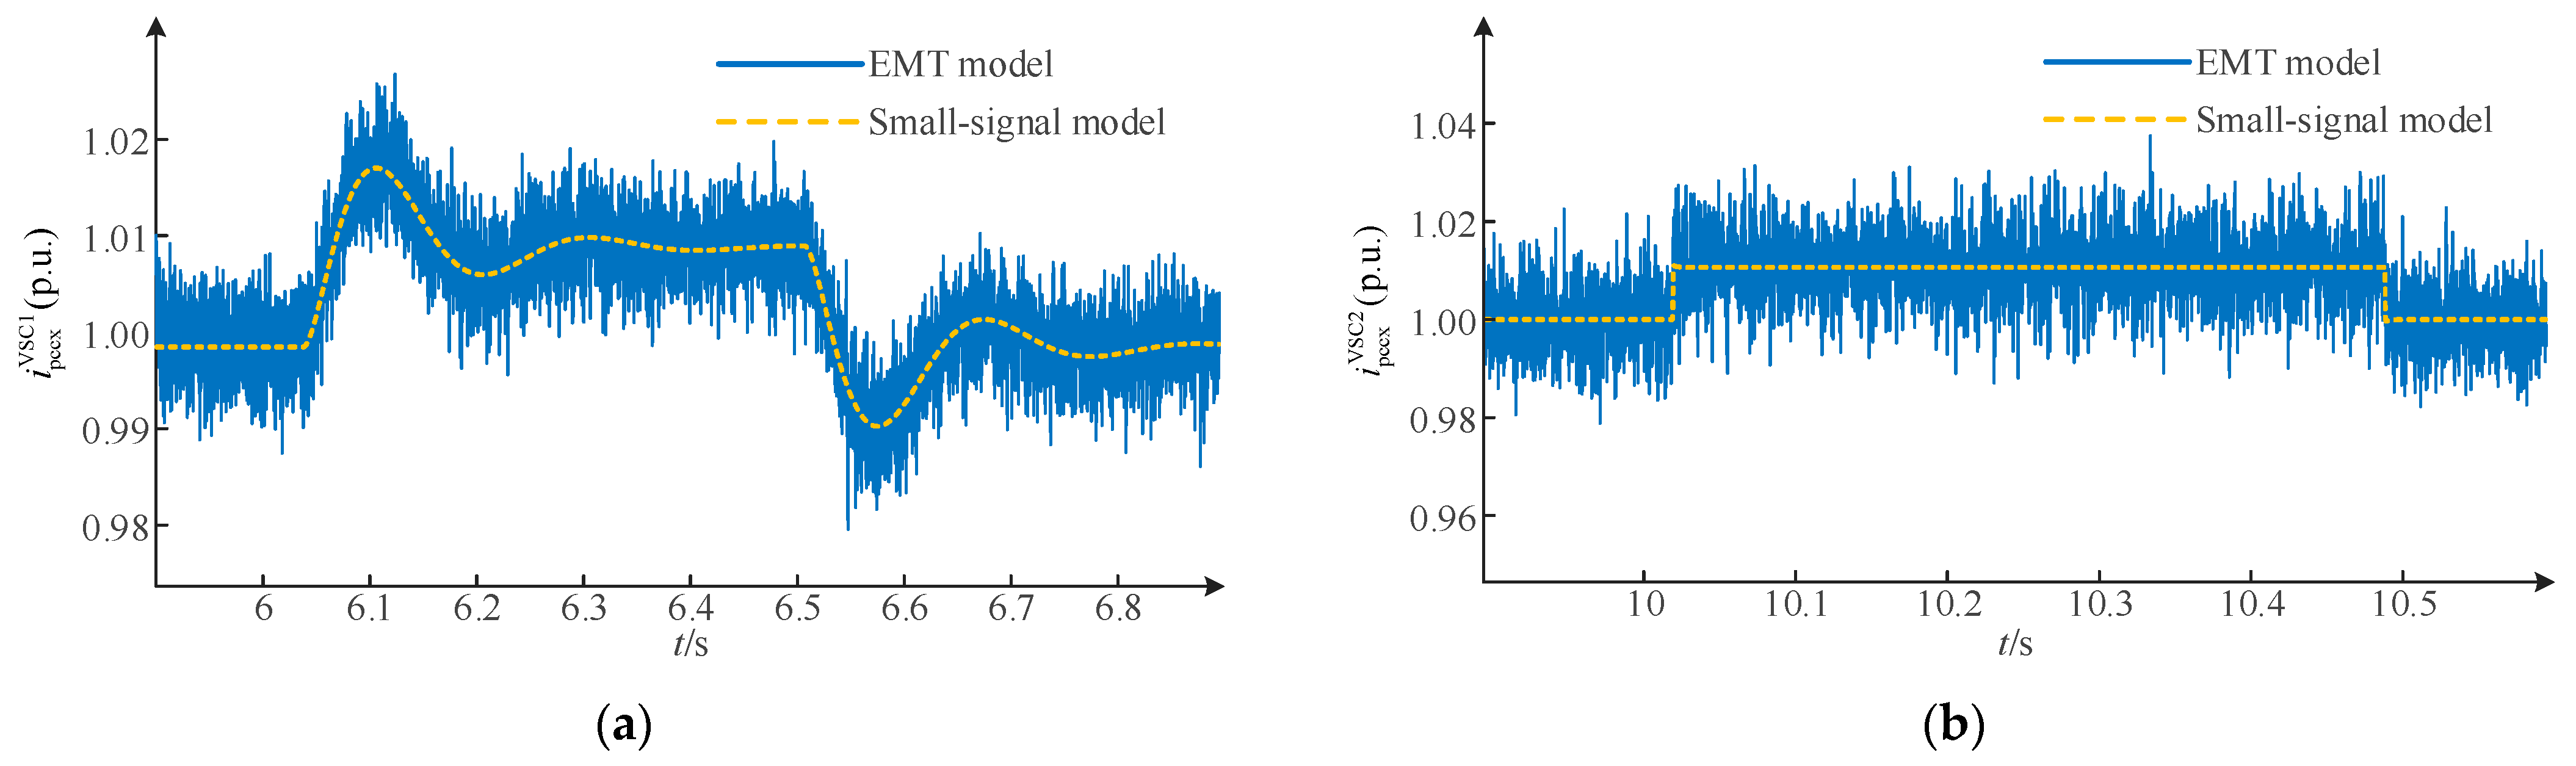
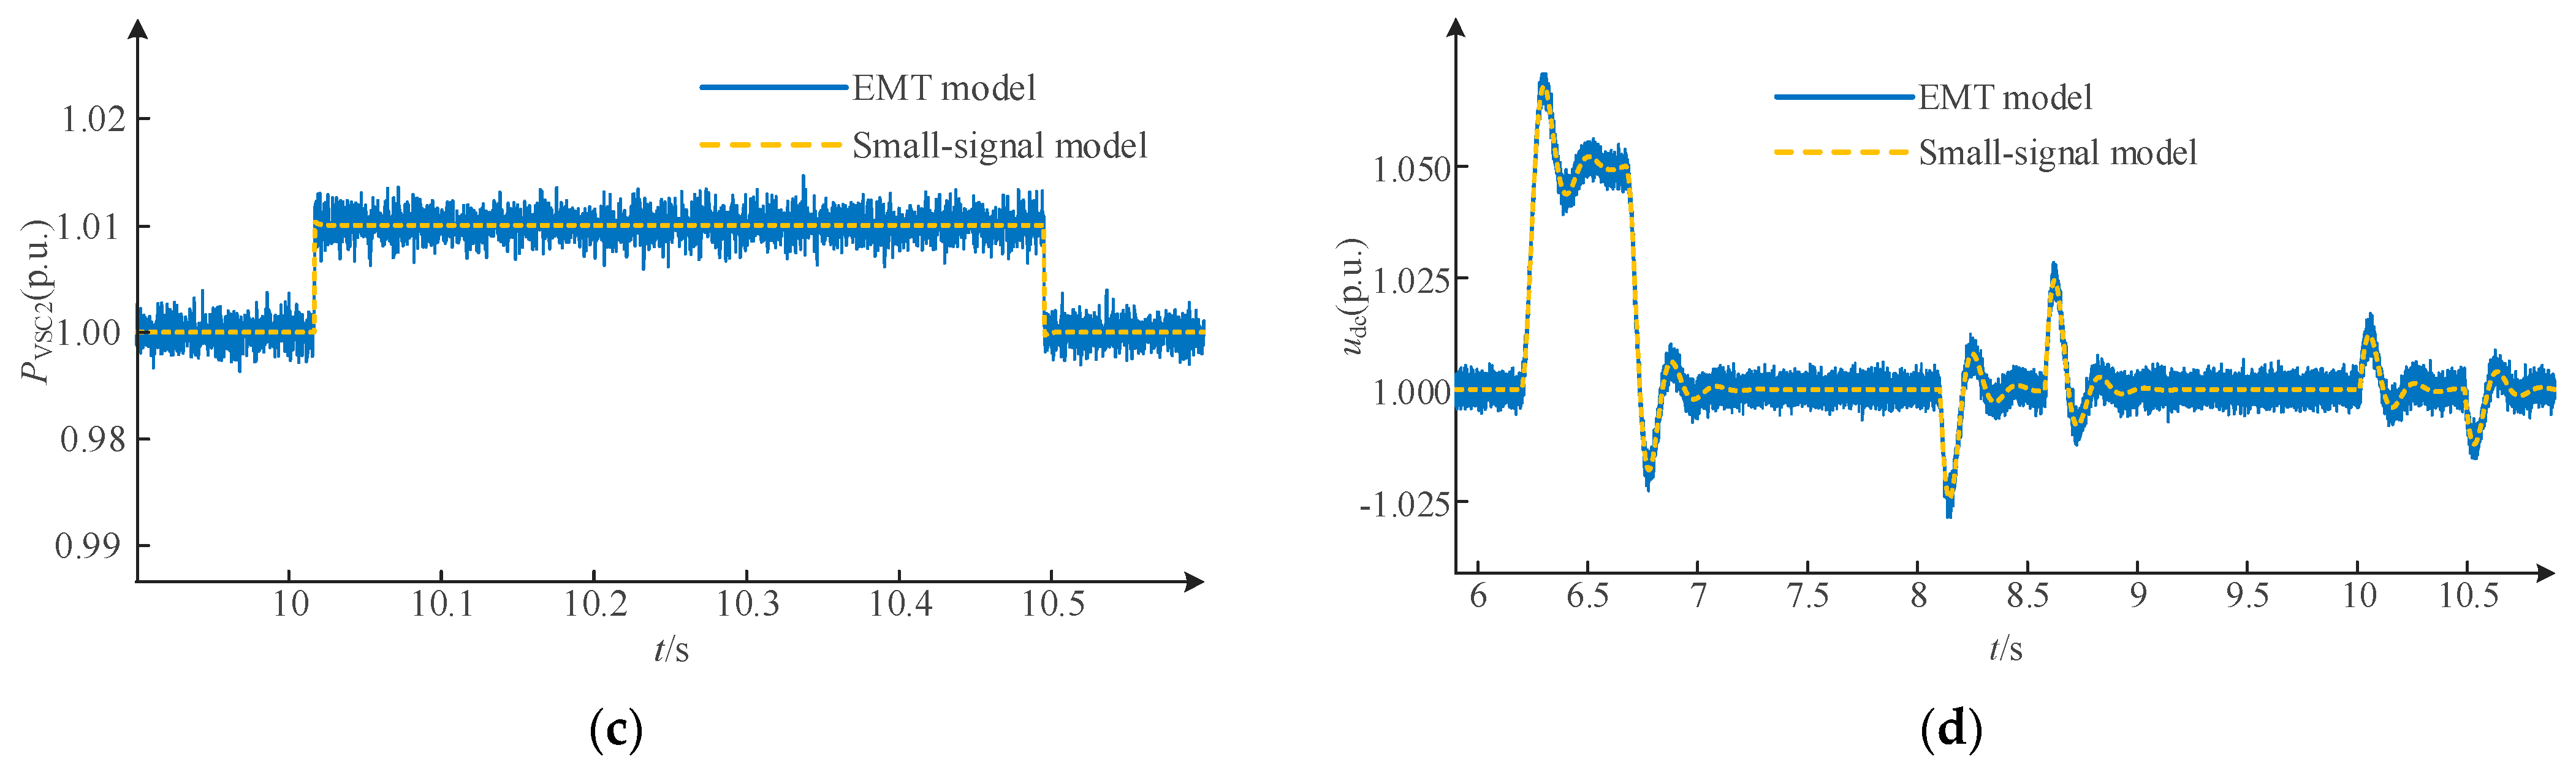
3.5. Model Validation

Based on the main circuit topology in Figure 1 and the control architecture illustrated in Figure 2, an electromagnetic transient (EMT) model was established in MATLAB/Simulink. By comparing the calculation results of the small-signal model and the EMT model, the accuracy of the small-signal model is verified. The system parameters are presented in Table 1 and Table 2.
The system commences operation at its rated operating point during the initial phase. The predefined disturbance conditions are structured as follows: (1) udcref undergoes an upward step change of 0.05 p.u. at t = 6 s; (2) iline experiences an upward step change of 0.01 p.u. at t = 8 s; (3) P2ref encounters an upward step change of 0.03 p.u. at t = 10 s. Each disturbance signal is removed after being injected for 0.5 s. The comparison results of the time-domain responses between the small-signal model and the EMT model are presented in Figure 4. The solid-line waveforms represent the simulation results of the EMT model, while the dashed-line waveforms denote the theoretical calculation results of the small-signal model. The time-domain responses of x-axis currents in VSC1 and VSC2, the active power of VSC2-HVDC, and the DC voltage are illustrated in Figure 4a–d, respectively. The time-domain responses of the two models exhibit substantial overlap when the additional high-frequency components caused by the switching processes of the EMT model are excluded, demonstrating the validity and accuracy of the established small-signal model.

4. Construction of a Feasible SCR Region with Joint Power–Topology Constraints

In this section, based on the small-signal model, the influence of control strategy, asymmetrical grid strength, power flow direction, and tie line on the small-signal stability is analyzed, and the formation of a feasible SCR region constrained by power and topology is described.

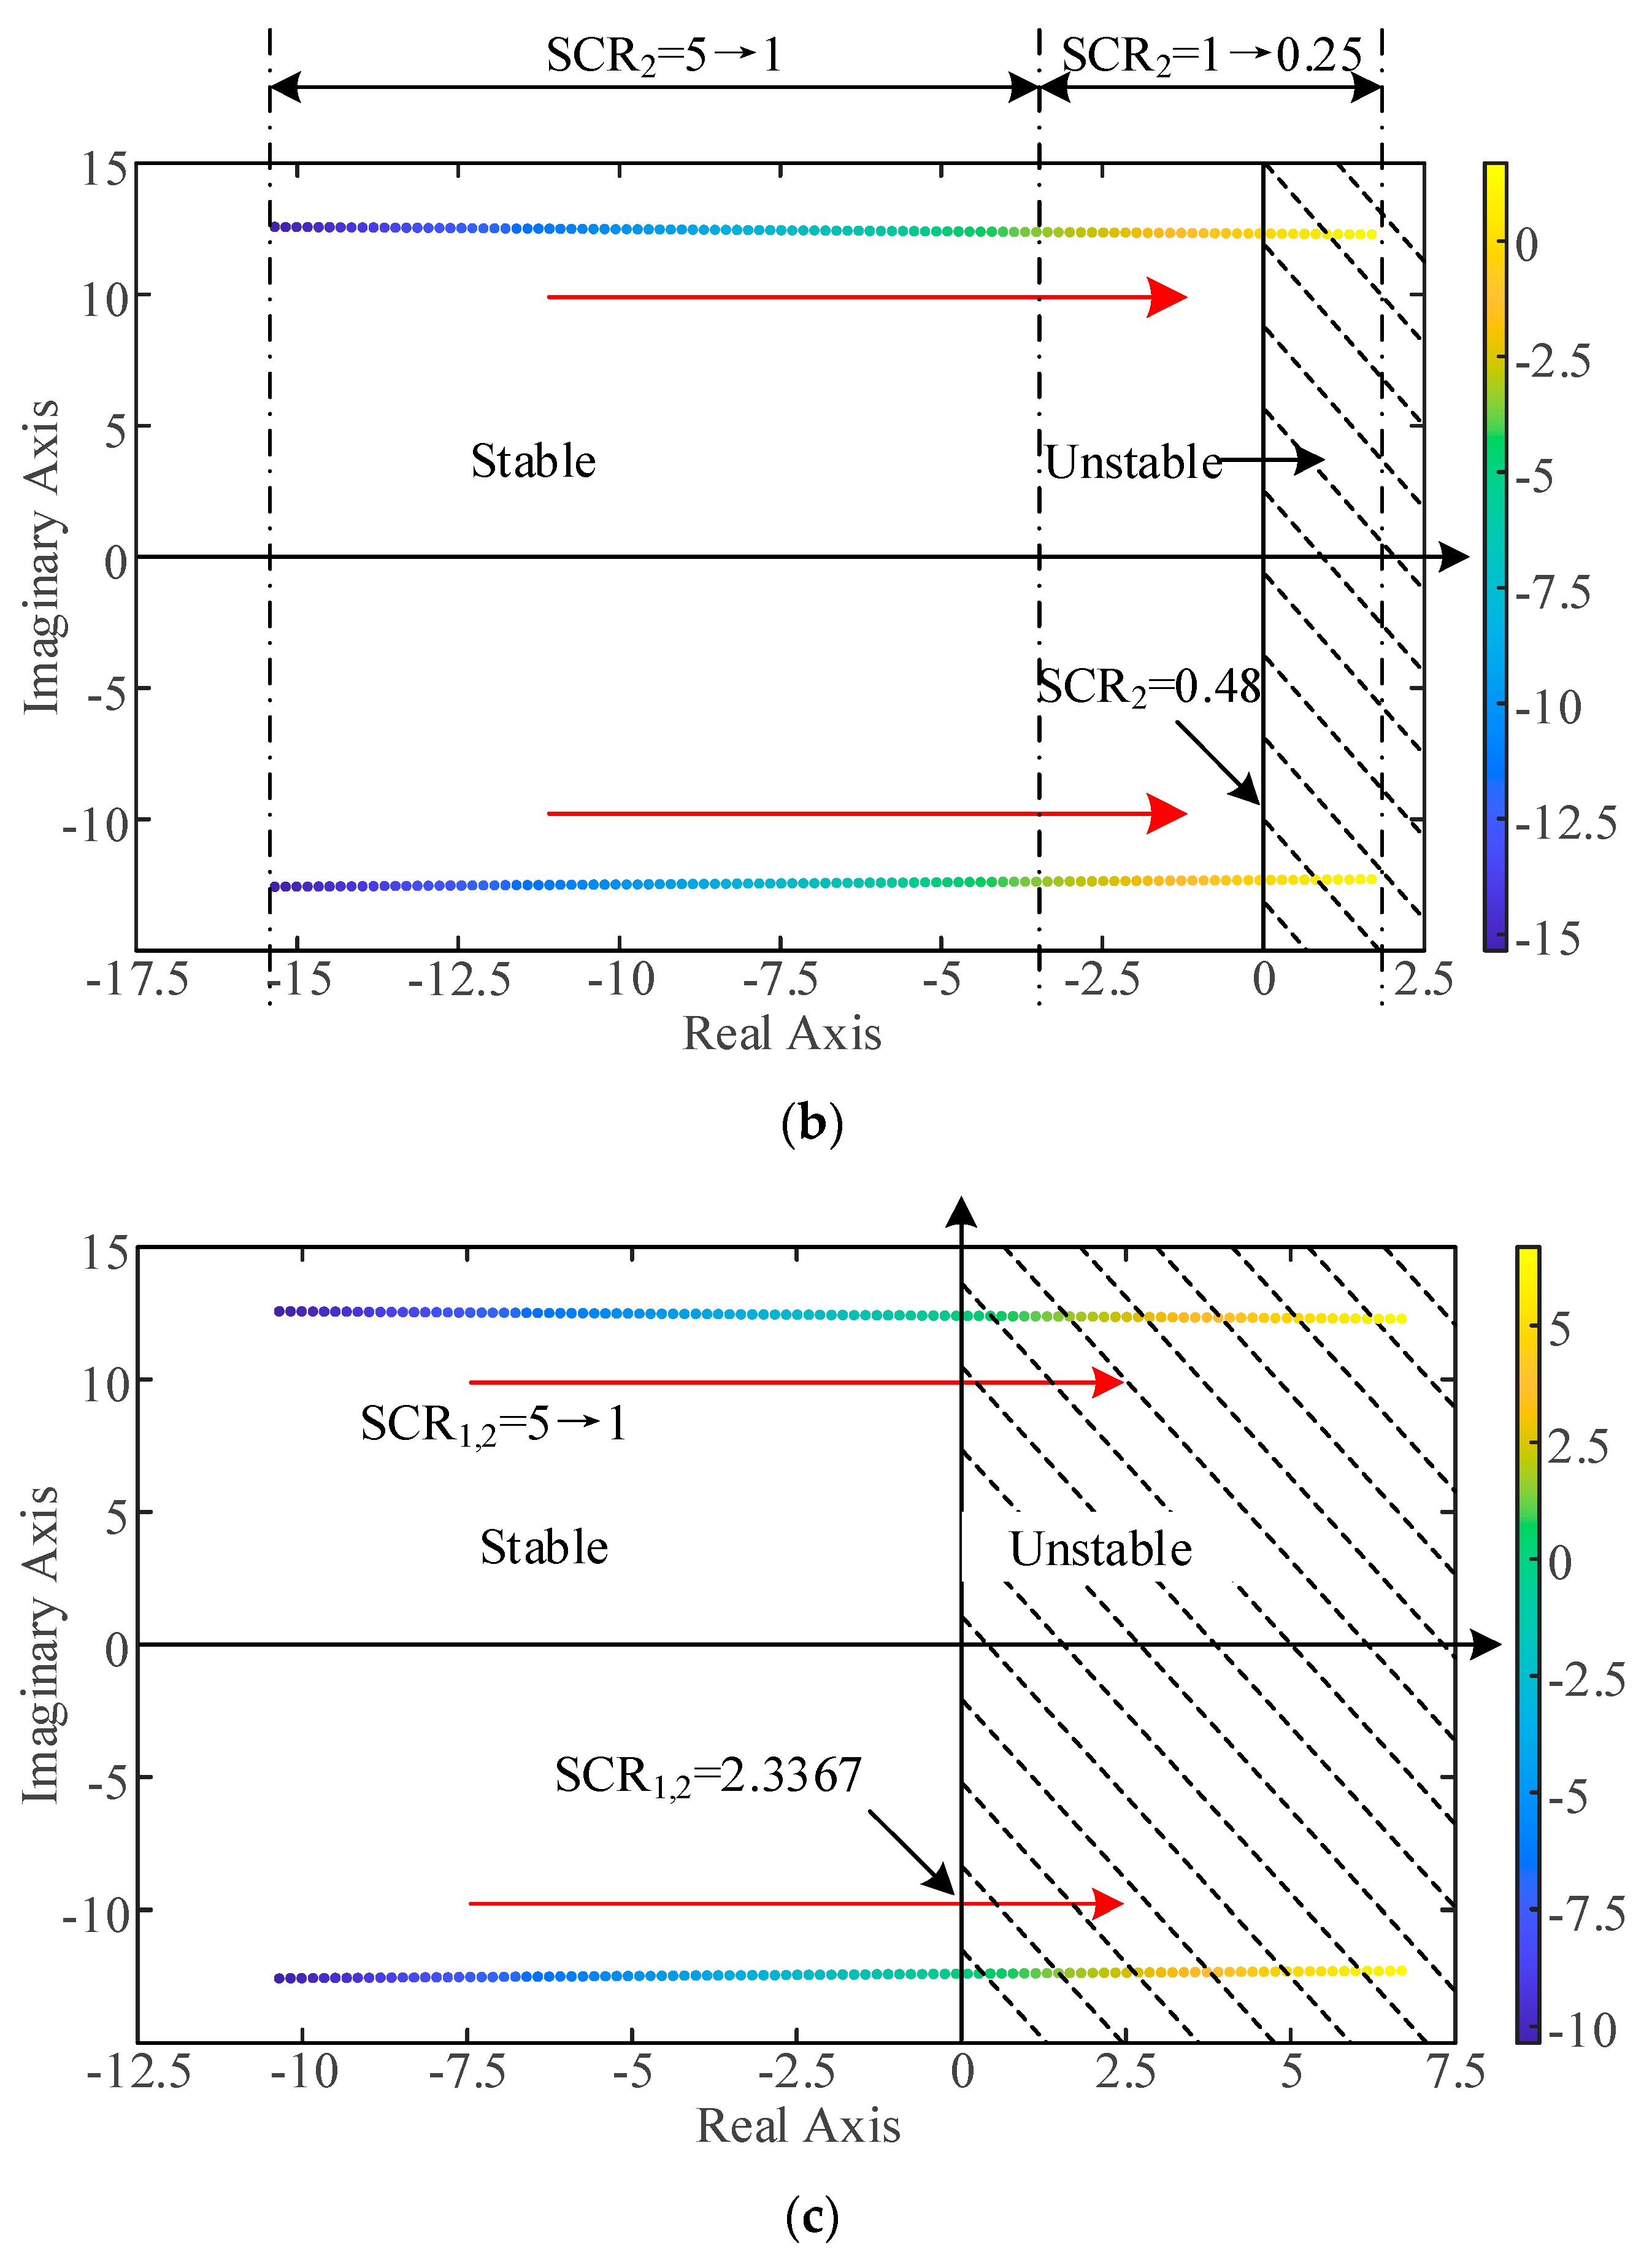
4.1. The Impact of AC System Strength

As shown in Figure 1, the main circuit is interconnected on the AC side via the tie line. In this configuration, when the connected AC power grid exhibits relatively weak strength, the voltage at PCC becomes susceptible to disturbances, resulting in enhanced dynamic coupling between VSC1-HVDC and VSC2-HVDC, which in turn affects the system’s stability [28,29]. Therefore, three sets of SCR combination conditions were selected for investigation, as discussed in the following sections.
In Case 1, SCR2 was kept constant while varying SCR1 from 5 to 1; in Case 2, SCR1 was kept constant while varying SCR2 from 5 to 1; In Case 3, SCR1 and SCR2 both varied from 5 to 1. In all three aforementioned cases, the length of the tie line was 50 km, and VSC2-HVDC transmitted rated power. The system’s root loci are depicted in Figure 5a–c, respectively, with the color bars corresponding to the real axis of the dominant mode.
As shown in Figure 5a,b, as SCR1 decreases in Case 1, the dominant modes exhibit a progressive migration toward the imaginary axis, directly reducing the system’s stability margin. When SCR1 < 2.1465, the system oscillates and becomes unstable. Similarly, for Case 2, the system could still operate stably when SCR2 is reduced to 1. On this basis, SCR2 was further decreased; when SCR2 < 0.48, the system fails to maintain stable operational conditions. According to the aforementioned analysis, despite the symmetrical configuration of Case 1 and Case 2, the distinct control strategies adopted by VSC1-HVDC and VSC2-HVDC lead to a situation where the minimum acceptable SCR for AC2 is lower than that for AC1, which implies that a VSC-HVDC system employing PQC is less affected by grid strength and can accommodate a weaker AC system while maintaining the same rated power. According to Figure 5c, as both SCR1 and SCR2 decrease simultaneously, the small-signal stability of the system also weakens, and when both SCR1 and SCR2 < 2.3367, the system oscillates and becomes unstable.
Furthermore, by configuring additional SCR combination scenarios as shown in Figure 5, the feasible SCR region can be constructed as illustrated in Figure 6. The solid black line in the figure represents the SCR’s critical boundary, indicating the minimum acceptable SCR when either SCR1 or SCR2 varies. For instance, points A, B, and C on the critical boundary correspond to the minimum acceptable SCR values for Case 1, Case 2, and Case 3, respectively. The regions above and below the solid black line denote the feasible and infeasible SCR regions, respectively.

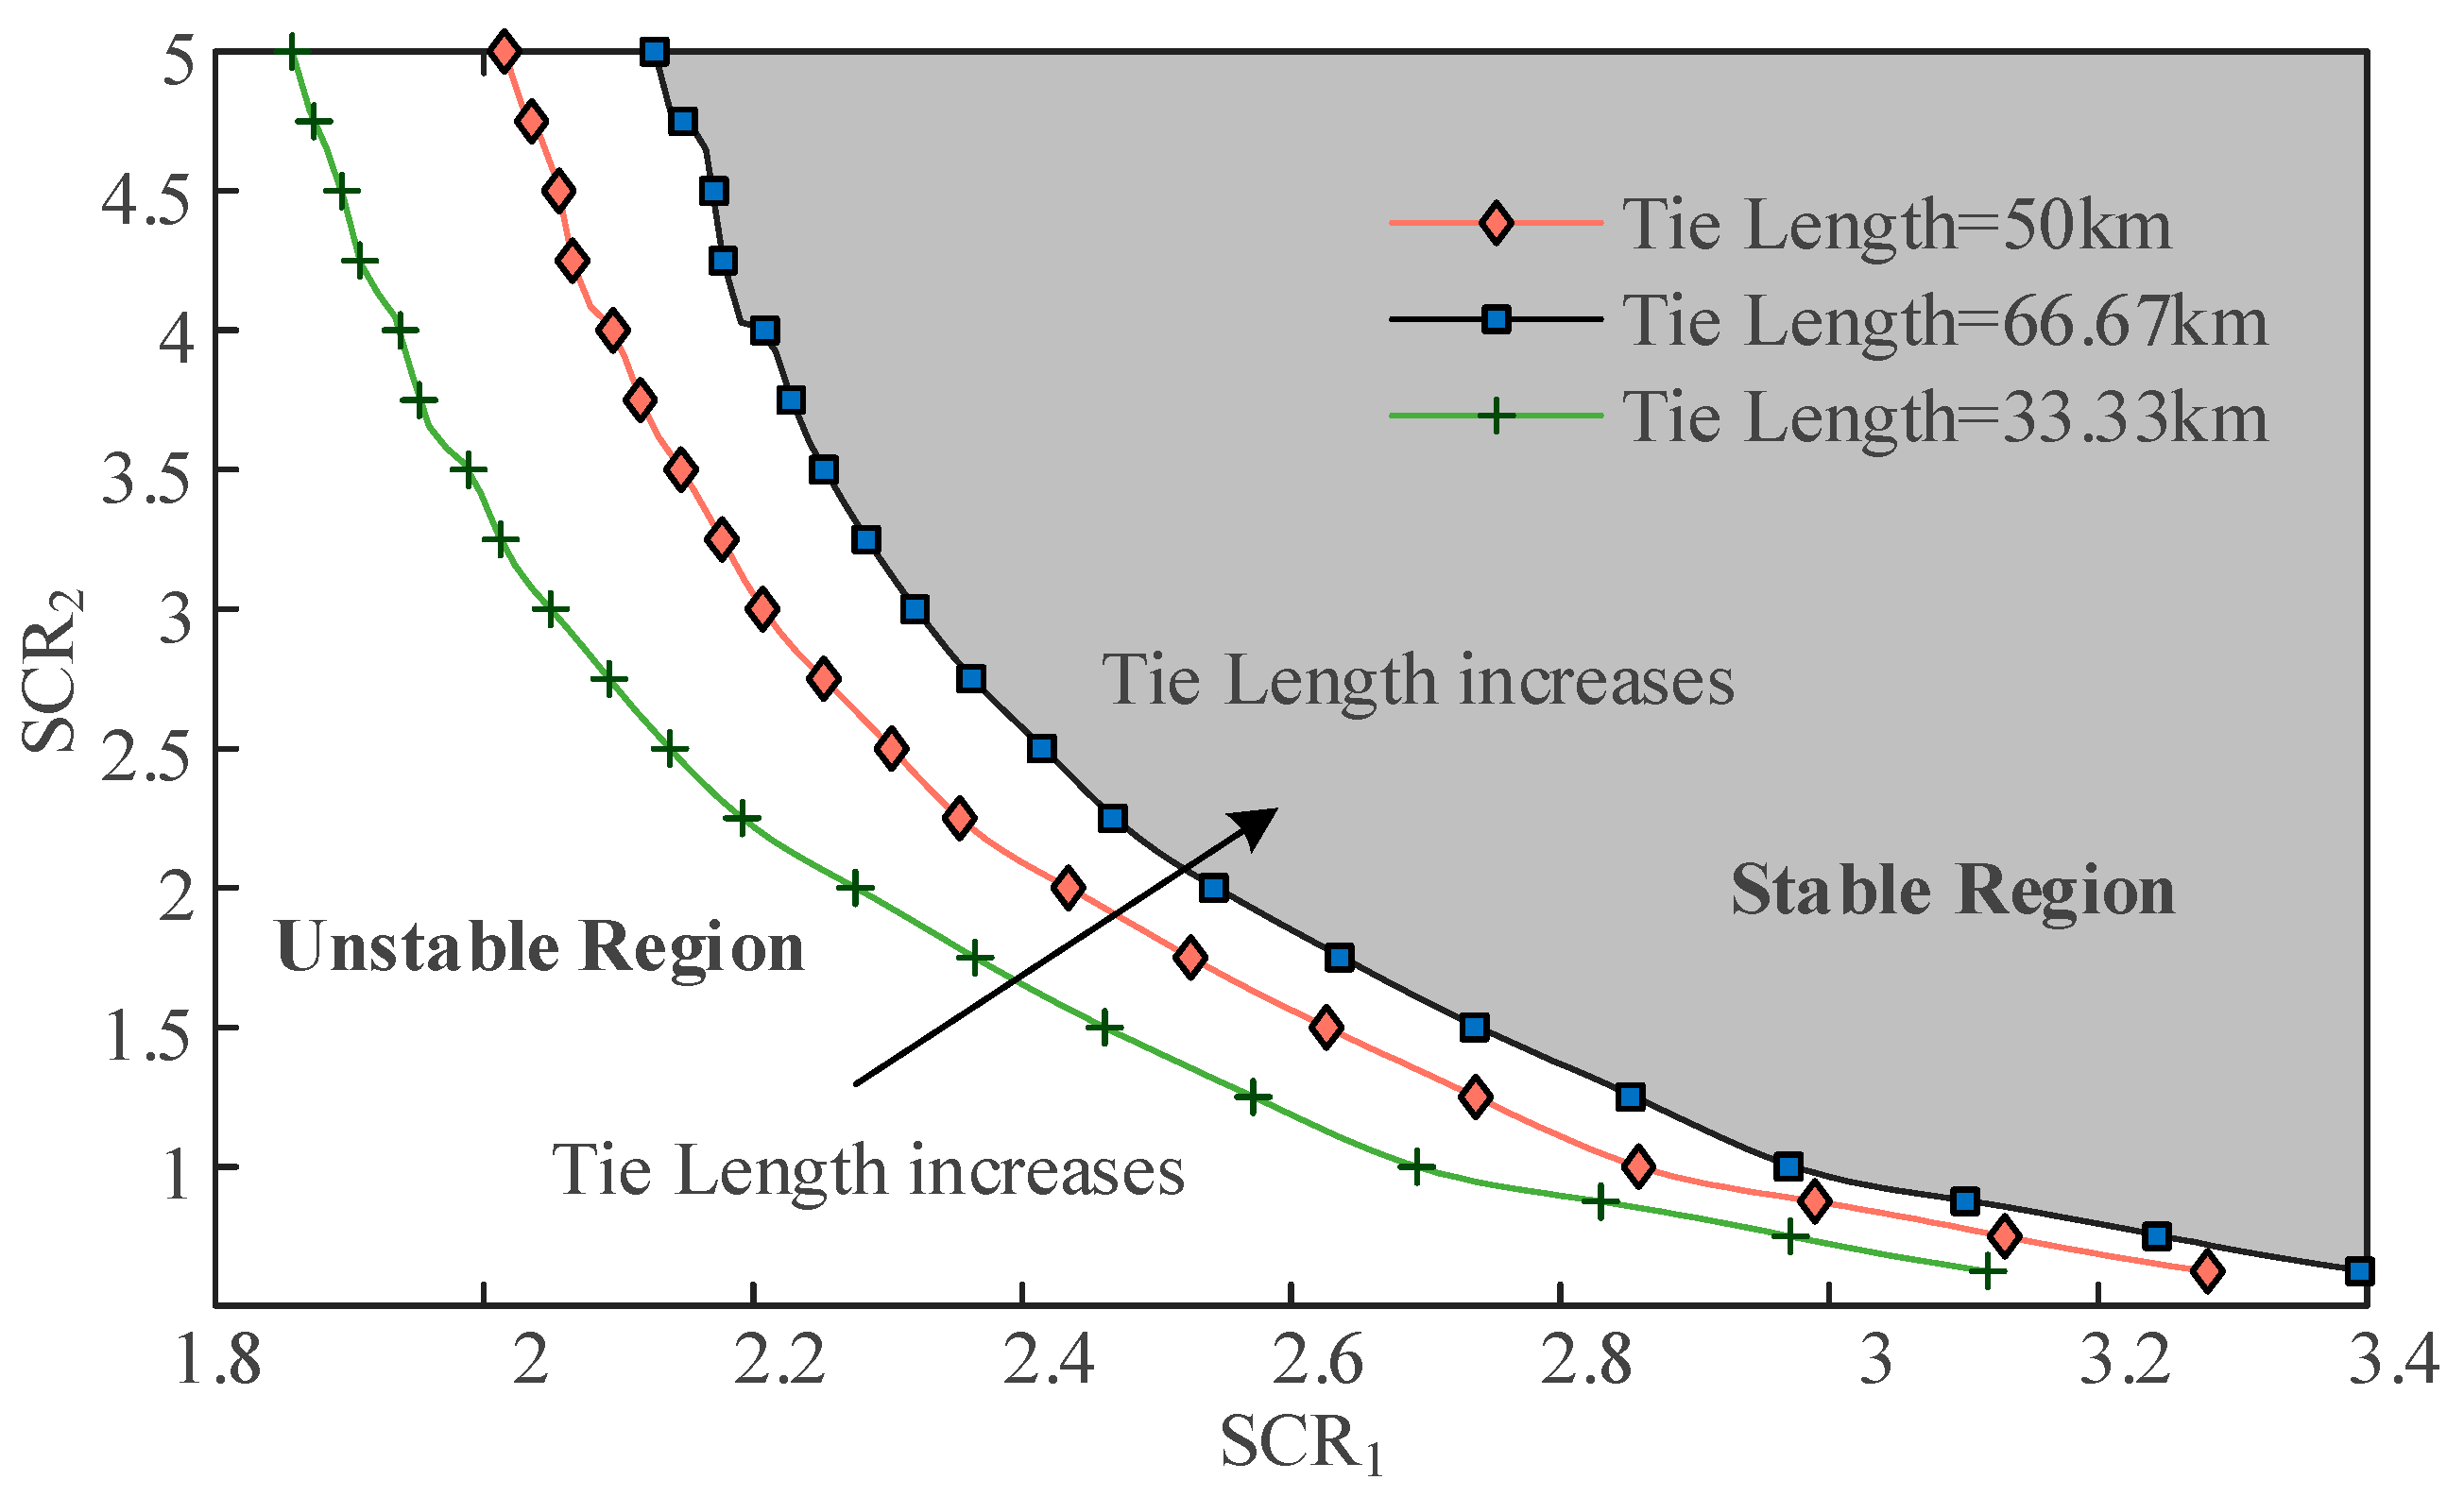
4.2. The Impact of Tie Line Length

AC1 and AC2 are electrically interconnected through the tie line. As illustrated in Figure 3, different tie-line lengths exhibit significant variations in their impact on the cross-coupling of dynamic responses among differentiated control strategies and the degree of interaction between electrical quantities in the VSC1-HVDC and VSC2-HVDC subsystems [30]. To further evaluate the aforementioned impacts, three SCR combinations were analyzed under constant rated power transmission of VSC2-HVDC: Case 4 (SCR1 = 2.1465, SCR2 = 3.5), Case 5 (SCR1 = 3.5, SCR2 = 2.1465), and Case 6 (SCR1 = 2.8233, SCR2 = 2.8233). Under these three operating conditions, the length of tie line varied from 20 km to 100 km. The system’s root loci are depicted in Figure 7a–c, respectively, with the color bars corresponding to the real axis of the dominant mode.
Figure 7a–c demonstrate that the extended tie line lengths induce dominant modes to approach and cross the imaginary axis, which may escalate the risk of small-signal instability. Furthermore, the maximum permissible tie line length is jointly determined by the outer-loop control strategy and the unbalanced grid parameters. Specifically, under a symmetric grid configuration (Case 6), the maximum acceptable length of the tie line is 91 km. In contrast, under balanced grid parameters (Case 4 and Case 5), when the grid connected to the VSC-HVDC with DVC is weaker (Case 4), the maximum allowable length of the tie line is 51 km, whereas under conditions where the grid connected to the VSC-HVDC with PQC is weaker (Case 5), the system can still operate stably with a tie line length of 100 km. Although Case 4 and Case 5 are symmetrically configured, their critical tie line lengths differ. Based on the aforementioned analysis, it can be stated that VSC1-HVDC is more critically dependent on grid strength; therefore, when the strength of AC1 is weaker, reducing the equivalent electrical distance of the tie line becomes essential to mitigate oscillations and maintain stability.
By maintaining the power transmission of VSC2-HVDC at a constant rate, the feasible SCR region under various tie line lengths was obtained, as illustrated in Figure 8. The definition of the feasible SCR region in this figure is consistent with that presented in Figure 6. It can be discerned that the line impedance experiences an upward trend with the increase in tie line length, and the equivalent SCR of the AC system gradually decreases [31,32]. As a result, the stability boundary migrates towards the upper right region of the graph, accompanied by a reduction in the area of the feasible SCR region, signifying a progressive decline in the system’s stability margin. In addition, the smaller the value of SCR1 is, the more rapid the change of stability boundary with respect to the tie line length, indicating that compared with the PQC strategy, the DVC strategy amplifies the impact of tie line length fluctuations on small-signal stability under weak grid conditions.

4.3. The Impact of Power Condition for VSC2-HVDC

On the basis of the aforementioned research, the constraint relationships between the feasible SCR region and the capacity as well as the direction of PVSC2 were considered. For all the aforementioned tie line configurations, by gradually adjusting the operating point of PVSC2 from 1.0 p.u. to −1.0 p.u., a feasible SCR region subject to combined power–topology constraints was constructed; the evolutionary characteristics are depicted in Figure 9, for the conditions of a 66.67 km tie line and PVSC2 = −1.0 p.u., where point P represents a set of critical SCR combinations (SCR1 = 4.303, SCR2 = 2.5) for maintaining stable operation. During the process of the VSC2-HVDC transitioning from the normal operating mode to the mutual-support power mode, the stability boundary migrates towards the upper-right section, accompanied by a reduction in the area of the feasible SCR region, signifying a progressive diminishment of the system’s stability margin, with this trend unaffected by changes in the length of tie line.
Furthermore, with SCR2 and the tie line length fixed at 2.5 and 50 km, respectively, the participation factor distributions at operating points on the stability boundary are comparatively illustrated in Figure 10, for two operational scenarios of the VSC2-HVDC system: normal operating mode and mutual-support power mode. All the state variables are categorized into seven groups: AC system, PLL1, PLL2, DVC loop, PQC loop, VCC1, and VCC2. A quantitative examination of the operational characteristics demonstrates that under forward power flow conditions in VSC2-HVDC, the state variable xod1 associated with DVC exhibits dominant participation (79.79% contribution rate). Conversely, when VSC2-HVDC provides power support to AC1, the participation of xod1 further increases to 87.78%, while the participation of other variables decreases, indicating that the mutual-support power mode exacerbates the sensitivity of DVC strategy to the weak AC grid, thereby reducing the system’s stability margin.

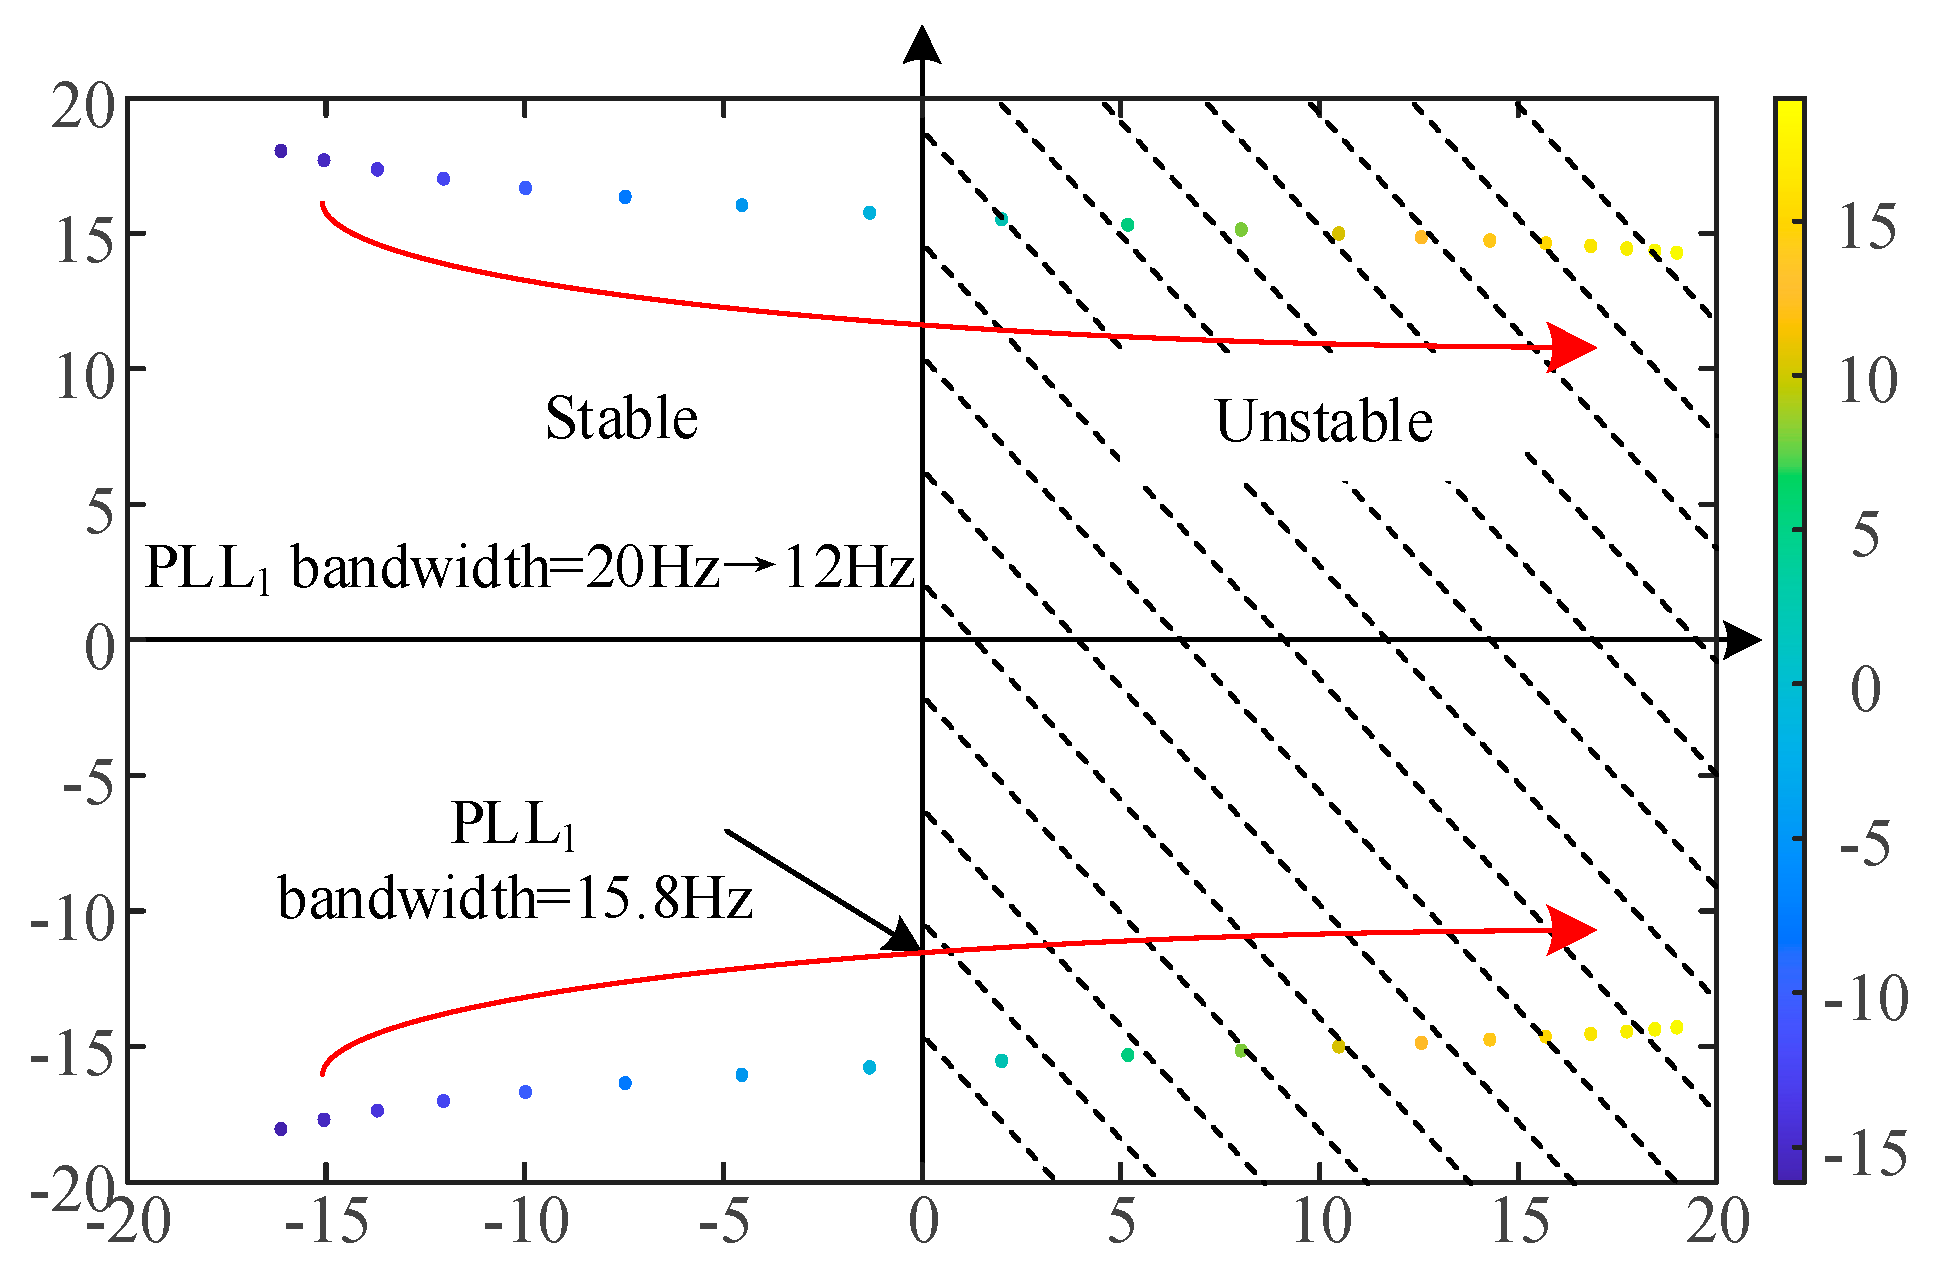
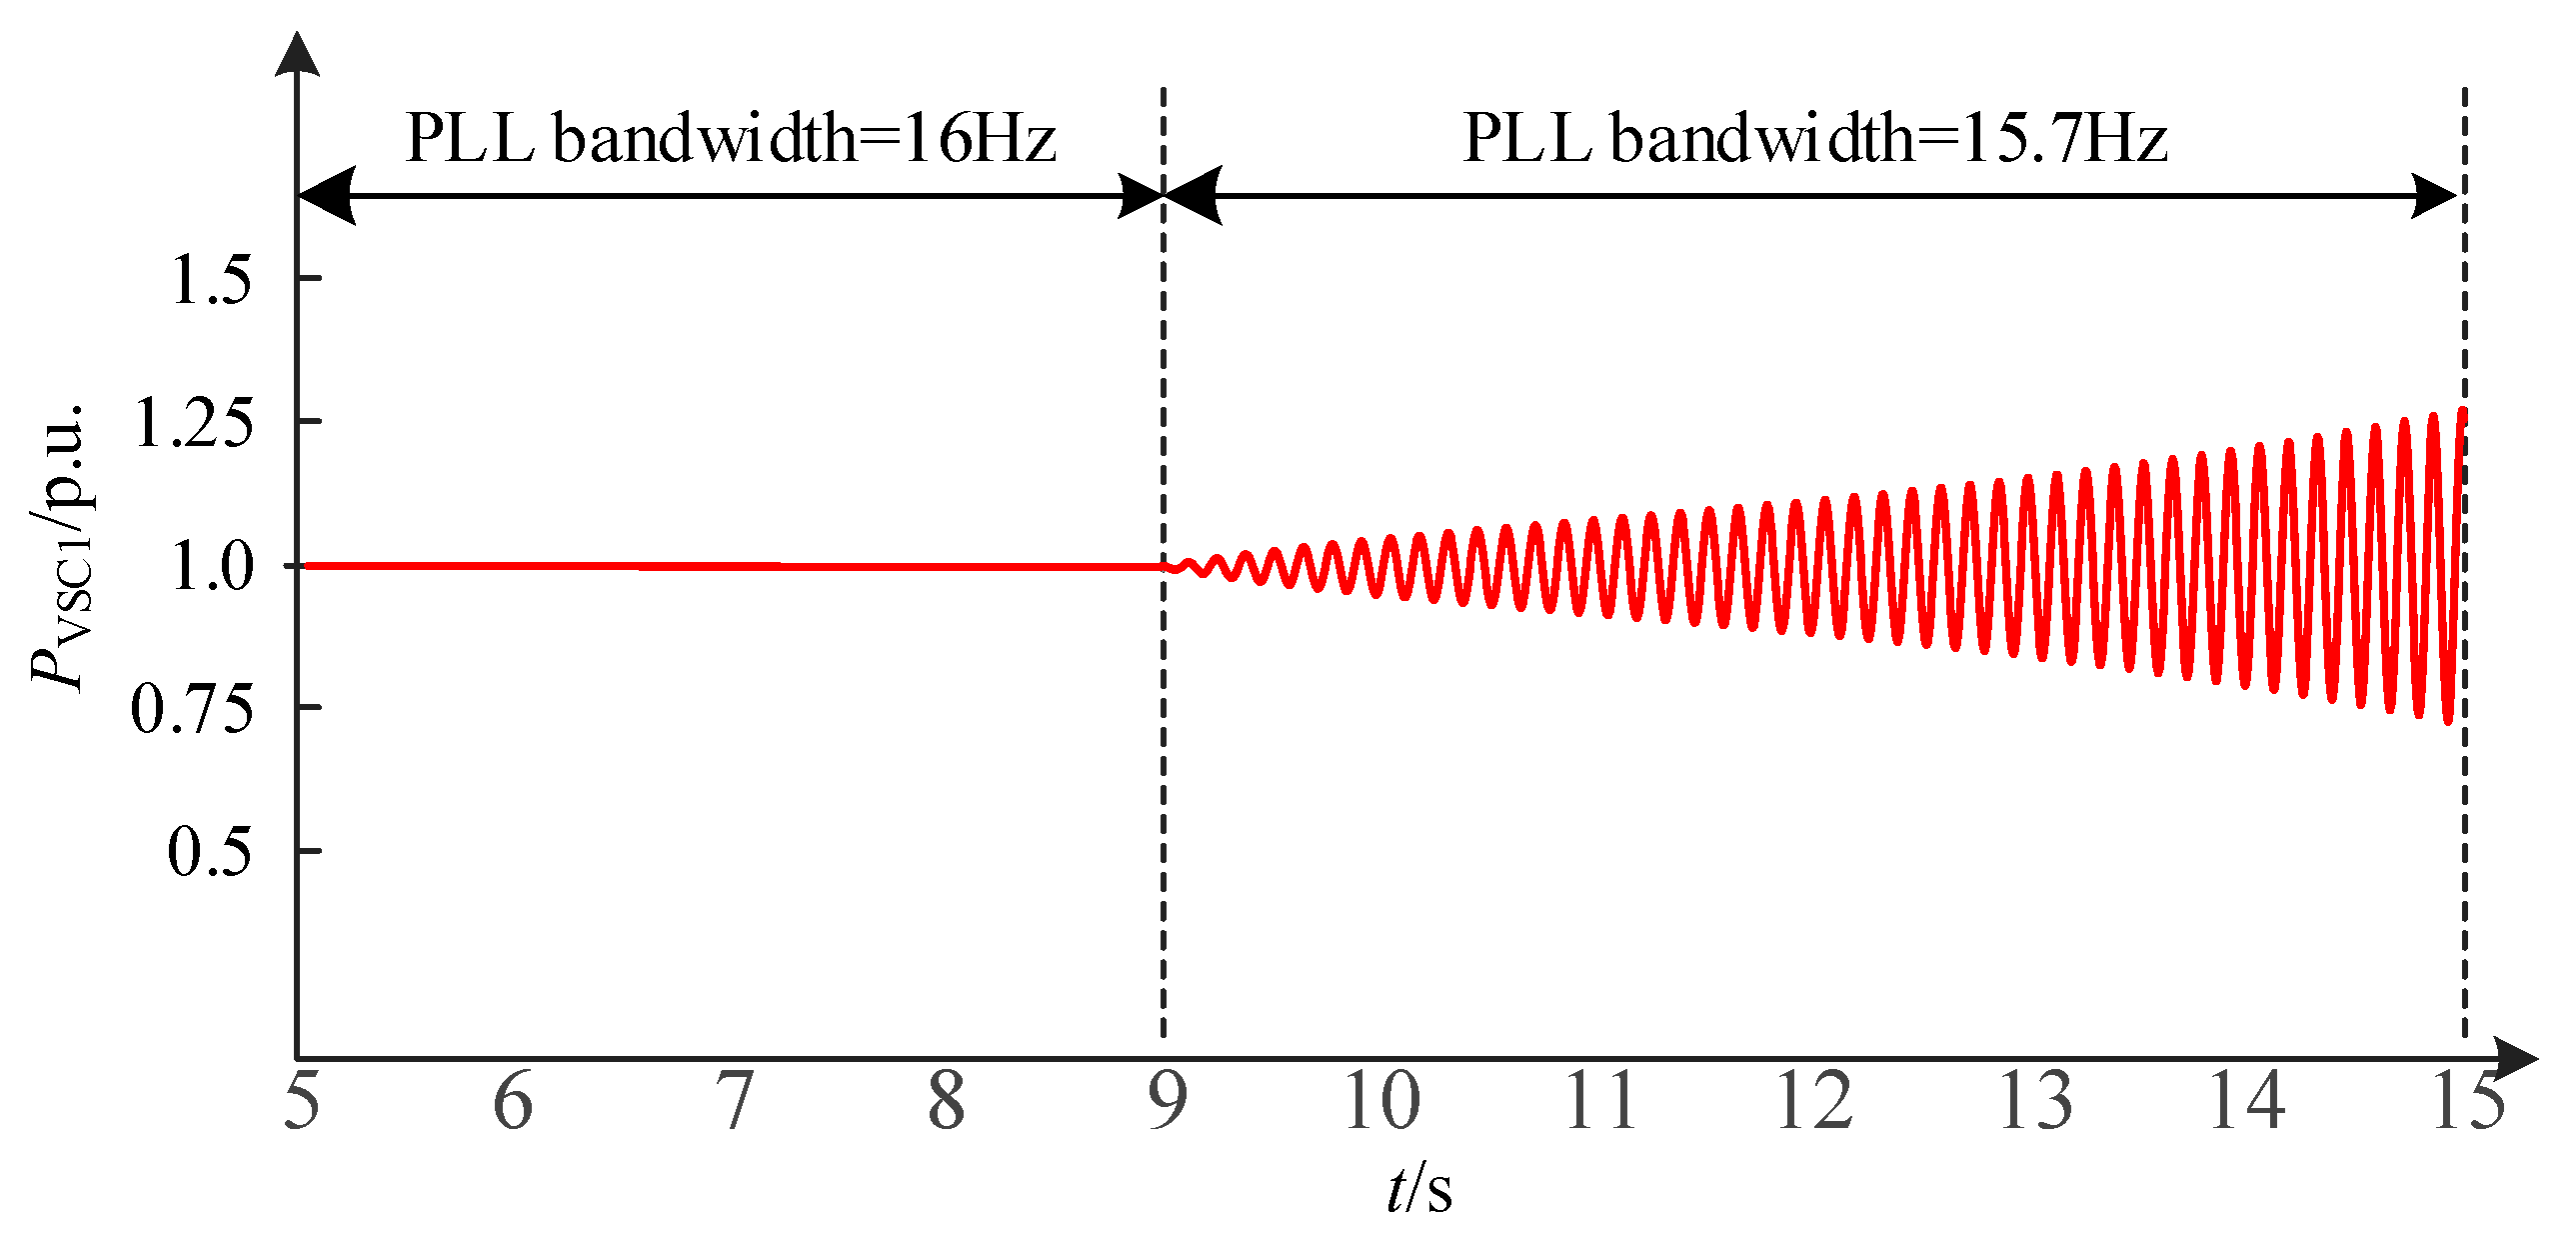
4.4. The Impact of PLL Bandwidth

As depicted in Figure 3, PLL also plays a role in the stability of the interconnected system. To further evaluate the impact of PLL bandwidths, the bandwidths of PLL1 were varied from 20 Hz to 12 Hz. The system’s root loci are depicted in Figure 11, with the color bars corresponding to the real axis of the dominant mode.
Figure 11 demonstrates that decrease in PLL bandwidths induce dominant modes to approach and cross the imaginary axis with a critical PLL bandwidth of 15.8 Hz, which may escalate the risk of small-signal instability. Therefore, it is recommended to set the PLL bandwidth at a larger value to ensure the stable operation of the dual-receiving-end VSC-HVDC system.

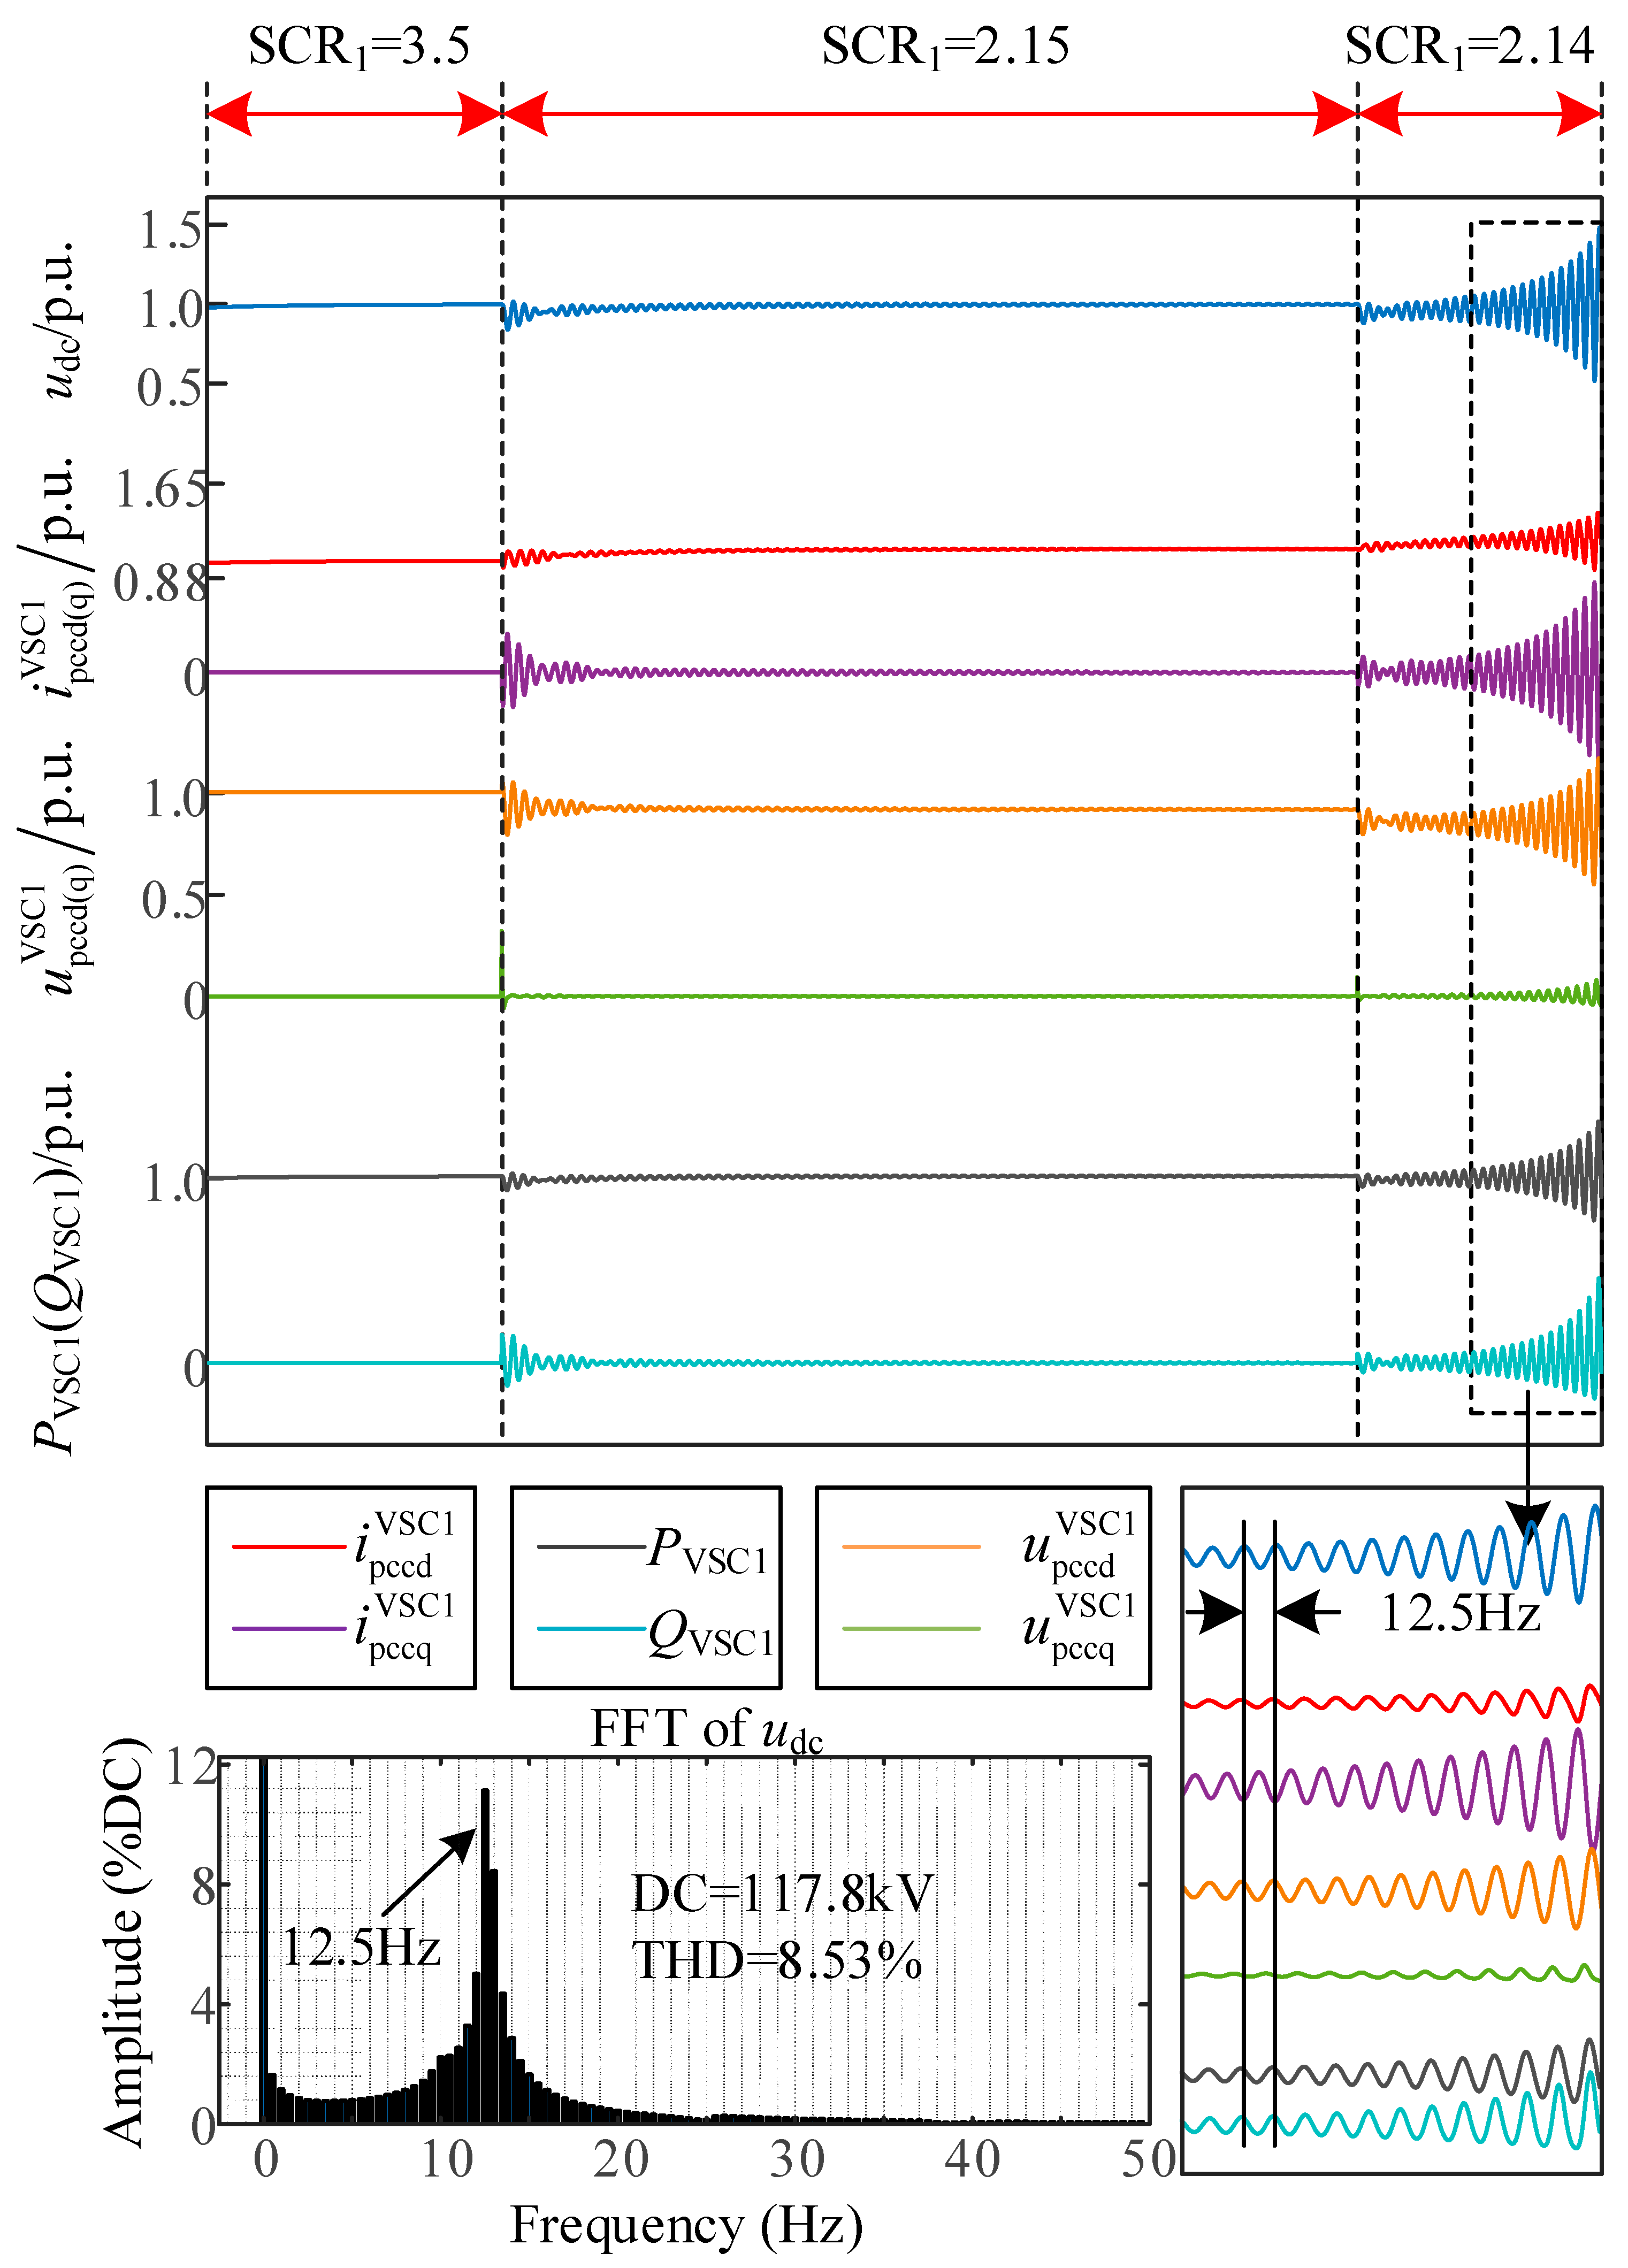
4.5. Simulation Verification

A dual-receiving-end VSC-HVDC system simulation model was established in MATLAB/Simulink. Initially, the system commenced operation with stable parameters (PVSCi = 1.0 p.u., SCRi= 3.5, tie line length = 50 km). Subsequently, while maintaining other parameters unchanged, SCR1 was sequentially switched to 2.15 and 2.14. The waveforms of udc, active and reactive power, PCC current, and PCC voltage of VSC1-HVDC were plotted, as presented in Figure 12. Although the system exhibited minor oscillations after SCR1 was switched to 2.15, the oscillations were rapidly suppressed as SCR1 and SCR2 were within the feasible region at that time, with all parameters converging well to steady-state values. After SCR1 was switched to 2.14, the system gradually became unstable, and the oscillations could not be suppressed. FFT (fast Fourier transform) analysis was performed on the udc waveforms during the oscillation process, revealing the presence of a 12.5 Hz oscillation component.
The verification results of point P for the feasible SCR region are illustrated in Figure 13. After the system was initiated under stable parameters (PVSCi = 1.0 p.u., SCR1 = 4.31, SCR2 = 2.5, tie line length = 66.67 km), while maintaining other parameters unchanged, PVSC2 was first set to −1.0 p.u. and SCR1 was then switched to 4.3. The results indicate that after the first parameter switching, SCR1 and SCR2 were within the feasible region, and the system smoothly entered the mutual-support power mode. After the second parameter switching, the system gradually became unstable, indicating that SCR1 and SCR2 were outside the feasible region at that time, thereby validating the effectiveness of the SCR feasible region constructed in Figure 9.
Figure 14 illustrates the verification results for the critical bandwidth value of PLL1. The system was initiated with a PLL1 bandwidth of 16 Hz, while maintaining all other parameters constant. Subsequently, the PLL1 bandwidth was adjusted to 15.7 Hz, at which point a gradual divergence in the active power waveform of VSC1 was observed. This observation indicates that the PLL1 bandwidth exceeded its critical value, thereby validating the effectiveness of the theoretical analysis.

5. Conclusions

In this paper, a small-signal model of dual-receiving-end VSC-HVDC system is described, incorporating comprehensive considerations of differential control strategies, bidirectional power flow dynamics, and grid topology configurations. By comparing its time-domain response with that of the MATLAB/Simulink R2023b electromagnetic transient model, the accuracy of the established model was verified. Eigenvalue and participation factor analyses were applied to evaluate the influence of control strategy, asymmetrical grid strength, power flow direction, and tie line on the system’s small-signal stability. The following conclusions are drawn:
  • Compared with the combined active/reactive power control strategy, DC voltage control strategy is more sensitive to changes in the power grid. Under conditions of the same rated power, it requires the configuration of a stronger AC system, and the state variable of DC voltage controller is the dominant factor causing this difference;
  • An increase in the tie line length leads to a decrease in the area of the feasible SCR region, a reduction in the system’s stability margin, and an increase in the risk of instability. Moreover, the critical length is jointly determined by the outer loop control strategy and the asymmetric configuration of power grid;
  • Compared with the combined active/reactive power control strategy, DC voltage control strategy exacerbates the influence of tie line length fluctuations on small-signal stability under weak grid conditions.

Author Contributions

Conceptualization, Z.B. and X.K.; methodology, Z.B.; software, K.Z.; validation, Z.B., X.K. and K.Z.; formal analysis, X.W.; investigation, Y.Y.; resources, Y.Y.; data curation, X.R.; writing—original draft preparation, K.Z.; writing—review and editing, X.R.; visualization, X.W.; supervision, X.K.; project administration, K.Z.; funding acquisition, Z.B. All authors have read and agreed to the published version of the manuscript.

Funding

This research was funded by Science and Technology Project of State Grid Jiangsu Electric Power Company of China (Grant No: J2023144).

Data Availability Statement

The original contributions presented in this study are included in the article. Further inquiries can be directed to the corresponding author.

Conflicts of Interest

Authors Zijun Bin, Xiangping Kong and Yubo Yuan are employed by (Electric Power Research Institute), State Grid Jiangsu Electric Power Co. Ltd.; Xuchao Ren is employed by State Grid Jiangsu Electric Power Co. Ltd. The remaining authors declare that the research was conducted in the absence of any commercial or financial relationships that could be construed as a potential conflict of interest.

Nomenclatures

Rgj, LgjResistances and inductances of AC system (j = 1, 2)
RTj, XTjLeakage resistance and Inductive inductance of transformer (j = 1, 2)
Rtie, LtieResistance and inductance of tie line
CdcDC link capacitor
u g VSC j ,   u pcc VSC j ,   u c VSC j Voltage of AC system, PCC and VSC AC port (j = 1, 2)
i g VSC j ,   i pcc VSC j ,   i tie VSC j Current of AC system, VSC AC port and tie line (j = 1, 2)
idcjDC current of VSCj-HVDC (j = 1, 2)
udcDC voltage
ilineCurrent of DC transmission line
xod1, xid1, xiq1State variables of controller for VSC1-HVDC
xod2, xod2, xid2, xiq2State variables of controller for VSC2-HVDC
ω0Rated angular frequency of AC system
x PLL VSC j , θ PLL VSC j State variables and output phase angles of PLL (j = 1, 2)

References

  1. Ayaka, N.; Mikimasa, I.; Yasunobu, Y.; Naoto, K. Proposal of Emergency Operation and Active Power Dispatch Control Scheme for Bipolar VSC-MTDC System. IEEE Access. 2025, 13, 31590–31602. [Google Scholar]
  2. Li, D.; Wang, Z.; Gao, B.; Han, J.; Deng, F.; Li, Z. Improved Median Mode Decomposition Based Fault Detection Method in VSC Interfaced DC System. IEEE Trans. Instrum. Meas. 2025, 74, 1–10. [Google Scholar] [CrossRef]
  3. Zeng, Z.; Jiang, Z.; Liu, S.; Zhong, J.; Yan, Y.; Xie, Y. Corrective Security-Constrained Optimal Power Flow Considering Dynamic Thermal Line Rating and Fast Control of Battery Storage and VSC-HVDC. J. Energy Storage 2024, 100, 113705. [Google Scholar] [CrossRef]
  4. Jiang, H.; Zhou, Y.; Gao, Y.; Gao, S. Droop Frequency Limit Control and Its Parameter Optimization in VSC-HVDC Interconnected Power Grids. Energies 2024, 17, 3851. [Google Scholar] [CrossRef]
  5. Abdelaziz, Y.N.; Mansour, M.; Aboushady, A.A.; Alsokhiry, F.; Ahmed, K.H.; Abdel-khalik, A.S.; Al-Turki, Y. New Analysis of VSC-based Modular Multilevel DC-DC Converter with Low Interfacing Inductor for Hybrid LCC/VSC HVDC Network Interconnections. Alex. Eng. J. 2024, 95, 82–93. [Google Scholar] [CrossRef]
  6. Wu, X.; Yang, H.; Zheng, C.; Zou, Z. Model-Free Adaptive Control for Mitigation of SSO in PMSG Based Wind Farms with VSC-HVDC. IEEE Trans. Power Electron. 2025, 40, 3684–3696. [Google Scholar] [CrossRef]
  7. Xiang, F.; Liao, S.; Zhang, H.; Luo, L. Sub-synchronous Oscillation Phenomenon Analysis of Grid-connected Direct Drive-Doubly Fed Hybrid Wind Farms Via VSC-HVDC System. IEEE Access 2025, 13, 37966–37978. [Google Scholar] [CrossRef]
  8. Lu, X.; Wang, X.; Lin, W.; Wen, J. Comparative Study of Small-Signal Stability under Weak AC System Integration for Different VSCs. IEEE J. Emerg. Sel. Top. Power Electron. 2021, 9, 4482–4499. [Google Scholar] [CrossRef]
  9. Givaki, K.; Chen, D.; Xu, L. Current Error Based Compensations for VSC Current Control in Weak Grids for Wind Farm Applications. IEEE Trans. Sustain. Energy 2019, 10, 26–35. [Google Scholar] [CrossRef]
  10. Bakeer, A.; Chub, A.; Abid, A.; Zaid, S.A.; Alghamdi, T.A.H.; Salama, H.S. Enhancing Grid-Forming Converters Control in Hybrid AC/DC Microgrids Using Bidirectional Virtual Inertia Support. Processes 2024, 12, 139. [Google Scholar] [CrossRef]
  11. Guo, C.; Yang, S.; Liu, W.; Zhao, C.; Hu, J. Small-Signal Stability Enhancement Approach for VSC-HVDC System Under Weak AC Grid Conditions Based on Single-Input Single-Output Transfer Function Model. IEEE Trans. Power Del. 2021, 36, 1313–1323. [Google Scholar] [CrossRef]
  12. Morris, J.F.; Ahmed, K.H.; Alvarez, A.E. Analysis of Controller Bandwidth Interactions for Vector-Controlled VSC Connected to Very Weak AC Grids. IEEE J. Emerg. Sel. Top. Power Electron. 2020, 9, 7343–7354. [Google Scholar] [CrossRef]
  13. Gao, S.; Zhao, H.; Gui, Y.; Luo, J.; Blaabjerg, F. Impedance Analysis of Voltage Source Converter Using Direct Power Control. IEEE Trans. Energy Convers. 2021, 36, 831–840. [Google Scholar] [CrossRef]
  14. Zhang, Q.; McCalley, J.D.; Ajjarapu, V.; Renedo, J.; Elizondo, M.A.; Tbaileh, A.; Mohan, N. Primary Frequency Support Through North American Continental HVDC Interconnections with VSC-MTDC Systems. IEEE Trans. Power Syst. 2021, 36, 806–817. [Google Scholar] [CrossRef]
  15. Zhu, J.; Li, S.; Yu, L.; Bu, S.; Li, Y.; Wang, Y.; Deng, Z.; Liu, D.; Jia, H.; Wang, C. Coherence Analysis of System Characteristics and Control Parameters for Hybrid HVDC Transmission Systems Based on Small-Signal Modeling. IEEE J. Emerg. Sel. Top. Power Electron. 2020, 9, 7436–7446. [Google Scholar] [CrossRef]
  16. Guo, C.; Cui, P.; Zhao, C. Optimization and Configuration of Control Parameters to Enhance Small-signal Stability of Hybrid LCC-MMC HVDC System. J. Mod. Power Syst. Clean. Energy 2022, 10, 213–221. [Google Scholar] [CrossRef]
  17. Fu, Q.; Du, W.; Wang, H.; Ren, B.; Xiao, X. Small-Signal Stability Analysis of a VSC-MTDC System for Investigating DC Voltage Oscillation. IEEE Trans. Power Syst. 2021, 36, 5081–5091. [Google Scholar] [CrossRef]
  18. Pang, Y.; Egea-Alvarez, A.; Gonzalez-Torres, J.C.; Shinoda, K.; Perez, F.; Benchaib, A. DC Voltage Stability Analysis and Enhancement for Grid-Forming-Based MTDC Systems. IEEE Trans. Power Electron. 2024, 39, 12113–12117. [Google Scholar] [CrossRef]
  19. Zhou, Y.; Zhao, L.; Lee, W.-J. Robustness analysis of dynamic equivalent model of DFIG wind farm for stability study. In Proceedings of the 2018 IEEE/IAS 54th Industrial and Commercial Power Systems Technical Conference, Niagara Falls, ON, Canada, 7–10 May 2018. [Google Scholar]
  20. Ali, M.; Ilie, I.-S.; Milanovic, J.V.; Chicco, G. Wind farm model aggregation using probabilistic clustering. IEEE Trans. Power Syst. 2013, 28, 309–316. [Google Scholar] [CrossRef]
  21. Huang, L.; Xin, H.; Li, Z.; Ju, P.; Yuan, H.; Wang, G. Identification of generalized short-circuit ratio for on-line stability monitoring of wind farms. IEEE Trans. Power Syst. 2020, 35, 3282–3285. [Google Scholar] [CrossRef]
  22. Zhou, Y.; Zhao, L.; Lee, W.J. Robustness Analysis of Dynamic Equivalent Model of DFIG Wind Farm for Stability Study. IEEE Trans. Ind. Appl. 2018, 54, 5682–5690. [Google Scholar] [CrossRef]
  23. Dong, W.; Xin, H.; Wu, D.; Huang, L. Small Signal Stability Analysis of Multi-Infeed Power Electronic Systems Based on Grid Strength Assessment. IEEE Trans. Power Syst. 2019, 34, 1393–1403. [Google Scholar] [CrossRef]
  24. Meng, P.; Xiang, W.; Chi, Y.; Wang, Z.; Lin, W.; Wen, J. Resilient DC Voltage Control for Islanded Wind Farms Integration Using Cascaded Hybrid HVDC System. IEEE Trans. Power Syst. 2022, 37, 1054–1066. [Google Scholar] [CrossRef]
  25. Zhao, L.; Jin, Z.; Wang, X. Analysis and Damping of Low-Frequency Oscillation for DC-Link Voltage-Synchronized VSCs. IEEE Trans. Power Electron. 2023, 38, 8177–8189. [Google Scholar] [CrossRef]
  26. Chen, L.; Zhang, X.; Shi, Y.; Qi, L. A Novel Mixture-Devices-Based Submodule for MMC by Using Low on-State Voltage IGCT and High di/dt Ability IGBT. IEEE Trans. Ind. Electron. 2024, 71, 2375–2384. [Google Scholar] [CrossRef]
  27. Guo, Y.; Gao, H.; Wu, Q.; Zhao, H.; Østergaard, J.; Shahidehpour, M. Enhanced Voltage Control of VSC-HVDC-Connected Offshore Wind Farms Based on Model Predictive Control. IEEE Trans. Sustain. Energy 2017, 9, 474–487. [Google Scholar] [CrossRef]
  28. Fu, X.; Huang, M.; Pan, S.; Zha, X. Cascading Synchronization Instability in Multi-VSC Grid-Connected System. IEEE Trans. Power Electron. 2022, 37, 7572–7576. [Google Scholar] [CrossRef]
  29. Sun, P.; Yao, J.; Zhao, Y.; Fang, X.; Cao, J. Stability Assessment and Damping Optimization Control of Multiple Grid-connected Virtual Synchronous Generators. IEEE Trans. Energy Convers. 2021, 36, 3555–3567. [Google Scholar] [CrossRef]
  30. Xiao, H.; Li, Y. Multi-Infeed Voltage Interaction Factor: A Unified Measure of Inter-Inverter Interactions in Hybrid Multi-Infeed HVDC Systems. IEEE Trans. Power Del. 2019, 35, 2040–2048. [Google Scholar] [CrossRef]
  31. Kim, Y.K.; Lee, G.S.; Kim, C.K.; Moon, S.I. An Improved AC System Strength Measure for Evaluation of Power Stability and Temporary Overvoltage in Hybrid Multi-Infeed HVDC Systems. IEEE Trans. Power Del. 2022, 37, 638–649. [Google Scholar] [CrossRef]
  32. Xiao, H.; Li, Y.; Shi, D.; Chen, J.; Duan, X. Evaluation of Strength Measure for Static Voltage Stability Analysis of Hybrid Multi-Infeed DC Systems. IEEE Trans. Power Del. 2019, 34, 879–890. [Google Scholar] [CrossRef]
Figure 1. Main circuit of the dual-receiving-end VSC-HVDC system.
Electronics 14 02178 g001
Figure 2. The controller of the dual-receiving-end VSC-HVDC system.
Electronics 14 02178 g002
Figure 3. The small-signal model of the dual-receiving-end VSC-HVDC system.
Electronics 14 02178 g003
Figure 4. Comparison of dynamic responses. (a) i pccx VSC 1 ; (b) i pccx VSC 2 ; (c) PVSC2; (d) udc.
Electronics 14 02178 g004aElectronics 14 02178 g004b
Figure 5. Root loci of system under different SCR conditions: (a) Case 1; (b) Case 2; (c) Case 3.
Electronics 14 02178 g005aElectronics 14 02178 g005b
Figure 6. The feasible SCR region (tie line length = 50 km, PVSC2 = 1.0 p.u.).
Electronics 14 02178 g006
Figure 7. Root loci of system with different tie line lengths under different SCR configurations: (a) Case 4; (b) Case 5; (c) Case 6.
Electronics 14 02178 g007aElectronics 14 02178 g007b
Figure 8. SCR feasible region under different tie line lengths (P2 = 1.0 p.u.).
Electronics 14 02178 g008
Figure 9. Feasible SCR region subject to combined power–topology constraints.
Electronics 14 02178 g009
Figure 10. Distribution of participation factors in different directions of VSC2 power flow (tie line length = 50 km).
Electronics 14 02178 g010
Figure 11. Root loci of system with different bandwidth of PLL1.
Electronics 14 02178 g011
Figure 12. Verification results for point A in the feasible SCR region.
Electronics 14 02178 g012
Figure 13. Verification results for point P in the feasible SCR region.
Electronics 14 02178 g013
Figure 14. Verification results for critical bandwidth of PLL1.
Electronics 14 02178 g014
Table 1. Parameters of main circuit.
ParametersValues
VSC1-HVDC subsystemRated DC voltage udc400 kV
Voltage of AC system u g VSC 1 525 kV
SCR3.5
Rated active power1000 MW
Transformer leakage impedance LT1/RT10.20 p.u./0.20 p.u.
VSC2-HVDC subsystemVoltage of AC system u g VSC 2 510.089 kV
SCR3.5
Rated DC voltage udc400 kV
Rated active power1000 MW
Transformer leakage impedance LT2/RT20.20 p.u./0.20 p.u.
Tie lineTie line length50 km
Tie line resistance Rtie28 mΩ/km
Tie line inductance Ltie12.9 mH/km
Table 2. Parameters of main controller.
ParametersValues
PLL bandwidth of VSC1-HVDC20 Hz
PLL bandwidth of VSC2-HVDC20 Hz
DVC parameters of VSC1-HVDC kpv/kiv5 × 10−7/0.1
PQC parameters of VSC2-HVDC kpac/kiac7 × 10−6/7 × 10−5
VCC parameters of VSC1-HVDC k pi VSC 1 / k ii VSC 1 1.0/330
VCC parameters of VSC2-HVDC k pi VSC 2 / k ii VSC 2 0.5/300
Disclaimer/Publisher’s Note: The statements, opinions and data contained in all publications are solely those of the individual author(s) and contributor(s) and not of MDPI and/or the editor(s). MDPI and/or the editor(s) disclaim responsibility for any injury to people or property resulting from any ideas, methods, instructions or products referred to in the content.

