1. Introduction
With the rapid development of the internet, network measurement is indispensable to ensure network reliability [
1,
2,
3,
4,
5,
6,
7]. It provides an abundance of traffic data for numerous network functions such as traffic engineering [
8,
9,
10], capacity planning [
11], anomaly detection, load balancing, quality of service [
5,
12,
13], and congestion control [
14]. The realization of these network functions depends on many network measurement tasks, among which flow size measurement is a basic and significant measurement task [
15,
16,
17,
18]. Flows can be created from network packets based on several fields of the packet header, i.e., the flow ID; these fields include the source IP or the five-tuple (source IP, source port, destination IP, destination port, and protocol). In network measurement, there are two important tasks. One is flow size estimation, that is, estimating the number of packets per flow. Another is detecting heavy hitters (i.e., the flows that have a number of packets exceeding a certain percentage of the total number of packets) [
19,
20]. The key to this task is to recover the flow ID of the abnormal flows. With this task, many causes of network anomalies can be identified, such as distributed denial-of-service (DDoS) [
21], worms [
22], and port scanning [
23].
However, the current network measurement faces two main challenges. The first is limited processing time and memory, caused by the high-speed forwarding capabilities of network equipment [
12,
24,
25,
26]. High-speed network traffic is typically handled by on-chip SRAM or TCAM. Whereas, the storage capacity of network devices is extremely limited [
22,
27], making it impossible to accurately record every packet. The second challenge is skewed network traffic, where a few flows (i.e., elephant flows) have large sizes, while most flows (i.e., mouse flows) only have small sizes [
15,
28]. In this scenario, it is necessary to use large counters, such as the 32-bit counter, to capture elephant flows. However, for mouse flows, filling these counters is not feasible, resulting in memory waste.
To tackle these challenges, sketches—types of probabilistic data structures—have emerged as one of the most promising solutions for network measurement in recent years, as they can greatly optimize speed and memory usage at the cost of a small error [
24,
29,
30]. The current sketch-based schemes can be divided into two categories. The first category of sketches adopts unified big counters, ignoring the skewness of the flow size distribution. These sketches trade algorithmic complexity for high memory usage. Typical sketches include the Count-Min (CM) sketch [
31], Conservative Update (CU) sketch [
32], and Count Sketch (CS) [
33]. The second category seeks to alleviate the problem of memory wastage by separating elephant and mouse flows. For example, Elastic Sketch [
4] uses voting to separate elephant flows from mouse flows. Diamond Sketch [
16] stores the overflowed parts of an elephant flow in a higher layer. TowerCU sketch [
6] uses differently sized counters to automatically distinguish between mouse and elephant flows. Although these schemes have significantly improved the accuracy of sketches, they still exhibit at least one of the following disadvantages:
Firstly, the lack of a flow ID makes it difficult to catch abnormal flows like heavy hitters.
Secondly, the accuracy is unstable with the change in network traffic skewness.
Thirdly, an increase in accuracy is typically accompanied by a rise in algorithmic complexity, which in turn leads to a decrease in throughput. A comparison of CM, CU, and Elastic Sketch is presented in
Table 1.
Therefore, an effective network measuring scheme should have the following abilities: (1) recall the elephant flow actively; (2) keep high accuracy under traffic loads with multiple skewnesses; (3) maintain both high insert throughput and query throughput. To this end, Air Sketch (AS), which contains three-level substructures, is proposed. AS treats flow as air; as the flow grows larger, it floats up and is recorded in higher substructures. The three-level substructure distinguishes elephant flows from mouse flows, significantly improving the overall accuracy of AS. To further improve the accuracy of detecting elephant flows, AS uses a deterministic replacement strategy [
5] to update the recorded elephant flows. Furthermore, this paper proposes an asymmetric insert and query algorithm (AIQ) with a global hash to improve both insert throughput and query throughput. Unlike SIMD, it cannot accelerate flows whose flow IDs are defined as 104-bit five-tuples [
34,
35], since the operands for SIMD instructions are integer powers of 2. AIQ achieves acceleration through a carefully designed algorithm, thereby broadening the scope of AS application scenarios. Our main contributions are as follows:
A novel sketch called Air Sketch is designed. It models flows as air, where elephant and mouse flows are accurately separated as the air rises. Therefore, the measurement accuracy of Air Sketch is significantly improved.
The AIQ algorithm is proposed. AIQ utilizes the skewed distribution characteristics of the data stream to simultaneously improve insertion throughput and query throughput without SIMD. Meanwhile, the global hash is used to further improve the throughput of Air Sketch.
The performance of AS is evaluated on CAIDA datasets, synthetic datasets, and webpage datasets. Meanwhile, the feasibility of implementing Air Sketch on the FPGA is also verified. Experimental results show that AS not only achieves high and stable accuracy but also maintains high insertion throughput and query throughput compared to the state-of-the-art schemes.
The remainder of this paper is organized as follows.
Section 2 classifies and summarizes the current sketch schemes.
Section 3 first describes the architecture and algorithm of AS in detail, and then analyzes its error bounds.
Section 4 provides the experimental results and extensive analysis of AS. Finally,
Section 5 presents our conclusion.
2. Related Work
This section divides the current sketch schemes into four categories—classic sketch, CM variant, hierarchical counter-sharing, and hybrid structure—all according to the different structures.
2.1. Classic Sketch
The concept of a sketch was first presented in 1978 [
36] as a method to obtain precise measurement results while working with memory constraints. After that, some classic sketch schemes have been proposed, such as CM [
31], CU [
32], and Count Sketch [
33].
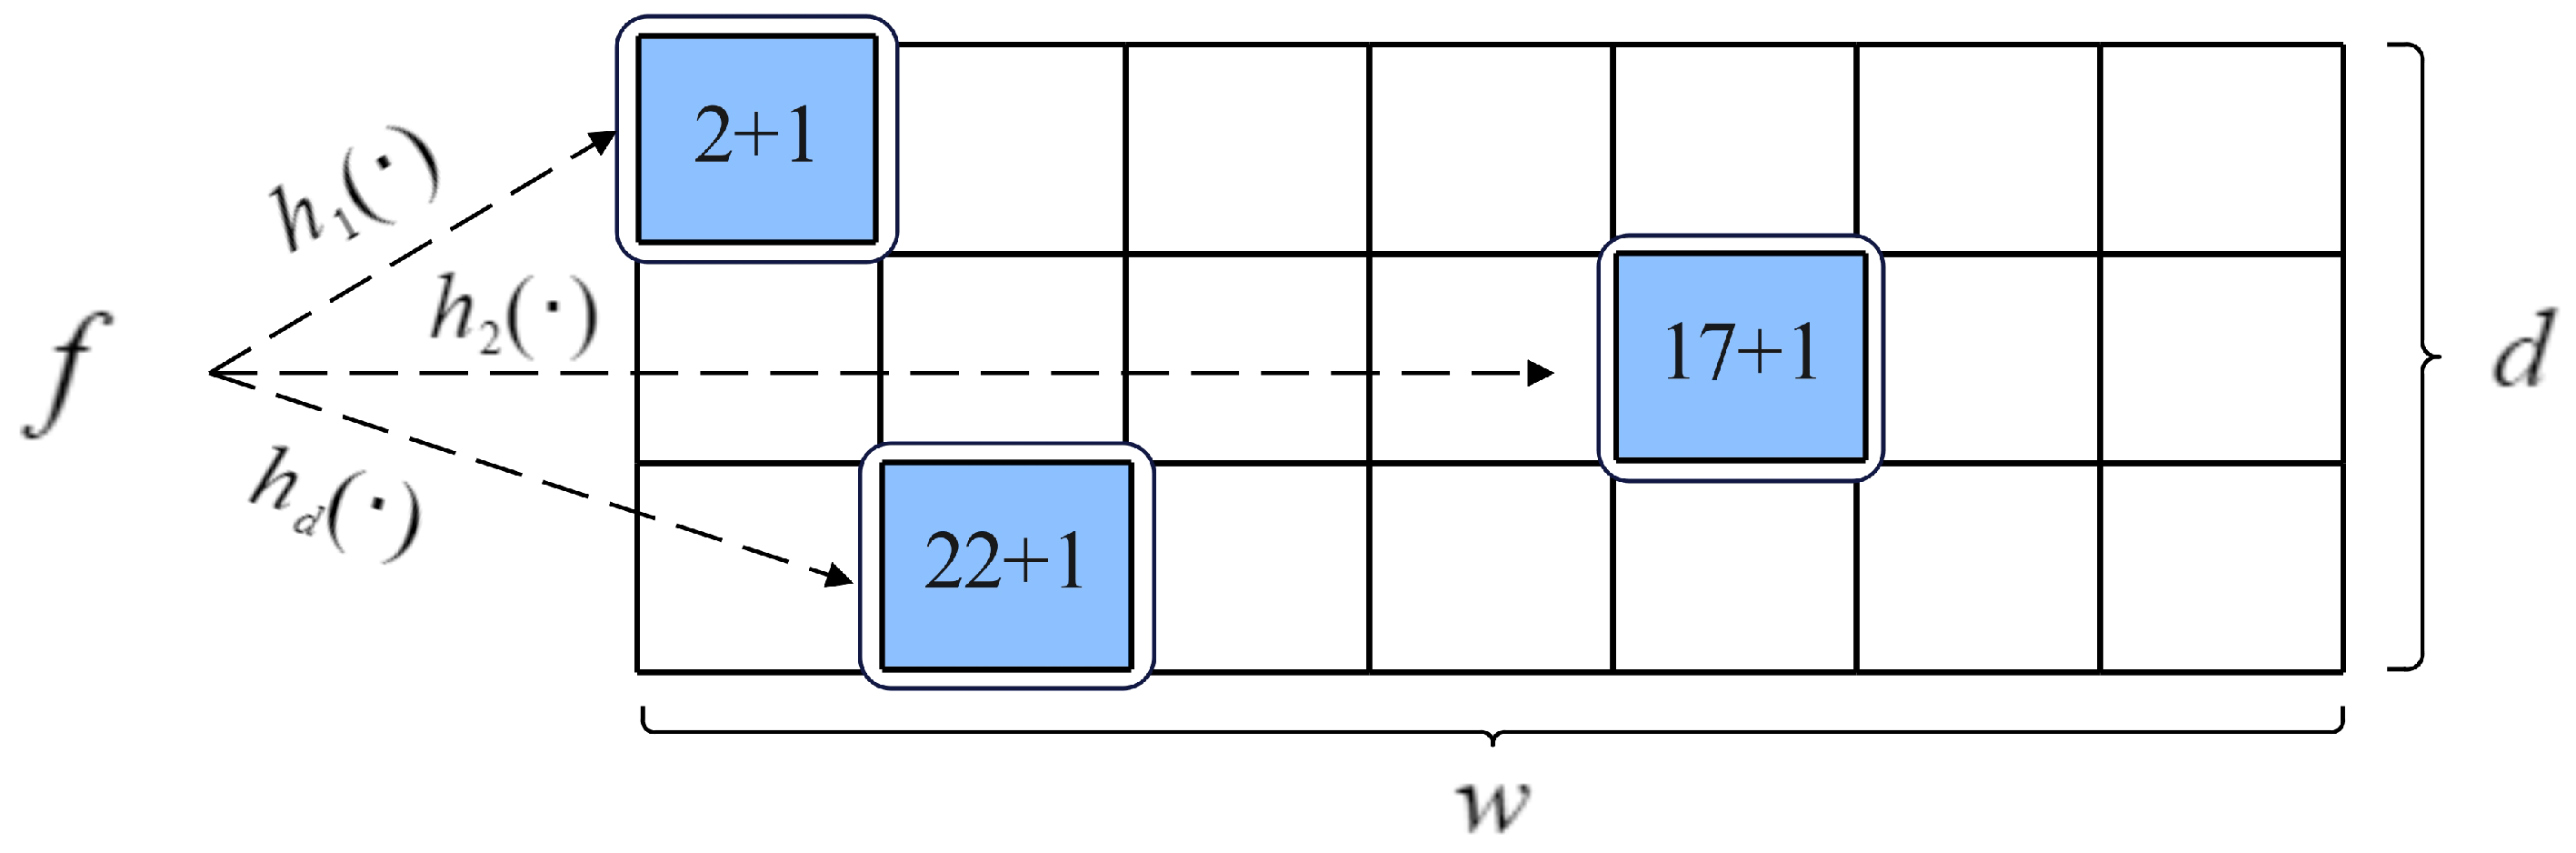
A classic sketch is composed of a two-dimensional array with
d rows and
w columns. Take the CM sketch as an example, the structure of it is shown in
Figure 1. In CM, each row is assigned a hash function, and they are independent of each other. Each counter has the same size, often 32 bits. All counters are shared by the elephant and mouse flows. Both insert and query operations are supported. According to the packet count or byte count, CM hashes the input packet to the corresponding counter for each row and then increases those counters by 1 or the packet size. When queried, the
d hash functions find the counters on each row, and the minimum counter value is used as an estimate of flow size for a given flow. Unlike CM, CU only updates the minimum counter among multiple counters, applying a conservative update strategy during insertion. Thanks to the conservative update strategy, the overestimation error caused by hash collisions is reduced. Count Sketch employs an extra symbol hash function to determine the sign of the modified value. Finally, it returns the median of multiple counters as the query value. A classic sketch achieves high throughput due to its simple operations.
However, it cannot separate elephant flows from mouse flows, resulting in poor accuracy. In addition, it cannot actively detect elephant flows due to the lack of a flow ID.
2.2. CM Variant
The CM variant was proposed to adapt to the highly skewed distribution of network traffic. The characteristic of this type of structure is that counters are not of a single size, and all counters are shared by the elephant and mouse flows, such as Tower Sketch [
6] and CL-MU [
34]. Like CM, the Tower Sketch is also a two-dimensional array, with the exception that its counters vary in size, e.g., 2-bit, 4-bit, 8-bit, 16-bit, and 32-bit counters, respectively. These counters can be used to cleverly separate elephant flows from mouse flows. Specifically, an elephant flow always overflows in the corresponding small counters at the lower layers and is automatically recorded in the large counter of an upper layer. Under the same memory condition, there are fewer upper-layer counters due to their larger sizes. Therefore, a mouse flow is more likely to experience a hash collision in an upper layer than in a lower one. And the mouse flow can be regarded as being recorded in a lower layer under the condition that the minimum value is returned. The CM variant achieves high memory utilization due to counters of multiple sizes.
However, the interference from mouse flows has not yet been alleviated for elephant flows. Meanwhile, the CM variant also does not record flow IDs and, hence, cannot complete certain measurement tasks in an active way, such as heavy hitter detection.
2.3. Hierarchical Counter-Sharing
Another way to improve the memory utilization of a sketch is to allocate the number of counters based on the size of the flow. A variety of sketch schemes based on hierarchical counter-sharing have been proposed, such as Bloom Sketch [
15], Diamond Sketch [
16], Pyramid Sketch [
24], CBFSketch [
37], and OEBSA-Sketch [
38]. The structure of this type of sketch scheme is characterized by fixed-size counters, such as small 4-bit counters. Elephant flows are assigned to more counters due to overflow, while fewer counters are assigned to mouse flows. Diamond Sketch consists of three parts, that is, an increment part (I), a deletion part (D), and a carry part (C). Part C is a counting Bloom filter (CBF) [
39] that is responsible for recording the overflow depth of a flow; part I contains multiple layers for recording flows of different sizes; and part D is used to support the delete operation. Bloom Sketch is composed of many atomic sketches, such as CM or CU. Except for the atomic sketch, all other atomic sketches are assigned a Bloom filter. Like the CBF in Diamond Sketch, when a flow overflows from the atomic sketch, the associated Bloom filter will be updated. CBFSketch and OEBSA-Sketch both use CBF to record overflow depth. Pyramid Sketch determines whether there is an overflow from the left or right child counter by setting two flag bits in the parent counter. The above schemes improve memory utilization and accuracy by storing elephant flows with more counters rather than larger ones.
However, the insertion throughput and query throughput are reduced because flows are scattered and stored in multiple atomic sketches. At the same time, sketches based on hierarchical counter-sharing also fail to detect elephant flows due to the absence of a flow ID.
2.4. Hybrid Structure
To record the flow IDs of elephant flows without discarding mouse flows, hybrid structures have been proposed, such as Elastic Sketch [
4], DAP [
5], cold filter [
40], Prop-CS [
41], Bubble Sketch [
42], and ActiveGuardian [
43]. A key structural characteristic of these schemes is that their counters are not of a single size, and the allocation of counters is not fair. The counters, in large and small parts, are used to record elephant flows and mouse flows, respectively. The counter of the L part is 32 bits, which is larger than the counter of the S part. Elastic Sketch is a typical hybrid structure. Its large part is composed of a hash table of buckets. Each bucket is used to record several flows. The small part is a CM sketch, which is used to record mouse flows as well as flows kicked out of the hash table. However, the replacement of Elastic Sketch for elephant flows may fail. To overcome this problem, DAP proposes a deterministic admission policy that consists of a hash table and a sketch. The replace operation is triggered only if the ratio of a flow’s measured value in the sketch to the value of the corresponding minimum flow in the hash table exceeds
k, that is, the replacement threshold. Prob-CS combines probabilistic counting with Cuckoo hashing to achieve high-precision traffic measurement by dynamically adjusting hash collisions while maintaining compact memory usage. Bubble Sketch employs a bubble-up ranking mechanism to efficiently track the top-k items in streams, prioritizing memory efficiency through hierarchical filtering and adaptive promotion of frequent elements. ActiveGuardian combines adaptive sampling and lightweight flow tracking to accurately identify high-volume elephant flows in real-time network traffic. Thanks to the recording of flow IDs, hybrid schemes can complete more measurement tasks.
However, due to the highly skewed nature of network traffic, inserting packets into the larger part first can improve insertion throughput but may be less efficient for query throughput. Conversely, inserting the smaller part first may have the opposite effect. Therefore, improving both the insertion throughput and query throughput for a hybrid scheme without SIMD can be challenging.
2.5. Summary
A classic sketch has high throughput due to simple operations. The CM variant and the sketch based on hierarchical counter-sharing improve the accuracy of the flow measurement by reducing counter memory waste. However, the accuracy of the classic sketch is insufficient because there is no distinction between elephant and mouse flows. The CM variant is insufficiently accurate to measure elephant flows because it does not mitigate the interference of mouse flows on elephant flows. The sketch based on hierarchical counter-sharing has low throughput due to the complex operation. Meanwhile, the above three types of schemes cannot detect elephant flows due to the lack of flow IDs. As for the hybrid structure, although it has high accuracy and can actively detect elephant flows, it often has low insertion throughput or query throughput due to skewed traffic distribution. In conclusion, there is currently no scheme that can simultaneously satisfy the three goals mentioned in
Section 1. According to this, AS is proposed; it not only accurately detects elephant flows but also maintains high accuracy under different traffic loads and achieves high insertion and query throughput without relying on SIMD.
3. Air Sketch Design
In this section, the architecture of AS and the AIQ algorithm are introduced in detail. Subsequently, the error bound of AS is analyzed.
3.1. Air Sketch Architecture
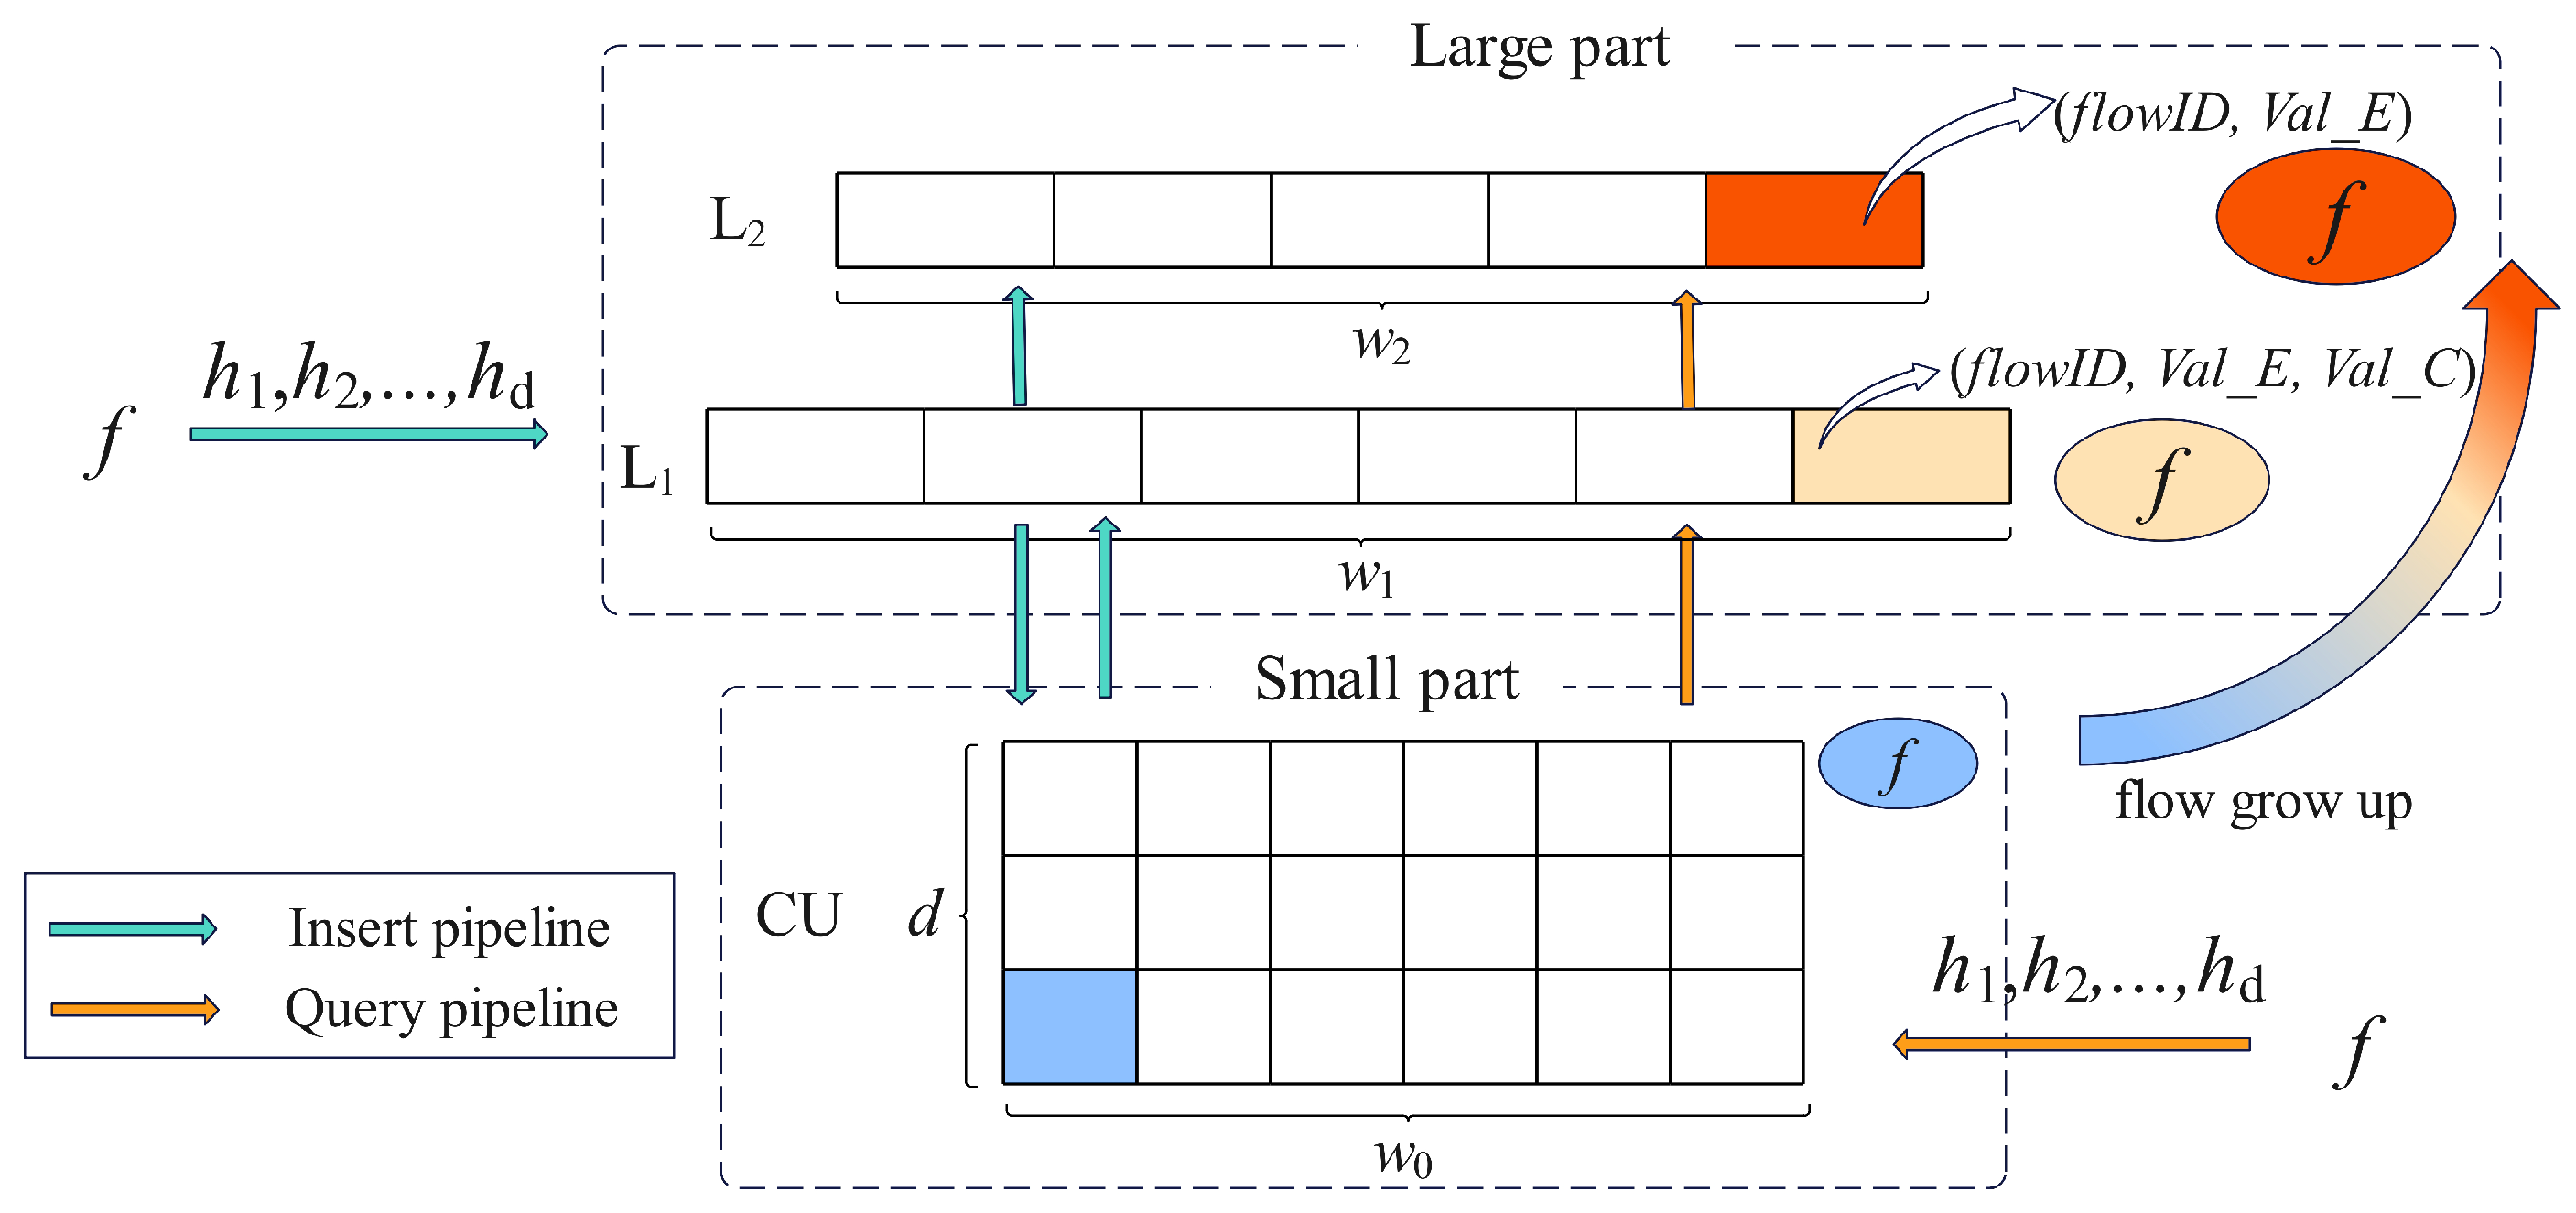
Air Sketch is a hybrid structure made up of a large part (L) and a small part (S).
As shown in
Figure 2, the large part contains two hash tables, L
1 and L
2, where L
1 is used to record the elephant flows and their candidates, and L
2 only records the elephant flows. Let
and
denote the
i-th bucket and
j-th bucket in L
1 and L
2, respectively. Each bucket
consists of two fields, that is, (1)
, which tracks the flow ID of the current heavy flow in the bucket; and (2)
, which counts the number of packets belonging to the
in the bucket. Slightly different from
,
adds an extra field,
, which records the elephant flow candidates. To further improve memory efficiency,
bits are allocated to both
and
in each
, and
bits are allocated to
in each
, where
.
The small part is a CU sketch, which is responsible for recording mouse flows as well as picking out elephant flows. The size of each counter in CU is set to bits, where . The maximum values of the counters in CU, L1, and L2 are represented by , , and , respectively. L1, L2, and CU are in charge of capturing flows of different sizes, allowing them to share the hash functions. As a result, AS uses global hash functions, which are , , , etc. This means that the hash calculation results from L1, or the small part, can be used directly by the other parts. Shared hash functions reduce the number of hash calculations to improve throughput.
3.2. Asymmetric Insert and Query Algorithm
As mentioned in
Section 2.4, it is difficult to improve both the insert and query throughput in a hybrid structure without SIMD. To solve this problem, an asymmetric algorithm called AIQ is proposed. In AIQ, the order of accessing each substructure is different when inserting and querying.
3.2.1. Insert Operation
The L and S parts are first cleared during initialization at the beginning of the insertion. All incoming packets first access L1 through hash calculation, then CU and L2 are accessed depending on the counter overflow and flow ID matching. Here, the case where the counter reaches its maximum value is used as an overflow flag. Specifically, flow ID f is extracted from a packet during the first hash operation, . The hash attempt is terminated if the match succeeds. Otherwise, the second hash operation, , is performed; at most, d hash operations are performed. Each hash value is recorded during the hash operation to prevent repeated hash calculations in the following parts. Furthermore, the threshold for a candidate to replace the elephant flow in L1 is . And this paper uses the package count by default.
Algorithm 1 describes the insertion process. When there is a
that matches
f in L
1, the insertion can be considered in three cases.
| Algorithm 1 Asymmetrical insert algorithm. |
Require: packet,
- 1:
procedure INSERT() - 2:
← - 3:
if = then - 4:
- 5:
else if match = then - 6:
- 7:
else if > then - 8:
- 9:
function () - 10:
← - 11:
for i = 1 to d do - 12:
← - 13:
if then - 14:
← - 15:
if < then - 16:
← + - 17:
- 18:
return - 19:
function () - 20:
←]) - 21:
if < then - 22:
() - 23:
else - 24:
- 25:
if then - 26:
- 27:
function (,,f,) - 28:
if is then - 29:
if exist a empty j in then - 30:
- 31:
else - 32:
() - 33:
else - 34:
- 35:
j← index corresponding to - 36:
- 37:
() - 38:
if the ration of to > then - 39:
- 40:
← - 41:
function () - 42:
if is then - 43:
if exist a empty j in or other place then - 44:
- 45:
else if exist f in or other place then - 46:
|
Case 2: The has overflowed before an insertion. f is inserted into L2 with (Line 5–6). Due to the extremely limited number of flows inserted into L2, traverse L2 if the at an index position does not match f. Then, the corresponding is incremented by 1 (Line 45–46).
Case 3: The will overflow after an insertion. is inserted into L2 with (Line 3–4). Traverse L2 if the index position is not empty. Then the corresponding and are assigned as f and , respectively (Line 43–44).
If there is no in L1 that matches f, f will be inserted into CU, and the insertion process can be considered in three other cases as described in lines 7 to 8.
Case 1: A small part (CU) will not overflow after an insertion. f is inserted into CU with , where i ranges from 1 to d. (Line 22)
Case 2: A small part has overflowed before an insertion. f is inserted into L1 with (Line 24). The corresponding d entries in are incremented by 1 using a conservative update strategy (Line 37). Record the minimum values of and at the d index positions as and , respectively, and the corresponding bucket index of is j (Line 34–36). If the ratio of to is greater than , is inserted into (Line 39). Perform d hash calculations on the replaced flow , and the corresponding d entries in are assigned as (Line 40). Note that is important for the performance of AS. If is too large, it is difficult for the elephant flow to replace the mouse flow, which will reduce the measurement accuracy of the elephant flow. On the contrary, setting too small results in frequent flow replacements, possibly degrading insertion throughput.
Case 3: A small part will overflow after an insertion. f is inserted into L1 with (Line 25–26). If there is an idle space at the d index positions, insert at that position (Line 29–30). If none of the d index positions are empty, the corresponding d entries in are incremented by 1 using a conservative update strategy (Line 32).
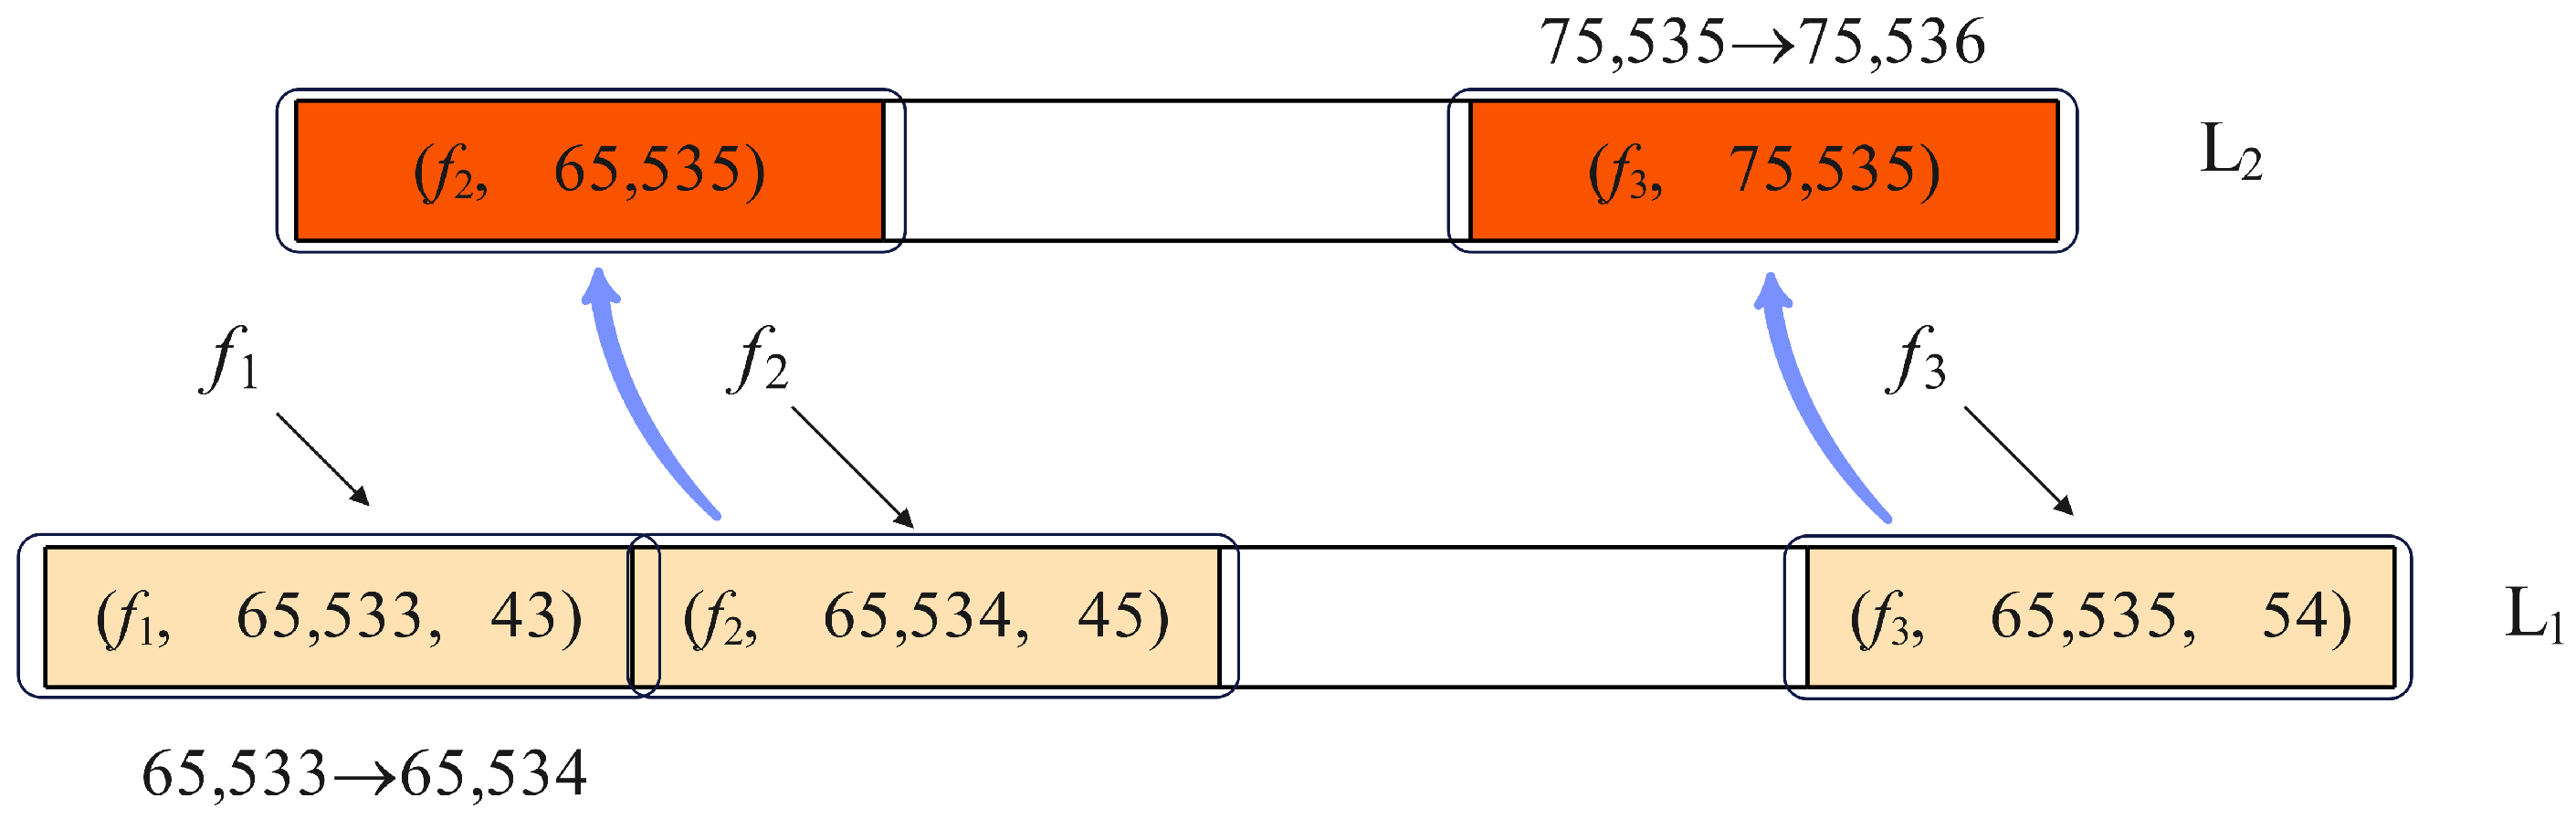
The following are some examples used to further explain the insertion process of the algorithm. Assuming that
,
, and
are 8, 16, and 32 bits, respectively, some insert operation examples are shown in
Figure 3 and
Figure 4. For
Figure 3, flow
has a position in L
1, and its
is 65533, which will not overflow after the update. Hence, the counter is just increased by 1. Like
, the
of
is updated from 65534 to 65535, but an overflow occurs there. Therefore,
is then inserted into L
2. As for flow
, its
has an overflow before the insert. Thus,
is inserted into L
2 directly, and the corresponding
is increased by 1.
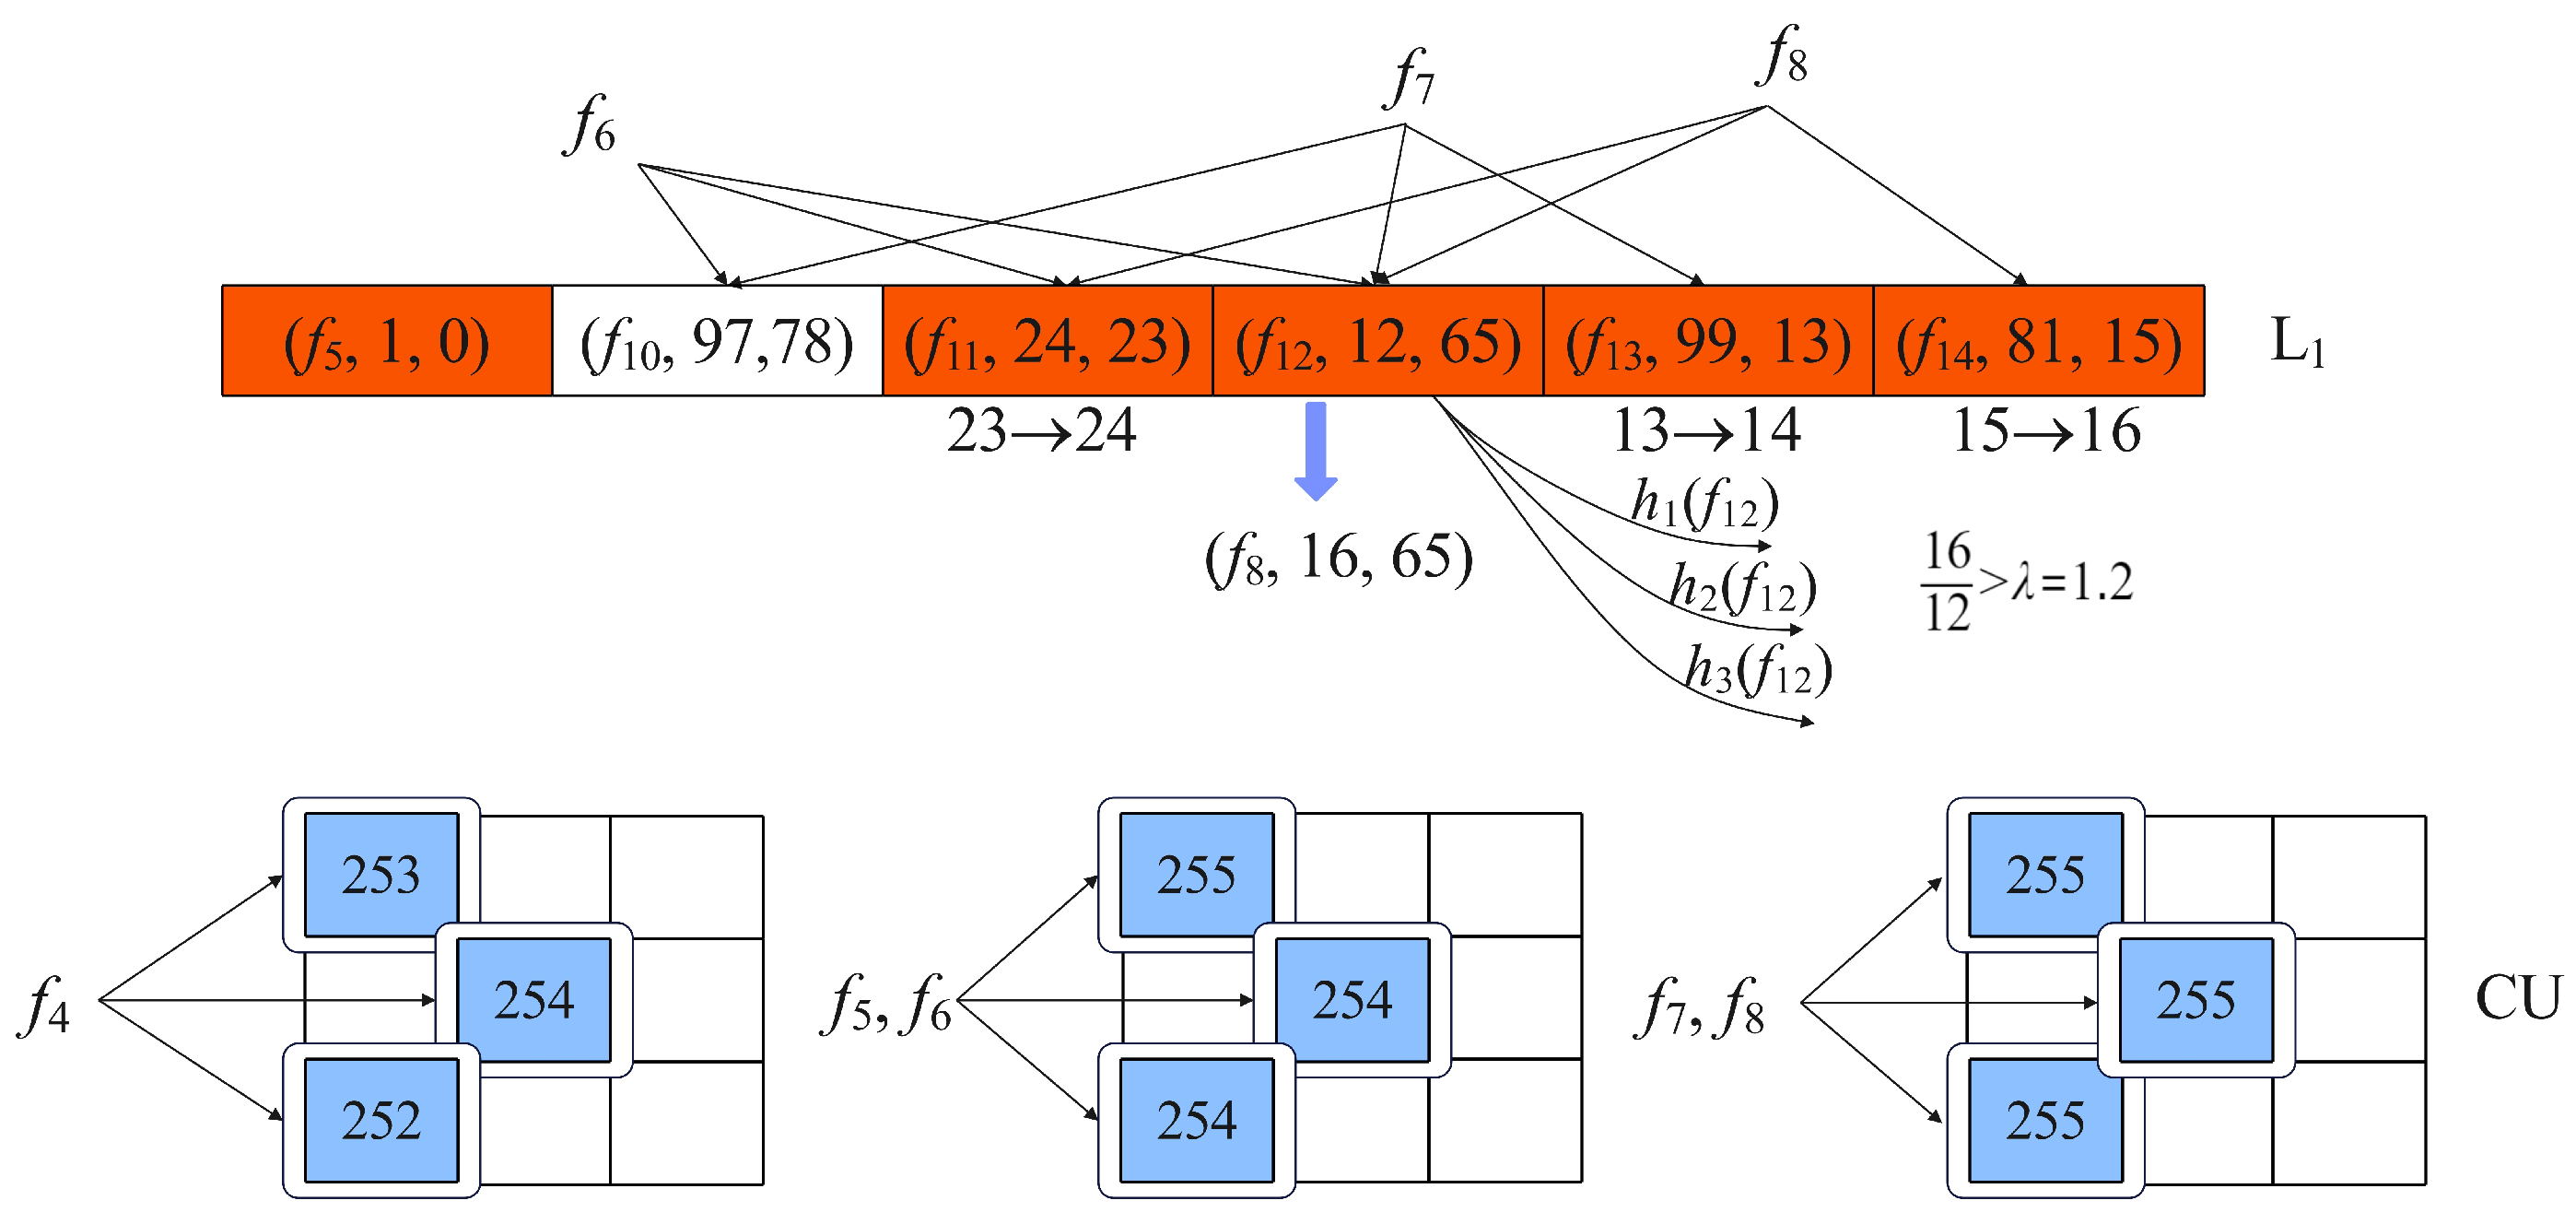
Since there are no matching
in L
1,
skip L
1, and are inserted into CU as shown in
Figure 4.
The minimum counter value of CU is 252 for , and the corresponding counter is increased by 1.
For , all counters reach their maximum value of 255 following the insert. L1 has an idle bucket for ; therefore, is inserted there. Since is unable to locate a free bucket in L1, the minimum value of 23 among the three associated parts changes to 24.
For and , the three counters in CU reach maximum value before they are updated. With the insertion of , the minimum value of 13 among the three corresponding parts is updated to 14. Similar to , the minimum value of 15 among the three associated parts is updated to 16 by . The difference is that the ratio of 16 to 12 is greater than , and the flow substitution operation is triggered. During the replacement, flow replaces flow , and the corresponding is set to 16. The will locate another three buckets through three global hash functions, and the of these buckets is set to 12.
3.2.2. Query Operation
As shown in Algorithm 2, for a given flow f, AIQ first queries a small part through the global hash functions and records the hash values. The query result is immediately returned if it does not overflow from the small part (CU). Otherwise, L1 is queried using the d hash values. The sum of and is provided as the query response if a matching is discovered and its is less than . If there is a matching with its equal to , then L2 will be queried with the first hash value. AIQ tries to find a matching f in L2 through the and traversal. If the match is successful, return the sum of the relevant and . Otherwise, return . However, if no matching f is found in L1, the sum of the minimum value among the d-associated entries and is returned directly.
Unlike most of the previous hybrid structures, whose insert and query pipelines are similar, AS uses an asymmetric insert and query algorithm. Since elephant flows account for a large proportion of total traffic, accessing the large part first is more likely to enable direct insertion of many packets without accessing the small part. For the mouse flows that constitute the majority of the traffic, accessing the small part first is more likely to directly return the query result without accessing the large part. Therefore, AIQ can improve insert and query throughput. To summarize, accessing L
1 first but prioritizing insertion into the small part optimizes both insert throughput and query throughput.
| Algorithm 2 Asymmetrical query algorithm. |
Require: packet(f)
Ensure: the size of f
- 1:
procedure QUERY(f) - 2:
← - 3:
if then - 4:
return - 5:
else - 6:
← - 7:
if < then - 8:
return + - 1 - 9:
else - 10:
return - 11:
function (f) - 12:
for i = 1 to d do - 13:
← - 14:
return - 15:
function () - 16:
for i = 1 to d do - 17:
if then - 18:
return - 19:
return - 20:
function () - 21:
if exsit f in or other place then - 22:
return + - 1 - 23:
else - 24:
return + - 1
|
3.3. Space and Time Complexity
Assuming the lengths of flow ID are set to . The memory footprint of AS consists of three parts, and the space footprint of the CU part is . Each bucket of L1 contains a key, and the number of bits occupied by the key is set to , so the space occupied by L1 is . Similarly, L2 takes . Therefore, the space complexity of AS can be expressed as .
Since the calculation of the hash function has the greatest impact on the performance of the algorithm, the time complexity of AS is analyzed from the perspective of the number of hash function calculations. For the insertion of AS, the worst case—where flow substitution occurs—is considered, where hash computations are performed. Therefore, the time complexity per packet update of AS can be expressed as .
3.4. Error Bound
For any individual packet, the insertion operation is completed within only one structure—either in the small or large part—at a time. The results in other structures remain unaffected. From this perspective, the insertion of each packet across different structures can be treated as an independent process.
The
of all buckets in L
1 can be viewed as an MI-SBF [
44]. CU and MI-SBF can be converted into the theoretical data structure, LCS, as mentioned in [
45]. Their errors can be analyzed using the false positive function. The false positive functions for CU and MI-SBF are as follows:
where Formula (
1) represents the false positive function of CU,
d denotes the number of pairwise independent hash functions,
denotes the number of counters per row, and
N denotes the number of flows inserted into CU. Formula (
2) denotes an upper bound for the MI-SBF false positive function, where
represents the size of the SBF array, and the other parameters have the same meanings as those in Formula (
1). In a given data structure, the false positive function is only related to the number of flows inserted into it.
According to [
45], the false positive function and the estimation error of the flow size in the LCS have the following relationship:
where
represents the actual number of flows in layer
k of the LCS structure.
f is the true size of the flow
i, and
is the estimate given by LCS. For convenience of analysis,
is replaced with
.
denotes the number of flows in the dataset with a size of at least
k. Therefore, we have the following:
Substituting Formula (
1) into Formula (
4), the estimation error of CU can be obtained as follows:
Let
, where
is the error rate in CU; we have the following:
Let
; the estimation error of MI-SBF can be obtained as follows:
Depending on where the flow is eventually recorded, the errors are discussed in three cases:
Recorded in CU.
In this case, the upper bound of the error for the flow is equivalent to CU. That is, we have the following:
where
represents the total number of data packets inserted into the CU at the end of the measurement period.
Recorded in L1.
Let
; the estimated values for the CU and L
1 parts are denoted by
and
, respectively, and their corresponding true values are represented by
and
. According to Formula (
6), the error of
is as follows:
where
is the total number of data packets inserted into CU when flow
i overflows from CU. Obviously,
. According to (
7), the error of
is as follows:
where
is the total number of data packets inserted into all the
parts of L
1. By combining Formulas (
9) and (
10), we have the following:
Recorded in L2.
L
2 records a very small number of flows, such as those larger than
. As a result, it is assumed that L
2 will not lose any flows. Based on this assumption, Formula (
11) is still valid in this case.
4. Experiments
In this section, an analysis is conducted on the influence of the selection of the parameter on the performance of AS. Then, multiple datasets are selected to test the accuracy of AS in various measurement tasks. Furthermore, the insertion throughput and query throughput of different schemes are also compared.
4.1. Experimental Setup
Three datasets, which are the most representative in the field of network measurement, were used to evaluate the performance of AS under different network conditions.
IP trace datasets. CAIDA’s anonymized internet traces, which are public traffic traces collected in the Equinix-Chicago monitor [
46], were used to evaluate the performance of AS under actual network traffic. Each trace was divided into subtraces that were 5 s in length, and each subtrace contained around 2.5 M packets and 170 K flows (srcIP, srcPort, dstIP, dstPort, protocol).
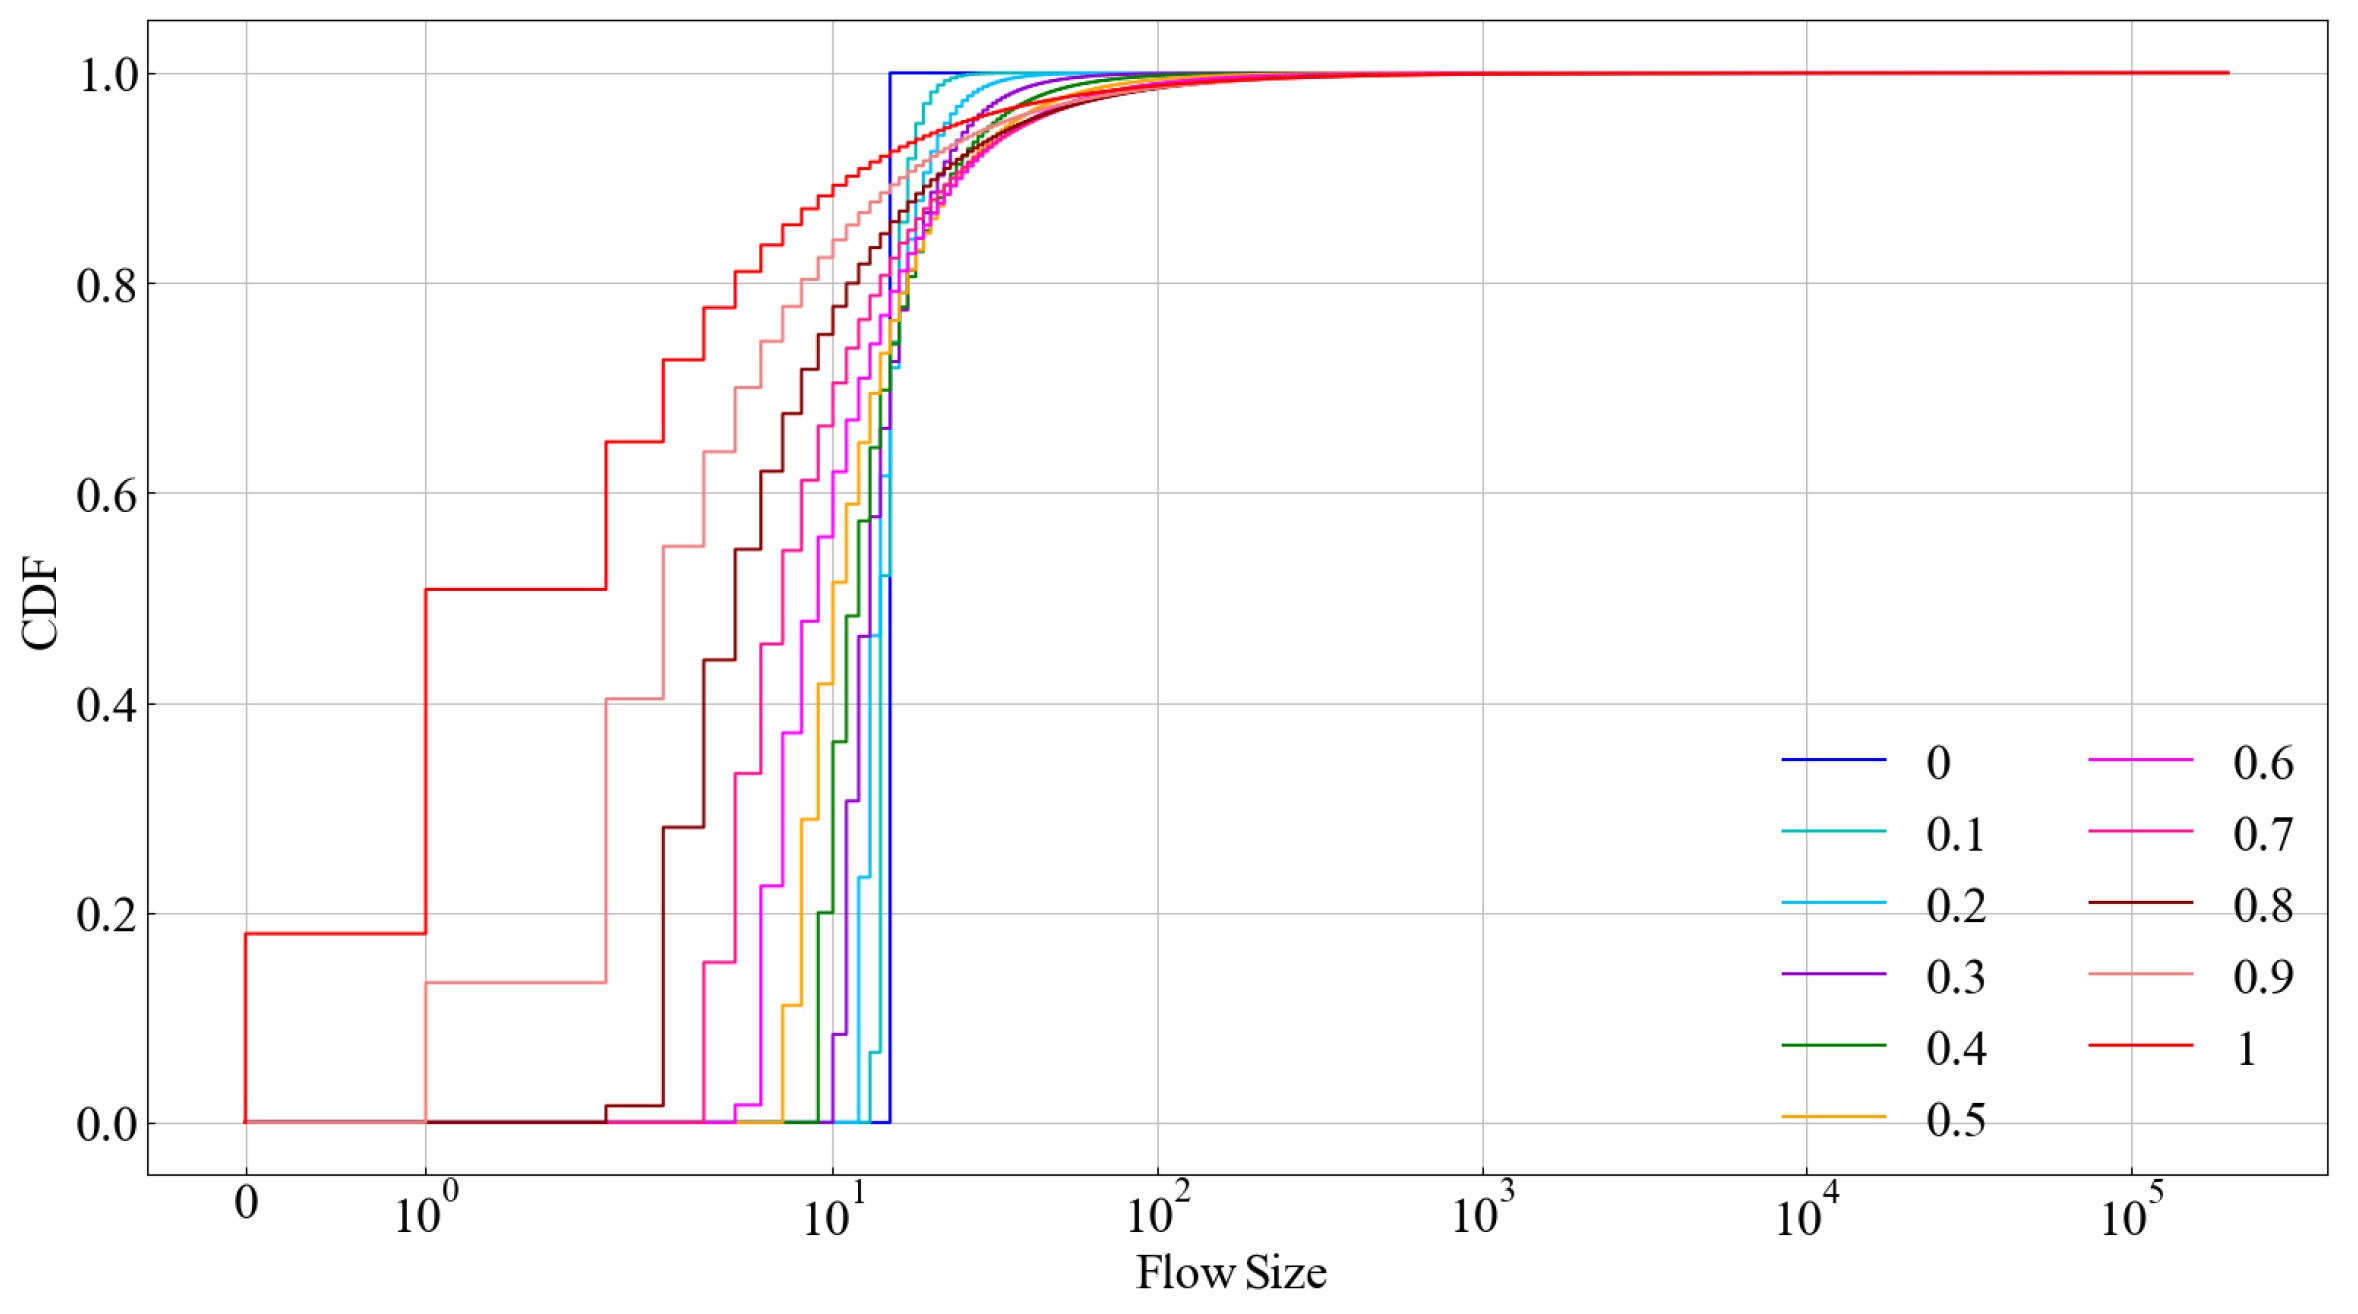
Zipf distribution datasets. The 11 datasets following the Zipf distribution [
47] were generated across varying levels of skewness, ranging from 0.0 to 1.0, in increments of 0.1, to simulate skewed and variable flow size distributions. The Zipf stream with skew value
consisted of several items
, where
n denotes the number of items, and the probability of the
jth item is
. The length of each item is 13 bytes, and each dataset contains about 4 M packets. The cumulative distribution function (CDF) diagram of datasets with different skewness values is shown in
Figure 5.
Real-life transactional dataset. This webpage dataset was built from a spider collection of web HTML documents, as obtained from the website [
48]. Due to its significant size, the initial dataset was partitioned into a reduced subdataset of 184 MB. The subdataset, comprising approximately 1 M flows and 38 M packets, is utilized to evaluate the performance of AS under extreme scenarios.
Flow size estimation: At the end of the insertion, the number of packets per flow in the dataset was obtained by querying. Some representative schemes were selected from each category for comparison, including CM, CU, CS, TowerCU, Elastic Sketch, and Diamond Sketch, as outlined in
Section 2.
Heavy hitter detection: A heavy hitter is a flow whose size exceeds a certain percentage of the total of all packets. The classic schemes—CMheap and Elastic Sketch—which share the same structural category as AS, were used for comparison. TowerCU was not compared because it does not record the flow ID.
Heavy changer detection: A heavy changer is a flow whose value change between two adjacent measurement periods exceeds the threshold. The same schemes in heavy hitter detection were compared with AS.
AAE (average absolute error): , where n is the number of flows, and and represent the estimated and true flow sizes, respectively.
ARE (average relative error): .
RR (recall rate): , where k is the number of true elephant flows detected and M is the number of overall true elephant flows.
PR (precision rate): , where N is the number of overall reported elephant flows.
F1 score: .
Throughput: The number of packets processed per second (Mpps).
For AS, the counter sizes in CU, L
1, and L
2 were set to 8-bit, 16-bit, and 32-bit, respectively. The memory sizes for the L
1 and L
2 parts were set to 115 KB and 1 KB, respectively. The detection threshold of heavy hitters and heavy changers was set to 0.02% of the total packets. The settings for other schemes remained the same as in the original paper. The hash function used was BOBhash [
49], which is the most commonly used in network measurements. In the experiments, in order to ensure independence between different hash functions, a unique seed was set for each hash function. All experiments were repeated 50 times to obtain the results.
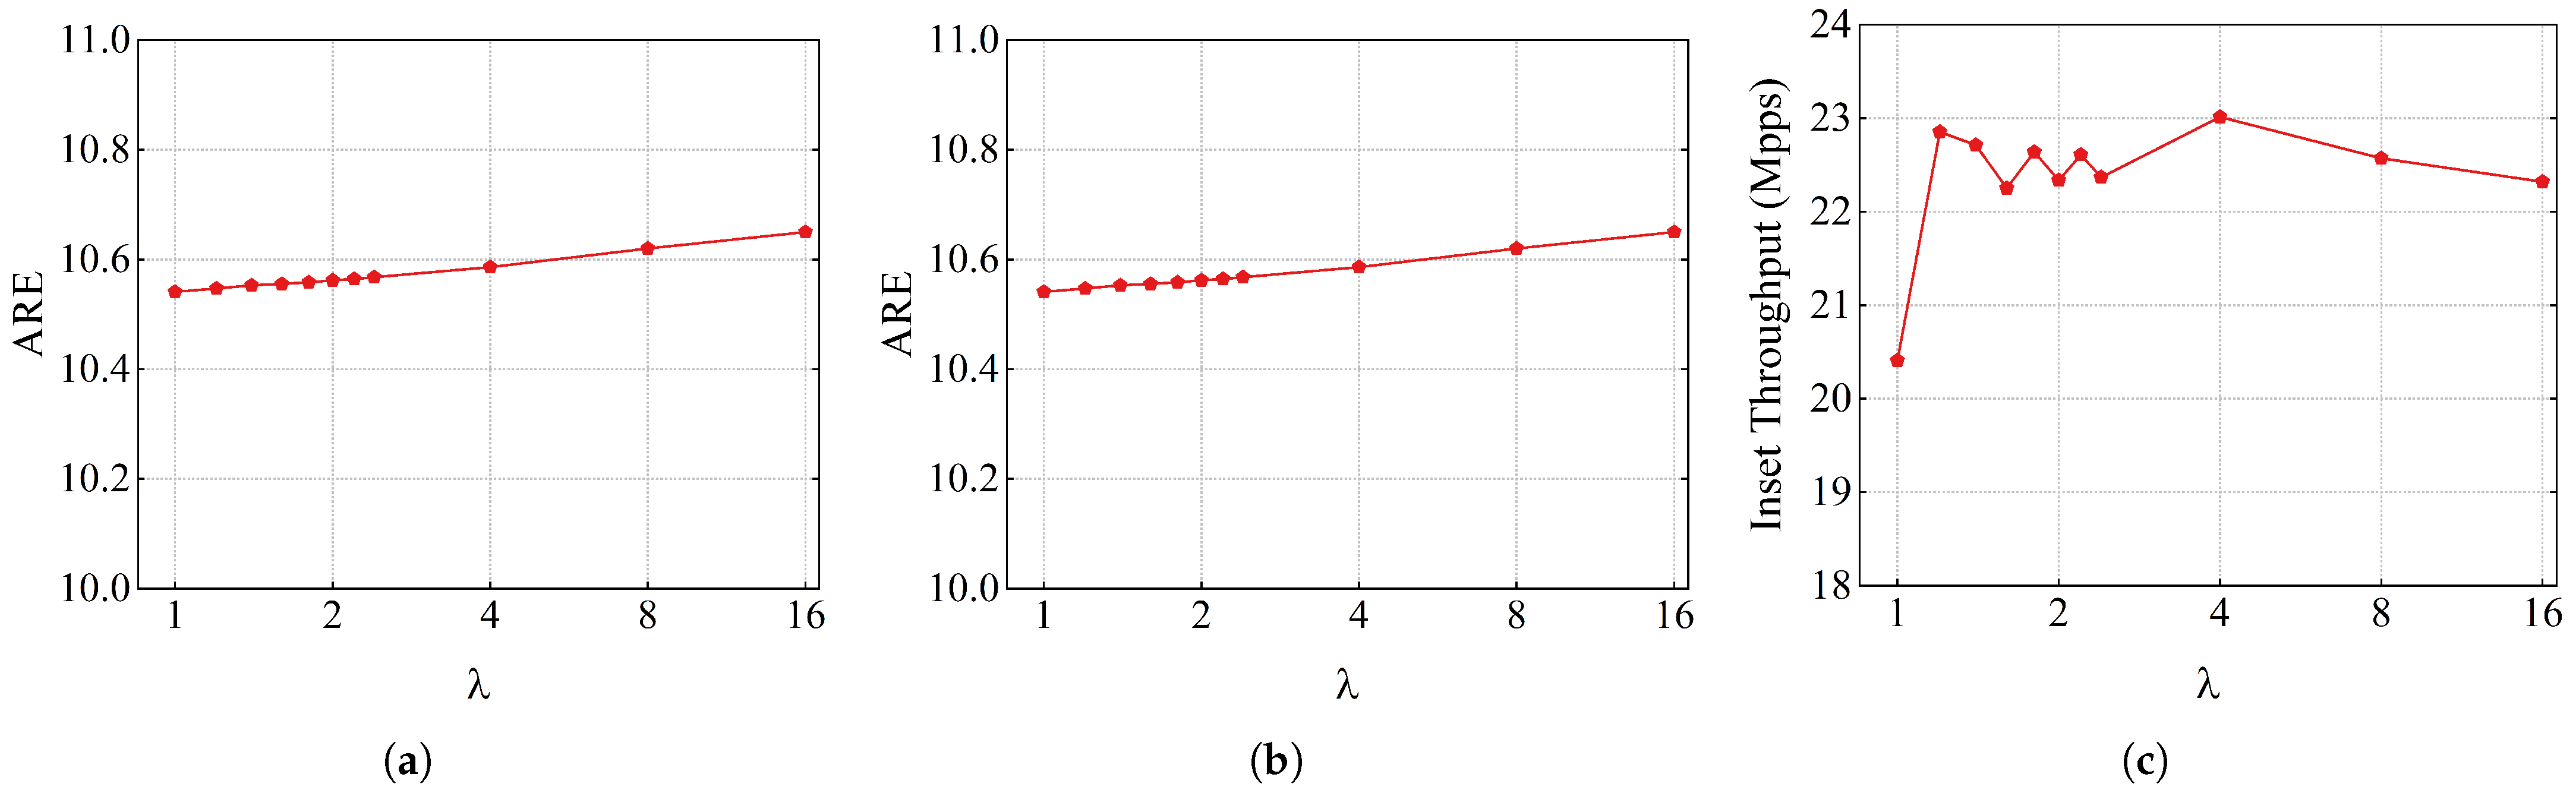
4.2. Impact of Replacement Threshold
is the threshold for the elephant flow replacement. If is too large, it is difficult for the elephant flow to replace the mouse flow, which will reduce the measurement accuracy of the elephant flow. On the contrary, setting too small results in frequent flow replacements, possibly degrading insertion throughput. To this end, the impact of on the performance of AS is studied from three aspects, that is, flow size, heavy hitter, and insertion throughput. The total memory of AS is set to 400 KB.
The experimental results under the web datasets are shown in
Figure 6, the ARE values of flow size and insert throughput fluctuate slightly with the increase in
. The ARE of the heavy hitter remains almost constant when the value of
changes from 1 to 1.6. However, when
changes from 2 to 16, the ARE of the heavy hitter increases approximately linearly.
To summarize, the value of has little effect on the accuracy of flow size and throughput. The impact of on the accuracy of heavy hitters is reflected in the dataset with a lot of elephant flows. Therefore, is set to 1.2 in this paper.
4.3. Accuracy
4.3.1. Flow Size Estimation
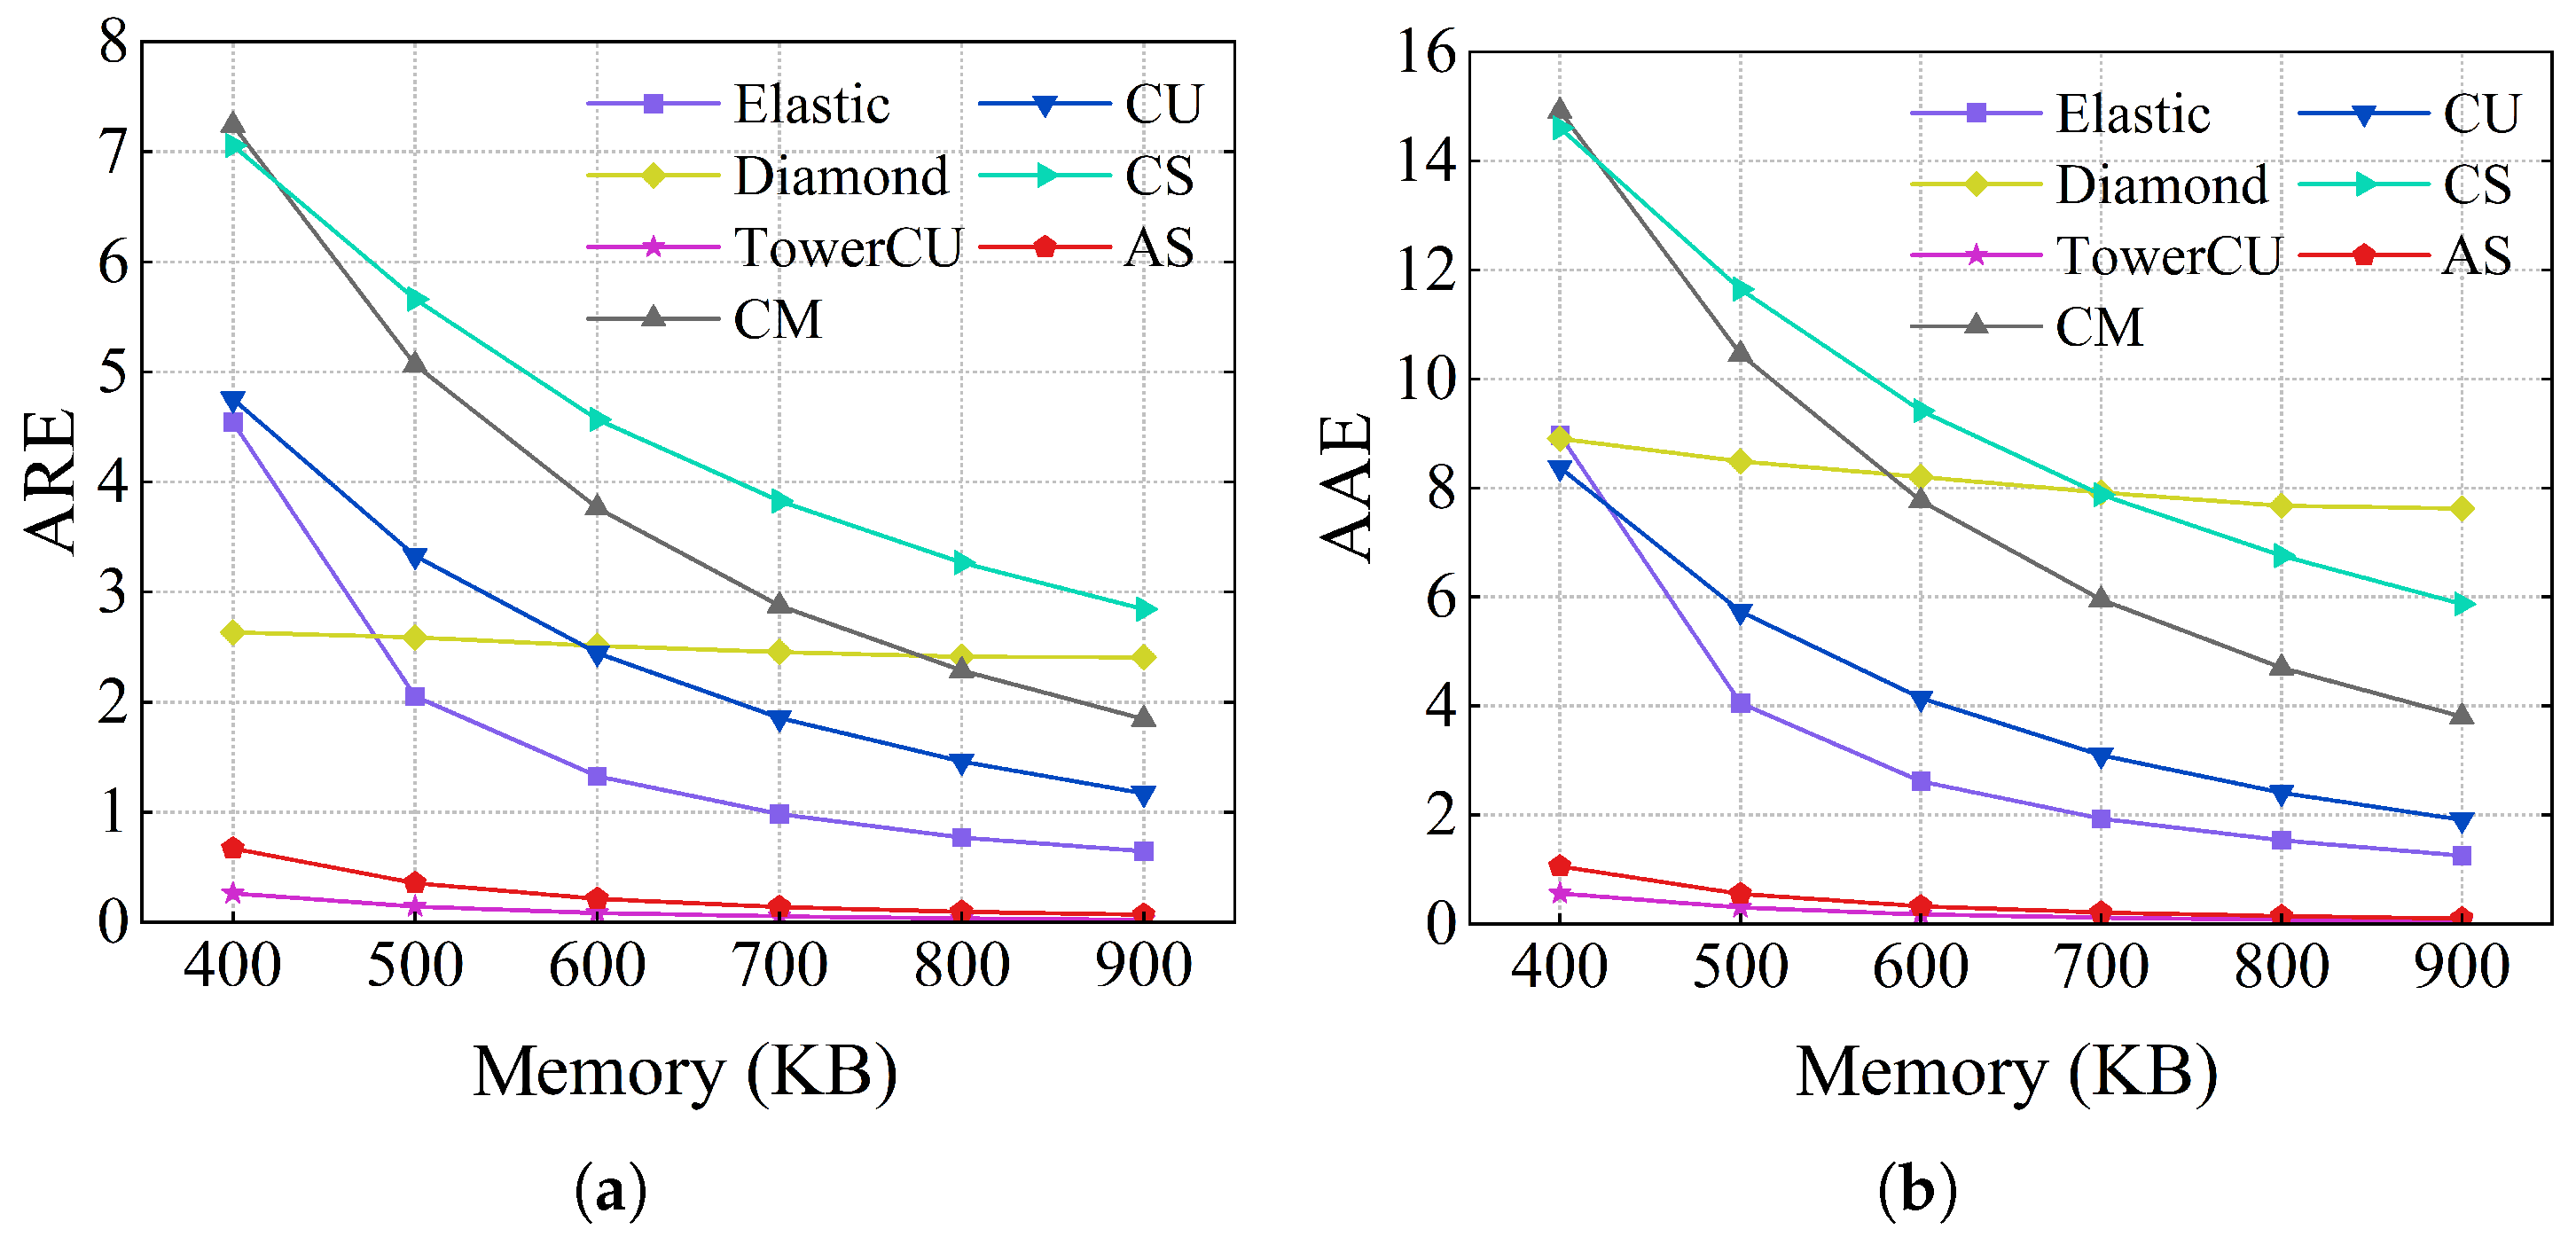
Results of the flow size estimation using the CAIDA dataset are shown in
Figure 7 and
Table 2. The ARE and AAE of AS are similar to those of TowerCU, which are lower than all other schemes under all memory constraints. Compared with CM, CU, CS, Diamond Sketch, and Elastic Sketch, the ARE values of AS are reduced by 17.75, 11.53, 21.54, 11.83, and 6.26, respectively, when memory is 600 KB. The AAE values are reduced by 23.73, 12.66, 28.79, 25.07, and 7.99, respectively. The AAE and ARE of CM, CU, and CS increase sublinearly with the decrease in memory. When memory decreases, the number of counters per row decreases, and hash conflicts intensify. The accuracy of CU is higher than that of CM and CS because the conservative updating method decreases the overestimation error of the flow. Elastic Sketch adopts a hybrid structure to avoid errors while achieving sublinear memory growth. However, Elastic Sketch records mouse flows using CM with only one hash function, which results in low accuracy for mouse flows. In the CAIDA dataset, the number of elephant flows is relatively small. As a result, diamond mainly relies on the MI-SBF of the bottom two layer counts, which results in lower accuracy. The counters of TowerCU are as short as 2 bits for mouse flows, which means there are more counters, and the overestimation error of mouse flows is greatly reduced. AS inherits the advantages of a hybrid structure and avoids the impact of the mouse flow on the elephant flow. For mouse flows, AS can use three hash functions with the help of a globally shared hash value, significantly improving the accuracy of the mouse flows compared with elastic. For elephant flows, AS uses 16-bit and 32-bit counters for more detailed division, which helps to improve the accuracy of elephant flows. Therefore, the overall measurement accuracy of AS is higher.
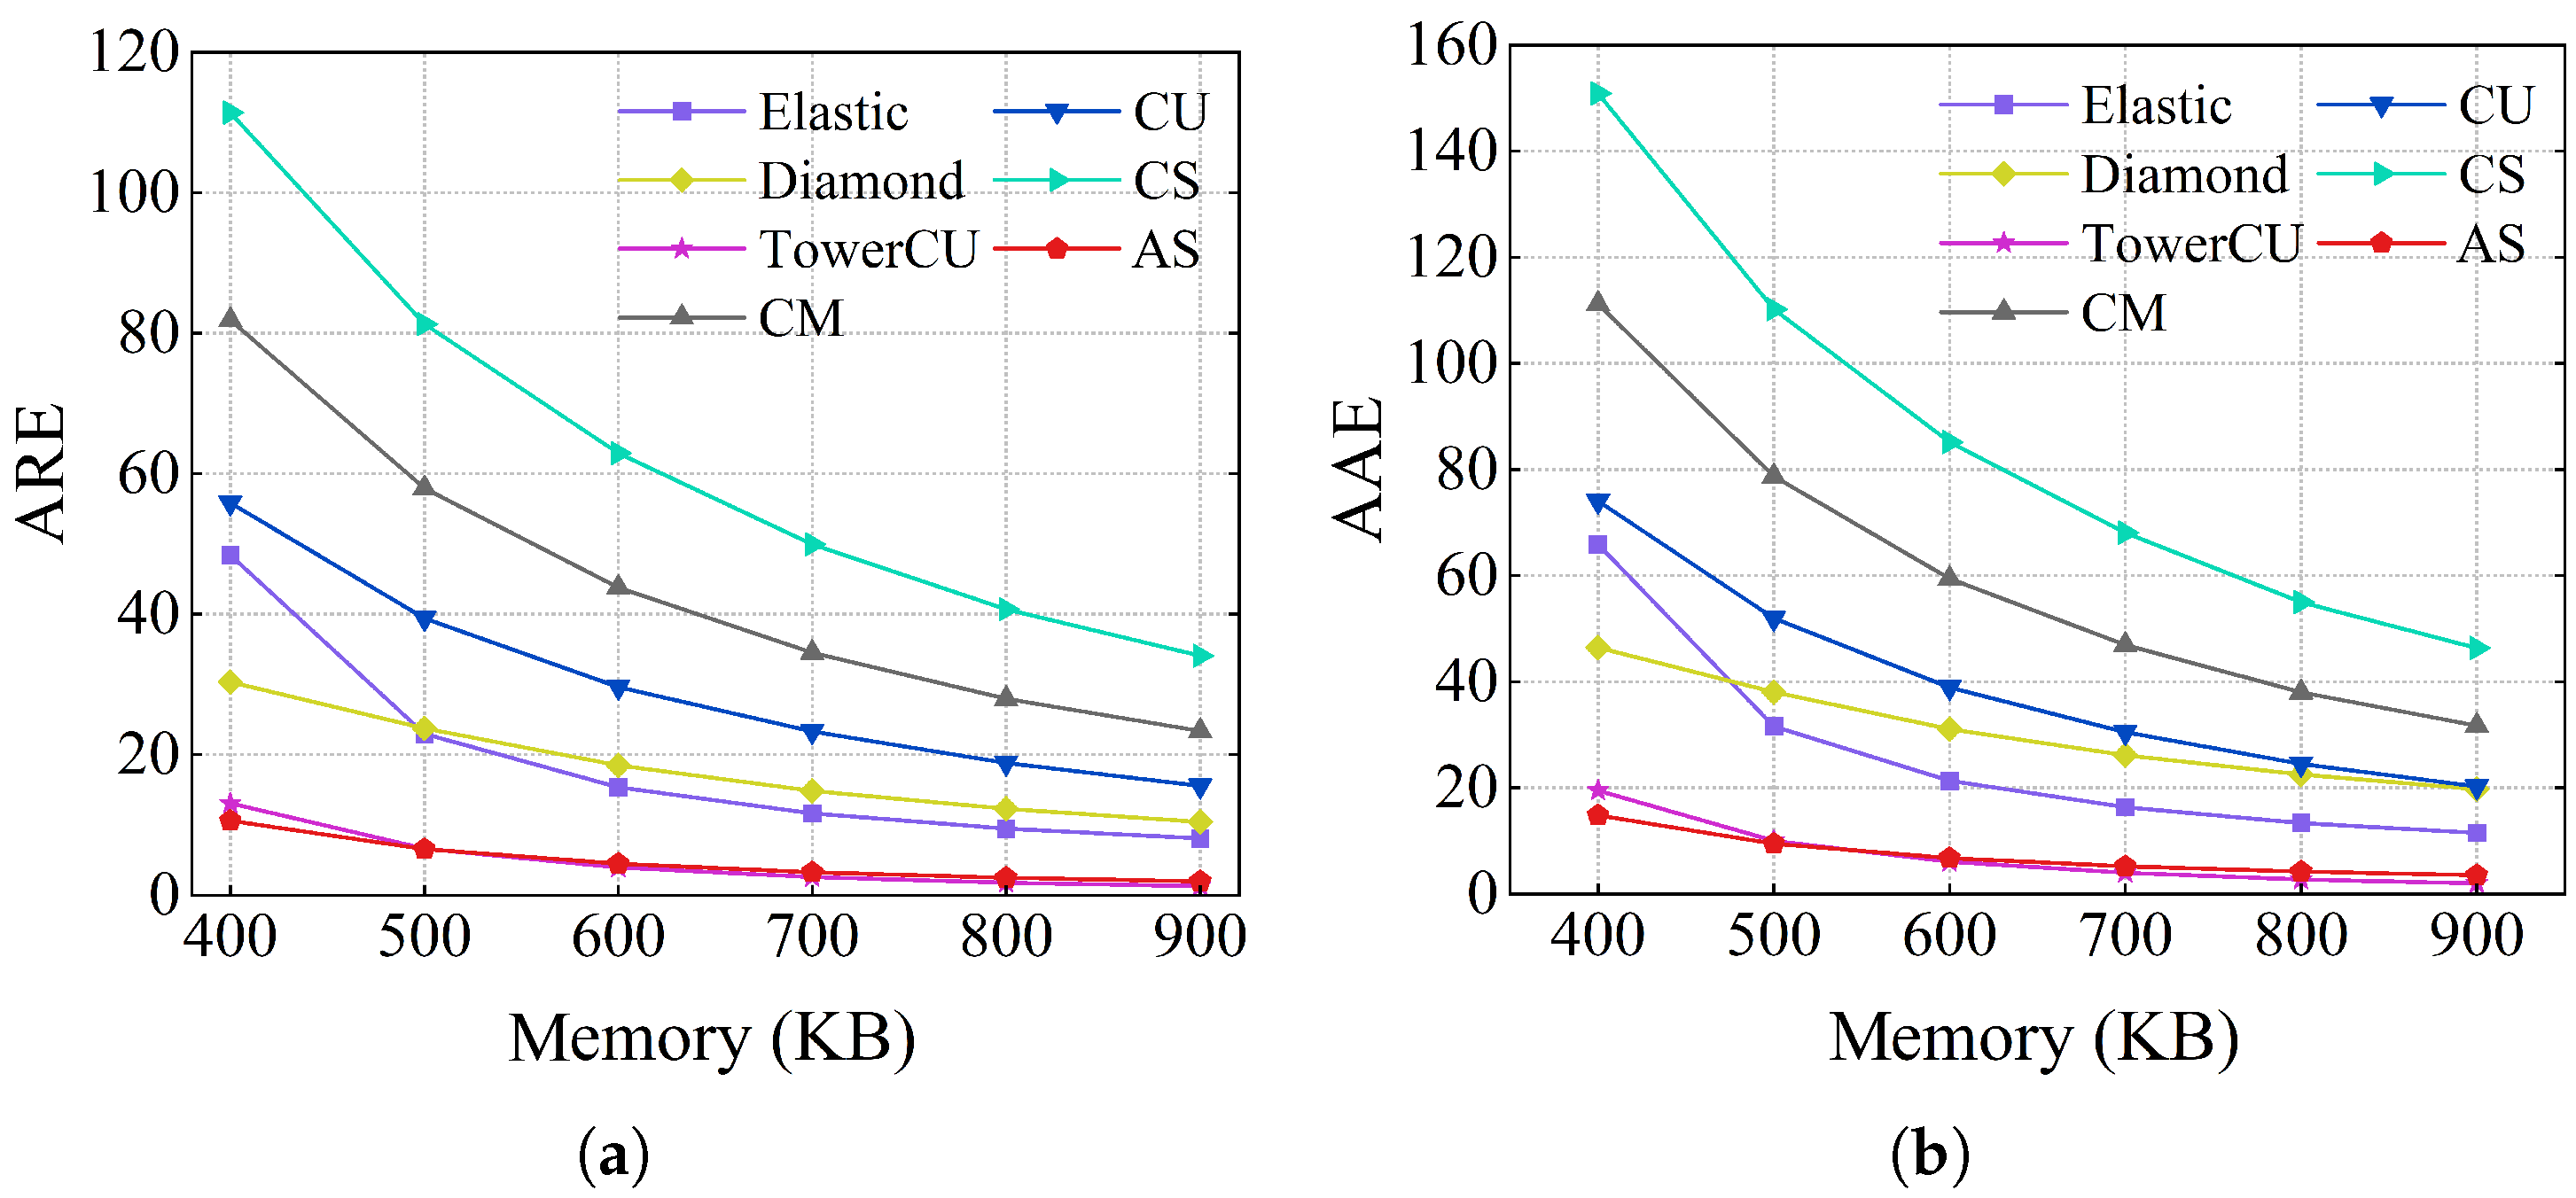
Figure 8 and
Table 3 show the accuracy values of flow size estimation on the webpage dataset, which is much larger than CAIDA. The accuracy of AS is still significantly higher than other schemes in this dataset. The difference is that the relative accuracy of Diamond Sketch is significantly improved. The primary reason is that the dataset is sufficiently large, and the high-level memory in Diamond Sketch is utilized to enhance accuracy.
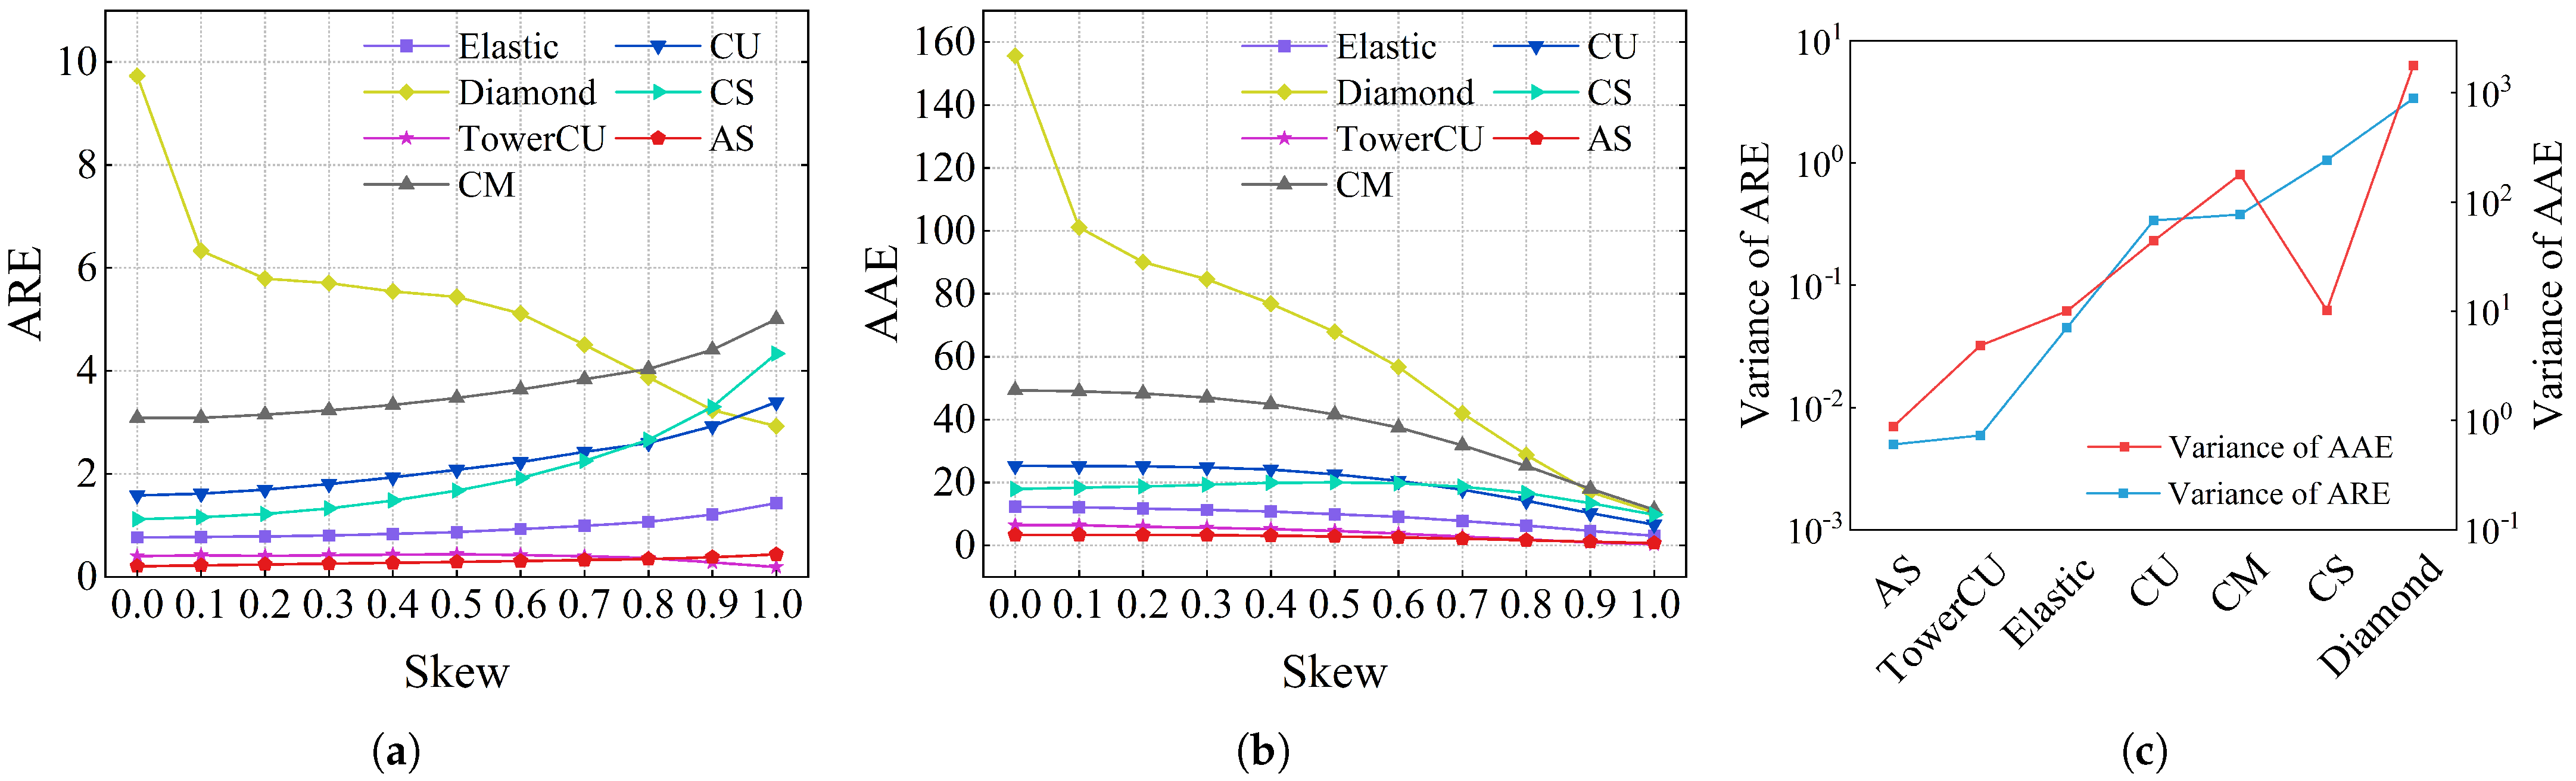
In addition to the two real datasets mentioned above, the synthetic datasets with varying degrees of skewness were also employed to simulate how each scheme would perform across varying levels of skewness loads. The total memory for all schemes was set to 600KB. As shown in
Figure 9a,b, the ARE and AAE of AS were lower than other schemes under almost all skewness. When skewness was zero, that is, a completely uniform dataset, the ARE and AAE of AS were reduced by factors of 14.99, 7.68, 5.44, 47.29, 3.73, and 1.95 with respect to CM, CU, CS, Diamond Sketch, Elastic Sketch, and TowerCU. As shown in
Figure 9c, when the skewness ranged from 0 to 1, the variance of AS’s AAE and ARE was significantly lower than that of all other schemes. When memory exceeded 600KB, the AS number increased, and hash collisions between flows decreased. Consequently, both ARE and AAE further decreased. According to
Figure 9, it can be concluded that AS surpassed other schemes in terms of accuracy while maintaining high measurement stability across varying skewness levels. This is because the small part counters of AS were sufficient for a skewness of zero, while the large part counters could effectively capture all elephant flows with a skewness of one.
In summary, the accuracy of AS, TowerCU, Elastic Sketch, and Diamond Sketch, which were adapted to the skewed distribution, is better than that of classical schemes (CM, CU, and CS). However, Diamond Sketch relies on a skewed distribution or a large dataset, as shown in
Figure 7 and
Figure 8. For Elastic Sketch, there is still room for accuracy improvement because it does not take into account the hash conflicts of mouse flows. Although the accuracy of TowerCU is similar to AS, it does not record flow ID and cannot measure tasks such as heavy hitters. AS does not depend on the distribution characteristics of the dataset, and can achieve good accuracy in a large or small dataset, as well as datasets of varying levels of skewness.
4.3.2. Heavy Hitter Detection
The accuracy of heavy hitter detection using the CAIDA dataset is displayed in
Figure 10. In terms of precision, AS achieved an accuracy of 1 with all memory. For CMheap, its precision was 0.958, which was significantly lower than Air Sketch and Elastic Sketch when memory was 200KB. This can be explained by the fact that when memory is constrained, hash collisions increase, and CMheap misinterprets some mouse flows as elephant flows. For the recall rate, under all memory conditions, AS recalled all real heavy hitters. The recall rate of Elastic Sketch was lower because its elephant flow replacement strategy was nondeterministic. From the perspective of the comprehensive evaluation parameter, the F1 score, AS was 1, while Elastic Sketch and CMheap were 0.987 and 0.978, respectively. In addition to accurately recalling every elephant flow, AS also measures them with great accuracy. As shown in
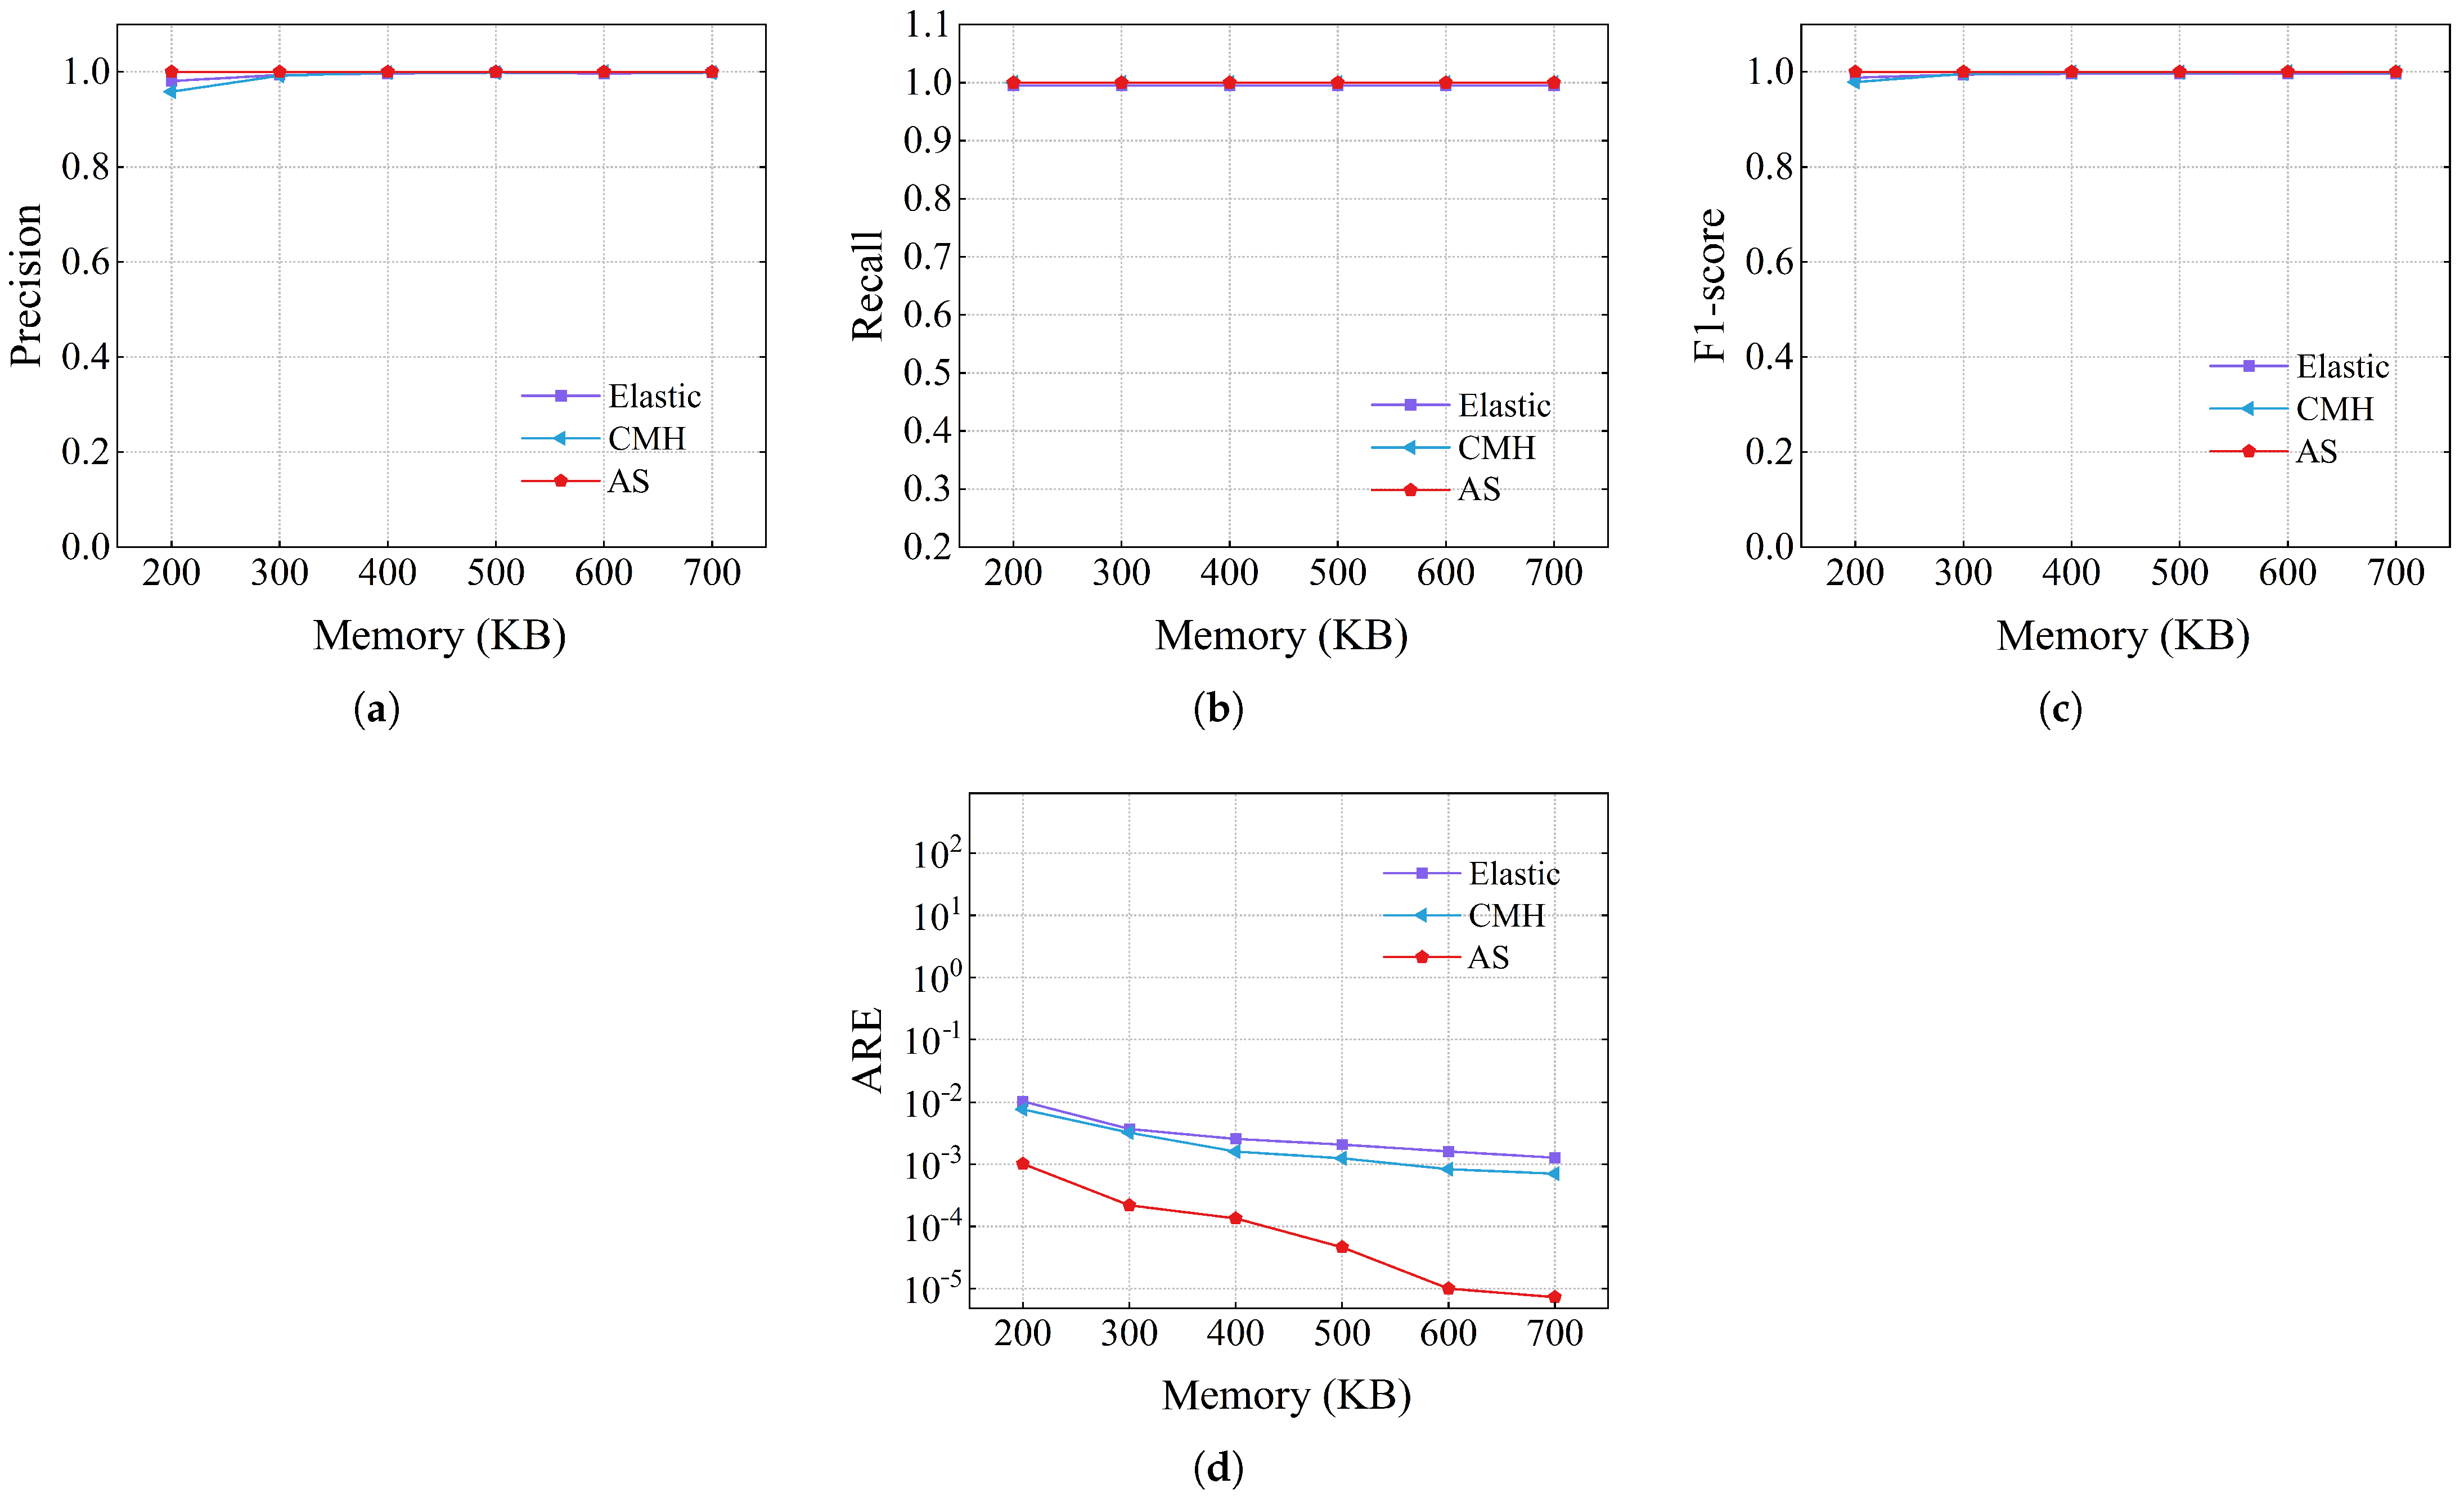
Figure 10d, the ARE of AS was between 10.15 and 177.23 times smaller than that of Elastic Sketch, and was between 7.52 and 97.24 times smaller than CMheap. The high accuracy of AS in measuring elephant flows lies in two aspects. First, AS filters out most of the mouse flows with a small part. Second, a deterministic replacement strategy is used to perform rolling updates on a chosen small number of elephant flows.
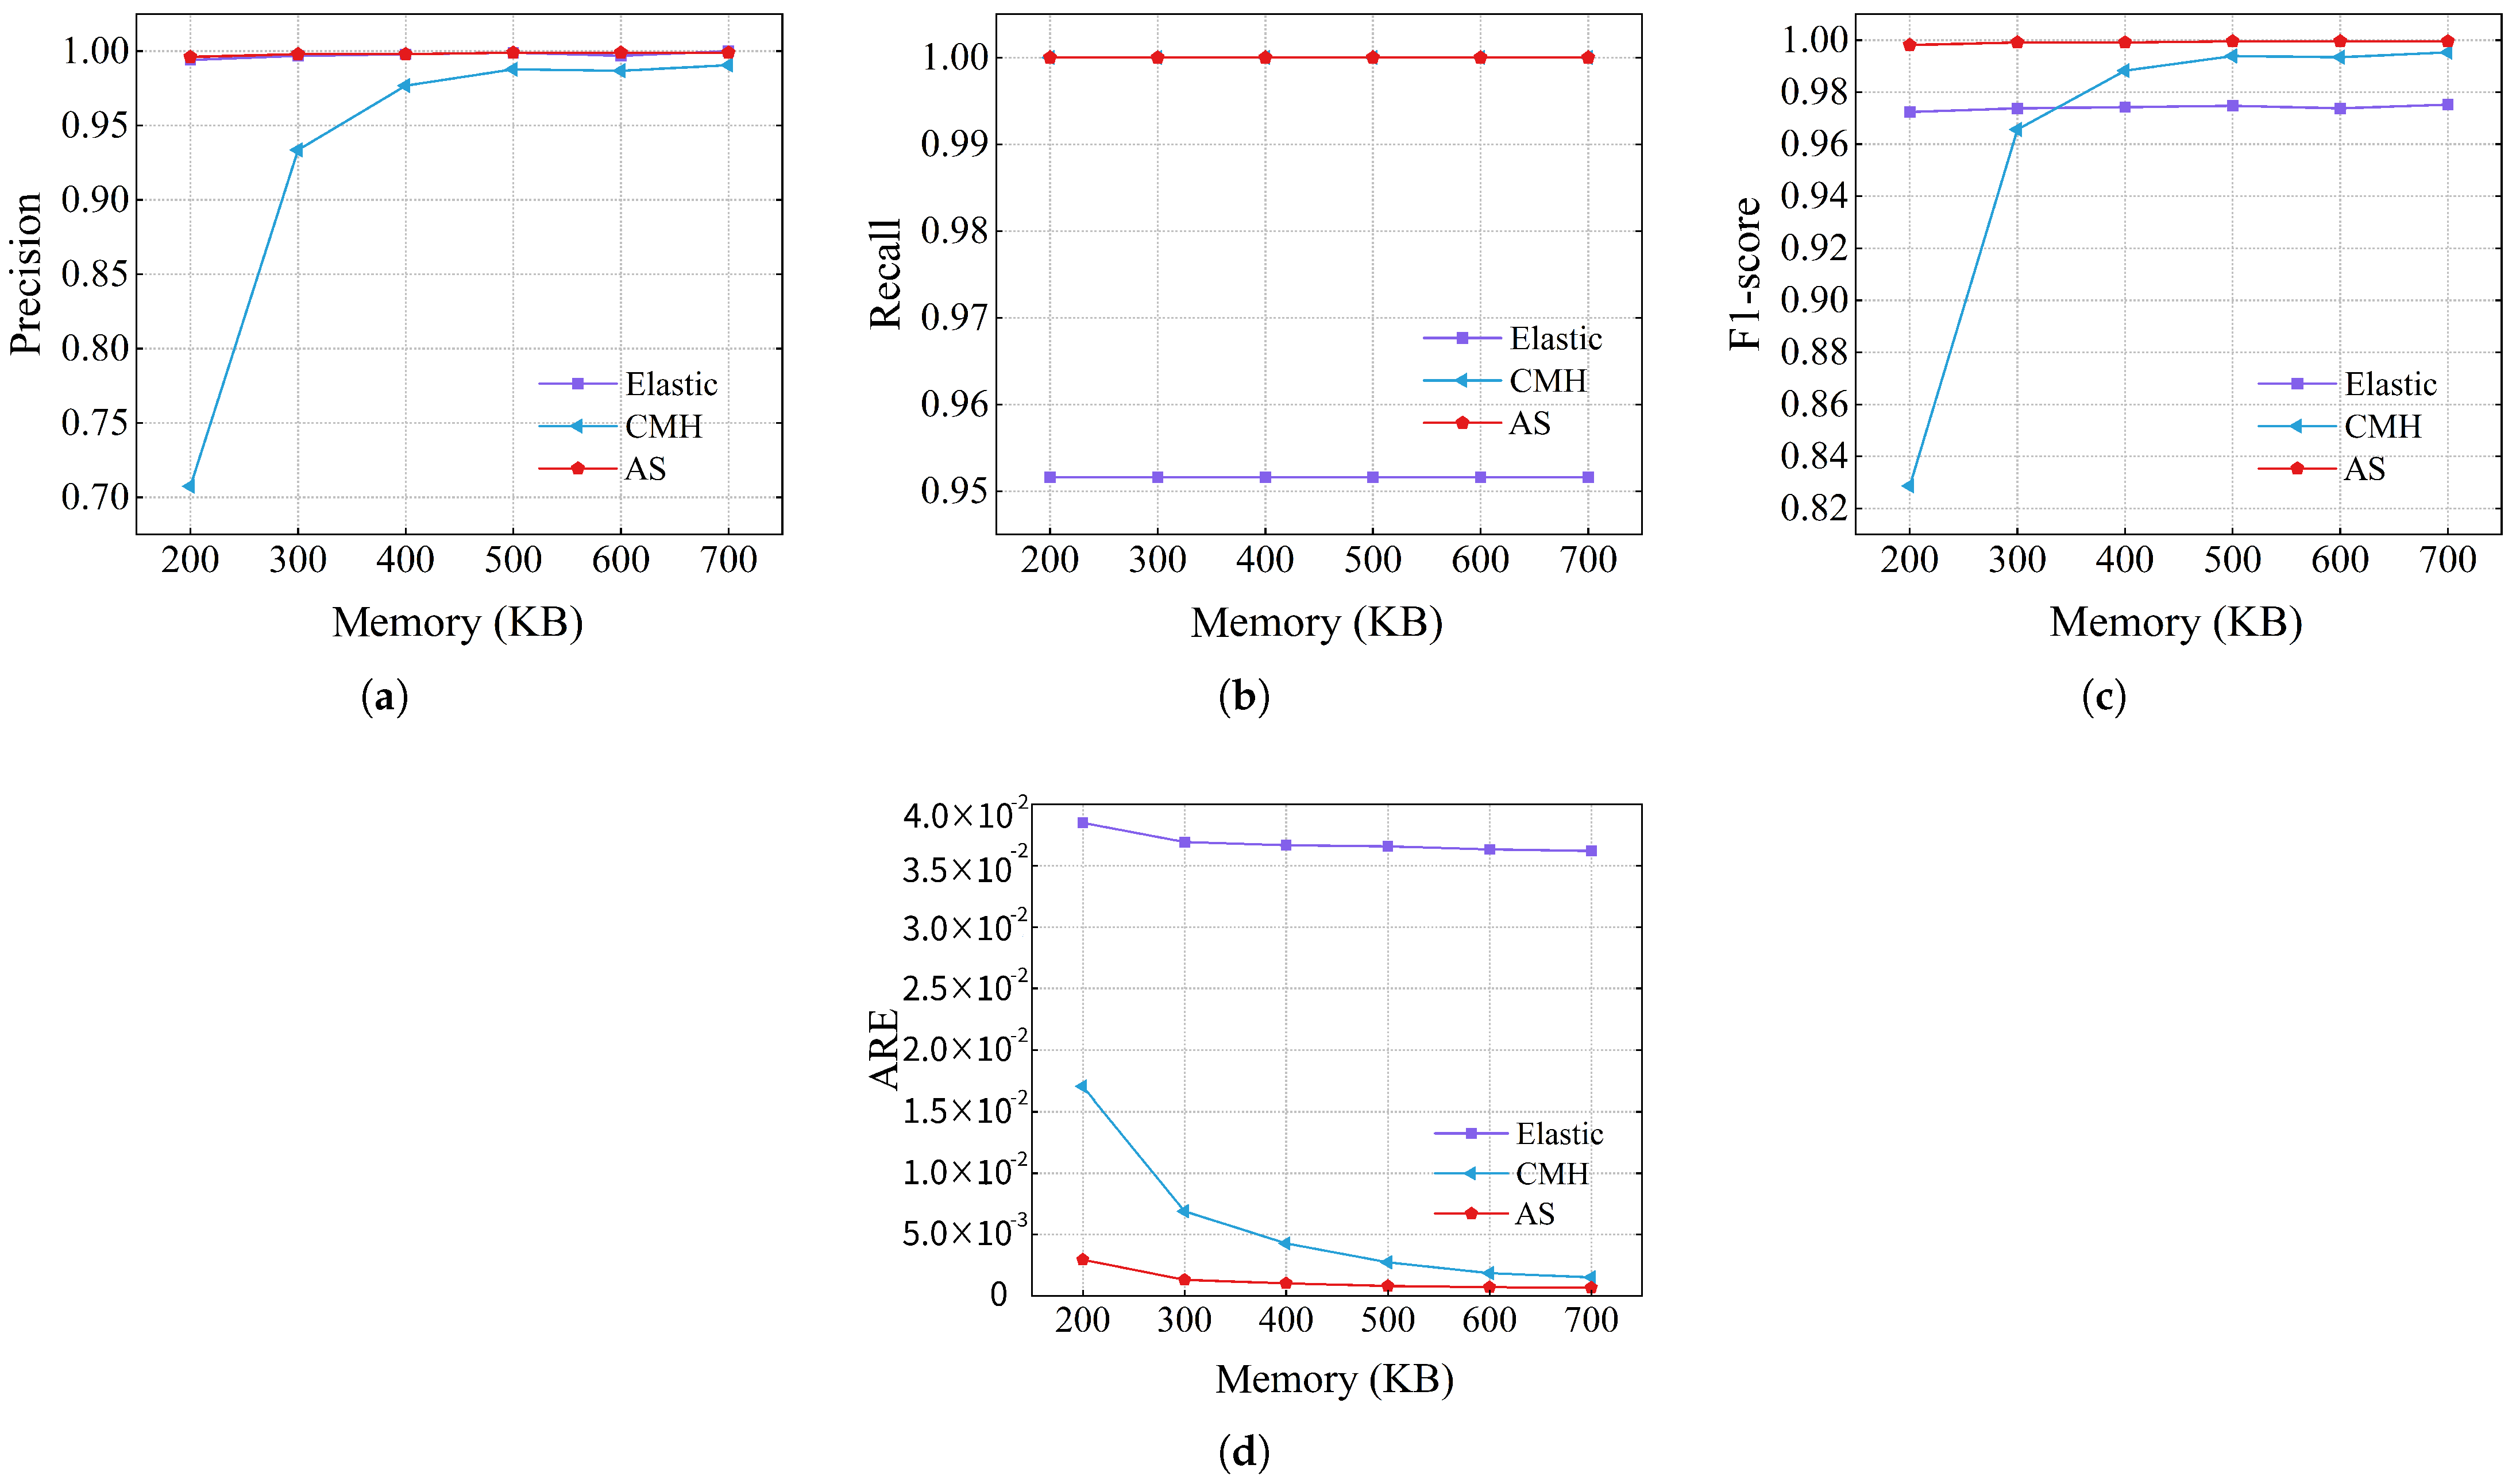
The accuracy of using the webpage dataset is shown in
Figure 11. The recall rate and precision of AS were almost 1, even when tested under a large dataset. Meanwhile, the recall of Elastic Sketch and the precision of CMheap dropped significantly compared to the performance under CAIDA. In terms of ARE, AS is still significantly better than Elastic Sketch and CMheap. The errors were reduced by 2.23∼5.73 times and 12.95∼52.54 times, respectively, compared to CMheap and Elastic Sketch.
In summary, AS recalled almost all elephant flows with almost no false positives under two real datasets. Meanwhile, the ARE of the elephant flows remained at or below the order of magnitude of when memory was 200 KB.
4.3.3. Heavy Changer Detection
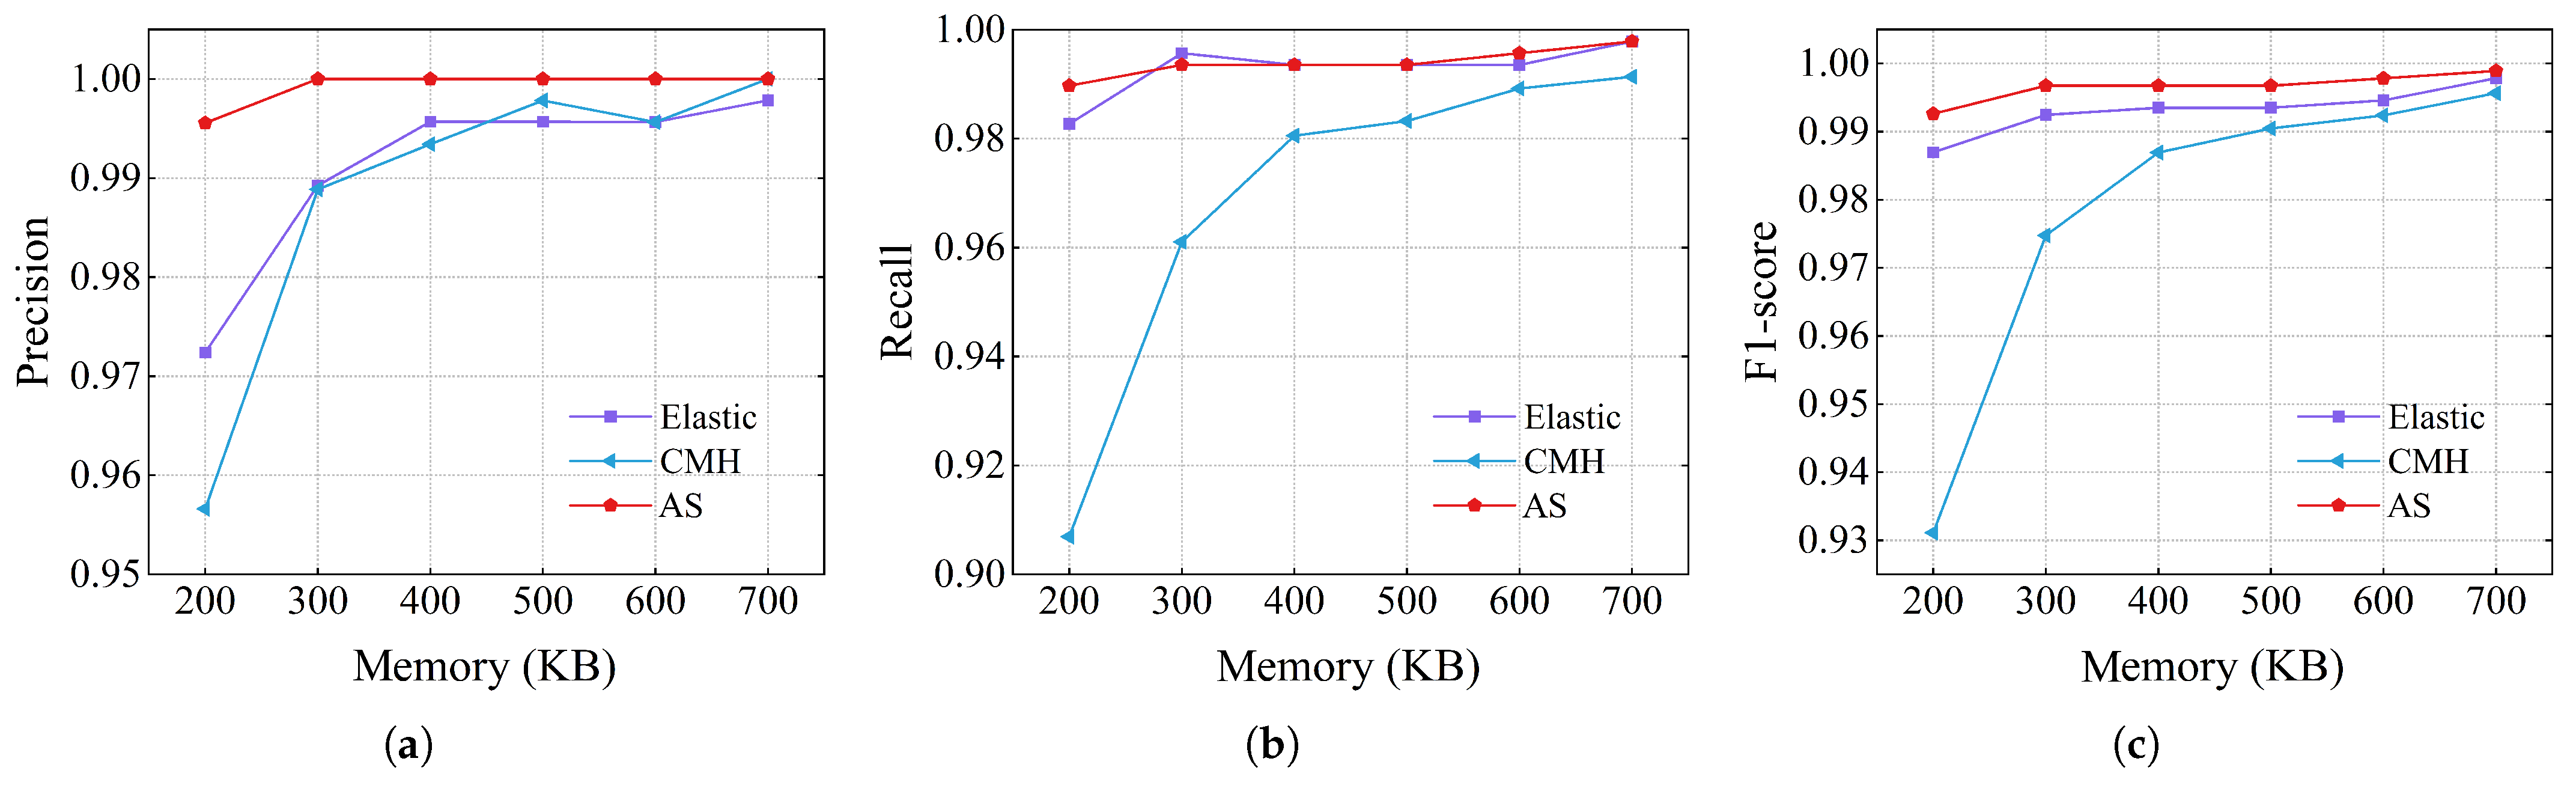
The accuracy values of the heavy changer detection using the CAIDA dataset are shown in
Figure 12. For recall rate, AS was 0.97, which was similar to 0.98 for Elastic Sketch and higher than 0.91 for CMheap. Additionally, AS maintained the highest precision across all memory conditions. When using 200 KB of memory, the precision of AS was 0.99, while the values of Elastic Sketch and CMheap were 0.97 and 0.95, respectively. AS continues to be higher than elastic and CMheap in terms of F1 score.
4.4. Speed
In this subsection, the insertion and query throughputs of different schemes on the CAIDA, webpage, and Zipf datasets are evaluated. The total memory of all schemes was set to 600 KB, and SIMD acceleration was not used.
4.4.1. Insert Throughput
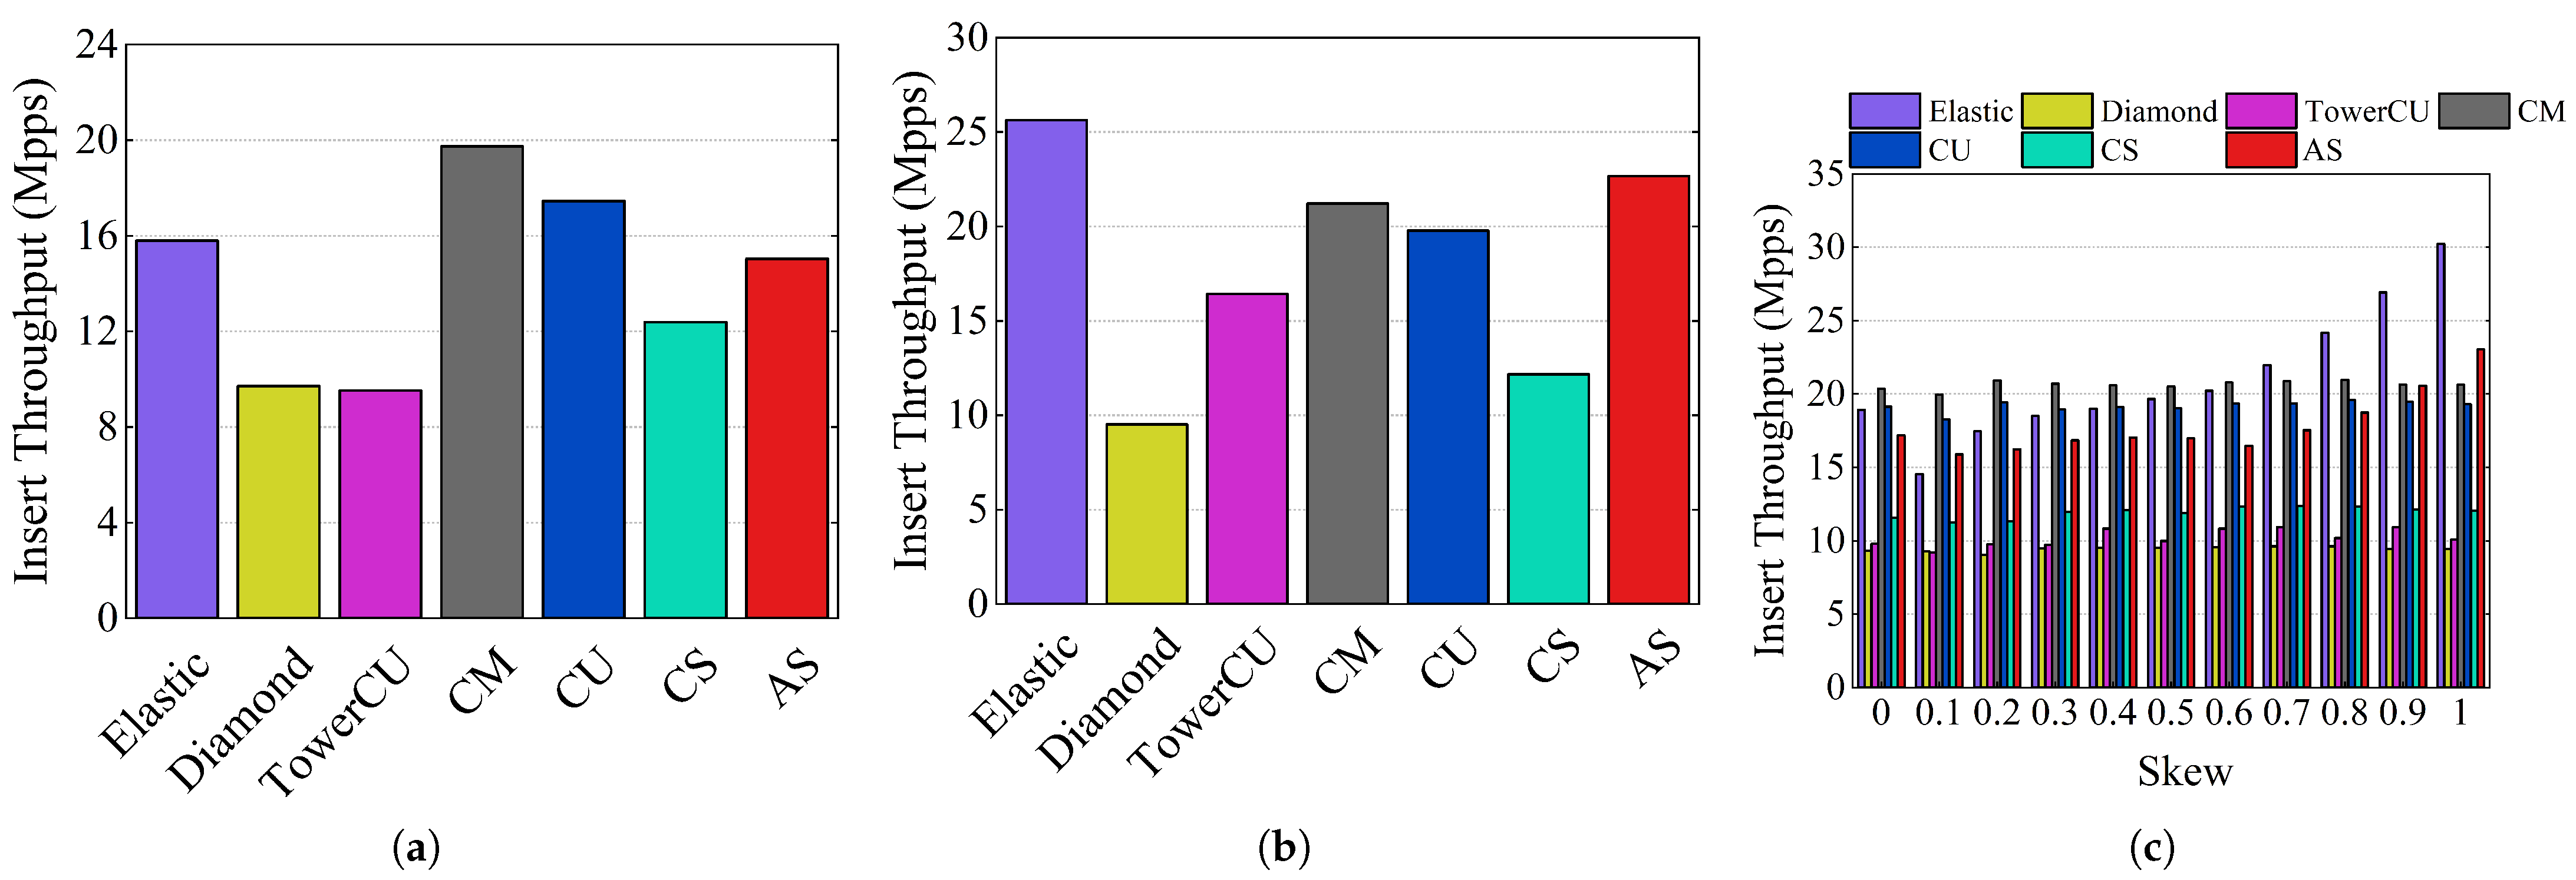
The experimental results of insertion throughput are shown in
Figure 13. In the CAIDA dataset, the CM insertion throughput was the highest at 19.74 Mpps, while AS and elastic had throughputs of 15.04 Mpps and 15.79 Mpps, respectively. The insertion throughputs of TowerCU and Diamond Sketch were significantly lower than that of AS, at 9.53 Mpps and 9.70 Mpps, respectively. For the webpage dataset, the insert throughput of AS was 22.67 Mpps, while the values of Elastic Sketch, TowerCU, Diamond Sketch, and CM were 25.63 Mpps, 16.44 Mpps, 9.51 Mpps, and 21.22 Mpps, respectively. The limited insert throughputs of TowerCU and diamond were caused by multiple hash calculations during insertion.
The insertion throughput values of the schemes for different skewness loads are shown in
Figure 13c. Due to the simplicity of CM and CU, their insertion throughput values are stable and maintained at high levels across varying levels of skewness. The insertion throughput of AS was 17.19 Mpps when skewness was 0, which was slightly smaller than 20.38 Mpps for CM. As the skewness increased, the insertion throughput of AS started to increase. When the skewness was 1, AS had a throughput of 23.04 Mpps, which was higher than the 20.62 Mpps of CM. Elastic Sketch is a hybrid structure, so its insert throughput follows a similar pattern to AS. The insert throughput of TowerCU was about 10 Mpps, which was much less than that of AS and elastic. The insertion throughput of AS increased with skewness, as more packets could be inserted directly when accessing. To summarize, the insertion throughput of AS is similar to that of Elastic Sketch and much higher than that of TowerCU.
4.4.2. Query Throughput
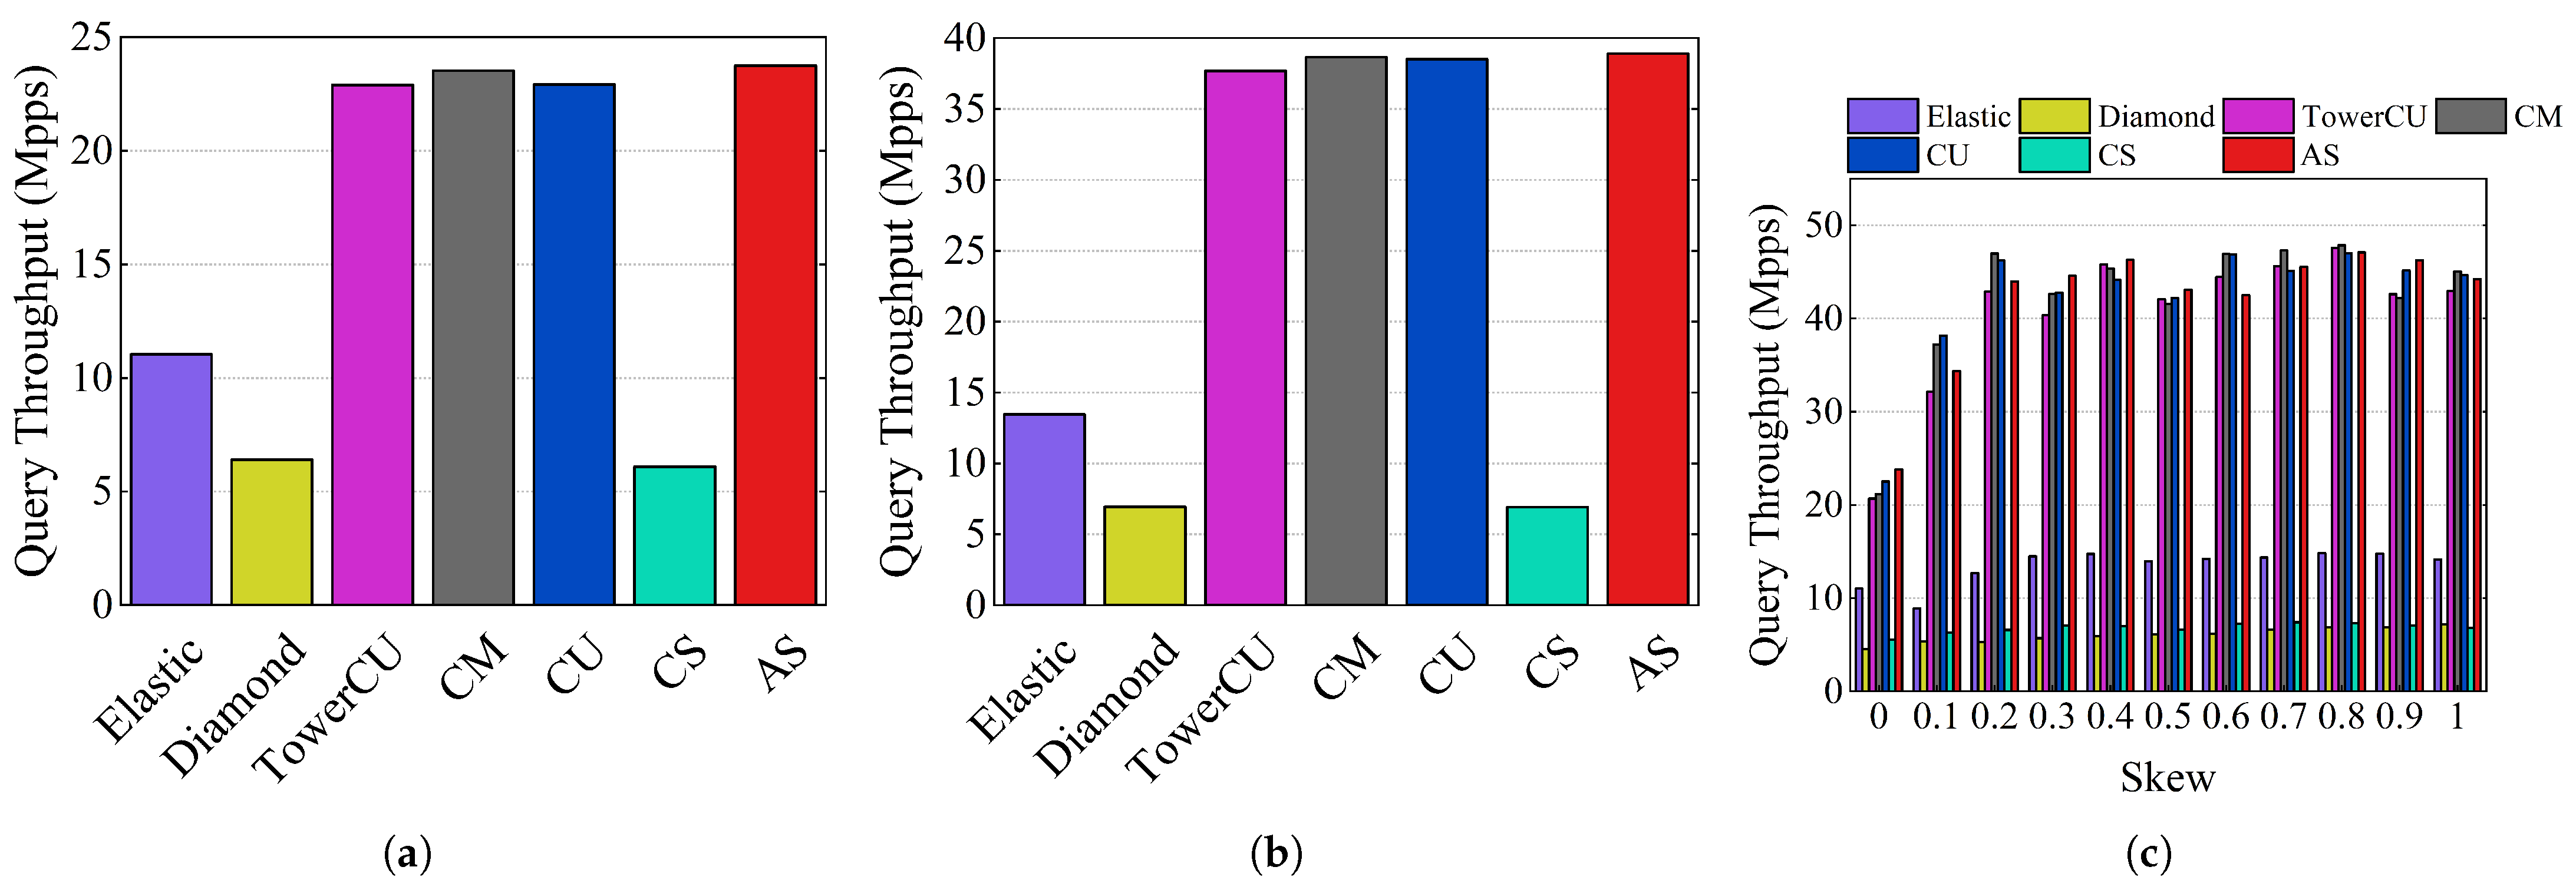
The experimental results of the query throughput are shown in
Figure 14. In the CAIDA dataset, the query throughput of AS was 23.76 Mpps, while the values of TowerCU, Diamond Sketch, Elastic Sketch, and CM were 22.89, 6.40, 11.05, and 23.53 Mpps, respectively. In the webpage dataset, the throughputs were 38.90, 37.69, 6.93, 13.46, and 38.65 Mpps, respectively. Since most of the flows were mouse flows and were recorded in the small part, Elastic Sketch first queried the large part, and there were many invalid flow ID matches, thereby reducing the query throughput. As shown in
Figure 14c, the query throughput of AS closely approximated CM, CU, and TowerCU across all levels of skewness, outperforming Elastic Sketch, Diamond Sketch, and CS. When skewness was 0, the query throughputs of AS, Elastic Sketch, Diamond Sketch, TowerCU, CM, CU, and CS were 23.83, 11.03, 4.56, 20.69, 21.18, 22.53, and 5.54 Mpps, respectively. AS can query the small part first and return results directly in most cases, thanks to AIQ. Thus, AS achieved a high query throughput. To summarize, the query throughput of AS is similar to that of TowerCU and much better than that of Elastic Sketch.
In conclusion, only the AS scheme achieved high insertion and query throughput among the schemes that adapted to the skewed distribution. The other schemes had either low insertion throughput, low query throughput, or both.
4.5. Air Sketch on the FPGA
To verify the feasibility of Air Sketch on the FPGA, we implemented Air Sketch on Xilinx Artix-7 with the following parameters:
d = 3,
= 1.2. The hardware circuit implementation of the Air Sketch was fully pipelined. The CU could not be implemented efficiently in a pipelined manner [
6], so the CU in the Air Sketch was replaced with the CM. The target device for the FPGA implementation was the Xilinx xc7k160t-fbg484-2, equipped with 101,400 Slice LUTs, 325 Block RAMs, and 202,800 slice registers. The development was conducted using Vivado 2023.1.
The resource utilization for Air Sketch is as follows: it consumes 2120 LUTs, which accounts for 2.09% of the 101,400 LUTs available; occupies 93.5 Block RAMs, representing 28.77% of the 325 BRAMs; and utilizes 1720 registers, which is less than 1% of the 202,800 available. Furthermore, Air Sketch supports a maximum clock frequency of 161.3 MHz without timing violations. Benefiting from full pipelining, which processes a packet in each clock cycle, Air Sketch achieves a peak throughput of 161.3 Mpps.
5. Conclusions and Future Work
A novel sketch named AS is proposed to accurately and quickly measure network traffic. AS mimics air floating and automatically identifies elephant flows. To improve both insert throughput and query throughput without SIMD, the AIQ algorithm is designed, and the global hash is applied. Additionally, a deterministic substitution strategy is used to ensure the detection accuracy of elephant flows. Extensive experimental results on real and synthetic datasets demonstrate that, compared with state-of-the-art schemes, AS accurately and stably measures both elephant and mouse flows while ensuring high insertion throughput and query throughput. Meanwhile, the feasibility of implementing AS on an FPGA is also verified.
For future work, implementing dynamic replacement thresholds would significantly enhance the adaptability and performance of network measurement. Meanwhile, applying the statistical results from network measurement to network attack detection represents a promising research direction with considerable potential for future investigation. Additionally, in order to cope with the requirements of the future ultra-high-speed network on the packet processing speed, we will optimize the deployment of AS on programmable switches.


