1. Introduction
Cervical cancer is a common and fatal cancer that affects women’s health and ranks fourth in the world in terms of incidence and mortality. It was estimated that, in 2020, there would be approximately 600,000 newly diagnosed cases and more than 340,000 deaths worldwide [
1,
2]. Its incidence and mortality rates vary across countries and regions and are related to factors such as the quality of local healthcare services, the extensiveness of screening and prevention programs, and the living habits and environmental conditions of the population [
3].
Initially, cervical cancer may not present obvious symptoms, but, when the disease progresses, it may cause problems such as abnormal vaginal bleeding, increased vaginal discharge, and pelvic pain. Early detection is critical for effective treatment and improved prognosis [
4]. Strong evidence shows that regular cervical cancer screening is effective in preventing and treating this disease, making it one of the most manageable and treatable types of cancer.
With the development of AI [
5,
6], more and more AI models are being applied to cervical cytology screening [
7]. AI can effectively reduce the burden on cytopathologists and improve diagnostic efficiency, providing automated screening for early assisted diagnosis. However, the transition to AI-driven diagnosis using digitized whole-slide images (WSIs) faces several significant challenges:
(1) WSI Quality: Variability in slide preparation, staining, and scanning can result in poor-quality WSIs (e.g., with uneven staining, artifacts, or insufficient cell density). This variability can seriously affect the reliability of AI analysis, potentially leading to missed detections or misclassifications.
(2) Data Scarcity and Imbalance: Currently, high-quality large-scale annotated datasets for cervical cytology are limited. This scarcity, coupled with the challenge of collecting sufficient examples of diverse abnormal cell types (especially rare but critical high-grade lesions), makes building balanced datasets difficult and hinders the training of robust and generalizable AI models. For example, the significant class imbalance observed in the instance distribution detected by the baseline model (YOLOv8) in our study vividly illustrates this challenge. This initial distribution, where common findings or lower-grade lesions vastly outnumber rarer high-grade abnormalities, highlights the data imbalance problem addressed by our subsequent strategies.
(3) Lack of Interpretability: Clinical diagnosis in cytopathology often relies on established rule-based reasoning. The “black-box” nature of many deep learning models makes it difficult for clinicians to understand and trust their predictions, posing a barrier to adoption.
To address these challenges, we propose an integrated automatic cervical cancer screening (IACCS) framework. This framework aims to provide a robust, adaptable, and interpretable solution for AI-assisted screening. The main contributions of this study include the following:
(1) Enhanced Quality Control: IACCS uses a binarization-based method for cell counting and an SVM approach to identify fuzzy image areas, enabling automated assessment of WSI quality and filtering out unreliable data inputs.
(2) Adaptive Learning Strategy: Leveraging data enhancement, an incremental learning mechanism and an active learning mechanism are proposed to progressively adjust the model parameters. This allows the model to continuously improve by learning from new data and expert feedback, addressing data scarcity and imbalance issues.
(3) Interpretable Rule Generation: A multi-objective evolutionary algorithm is utilized to generate interpretable diagnostic rules that offer explicit trade-offs between specificity and sensitivity, addressing the need for transparency in AI-based diagnostic support.
The remainder of the paper is organized as follows.
Section 2 provides an overview of the background, while
Section 3 outlines the related work.
Section 4 provides a detailed account of the implementation of IACCS.
Section 5 outlines the experimental design, which validates the effectiveness of IACCS. The final section of this study,
Section 6, provides a conclusion.
2. Background
Cervical cancer is a malignant tumor primarily caused by HPV (Human Papillomavirus), mainly occurring in the cervix. It is divided into two main types: squamous cell carcinoma and adenocarcinoma, with squamous cell carcinoma being the most common. This cancer has a prolonged precancerous stage characterized by significant changes in cell nuclei and irregular nuclear membrane contours.
Cervical cytology screening is a widely used procedure effective in detecting early precancerous lesions, which is crucial for preventing cervical cancer [
8]. It is recommended for women to undergo this screening regularly, using methods such as Pap smears or liquid-based cytology testing [
9].
With the advancement in imaging and digital processing technologies, cervical cancer screening samples can now be converted into digital slides through pathology scanners, greatly transforming the method of cervical cancer screening. Digital pathology reduces the workload of pathologists, improves diagnostic efficiency, and enables rapid and accurate examination of cervical cells [
10,
11].
The Bethesda System (TBS), introduced in 1988, marked a significant advancement in cervical cytology reporting [
12]. Abnormal cells can be classified into several types according to latest TBS [
13], including the following:
Atypical Squamous Cells of Undetermined Significance (ASC-US) in cervical cytology screening indicate possible low-grade squamous intraepithelial lesions (LSILs), characterized by unusual cytological features with an unspecified cause.
Atypical Squamous Cells-Cannot Exclude High-grade Squamous Intraepithelial Lesion (ASC-H) indicates a possible high-grade squamous intraepithelial lesion (HSIL) but remains undiagnosed.
Low-grade squamous intraepithelial lesion (LSIL) involves mild cytological abnormalities, mainly appearing in mature intermediate or superficial squamous cells. The features include nuclear enlargement, hyperchromasia, inconspicuous nucleoli, binucleation or multinucleation, and increased vacuolated cells, typically associated with HPV infection.
High-grade squamous intraepithelial lesion (HSIL) mainly occurs in immature basal parabasal cells or basal cells, presenting as sheets, single cells, or clustered dark crowded groups. The features include nuclear enlargement with decreased cytoplasmic volume, increased nuclear-to-cytoplasmic ratio, common nucleolar absence, and irregular nuclear membranes.
Squamous cell carcinoma (SCC) is the primary type of cervical cancer, accounting for approximately 90% of cases, often associated with HPV infection. Its cytological features include pleomorphic deeply staining nuclei, irregular nuclear clearing, multiple irregular nucleoli, cell keratinization, and keratin fragments.
In large-scale cervical cytology screening projects targeting the general population, the number of abnormal squamous cell cases far exceeds that of abnormal glandular cell cases, with ASC-US, LSIL, ASC-H, and HSIL being the four most common types. ASC-US and LSIL lesions typically occur in superficial or intermediate cells, while ASC-H and HSIL lesions typically occur in parabasal and basal cells. Our proposed IACCS is primarily based on these five types of lesions for auxiliary diagnosis.
3. Related Work
In cytopathology, conducting an analysis of the entire WSI remains a significant and complex task. For cervical cytology screening, rapid searching and accurate localization of suspicious abnormal cervical cells are crucial to ensuring the accuracy of screening. In the field of computer vision, object detection models have been widely studied and applied [
14]. These models not only accurately locate objects but also simultaneously predict their categories. In the detection of abnormal cervical cells, these object detection models have made significant progress [
15], providing reliable tools for the rapid and effective detection of abnormal cervical cells [
16,
17,
18].
The application of these methods is closely associated with a large amount of data, which means that insufficient training data may severely affect the performance of deep learning models. One challenge in applying deep learning to cervical cytology screening is the lack of effectively annotated data. Due to limited labeled data, the available datasets are consequently restricted, making it difficult for deep learning models to obtain sufficient training and leading to overfitting issues. Although transfer learning [
19] can compensate for certain data problems, it is still crucial to construct high-quality cervical cytometry datasets in complex clinical settings. Extensive cervical cancer screening involves a vast female population, making it difficult to collect a sufficient number of rare and severe cases, resulting in dataset imbalances [
20]. To address this issue, we introduce an incremental learning [
21,
22] mechanism in IACCS, which progressively learns based on new data without retraining the entire model. This method allows the model to continuously learn and quickly adapt to new contexts and data distributions.
An ensemble of multiple models is the most direct way to achieve integrated deep learning [
20,
23]. The key feature of ensemble learning is the diversity of individual networks, and various integration strategies can assist basic models in achieving better performance. Inspired by ensemble learning, we introduce an active learning [
24] mechanism into IACCS. In complex clinical scenarios, once the object detection model locates and predicts an object, we introduce a classification model for that predicted object. This classification model, through active learning based on expert-reviewed results, is used to distinguish abnormal cervical cells from normal cells. The active learning mechanism allows the model to selectively pick the most informative samples, focusing on those the model deems most challenging or uncertain.
Despite many studies applying deep learning methods to cervical cell studies, research on the interpretation and diagnostic application of model results is relatively limited. With the emergence of the first deep-learning-based WSI analysis method in cervical cell screening, automated cervical cell screening has entered a comprehensive WSI analysis stage. Unlike the above methods, we propose for the first time the use of multi-objective optimization [
25] to find interpretable diagnostic rules.
4. Proposed Method
In this section, we first outline the integrated automated cervical cancer screening framework we propose. Subsequently, we delve into the discussion of the evaluation module used for automatically assessing the quality of WSI. Following that, we will introduce the dataset established for abnormal squamous or glandular cells and provide a detailed description of the data processing strategies we have employed. Finally, we introduce a multi-objective optimization algorithm for generating diagnostic rules that have different trade-offs among sensitivity and specificity.
4.1. Framework Overview
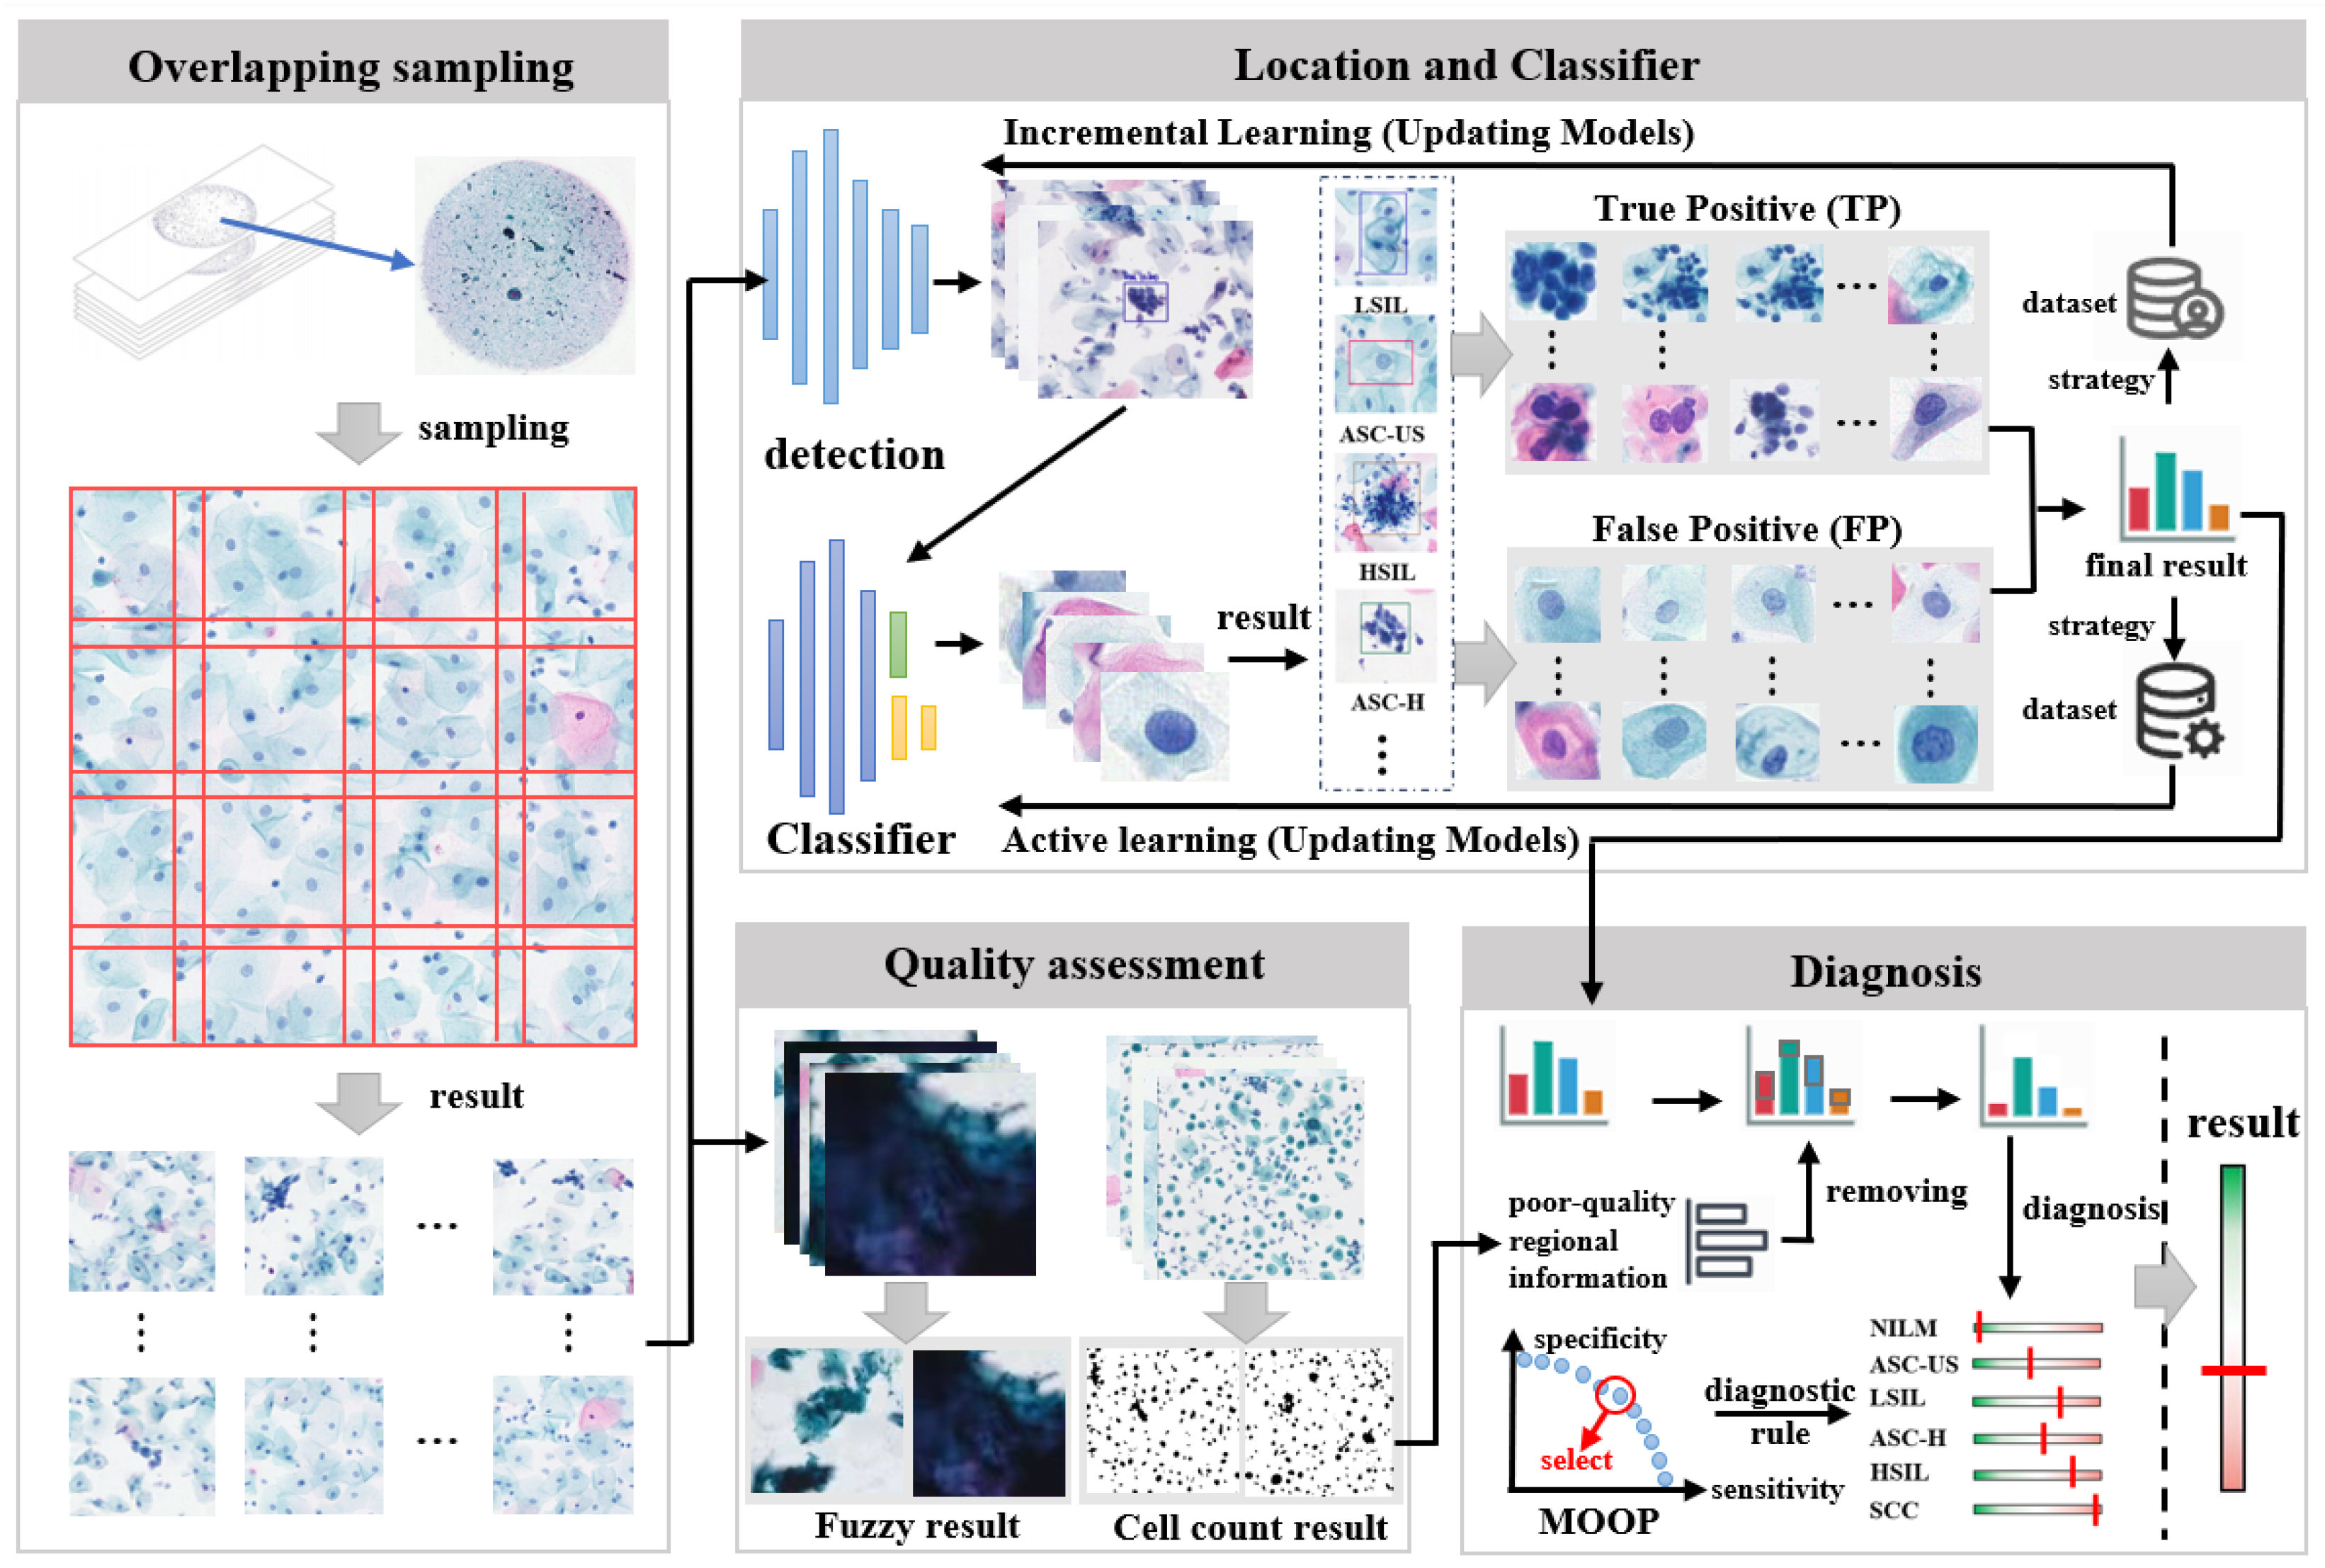
The IACCS framework is illustrated in
Figure 1. When there are new WSIs awaiting screening, the WSI is first subjected to preprocessing. This preprocessing involves removing edge portions to enhance detection efficiency and partitioning the WSI for subsequent detection. Subsequently, the quality of the WSI is assessed, including counting the number of cells and determining fuzzy areas. Meanwhile, the partitions are sequentially fed into a pre-trained object detection model to detect abnormal cervical cells. Next, the detected results of abnormal cervical cells are input into a classification model to further determine if they are abnormal. An expert will review these results, and data from rare and severe cases will be added to the object detection dataset for incremental learning, while cases of model misjudgment will be added to the classification dataset for active learning. Finally, a diagnostic rule for generating preliminary diagnosis results is formulated based on multi-objective optimization, considering various types and quantities of abnormal cervical cells.
4.2. Quality Assessment
In the quality assessment module, by statistically analyzing the cell count and determining the presence of fuzzy regions in the WSI, potential issues in the preparation process can be identified. This process contributes to enhancing the quality of WSIs, thereby bolstering the accuracy and reliability of subsequent analyses.
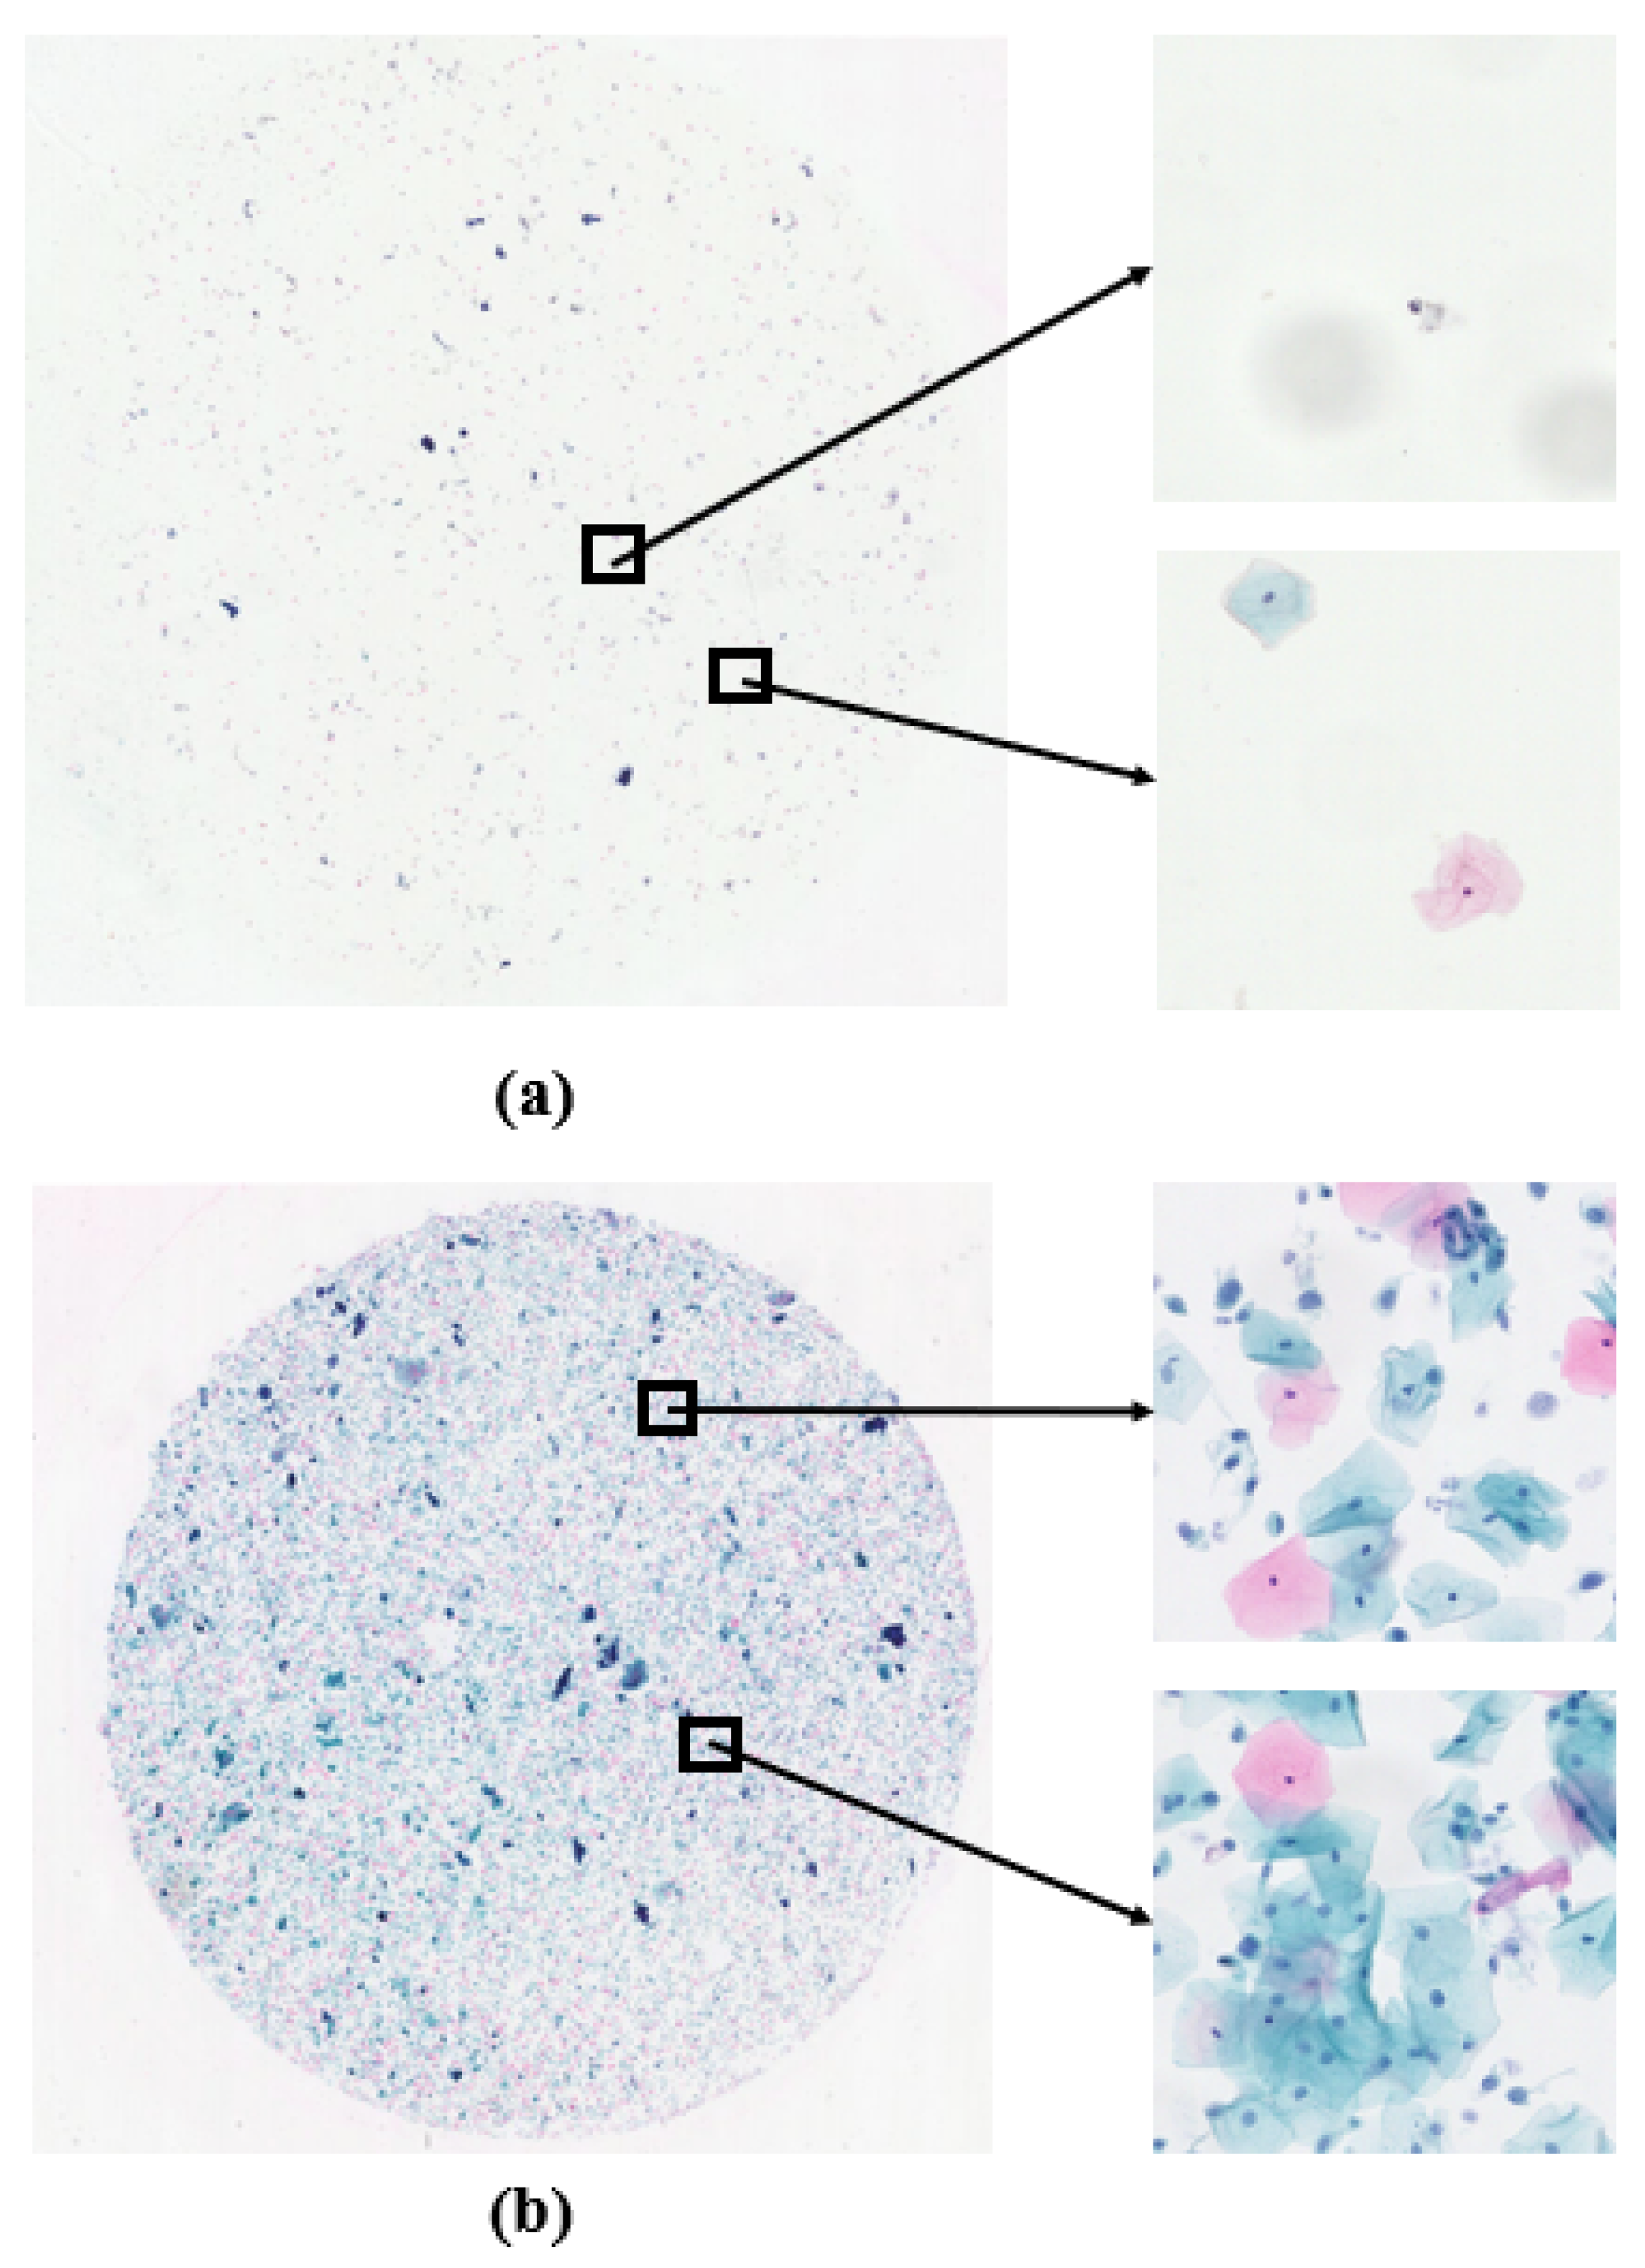
4.2.1. WSI Cell Count Statistics
Figure 2a shows the case of low cell density, while
Figure 2b represents the normal situation. Conducting cell counting on the WSIs not only helps to evaluate potential flaws in the sample preparation process, such as uneven cell dispersion or low cell density, but also serves as a reminder for operators to strengthen technical controls and quality management during preparation. Leveraging the characteristic of cell staining, where cell nuclei appear darker compared to other parts, we utilize traditional image analysis methods to perform cell counting. The main steps include, first, converting the color image to a grayscale image and applying erosion and dilation operations to remove noise; then identifying connected regions in the image through thresholding and Gaussian filtering, representing potential cell nucleus regions; next, filtering out potential cells based on the area of connected regions, excluding small-area noise; and, finally, counting the remaining connected regions to determine the number of cells in the image.
4.2.2. Fuzzy Region Determination
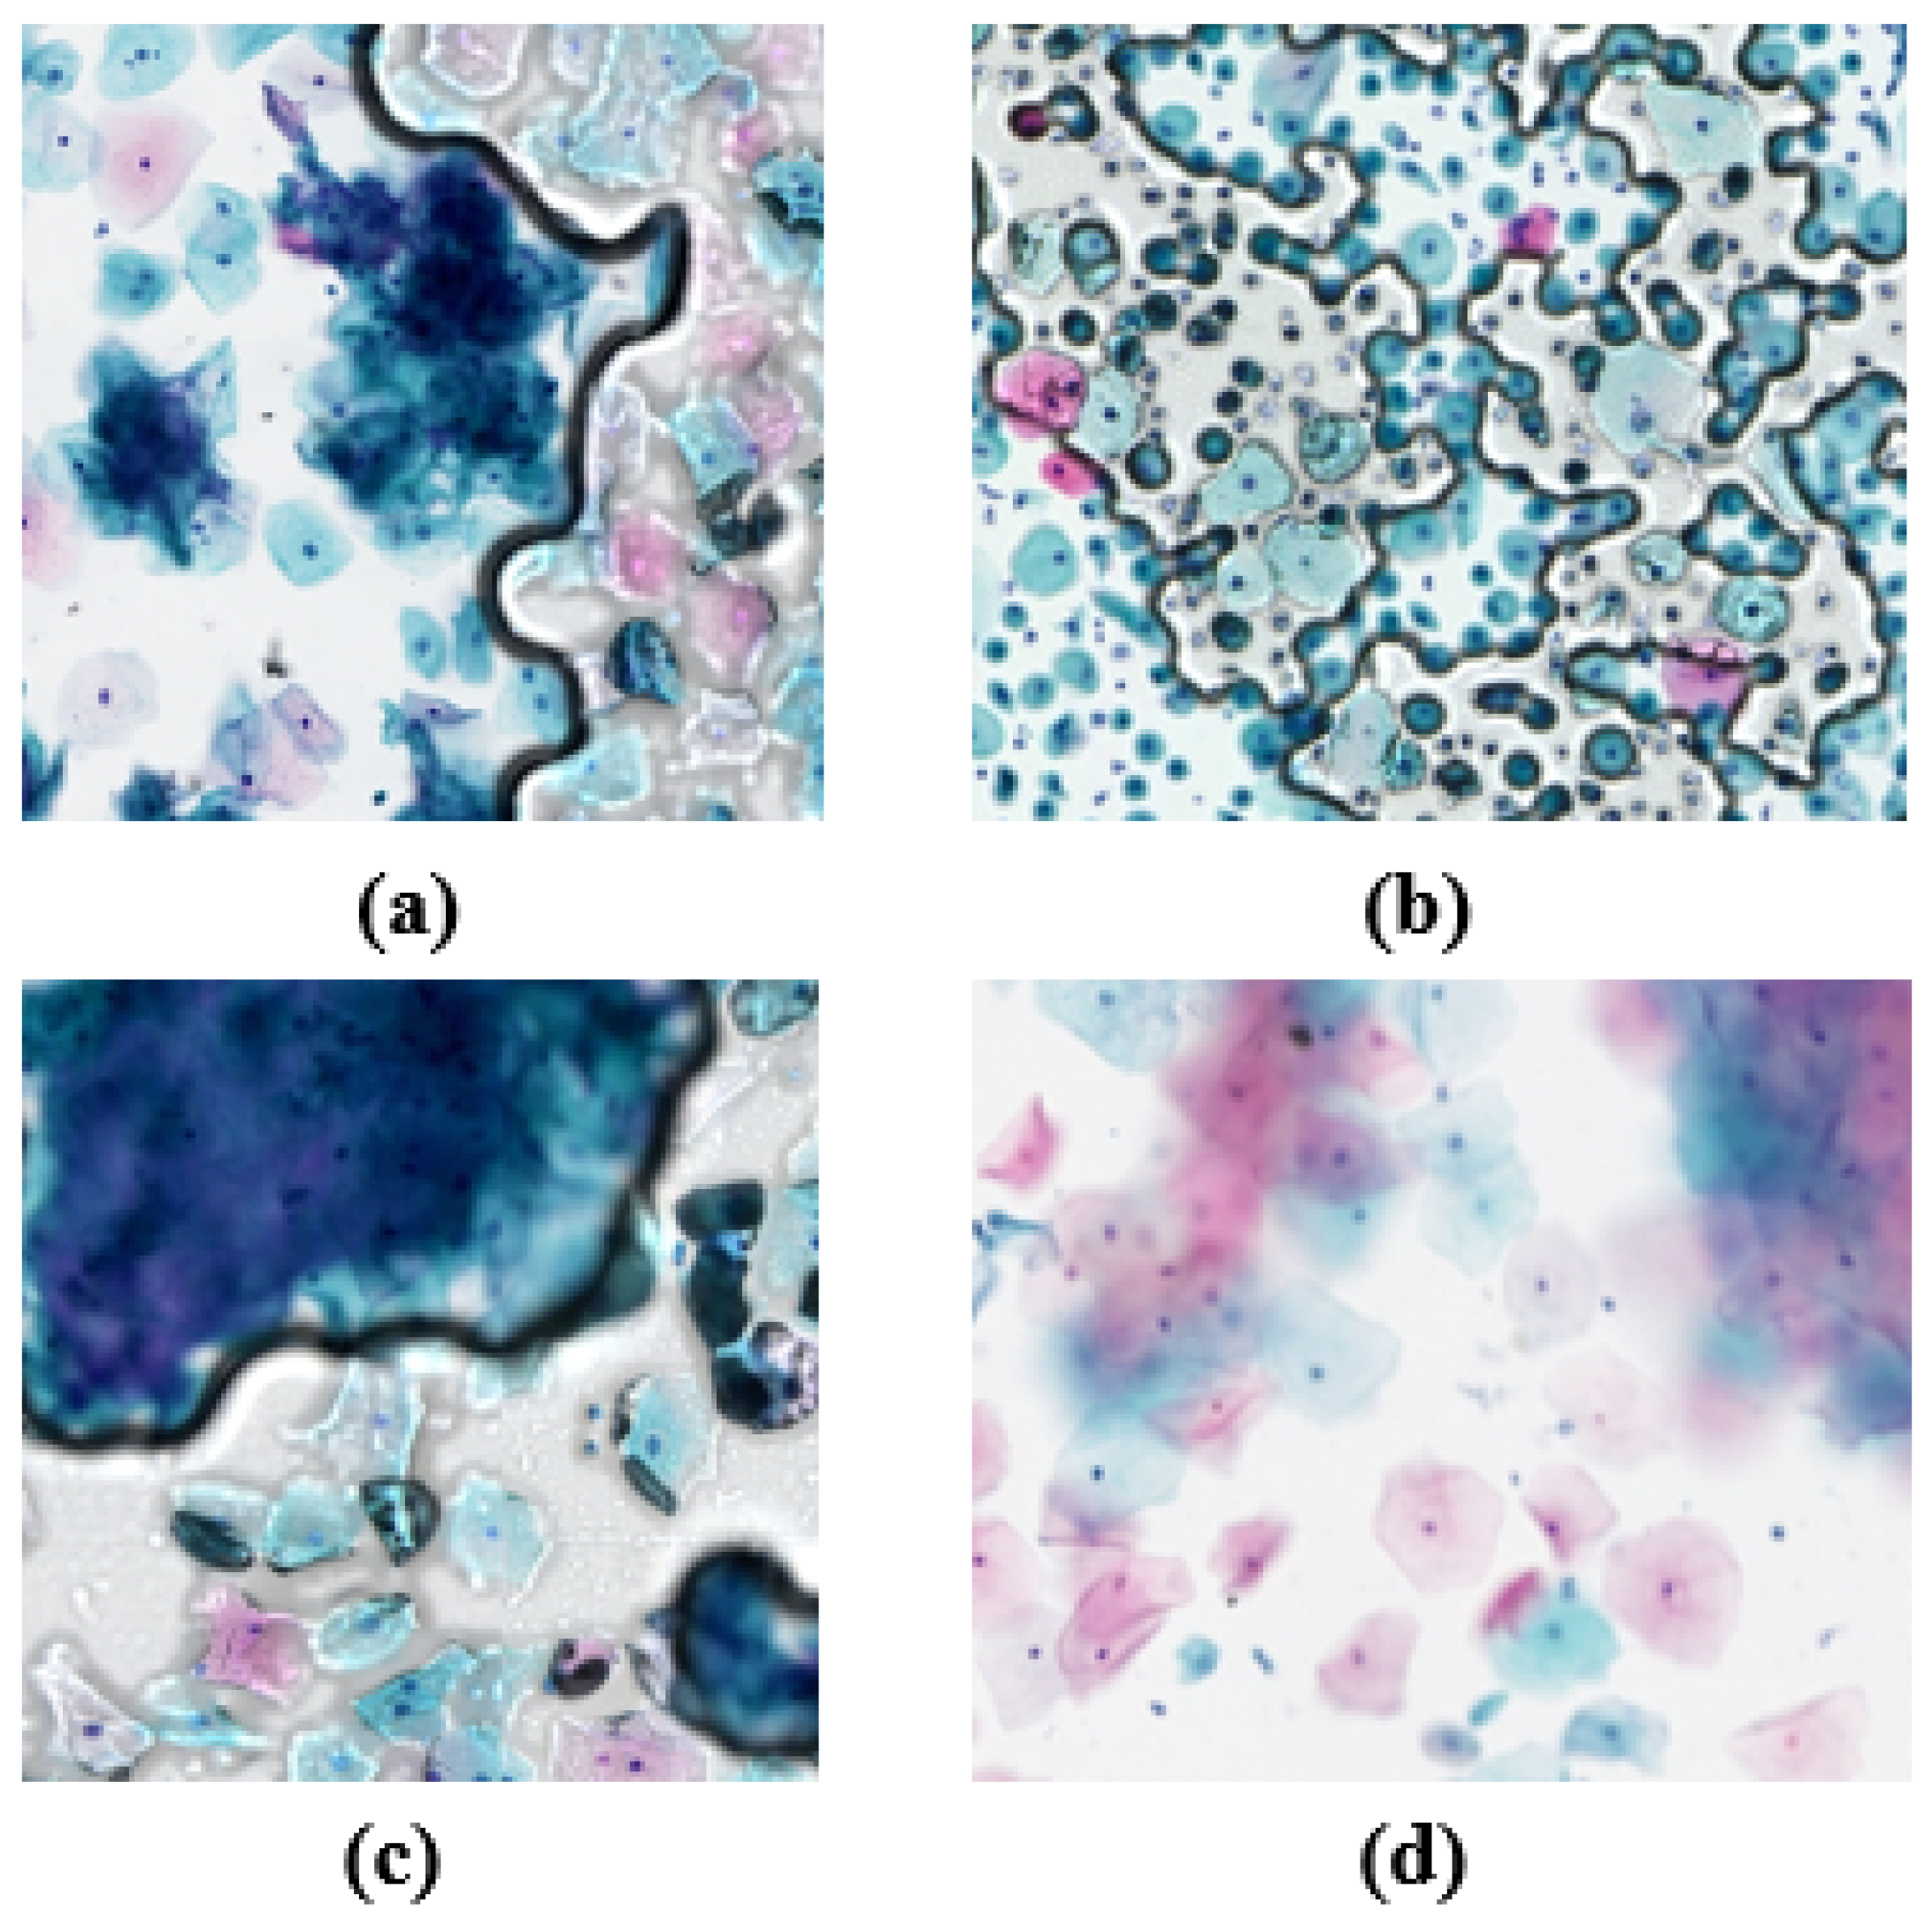
The presence of fuzzy regions may indicate poor image quality, possibly due to issues with imaging equipment (such as poor focus, vibration, or movement) or improper sample preparation (such as uneven tissue slicing or uneven staining). By determining fuzzy regions in WSIs, it is possible to effectively improve the accuracy and reliability of subsequent analyses. The fuzzy regions, as shown in
Figure 3, prompted the development of a method for determining image blurriness based on gradient features and Support Vector Machine (SVM). This method first converts the image into a grayscale image. To evaluate image clarity, four gradient features are employed as follows:
The equation for calculating the Brenner gradient is as follows:
where
B represents the calculation result of the Brenner gradient, serving as an indicator of the overall sharpness of the image.
x represents the horizontal coordinate, and
y represents the vertical coordinate.
denotes the intensity or grayscale value of the pixel at coordinates
. For each pixel in the image, we find the intensity of the pixel two positions to its right and calculate the square of the intensity difference between them. Then, summing up all these squared differences yields a total
B. A larger total
B indicates higher image contrast, typically implying greater image sharpness.
The equation for calculating the Laplacian gradient is as follows:
where
represents the result after processing with the Laplacian operator, typically used in image processing to indicate the edge intensity at position
.
is an element in the kernel matrix, where the kernel is a 3 × 3 matrix used to multiply with the corresponding region of the image to compute the edge intensity. By applying the kernel matrix to each pixel and its neighborhood, new pixel values are calculated for detecting edges and textures in the image.
The equation for calculating the SMD is as follows:
where
stands for Sum of Modified Laplacian, which is a measure of image sharpness.
represent pixel positions on the image.
is the pixel value of the image at coordinates
. This equation evaluates image sharpness by calculating the squared sum of changes (gradients) in pixel values in both horizontal and vertical directions, indicating that higher
values typically imply higher image sharpness or contrast as this indicates larger variations between pixel values.
The equation for calculating the SMD2 is as follows:
is an enhanced version of the Sum of Modified Laplacian method used to measure image sharpness. Image sharpness is evaluated by calculating the differences between each pixel and its surrounding pixels and summing the absolute values of these differences. Higher values typically indicate more edge or texture information in the image, thus higher image sharpness.
The extracted gradient features are normalized to meet the input requirements of the SVM model. The SVM model, trained on fuzzy data, is used to classify whether images are clear or fuzzy. By inputting standardized features, the model can effectively determine whether images are clear or fuzzy.
4.3. Detection of Abnormal Cervical Cells
As mentioned above, given the significantly higher number of abnormal squamous cell cases compared to abnormal glandular cell cases in large-scale cervical cell screening projects, we focus on ASC-US, LSIL, ASC-H, HSIL, and SCC and have accordingly constructed a dataset. We selected initial data, consisting of 500 positive WSIs and 500 negative WSIs. To establish the dataset, we partitioned the WSIs with a 50% overlap (640 × 640 pixels) and selected the partitions annotated with abnormal cervical cells. Regarding the processing of new WSIs, it follows Algorithm 1, where, in lines 1–10, the WSIs are initially partitioned, followed by detection on each partition. Subsequently, in lines 11–18, the detected results with the same object are merged. Finally, in lines 19–25, each detection result undergoes further classification to obtain the ultimate detection outcome.
| Algorithm 1 Whole-slide images (WSIs) to be inspected |
| Input: WSI X, the height of WSI , the width of WSI , the size of the blocks: , Overlap: |
| Output: detection results: boxes |
- 1:
, , - 2:
While
- 3:
- 4:
While - 5:
- 6:
- 7:
- 8:
EndWhile - 9:
- 10:
EndWhile - 11:
For m in - 12:
For n in - 13:
If and - 14:
- 15:
- 16:
EndIf - 17:
EndFor - 18:
EndFor - 19:
For k in - 20:
If is abnormal - 21:
- 22:
Else - 23:
- 24:
EndIf - 25:
EndFor - 26:
End
|
4.3.1. Data Enhancement
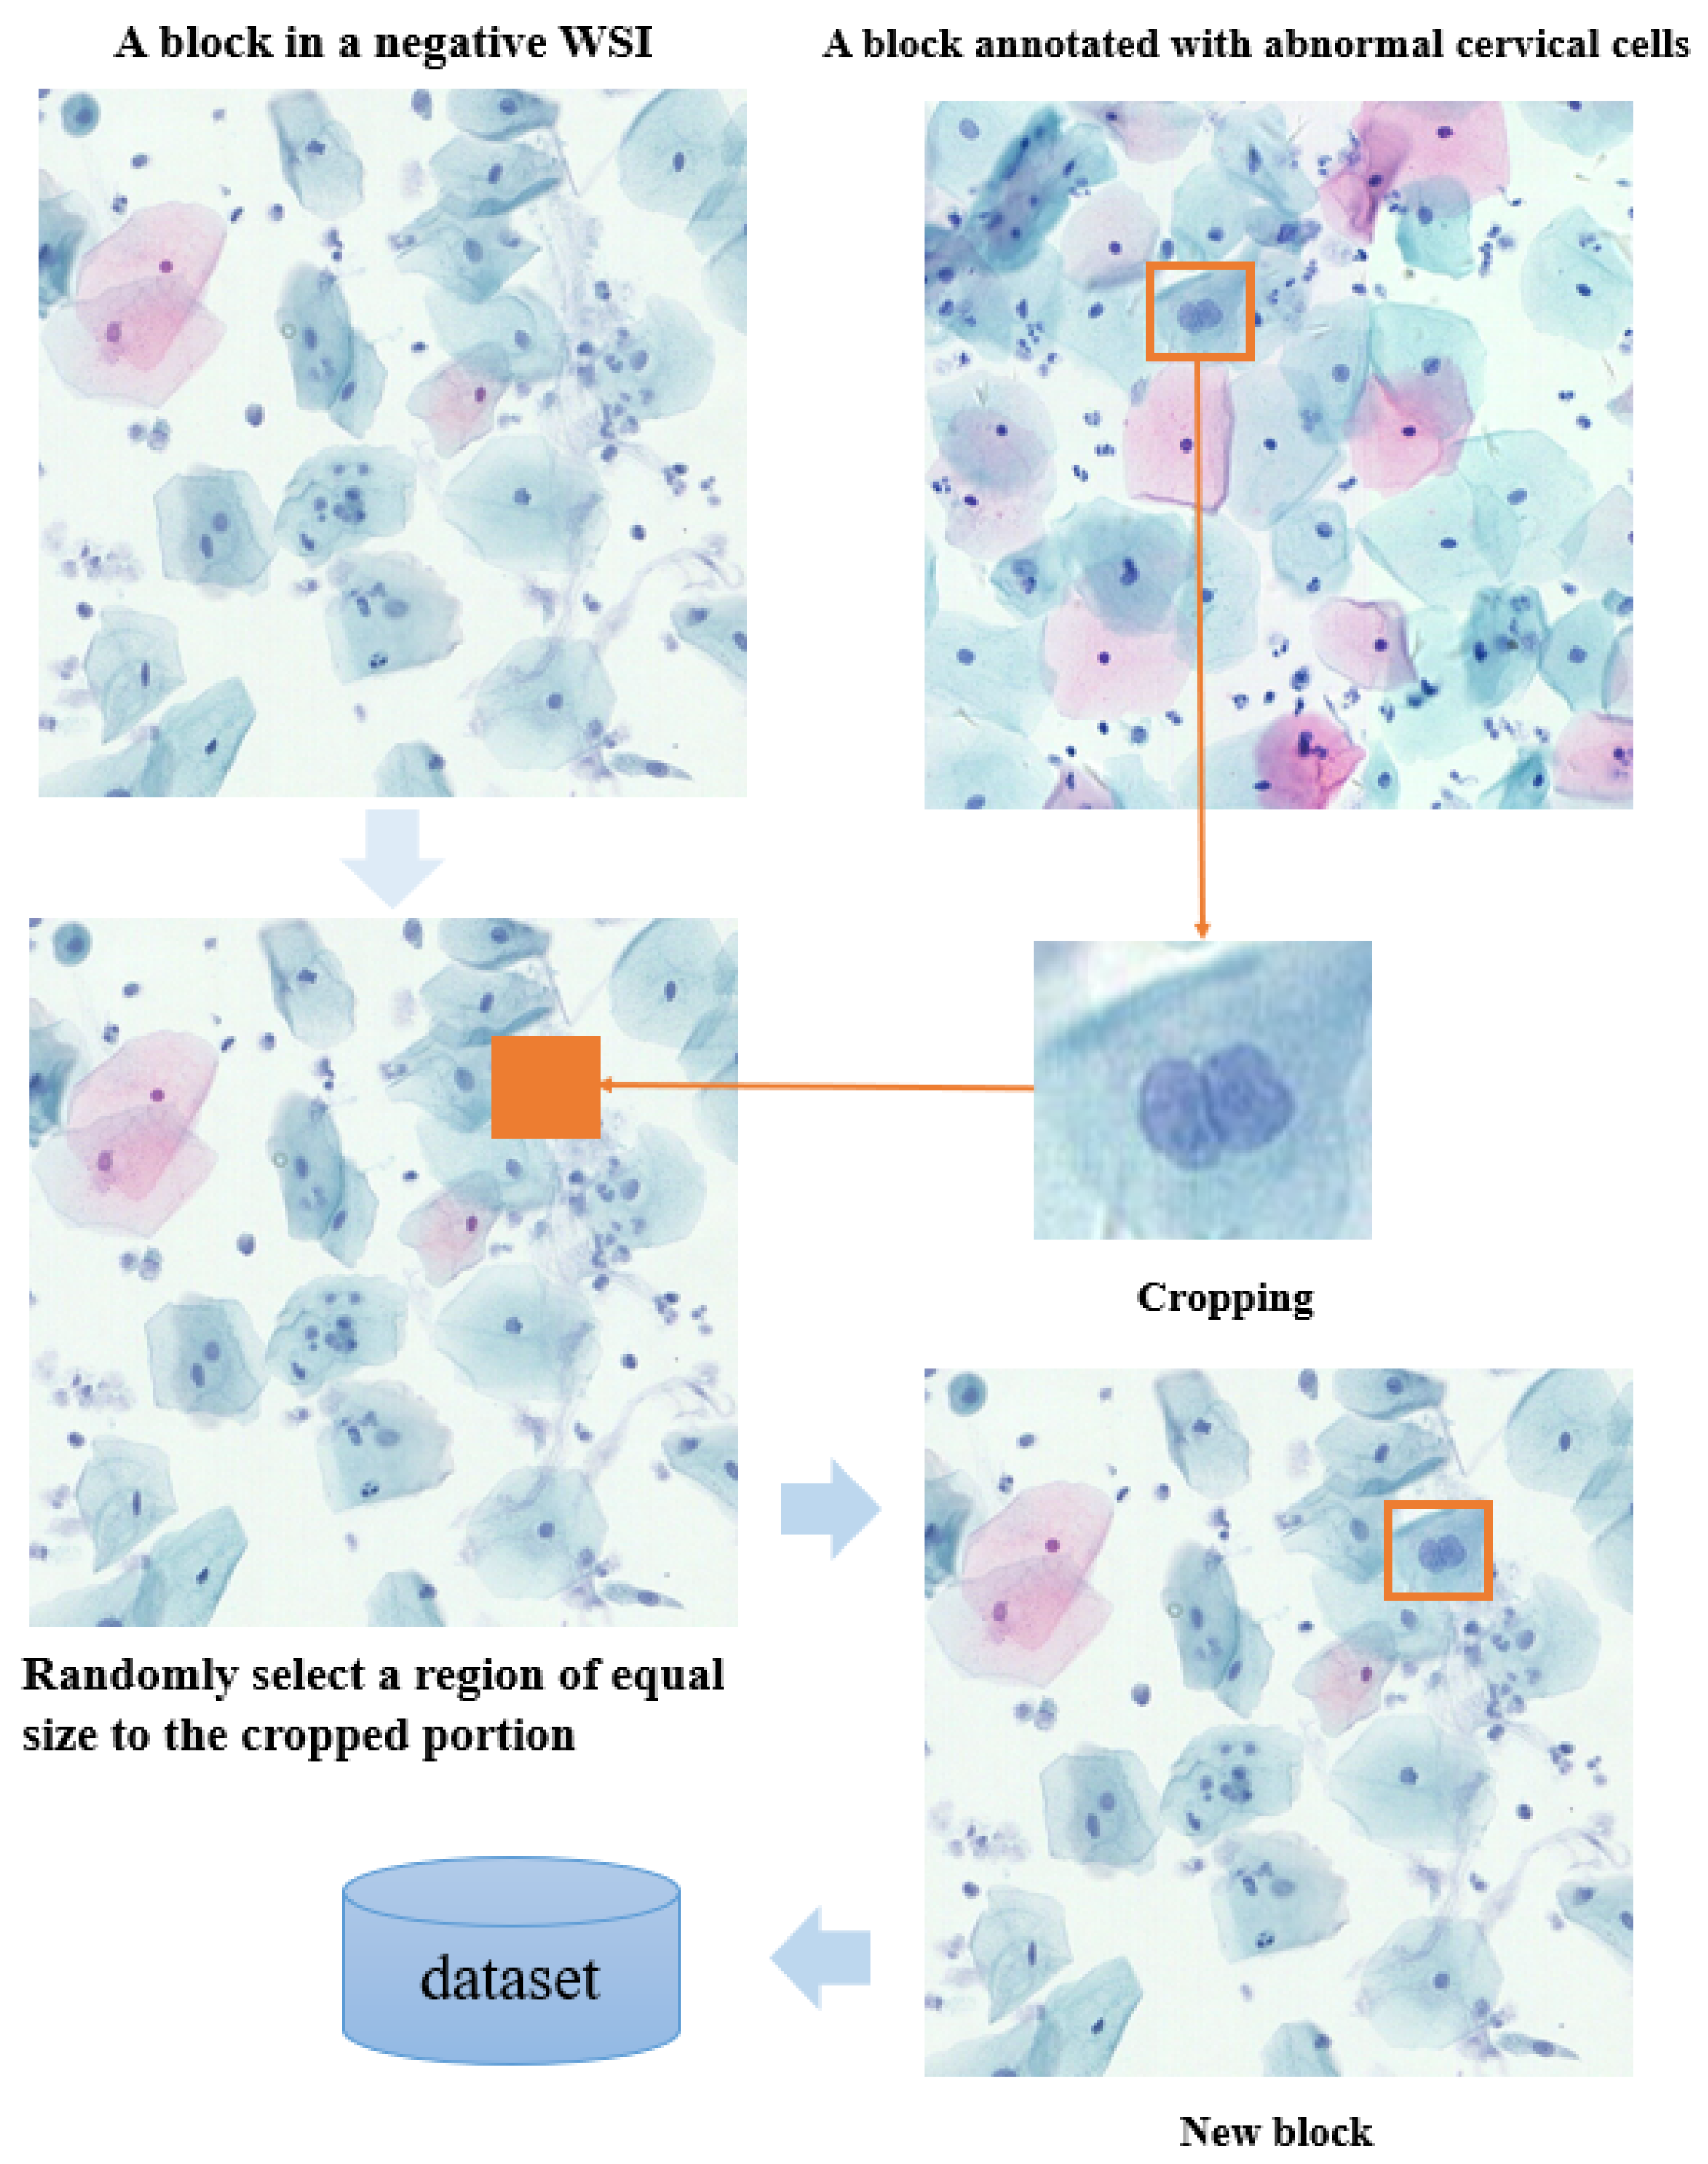
In cervical cell detection, positive annotation refers to images containing annotations of abnormal cervical cells, while negative blocks refer to images without abnormal cells. CutMix technology allows the replacement of positive annotations into a random region of negative blocks, as shown in
Figure 4. By incorporating positive annotations into the background of negative blocks, training sample diversity is increased, and the balance between positive and negative samples is improved. This helps the model to better learn the features of abnormal cells and reduces training biases caused by class imbalances. Additionally, embedding positive annotations into negative blocks enables the model to learn features of both normal and abnormal cells simultaneously, enhancing model robustness to correctly identify abnormal cells even in the absence of anomalies. By introducing CutMix, the generated mixed images retain the label information of the original images but are not exact duplicates. This helps to reduce the risk of overfitting and improves the model’s generalization ability to unseen data.
4.3.2. Incremental Learning
Due to the limited amount of annotated data and the relatively small number of severe cases, the distribution of the dataset is uneven. To address this issue, we introduced an incremental learning mechanism into IACCS. This mechanism enables progressive learning based on new data, gradually integrating data detected as rare or severe cases and reviewed by experts into the original dataset. This allows the model to continuously learn and quickly adapt to new situations and data distributions. Let represent the current dataset of the model and denote the set of samples reviewed by experts. Let N represent the number of categories in the dataset, denote the number of samples in the i th category, and represent the proportion of the i th category.
When relatively small proportions of categories are detected, we aim to incorporate these new data into the original dataset for learning. For each category
i, we can calculate its proportion in the new dataset,
. If
is less than a certain threshold
, we add the samples of that category to the set of samples reviewed by experts
, i.e.,
Here, the union symbol indicates that is formed by collecting all samples that satisfy the condition () across all relevant categories i (from 1 to N) in the new data . represents the set of samples belonging to category i in the new data.
4.3.3. Active Learning
After conducting cervical cell detection on the WSI, we introduced the ResNet50 model to classify cells and determine if they are abnormal. If the ResNet50 model classifies a cell as abnormal, the sample is retained; otherwise, it is removed. To improve the performance of the classification model, we employed active learning mechanism. It selects the most informative samples based on the current model’s prediction uncertainty or other metrics and actively requests expert annotations to minimize the number of labeled samples. We chose abnormal cervical cells detected in negative blocks and those confirmed by experts as errors in positive blocks as normal cervical cells. Let
represent the current dataset of the model,
denote the set of positive block samples after expert review,
represent the set of abnormal cervical cells detected in negative blocks, and
represent the set of abnormal cervical cells confirmed as errors in positive blocks. Then, the new sample set
can be expressed as
where samples in
are selected under the condition that the confidence
O is greater than or equal to the threshold
, i.e.,
The active learning process utilizes the selection strategy of Equations (
6) and (
7) to actively learn problematic cases, further classifying and filtering the detection results to improve accuracy.
4.4. Diagnostic Rules
After completing the detection of abnormal cervical cells in WSI, automatic diagnosis based on the detection results is required. This diagnosis is based on the counts of five types of abnormal cervical cells (i.e., five variables) and rules corresponding to different lesion grades. The evaluation of diagnosis results mainly relies on two objective functions: sensitivity and specificity. The calculation of sensitivity and specificity is as follows:
and
We take another thousand WSIs and aim for the diagnostic rules to maximize the sensitivity and specificity of the diagnostic results for this batch of WSIs; i.e., the optimization objective is to minimize
and
. Therefore, this problem can be transformed into a multi-objective optimization problem, which satisfies the following:
We utilize the Pareto dominance relationship to obtain a set of mutually non-dominating solutions. Pareto optimality ensures that specificity (sensitivity) is improved without decreasing sensitivity (specificity). Our problem can be addressed through the following steps to obtain the Pareto-optimal solution set. Firstly, compute the objective function values for each candidate solution x, where and represent the reciprocals of sensitivity and specificity, respectively. Based on the computed objective function values, categorize all candidate solutions into different non-dominated solution sets. A solution is considered non-dominated over another solution x if and . For each non-dominated solution set, select the Pareto-optimal solution set, comprising solutions that cannot be dominated by other solutions. Specifically, from each non-dominated solution set, choose solutions that satisfy the following conditions: there is no other solution x such that and ; there is no other solution x such that and .
The final set of solutions obtained through the multi-objective optimization algorithm GDE3 [
26] is the set of Pareto-optimal solutions, where the solutions show the best sensitivity and specificity. GDE3 was selected due to its demonstrated effectiveness in handling multi-objective problems through its differential evolution mechanism, which can efficiently explore the complex parameter space of diagnostic rules [
26]. It is important to note that our proposed framework is designed to be general, and other multi-objective optimization algorithms, such as NSGA-II or SPEA2, could also be readily integrated and applied. In this study, we utilized GDE3 primarily as a means to validate the framework’s capability to generate effective and interpretable diagnostic rules. Each solution
x corresponds to a diagnostic rule, where
includes the quantity of each type of abnormal squamous cell. When diagnosing a new WSI, diagnosis proceeds according to Algorithm 2 and the selected rule
x. In Algorithm 2, the first step is to perform statistical analysis of the detection results of various abnormal cervical cells (as seen in lines 2 to 4). Subsequently, diagnoses are conducted based on the quantity of each type of abnormal squamous cell, ranked by severity from high to low (as seen in lines 6 to 26), ultimately resulting in the graded diagnostic outcome of the WSI.
| Algorithm 2 Automated diagnosis |
| Input: detection results , diagnostic rule x |
| Output: Positive Grading |
- 1:
- 2:
For in - 3:
- 4:
EndFor - 5:
- 6:
If
- 7:
- 8:
Else - 9:
If - 10:
- 11:
Else - 12:
If - 13:
- 14:
Else - 15:
If - 16:
- 17:
Else - 18:
If - 19:
- 20:
Else - 21:
- 22:
EndIf - 23:
EndIf - 24:
EndIf - 25:
EndIf - 26:
EndIf - 27:
End
|
5. Experiments and Analysis
To validate the effectiveness of our integrated automatic cervical cancer screening framework, we introduce the achieved results from the following three aspects. Firstly, quality assessment is implemented to automatically judge the quality of WSIs. Secondly, we present the situation of the established datasets for abnormal cervical cells, along with the corresponding improvements we made and their effects. Finally, we demonstrate the specificity and sensitivity of the diagnostic rules found through multi-objective optimization.
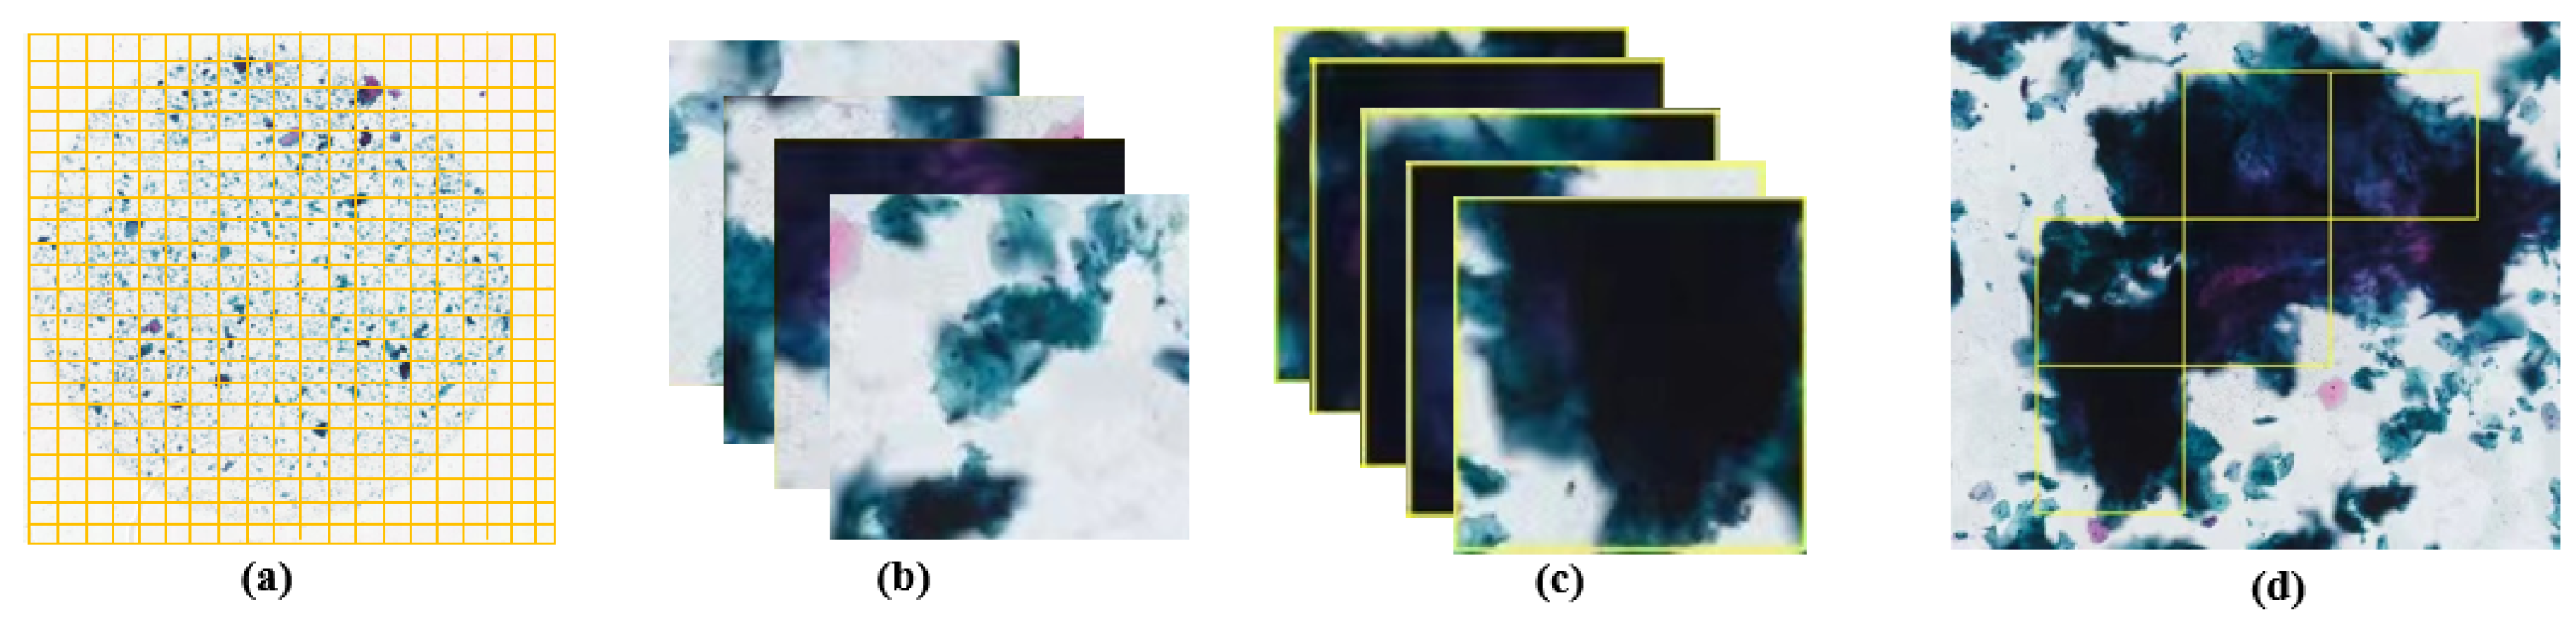
5.1. WSI Cell Count Statistics
As shown in
Figure 5a, four segmented images from two types of WSIs (those with fewer instances and those with normal cell quantities) are displayed. These segmented images are then converted into grayscale images, as depicted in
Figure 5b. Subsequently, we applied erosion and dilation operations to the images using a 2 × 2 matrix of all ones as the kernel, iterating each operation five times to eliminate noise and unnecessary details from the images. Next, the images were thresholded at 155/255 to convert them into binary images, further highlighting the contours of the cells, as shown in
Figure 5c. Following this, a 3 × 3 Gaussian filter was applied to the binary images for smoothing, reducing the influence of noise. Finally, by identifying connected components in the images and excluding components with an area less than 25 pixels, we removed smaller noise or non-cellular areas. We then plotted and quantified the connected components, the results of which are illustrated in
Figure 5d. Based on the darker color of the cell nuclei compared to the background and cytoplasm, our method can achieve cell count statistics with minimal computational resources. This approach not only eliminates the cost of manual annotation but also operates independently of algorithmic models.
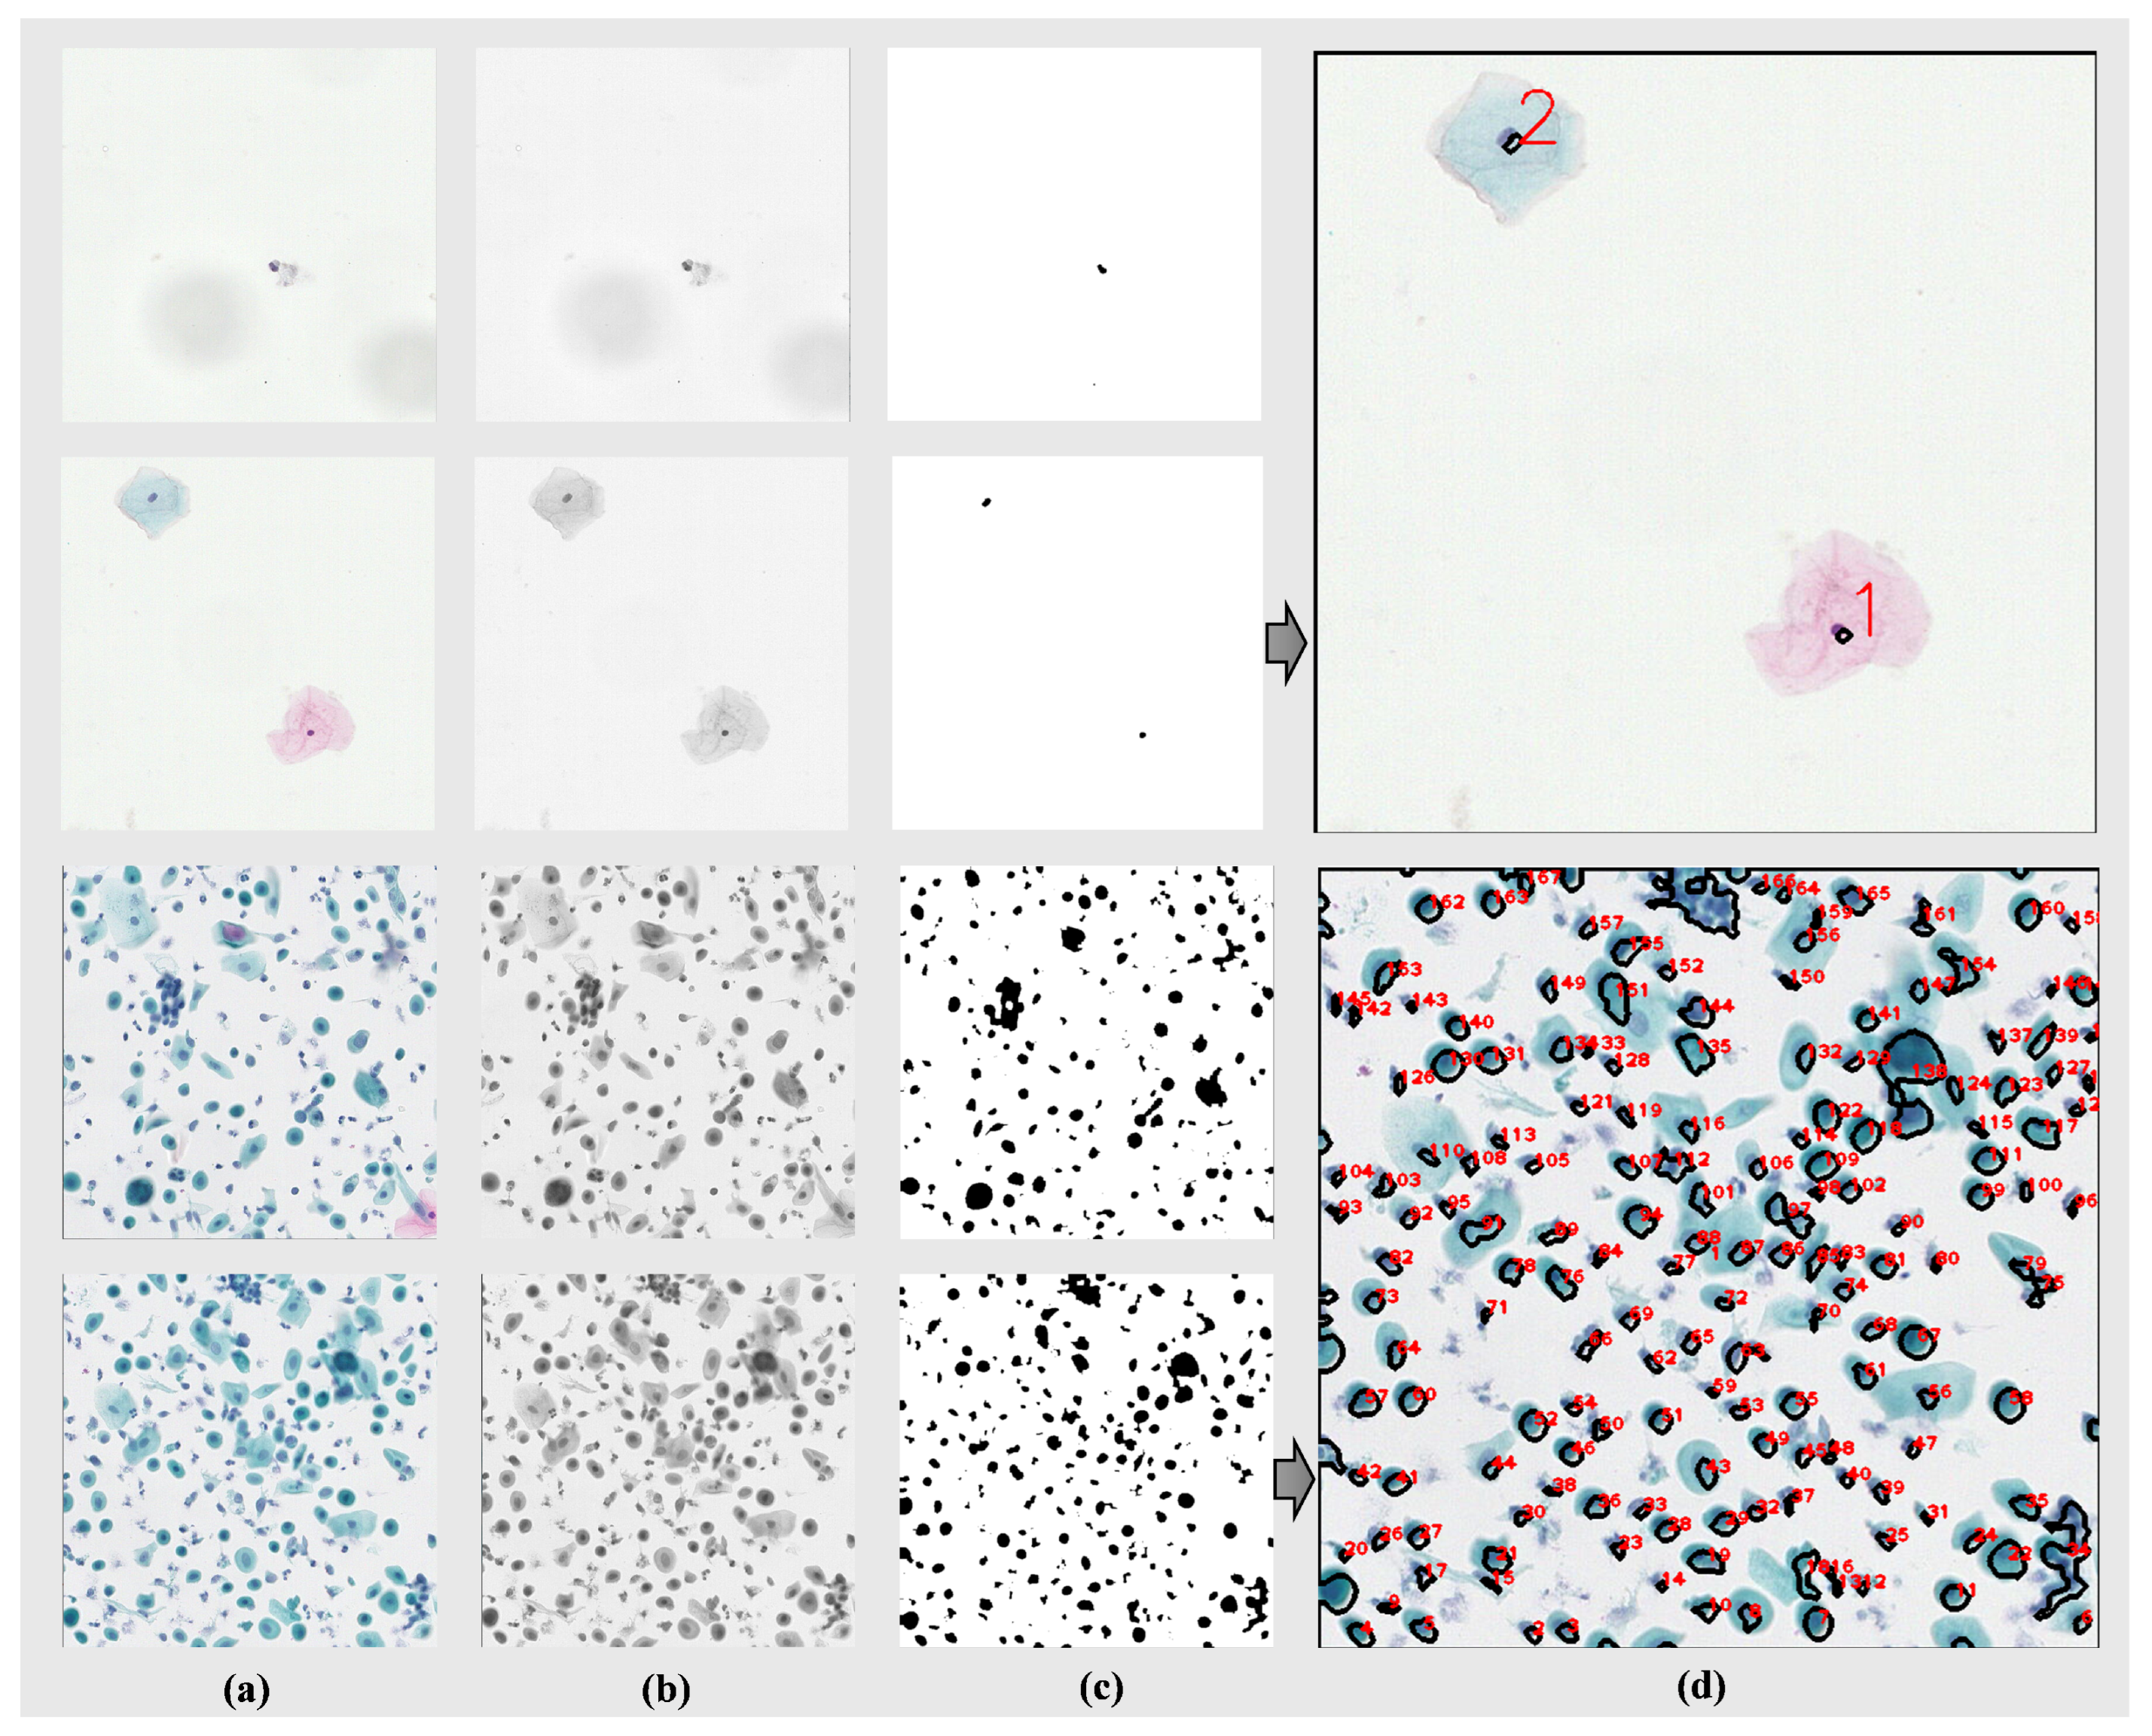
5.2. Fuzzy Region Determination
The process of determining fuzzy regions is illustrated in
Figure 6. Firstly, the WSI is segmented, as shown in
Figure 6a. Then, each segment is processed sequentially using four different gradient functions (Brenner, Laplacian, SMD, and SMD2) to extract gradient features from the images. Subsequently, the extracted gradient feature data are normalized, and a pre-trained SVM model is utilized for fuzzy region determination.
Figure 6b displays the non-fuzzy segments, while
Figure 6c illustrates the fuzzy segments. Following the assessment of all the segments, the fuzzy regions are annotated, as depicted in
Figure 6d. When the proportion of fuzzy to WSI was small, we removed the abnormal cervical cells whose detection was in the fuzzy region, and, when the proportion was too large, the WSI was considered to be of poor quality. The determination of the fuzzy region was thus realized.
5.3. Object Detection
We chose YOLOv8 as the object detection model and created a dataset of 500 positive WSIs with annotations and 500 negative WSIs. We divided the dataset into training, validation, and test sets according to the ratio of 7:2:1. The dataset included abnormal squamous cells (ASC-US, ASC-H, LSIL, HSIL, and SCC), glandular cells (AGC-NOS), microbial infections (Candida and Trichomonas), and normal squamous cells (NILM).
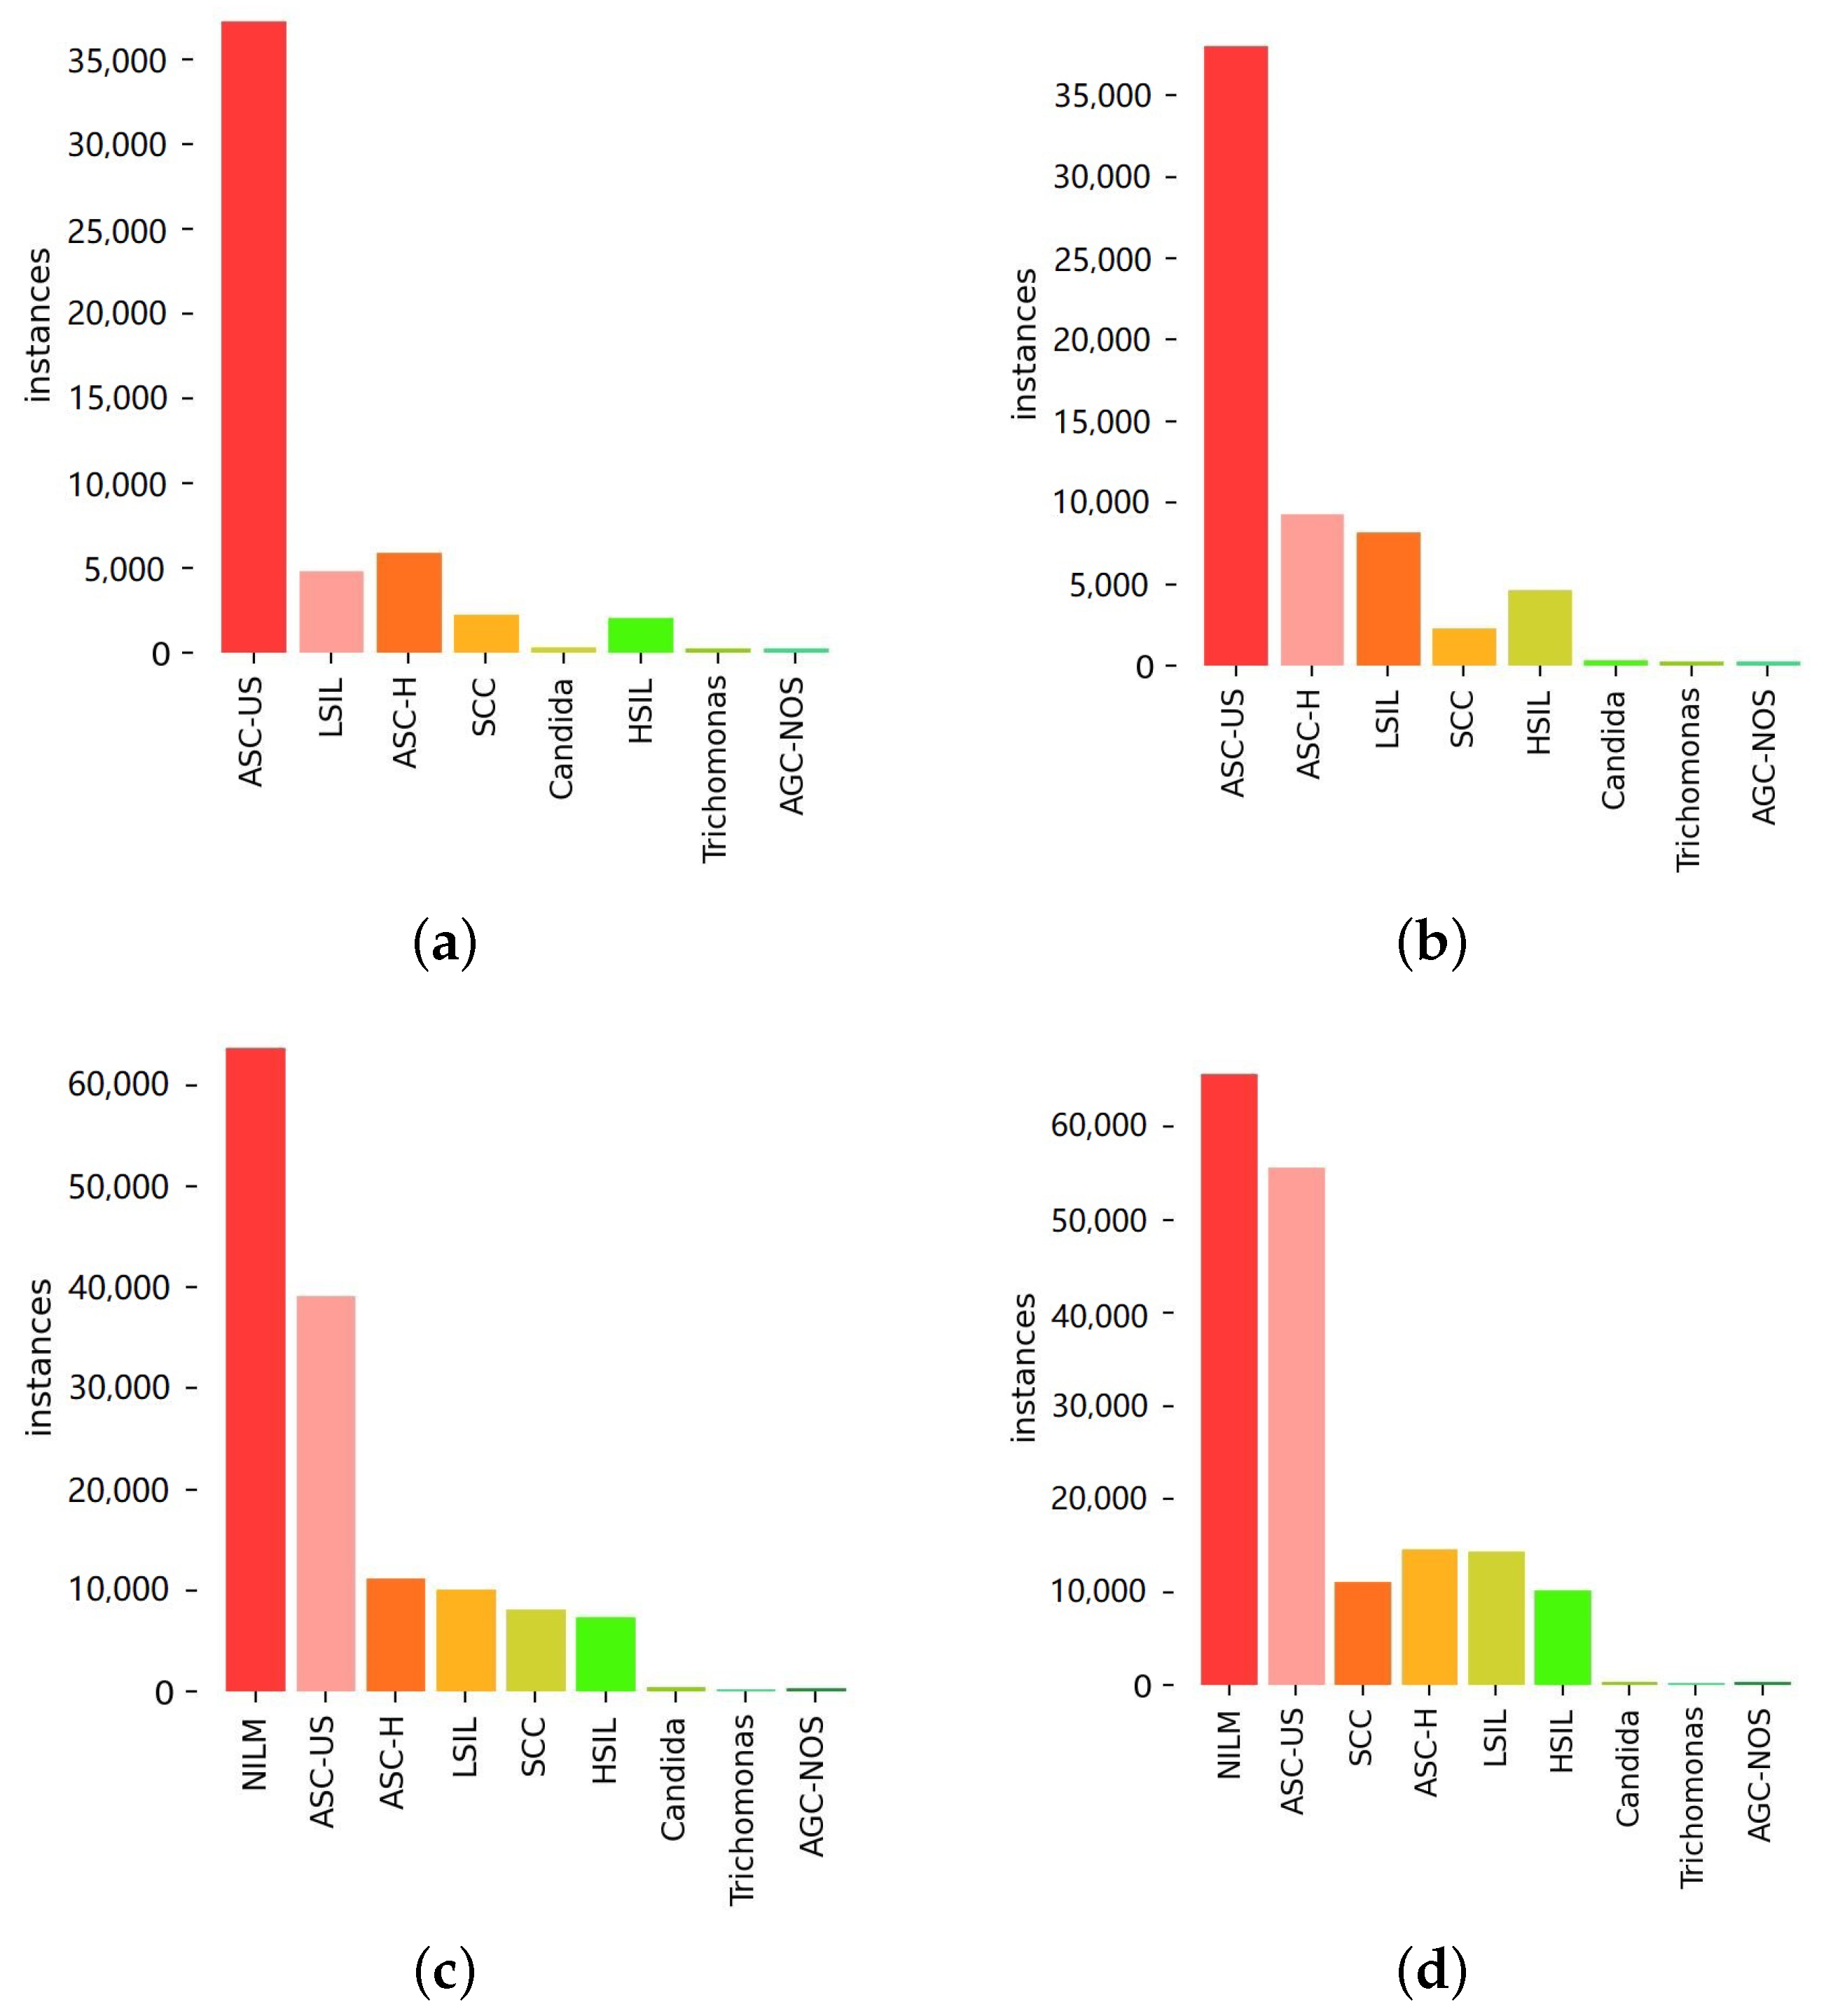
To address the inherent class imbalance and illustrate the impact of our proposed data handling strategies,
Figure 7 presents the per-class sample distributions at various stages. Specifically, it shows the distribution for (a) the baseline YOLOv8 dataset, (b) after applying data enhancement (DE), (c) after subsequently incorporating incremental learning (IL), and (d) the final distribution after including active learning (AL). These distributions highlight how our framework progressively adjusts the dataset composition to potentially improve model training on under-represented classes.
We evaluated the model performance using COCO-style average precision () and average recall (). Additionally, we employed (mean average precision at an IoU threshold of 0.5) and (mean average precision within the IoU range of 0.5 to 0.95). In our proposed IACCS, we utilized CutMix data augmentation () and introduced incremental learning () mechanisms and active learning () mechanisms.
Table 1 presents the performance comparison of different components of our proposed method. From
Table 1, it is evident that adopting
significantly improves all the metrics compared to the baseline model. Furthermore, further enhancements in
and
are achieved with the incorporation of
and
, demonstrating their effectiveness. Clearly, leveraging
for negative WSI data utilization and continuously updating new data with
and
can effectively enhance the model performance.
We further validate the proposed strategy on the current state-of-the-art object detection algorithms RT-DETR [
27] and YOLOV9 [
28]. The results are shown in
Table 2, covering the metrics before and after applying the strategy and focusing on the calculation of the performance improvement, for which the improved parts of the performance metrics are labeled. The results show that the proposed strategy can effectively improve the performance of the model.
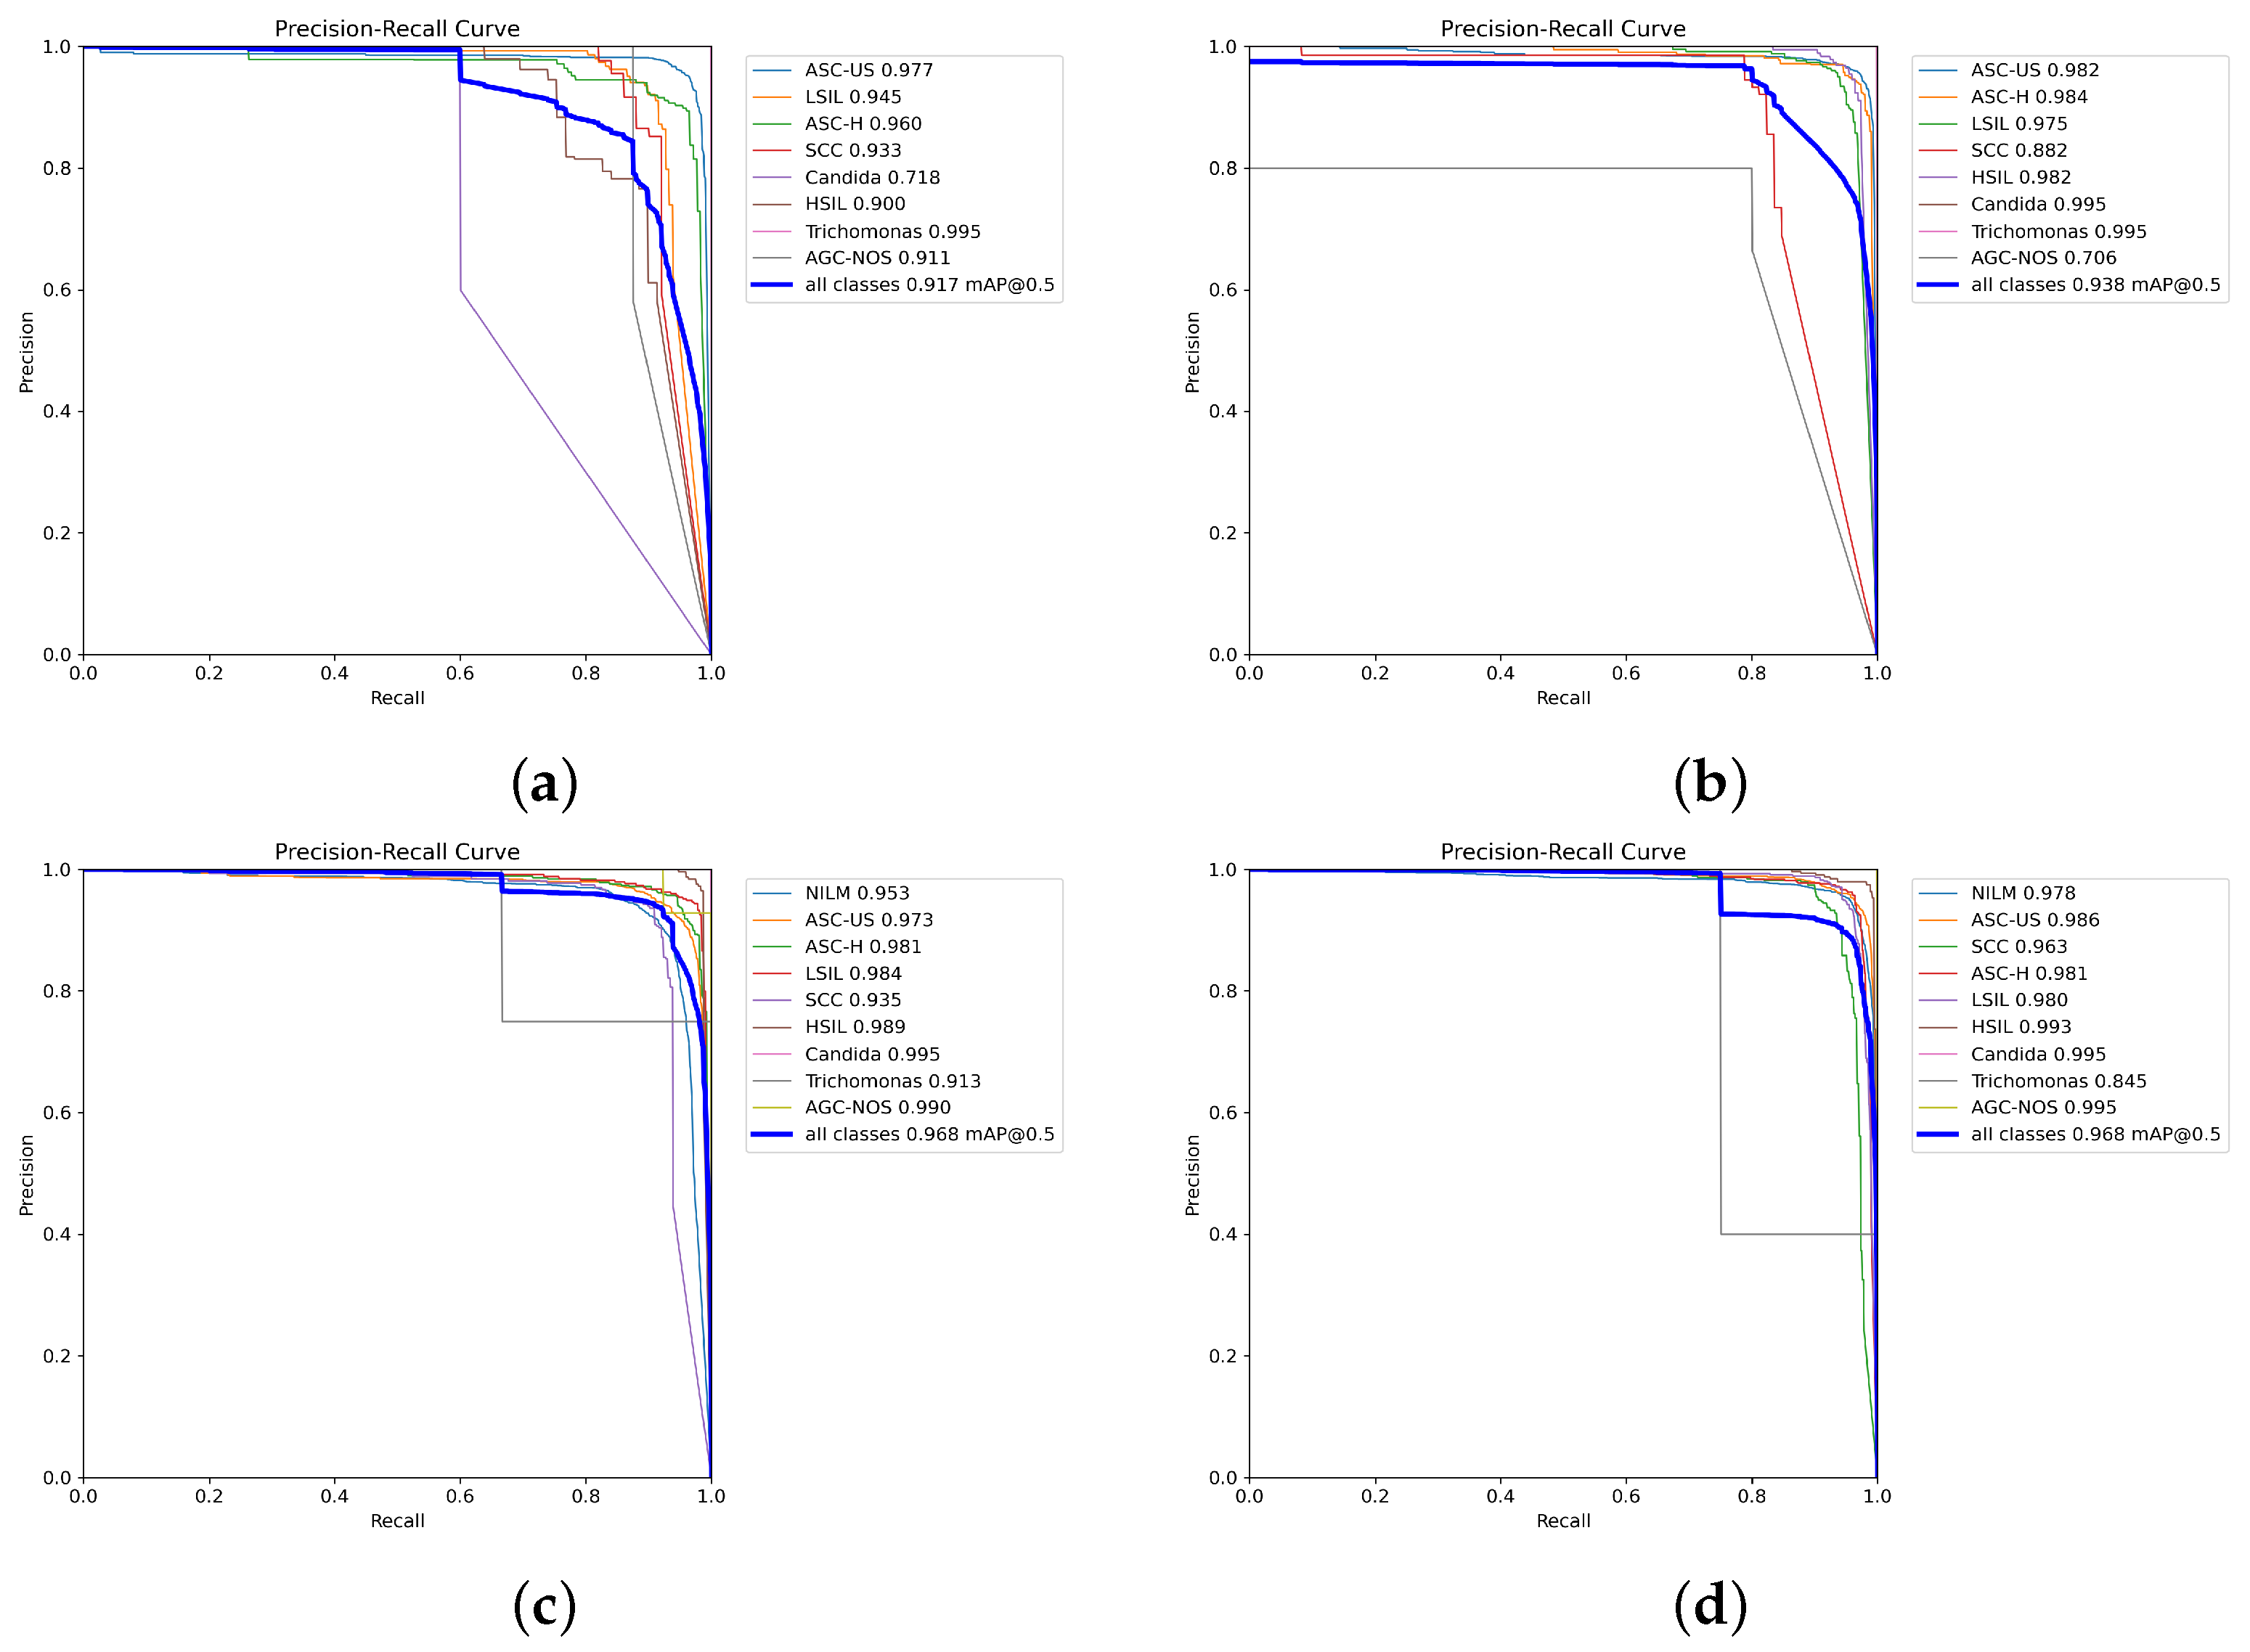
To further assess the model’s performance across different confidence thresholds and evaluate its probabilistic outputs, which are crucial in medical diagnosis for risk stratification, we present the precision–recall curves (PRCs) in
Figure 8. These curves illustrate the trade-off between precision and recall (sensitivity) at various decision thresholds for each class and the overall model performance. The area under the PRC (PRC-AUC), often summarized by metrics like mean average precision (mAP) at a specific IoU (e.g., mAP@0.5, which we report), provides an indication of the model’s ability to distinguish between classes across the full range of operating points.
Figure 8 shows the PRCs for (a) the baseline YOLOv8 model, (b) after applying data enhancement (DE), (c) after subsequently incorporating incremental learning (IL), and (d) the final PRCs after including active learning (AL). These visualizations demonstrate how our proposed strategies impact the model’s diagnostic confidence and its ability to correctly classify instances at varying levels of certainty.
5.4. Diagnostics
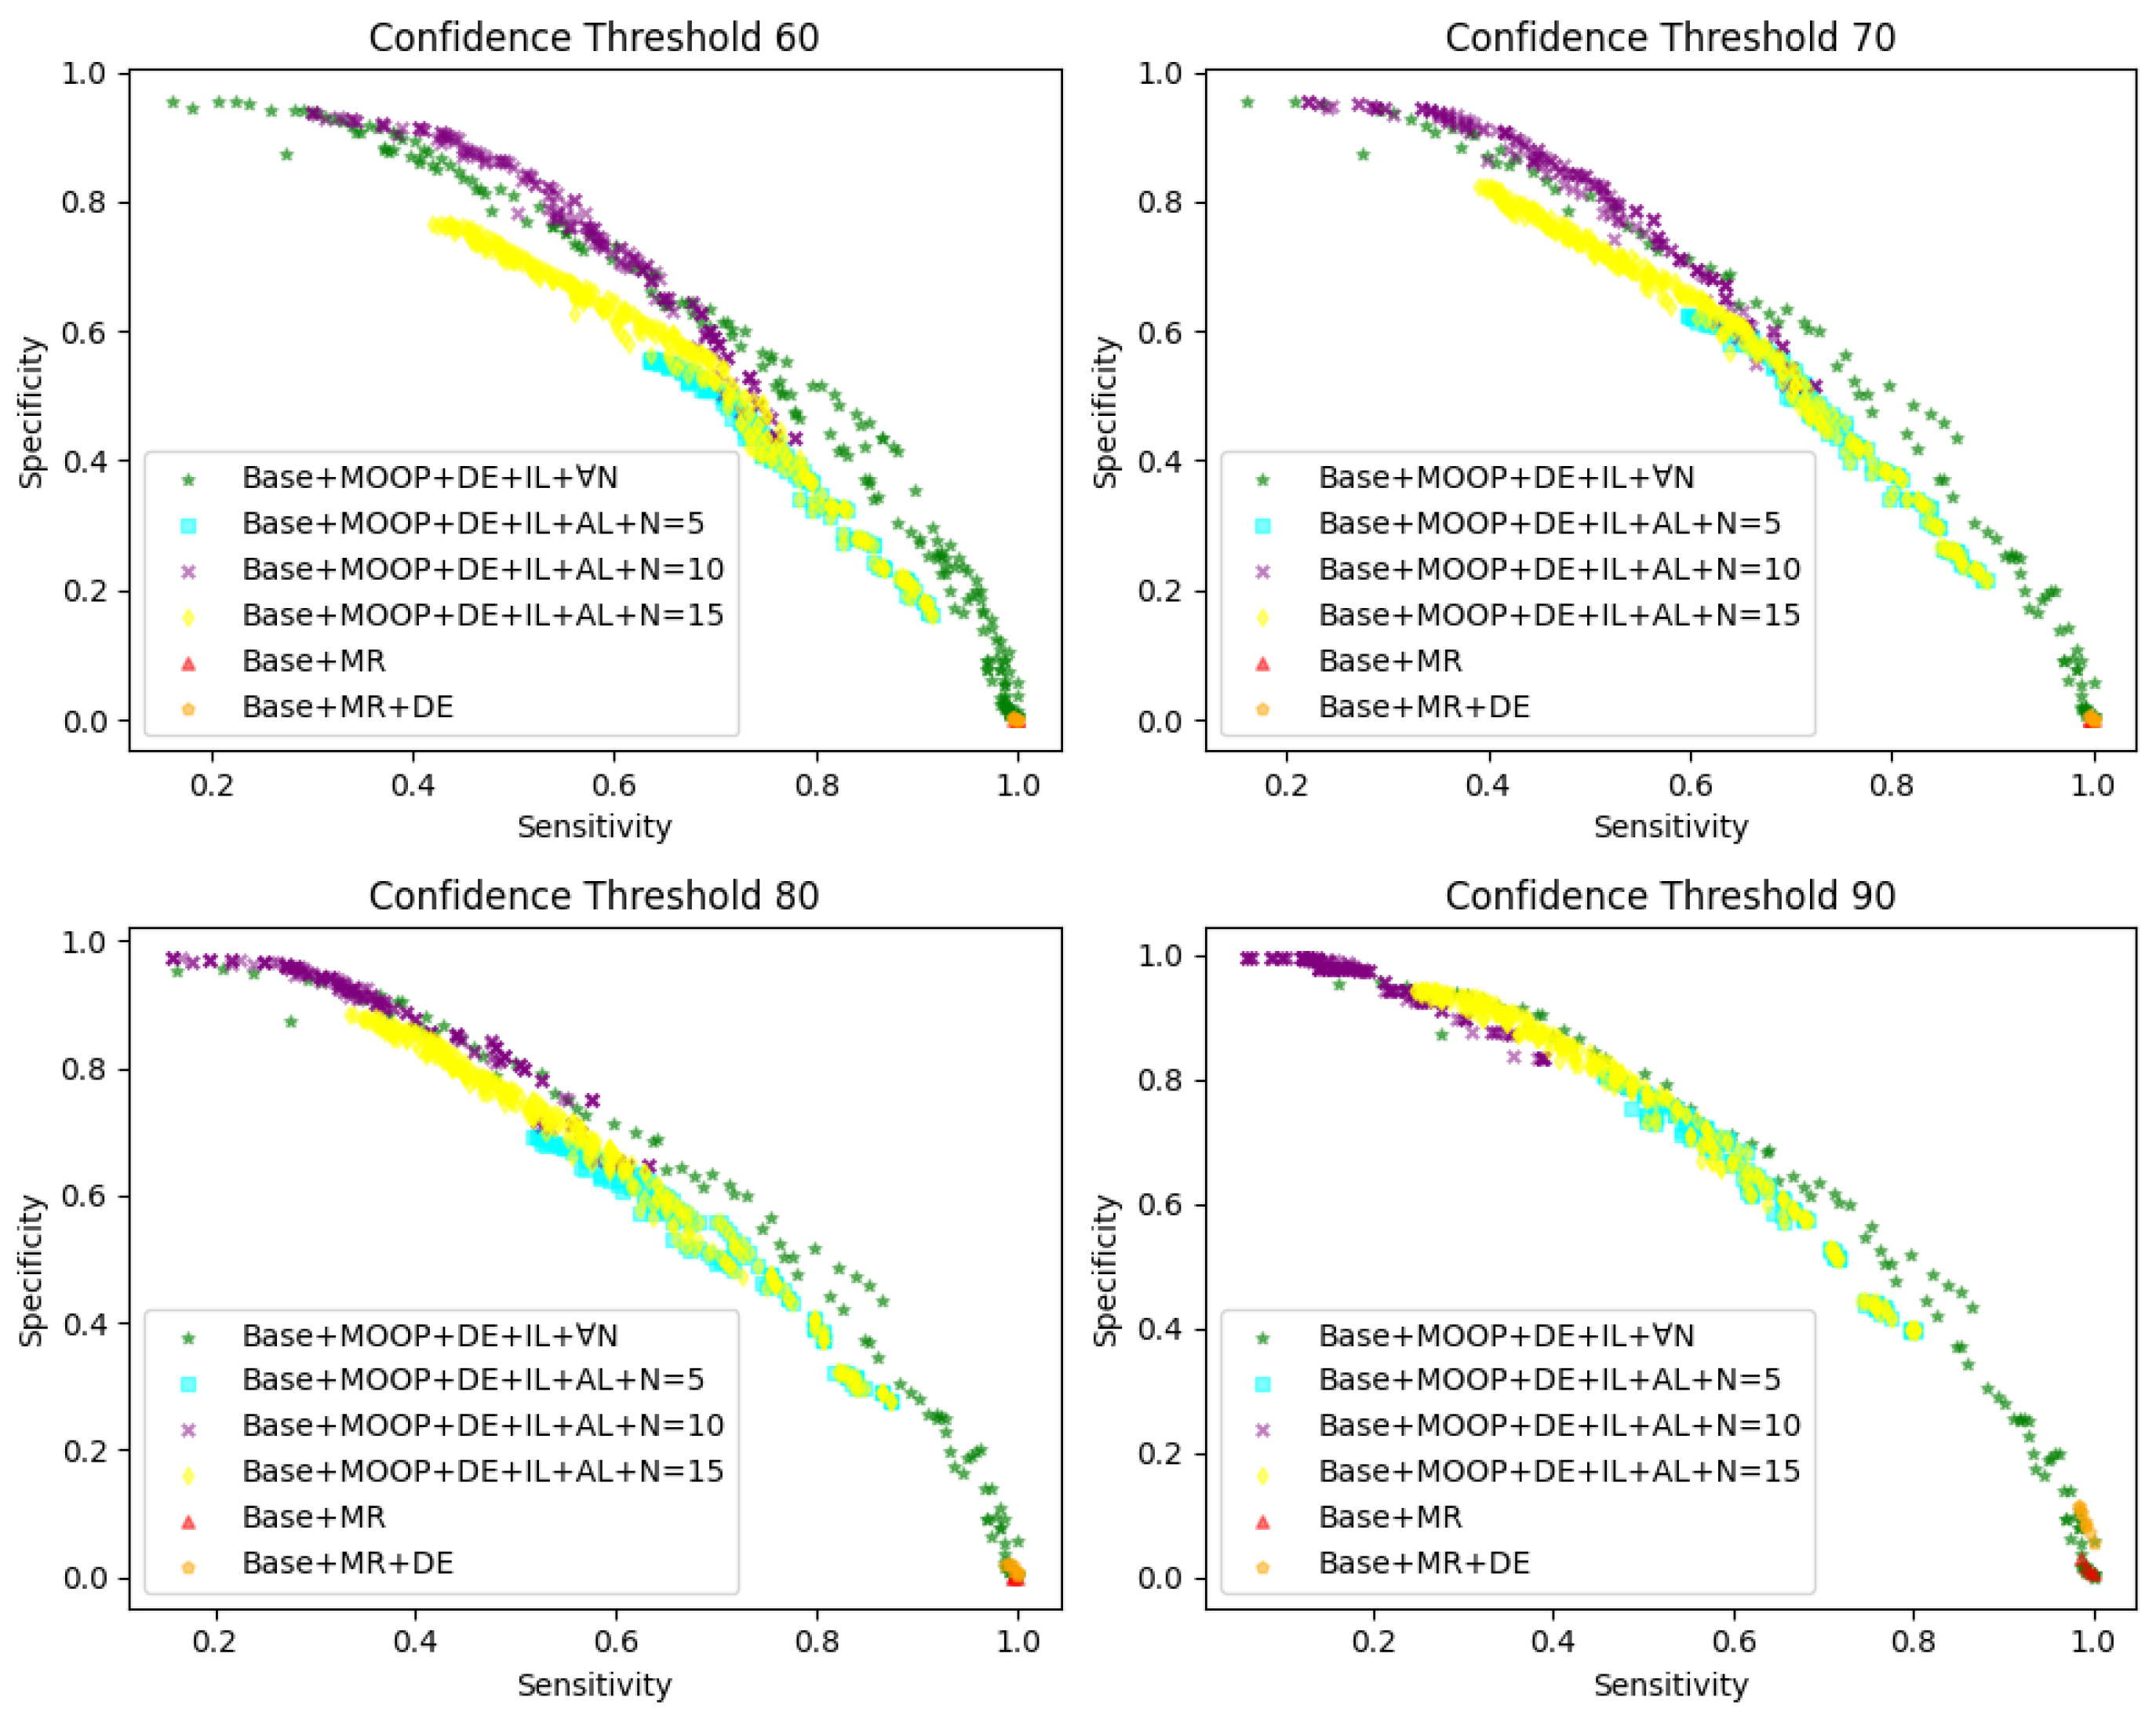
We collected 990 WSIs diagnosed by experts under a microscope to establish the diagnostic rules. Our algorithm first detected abnormal cervical cells in the WSI and then identified the Pareto-optimal solution set based on Equation (
10) after obtaining the detection results. The Pareto-optimal solution sets under various conditions are shown in
Figure 9.
For each condition, we diagnosed using different thresholds, namely confidence thresholds of 60, 70, 80, and 90. In
Figure 9,
represents the baseline model,
denotes manual rules, and
N represents the range of parameter
x in multi-objective optimization (MOOP) from
, with sensitivity on the horizontal axis and specificity on the vertical axis. For example, as shown in
Figure 9,
represents the diagnosis of YOLOv8 test results using manually formulated rules for evaluating its sensitivity and specificity, while
represents the diagnosis of YOLOv8 using
,
, and
detection results by a multi-objective optimization method under
to assess its sensitivity and specificity.
Comparing the scenarios of and , it can be observed that can yield better results than . However, unlike the results of MOOP, the sensitivity and specificity corresponding to have significant limitations. The sensitivity of tends towards 1, while the specificity tends towards 0, indicating that almost all the WSIs are diagnosed as positive in different confidence intervals, which clearly does not serve as effective auxiliary diagnosis.
After applying MOOP and combining , , and , the effectiveness of our approach surpasses manually devised rules in various scenarios. Additionally, each point on the graph represents a diagnostic rule, indicating that they are optimal or nearly optimal on both objectives, and no solution can further improve one objective without sacrificing the other.
Furthermore, we explored the impact of different values of N on the results, where represents no restriction on the scale of N, yielding the best results, albeit far beyond what experts can accept. We aim for N to be as small as possible for diagnosis. Comparing the scenarios of and N = 5/10/15, it is evident that our method can approach the performance of and even outperform it in some cases. Therefore, by selecting a certain Pareto solution, effective auxiliary diagnosis can be achieved to enhance the diagnostic efficiency of experts under this rule.
6. Conclusions
In this work, we proposed an IACCS framework. Firstly, regarding the quality assessment, cell count statistics and the identification of fuzzy regions are conducted on the WSI to ensure high-quality WSI detection and diagnosis. Then, by fully utilizing annotated information and negative WSIs, an incremental learning mechanism and active learning mechanism are introduced to effectively utilize and continuously update the data. Finally, by employing multi-objective optimization, interpretable diagnostic rules are identified, providing more reliable auxiliary diagnosis.
Future Perspectives, Limitations, and Methodological Enhancements: Looking ahead, the proposed IACCS framework holds considerable promise for clinical deployment. It could serve as an efficient assistive tool for cytopathologists, pre-screening WSIs to prioritize suspicious cases, thereby potentially reducing workload and diagnostic turnaround times. In regions with limited access to pathology expertise, IACCS could offer valuable preliminary screening support. Furthermore, the interpretability offered by its MOO-generated rules may facilitate clinician trust and adoption and aid in standardizing diagnostic approaches.
However, several limitations and avenues for future work should be acknowledged. While our current dataset encompassed common lesion types, its diversity concerning rarer conditions like adenocarcinoma (which we plan to focus on in future research), varied patient demographics, and different WSI acquisition protocols may be limited. This highlights the need for future validation on larger multi-center datasets to assess broader applicability. Consequently, the generalization of the current models to entirely new clinical settings or scanner types without further fine-tuning or domain adaptation techniques remains a challenge. To more rigorously assess model robustness and generalization, particularly as we expand our research to include glandular abnormalities and more diverse datasets, future work will incorporate stratified k-fold cross-validation. The use of a fixed train/validation/test split in this study, while facilitating consistent comparisons, may not fully capture generalization across all data partitions, and k-fold cross-validation will provide a more comprehensive evaluation. Practical integration with the existing laboratory information systems and the need for continuous model monitoring also represent important considerations for real-world deployment. Ultimately, rigorous prospective clinical trials will be essential to fully validate the efficacy and safety of IACCS before its widespread clinical adoption.


