1. Introduction
Côte d’Ivoire is the world’s leading cocoa producer, accounting for 40% of global production. This sector plays a key role in the national economy, contributing approximately 10% of GDP. Improving the quality of cocoa beans is a significant challenge, involving various sectors of activity and generating growing interest in scientific research. Numerous studies focus on diseases, maturity, drying, and cocoa processing to optimize its quality and properties [
1]. A determining factor in cocoa quality is its fermentation state, which is divided into three categories: fermented, bad condition, and non-fermented. Fermentation directly influences the taste and properties of the beans and their use in the food industry. In recent decades, computer vision has emerged as a powerful tool for analyzing cocoa quality, with a gradual transition from color imaging to multispectral imaging, offering more accurate results [
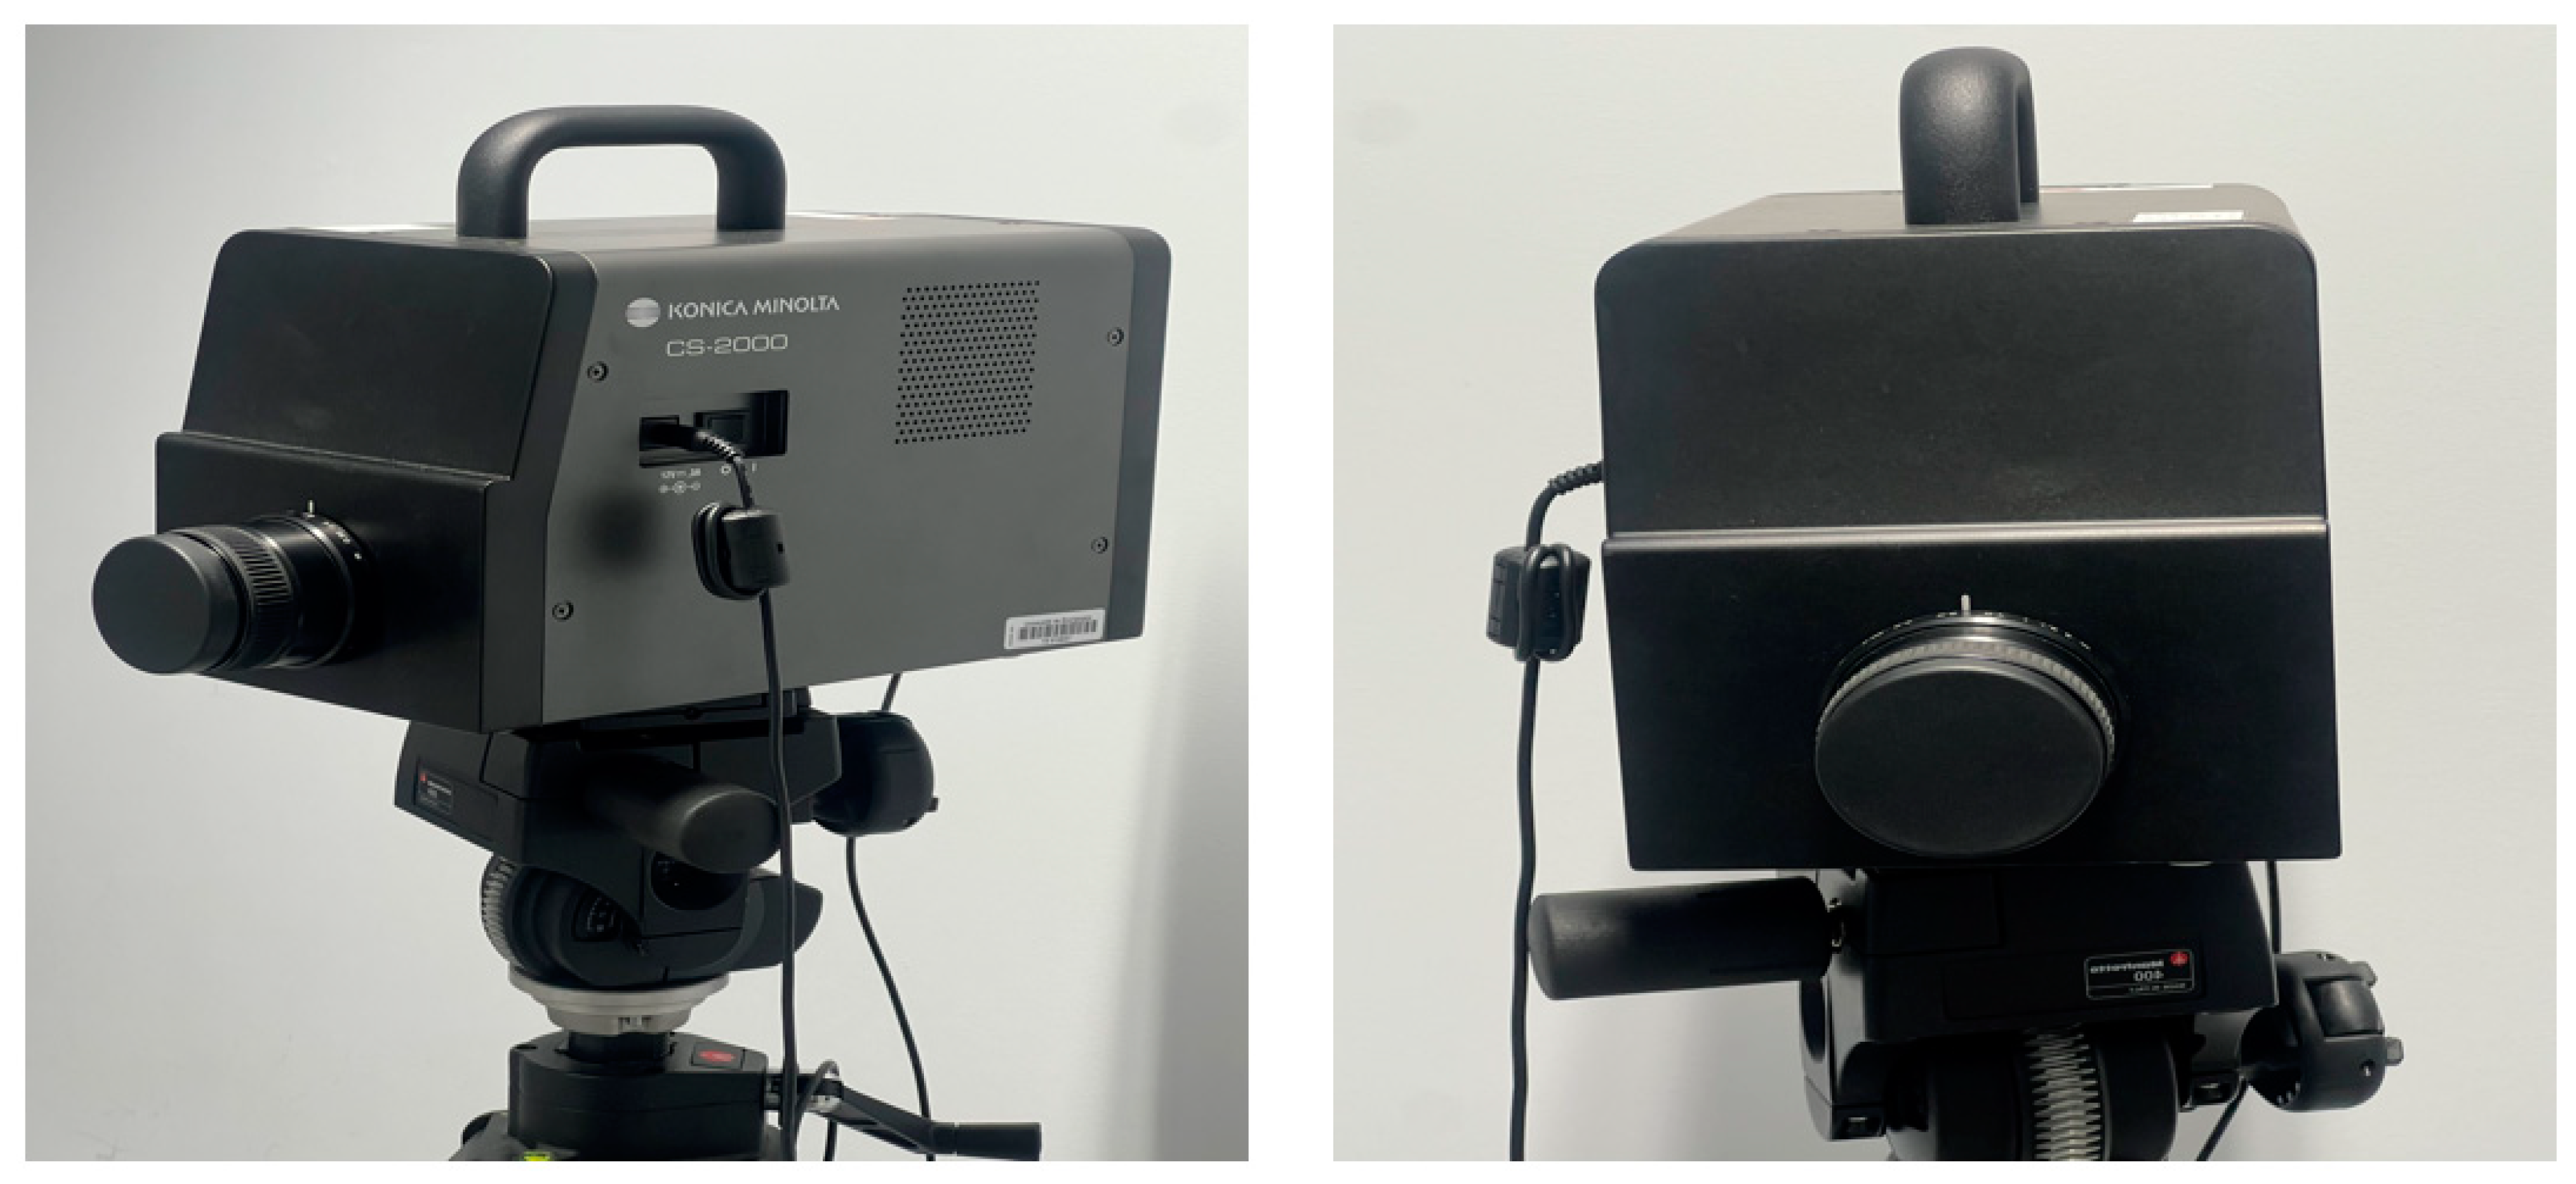
2]. In this study, we exploited the spectral responses of cocoa beans obtained using the Konica-Minolta CS-2000 optical spectroradiometer, designed at the ImViA Laboratory of the University of Burgundy. This instrument enables the capture of Spectral Reflectance of beans in the visible spectrum (380–780 nm), providing a rich database for analysis [
3]. We applied several spectral band selection methods, including ANOVA, F-score, LASSO, Linear Discriminant Analysis (LDA), Mutual Information, and Partial Least Squares (PLS), to identify the most discriminating wavelengths for classifying cocoa beans. Each method identified specific bands based on statistical and informational criteria.
The spectral band selection problem has been addressed to reduce the dimensionality of the spectral data while preserving the most informative features necessary for an accurate classification of the cocoa beans. In this study, the goal of band selection was to eliminate redundant or irrelevant bands that could introduce noise and degrade model performance and highlight the wavelengths that carry the most discriminative information for distinguishing between the three classes of beans.
To achieve this, we implemented a voting strategy to enhance the reliability of the selections and avoid biased choices based on a single method. This approach involves identifying the wavelengths most frequently selected using different selection techniques, thus ensuring a more robust and representative selection of key spectral features.
The selected spectral bands were then used to train three supervised classification models: Random Forest, SVM, and XGBoost. This methodology allowed us to systematically assess the impact of different band selections on model precision and to identify the optimal combinations of bands that maximize the performance and robustness of the cocoa bean classification task.
Our study made several significant contributions to the spectral evaluation of cocoa beans based on their fermentation state:
We created a database of Spectral Reflectance covering the range from 380 nm to 780 nm, corresponding to the visible spectrum. This database categorizes beans into three categories: fermented, poor condition, and unfermented. Measurements were performed using a Konica-Minolta CS-2000 spectrophotometer, ensuring the samples’ spectral responses were accurately acquired.
We applied several feature selection methods to identify the most relevant wavelengths for classification. These methods include ANOVA, F-score, LASSO, Linear Discriminant Analysis (LDA), Mutual Information, and Partial Least Squares (PLS). To improve the robustness of the selection, we implemented a voting strategy to retain recurring spectral bands across the different methods. This approach ensures better representativeness of discriminating wavelengths and limits the impact of variations due to individual methods.
The selected spectral bands were meticulously used to train and evaluate three supervised classification algorithms: Random Forest, SVM, and XGBoost. The objective was to analyze their ability to effectively discriminate between different bean categories using only the most informative wavelengths, ensuring a comprehensive research process.
We compared the performance of the different spectral band selection methods and classification models by examining several performance metrics, including accuracy, F1 score, and Matthews correlation coefficient (MCC). This analysis highlighted the influence of each technique on improving classification and identified the most effective combinations for optimizing bean recognition based on their fermentation state, a crucial factor in determining the quality of cocoa beans.
Our results demonstrate the value of machine learning combined with rigorous wavelength selection for cocoa bean quality control. This research opens up exciting possibilities for industrial applications, paving the way for automating bean sorting based on the fermentation state and enhancing the efficiency of the agricultural industry.
The manuscript is structured as follows:
Section 2 reviews the state of the art in the spectral analysis of cocoa beans and the methods for spectral band selection.
Section 3 describes the materials used and the methodologies adopted in our approach.
Section 4 details the experiments conducted and the results obtained.
Section 5 provides a discussion of these findings. Finally,
Section 6 concludes the study.
2. Related Work
Hyperspectral imaging research has significantly developed over the past two decades, with increasing adoption in the agricultural sector. Its gradual integration into this sector is driven by methodological and technological advances, particularly in spectral band selection and machine learning. Numerous studies have highlighted its potential impact on optimizing agricultural processes, reinforcing its importance for society, and its future deployment.
Thenkabail et al. highlighted the informative richness of hyperspectral data for crop characterization. They distinguish two main approaches: global spectral analysis (WSA), which exploits the entire spectrum to capture the most subtle variations, and the selection of optimal hyperspectral bands (OHNBs), which aims to reduce redundancy and simplify analysis. Their study identified 28 bands that are particularly relevant for modeling plants’ biophysical and biochemical properties and constructing effective vegetation indices. However, they emphasize adapting this selection according to specific applications [
4].
In this research, Jana Wieme et al. explored hyperspectral imaging as a method for non-destructively assessing the quality of fruits, vegetables, and mushrooms [
5]. Their study analyzed laboratory-measurable quality parameters and assessed complex properties, including maturity, ripening, biotic defect detection, physiological disorders, mechanical damage, and sensory quality.
Furthermore, L. Mou et al. addressed the problem of unsupervised band selection from a Markov decision process perspective, proposing an approach based on deep reinforcement learning [
6]. Once the agent is trained, it learns a band selection policy that enables it to select the most relevant wavelengths sequentially, thereby fully exploiting the information in the hyperspectral image and previous selections.
In a study by Peña et al., satellite images (SITS) combined with normalized difference indices (NDIs) improved the classification of six types of fruit tree crops in the Aconcagua Valley, Chile [
7]. Applying penalized Linear Discriminant Analysis (LDA) techniques to address the high dimensionality of the data resulted in a 23% increase in classification accuracy. The most significant spectral bands were identified as those corresponding to the greening stage of the crops.
The food industry can also benefit from non-destructive, real-time classification methods, particularly for differentiating specialty and traditional green coffee beans. To this end, Gomes et al. applied techniques based on multispectral imaging and machine learning [
8]. They could distinguish these two categories using reflectance and autofluorescence data processed using the SVM, RF, XGBoost, and CatBoost algorithms. The SVM achieved the best performance with an accuracy of 0.96. Furthermore, PCA and SVM analysis highlighted the importance of autofluorescence at 405/500 nm and specific fluorophores in the classification process.
Sim J. et al. explored near-infrared hyperspectral imaging (HSI-NIR) combined with machine learning to combat fraud in the geographic origin of coffee [
9]. Their study classified coffee origins at different scales (continental, national, and regional) by analyzing green coffee beans from three continents, eight countries, and 22 regions. Four machine learning models (PLS-DA, SVM, RBF-SVM, and Random Forest) were compared, with linear SVM achieving nearly perfect results. This study thus demonstrates the feasibility of using HSI-NIR combined with machine learning for non-destructive screening of coffee origin.
Lin, M. Y. et al. developed a deep learning model for a multispectral vision system integrating a CMOS sensor and a spectrometer [
10]. This model features an automatic and adaptive color temperature correction engine, ensuring accurate color recognition even in varying lighting and chromatic conditions. Trained on a nine-dimensional dataset, this system demonstrated remarkable efficiency in classifying adulterated coffee beans, achieving an accuracy of 99.3%.
Furthermore, Castro et al. used hyperspectral imaging (Vis-NIR and NIR) to analyze mango samples from eleven distinct varieties [
11]. After data preprocessing, three machine learning models were trained: Linear Discriminant Analysis (LDA), k-nearest neighbors (k-NNs), and artificial neural networks (ANNs). Model evaluation using precision, accuracy, and F-score metrics revealed subtle spectral differences between the varieties. The selection of 17 (UV-Vis-NIR) and 21 (NIR) optimal spectral bands improved model performance, achieving an accuracy ranging from 0.752 to 0.972. These results confirm the potential of hyperspectral imaging combined with machine learning for the acceptable discrimination of mango varieties.
Hyperspectral imaging has emerged as a robust method for assessing the quality of agricultural products, particularly tubers such as potatoes and sweet potatoes. This technique analyzes the interactions between light and matter, enabling a precise and non-destructive characterization of tuber properties. Capturing detailed spectral information facilitates not only the classification and authentication of these products but also the prediction of their physical properties, such as texture and water retention, as well as their chemical composition, including protein and starch content, while detecting potential defects [
12].
Integrating machine learning with hyperspectral imaging significantly enhances the accuracy and reliability of analyses. Machine learning models can effectively process complex spectral data and identify subtle patterns that traditional methods might overlook. Furthermore, feature selection helps optimize these models by reducing data dimensionality, improving efficiency, and minimizing the risk of overfitting.
This study highlights the effectiveness of combining hyperspectral imaging with artificial intelligence for assessing tuber quality. It demonstrates this synergy through various real-world applications and discusses key challenges, such as variability in image acquisition conditions and the need for standardized protocols. Ultimately, it examines prospects, including advancements in sensor technology and developing more robust predictive models, which will pave the way for automated and more accessible evaluation systems.
Hyperspectral imaging, combined with machine learning, is emerging as a crucial method for the non-destructive analysis of agricultural products. Various studies have demonstrated its effectiveness in classifying, authenticating, and assessing the quality of coffee beans, fruits, and tubers. Recent advances in deep learning and optimized spectral band selection have significantly improved the accuracy of predictive models. However, challenges remain, particularly related to the variability of acquisition conditions and the need for standardized methodologies.
3. Materials and Methods
The experiments were conducted in Python on a DELL laptop computer at the ImVIA laboratory at Dijon in France. This computer features an Intel Core i7-10700 processor operating at 2.90 GHz, 32 GB of RAM, and an NVIDIA Quadro P400 GPU. The models were implemented using Python 3.8.8, with the Keras 2.4.3 API and TensorFlow 2.3 as the backend.
3.1. Implementation of the Dataset and Spectral Measurement Process
To construct the dataset, we measured the spectral characteristics of cocoa beans using the high-precision CS2000 spectroradiometer. This instrument accurately captures the spectral characteristics of materials by measuring the beans’ reflectance across the entire visible spectrum.
Figure 1 represents the spectroradiometer.
The CS2000 spectroradiometer was used in a multi-step process:
Step 1: A controlled light illuminates the cocoa bean to be analyzed. This light comes from a standardized white light source, ensuring uniform and reproducible illumination in a controlled environment;
Step 2: When the light strikes the surface of the bean, several optical phenomena occur:
- ○
The bean absorbs some of the light;
- ○
Another part is reflected, carrying information about the bean’s composition and condition.
Step 3: The CS2000 captures the light the bean reflects and decomposes it into different wavelengths using an optical system equipped with a diffraction grating. This decomposition provides a detailed Spectral Reflectance of each bean;
Step 4: The device records the intensity of the reflected light for each wavelength of the visible spectrum (from 380 nm to 780 nm). The measurements are converted into standardized digital values, facilitating accurate comparison of beans according to their condition.
For this study, 90 cocoa beans were selected, with 30 samples for each category. This balanced distribution aims to ensure fair representation of each class during the analysis and training of classification models. Bean selection was manually performed from homogeneous batches based on visual and sensory criteria such as odor, color, and texture. This assessment was validated by local farmers operating in the study area in Yakassé, a village in the commune of Grand-Bassam, Côte d’Ivoire.
Each selected bean underwent individual spectral acquisition, covering a wavelength ranging from 380 nm to 780 nm, corresponding to the visible spectrum. These measurements were designed to accurately assess each sample’s Spectral Reflectance.
Acquisitions were conducted under rigorously controlled conditions, particularly ambient lighting, angle of incidence, and humidity, to ensure data reliability. These measurements were carried out in the ImViA laboratory at the University of Burgundy Europe (formerly the University of Burgundy), France.
This data provides a reliable basis for comparing Spectral Reflectance between fermented, unfermented, and unprocessed beans, ensuring the reproducibility of the experiments and the validity of the results obtained.
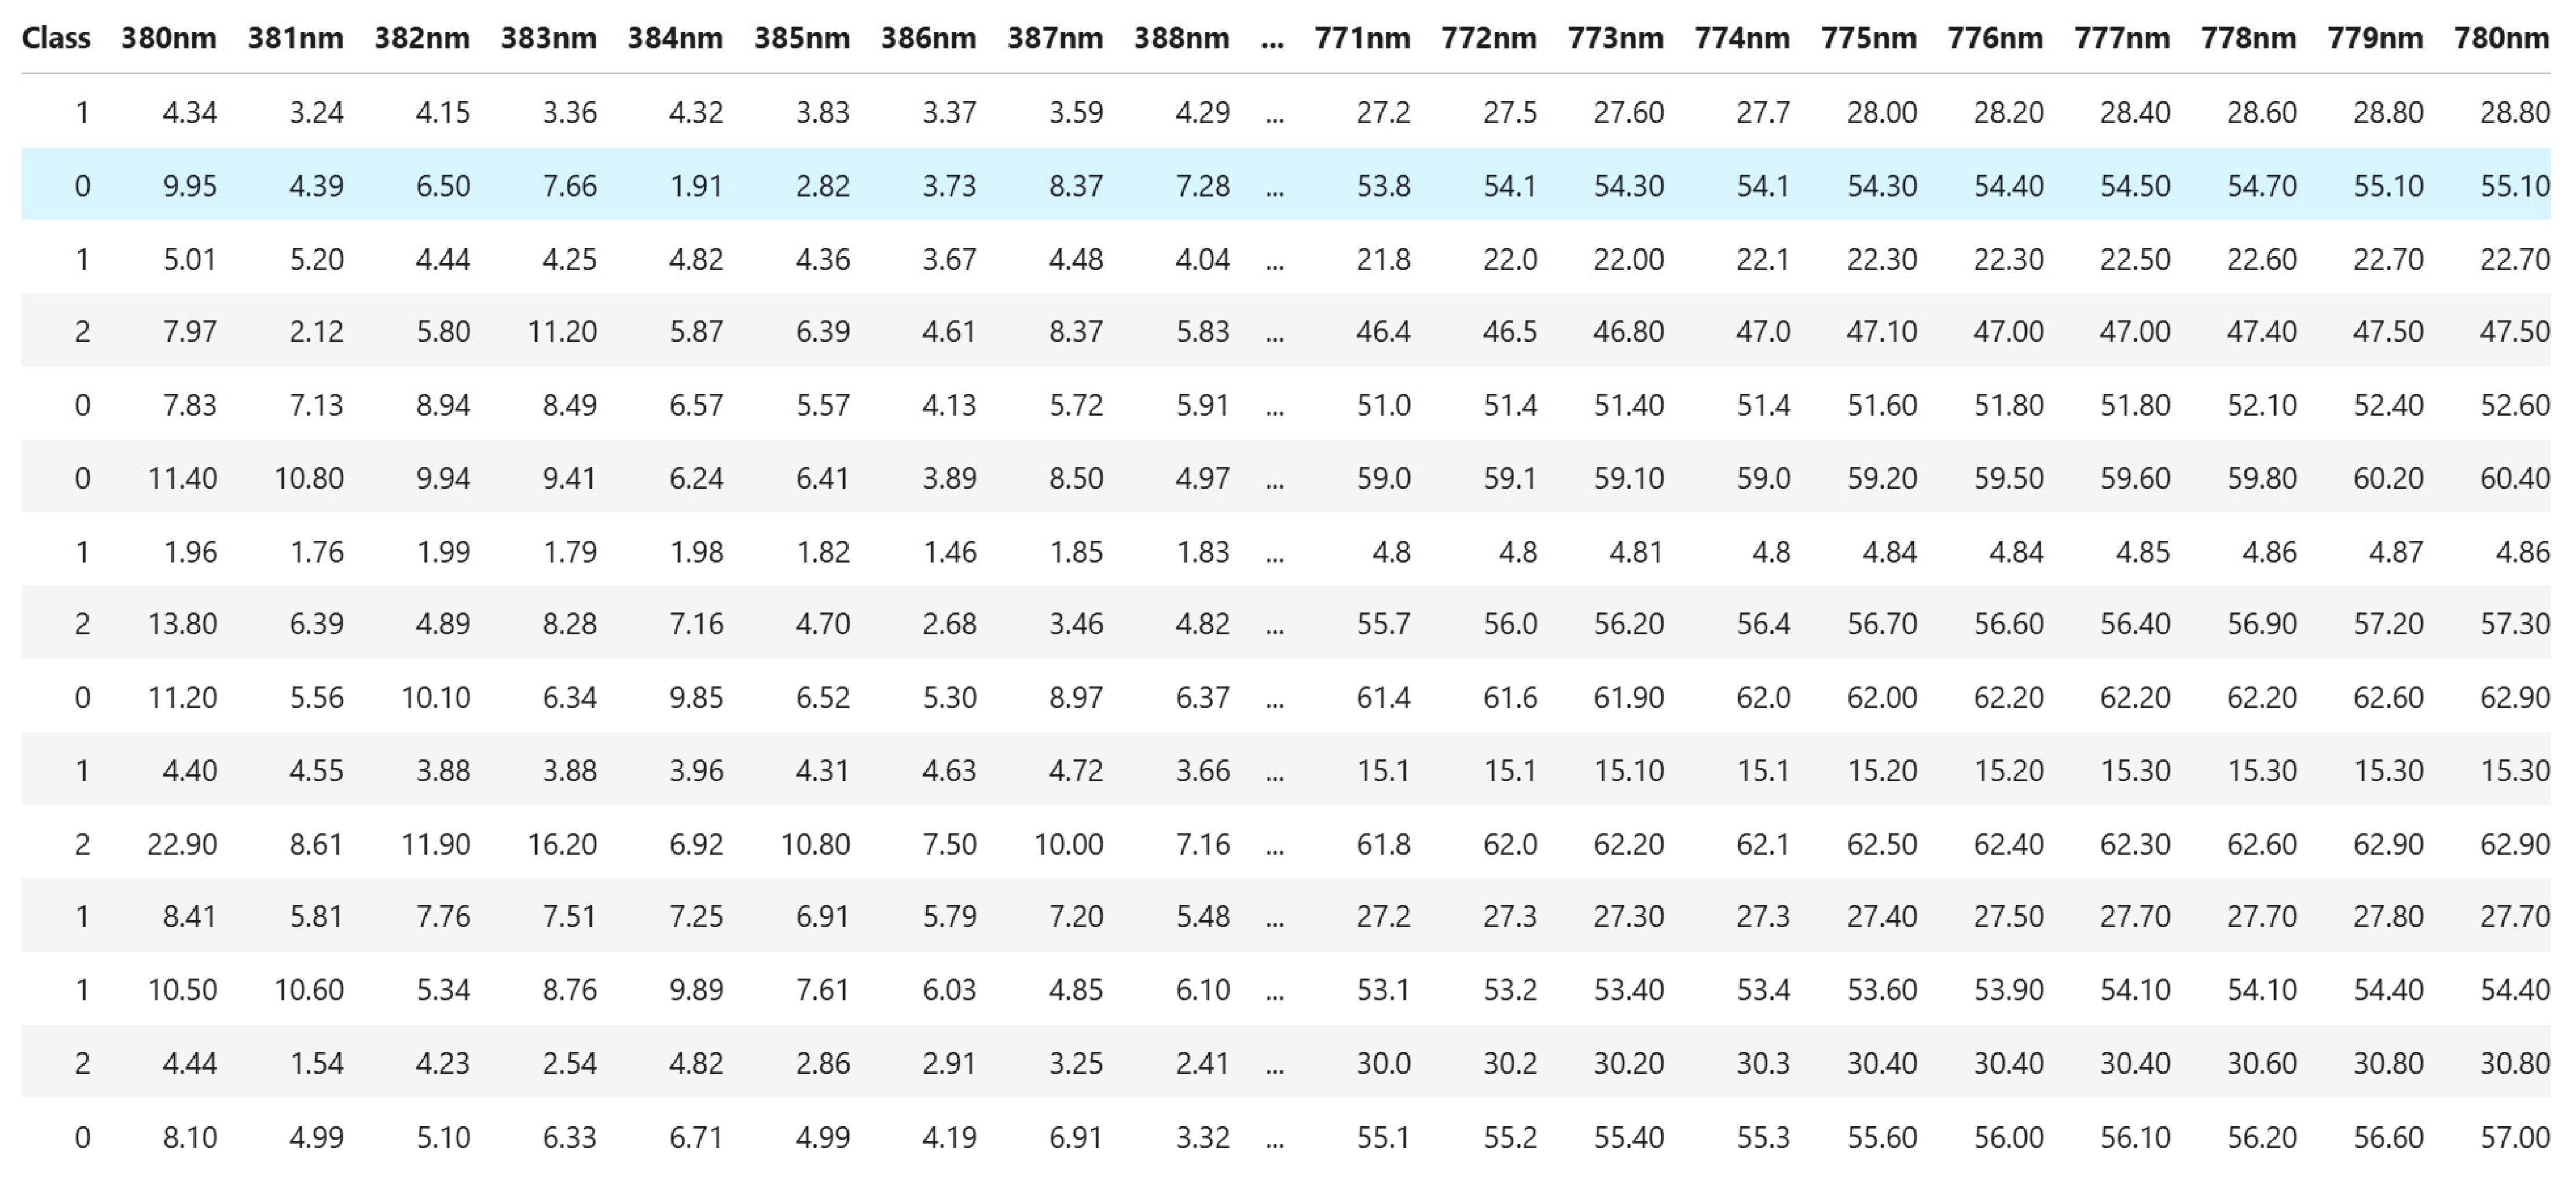
Figure 2 shows a sample of the reflected light intensity for each wavelength of the visible spectrum, ranging from 380 nm to 780 nm.
The resulting data are organized in a table format. Each row corresponds to a single bean, and each column represents the spectral intensity measured at a specific wavelength.
The beans are classified into three categories according to their condition:
0: Fermented;
1: Bad condition;
2: Non-fermented.
Each recorded value indicates the bean’s reflectance rate at a given wavelength, expressed in units normalized by the spectrometer. These data are essential for identifying spectral differences between beans and assessing their quality based on fermentation.
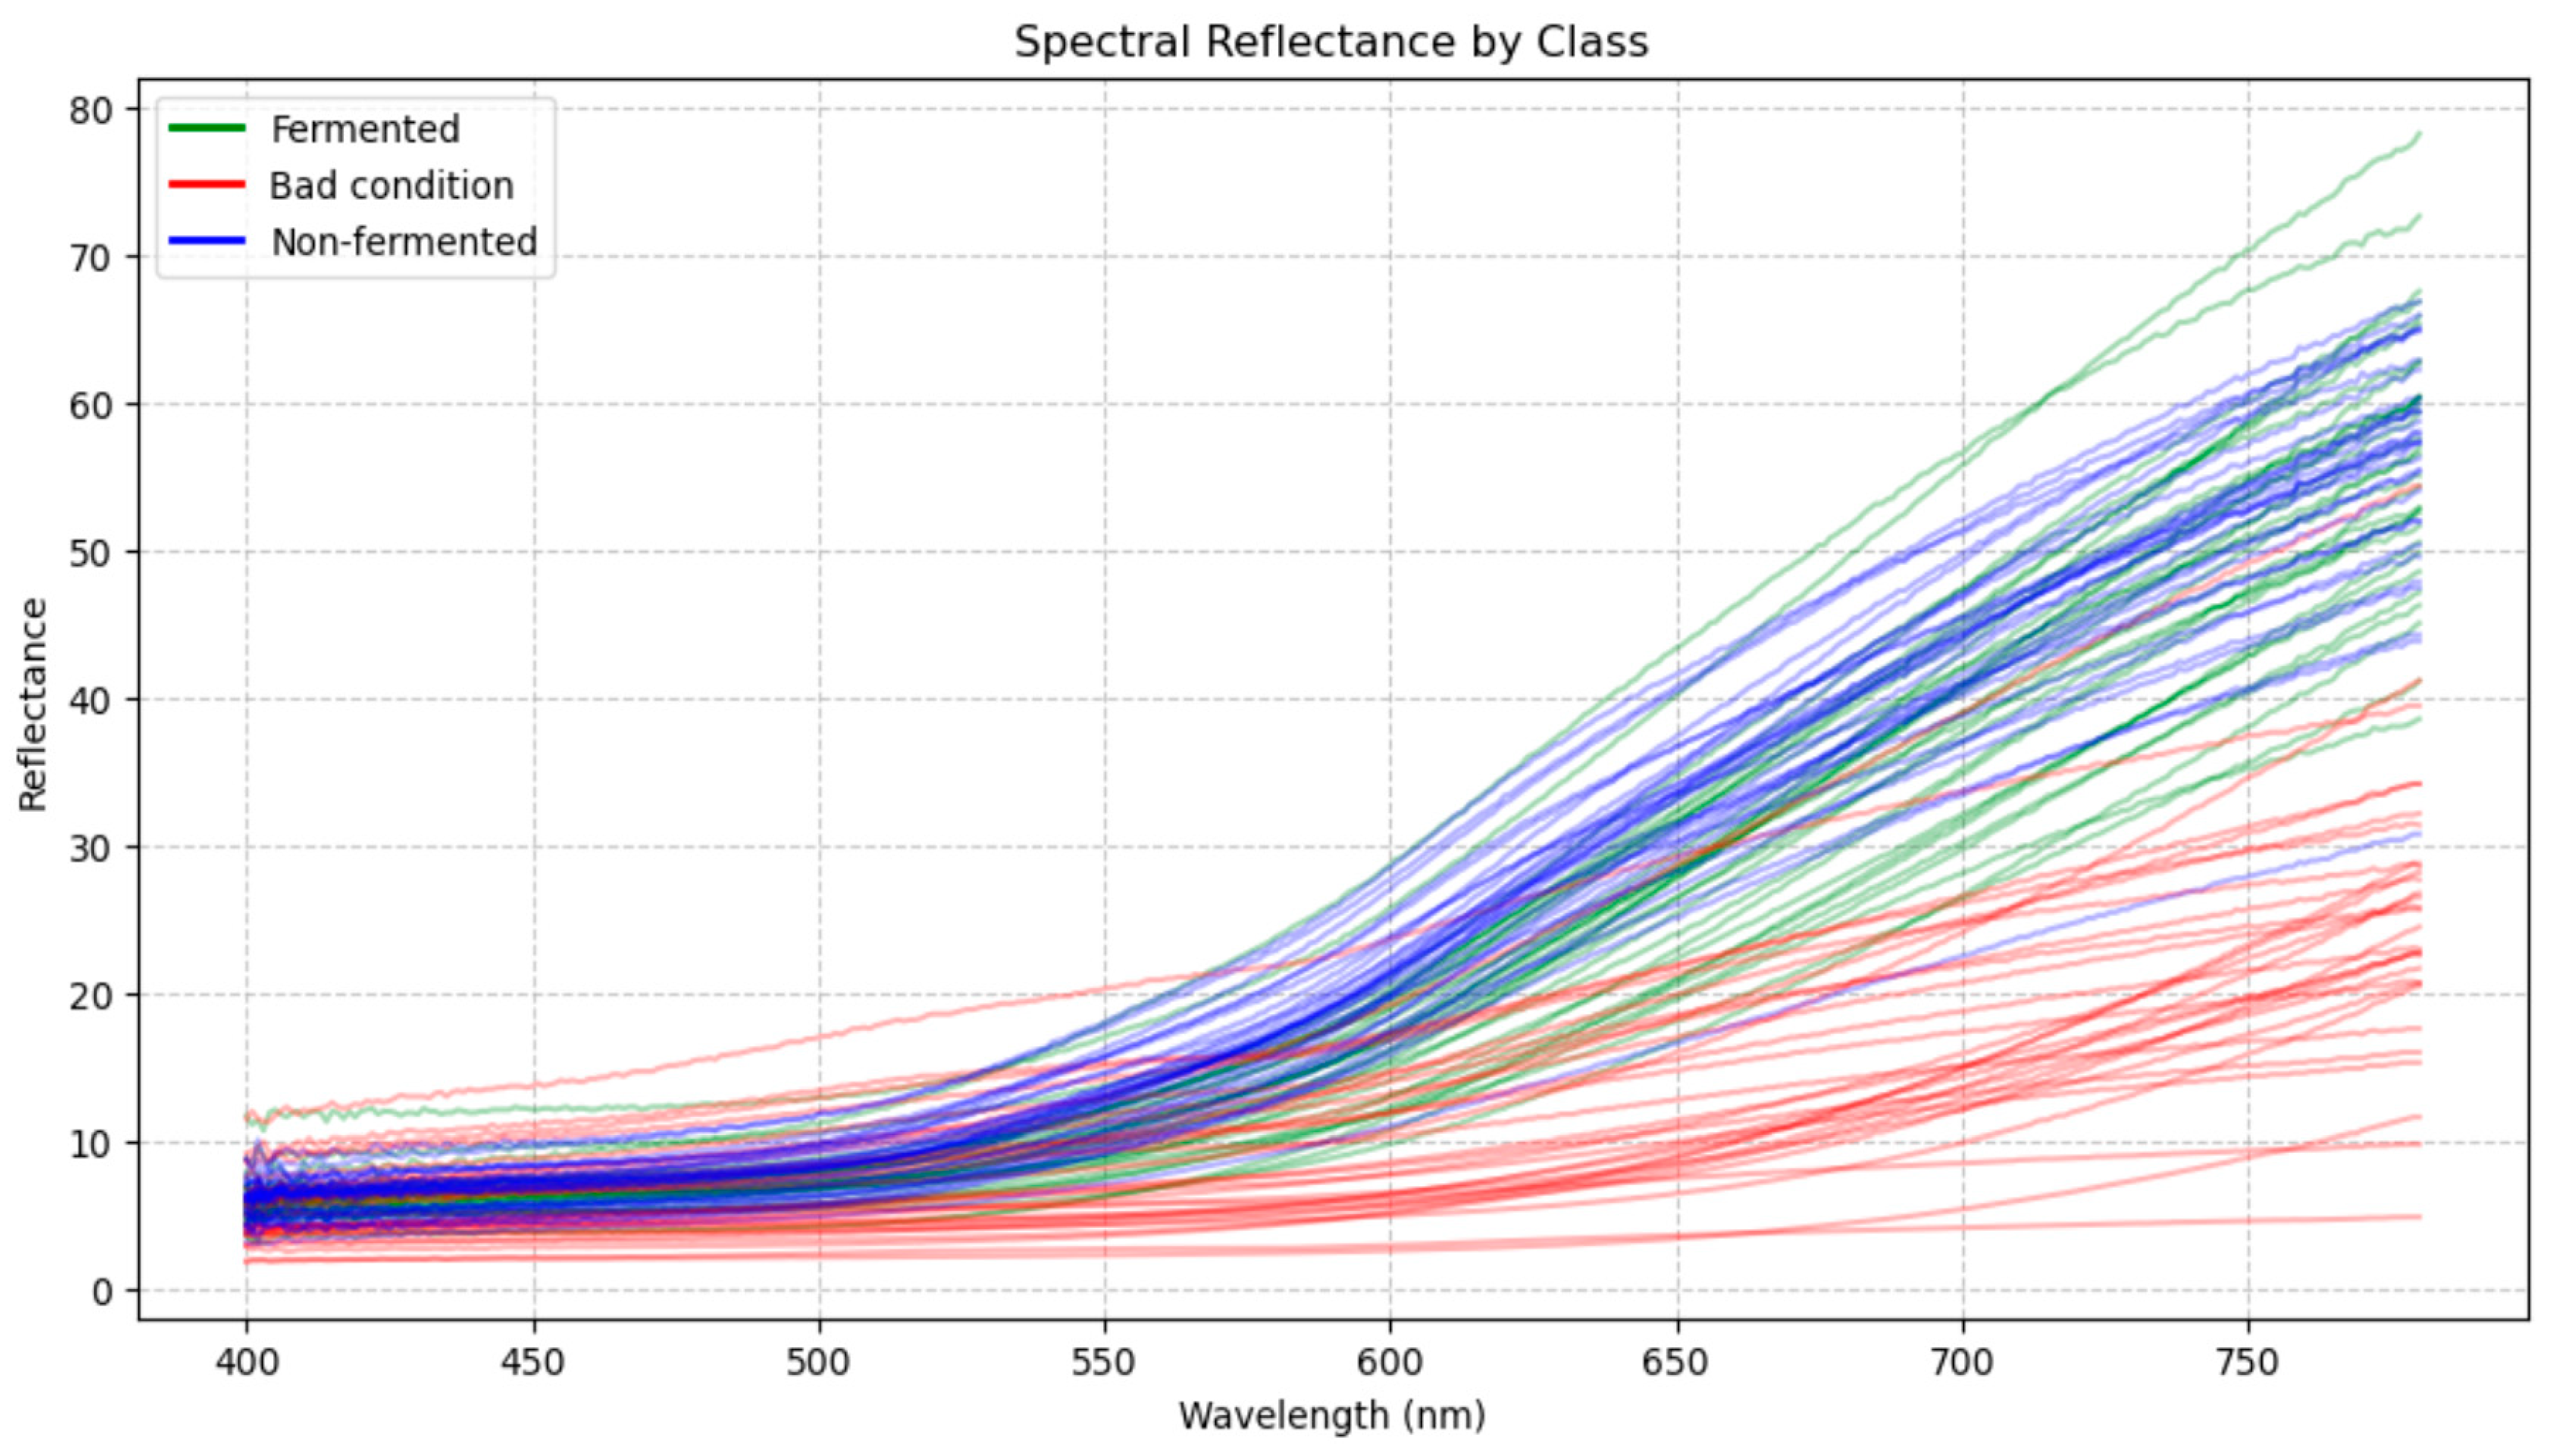
Figure 3 illustrates the Spectral Reflectance of cocoa beans obtained from measurements made using the CS2000 spectroradiometer.
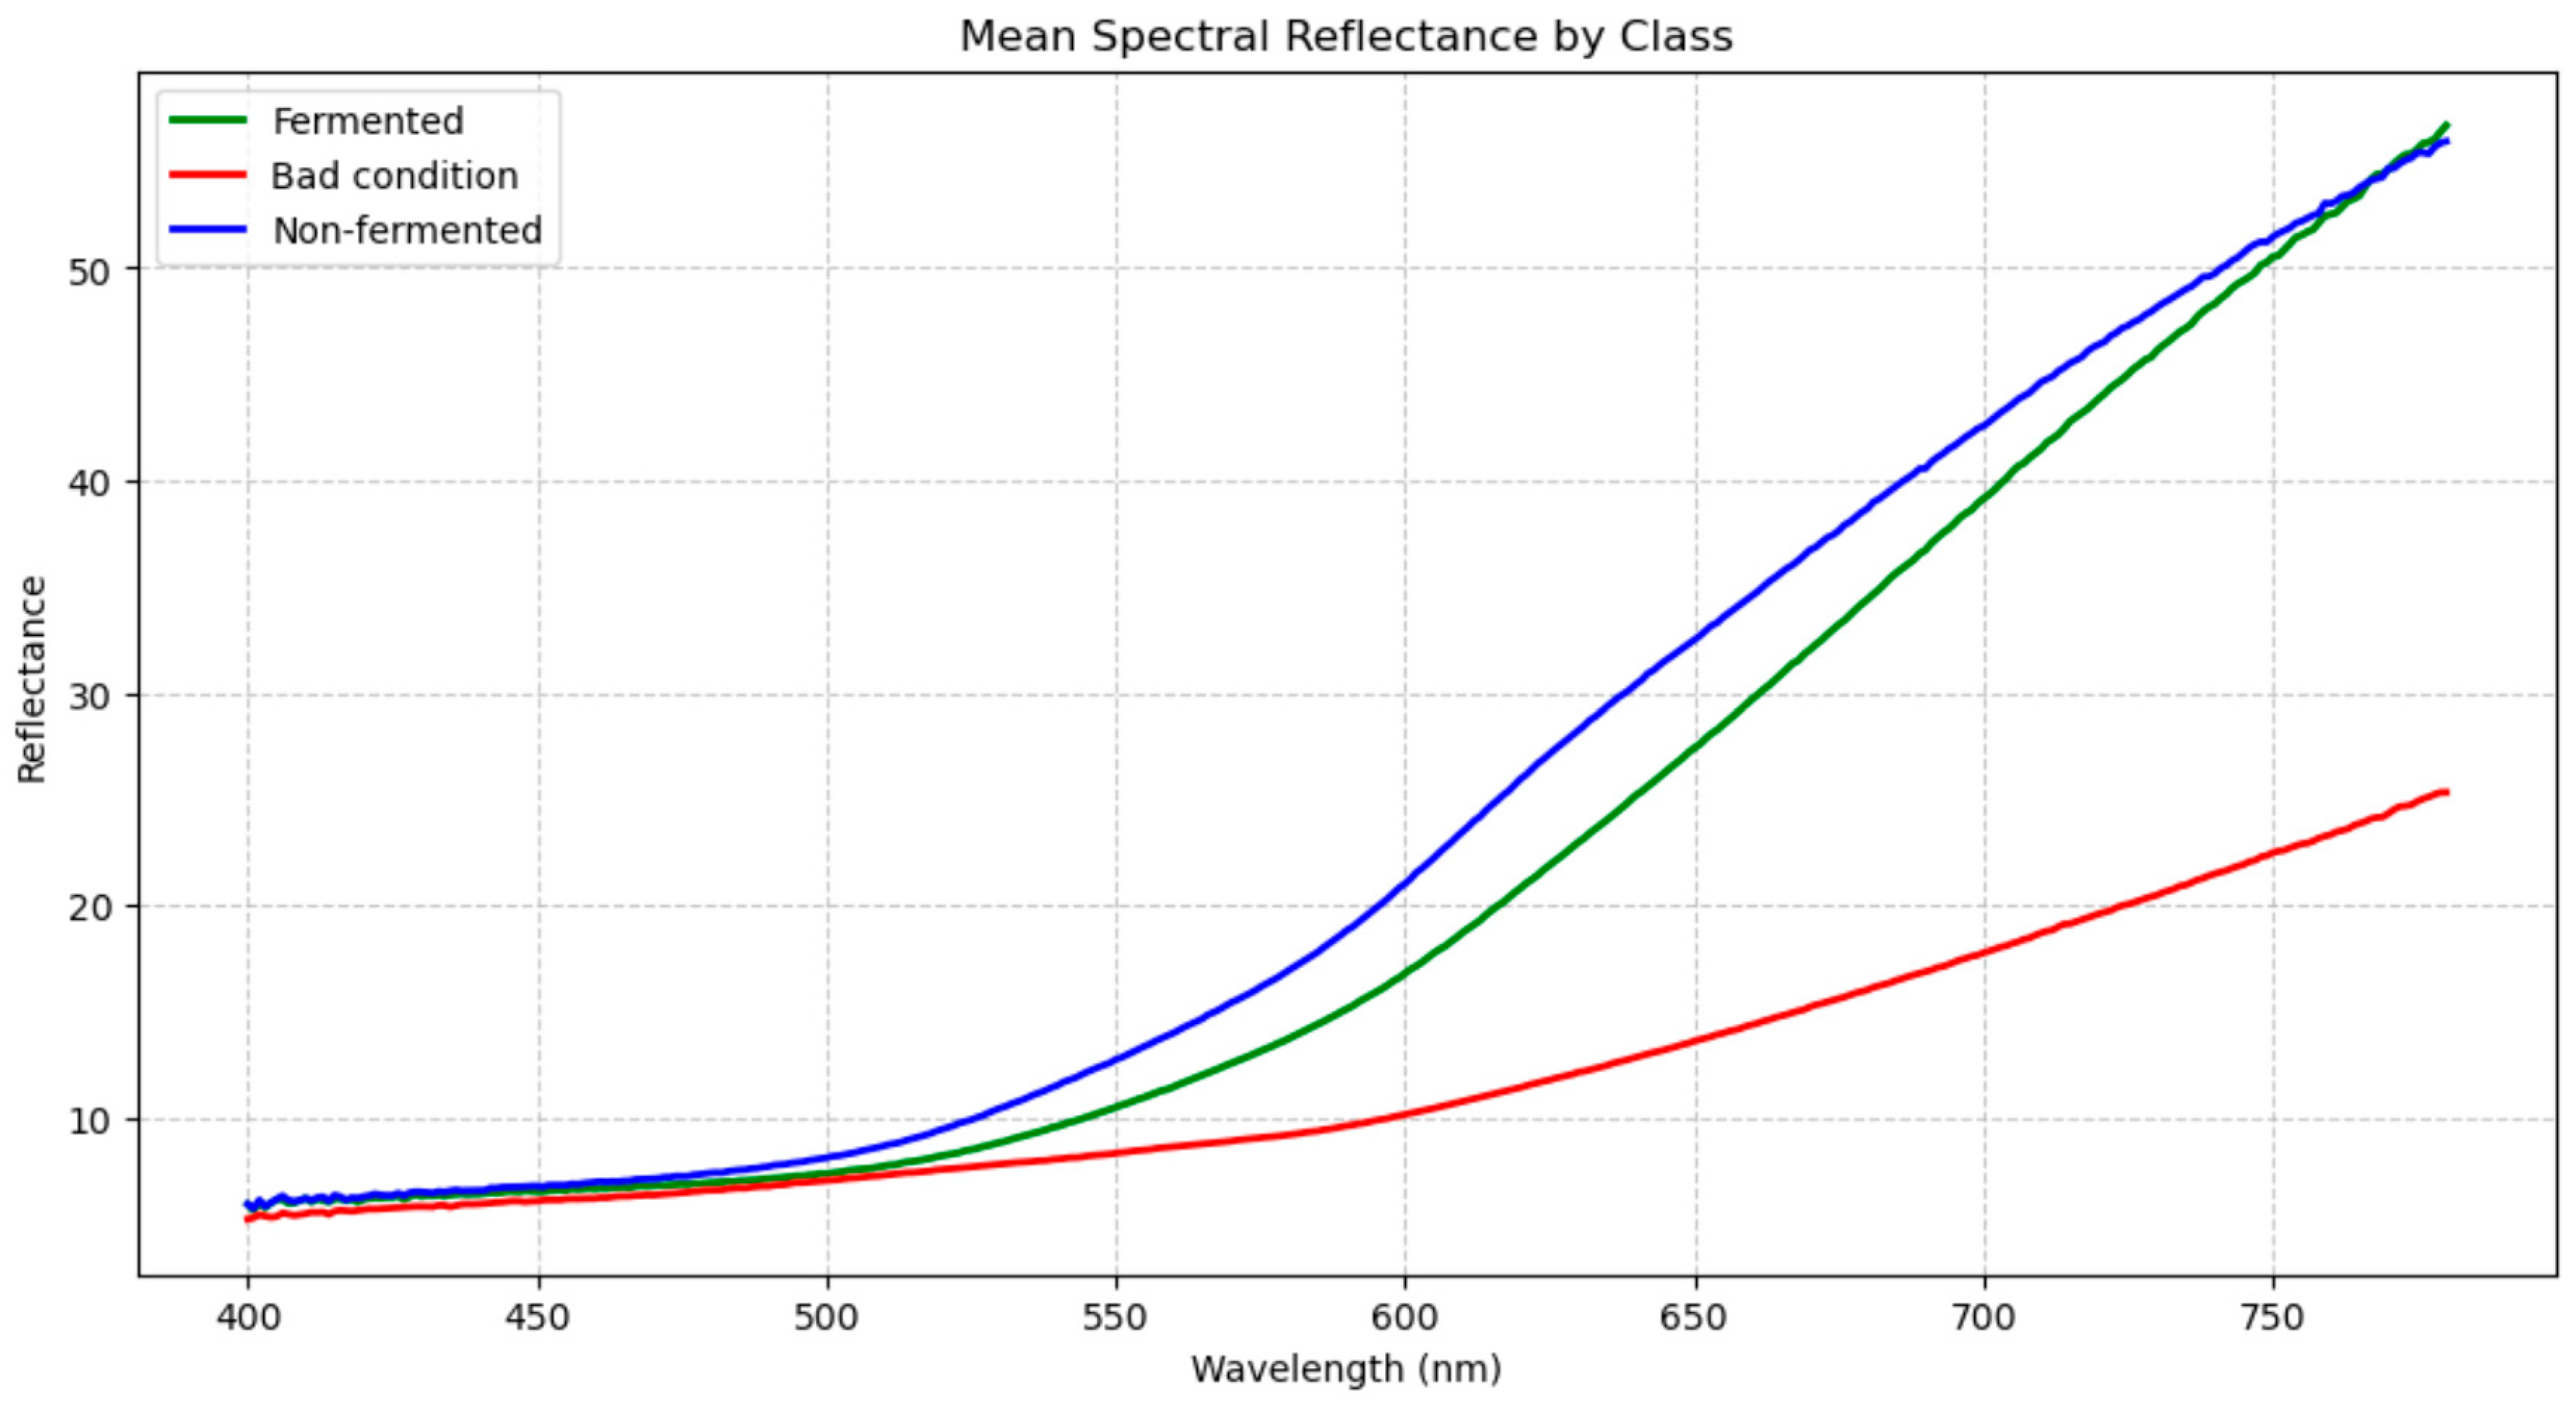
Figure 4 shows the average Spectral Reflectance for each class.
3.2. Methods for Spectral Band Selection
Spectral band selection methods are essential for optimizing the performance of classification algorithms by reducing redundancy and enhancing the relevance of extracted information. Various approaches are used to identify the most significant bands, including Mutual Information, Voting, ANOVA, F-score, Linear Discriminant Analysis (LDA), Partial Least Squares (PLS), and LASSO. Each method has specific characteristics that influence the accuracy and robustness of classification models.
3.2.1. Analysis of Variance (ANOVA)
ANOVA is a powerful statistical technique used to determine whether significant differences exist between the means of three or more groups. Imagine testing the effectiveness of three different teaching methods on student performance. ANOVA would help determine whether students’ average scores differ significantly among these three groups.
In its functioning, ANOVA focuses on variance, which refers to the dispersion of data around the mean. It compares two types of variances: between-group variance and within-group variance. The between-group variance measures how different the group means are from each other. If the group means vary greatly, this variance will be high. On the other hand, within-group variance measures the variability of individual observations within each group. Even if the group means are similar, there will always be some degree of individual variability [
13,
14].
ANOVA is a valuable tool for comparing the means of multiple groups. Analyzing variance helps determine whether the observed differences are likely due to chance or if they reflect actual differences between the groups. The equation associated with this model is the following:
total number of classes
3.2.2. Mutual Information
Mutual Information is a measure of statistical dependence between two random variables. Observing the other quantifies the amount of information gained about one variable. In other words, it measures the reduction in uncertainty about one variable due to knowledge of the other. The entropy of a random variable reflects its uncertainty or degree of disorder. The higher the entropy, the more unpredictable the variable is. The joint information of two random variables indicates the total uncertainty associated with their simultaneous observation. The conditional information of a random variable, given another, measures the remaining uncertainty about the first variable after observing the second. In feature selection, Mutual Information is used to evaluate the relationship between the target variable (the variable to be predicted) and each feature (explanatory variable), allowing for the measurement of their mutual dependence. Features with high Mutual Information with the target variable are considered the most informative and relevant and thus selected for inclusion in the predictive model [
15,
16]. Mutual Information is a powerful and flexible measure of dependence between random variables, with applications in fields such as information theory, machine learning, and signal processing. The equation associated with this model is the following:
3.2.3. Linear Discriminant Analysis (LDA)
LDA is a statistical technique used for classification and dimensionality reduction. It aims to find a linear combination of features that best separates the classes in a dataset. The primary objectives of this method are to assign an observation to the class to which it is most likely to belong and to project the data into a lower-dimensional space while preserving as much discriminative information as possible between the classes. In its operation, LDA seeks to maximize the distance between class means while minimizing the variance within each class. It assumes that the data for each class follows a normal distribution and that the covariance matrices of the classes are equal. LDA calculates linear discriminant functions that enable projecting the data into a new space where the classes are more clearly separated [
17,
18]. The equation associated with this model is the following:
λ: Each spectral band
: The discriminant function
: Spectral value at the band
Average of class for the band
Prior probability of the class
3.2.4. F-Score
The F-score is a widely used performance metric in statistics and machine learning, particularly for evaluating classification models. When applied to spectral band selection, it is an effective tool for assessing the relevance of different bands in a classification model. In this context, the F-score evaluates the impact of each band on the model’s overall performance by considering both precision (the percentage of correct optimistic predictions) and recall (the percentage of actual positives correctly predicted).
By selecting the spectral bands that maximize the F-score, we optimize the model’s ability to distinguish between different classes while minimizing errors. This is especially useful when dealing with multiple spectral bands, where careful selection is crucial to avoid model overcomplexity and improve performance [
19].
Therefore, the F-score helps assess the importance of each spectral band in the classification task, aiming to strike the right balance between precision and recall while minimizing the influence of non-informative or redundant bands. The equation associated with this model is the following:
Number of samples in the class
Total number of samples
Number of classes
3.2.5. Partial Least Squares (PLS)
Partial Least Squares (PLS) is a powerful and flexible statistical method that models the relationship between two sets of variables, even in multicollinearity and high-dimensional data [
20]. This technique is particularly useful when the number of predictor variables (X) is large and there is a strong correlation between them.
PLS aims to find a linear relationship between the predictor and response variables (Y). When the number of predictor variables is high, PLS reduces the dimensionality by creating a small number of latent components that capture the most important information. PLS is robust to multicollinearity, which refers to the strong correlation between predictor variables.
In its operation, PLS extracts latent components from the predictor and response variables. These latent components are linear combinations of the original variables that maximize the covariance between X and Y. Once the latent components are extracted, PLS performs a linear regression of the response variables on them. The resulting PLS model can predict the response variables for new observations [
21].
PLS is particularly suitable for data with strong multicollinearity. It helps reduce the number of variables to consider, simplifying the model and reducing the risk of overfitting. PLS can be used for linear, logistic, and discriminant analyses. It is widely used in chemometrics for spectroscopic data analysis and bioinformatics for analyzing genomic data. The equation associated with this model is the following:
The weights w are determined to maximize the covariance between the scores and the response variable:
3.2.6. Least Absolute Shrinkage and Selection Operator (LASSO)
The LASSO method is a regularization technique used in statistics and machine learning for variable selection and regression. It is beneficial when you have many potentially predictive variables and want to identify the most relevant ones [
22]. The LASSO method can shrink some regression coefficients to zero. This means that the corresponding variables are effectively excluded from the model. This helps simplify the model by keeping only the most essential variables for prediction. Regularization is a technique used to prevent overfitting, which occurs when a model fits the training data too closely and fails to generalize effectively to new data [
23]. LASSO uses an L1 penalty, which is the sum of the absolute values of the regression coefficients. This penalty pushes the coefficients to shrink, and some become precisely zero. The equation associated with this model is the following:
3.2.7. Selection by Majority Vote (Voting)
The voting method aggregates results from several variable selection techniques. This study was implemented to increase the robustness and reliability of selecting the most relevant spectral bands for cocoa bean classification.
The process is based on the following key steps:
Application of selection methods: Several statistical methods (LASSO, Mutual Information, ANOVA, PLS, and LDA) are applied independently to the spectral data to identify discriminatory wavelengths.
Generation of spectral band lists: Each method produces a list of selected spectral bands. The number of times each spectral band was chosen among the different techniques is recorded.
Determination of the voting threshold: A selection threshold is set at four. Thus, if at least four of the five methods used identify a spectral band as relevant, a spectral band is retained in the final selection. This threshold was chosen to balance selection rigor (by reducing biases specific to a given method) with retaining sufficient bands for efficient learning.
Aggregation of results: The spectral bands meeting the majority criterion are grouped to form the final set of explanatory variables. This set is then used for training and evaluating classification models.
The voting approach thus capitalizes on the complementarity of the different selection techniques while limiting the risks of overfitting linked to an isolated method. It contributes to improving the generalization capacity of predictive models by retaining only the spectral bands deemed both stable and informative using several independent methods.
3.3. Algorithms for Classification
The choice of three algorithms, namely Support Vector Machine (SVM), Random Forest, and XGBoost, for cocoa bean classification is based on their strengths regarding robustness, performance, and ability to handle complex data. Each algorithm offers distinct advantages that can be leveraged to enhance the accuracy and reliability of cocoa bean classification.
3.3.1. Support Vector Machine (SVM)
SVM is known for handling high-dimensional data and finding optimal hyperplanes that separate classes with maximum margin. It is susceptible to overfitting, especially in complex feature spaces. Thanks to kernel functions that transform the feature space, it is particularly effective for classification problems where classes are well separated or when the data is not linearly separable. It can also handle nonlinear data using the radial kernel (RBF) kernel, which helps capture complex relationships between spectral bands in cocoa bean measurements [
24].
3.3.2. Random Forest
Random forests are ensemble methods that combine multiple decision trees, reducing the risk of overfitting and improving generalization. They are robust to outliers and noise in the data.
Random forests offer good accuracy performance and are capable of handling interpretable models. They can handle both numerical and categorical data, which is helpful for the diverse characteristics of cocoa beans.
Random forests can capture complex interactions between features by building multiple decision trees, which is beneficial for heterogeneous data [
25].
3.3.3. XGBoost
XGBoost is a boosting method that combines multiple weak models to form a strong one. It is robust to overfitting, thanks to regularization and model complexity control techniques. XGBoost is known for its high accuracy and training speed. It is often used in machine learning competitions because it produces accurate results. XGBoost can handle data with nonlinear relationships and complex interactions between features. It is also effective at handling missing data and heterogeneous features [
26].
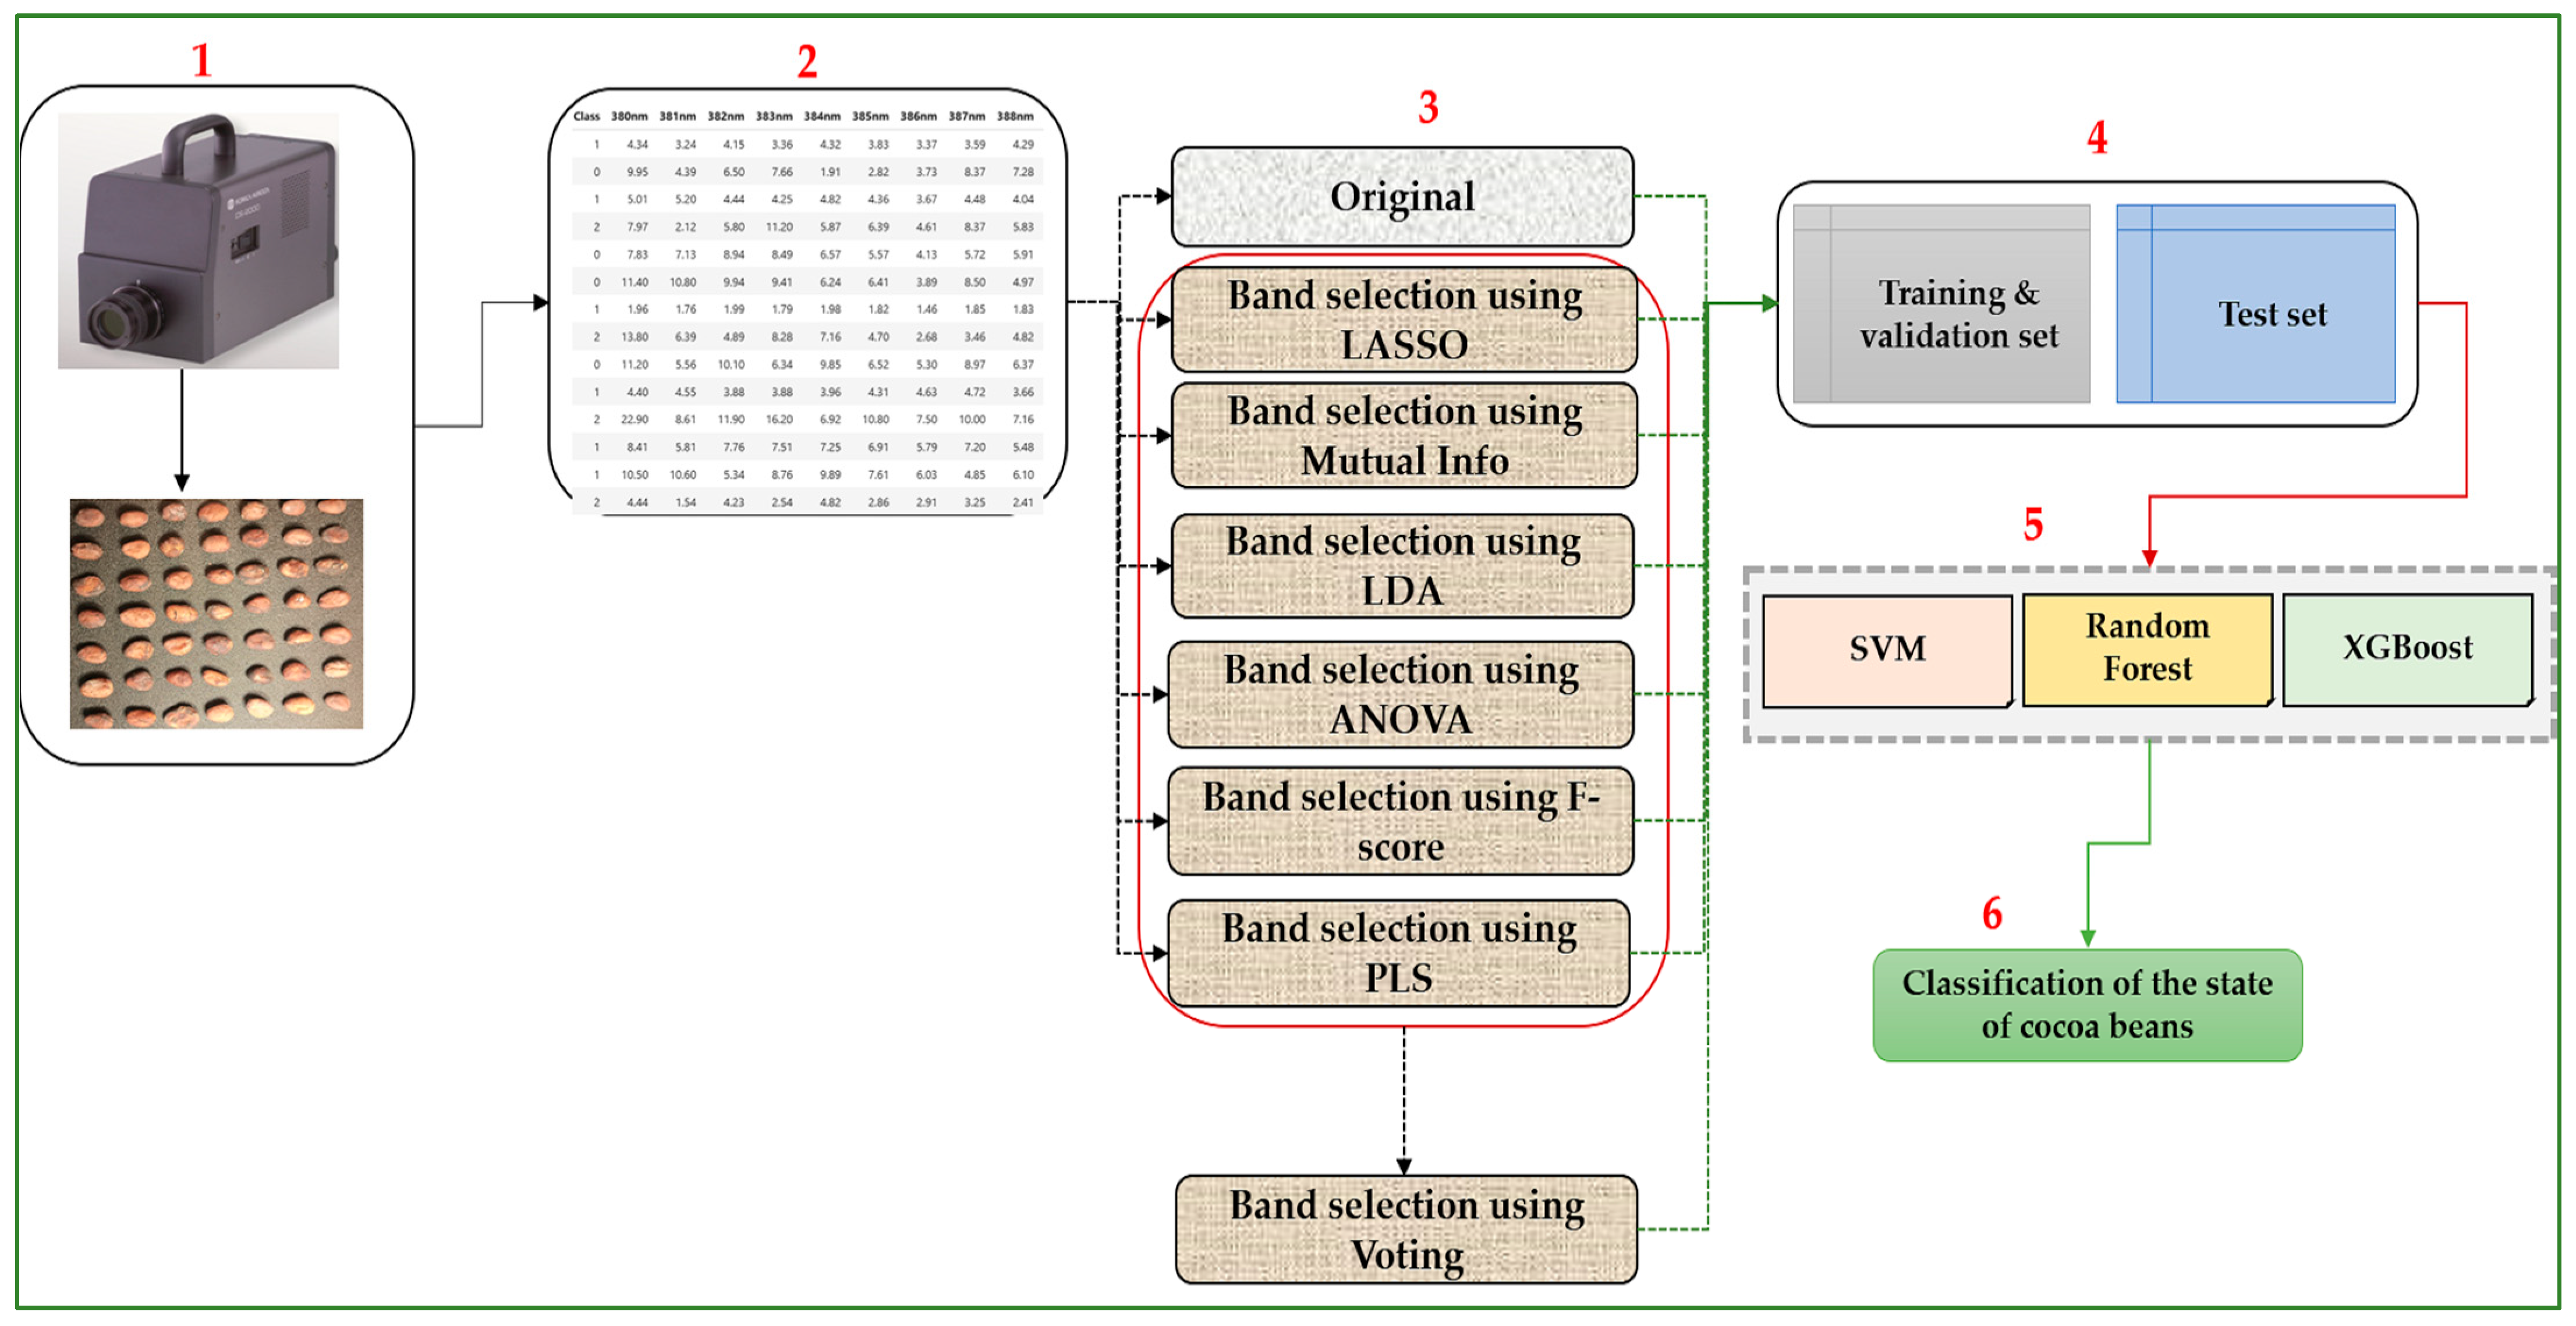
3.4. Pipeline Methodology
The methodology architecture describes the process of classifying the condition of cocoa beans from spectral measurement data.
Data Acquisition: This device captures the wavelengths of light reflected by cocoa beans. These data are then converted into digital values corresponding to different spectral bands.
Data Preparation: The raw dataset comprises spectral intensity measurements of cocoa beans across multiple wavelengths, ranging from 380 nm to 780 nm. The data are structured in a tabular format, where each row corresponds to a single cocoa bean and includes its spectral response along with its assigned class label:
- ○
0: Fermented;
- ○
1: Bad condition;
- ○
2: Non-fermented.
Spectral Band Selection: Spectral band selection is an essential step in reducing the dimensionality of the data while retaining the most discriminating features. Several band selection methods are applied:
- ○
LASSO (Least Absolute Shrinkage and Selection Operator): A regularization method that selects the most critical variables by forcing specific coefficients to zero;
- ○
Mutual Information: Evaluate the dependence between wavelengths and classes to retain only the most relevant ones;
- ○
LDA (Linear Discriminant Analysis): Finds a linear combination of features that maximizes the separation between classes;
- ○
ANOVA (Analysis of Variance): Select the bands with the most significant variance between groups;
- ○
F-score: Used to evaluate the relevance of features based on inter- and intra-class variance;
- ○
PLS (Partial Least Squares Regression): A dimensionality reduction method that finds the most informative spectral bands;
- ○
Voting: After applying these methods, a final selection is made by combining the results of the different approaches to identify the most relevant spectral bands.
Data Splitting: The resulting data are split into two sets:
- ○
Training and Validation Set: Used for training and adjusting models;
- ○
Test Set: Reserved for final performance evaluation.
Classification: Three machine learning algorithms are used to classify the condition of cocoa beans:
- ○
SVM (Support Vector Machine): A classification model that uses hyperplanes to separate classes;
- ○
Random Forest: An ensemble of decision trees that improves robustness and generalization;
- ○
XGBoost (Extreme Gradient Boosting): A decision tree-based model optimized for performance.
Final Classification: The trained model predicts the condition of cocoa beans based on selected spectral characteristics. The goal is to achieve an accurate classification that distinguishes between fermented, bad condition, and non-fermented beans.
Figure 5 presents the general framework of our methodology.
3.5. Performance Metric
To evaluate the performance of the studied models, we will use several metrics, including accuracy, precision, mean squared error (MSE), recall, F1-score, Matthew’s correlation coefficient (MCC), and the ROC curve. Specific formulas define these metrics:
Accuracy: Measures the model’s ability to correctly classify data into the appropriate classes;
Precision: The ratio of instances correctly classified as positive to the total number of instances predicted as positive;
Recall: The classifier’s ability to correctly identify all truly positive instances;
F1-score: The weighted harmonic means of precision and recall;
Matthew’s correlation coefficient (MCC): Assesses the overall quality of classifications;
Mean Squared Error (MSE): The average of the squared differences between the predicted and actual values.
The variables used in performance evaluation are as follows:
True Positives (TP): Instances correctly classified as positive;
False Positives (FP): Instances incorrectly classified as positive while actually negative;
True Negatives (TN): Instances correctly classified as negative;
False Negatives (FN): Instances incorrectly classified as negative when they are positive;
Yi: The actual values from the dataset;
Ŷi: The predicted values from the dataset.
We utilized the ROC curve to evaluate the model’s performance, based on two key indicators: sensitivity and specificity. The ROC curve visually assesses the model’s performance and is one of the most important metrics for evaluating its effectiveness.
Additionally, we used the confusion matrix, which provides a detailed analysis of predictions by categorizing the results into true positives, false positives, true negatives, and false negatives.
4. Experiments and Results
In our experiment, we applied several statistical methods for spectral band selection to the cocoa bean measurements, including LASSO, Mutual Information, ANOVA, PLS, and LDA. Each method was used to identify the most discriminating spectral bands, i.e., those that provided the most relevant information for classification.
To improve the robustness of the selection, we then adopted a voting-based approach. This principle consists of retaining only spectral bands selected by at least four of the five statistical methods used. This strategy reduces the impact of method-specific biases and optimizes the quality of the bands retained for classification.
Once the spectral band selection was completed, we classified them using three benchmark classifiers: XGBoost, SVM, and Random Forest. Classification was performed for each selection method and the voting-based approach to assess the impact of each strategy on model performance. The results of each selection method will be presented in detail, allowing for an analysis of their respective performances. A general comparison will also be conducted to identify the optimal combination of techniques for efficiently classifying cocoa beans.
4.1. Detailed Overview of the Experimental Setup
The data used in this study come from spectral measurements performed on cocoa beans using a Konica-Minolta CS-2000 spectroradiometer. Measurements were carried out in the visible range (380–780 nm), allowing the reflection spectrum of each sample to be obtained. The cocoa beans were categorized into three fermentation states: fermented, unfermented, and bad condition.
Our dataset consists of 90 spectral measurements of cocoa beans, evenly distributed across three classes (30 measurements per class). We adopted a stratified splitting strategy to ensure a reliable assessment of the classification models’ performance and to preserve the proportion of classes in the data subsets. Thus, 70% of the measurements were used for training, and the remaining 30% served as a test set.
Furthermore, to enhance the reliability of the results and limit the effects of a single random split, we applied cross-validation, ensuring better model generalization and optimal use of the dataset. This approach allows for more robust evaluations that are representative of the algorithms’ actual performance.
The classification experiments used three supervised learning algorithms: Random Forest, Support Vector Machine (SVM), and XGBoost. The Random Forest and SVM algorithms were implemented using the scikit-learn library (version 1.0.1), while the XGBoost model was implemented using the xgboost library (version 1.6.2).
The Random Forest classifier was parameterized with n_estimators = 100, resulting in the construction of 100 decision trees. For the SVM, a linear kernel (kernel = “linear”) was used for class separation, and the probability = True option was enabled to calculate the probabilities associated with each prediction.
For the XGBoost model, the use_label_encoder = False and eval_metric = ‘mlogloss’ parameters were specified. The first one allows the disabling of the default label encoder, deprecated in recent versions of the library. In contrast, the second one defines the multiclass log-loss as the evaluation metric suitable for multiclass classification problems.
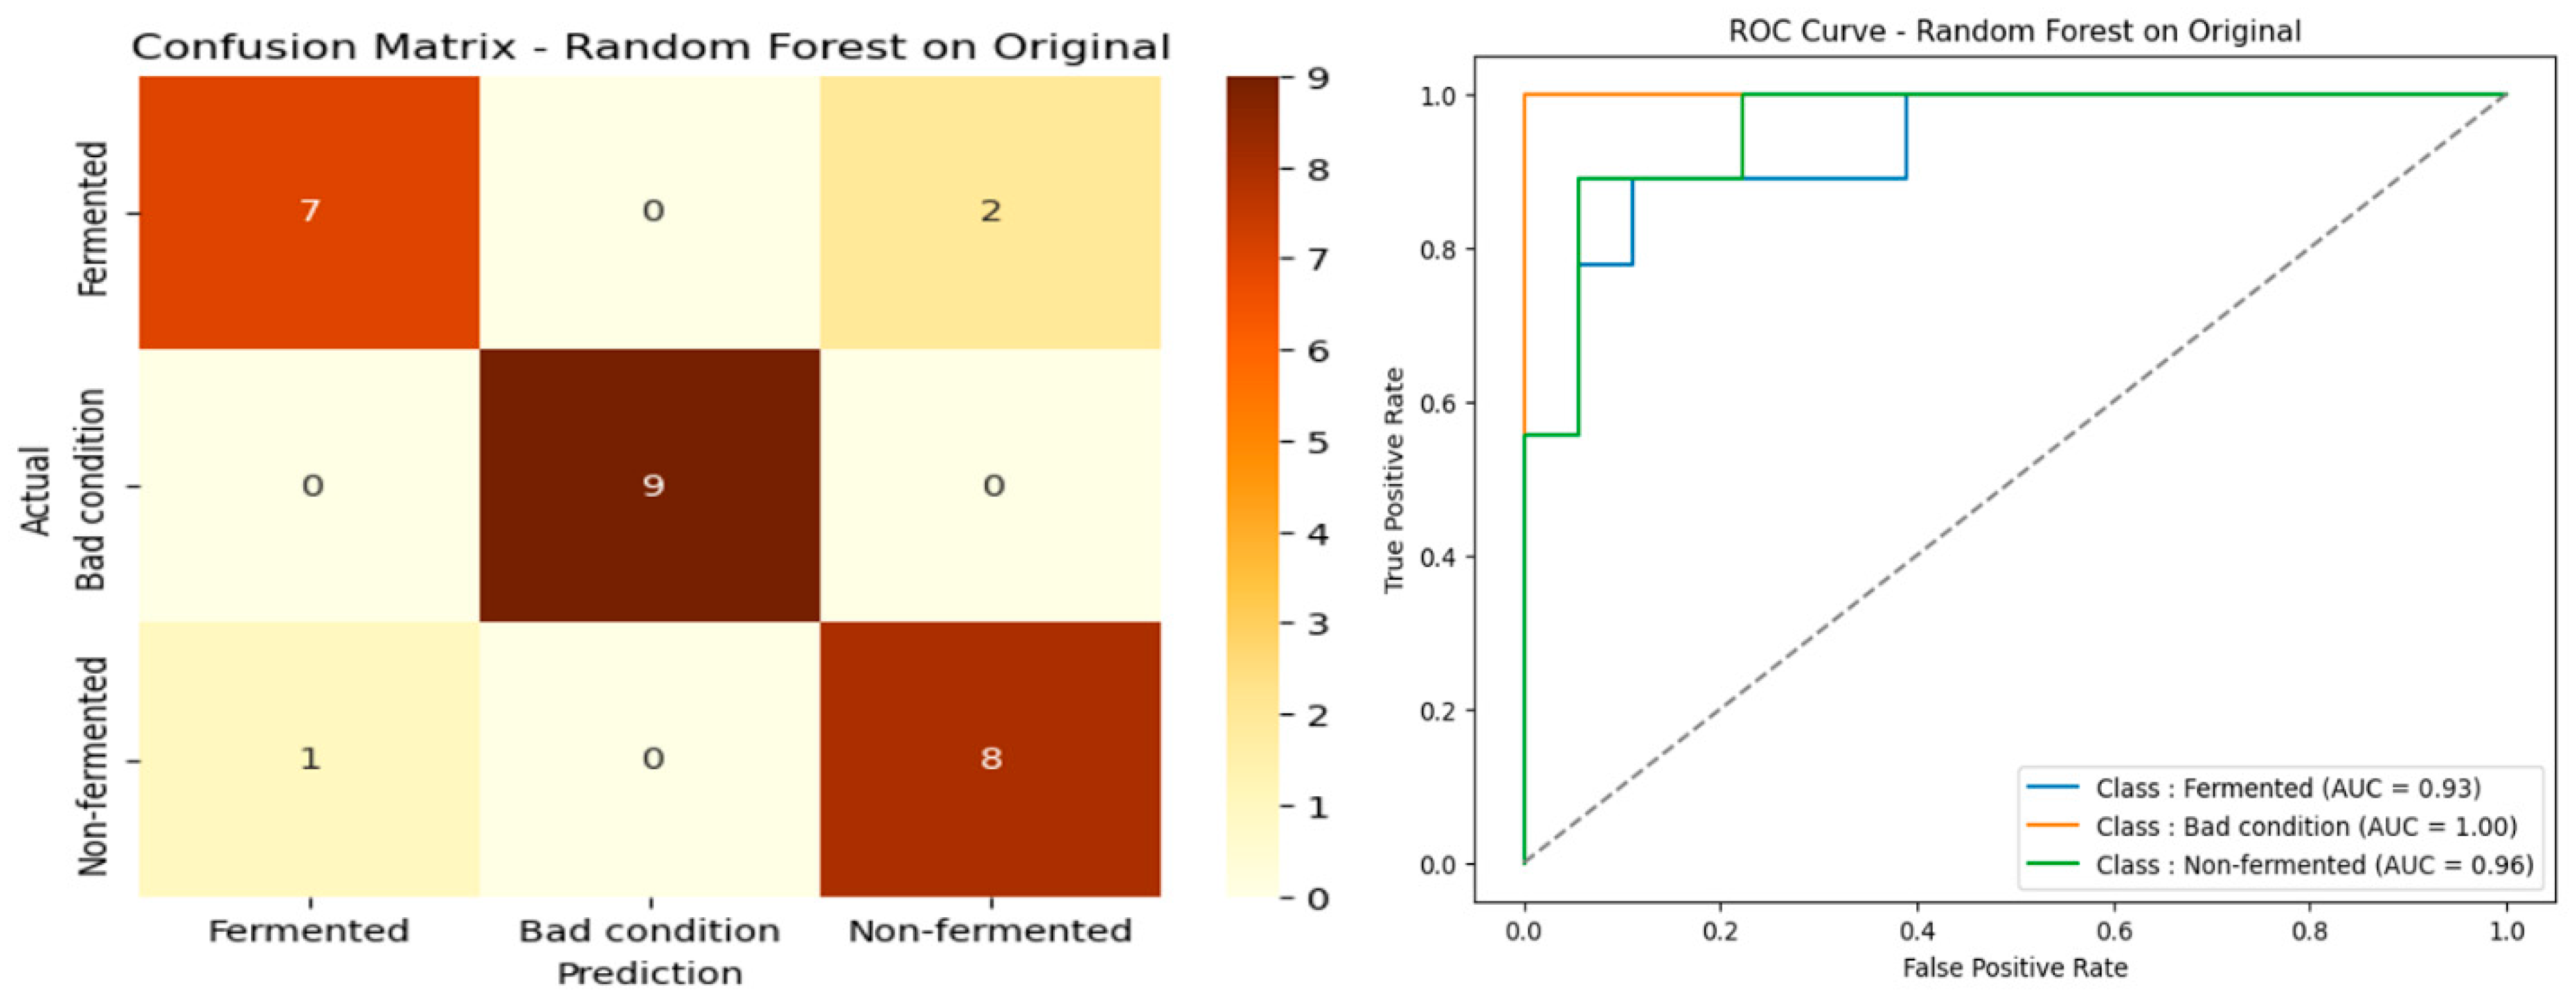
4.2. Original Spectral Bands Without Selection
Table 1 highlights that Random Forest is the best-performing algorithm for classifying cocoa beans across all spectral bands. It achieves an accuracy of 88.89%, an F1-score of 88.85%, and an MCC of 83.51%, outperforming other models in both performance and robustness.
Analysis of the original spectral data confirms the robustness and stability of Random Forest, which combines high accuracy with low variance. SVM is a reliable alternative with relatively consistent results. In contrast, XGBoost, despite its reputation for efficiency, was unable to optimally adapt to the complex characteristics of the raw spectral data.
Figure 6 represents its confusion matrix and the ROC curve of Random Forest.
4.3. Spectral Bands Selected by LASSO
Table 2 shows the algorithms’ performance after spectral band selection using the LASSO method. Once again, Random Forest stands out as the best-performing algorithm, achieving an accuracy of 85.19%, an equivalent F1 score, and an MCC of 77.78%, confirming its robustness and superiority even after dimensionality reduction. The stability of the standard deviations reinforces the idea that Random Forest remains reliable on transformed data. The performance of SVM and XGBoost is comparable, with an accuracy of 81.48%, but their lower MCC scores (72.37%) reflect lower discriminatory ability. This suggests that although LASSO selection reduces data complexity, Random Forest takes better advantage of the key variables selected, ensuring a good compromise between model simplicity and predictive accuracy. The confusion matrix and ROC curve in
Figure 7 confirm these results, demonstrating good generalization ability and adequate distinction between classes.
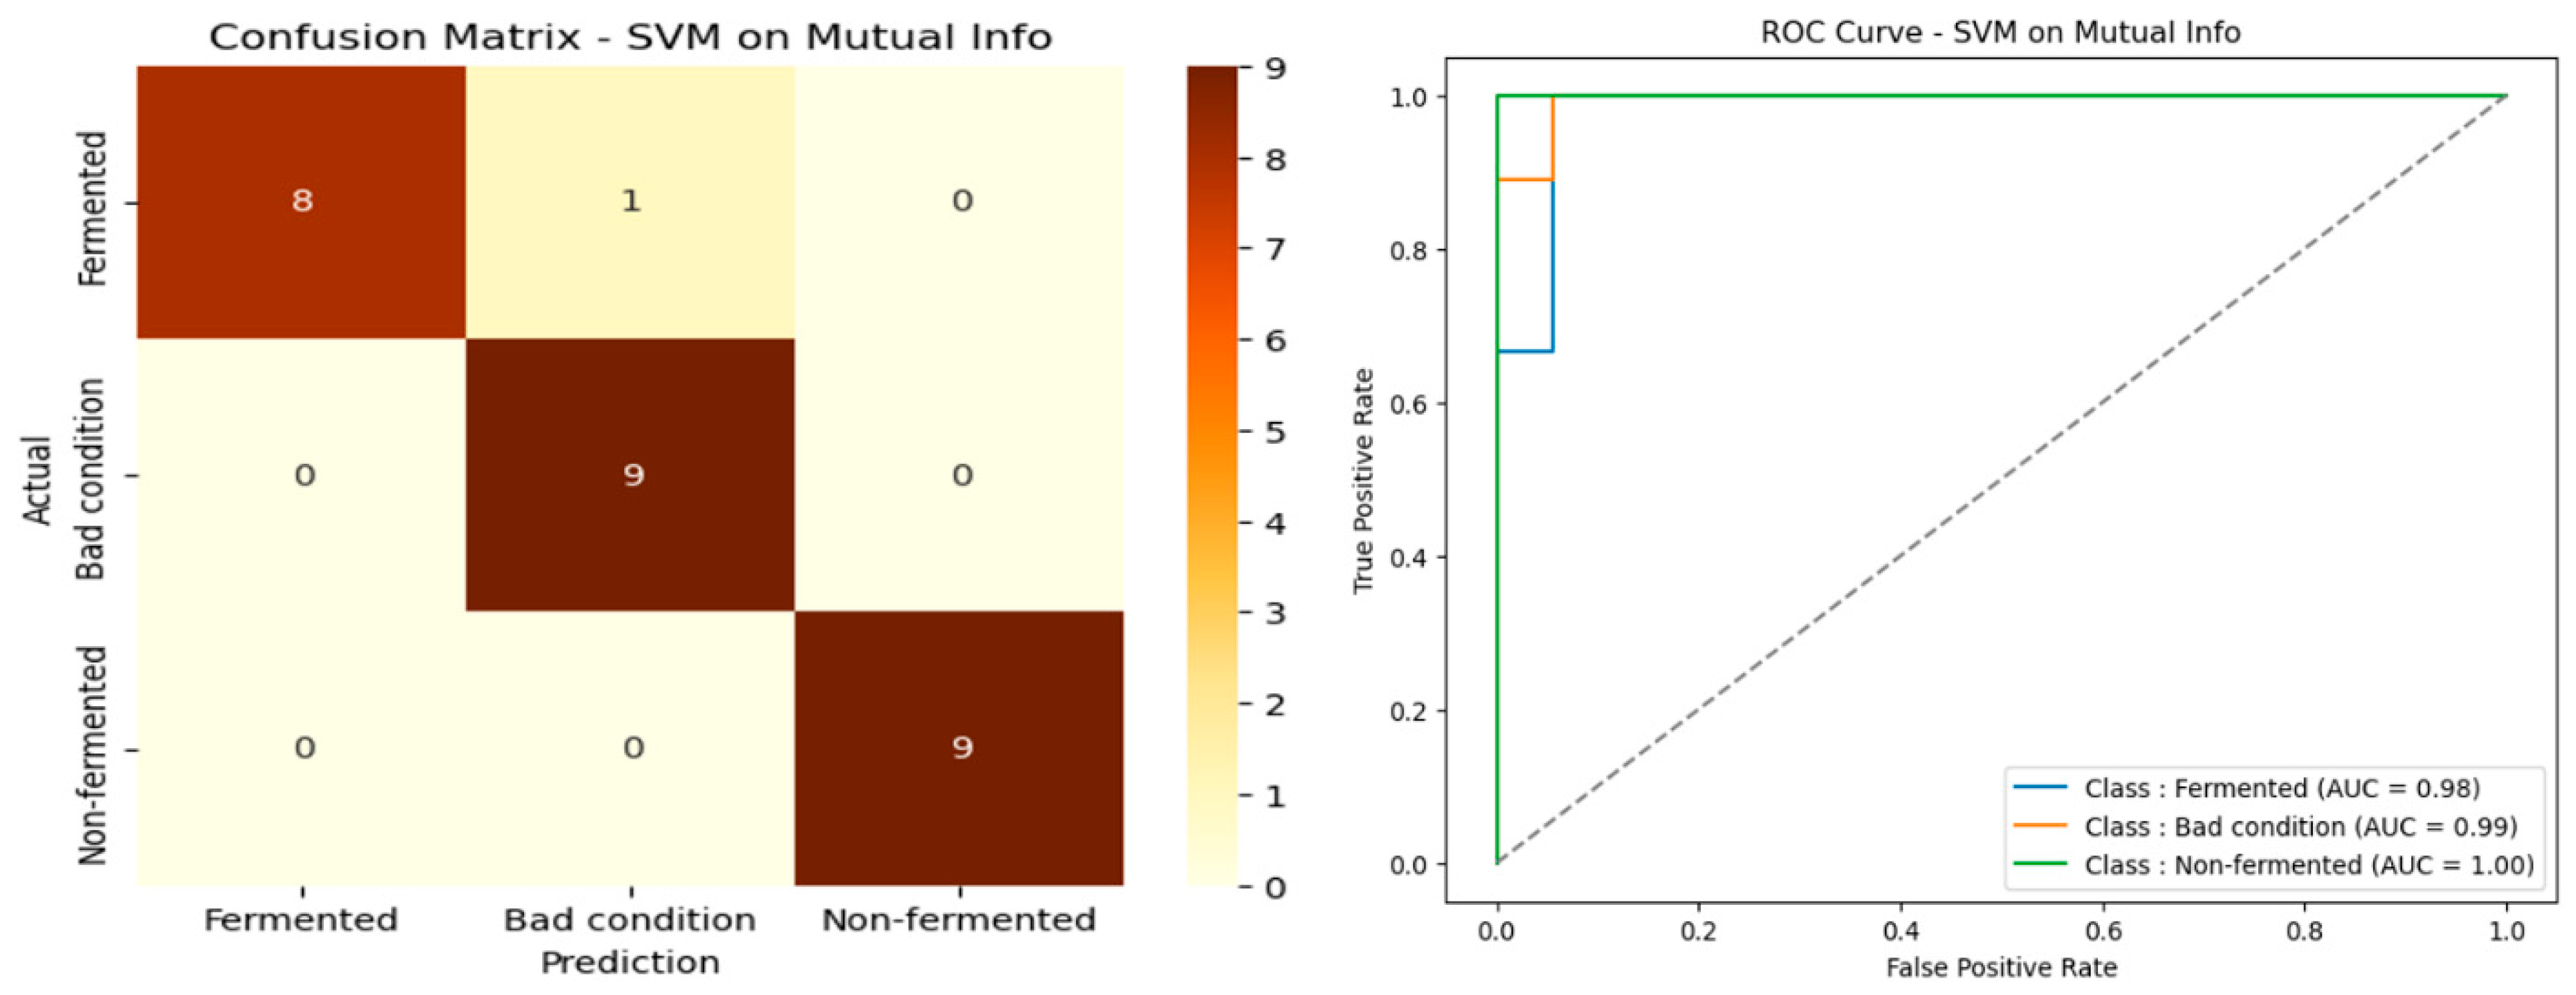
4.4. Selected Spectral Bands by Mutual Information
Performance analysis on the spectral bands selected by Mutual Information in
Table 3 highlights the superiority of the SVM model, which achieved a remarkable accuracy of 96.30%, an F1 score of 96.28%, and a high MCC of 94.64%, with a low variance (±2.91). These results reflect the SVM’s excellent generalization capacity and strong robustness against features extracted using this selection method. Although Random Forest and XGBoost maintain high performance (88.89% accuracy each), their respective MCC scores (83.51% and 84.92%) and slightly higher standard deviations indicate they are less effective than the SVM. The Mutual Information approach thus better leverages the strengths of the SVM, making it particularly suited to classifying cocoa beans based on an optimized subset of spectral bands. The confusion matrix and ROC curve presented in
Figure 8 confirm this performance, illustrating excellent class separation and significant error reduction.
4.5. Selected Spectral Bands by ANOVA
Performance evaluation on the selected spectral bands using ANOVA in
Table 4 confirms the superiority of the Random Forest model, which achieves an accuracy of 92.59%, an F1 score of 92.50%, and an MCC of 89.63%, with relatively low standard deviations (±3.92 for accuracy), demonstrating increased stability and robustness. These results indicate that Random Forest effectively exploits the discriminative features extracted by ANOVA, providing excellent classification capability on filtered spectral data. The performance of the SVM and XGBoost models, while acceptable (85.19% accuracy for each), lags. Their MCC scores (79.95% and 78.26%, respectively) and F1-score (83.96% and 85.49%) show lower classification consistency, accompanied by slightly greater variations. These differences suggest that ANOVA favors Random Forest, reinforcing its role as a reference model in classifying cocoa beans from selected spectral bands. The confusion matrix and ROC curve presented in
Figure 9 confirm this performance, illustrating good class separation and increased model robustness.
4.6. Selected Spectral Bands Using Partial Least Squares (PLS)
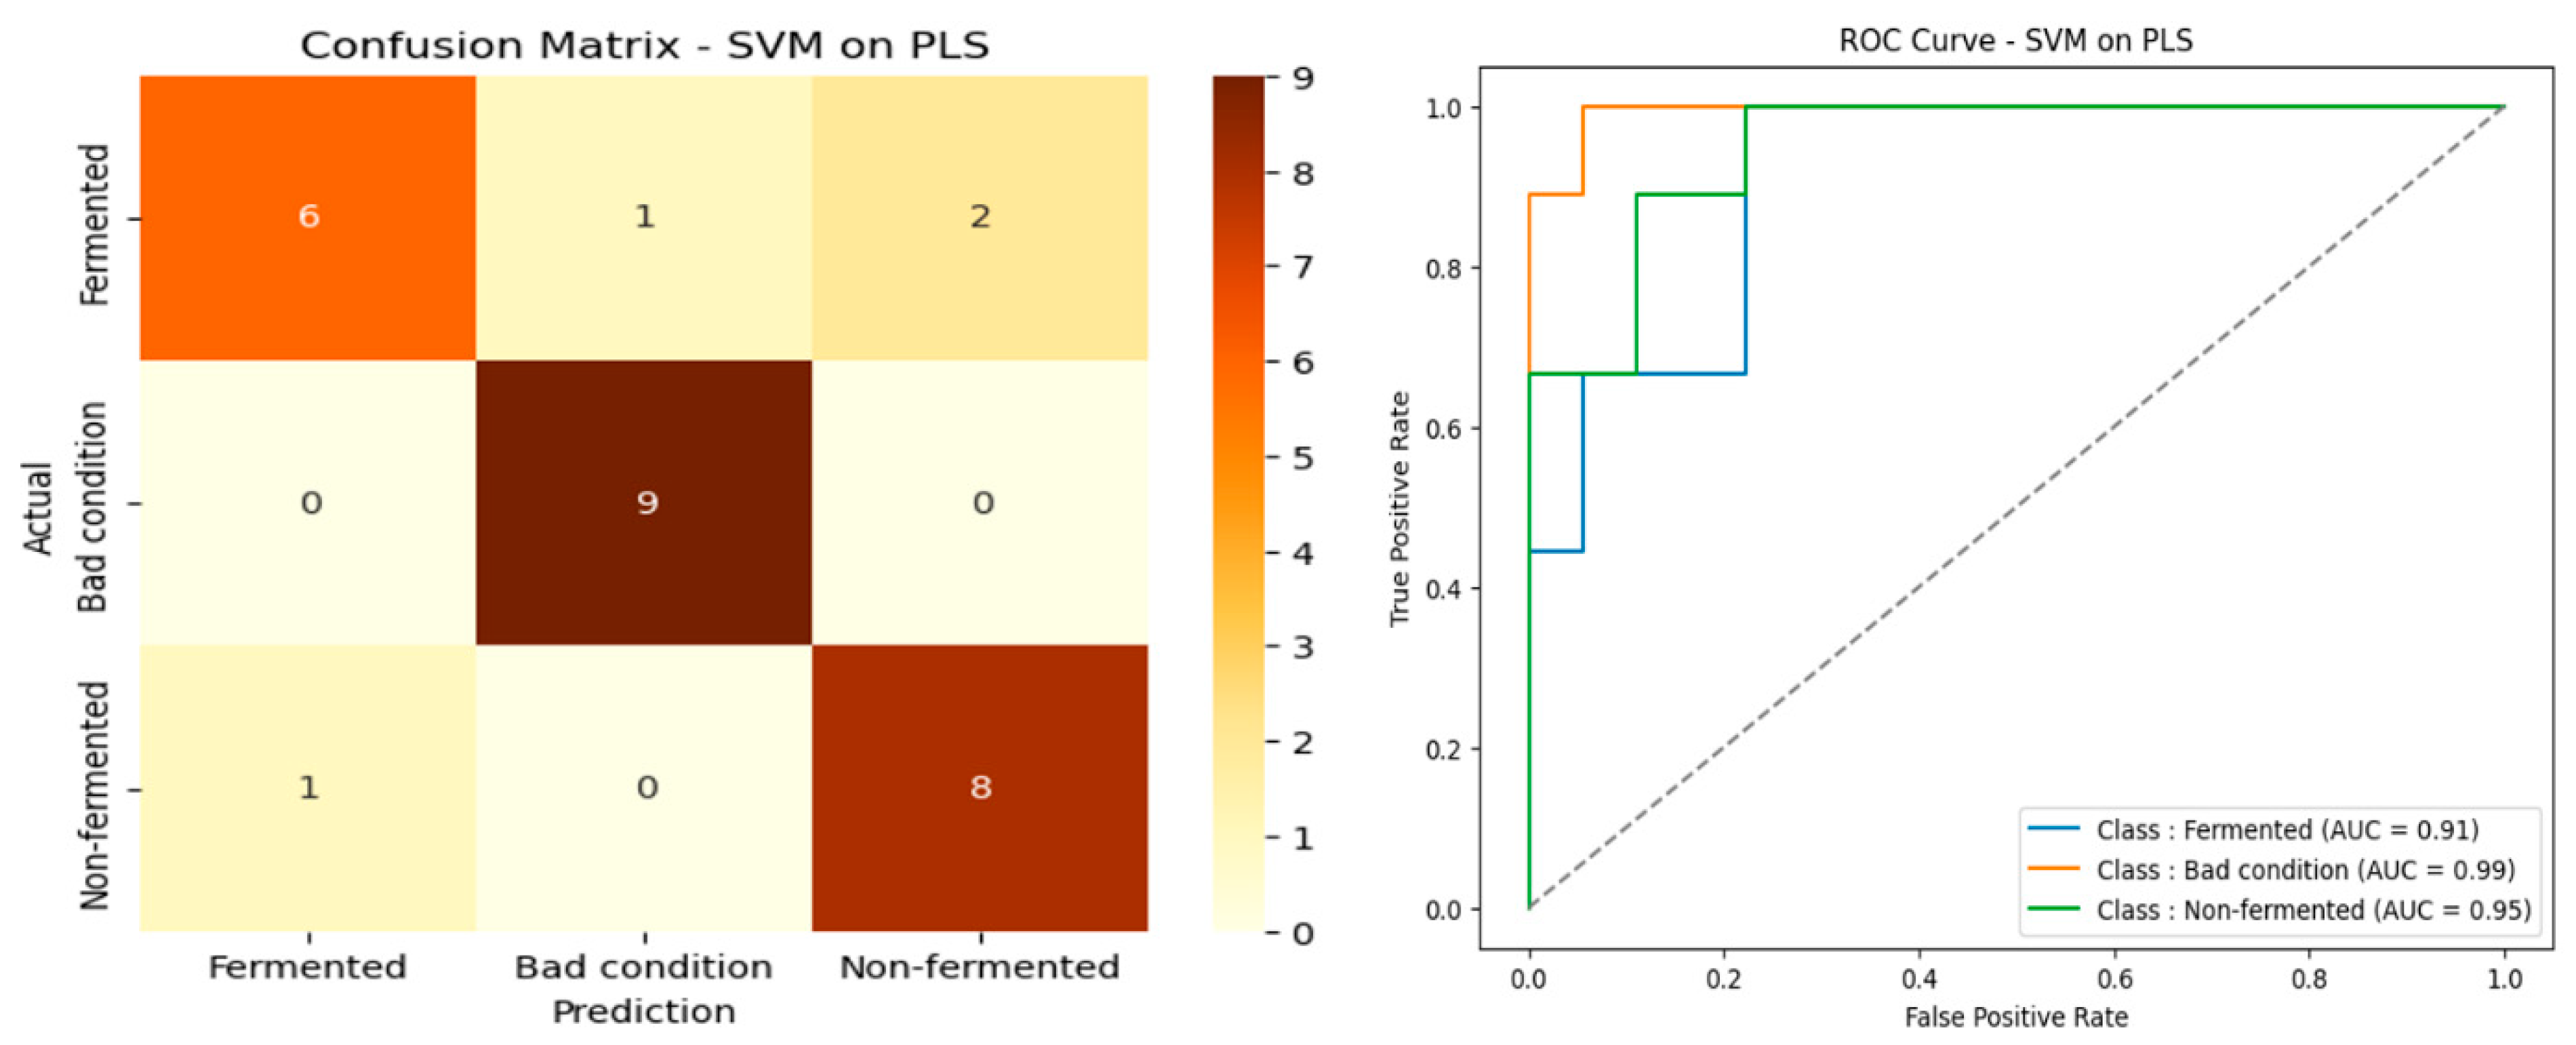
Performance analysis on the spectral bands selected using PLS in
Table 5 reveals nearly equal results between the three algorithms evaluated. All achieved an identical accuracy of 85.19%, accompanied by similar values for F1-score, precision, and recall, with relatively moderate standard deviations (ranging from ±3.24 to ±7.32 depending on the metrics and models). Among them, SVM stood out slightly with an MCC of 78.26%, compared with 77.94% for Random Forest and XGBoost, suggesting a slight superiority in classification consistency. However, the overall differences remain small and statistically insignificant, indicating that the PLS method normalizes performance between models without allowing any one to dominate clearly. These results show that variable selection using PLS produces a balanced feature space, enabling consistent classification regardless of the algorithm used. However, for the sake of robustness, the SVM could be preferred, particularly in an application context where the stability of the model is essential. The confusion matrix and ROC curve in
Figure 10 confirm these results, attesting to the model’s reliability.
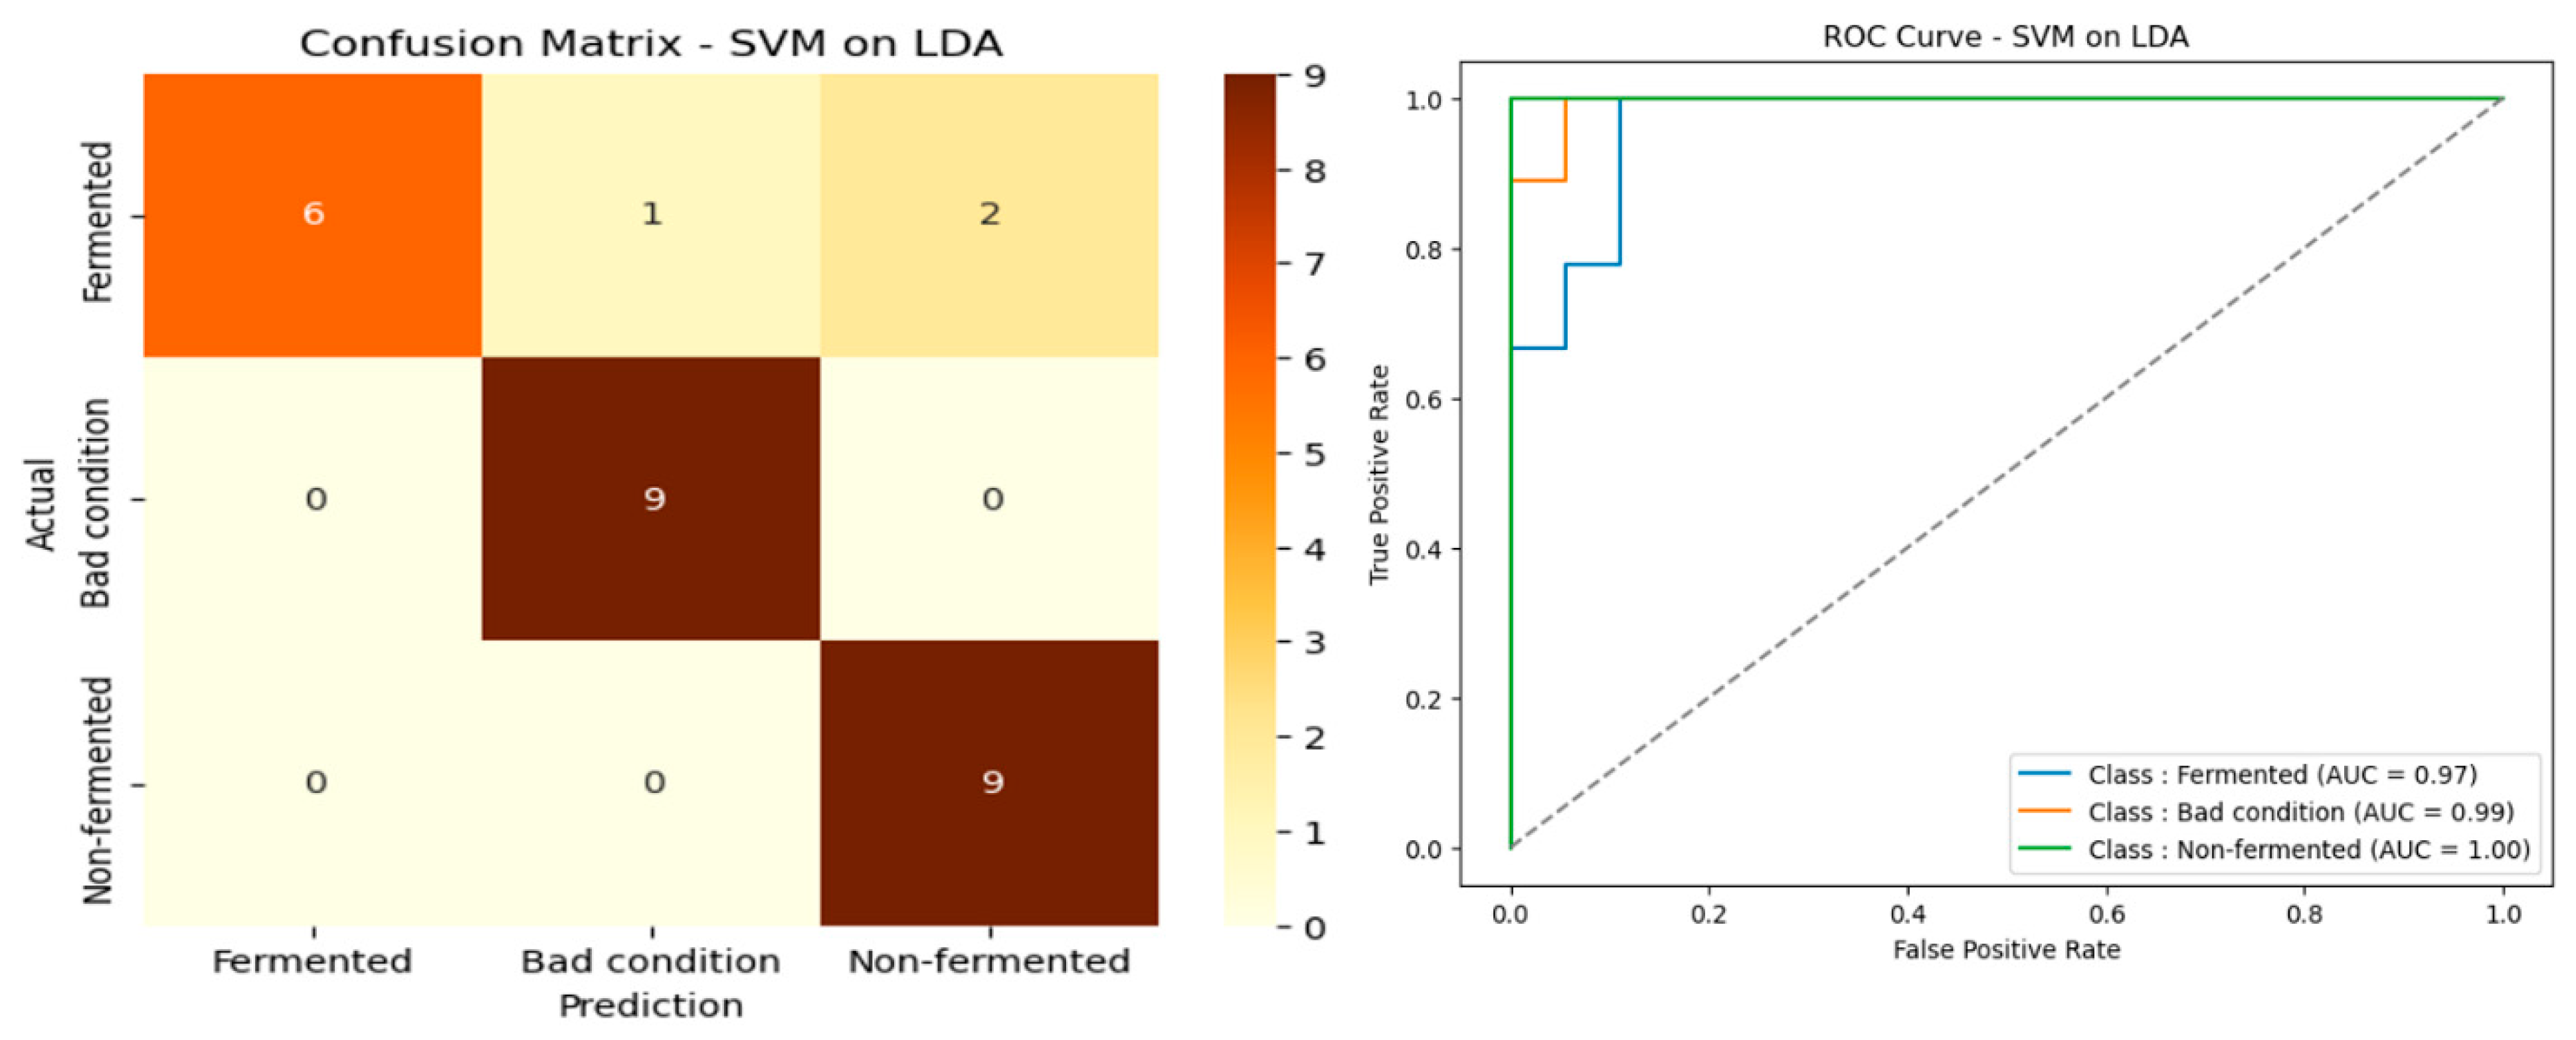
4.7. Selected Spectral Bands Using Linear Discriminant Analysis (LDA)
The results in
Table 6 show that the spectral band selection method based on Linear Discriminant Analysis (LDA) achieved excellent overall performance for the three algorithms evaluated. The SVM stands out as the best classifier, with an accuracy of 88.89% ± 3.95, an F1-score of 88.25% ± 4.11, and an MCC of 84.56% ± 5.43, indicating reliable classification and good stability. The performance of the Random Forest is also remarkable, with accuracy and F1-score identical to those of the SVM (88.89% ± 3.24) and an MCC of 83.51% ± 4.83, making it a very competitive alternative. In contrast, XGBoost, while achieving decent performance (85.19% ± 4.32 accuracy), remains behind the other two models, particularly in terms of MCC (77.94% ± 6.42), showing slightly lower robustness for classifying spectral data processed using LDA. These results confirm the relevance of LDA selection to improving spectral data quality and reveal that SVM is somewhat more reliable for this particular configuration. The confusion matrix and ROC curve presented in
Figure 11 confirm this performance, illustrating good class separation and increased model robustness.
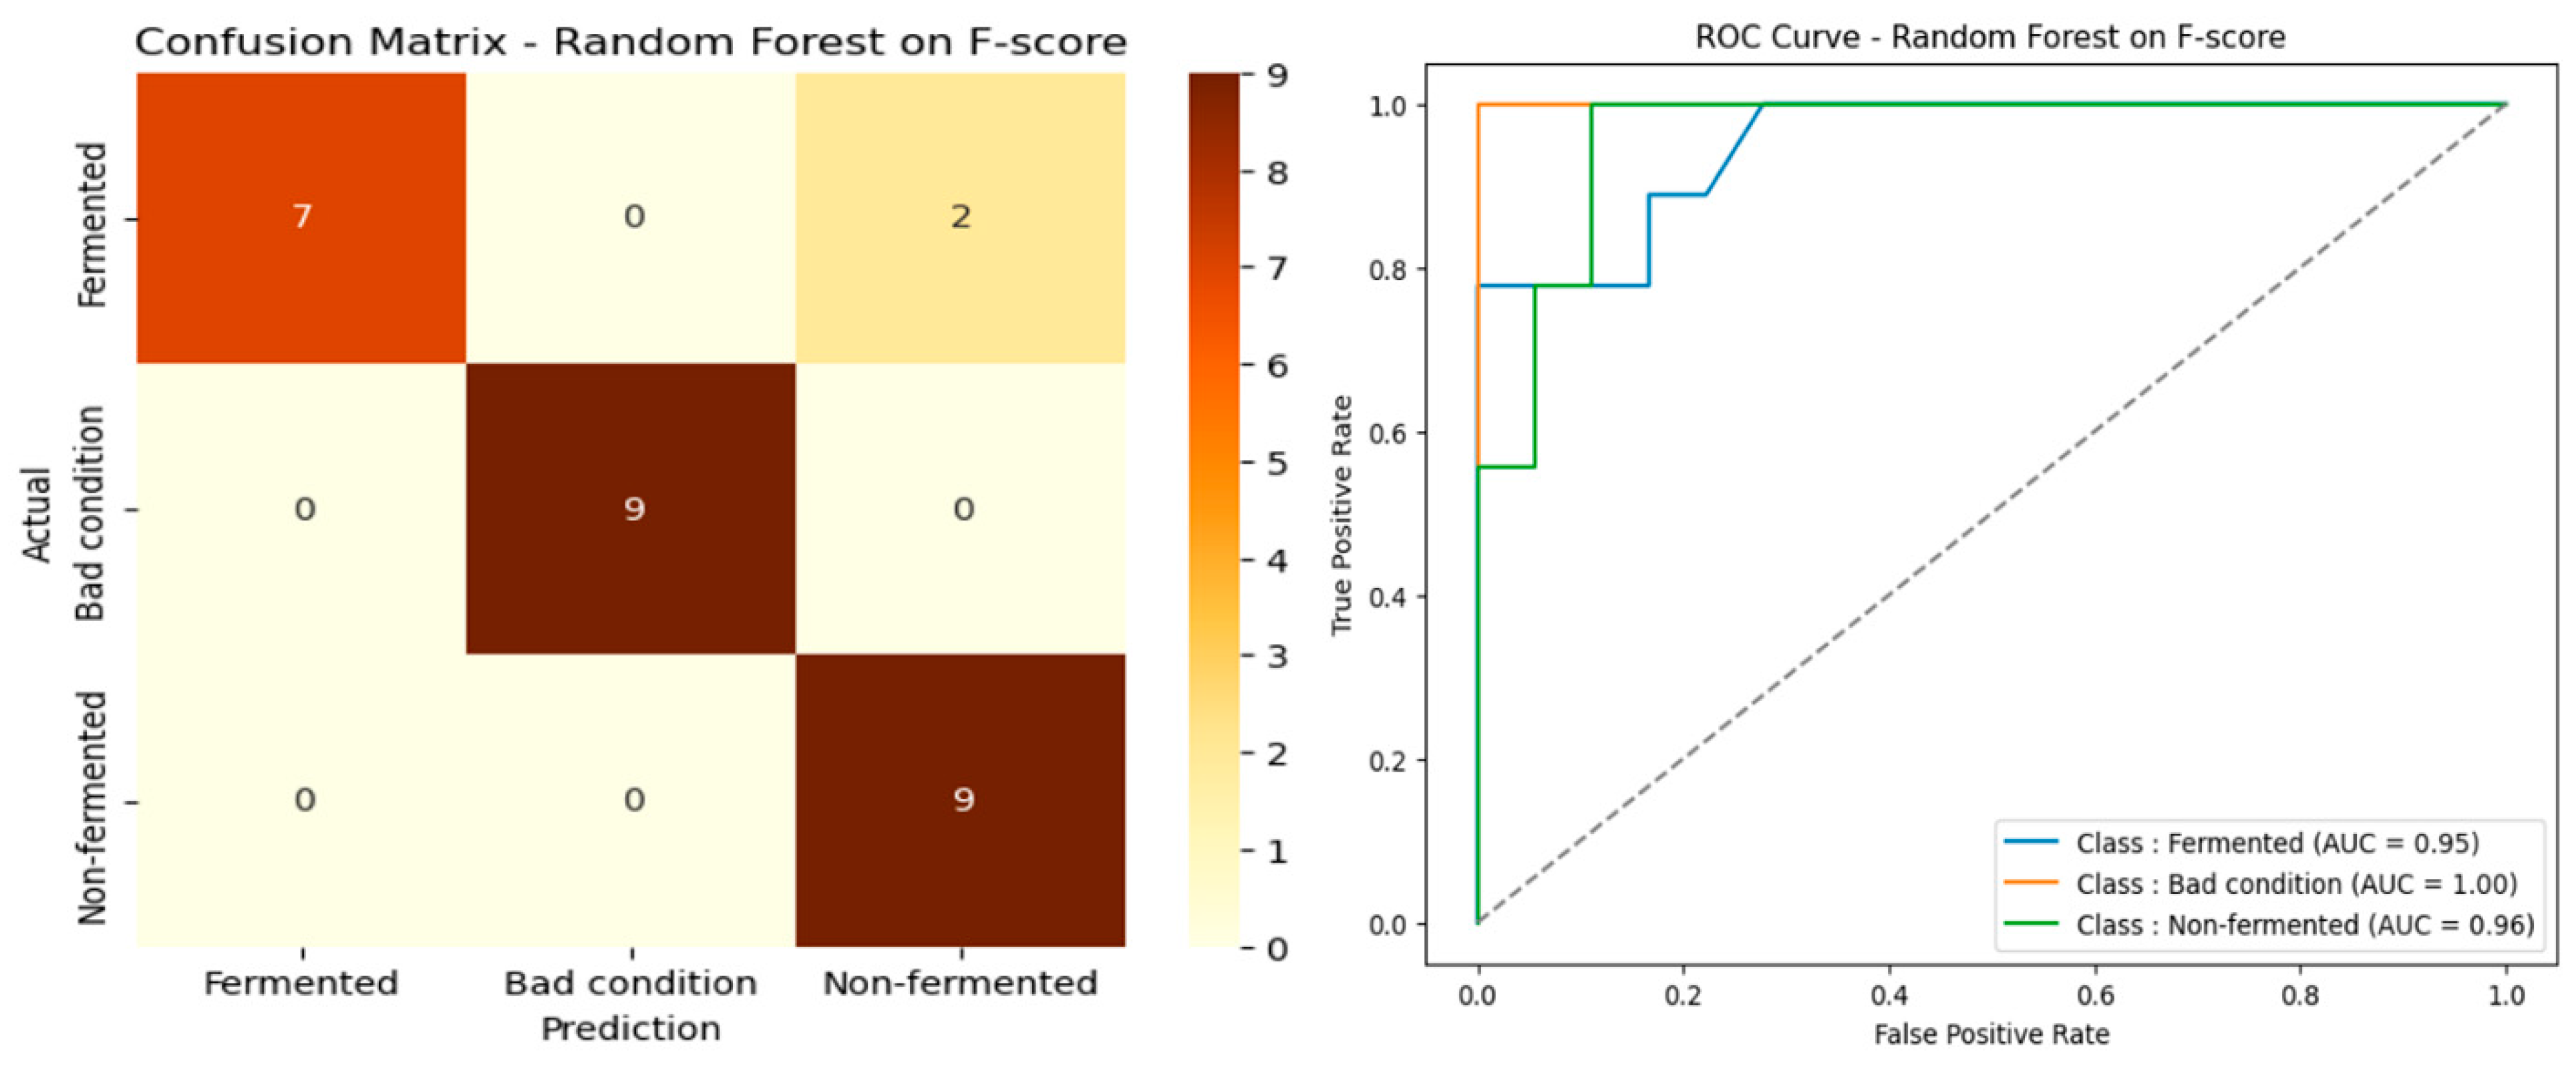
4.8. Selected Spectral Bands Using Linear F-Score
The results presented in
Table 7 show that the F-score-based spectral band selection method achieved excellent overall performance for all three evaluated algorithms. Random Forest stands out as the best classifier, with an accuracy of 92.59% ± 3.92, an F1-score of 92.50% ± 3.25, and an MCC of 89.63% ± 4.83, indicating reliable classification and excellent stability. The performance of SVM is also remarkable, with an accuracy of 85.19% ± 4.43, an F1-score of 83.96% ± 4.77, and an MCC of 79.95% ± 5.97, making it a competitive alternative. On the other hand, although XGBoost shows satisfactory performance, with an accuracy of 85.19% ± 4.20, it falls behind the other two models, especially in terms of MCC (78.26% ± 6.14), showing a slightly lower robustness for the classification of spectral data processed using F-score. These results confirm the relevance of spectral band selection using F-score to improve spectral data quality and reveal that Random Forest is more reliable overall for this particular configuration. The confusion matrix and ROC curve presented in
Figure 12 confirm these results, demonstrating excellent class separation and increased model robustness.
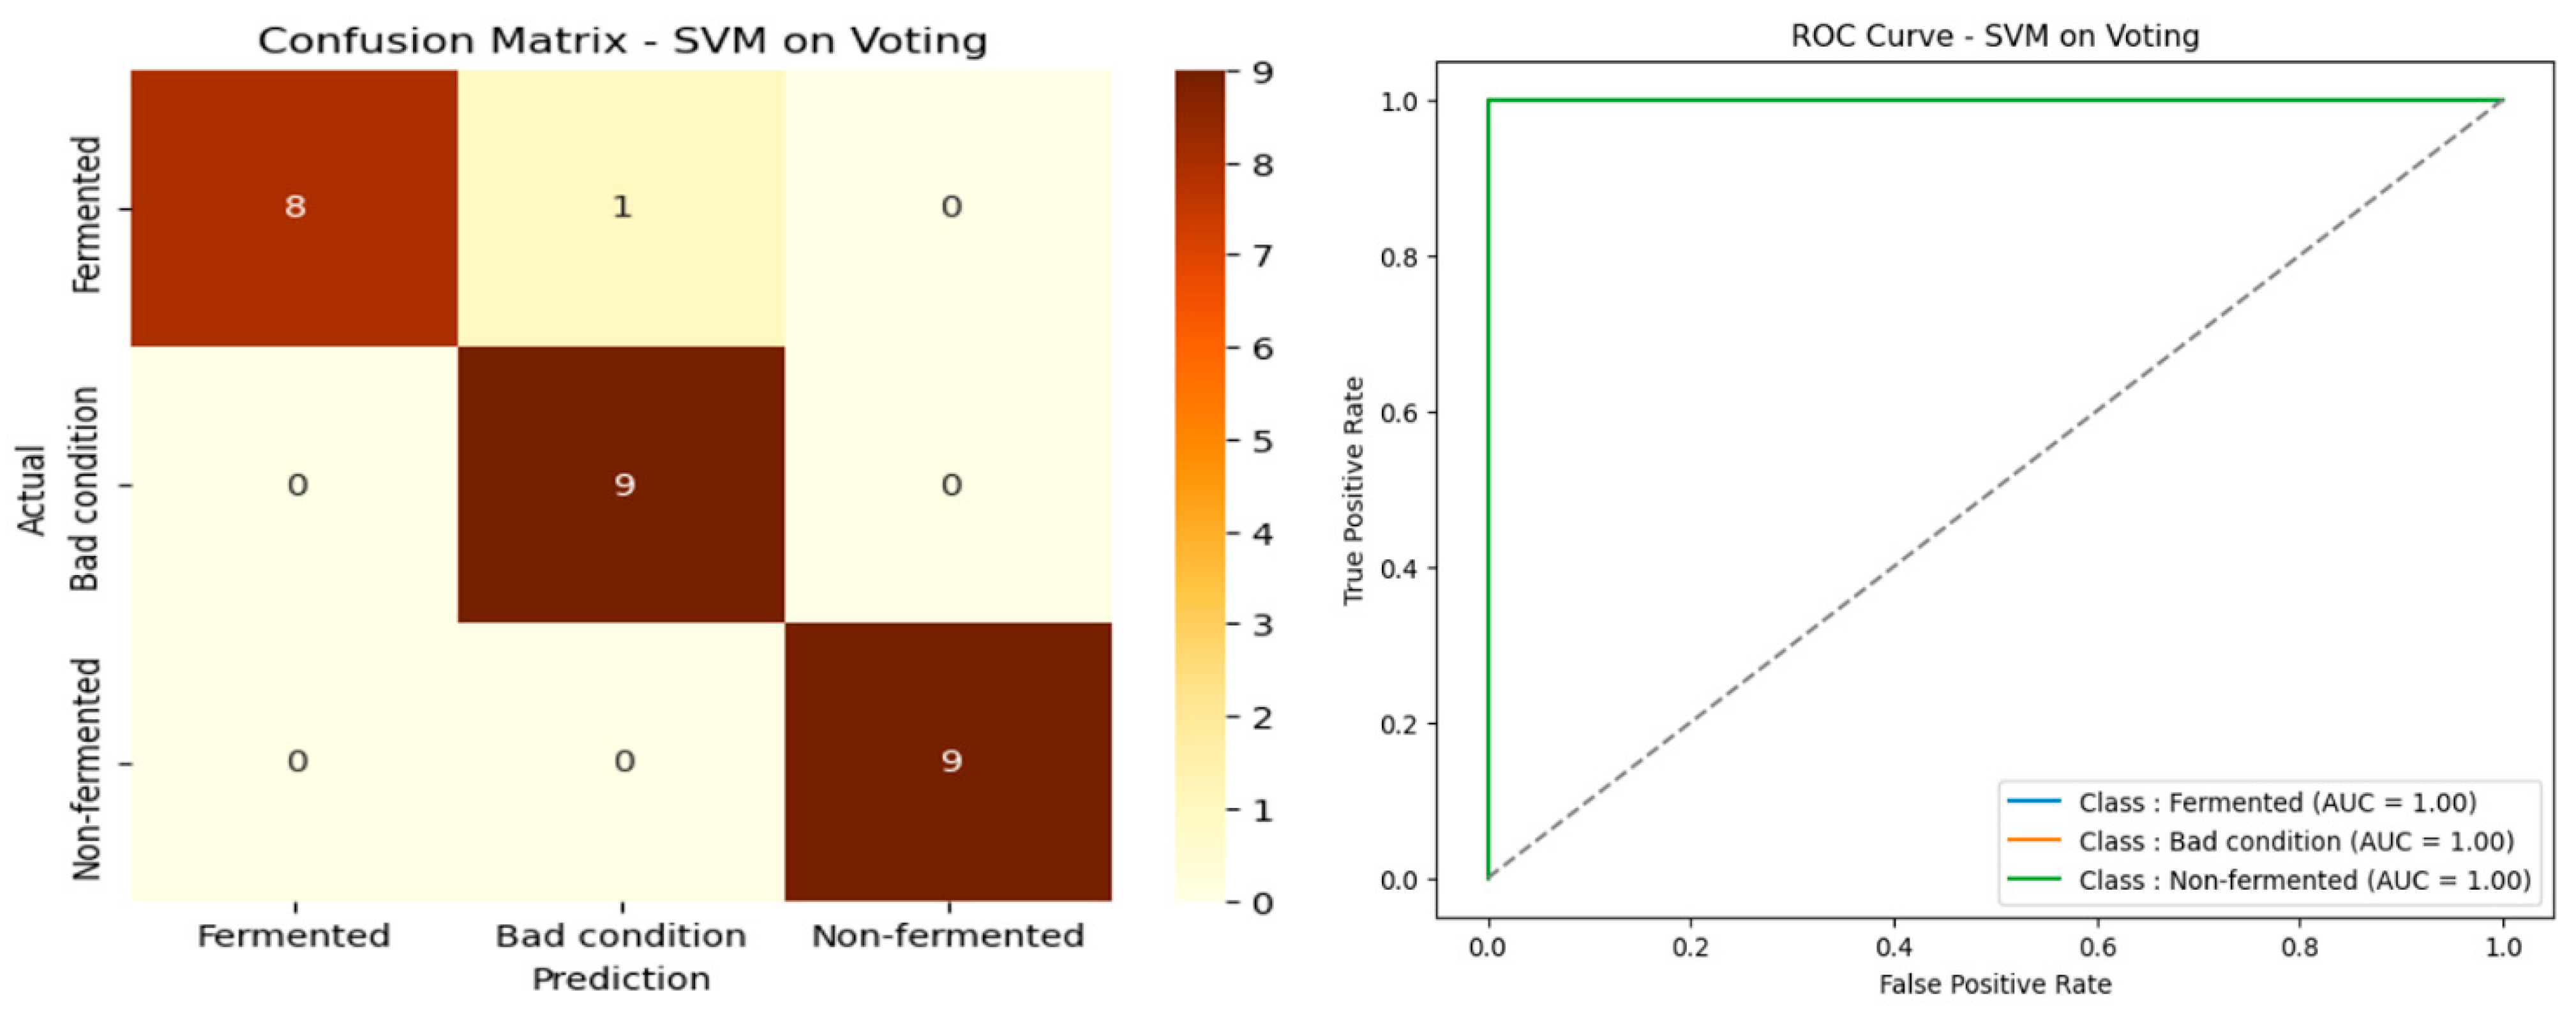
4.9. Selected Spectral Bands Using Voting
The results presented in
Table 8 show that the Voting-based spectral band selection method significantly improved the algorithms’ performance, particularly for the SVM. The latter stands out as the best classifier, with an accuracy of 96.30% ± 3.49, an F1-score of 96.28% ± 3.44, and an MCC of 94.64% ± 5.25. These results reflect extremely reliable classification, excellent consistency between precision and recall, and a very low prediction error (MSE = 0.0370), demonstrating the model’s robustness. Random Forest also performed well, with an accuracy of 88.89% ± 3.39 and an F1-score of 88.85% ± 3.41, along with an MCC of 83.51% ± 4.97, making it an attractive alternative but significantly less efficient than SVM in this context.
In contrast, XGBoost performed more modestly, with an accuracy of 85.19% ± 3.95 and an MCC of 77.94% ± 5.91, indicating good classification capability but lower stability and reliability than the other two models.
These results confirm the effectiveness of the Voting method for spectral band selection and highlight the superiority of SVM in this specific configuration. The SVM model thus proves to be the most accurate and robust for classifying spectral data resulting from this selection strategy.
The confusion matrix and ROC curve presented in
Figure 13 confirm these results, demonstrating excellent class separation and optimized model performance.
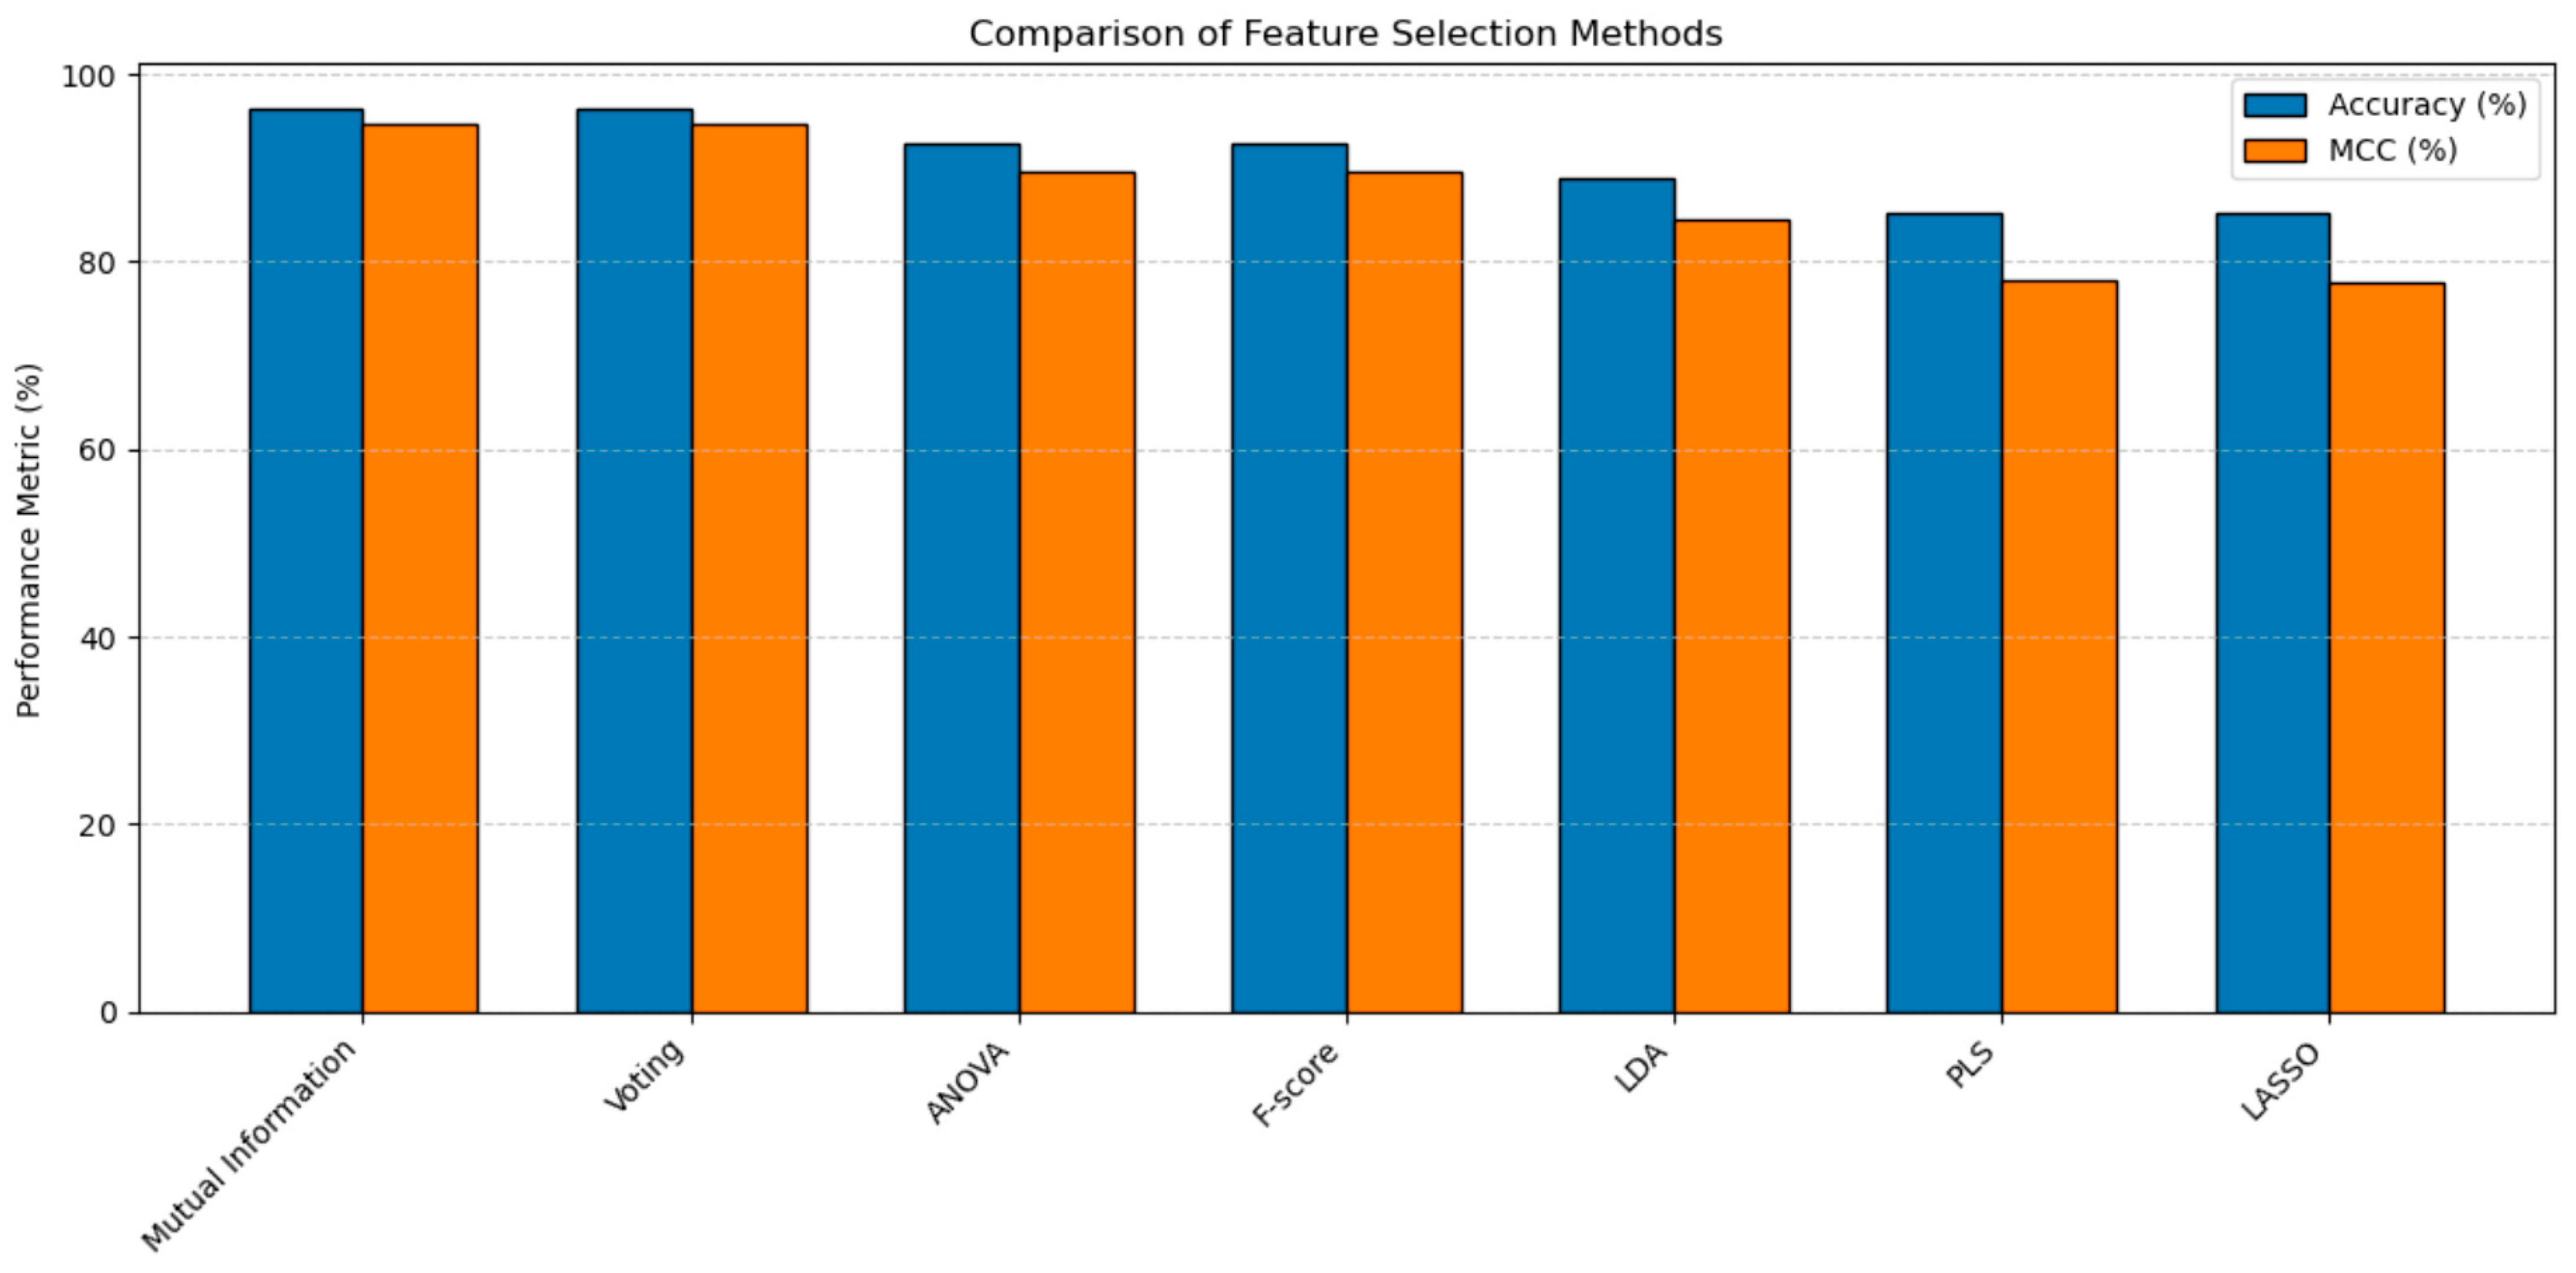
4.10. Comparison of Methods for Spectral Band Selection
Table 9 compares the different band selection methods and their impact on the classification models’ accuracy and Matthews Correlation Coefficient (MCC). The results show that Mutual Information and voting achieve the best performance, with an accuracy of 96.3% and an MCC of 94.64% when coupled with an SVM. These methods, therefore, appear particularly effective for selecting discriminatory and relevant spectral bands for classification.
Other approaches, such as ANOVA and F-score, combined with a Random Forest, also perform well, with an accuracy of 92.59% and an MCC of 89.63%. These statistical methods identify the most influential bands based on their contribution to class variance.
In contrast, although they remain competitive, methods such as LDA and PLS perform less well, with accuracies of 88.89% and 85.19%, respectively. LDA, which maximizes class separation, appears less effective in this context, while PLS and LASSO, although versatile, do not achieve the performance levels of other, more targeted methods.
These results underscore the importance of selecting the appropriate band selection method to maximize the performance of classification models. The most effective approach depends on the type of algorithm used and the specific characteristics of the hyperspectral data analyzed.
Figure 14 presents a histogram that visually compares the performance of different band selection methods, providing a clear visual representation of the accuracy and MCC results.
5. Discussion
The evaluation of the algorithms’ performance based on the spectral band selection methods highlights the latter’s significant influence on the classification of cocoa beans. The analysis of the different results reveals that the choice of the optimal algorithm strongly depends on the data characteristics used and the band selection method applied.
Among the three algorithms tested (Random Forest, SVM, and XGBoost), the SVM stands out in several configurations. It achieved an accuracy of 96.30%, an F1-score of 96.28%, and an MCC of 94.64% using the Mutual Information and Voting methods. These results demonstrate that the SVM performs exceptionally well when the input variables are carefully selected, reducing the problem’s complexity while retaining essential discriminant information. This is explained by the SVM’s ability to handle high-dimensional spaces well when relevant variables provide a clear separation between classes.
The Random Forest model also performs well, particularly after selection via ANOVA and F-score, with an accuracy of 92.59% and an MCC of 89.63%. This behavior confirms that Random Forest is a robust algorithm capable of handling datasets where combining several relevant variables allows for effective class separation. However, its performance remains generally lower than SVM’s, particularly when dimensionality reduction is essential.
While XGBoost performs well in some cases, it performs overall worse than the other two models, with a maximum accuracy of 85.19%. This underperformance can be explained by increased sensitivity to variations in the selected features and reduced generalization capacity on limited datasets, as in this study.
Regarding feature selection methods, they strongly influence model performance:
Mutual Information and Voting are the most effective approaches, particularly with SVM, by extracting non-redundant and highly informative variables;
ANOVA and F-score are more suitable for Random Forest, suggesting that these methods identify features well exploited by decision trees;
LDA and PLS yield more consistent results, with no real marked advantage for a given model, indicating that they offer good stability but more limited discriminatory power.
The improved performance with these selection methods highlights the importance of dimensionality reduction for achieving the following:
Reduce the risk of overfitting;
Improve the generalization ability of models;
Simplify the model structure without losing critical information.
In particular, SVM provides clear class separation and effectively reduces classification errors. The associated ROC curve shows a high area under the curve (AUC), confirming its strong ability to discriminate between classes. Similarly, Random Forest sometimes achieves high performance, although lower than SVM, reinforcing its value depending on the type of selection applied.
This study highlights the importance of coupling the variable selection method and the classification algorithm. Combined with Mutual Information or Voting methods, SVM offers the best performance, while Random Forest remains a reliable alternative depending on the nature of the variables selected. These results confirm that machine learning techniques can significantly improve sorting and quality control processes in the cocoa industry.
Although the results obtained demonstrate the effectiveness of the proposed spectral band extraction techniques, some limitations should be mentioned. First, the experiments were performed on a limited dataset from a single geographical region, which may limit the generalization of the results to other contexts. However, a more diverse database is being built to expand the geographical and varietal coverage, improving the robustness and transferability of the proposed models. Finally, only classical classifiers were used in this first phase. Integrating more advanced deep learning models could be explored in future work, as the database becomes richer and better balanced.
6. Conclusions
Our study demonstrated the importance of spectral analysis in classifying cocoa beans according to their fermentation state. The evaluation of the classification models’ performance highlighted the impact of spectral band selection methods on prediction accuracy.
The results show that the optimal algorithm choice closely depends on the selected features. Combined with Mutual Information and Voting methods, SVM achieved the best performance with an accuracy of 96.30%, surpassing Random Forest and XGBoost. However, Random Forest remains a robust alternative, particularly effective in conjunction with ANOVA and F-score, achieving an accuracy of 92.59%. On the other hand, XGBoost was found to be less suited to the studied data.
The analysis also highlighted the importance of feature selection techniques in reducing dimensionality and enhancing model generalization. Mutual Information and Voting helped optimize classification with SVM, while ANOVA and F-score enhanced the performance of Random Forest.
These results confirm that machine learning, applied to carefully selected spectral bands, is a promising approach for automating the quality control of cocoa beans. Further optimization of feature selection methods and exploration of other algorithms could further enhance the accuracy and efficiency of models in an industrial context.
In our future work, we will expand our database to other producing regions to strengthen our model’s robustness. Furthermore, we can explore integrating our own deep learning models (such as CNNs or Transformers) to improve our classification accuracy.


