1. Introduction
Thermographic inspection is a critical component in the non-destructive evaluation of infrastructure, particularly those based on steel pipes. This technology is essential for detecting subsurface defects such as corrosion, which are vital for ensuring the structural integrity and safety of steel-based infrastructure around the world [
1,
2]. Despite its critical function, thermography’s integration with modern machine learning and deep learning algorithms can be limited by the shortage of large datasets [
3]. This scarcity greatly impedes the development and validation of automated systems, which are required for consistent performance in real-world scenarios. Traditional methods, while effective, rely significantly on human skill and are subject to inconsistencies and errors [
4].
To address these challenges, current research has focused on designing neural network architectures and tunning hyperparameters [
5,
6,
7,
8]. This research introduces a series of advanced image segmentation models—UNet [
9], UNet++ [
10], DeepLabV3+ [
11], and Feature Pyramid Networks (FPN) [
12]—each chosen for their distinct capabilities to improve defect detection in thermographic images. UNet, known for its effective encoder-decoder design, excels at complex image segmentation tasks. UNet++ improves on this by incorporating nested, dense skip paths, which can improve training accuracy and convergence time. DeepLabV3+ distinguishes itself with a convolution method that effectively collects multi-scale information, which is critical for detailed boundary detection in images. FPN uses a top-down architecture with lateral connections to generate high-level semantic feature maps at all scales, improving detection performance across a range of defect sizes.
The challenge of generating realistic thermal datasets has also been addressed with the use of generative adversarial networks (GANs) and computational simulations including the finite element method (FEM). While GANs are useful for enhancing thermal datasets with synthetically generated images [
13], they frequently fail to adequately capture the complex properties of defects [
14]. In contrast, FEM simulations provide a solid framework for generating high-fidelity synthetic data based on fundamental heat transfer principles and precise material properties, resulting in a more accurate replication of experimental conditions.
The present research takes advantage of these technological advancements by combining FEM-generated datasets with the segmentation capabilities of UNet, UNet++, DeepLabV3+, and FPN. This integration not only improves training data quality but also improves the models’ capacities to generalize from synthetic to real-world scenarios, resulting in much higher defect detection accuracy. Our methodology makes a methodological contribution, particularly in the detection of moisture-induced defects in steel pipe insulation—an issue of enormous relevance but underexplored in the existing literature [
13].
By combining the employing of synthetic datasets with advanced segmentation models, automatic defect detection systems can be made more accurate and dependable while remaining scalable and affordable in comparison to manual inspections and conventional data augmentation techniques. This initiative has the potential to transform thermographic inspection techniques by offering a more precise, dependable, and automated method to find corrosion under insulation (CUI) in steel pipes.
2. Literature Review
Thermographic inspection is a non-destructive testing (NDT) method essential for maintaining the integrity and safety of infrastructure, particularly those involving steel pipes. This technique excels at identifying hidden subsurface defects, such as corrosion, by detecting temperature variations caused by these flaws [
15]. Despite its effectiveness, the widespread application of infrared thermography is often hindered by a common challenge: the lack of comprehensive and diverse datasets. This limitation impedes the development of automated systems that can consistently perform under real-world conditions and increases the risk of errors in manual defect detection [
16].
Traditionally, methods like thresholding and edge detection have been used in thermographic analysis. However, these methods often fall short due to their simplistic approach, which fails to capture the complexities of heat transfer in defective materials [
17]. In contrast, advancements in machine learning have introduced more sophisticated techniques that significantly enhance the capabilities of thermographic analysis. For example, deep autoencoders [
18] and semi-supervised learning [
19] approaches have shown promise in uncovering intricate defect features within thermographic data. These methods utilize both labeled and unlabeled data to boost model performance and mitigate the risk of overfitting, a significant advantage given the frequent scarcity of labeled datasets.
Among the advanced models, UNet [
20] and its improved version UNet++ are celebrated for their encoder–decoder architecture, which excels at detailed image segmentation crucial for accurate defect detection. UNet++ further enhances this capability by incorporating nested, dense skip connections, improving feature propagation and training accuracy [
21]. Another model, DeepLabV3+, uses atrous convolutions to effectively manage scale variations and capture fine details at different resolutions, making it particularly useful for outlining complex defects [
22]. Similarly, Feature Pyramid Networks (FPN) tackle the challenge of detecting multi-scale defects using a pyramid architecture to maintain high-level semantic features at all scales, enhancing detection accuracy across varied conditions [
23].
While generative adversarial networks (GANs) have been used to augment thermal datasets by generating synthetic images [
24], they often struggle to capture specific defect characteristics, such as size and depth, accurately. This introduces uncertainties in defect identification. In response, this research utilized finite element method (FEM) simulations [
25], which provide high-fidelity synthetic data based on precise heat transfer equations and material properties. These simulations significantly improve the quality of training data for machine learning models, ensuring that the synthetic data closely mirrors real-world defect scenarios.
By integrating FEM-generated datasets with models like UNet, UNet++, DeepLabV3+, and FPN, this study sets a new benchmark in the field. This methodological advancement not only addresses the issue of dataset scarcity but also significantly enhances the models’ abilities to detect subsurface defects with unparalleled accuracy. Looking forward, the ongoing development of computational capabilities and machine learning algorithms is expected to further enhance the efficiency and effectiveness of thermographic inspections. Potential future advancements could include real-time processing and the integration of augmented reality applications, which could improve automated defect detection systems.
3. Method
The methodology of this study is designed to evaluate the effectiveness of combining finite element method (FEM) simulations with image segmentation to detect moisture-induced defects in steel pipe insulation. This section explains the detailed experimental setup and the advanced simulation techniques used, each selected to meet the specific challenges of thermographic inspection highlighted in previous research.
Section 3.1 describes the experimental procedures, including the selection and preparation of steel pipes and the acquisition of thermal images under controlled conditions. These steps are crucial for establishing a baseline dataset that accurately reflects real-world defect scenarios.
Section 3.2 discusses how this dataset is enhanced through FEM simulations. These simulations are meticulously calibrated to produce synthetic yet highly realistic thermal images, covering a broad spectrum of defect characteristics. Together, these methods address the critical issue of dataset scarcity and aim to boost the reliability of automated defect detection systems. By providing a detailed rationale for each experimental and simulation decision, this section not only ensures the reproducibility of our findings but also demonstrates the methodological rigor and alignment with the study’s objectives.
3.1. Experiment
This study was meticulously designed to unveil the capabilities of infrared thermography (IRT) in identifying defects within the insulation of steel pipes, with a special focus on moisture presence as an indicator of potential corrosion under insulation (CUI). Such defects, the consequences of moisture ingress, are known to significantly modify the insulation’s heat transfer coefficient, manifesting as observable temperature variances on the pipe’s surface. These variances are pivotal for pinpointing the defects’ locations and extents, effectively simulating real-world scenarios where internal leakages might signify corrosion or cracks necessitating immediate intervention.
In addressing the identified gaps within the existing body of research, six steel pipes of varied sizes and thicknesses were selected to broaden the scope of the experimental scenarios. This intentional selection mirrored the prevalent use of these materials in critical infrastructure, where the accurate detection of subsurface defects is not just beneficial but imperative for structural integrity.
Table 1 catalogs the geometrical properties of each pipe, including diameters and wall thicknesses, chosen to encompass a wide spectrum of potential defect scenarios, thereby ensuring the robustness and applicability of our findings across various conditions.
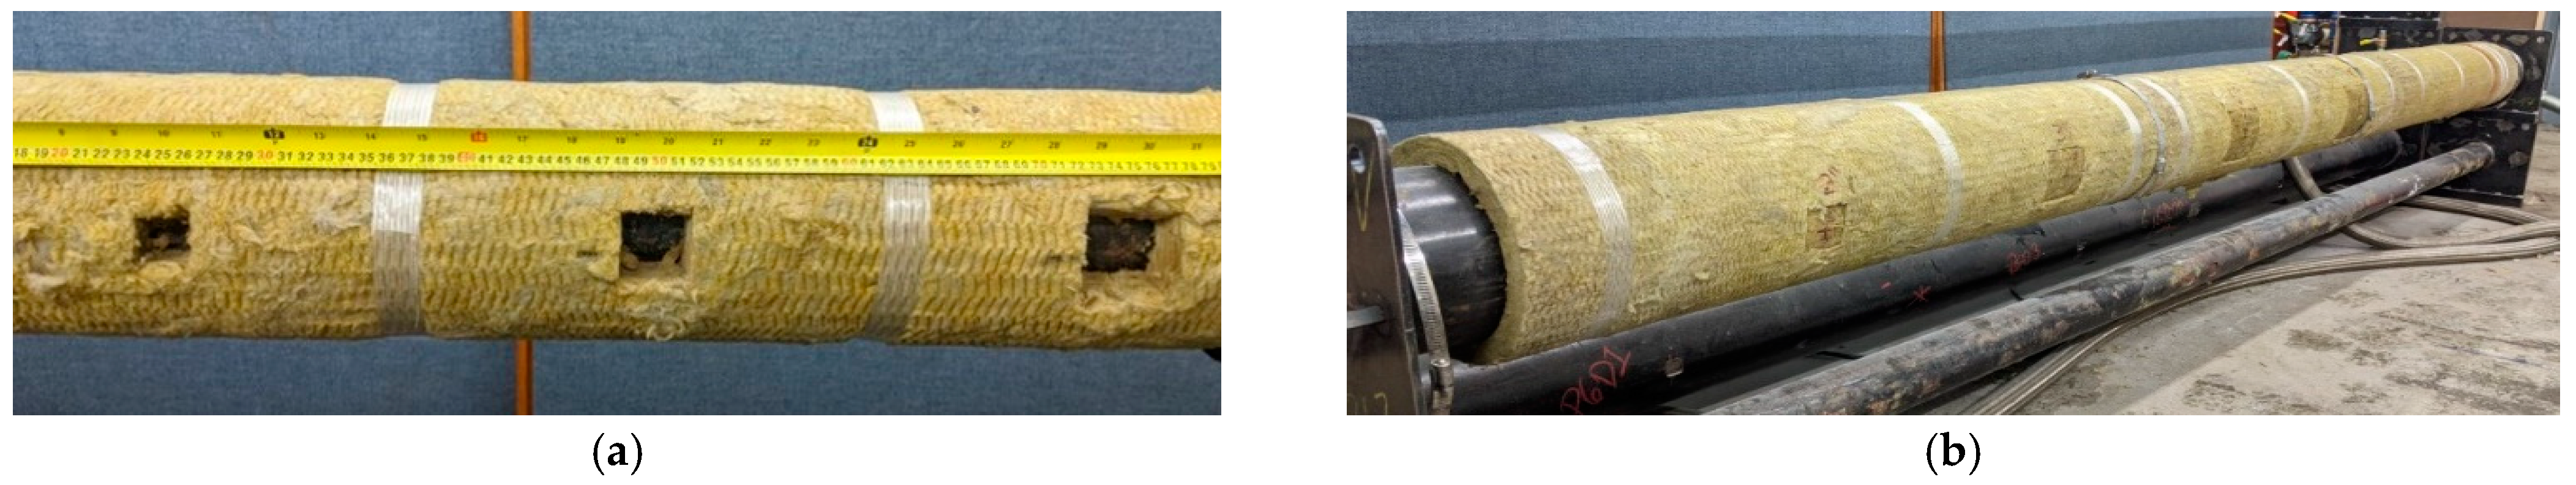
To simulate moisture ingress and enhance the realism of our experiment, each pipe was initially insulated with fiberglass, chosen for its widespread industrial use and favorable thermal properties. The insulation was uniformly applied at a thickness of 0.5 inches around each pipe, and then strategically cut to create defects of varying sizes. These sections were saturated with water to levels of 50% of their weight, before being reattached to their respective pipes. An aluminum cladding, with a thickness of 0.03 inches, enveloped the insulation layer on each pipe, serving to mimic the external protective layer found in operational insulation systems and providing both mechanical protection and weather resistance. This comprehensive approach, from the methodological preparation of defects to securing with aluminum cladding, closely replicated the diverse conditions that might be encountered in real-world industrial settings.
Figure 1 illustrates the defects within the insulation, offering a visual reference to the types and placements of the experimental conditions, while
Figure 2 provides additional clarity on the geometrical positioning and dimensions of these defects relative to the pipes, aiding in the understanding of the simulated defect’s types and placements.
Experimental tests conducted at a steady 90 °C were aimed at replicating the typical operational conditions encountered in industrial piping systems. Mobiltherm 603, chosen for its property similarities to the fluids typically found in oil pipelines, served as the heat transfer fluid, providing a realistic simulation environment. A heat transfer system (HTS) was precisely configured to simulate operational conditions by uniformly heating the process fluid within the pipes, achieving temperatures up to 150 °C at 30 PSI. This system played a pivotal role in establishing a steady-state thermal regime across the pipe system, which was essential for accurate thermal imaging. The HTS and its configuration, detailed in
Figure 3, showcased the integral components and their arrangement for precise temperature control.
The FLIR T650Sc thermal camera, selected for its high resolution of 640 × 480 pixels, was utilized to capture thermal images. Maintaining the precise temperature was crucial for the reliability of the thermal data collected; ensuring a uniform temperature distribution across the pipe’s surface was vital for highlighting anomalies attributed to the inserted defects. This approach ensured that the observed thermal patterns provided a consistent and accurate basis for analysis, emphasizing the impact of defects on heat transfer through the insulation.
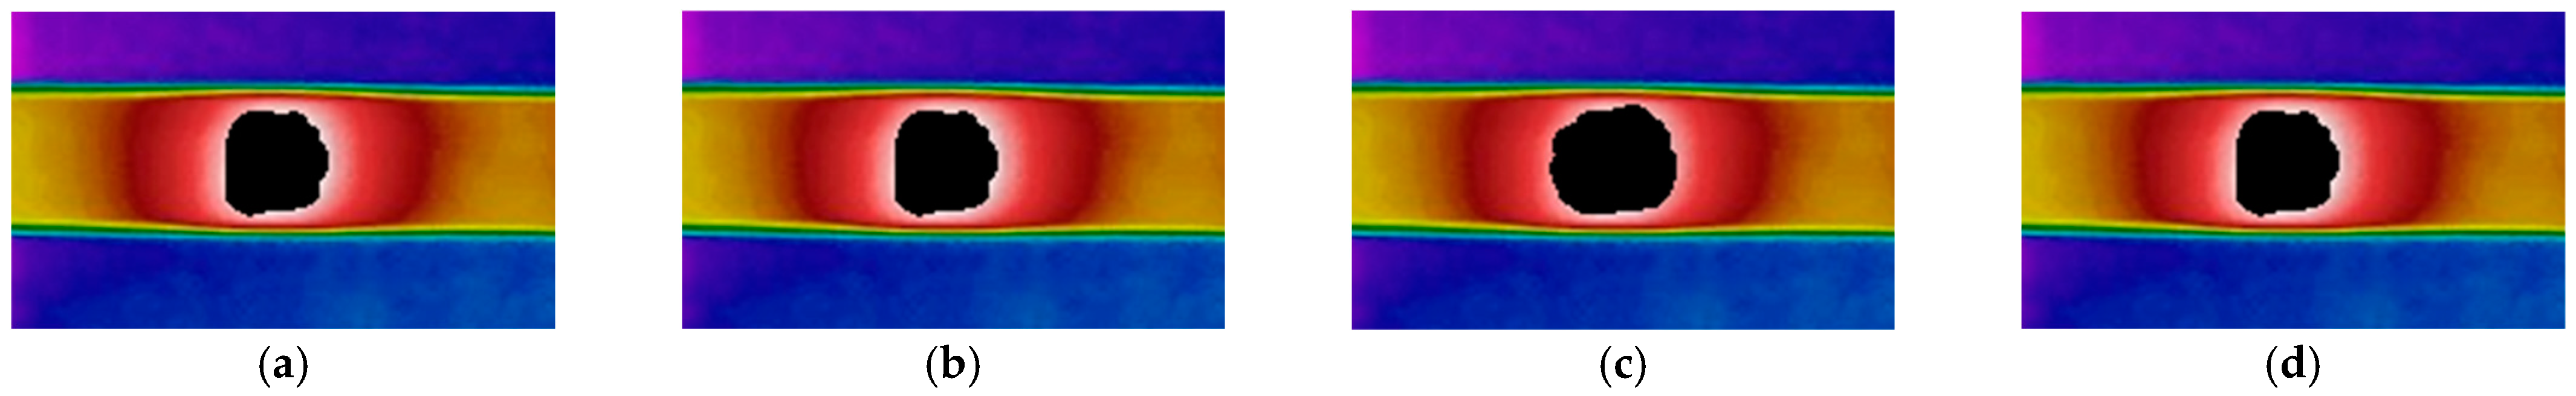
The captured thermal images were subjected to a preprocessing step involving image denoising, aimed at minimizing the influence of excessive noise. Given the predefined locations of the defects, regions of interest (ROI) were established based on these positions for later analysis.
Figure 4 shows the defined ROI, based on the position and size of the defect, for pipe number 6. As can be seen, the position of the defect is known in the thermal image, so a circle is defined that circumscribes the square.
3.2. Data Augmentation with FEM
To enhance the dataset and complement the experimental findings, the study’s setup was replicated within the COMSOL Multiphysics environment. This simulation aimed to precisely model the steel pipes, fiberglass insulation, and aluminum cladding, incorporating defects similar to moisture ingress, as outlined in the experimental section, to thoroughly analyze their thermal impact. The simulation was based on the assumption of material homogeneity across all components. Boundary conditions were established to assume no heat loss at the pipe ends, a choice that reflected the experimental setup, where defects were strategically placed far from the edges to reduce edge effects on thermal data. This approach ensured a focused analysis of the thermal behavior attributable to the introduced defects, aligning the computational model closely with the physical experiments. To ensure the simulation closely matched the experimental setup, the exact diameters and thicknesses of the pipes used in the experiment were replicated in the COMSOL Multiphysics environment. This step was vital for accurately simulating the conditions observed during the physical experiments. In the simulation, defects were introduced by substituting a section of the original insulation with a new material meant to simulate wet insulation, representing moisture ingress. This approach involved removing the original insulation in the defect areas and replacing it with material properties adjusted to reflect wet insulation, thereby simulating various levels of moisture presence, as explored in the experiment. Moreover, the simulation extended the investigation to a broader range of defect sizes, from as small as 0.1 inches to as large as 5 inches, aiming to understand the impact of defect size on thermal performance more comprehensively. The sizes and configurations of these defects, as well as the expanded range explored, are detailed in
Table 2.
To model the wet insulation’s thermal properties accurately, we utilized mixture rules. These rules allow for the calculation of the insulation’s effective thermal properties, such as thermal conductivity (
), density (
), and specific heat capacity at a constant pressure (
), taking into account varying moisture contents. The premise of our approach is grounded in volume-weighted averages, ensuring a precise representation of the wet insulation’s behavior. The equations deployed are as follows [
26]:
where:
and are the volume fractions of water and insulation, respectively, satisfying ;
, , and are the thermal conductivity, density, and specific heat capacity at constant pressure of water, respectively;
, , and are the corresponding properties of the insulation material.
This formulation provides a nuanced view of how moisture content influences the insulation’s thermal properties, laying a foundation for our experimental validation and simulations. These formulations allowed us to accurately model the thermal behavior of insulation with 50% wetness levels, directly correlating with the experimental conditions.
Table 3 presents the material properties used in the simulation, including the base properties of steel, fiberglass insulation, water, and aluminum. These properties were essential for ensuring the accuracy of the simulation results.
The conduction occurred between the solid phases of the simulation in each material, and also in the materials that have contact surfaces. The formulation of , where is the conduction heat transfer coefficient, is the external temperature, and is the temperature of the surface, governs these conductions. Inside the pipe, a forced internal convection was also set to replicate the experimental conditions. The fluid used within the pipe was Mobil Therm 603, to mimic the experiment. The convection heat transfer formulation was , where q represents the heat transfer rate per unit area, h is the convective heat transfer coefficient, is the fluid temperature, and is the temperature solid surface.
The outer surface of the aluminum cladding experienced two types of heat transfer. The first was external natural convection with the ambient environment. The second was radiation heat transfer, with a surface emissivity set at 0.9, , where is the radiation coefficient and is the ambient temperature.
The mesh size was set to automatic, allowing for finer mesh in areas with defects and around thin structures, while coarser mesh was applied elsewhere, such as the no-heat-loss ends. This strategy optimized computational resource utilization.
The simulations were set to steady-state conditions to mimic the experimental setup, focusing on achieving a uniform thermal regime that mirrored the steady-state thermal distribution observed in the experiments. This approach ensured that the simulation results were directly comparable to the experimental findings, facilitating a coherent analysis of the impact of insulation defects.
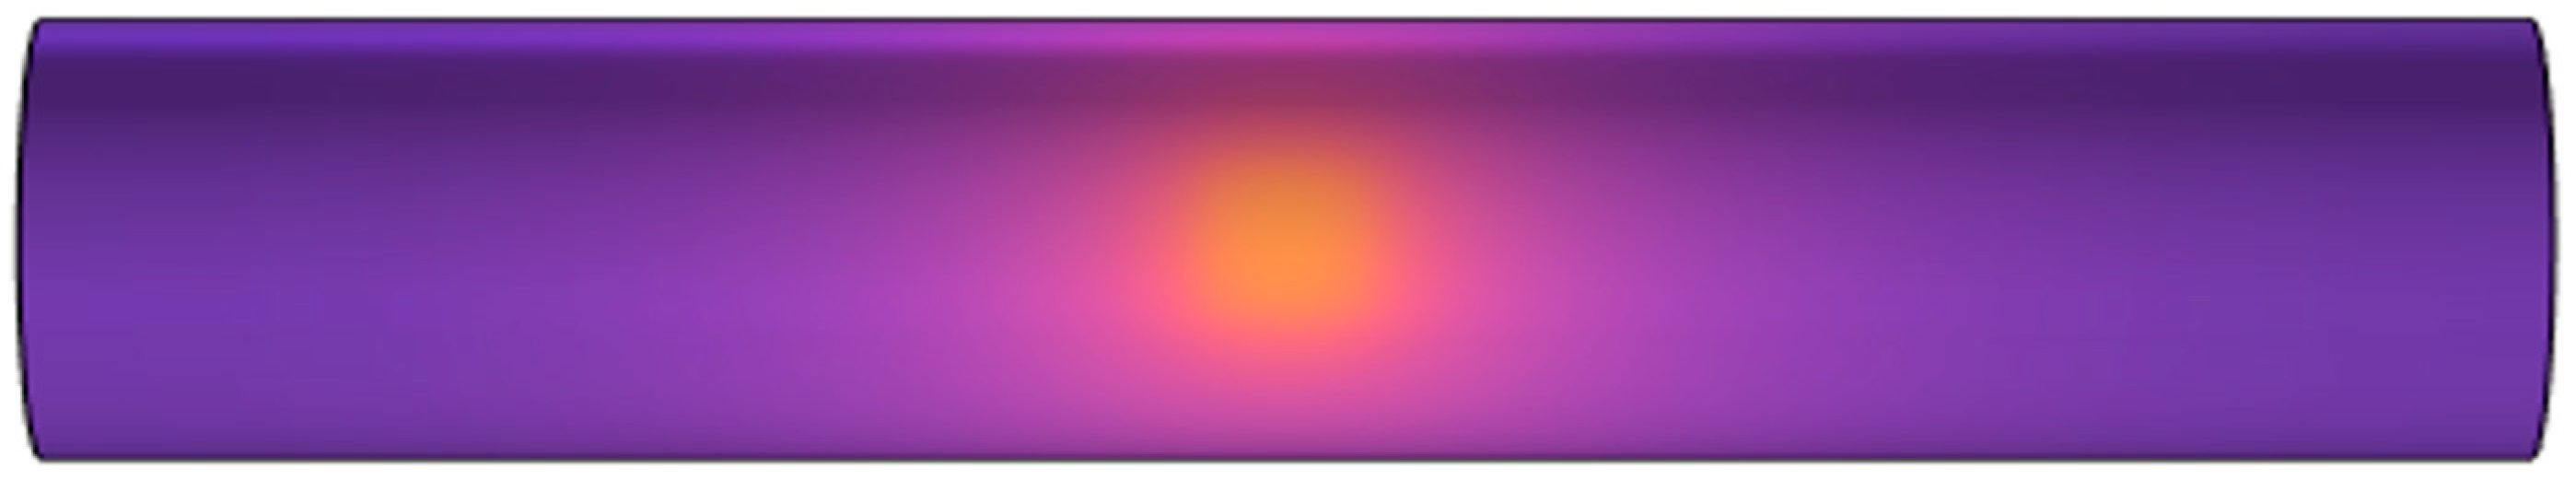
Figure 5 showcases the simulation results for Pipe ID 1, featuring a defect characterized by 50% wetness and a size of 1 inch. These results highlight the thermal patterns and anomalies induced by the wet insulation defect, providing valuable insights into the defect’s impact on the thermal efficiency of the insulation system.
The simulation findings indicated that the presence of water in the insulation, as expected, increased thermal conductivity. This change aids in identifying the areas of leakage, underscoring the potential of thermal imaging in detecting moisture-induced defects. These results affirm the efficacy of combining experimental data with FEM simulations to better understand the thermal dynamics of insulated piping systems and the critical role of defect size and moisture content in influencing thermal conductivity and, consequently, defect detectability.
4. Model Architecture and Training Details
In this study, the architectures of UNet, UNet++, DeepLabV3+, and FPN were used for segmenting thermal images to detect insulation defects. Each model employs the ‘Resnet152’ encoder, pre-trained on the ImageNet dataset, to leverage its deep architecture and superior feature extraction capabilities. This choice was based on the hypothesis that Resnet152’s extensive feature recognition enhances the models’ ability to identify complex defect patterns in thermal imagery, providing a strong foundation for accurate segmentation.
The models were optimized using the Adam optimizer with an initial learning rate of 0.0001. A StepLR learning rate scheduler was applied to decrease the learning rate by a factor of 0.1 every 10 epochs, optimizing model convergence by adjusting the rate based on performance over time. To address class imbalance in segmentation tasks, DiceLoss was selected as the loss function due to its effectiveness in handling such disparities. The performance of each model was evaluated using the intersection over union (IoU) score and the F1 score, key metrics for assessing precision and reliability in defect identification.
To balance computational demands and model performance, a batch size of four was used during both training and validation phases. The dataset was split, with 90% allocated for training and 10% for validation, allowing for a rigorous evaluation of the models’ generalization to new data. The training lasted for 50 epochs, considered sufficient for the models to learn from the dataset’s complexities. The training involved forward propagation for loss computation and backpropagation for parameter updates, with performance metrics logged to track and assess the models’ learning and segmentation effectiveness. The implementation framework was PyTorch, using segmentation models from the segmentation_models_pytorch library. This setup ensured a standardized input size of 512 × 512 pixels for images and masks, enhancing computational efficiency. Color encoding within the masks helped clearly delineate different defect types, improving segmentation precision.
5. Results and Discussion
The evaluation of four deep learning models—UNet-R152, UNet++-R152, DeepLabV3+-R152, and FPN-R152—was meticulously carried out in two distinct scenarios to determine their effectiveness in identifying moisture-induced defects within steel pipe insulation using thermal imaging. The initial training scenario involved a dataset of 20 experimental images, each representing a variety of defect conditions, to test each model’s learning capabilities with a purely real-world dataset. The second scenario expanded the dataset with 2000 synthetic images generated via finite element method (FEM) simulations, combined with the original experimental images. This approach aimed to expose the models to a wider array of defect scenarios, enhancing their generalization capabilities.
Validation against a separate set of experimental images not included in the training dataset allowed for a direct comparison of model performance across both scenarios. It was hypothesized that incorporating synthetic data alongside experimental images would enrich the learning environment for each model, potentially boosting their ability to generalize across previously unencountered defect types and conditions.
Figure 6 illustrates the models’ proficiencies in defect identification under various conditions, underscoring the benefits of integrating synthetic with experimental data in the training process.
5.1. Performance Evaluation Metrics
The performance of each model was evaluated using three key metrics: F1 score, loss, and mean intersection over union (IoU). The F1 score, which balances precision and recall, indicates the accuracy and reliability of each model. Loss quantifies the divergence between predicted outcomes and actual values, with lower scores indicating superior performance. Mean IoU offers a precise measure of segmentation accuracy by assessing the alignment between the model’s defect predictions and the actual defect areas.
5.2. Quantitative Analysis
Table 4 provides a detailed quantitative analysis of the validation metrics for the models trained under each scenario. This comparative analysis highlights significant improvements across all models when trained with the hybrid dataset, demonstrating the vital role of synthetic data in augmenting the training set and enhancing defect detection accuracy.
UNet saw slight improvements across all metrics, with mean IoU increasing from 0.64 to 0.72, loss decreasing from 0.61 to 0.59, and F1 score rising marginally from 0.87 to 0.88. These changes suggest a moderate increase in the model’s ability to match the prediction accuracy with actual defect characteristics, especially in terms of segmentation consistency. UNet++ experienced more pronounced enhancements. The mean IoU improved from 0.74 to 0.81, and the loss decreased from 0.52 to 0.41, coupled with a substantial rise in the F1 score from 0.90 to 0.96. This indicates a significant boost in both the precision and the reliability of the model’s defect identifications, likely due to its sophisticated architecture, which effectively handles multi-scale information and skip connections to mitigate the vanishing gradient problem.
DeepLabV3+ showed marked gains, with mean IoU climbing from 0.73 to 0.85 and loss reducing from 0.37 to 0.30. The F1 score also improved from 0.89 to 0.93. These metrics suggest that the model’s atrous convolutions effectively capture fine details across different scales, which is critical for outlining complex defect shapes accurately. FPN exhibited the most substantial improvements: the mean IoU jumped from 0.78 to 0.94, the loss dramatically dropped from 0.19 to 0.06, and the F1 score increased from 0.92 to 0.96. These results indicate exceptional performance enhancements in defect detection accuracy and reliability, with significant reductions in prediction errors. The model’s pyramid architecture, which maintains high-level semantic features at all scales, appears to be highly effective in handling varied defect sizes and complexities.
Overall, these metrics collectively demonstrate that integrating synthetic data into the training process substantially boosts the models’ capabilities in accurately segmenting defects. This improvement is critical for applications where precise and reliable defect detection is essential, affirming the utility of synthetic datasets in training more robust and adaptable machine learning models for industrial applications.
5.3. Model Performance
The observed improvements in the F1 scores, alongside more pronounced enhancements in loss and mean intersection over union (IoU) across all models, clearly demonstrate the impactful role of synthetic data in enhancing model evaluation dynamics. While increases in F1 scores were modest for some models, the significant reductions in loss and improvements in mean IoU, particularly for models like FPN-R152 and DeepLabV3+-R152, illustrate a finely tuned balance between precision and recall. This balance is crucial, as improvements in recall can sometimes diminish precision, reflecting a trade-off in model performance characteristics.
FPN-R152’s exceptional results, achieving a high mean IoU of 0.94 and the lowest loss of 0.06, suggest a potential risk of overfitting. These metrics indicate strong defect detection capabilities; however, the extreme reduction in loss combined with a high mean IoU might also imply that the model is overly fitted to the training data specifics, potentially limiting its generalizability to new, unseen datasets. This observation underscores the need for meticulously calibrating model complexity and training dynamics to prevent overfitting while still maintaining high accuracy and reliability.
The variation in error types and performance metrics between the models highlights the intricate interplay that governs these measures. UNet++-R152 and DeepLabV3+-R152, for instance, show robust performance improvements without the overfitting concerns noted in FPN-R152. This suggests that their architectural features—such as the increased depth and network pathways in UNet++ and the atrous convolution capabilities in DeepLabV3+—offer a more balanced approach to learning from augmented datasets. These features likely aid in capturing more complex patterns without overly conforming to the specifics of the training data, thereby enhancing the models’ generalization capabilities.
Furthermore, the strategic integration of synthetic data addresses the challenge of overfitting, a common issue when models are confined to learning from limited datasets. By broadening the variety and volume of training examples, synthetic data foster a deeper and more robust understanding of defect characteristics across various scenarios. This approach not only enriches each model’s comprehension of defect characteristics but also strengthens predictive accuracy and reliability across a wider range of real-world conditions. Such advancements pave the way for more effective management of corrosion under insulation (CUI) and other critical industrial applications, highlighting the value of synthetic data in advancing the field of thermographic inspections.
5.4. Discussion
The integration of synthetic data generated by Finite Element Method (FEM) simulations with experimental images provides a scalable and effective methodology for enhancing machine learning models’ defect detection capabilities. The empirical results from this study, especially the notable improvements in key performance metrics across all models, validate the approach’s effectiveness in various industrial applications that demand precise and reliable defect detection.
Expanding the training dataset with synthetic data opens new avenues for research and development in machine learning-based inspection methods. This enhancement not only improves the models’ ability to generalize across diverse conditions but also fortifies a more resilient framework for addressing real-world challenges in industrial contexts. The use of synthetic data helps overcome common challenges, such as overfitting and under-generalization, by allowing the models to develop more comprehensive representations of defects. Moreover, the varied performance enhancements observed across different models underscore the necessity of choosing the appropriate architecture tailored to the specific needs and constraints of the application. Selecting the right model architecture is essential for optimizing both the efficacy and computational efficiency of defect detection systems in industrial applications.
In summary, this methodology marks a significant step forward in the effective management of corrosion under insulation (CUI) and other similar industrial hazards. It advances the application of sophisticated imaging and machine learning techniques in industrial inspections. By effectively merging synthetic with experimental data, this strategy sets the stage for developing inspection systems that are not only more accurate but also adaptable to the evolving needs of industrial environments.
6. Conclusions
This study represents a significant stride in advancing the detection of moisture-induced defects in steel pipe insulation, a key factor in preventing corrosion under insulation (CUI). Through a sophisticated integration of experimental data and finite element method (FEM) simulations, the research delineates the critical role of water’s thermal properties in enhancing defect detectability via infrared thermography. This method offers a non-invasive, precise, and effective means for the early detection of potential CUI sites, contributing to the safety and integrity of industrial infrastructure.
By incorporating synthetic data generated from FEM simulations into the training of advanced machine learning models—UNet, UNet++, DeepLabV3+, and FPN—the study has significantly enhanced their accuracy and generalization capabilities across varied scenarios. This advancement underscores the utility of synthetic data in boosting the learning capabilities of the models, leading to more precise and robust defect detection.
Looking ahead, future research will aim to deepen the understanding of material properties under diverse conditions and explore time-dependent thermography techniques to further refine detection methodologies. This will enhance their practical applicability and reliability in real-world settings. Additionally, ongoing evaluations will focus on conducting rigorous comparisons with existing models and methods. These comparisons, ideally based on clear metrics and statistically significant differences, are essential to concretely determine the extent of improvements offered by these advanced techniques. Such efforts will not only validate the effectiveness of integrating synthetic and experimental data but also ensure that the developed methodologies are robust and adaptable to the dynamic conditions of industrial environments.
In conclusion, this research not only charts a path toward more effective management of CUI but also demonstrates the potent applications of advanced imaging and machine learning techniques in the realm of industrial inspections. By effectively blending synthetic and experimental data, this work lays the groundwork for the development of inspection systems that are not only more accurate but are also capable of adapting to evolving industrial challenges.
Author Contributions
Conceptualization, R.K.R., X.M. and C.I.-C.; methodology, R.K.R.; software, R.K.R.; validation, R.K.R.; formal analysis, R.K.R., X.M. and C.I.-C.; investigation, R.K.R., X.M. and C.I.-C.; resources, X.M. and C.I.-C.; data curation, X.M. and C.I.-C.; writing—original draft preparation, R.K.R.; writing—review and editing, R.K.R., X.M. and C.I.-C.; visualization, R.K.R.; supervision, X.M. and C.I.-C.; project administration, X.M.; funding acquisition, X.M. and C.I.-C. All authors have read and agreed to the published version of the manuscript.
Funding
This research was supported by the Natural Sciences and Engineering Council of Canada (NSERC), CREATE oNDuTy Program (funding ref. number 496439-2017), the Canada Research Chair in Multipolar Infrared Vision (MIVIM), Department of Civil Engineering from Université Laval, and the MITACS Accelerate Program.
Data Availability Statement
Conflicts of Interest
The authors declare no conflicts of interest.
References
- Xie, J.; Zhang, Y.; He, Z.; Liu, P.; Qin, Y.; Wang, Z.; Xu, C. Automated leakage detection method of pipeline networks under complicated backgrounds by combining infrared thermography and Faster R-CNN technique. Process Saf. Environ. Prot. 2023, 174, 39–52. [Google Scholar] [CrossRef]
- Nooralishahi, P.; Rezayiye, R.K.; López, F.; Maldague, X.P.V. PHM-IRNET: Self-training thermal seg-mentation approach for thermographic inspection of industrial components. NDT E Int. 2023, 138, 102884. [Google Scholar] [CrossRef]
- Kulkarni, N.N.; Raisi, K.; Valente, N.A.; Benoit, J.; Yu, T.; Sabato, A. Deep learning augmented infrared thermography for unmanned aerial vehicles structural health monitoring of roadways. Autom. Constr. 2023, 148, 104784. [Google Scholar] [CrossRef]
- Nooralishahi, P.; Laurent, K.; Lopez, F.; Maldague, X. Thermographic augmentation of defects on thermal images using multi-modal data. In Thermosense: Thermal Infrared Applications XLV; Avdelidis, N.P., Ed.; SPIE: Bellingham, WA, USA, 2023; p. 39. [Google Scholar] [CrossRef]
- Abiodun, I.; Jantan, A.; Omolara, A.E.; Dada, K.V.; Mohamed, N.A.; Arshad, H. State-of-the-art in artificial neural network applications: A survey. Heliyon 2018, 4, e00938. [Google Scholar] [CrossRef] [PubMed]
- Chen, H.; Zhang, Z.; Yin, W.; Zhao, C.; Wang, F.; Li, Y. A study on depth classification of defects by ma-chine learning based on hyper-parameter search. Measurement 2021, 189, 110660. [Google Scholar] [CrossRef]
- Mcknight, S.; Mackinnon, C.; Mohseni, E.; Pierce, G.; Macleod, C.; O’hare, T. Transfer learning for classifi-cation of experimental ultrasonic Non-Destructive Testing images from synthetic data. arXiv 2018, arXiv:1802.01548. [Google Scholar] [CrossRef]
- Hesam, S.; Rezayiye, R.K.; Ibarra-Castanedo, C.; Maldague, X. Enhancing the Thermal Inspection of Buildings Using Texture Analysis. Eng. Proc. 2023, 51, 9. [Google Scholar] [CrossRef]
- Ronneberger, O.; Fischer, P.; Brox, T. U-Net: Convolutional Networks for Biomedical Image Segmentation. In Proceedings of the Medical Image Computing and Computer-Assisted Intervention—MICCAI 2015, Munich, Germany, 5–9 October 2015; pp. 234–241. [Google Scholar] [CrossRef]
- Zhou, Z.; Siddiquee, M.M.R.; Tajbakhsh, N.; Liang, J. UNet++: A Nested U-Net Architecture for Medical Image Segmentation. In Deep Learning in Medical Image Analysis and Multimodal Learning for Clinical Decision Support; Springer: Berlin/Heidelberg, Germany, 2018; pp. 3–11. [Google Scholar] [CrossRef]
- Chen, L.-C.; Zhu, Y.; Papandreou, G.; Schroff, F.; Adam, H. Encoder-Decoder with Atrous Separable Con-volution for Semantic Image Segmentation. Available online: http://arxiv.org/abs/1802.02611 (accessed on February 2018).
- Lin, T.-Y.; Dollár, P.; Girshick, R.; He, K.; Hariharan, B.; Belongie, S. Feature pyramid networks for object detection. In Proceedings of the IEEE Conference on Computer Vision and Pattern Recognition, Honolulu, HI, USA, 21–26 July 2017; pp. 2117–2125. [Google Scholar]
- Rezayiye, R.K.; Laurent, K.; Nooralishahi, P.; Ibarra-Castanedo, C.; Maldague, X. Thermal Data Aug-mentation Approach for the Detection of Corrosion in Pipes Using Deep Learning and Finite Element Model-ling. Eng. Proc. 2023, 51, 20. [Google Scholar] [CrossRef]
- Fang, Q.; Maldague, X. A Method of Defect Depth Estimation for Simulated Infrared Thermography Data with Deep Learning. Appl. Sci. 2020, 10, 6819. [Google Scholar] [CrossRef]
- Usamentiaga, R.; Venegas, P.; Guerediaga, J.; Vega, L.; Molleda, J.; Bulnes, F.G. Infrared thermography for temperature measurement and non-destructive testing. Sensors 2014, 14, 12305–12348. [Google Scholar] [CrossRef] [PubMed]
- Maldague, X. Theory and Practice of Infrared Technology for Nondestructive Testing. (No Title). 2001. Available online: https://cir.nii.ac.jp/crid/1130282270813249920 (accessed on 31 April 2001).
- Ibarra-Castanedo, C.; González, D.; Klein, M.; Pilla, M.; Vallerand, S.; Maldague, X. Infrared image pro-cessing and data analysis. Infrared Phys. Technol. 2004, 46, 75–83. [Google Scholar] [CrossRef]
- Liu, K.; Zheng, M.; Liu, Y.; Yang, J.; Yao, Y. Deep Autoencoder Thermography for Defect Detection of Carbon Fiber Composites. IEEE Trans. Ind. Informatics 2022, 19, 6429–6438. [Google Scholar] [CrossRef]
- Ouali, Y.; Hudelot, C.; Tami, M. An Overview of Deep Semi-Supervised Learning. Available online: http://arxiv.org/abs/2006.05278 (accessed on 9 June 2020).
- Pedrayes, O.D.; Lema, D.G.; Usamentiaga, R.; Venegas, P.; García, D.F. Semantic segmentation for non-destructive testing with step-heating thermography for composite laminates. Measurement 2022, 200, 111653. [Google Scholar] [CrossRef]
- Yang, Q.; Ji, X. Automatic pixel-level crack detection for civil infrastructure using Unet++ and deep transfer learning. IEEE Sens. J. 2021, 21, 19165–19175. [Google Scholar] [CrossRef]
- Hao, J.; Xia, X.; Wang, L.; Li, Z.; Zhu, M. Accurate segmentation of infrared images for circuit board diag-nosis using an improved Deeplabv3+ network. Front. Phys. 2023, 11, 1223548. [Google Scholar] [CrossRef]
- Liu, F.; Liu, J.; Wang, L. Asphalt pavement crack detection based on convolutional neural network and infrared thermography. IEEE Trans. Intell. Transp. Syst. 2022, 23, 22145–22155. [Google Scholar] [CrossRef]
- Liu, K.; Tang, Y.; Lou, W.; Liu, Y.; Yang, J.; Yao, Y. A thermographic data augmentation and signal separa-tion method for defect detection. Meas. Sci. Technol. 2021, 32, 045401. [Google Scholar] [CrossRef]
- Mohamed, D.; May, D.; Pareek, K.A.; Ras, M.A.; Wunderle, B. Enhancing Defect Detection Using Lock In Thermography. In Proceedings of the 2024 25th IEEE International Conference on Thermal, Mechanical and Multi-Physics Simulation and Experiments in Microelectronics and Microsystems (EuroSimE), Sicily, Italy, 7–10 April 2024; pp. 1–9. [Google Scholar] [CrossRef]
- Bergman, T.L.; Lavine, A.S.; Incropera, F.P.; DeWitt, D.P. Introduction to Heat Transfer; John Wiley & Sons: Hoboken, NJ, USA, 28 December 2011. [Google Scholar]
| Disclaimer/Publisher’s Note: The statements, opinions and data contained in all publications are solely those of the individual author(s) and contributor(s) and not of MDPI and/or the editor(s). MDPI and/or the editor(s) disclaim responsibility for any injury to people or property resulting from any ideas, methods, instructions or products referred to in the content. |
© 2024 by the authors. Licensee MDPI, Basel, Switzerland. This article is an open access article distributed under the terms and conditions of the Creative Commons Attribution (CC BY) license (https://creativecommons.org/licenses/by/4.0/).


