

AI for Automating Data Center Operations: Model Explainability in the Data Centre Context Using Shapley Additive Explanations (SHAP)

 ,
,  ,
,  and
and
Abstract

1. Introduction
2. Related Work
3. Methodology
3.1. Dataset and Preprocessing
3.2. Prediction Models
3.2.1. Random Forest Forecasting
3.2.2. XGBoost
3.2.3. Long Short-Term Memory (LSTM) Deep Learning
3.3. Theoretical Foundations of the Shapley Additive Explanations (SHAP) Method
4. Limitations
- Data Quality and Variability: Inconsistency, noise, and missing values in data can all impact the reliability of SHAP explanations in the DC context. The stability and consistency of SHAP values can be impacted by variations in data center environments over time, such as shifts in workload patterns, hardware configurations, or environmental factors.
- Real-time Interpretability: Many data center applications require real-time decision-making in response to events or situations that change over time. The processing expense of computing SHAP values may make generating SHAP explanations for predictions in real-time impractical, particularly for complicated models such as deep learning or for enormous data sets.
- Domain Expertise Requirement: Understanding the significance of features, interpreting the direction and size of feature contributions, and making defensible decisions based on the information provided by SHAP values when interpreting SHAP explanations may require domain expertise. In data center operations, it can be challenging to bridge the knowledge gap between domain-specific experience and data science competence.
5. Experimental Results
5.1. Model Performance and Time Complexity Index
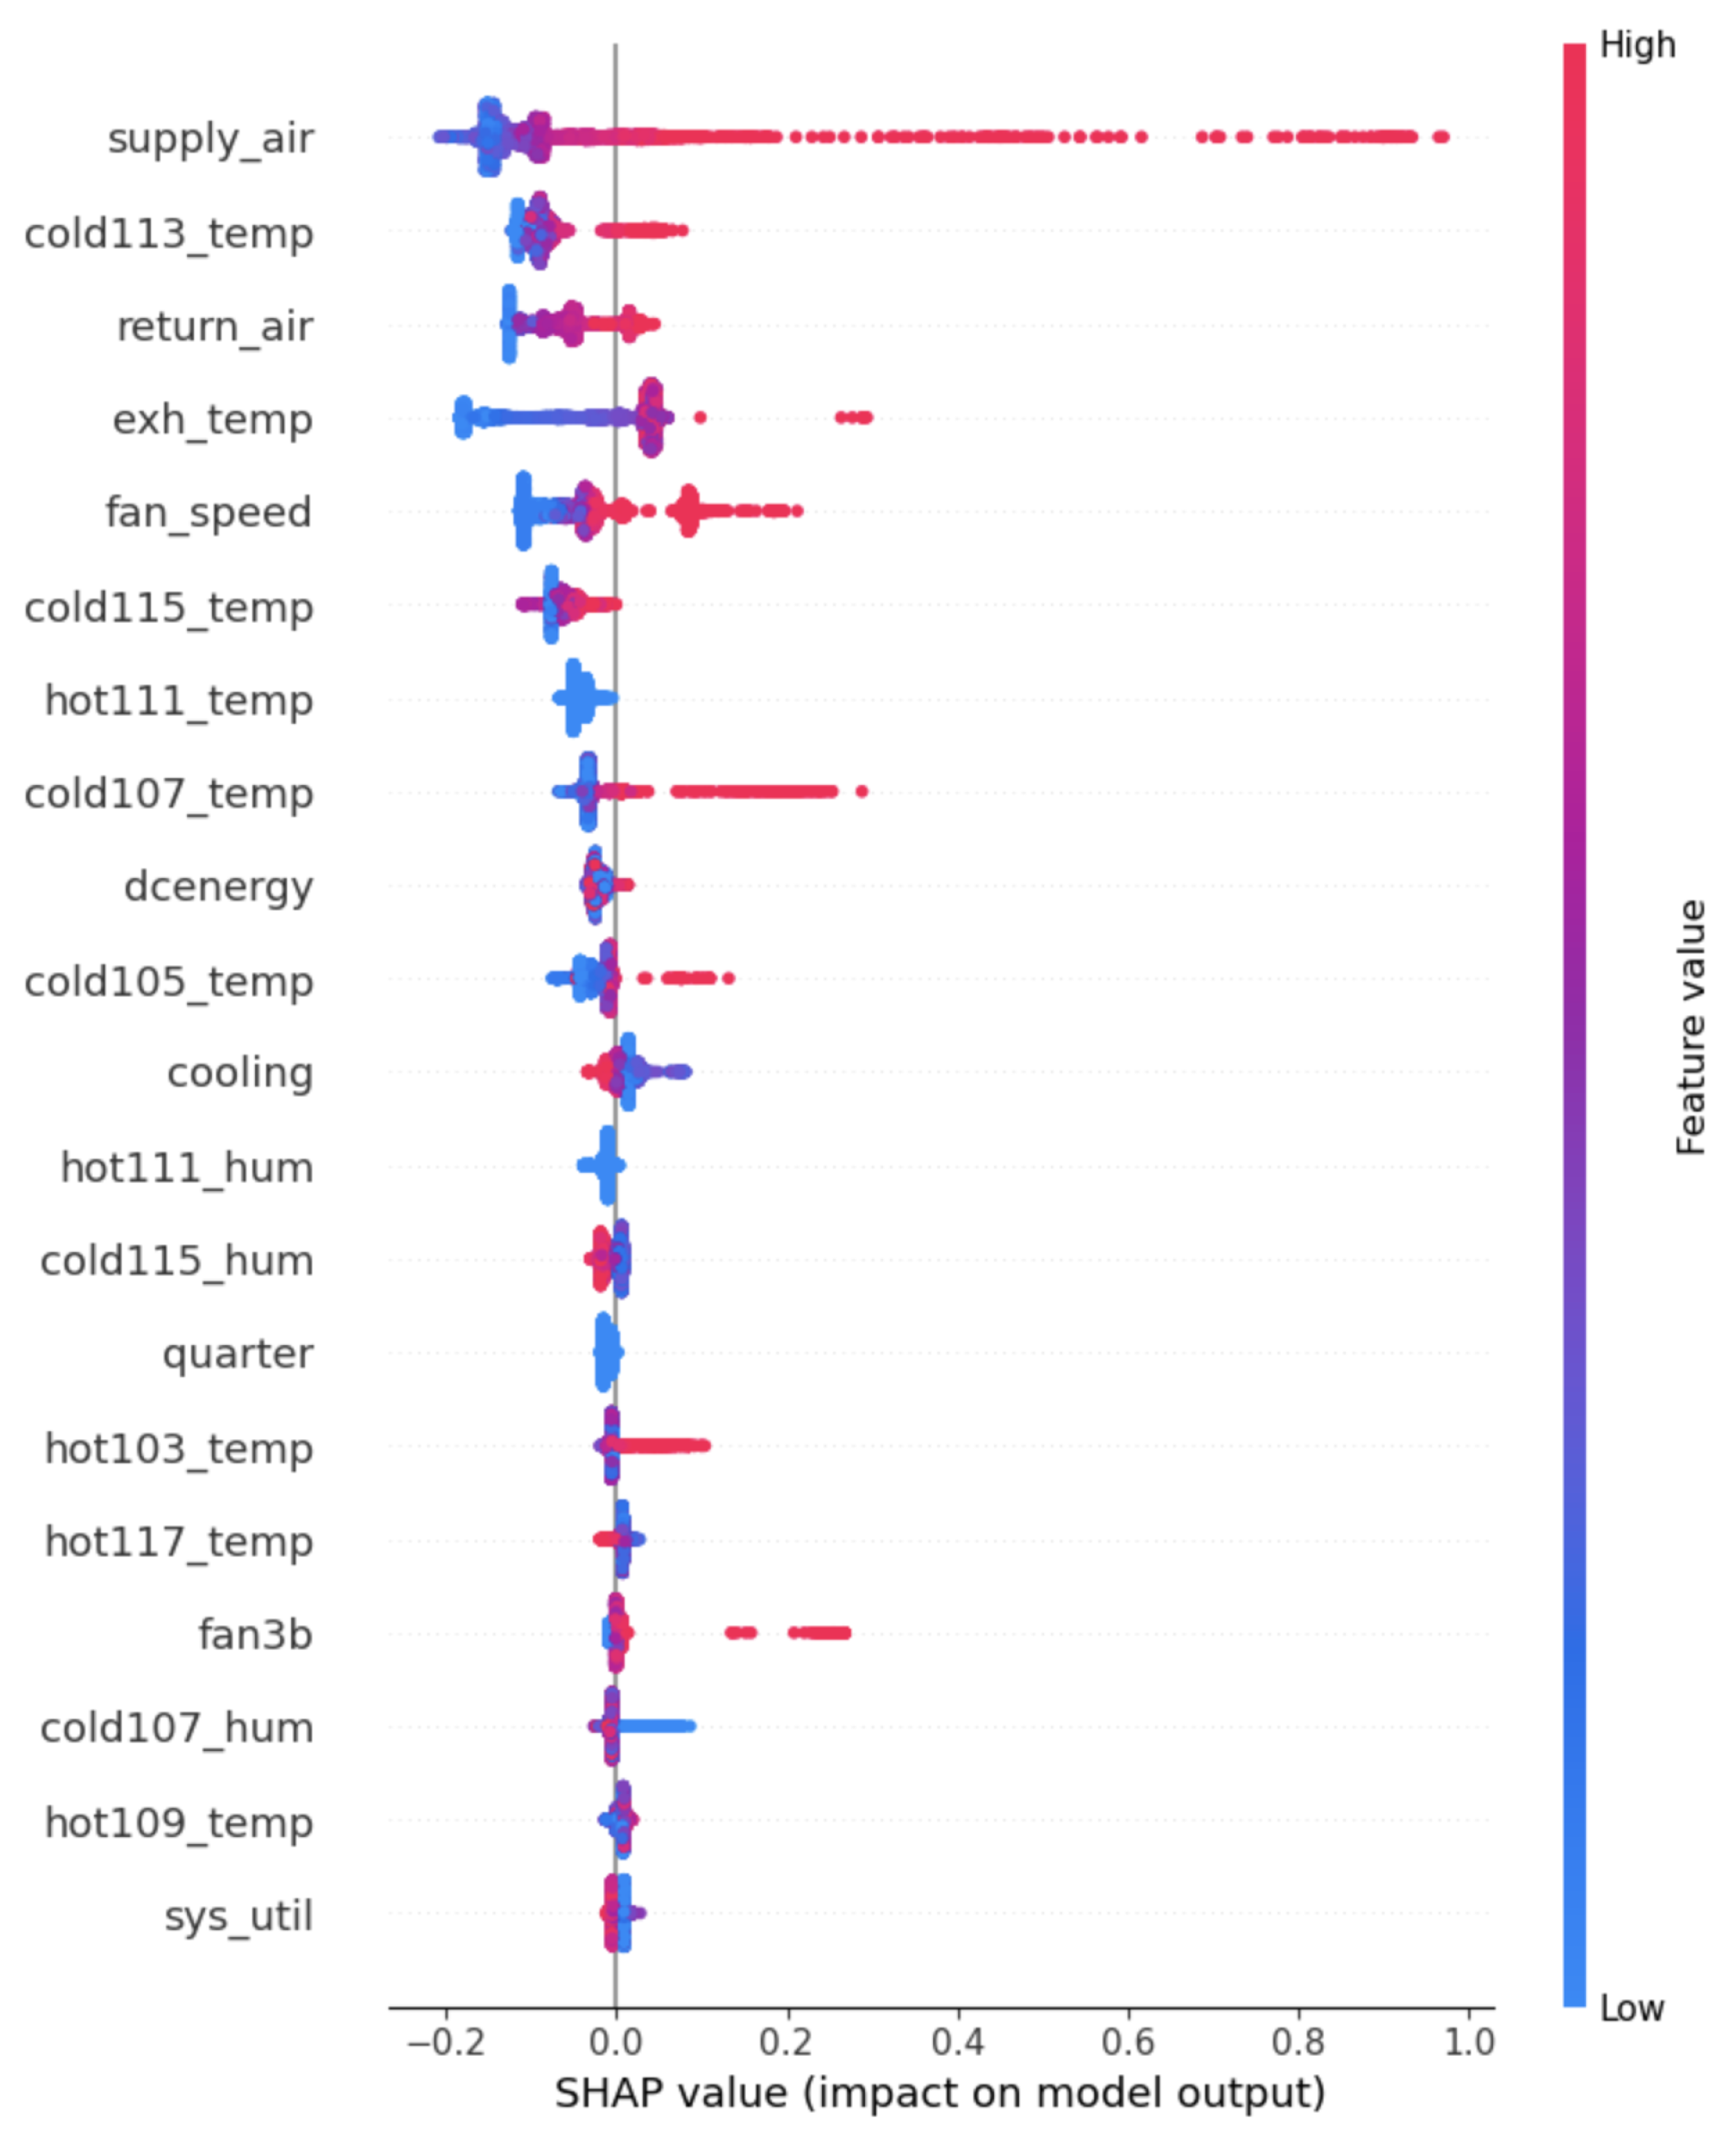
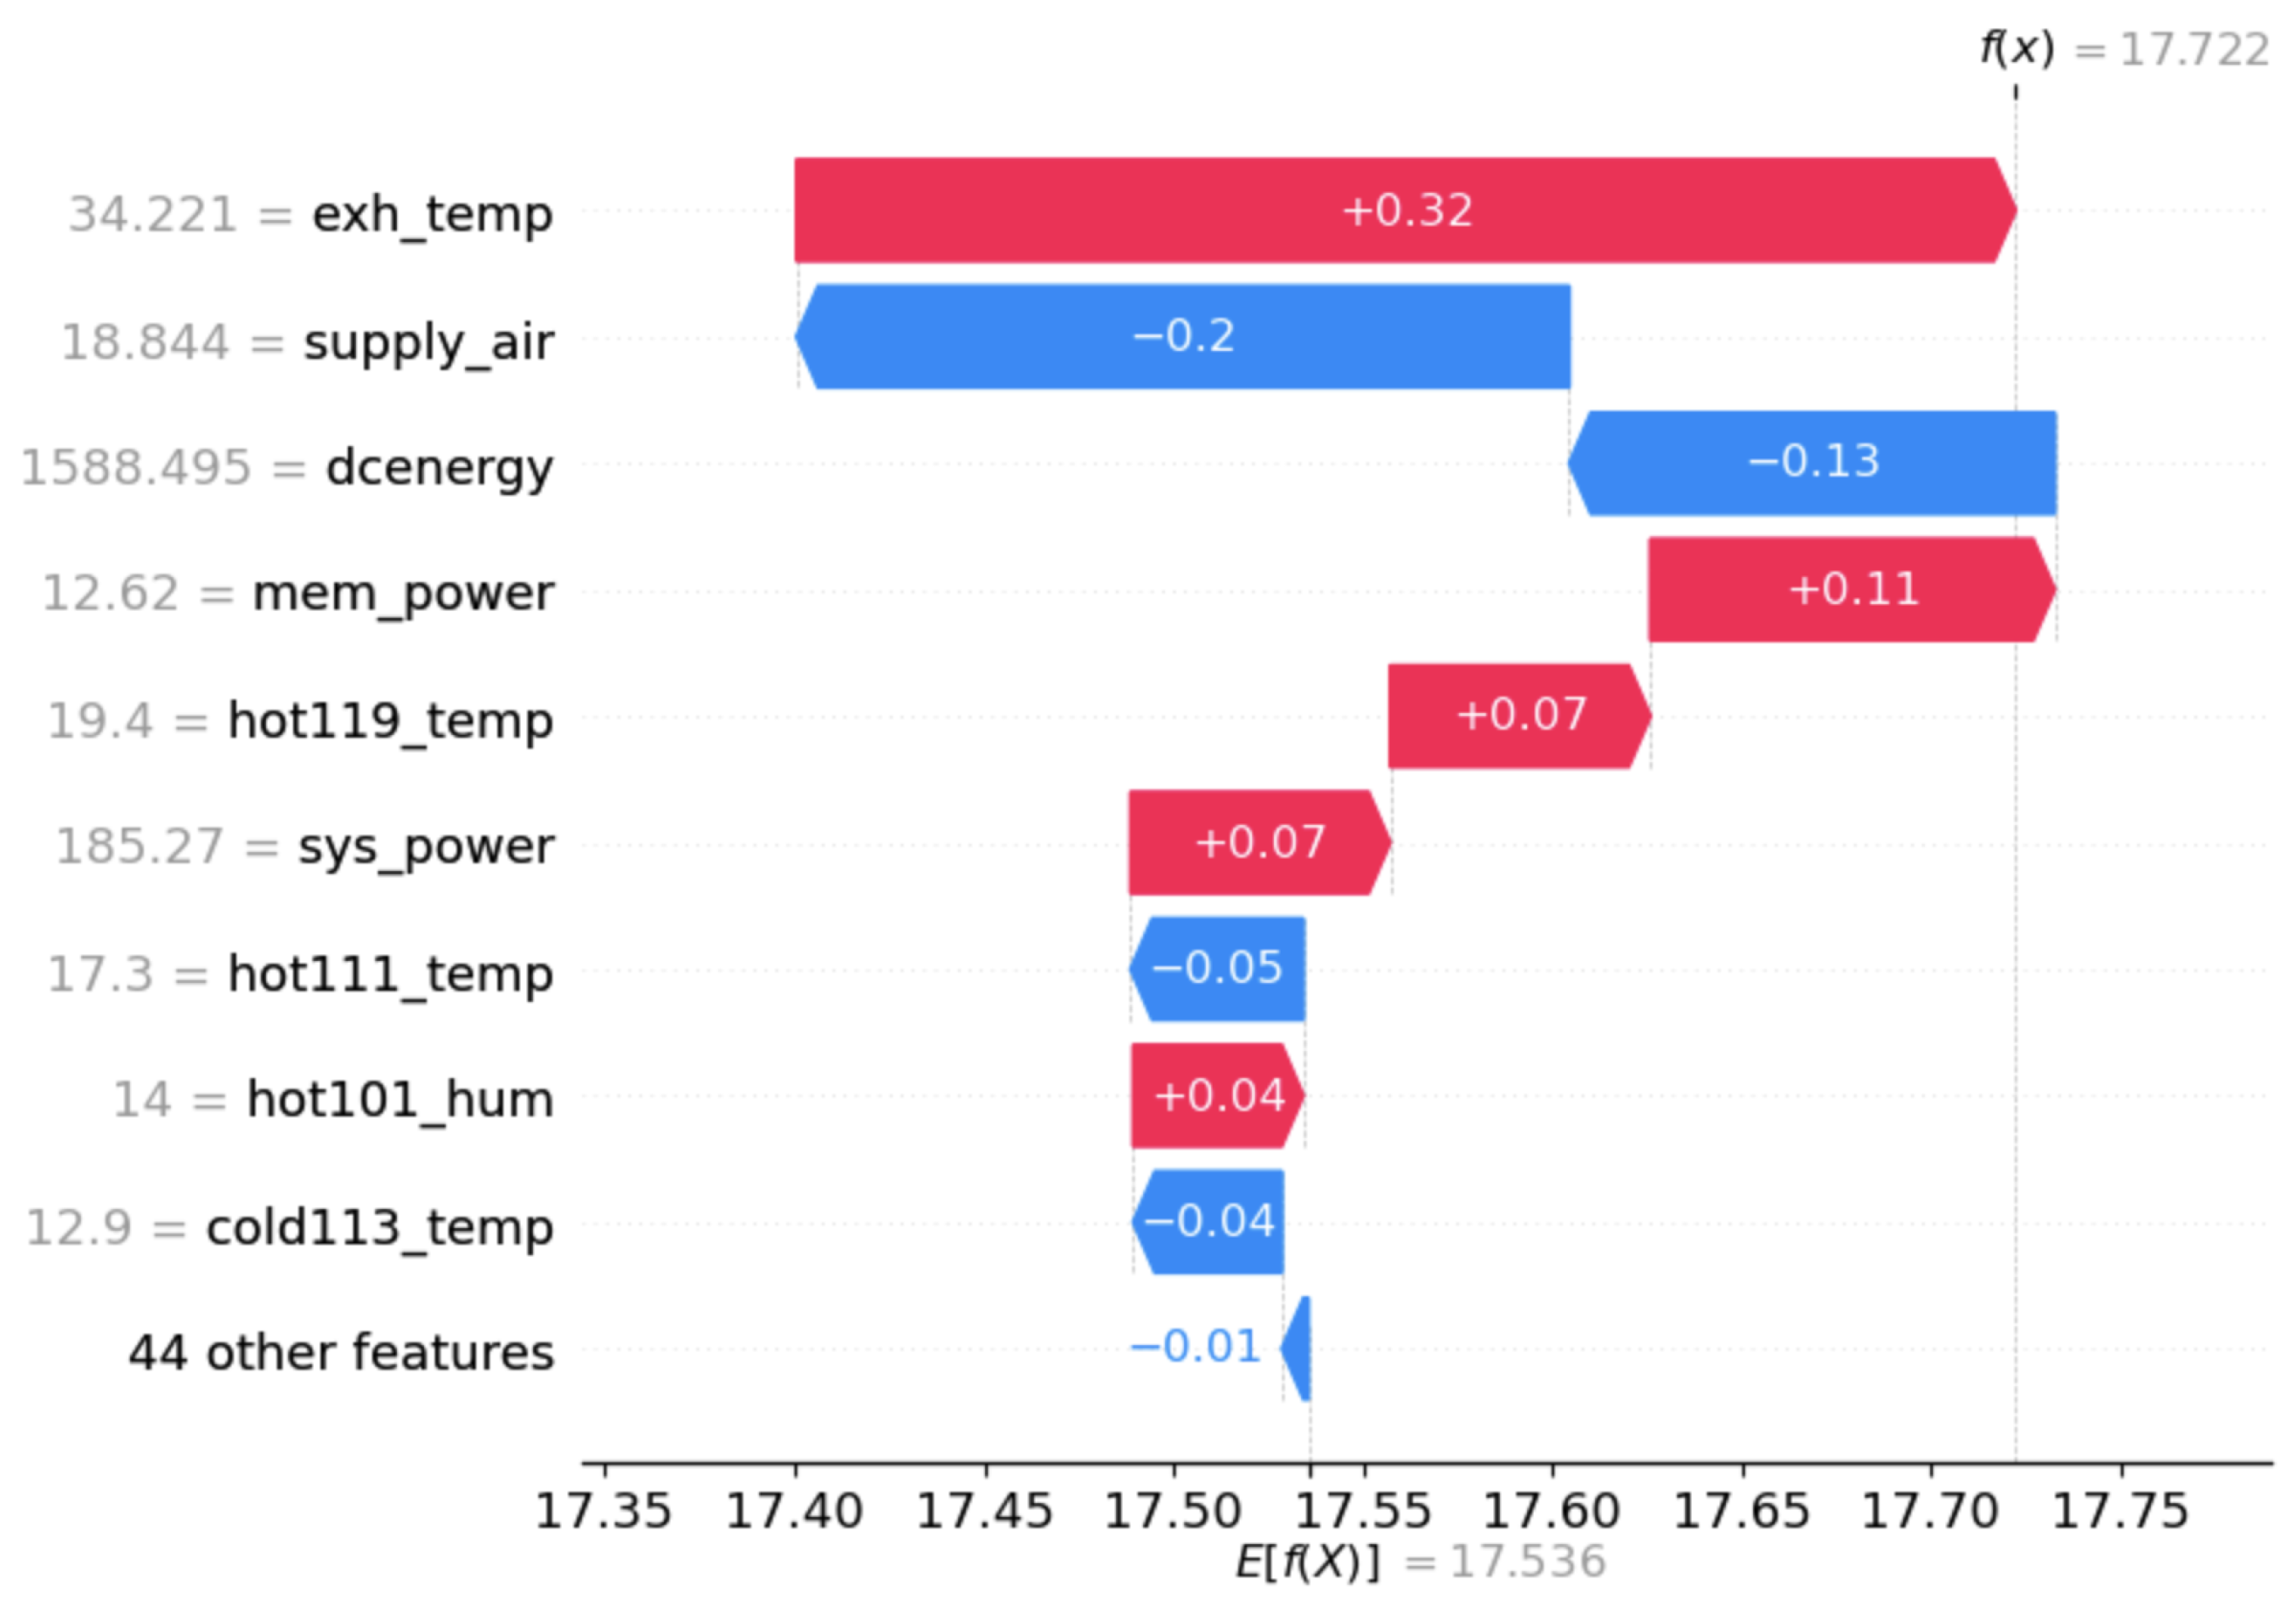
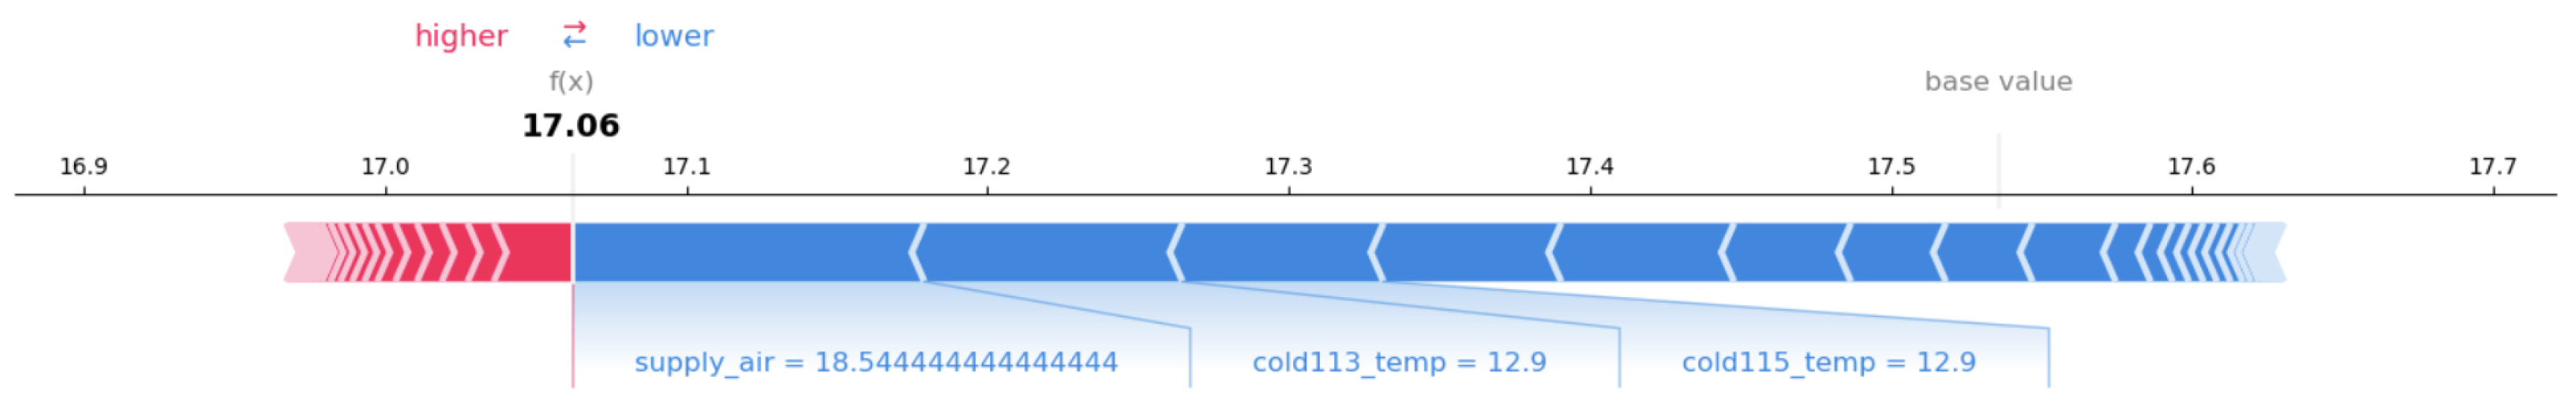
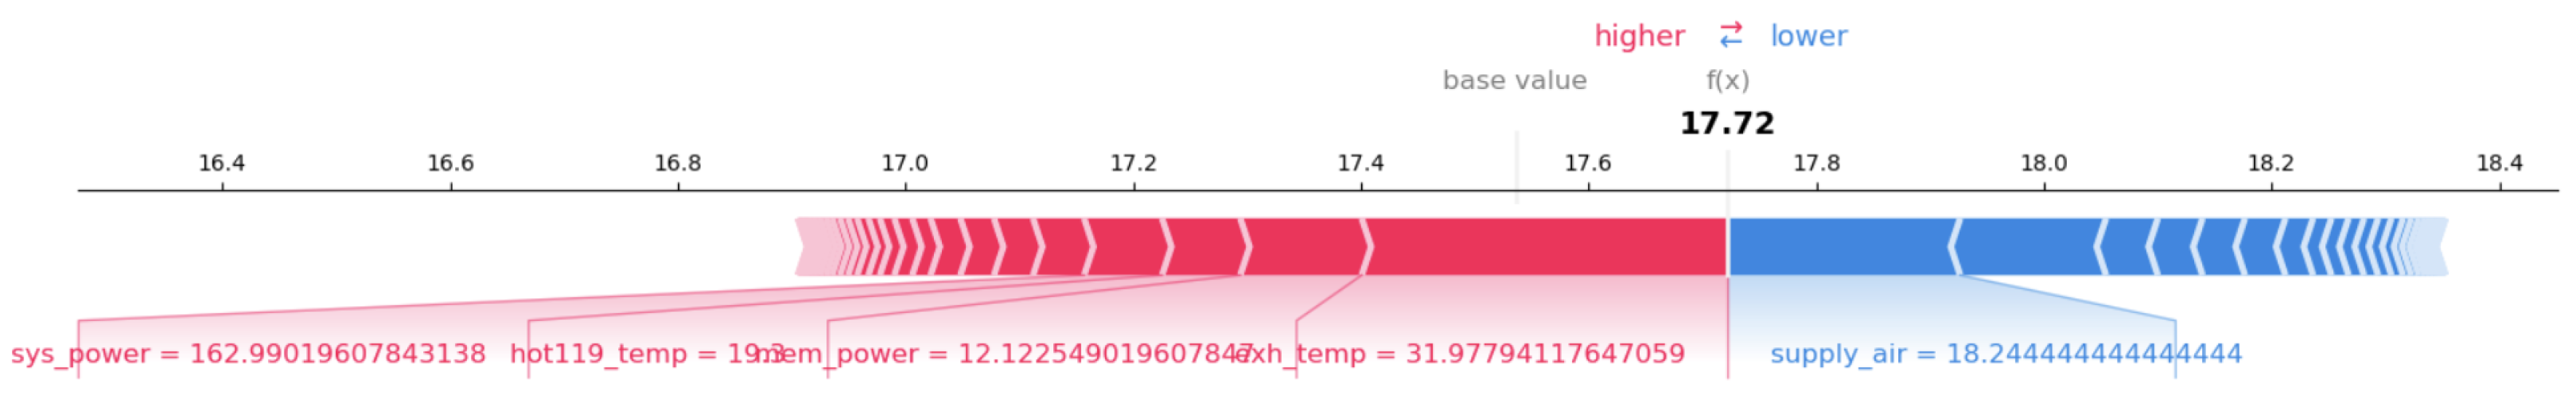
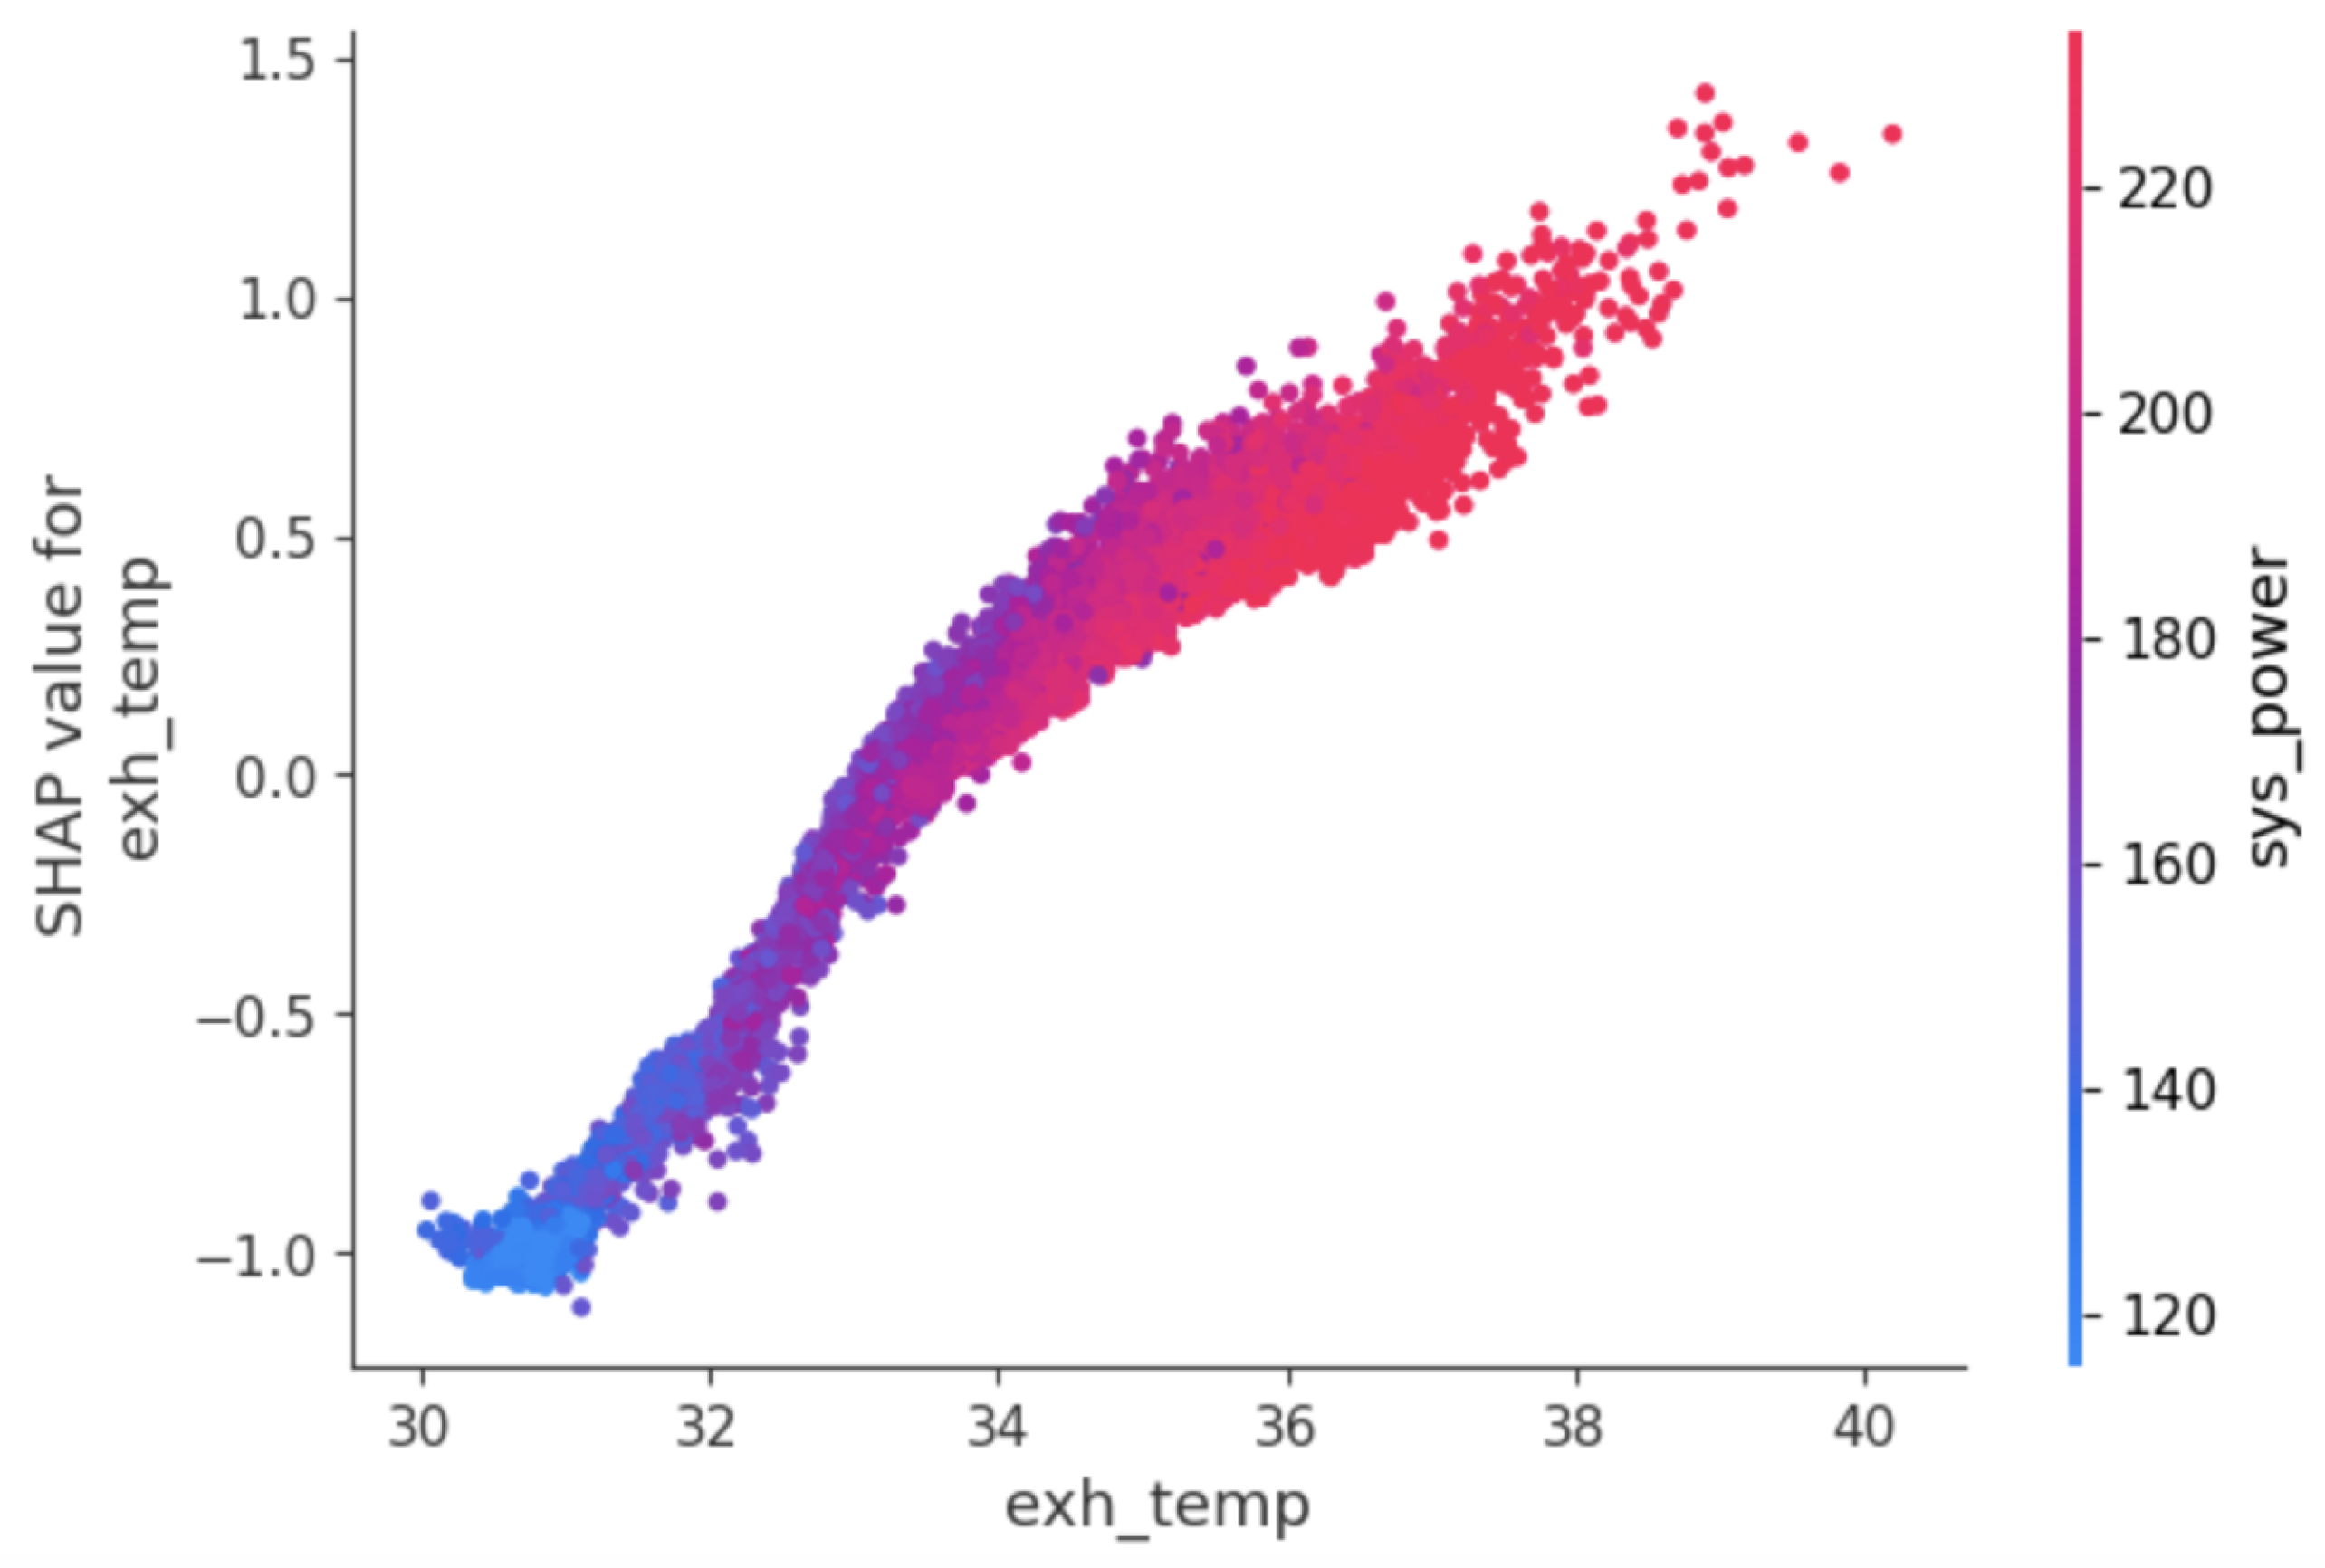
5.2. SHAP-Based Feature Importance and Comparison Analysis
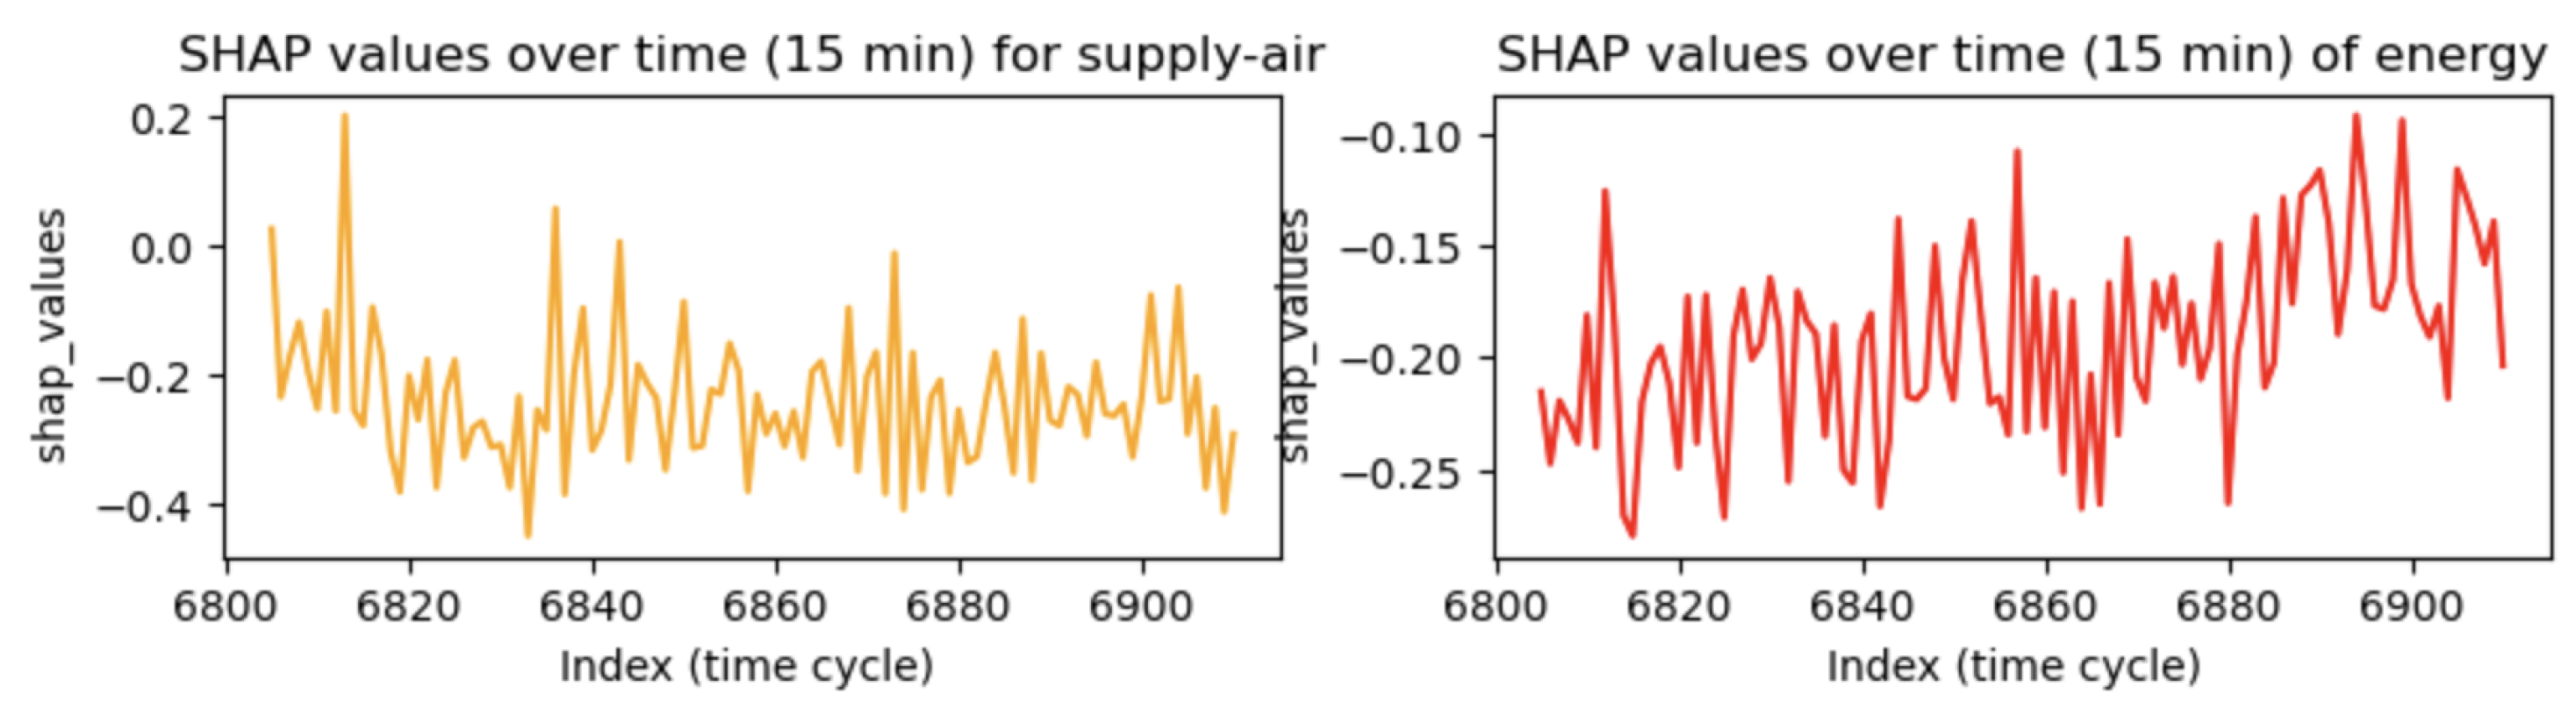
5.3. SHAP-Based Temporal Feature Importance Analysis
6. Conclusions and Future Works
Author Contributions
Funding
Data Availability Statement
Conflicts of Interest
Abbreviations
| AI | Artificial Intelligence |
| DC | Data Center |
| DCIM | Data Center Infrastructure Management |
| CNN | Convolutional Neural Network |
| LSTM | Long Short-Term Memory |
| RF | Random Forest |
| RNN | Recurrent Neural Network |
| SHAP | SHapley Additive exPlanations |
| ML | Machine Learning |
| NN | Neural Network |
| MTS | Multivariate Time Series |
| HPC | High-Performance Computing |
| XGB | XGBoost |
| XAI | Explainable AI |
Appendix A
- Timestamp_measure: the datetime for reading data streams from sensors (minutes)
- sys_power: the total instantaneous power of each node (Watts)
- cpu_power: the instantaneous CPU power of each node (Watts)
- mem_power: each node’s RAM memory instantaneous power (Watts)
- fan1a: the node’s fan speed, expressed in RPM (revolutions per minute)
- fan1b: speed of the fan (Fan1b) installed in the node, expressed in RPM
- fan2a: speed of the fan (Fan2a) installed in the node, expressed in RPM
- fan2b: speed of the fan (Fan2b) installed in the node, expressed in RPM
- fan3a: speed of the fan (Fan3a) installed in the node, expressed in RPM
- fan3b: speed of the fan (Fan3b) installed in the node, expressed in RPM
- fan4a: speed of the fan (Fan4a) installed in the node, expressed in RPM
- fan4b: speed of the fan (Fan4b) installed in the node, expressed in RPM
- fan5a: speed the fan (Fan5a) installed in the node, expressed in RPM
- fan5b: speed of the fan (Fan5b) installed in the node, expressed in RPM
- sys_util: the system usage (%)
- cpu_util: the CPU usage (%)
- mem_util: the RAM usage (%)
- io_util: the node’s I/O traffic
- cpu1_Temp: the CPU (CPU1) temperature (°C)
- cpu2_Temp: the CPU (CPU2) temperature (°C)
- sysairflow: the airflow of the node in CFM (cubic feet to minute)
- exh_temp: the exhaust temperature (air exit of the node), expressed in °C
- amb_temp: ambient temperature/room temperature, expressed in °C (target variable)
- dcenergy: the DC energy demand, expressed in Kwh (target variable)
- supply_air: the cold air or inlet temperature (°C)
- return_air: the heat or warm air ejected to the outside (°C)
- relative_umidity: the working humidity of the CRAC (°C)
- fan_speed: the speed of the CRAC cooling system (RPM)
- cooling: the working intensity of the CRAC (%)
- free_cooling: not applicable, as all values are 0
- hot103_temp: the hot temperature (°C) monitored by sensor hot103
- hot103_hum: hot_humidity monitored by sensor hot103
- hot101_temp: hot temperature (°C) monitored by sensor hot101
- hot101_hum: hot_humidity (%) monitored by sensor hot101
- hot111_temp: hot temperature (°C) monitored by sensor hot111
- hot111_hum: hot_humidity (%) monitored by sensor hot111
- hot117_temp: hot temperature (°C) monitored by sensor hot117
- hot117_hum: hot_humidity (%) monitored by sensor hot117
- hot109_temp: temperature (°C) monitored by sensor hot109
- hot109_hum: hot_humidity (%) monitored by sensor hot109
- hot119_temp: hot_temperature (°C) monitored by sensor hot119
- hot119_hum: hot_humidity (%) monitored by sensor hot119
- cold107_temp: cold_temperature (°C) monitored by sensor cold107
- cold107_hum: cold_humidity (%) monitored by sensor cold107
- cold105_temp: cold_temperature (°C) monitored by sensor cold105
- cold105_hum: cold_humidity (%) monitored by sensor cold105r
- cold115_temp: cold_temperature (°C) monitored by sensor cold115
- cold115_hum: cold_humidity (%) monitored by sensor cold115
- cold113_temp: cold_temperature (°C) monitored by sensor cold113
- cold113_hum: cold_humidity (%) monitored by sensor cold113
- hour: hours of the day
- day: days of the week
- month: months of the year
- quarter: quarter of the year
References
- Gao, J. Machine Learning Applications for Data Center Optimization. 2014. Available online: https://static.googleusercontent.com/media/research.google.com/en//pubs/archive/42542.pdf (accessed on 26 January 2024).
- Bianchini, R.; Fontoura, M.; Cortez, E.; Bonde, A.; Muzio, A.; Constantin, A.M.; Moscibroda, T.; Magalhaes, G.; Bablani, G.; Russinovich, M. Toward ml-centric cloud platforms. Commun. ACM 2020, 63, 50–59. [Google Scholar] [CrossRef]
- Haghshenas, K.; Pahlevan, A.; Zapater, M.; Mohammadi, S.; Atienza, D. Magnetic: Multi-agent machine learning-based approach for energy efficient dynamic consolidation in data centers. IEEE Trans. Serv. Comput. 2019, 15, 30–44. [Google Scholar] [CrossRef]
- Sharma, J.; Mittal, M.L.; Soni, G. Condition-based maintenance using machine learning and role of interpretability: A review. Int. J. Syst. Assur. Eng. Manag. 2022, 1–16. [Google Scholar] [CrossRef]
- Krishnan, M. Against interpretability: A critical examination of the interpretability problem in machine learning. Philos. Technol. 2020, 33, 487–502. [Google Scholar] [CrossRef]
- Vollert, S.; Atzmueller, M.; Theissler, A. Interpretable Machine Learning: A brief survey from the predictive maintenance perspective. In Proceedings of the 2021 26th IEEE International Conference on Emerging Technologies and Factory Automation (ETFA), IEEE, Vasteras, Sweden, 7–10 September 2021; pp. 01–08. [Google Scholar]
- Baptista, M.L.; Goebel, K.; Henriques, E.M. Relation between prognostics predictor evaluation metrics and local interpretability SHAP values. Artif. Intell. 2022, 306, 103667. [Google Scholar] [CrossRef]
- Al-Najjar, H.A.; Pradhan, B.; Beydoun, G.; Sarkar, R.; Park, H.J.; Alamri, A. A novel method using explainable artificial intelligence (XAI)-based Shapley Additive Explanations for spatial landslide prediction using Time-Series SAR dataset. Gondwana Res. 2023, 123, 107–124. [Google Scholar] [CrossRef]
- Casalicchio, G.; Molnar, C.; Bischl, B. Visualizing the feature importance for black box models. In Proceedings of the Machine Learning and Knowledge Discovery in Databases: European Conference, ECML PKDD 2018, Dublin, Ireland, 10–14 September 2018; pp. 655–670. [Google Scholar]
- Grishina, A.; Chinnici, M.; Kor, A.L.; De Chiara, D.; Guarnieri, G.; Rondeau, E.; Georges, J.P. Thermal awareness to enhance data center energy efficiency. Clean. Eng. Technol. 2022, 6, 100409. [Google Scholar] [CrossRef]
- Yang, Z.; Du, J.; Lin, Y.; Du, Z.; Xia, L.; Zhao, Q.; Guan, X. Increasing the energy efficiency of a data center based on machine learning. J. Ind. Ecol. 2022, 26, 323–335. [Google Scholar] [CrossRef]
- Ilager, S.; Ramamohanarao, K.; Buyya, R. Thermal prediction for efficient energy management of clouds using machine learning. IEEE Trans. Parallel Distrib. Syst. 2020, 32, 1044–1056. [Google Scholar] [CrossRef]
- Grishina, A.; Chinnici, M.; Kor, A.L.; Rondeau, E.; Georges, J.P. A machine learning solution for data center thermal characteristics analysis. Energies 2020, 13, 4378. [Google Scholar] [CrossRef]
- Guidotti, R.; Monreale, A.; Ruggieri, S.; Turini, F.; Giannotti, F.; Pedreschi, D. A survey of methods for explaining black box models. ACM Comput. Surv. CSUR 2018, 51, 1–42. [Google Scholar] [CrossRef]
- Nor, A.K.M.; Pedapati, S.R.; Muhammad, M.; Leiva, V. Abnormality detection and failure prediction using explainable Bayesian deep learning: Methodology and case study with industrial data. Mathematics 2022, 10, 554. [Google Scholar] [CrossRef]
- Amin, O.; Brown, B.; Stephen, B.; McArthur, S. A case-study led investigation of explainable AI (XAI) to support deployment of prognostics in industry. In Proceedings of the European Conference of The PHM Society, Turin, Italy, 6–8 July 2022; pp. 9–20. [Google Scholar]
- Doshi-Velez, F.; Kim, B. Towards a rigorous science of interpretable machine learning. arXiv 2017, arXiv:1702.08608. [Google Scholar]
- Mittelstadt, B.; Russell, C.; Wachter, S. Explaining explanations in AI. In Proceedings of the Conference on Fairness, Accountability, and Transparency, Atlanta, GA, USA, 29–31 January 2019; pp. 279–288. [Google Scholar]
- Ribeiro, M.T.; Singh, S.; Guestrin, C. “Why should i trust you?” Explaining the predictions of any classifier. In Proceedings of the 22nd ACM SIGKDD International Conference on Knowledge Discovery and Data Mining, San Francisco, CA, USA, 13–17 August 2016; pp. 1135–1144. [Google Scholar]
- Shrikumar, A.; Greenside, P.; Kundaje, A. Learning important features through propagating activation differences. In Proceedings of the International Conference on Machine Learning, PMLR, Sydney, Australia, 6–11 August 2017; pp. 3145–3153. [Google Scholar]
- Bach, S.; Binder, A.; Montavon, G.; Klauschen, F.; Müller, K.R.; Samek, W. On pixel-wise explanations for non-linear classifier decisions by layer-wise relevance propagation. PLoS ONE 2015, 10, e0130140. [Google Scholar] [CrossRef] [PubMed]
- Lipovetsky, S.; Conklin, M. Analysis of regression in game theory approach. Appl. Stoch. Model. Bus. Ind. 2001, 17, 319–330. [Google Scholar] [CrossRef]
- Lundberg, S.M.; Lee, S.I. A unified approach to interpreting model predictions. In Proceedings of the 31st Conference on Neural Information Processing Systems (NIPS 2017), Long Beach, CA, USA, 4–9 December 2017; pp. 2–9. [Google Scholar]
- Lundberg, S.M.; Erion, G.; Chen, H.; DeGrave, A.; Prutkin, J.M.; Nair, B.; Katz, R.; Himmelfarb, J.; Bansal, N.; Lee, S.I. From local explanations to global understanding with explainable AI for trees. Nat. Mach. Intell. 2020, 2, 56–67. [Google Scholar] [CrossRef]
- Molnar, C. Interpretable Machine Learning; Lulu: Morrisville, NC, USA, 2020. [Google Scholar]
- Mokhtari, K.E.; Higdon, B.P.; Başar, A. Interpreting financial time series with SHAP values. In Proceedings of the 29th Annual International Conference on Computer Science and Software Engineering, Markham, ON, Canada, 4–6 November 2019; pp. 166–172. [Google Scholar]
- Madhikermi, M.; Malhi, A.K.; Främling, K. Explainable artificial intelligence based heat recycler fault detection in air handling unit. In Proceedings of the Explainable, Transparent Autonomous Agents and Multi-Agent Systems: First International Workshop, EXTRAAMAS 2019, Montreal, QC, Canada, 13–14 May 2019; pp. 110–125. [Google Scholar]
- Saluja, R.; Malhi, A.; Knapič, S.; Främling, K.; Cavdar, C. Towards a rigorous evaluation of explainability for multivariate time series. arXiv 2021, arXiv:2104.04075. [Google Scholar]
- Raykar, V.C.; Jati, A.; Mukherjee, S.; Aggarwal, N.; Sarpatwar, K.; Ganapavarapu, G.; Vaculin, R. TsSHAP: Robust model agnostic feature-based explainability for time series forecasting. arXiv 2023, arXiv:2303.12316. [Google Scholar]
- Schlegel, U.; Oelke, D.; Keim, D.A.; El-Assady, M. Visual Explanations with Attributions and Counterfactuals on Time Series Classification. arXiv 2023, arXiv:2307.08494. [Google Scholar]
- Chakraborty, S.; Tomsett, R.; Raghavendra, R.; Harborne, D.; Alzantot, M.; Cerutti, F.; Srivastava, M.; Preece, A.; Julier, S.; Rao, R.M.; et al. Interpretability of deep learning models: A survey of results. In Proceedings of the 2017 IEEE Smartworld, Ubiquitous Intelligence & Computing, Advanced & Trusted Computed, Scalable Computing & Communications, Cloud & Big Data Computing, Internet of People and Smart City Innovation (smartworld/SCALCOM/UIC/ATC/CBDcom/IOP/SCI), IEEE, San Francisco, CA, USA, 4–8 August 2017; pp. 1–6. [Google Scholar]
- Yan, X.; Zang, Z.; Jiang, Y.; Shi, W.; Guo, Y.; Li, D.; Zhao, C.; Husi, L. A Spatial-Temporal Interpretable Deep Learning Model for improving interpretability and predictive accuracy of satellite-based PM2.5. Environ. Pollut. 2021, 273, 116459. [Google Scholar] [CrossRef]
- Carvalho, D.V.; Pereira, E.M.; Cardoso, J.S. Machine learning interpretability: A survey on methods and metrics. Electronics 2019, 8, 832. [Google Scholar] [CrossRef]
- Hong, S.R.; Hullman, J.; Bertini, E. Human factors in model interpretability: Industry practices, challenges, and needs. Proc. ACM Hum.-Comput. Interact. 2020, 4, 1–26. [Google Scholar] [CrossRef]
- Liu, C.L.; Hsaio, W.H.; Tu, Y.C. Time series classification with multivariate convolutional neural network. IEEE Trans. Ind. Electron. 2018, 66, 4788–4797. [Google Scholar] [CrossRef]
- Ma, Z.; Krings, A.W. Survival analysis approach to reliability, survivability and prognostics and health management (PHM). In Proceedings of the 2008 IEEE Aerospace Conference, Big Sky, MT, USA, 1–8 March 2008; pp. 1–20. [Google Scholar]
- Yang, Z.; Kanniainen, J.; Krogerus, T.; Emmert-Streib, F. Prognostic modeling of predictive maintenance with survival analysis for mobile work equipment. Sci. Rep. 2022, 12, 8529. [Google Scholar] [CrossRef] [PubMed]
- Wang, Y.; Li, Y.; Zhang, Y.; Yang, Y.; Liu, L. RUSHAP: A Unified approach to interpret Deep Learning model for Remaining Useful Life Estimation. In Proceedings of the 2021 Global Reliability and Prognostics and Health Management (PHM-Nanjing), IEEE, Nanjing, China, 15–17 October 2021; pp. 1–6. [Google Scholar]
- Lee, G.; Kim, J.; Lee, C. State-of-health estimation of Li-ion batteries in the early phases of qualification tests: An interpretable machine learning approach. Expert Syst. Appl. 2022, 197, 116817. [Google Scholar] [CrossRef]
- Youness, G.; Aalah, A. An explainable artificial intelligence approach for remaining useful life prediction. Aerospace 2023, 10, 474. [Google Scholar] [CrossRef]
- Gebreyesus, Y.; Dalton, D.; Nixon, S.; De Chiara, D.; Chinnici, M. Machine learning for data center optimizations: Feature selection using shapley additive explanation (SHAP). Future Internet 2023, 15, 88. [Google Scholar] [CrossRef]
- Ho, T.K. Random decision forests. In Proceedings of the 3rd International Conference on Document Analysis and Recognition, Montreal, QC, Canada, 14–16 August 1995; Volume 1, pp. 278–282. [Google Scholar]
- Breiman, L. Random forests. Mach. Learn. 2001, 45, 5–32. [Google Scholar] [CrossRef]
- Chen, T.; Guestrin, C. Xgboost: A scalable tree boosting system. In Proceedings of the 22nd ACM Sigkdd International Conference on Knowledge Discovery and Data Mining, San Francisco, CA, USA, 13–17 August 2016; pp. 785–794. [Google Scholar]
- Hochreiter, S.; Schmidhuber, J. Long short-term memory. Neural Comput. 1997, 9, 1735–1780. [Google Scholar] [CrossRef]
- Mazzanti, S. Shap Values Explained Exactly How You Wished Someone Explained to You. Towards Data Sci. 2020, 3. Available online: https://www.google.com.hk/url?sa=t&source=web&rct=j&opi=89978449&url=https://towardsdatascience.com/shap-explained-the-way-i-wish-someone-explained-it-to-me-ab81cc69ef30&ved=2ahUKEwi-n8X-89mFAxVPS2cHHXjOCN8QFnoECBYQAQ&usg=AOvVaw0GgsibNJk8EXlQScXIWl3f (accessed on 21 April 2024).
- Mazzanti, S. Boruta Explained Exactly How You Wished Someone Explained to You. Towards Data Sci. 2020. Available online: https://www.google.com.hk/url?sa=t&source=web&rct=j&opi=89978449&url=https://towardsdatascience.com/boruta-explained-the-way-i-wish-someone-explained-it-to-me-4489d70e154a&ved=2ahUKEwiC4IyP9NmFAxUdS2wGHaRbDtIQFnoECBAQAQ&usg=AOvVaw1tYqW1Fd6dhxvLWLB5yu4x (accessed on 21 April 2024).
- García, M.V.; Aznarte, J.L. Shapley additive explanations for NO2 forecasting. Ecol. Inform. 2020, 56, 101039. [Google Scholar] [CrossRef]


| Dataset | Samples | Features |
|---|---|---|
| Energy and workload_related_data | 12,541,104 | 26 |
| Cooling system related_data | 310,245 | 9 |
| Environmental related_data | 35,579 | 22 |
| Hyperparameters | Values |
|---|---|
| n_estimators | 200 |
| max_depth | 5 |
| min_samples_split | 2 |
| min_samples_leaf | 1 |
| Hyperparameters | Values |
|---|---|
| n_estimators | 2000 |
| max_depth | 6 |
| learning_rate | 0.001 |
| min_samples_split | 2 |
| min_samples_leaf | 1 |
| Hyperparameters | Values |
|---|---|
| Input tensor | 64 ∗ 10 ∗ 54 |
| LSTM layer | 64 ∗ 2 |
| Activation function | Relu |
| Output layer | 64 ∗ 1 |
| Optimiser | Adam |
| Loss function | MSE |
| epochs | 100 |
| batch_sizes | 32 |
| Models | Selected Features | MAE | MSE | RMSE | Run_Time |
|---|---|---|---|---|---|
| RF | 27 | 0.308 | 0.0501 | 0.0707 | 850 |
| XGB | 29 | 0.201 | 0.0433 | 0.0658 | 620 |
| LSTM | 54 | 0.0352 | 0.00341 | 0.0584 | 340 |
Disclaimer/Publisher’s Note: The statements, opinions and data contained in all publications are solely those of the individual author(s) and contributor(s) and not of MDPI and/or the editor(s). MDPI and/or the editor(s) disclaim responsibility for any injury to people or property resulting from any ideas, methods, instructions or products referred to in the content. |
© 2024 by the authors. Licensee MDPI, Basel, Switzerland. This article is an open access article distributed under the terms and conditions of the Creative Commons Attribution (CC BY) license (https://creativecommons.org/licenses/by/4.0/).
Share and Cite
Gebreyesus, Y.; Dalton, D.; De Chiara, D.; Chinnici, M.; Chinnici, A. AI for Automating Data Center Operations: Model Explainability in the Data Centre Context Using Shapley Additive Explanations (SHAP). Electronics 2024, 13, 1628. https://doi.org/10.3390/electronics13091628
Gebreyesus Y, Dalton D, De Chiara D, Chinnici M, Chinnici A. AI for Automating Data Center Operations: Model Explainability in the Data Centre Context Using Shapley Additive Explanations (SHAP). Electronics. 2024; 13(9):1628. https://doi.org/10.3390/electronics13091628
Chicago/Turabian StyleGebreyesus, Yibrah, Damian Dalton, Davide De Chiara, Marta Chinnici, and Andrea Chinnici. 2024. "AI for Automating Data Center Operations: Model Explainability in the Data Centre Context Using Shapley Additive Explanations (SHAP)" Electronics 13, no. 9: 1628. https://doi.org/10.3390/electronics13091628
APA StyleGebreyesus, Y., Dalton, D., De Chiara, D., Chinnici, M., & Chinnici, A. (2024). AI for Automating Data Center Operations: Model Explainability in the Data Centre Context Using Shapley Additive Explanations (SHAP). Electronics, 13(9), 1628. https://doi.org/10.3390/electronics13091628