Article

A Data Augmentation Method for Side-Channel Attacks on Cryptographic Integrated Circuits

1
School of Electronic Engineering, Beijing University of Posts and Telecommunications, Beijing 100876, China
2
Beijing Key Laboratory of Work Safety Intelligent Monitoring Beijing University of Posts and Telecommunications, Beijing 100876, China
3
Beijing Institute of Spacecraft System Engineering, Beijing 100094, China
4
Beijing Institute of Computer Technology and Applications, Beijing 100039, China
5
School of Cyberspace Security, Beijing University of Posts and Telecommunications, Beijing 100876, China
*
Author to whom correspondence should be addressed.
Electronics 2024, 13(7), 1348; https://doi.org/10.3390/electronics13071348
Submission received: 6 February 2024 / Revised: 24 March 2024 / Accepted: 1 April 2024 / Published: 3 April 2024

Abstract

:
The leaked signals, including electromagnetic, power, timing, and temperature generated during the operation of cryptographic devices, contain highly correlated key value information, leading to security vulnerabilities. In practical operations, due to information collection conditions and time limitations, attackers can only obtain limited valid data. At the same time, the attacker’s data environment cannot be ideal, and noise can affect the acquisition of valid information. Therefore, to improve the effectiveness of obtaining key values from side-channel information analysis in cryptographic devices, we proposed a data augmentation method based on cycle-consistent generative adversarial networks named EME-CycleGAN. By using generators and discriminators, new data are generated to expand the original electromagnetic information dataset, aiming for better modeling effects. For evaluating the data augmentation effect on side-channel electromagnetic signals, we employed the Kolmogorov–Smirnov test to characterize the original and generated data, serving as the evaluation standard for our network model and work. We utilize the existing data to model and verify side-channel attacks, evaluating the impact of the generated information on the overall experimental results. The proposed structure consists of three main parts: side-channel information acquisition, data verification analysis, and determination of attack positions. Experimental results demonstrate that effective attacks on encryption algorithms can be achieved under small-sample dataset conditions.

1. Introduction

In the era of rapid development of information technology, various embedded cryptographic devices are ubiquitous in people’s daily lives. These devices protect valuable information within them through encryption operations, enhancing the security of data. However, during the encryption process, devices inevitably generate information such as electromagnetic radiation [1], power consumption [2], heat [3], and timing [4]. Attackers can exploit side-channel analysis techniques to extract relevant and valuable information associated with the encryption process, posing a threat to the security of the devices. This type of attack is known as a side-channel attack [4]. Since side-channel information collection does not attempt to break the encryption or authentication mechanisms themselves, but rather extracts information from the system by analyzing its behavior or characteristics, such behavior is difficult to detect, exhibiting both high flexibility and high threat characteristics.
Traditional side-channel analysis obtains effective keys by calculating statistical characteristics between side-channel information and encryption algorithms, such as Correlation Power Analysis (CPA), Differential Power Analysis (DPA), and Template Attacks (TAs). In recent years, with the development of machine learning and deep learning, side-channel analysis has also made progress in the direction of profiling attacks. Researchers use neural networks as tools to construct templates during the side-channel modeling phase, aiming to obtain templates with higher accuracy and robustness. However, one major challenge in neural network modeling is the requirement for a large amount of information to be utilized. If the model is trained with limited data, it may lead to overfitting and deviate from its intended purpose. Therefore, researchers have been focusing on methods to achieve better modeling using limited information.
In this paper, we proposed a data augmentation method based on cycle-consistent generative adversarial networks (GANs) to enhance the modeling effectiveness of the original electromagnetic information dataset. The main contributions are as follows:
  • We introduced a cycle-consistent GAN model suitable for generating one-dimensional electromagnetic signals, enabling an effective augmentation of small-sample data.
  • We proposed an evaluation criterion for the data augmentation effect on side-channel electromagnetic signals, utilizing the Kolmogorov–Smirnov test to characterize the original and generated data. This criterion serves as the evaluation standard for our network model and work.
  • We established a side-channel attack model and validated it using existing data, evaluating the impact of the generated information on the overall experimental results.
The remaining sections of this paper are organized as follows. In Section 2, we introduce the related work in the CycleGAN model and traditional data augment method in side-channel analysis. In Section 3, we introduce the overview of the framework in this manuscript. Section 4 describes the EME-GAN we proposed. It is used to generate the electromagnetic signals we needed. Section 5 presents the data statistical analysis method we used to validate. Finally, in Section 6, we showcase the corresponding experimental results by correlation power analysis. Finally, the conclusion is in Section 7.

2. Related Work

In traditional single-sample data augmentation methods, various supervised geometric transformations such as flipping, rotation, cropping, and scaling can be applied to the dataset to generate new data different from the original data [5,6,7]. For electromagnetic signals, common data augmentation methods also include interpolation and smoothing, which are signal processing techniques. All of these methods mentioned are supervised augmentation techniques.
With the emergence of generative adversarial networks (GANs) [8,9], unsupervised data augmentation methods based on GANs have flourished. GANs implicitly model the high-dimensional data distribution to achieve the desired outcomes. The main components of a GAN are a generator and a discriminator, which are both trained under the principles of adversarial learning. The generator generates new samples based on the estimation of the latent distribution of real data samples [10,11]. Initially, GANs used multilayer perceptrons (MLPs) as the structure, and specific types of structures can be adapted for specific applications [12]. For example, recurrent neural networks (RNNs) for time-series data and convolutional neural networks (CNN) for images.
Generative adversarial networks (GANs) have found extensive applications in various fields such as image classification [13,14,15], sentiment analysis [16,17], and medical diagnosis [18]. Researchers use network models to augment and balance the datasets under study, aiming to obtain better research results. For example, Huang et al. [19] proposed an adversarial generative network model for image transformation, which can perform style transfer and generation on car images. This approach expands the dataset for vehicle detection in the automotive domain and improves the accuracy of vehicle detection. Mariani et al. [20] addressed the issue of imbalanced datasets by introducing the BAGAN (Balancing GAN) framework, which uses generative adversarial networks to restore balance to imbalanced image datasets. Yang et al. [21] proposed an IDA-GAN model that stabilizes the data distribution of minority and majority classes using a variant autoencoder. They validated the model on datasets such as MNIST, SVHN, and CIFAR-10. To tackle the problem of dataset scarcity, Jiangsha et al. [22] proposed a CycleGAN-based Extra Supervision (CycleGAN-ES) model to generate synthetic NDT (Non-Destructive Testing) images. In their experiment, they extracted a few defective and non-defective X-ray welding images from the publicly available GDXray dataset and used CycleGAN-ES to generate synthetic defect images based on a small number of extracted defective images and manually drawn defect images as content guides.
Among the various generative adversarial network (GAN) models, CycleGAN holds a prominent position in the field of image processing. In the field of medical diagnosis, Sandfort et al. [23] synthesized new non-contrast CT images of the kidney using CycleGAN to enhance image training. Xu [24] proposed a solution called SSACycleGAN (semi-supervised attention-guided CycleGAN), which is used to synthesize new tumor and normal images. Park et al. [25] utilized CycleGAN for forest image and data research. They addressed the imbalance issue in the data by generating wildfire images using the network. The trained wildfire images helped achieve excellent training accuracy for the models. Cap et al. [26] improved the performance of plant disease diagnosis by proposing the LeafGAN model, which can transform leaf images from a healthy state to a diseased state. Zhu et al. [27] accomplished image-to-image translation using CycleGAN, enabling various effects such as image style transfer, object deformation, seasonal transformation, and photo enhancement through the network.
In the field of side-channel analysis, researchers are also augmenting datasets through various data augmentation techniques to obtain a larger amount of data and increase the information entropy. Cagli et al. [28] addressed the issue of imbalanced number of classes in the Hamming weight model by artificially transforming the previously obtained data to generate new training traces. The transformation methods they used included shifting and add–remove operations. Through data augmentation methods, they alleviated the overfitting phenomenon in convolutional neural networks to a certain extent and constructed better templates.

3. Overview of the Framework

The purpose of this article is to perform data augmentation on the side-channel information generated by encryption devices, expanding the existing data samples to obtain a larger dataset for the modeling part of template attacks. The goal is to avoid overfitting in the training phase, allowing the model to find better parameters and improve its applicability and robustness. The overall content of this article is illustrated in Figure 1. The overall design is divided into four parts: the collection of side-channel leakage from the encryption chip, the construction of the side-channel dataset after side-channel information augmentation, the evaluation of the similarity between augmented and original data, and the results of device encryption algorithm attacks with different amounts of side-channel information data. Part A showcases our platform for collecting side-channel leakage from experimental cryptographic chips. The collection system records the relevant key information during the operation of the encryption chip and receives and saves the electromagnetic information leaked by the chip captured by an oscilloscope. Part B, as the focus of this article, explains how we perform data expansion and augmentation based on the original data. In Part C, we evaluate the work presented in Part B using statistical testing methods. Through different augmentation methods, we obtain augmented datasets based on the original data. To select the optimal data for subsequent work, we evaluate the original and augmented data using KS single-sample and two-sample testing methods, proposing our own metrics to assess the effectiveness of the data. Part D demonstrates the experimental results obtained using the augmented data, validating the effectiveness and feasibility of the proposed method through experiments.

4. EME-CycleGAN

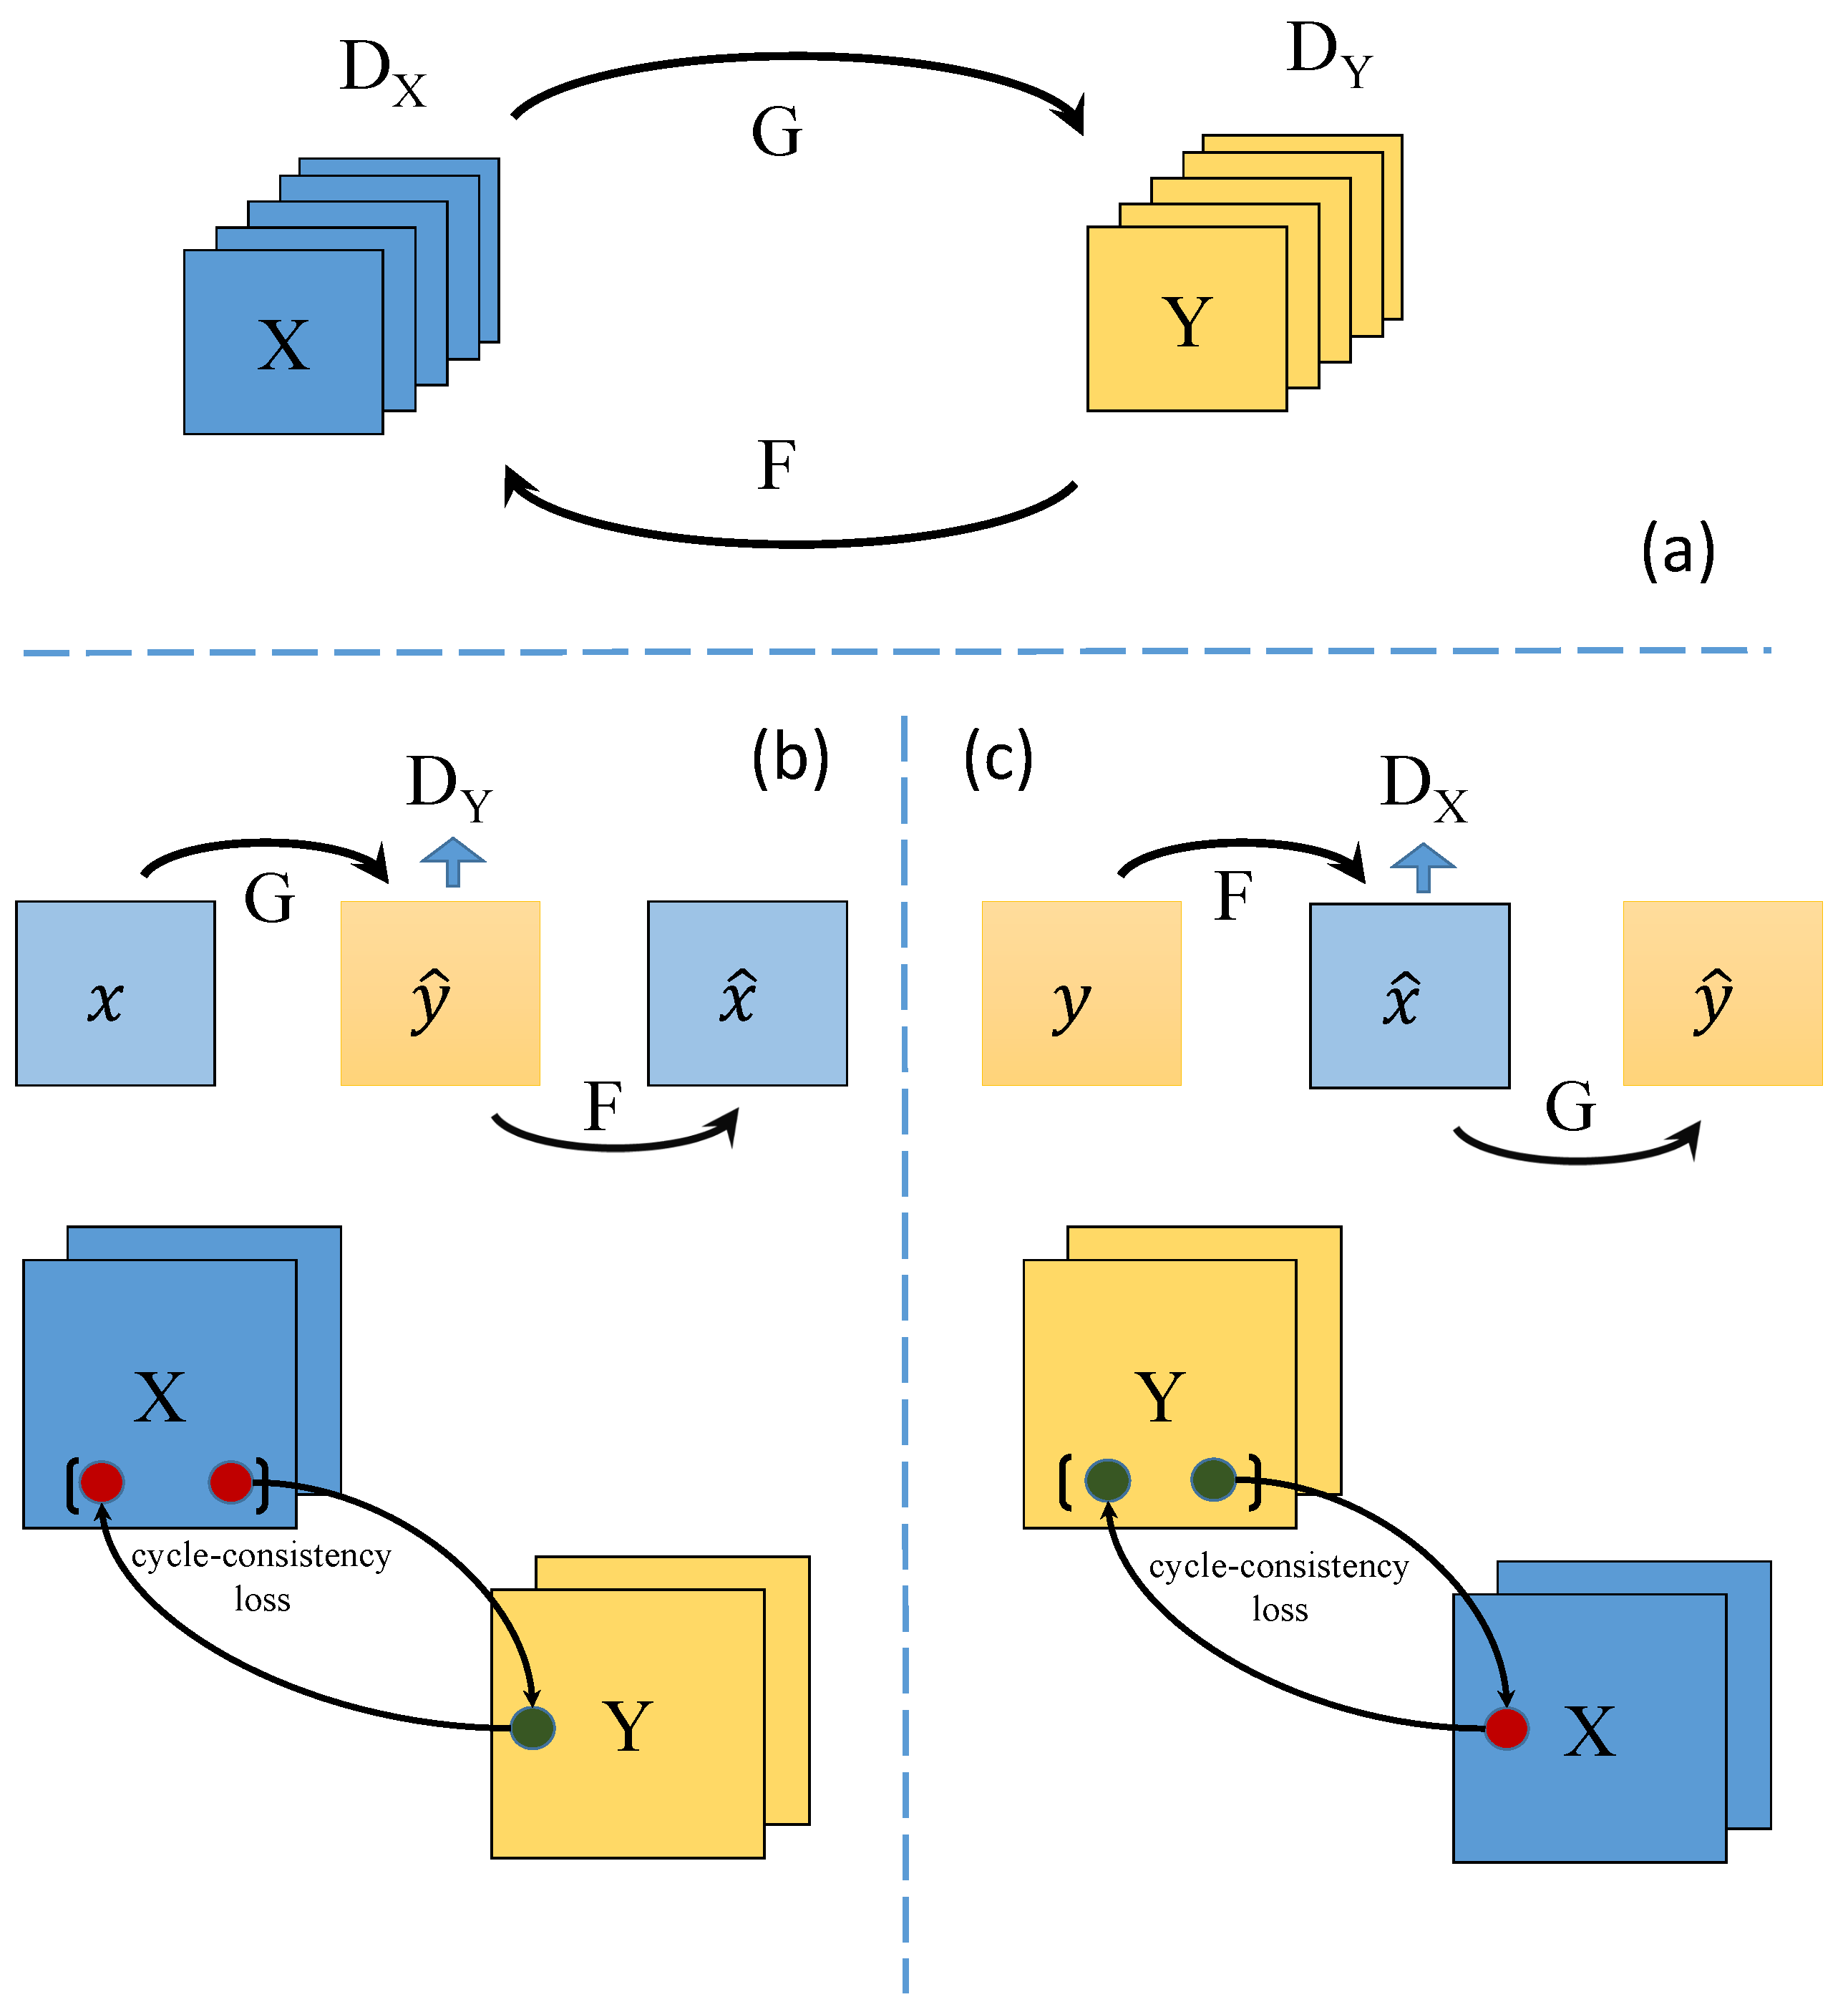
4.1. Basic Structure
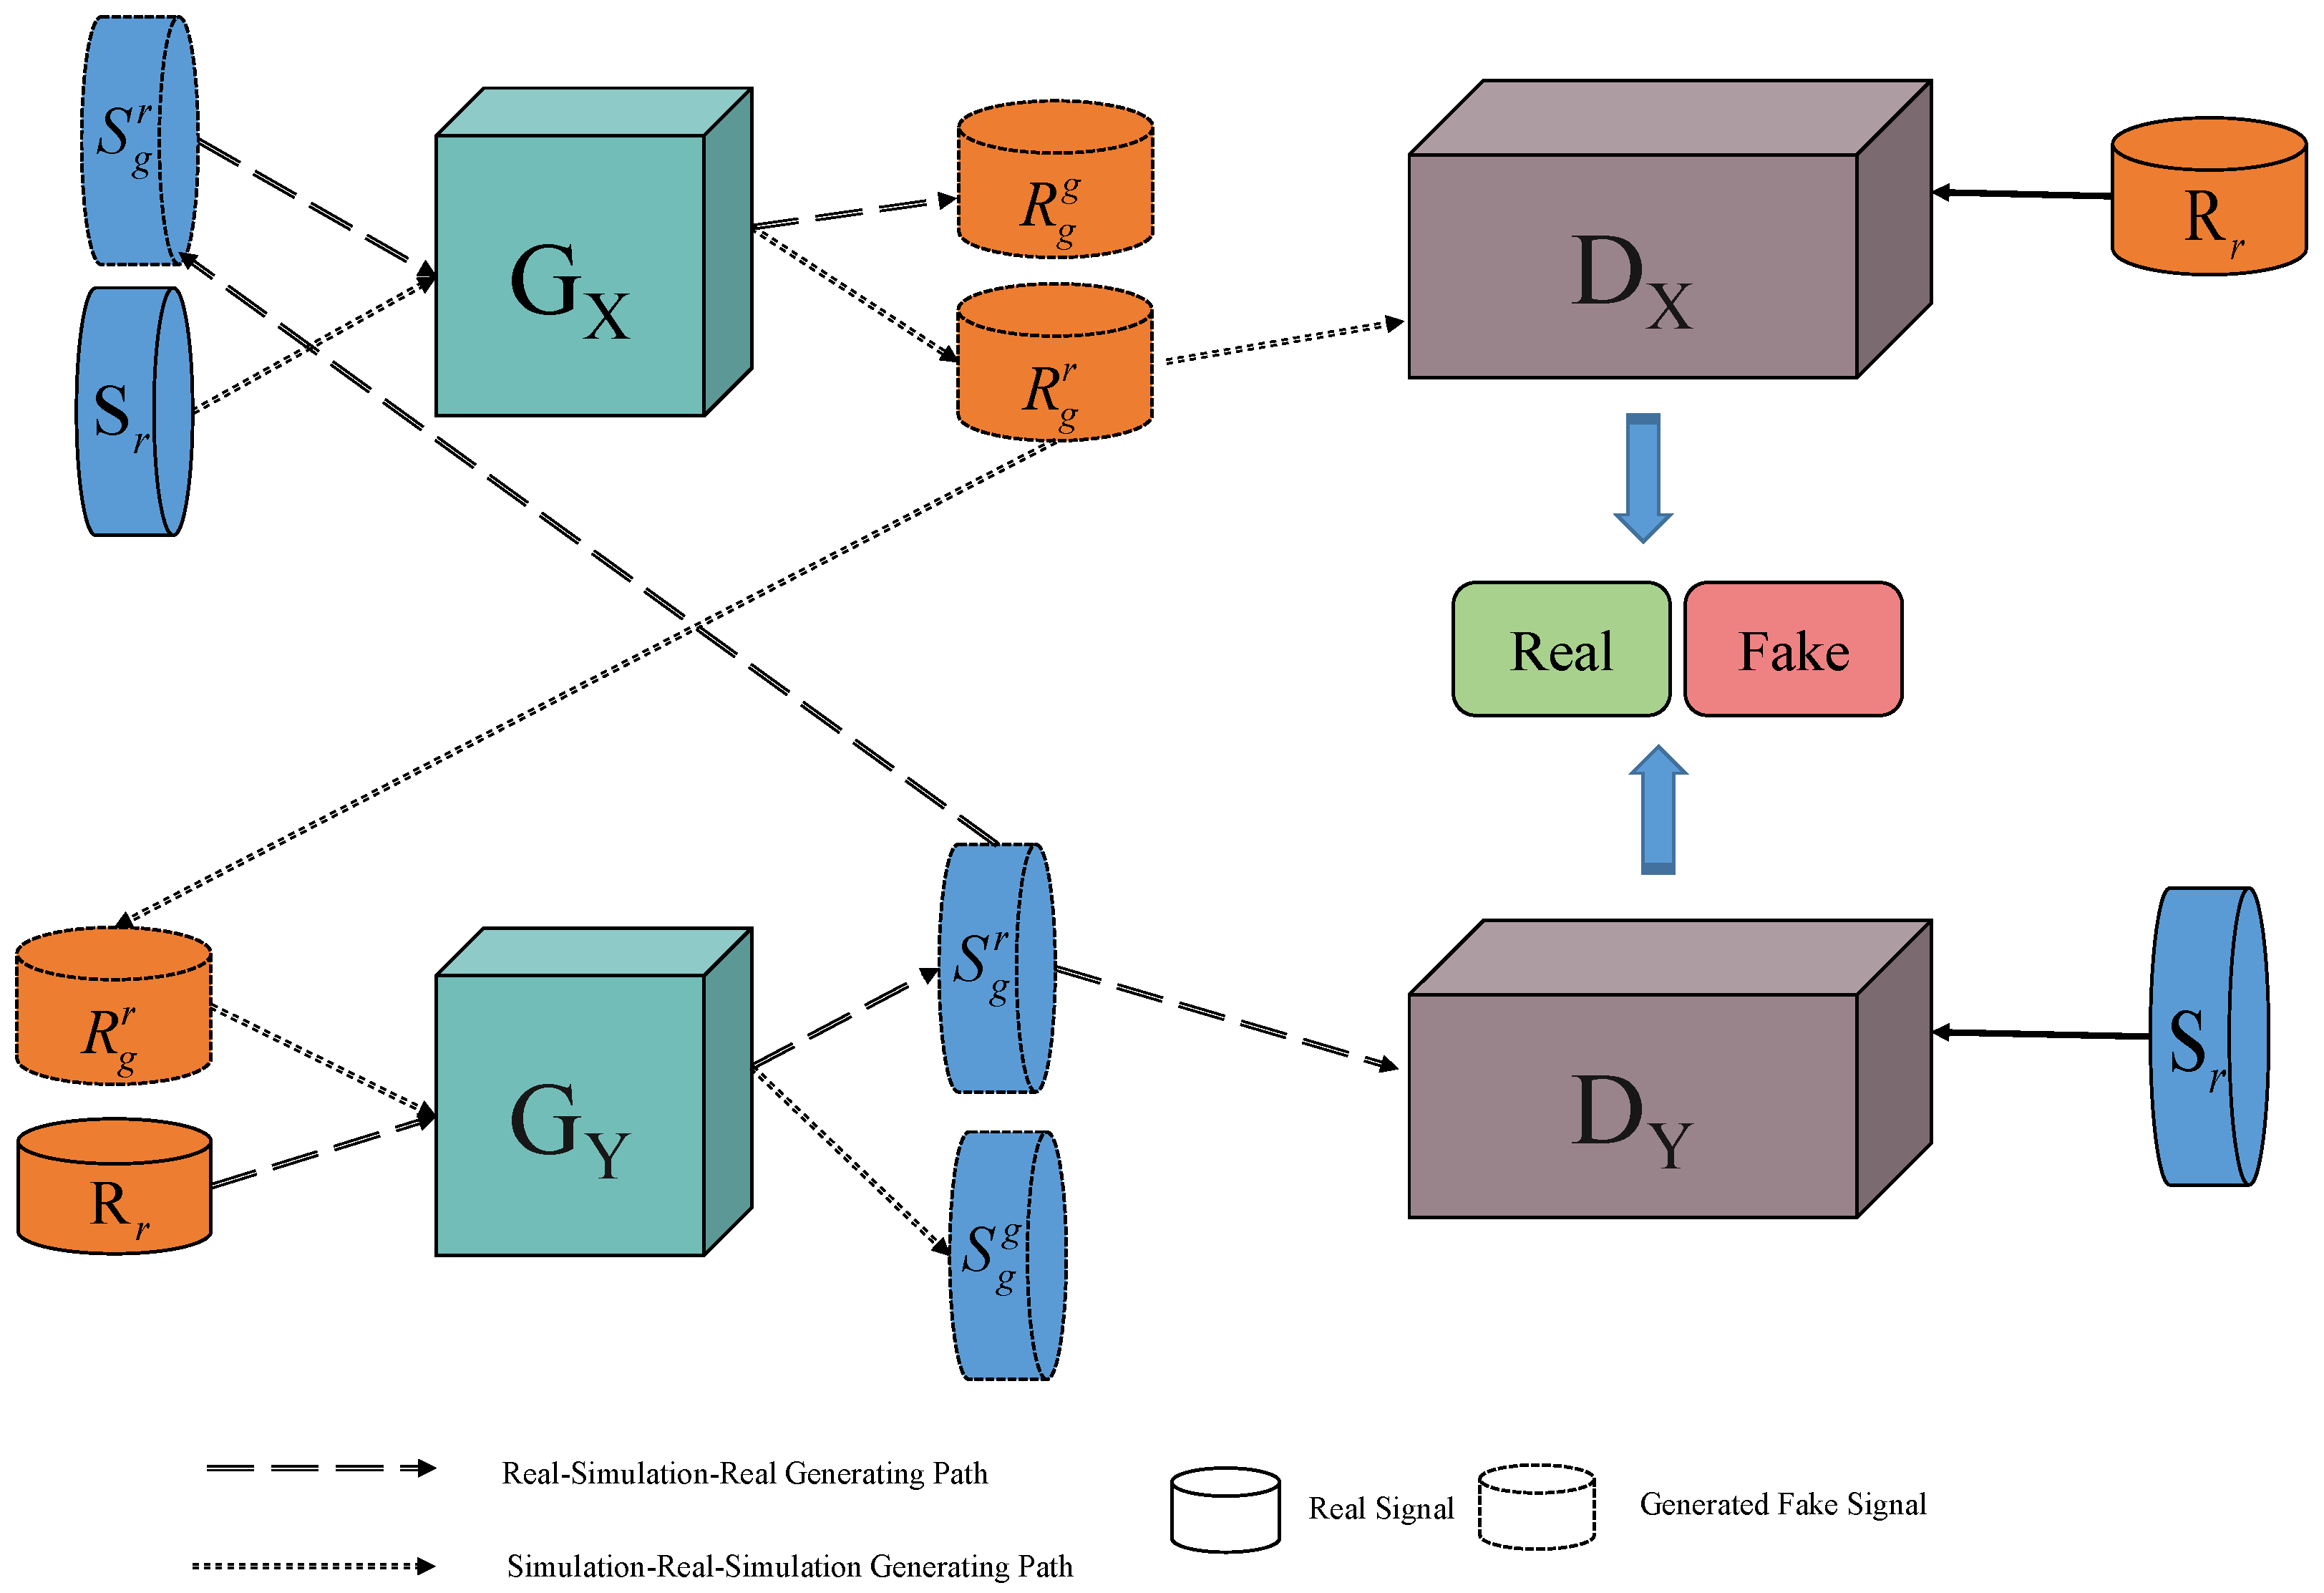
CycleGAN (Cycle-Consistent Generative Adversarial Network) originally was a deep learning model used for image translation, which is capable of performing unsupervised image translation between two different domains [27]. The goal of CycleGAN is to learn the mapping relationship between two domains without the need for paired training data. Typically, these two domains can differ in style, color, texture, or semantic content. The core idea of CycleGAN is to achieve bidirectional image translation by introducing cycle-consistency loss. This is illustrated in Figure 2. CycleGAN consists of two generator networks, G and F, and their corresponding discriminator networks D y and D x . The two generator networks in CycleGAN are responsible for transforming images from one domain to another. They learn the mapping relationship between the domains to generate the translated images. The discriminator networks are used to distinguish between the generated images and real images. They are trained to accurately identify the differences between the fake images generated by the generator and the real images. The objective of the discriminator is to maximize the accuracy in recognizing the generated images while minimizing cases where real images are incorrectly classified as generated images.
During the training process, the generator and discriminator engage in a game-like scenario, which is similar to that of conventional generative adversarial networks (GANs). The generator aims to produce realistic translated images to deceive the discriminator, while the discriminator strives to accurately distinguish between the generated and real images. To achieve consistency in bidirectional translation, CycleGAN also introduces cycle-consistency loss. This loss ensures that the generator maintains the consistency of image features by translating the translated image back to the original domain and comparing it with the input image. Through alternating training of the generator and discriminator, optimized under the guidance of cycle-consistency loss, CycleGAN can learn the mapping relationship between two domains and achieve unsupervised image translation. It has wide applications in tasks such as image style transfer, image translation, and image enhancement.
The loss functions of D y and G are defined as follows:
L G A N ( D y , G , x , y ) = E y P d a t a ( Y ) [ l o g D y ( y ) ] + E x P d a t a ( X ) [ 1 l o g ( D y ( G ( x ) ) ) ]
In the formula, E * ( ) represents the expectation over the data domain X or Y, and D y ( y ) represents the probability that the data come from the real data. During the training process of the model, the generator G aims to generate data G ( x ) that closely resemble real data y, while the discriminator D y tries to distinguish whether the data comes from real data y or from the generated fake data G ( x ) . Therefore, in the optimization of the model’s loss function, the model learns to minimize the loss function of G and maximize the discriminative distance of D y . The training process of the model G is expressed as follows:
G * = min G max D y L G A N ( D y , G , x , y )
Meanwhile, the loss functions for F and D x can be defined as follows:
L G A N ( D x , F , x , y ) = E x P d a t a ( X ) [ l o g D x ( x ) ] + E y P d a t a ( Y ) [ 1 l o g ( D x ( F ( y ) ) ) ]
Similarly, the training process for F can be derived as follows:
F * = min F max D x L G A N ( D x , F , x , y )
The training process for the two discriminators in CycleGAN can be derived from Equations (2) and (4) as follows:
G * , F * = a r g min G , F max D x , D y L G A N ( G , F , D x , D y )
In addition, CycleGAN introduces cycle-consistency loss, aiming to ensure that the signal remains consistent with itself after passing through both generators. This can be expressed as follows:
F ( G ( x ) ) = F ( f a k e _ y ) = f a k e _ x x
G ( F ( y ) ) = G ( f a k e _ x ) = f a k e _ y y
Therefore, the cycle-consistency function can be expressed as follows:
L c y c ( G , F ) = E x P d a t a ( X ) [ F ( G ( x ) ) x 1 ] + E y P d a t a ( Y ) [ G ( F ( y ) ) y 1 ]
where 1 represents the L 1 norm. Thus, the complete loss function of the CycleGAN network is the sum of the adversarial losses of the two sets of generative networks and the cycle-consistency loss, which can be expressed as follows:
L t o t a l ( D x , D y , G , F ) = L G A N ( D x , F ) + L G A N ( D y , G ) + L c y c ( G , F )

4.2. EME-CycleGAN

Based on the concept of the CycleGAN network, we utilize this network architecture to enhance the electromagnetic (EM) signals leaked from cryptographic integrated circuits. Through adversarial learning between limited real collected signals and simulated signals, we have designed an EM signal enhancement model called EME-CycleGAN. The specific model is illustrated in Figure 3. In the enhancement process, two generator networks are employed: G X : S i m u l a t i o n R e a l , G Y : R e a l S i m u l a t i o n . At the same time, two adversarial discriminators are used to distinguish between real data and generated fake data. D x is responsible for discriminating real signals R r and fake real signals R g r generated from simulated signals. D y is used to distinguish simulated signals S r and fake simulated signals generated from real signals S g r . S g g is the last generated simulated signal in the Simulation–Real–Simulation Path, while R g g is the last generated real signals in the Real–Simulation–Real Path.

5. Data Augmentation Consistency Analysis

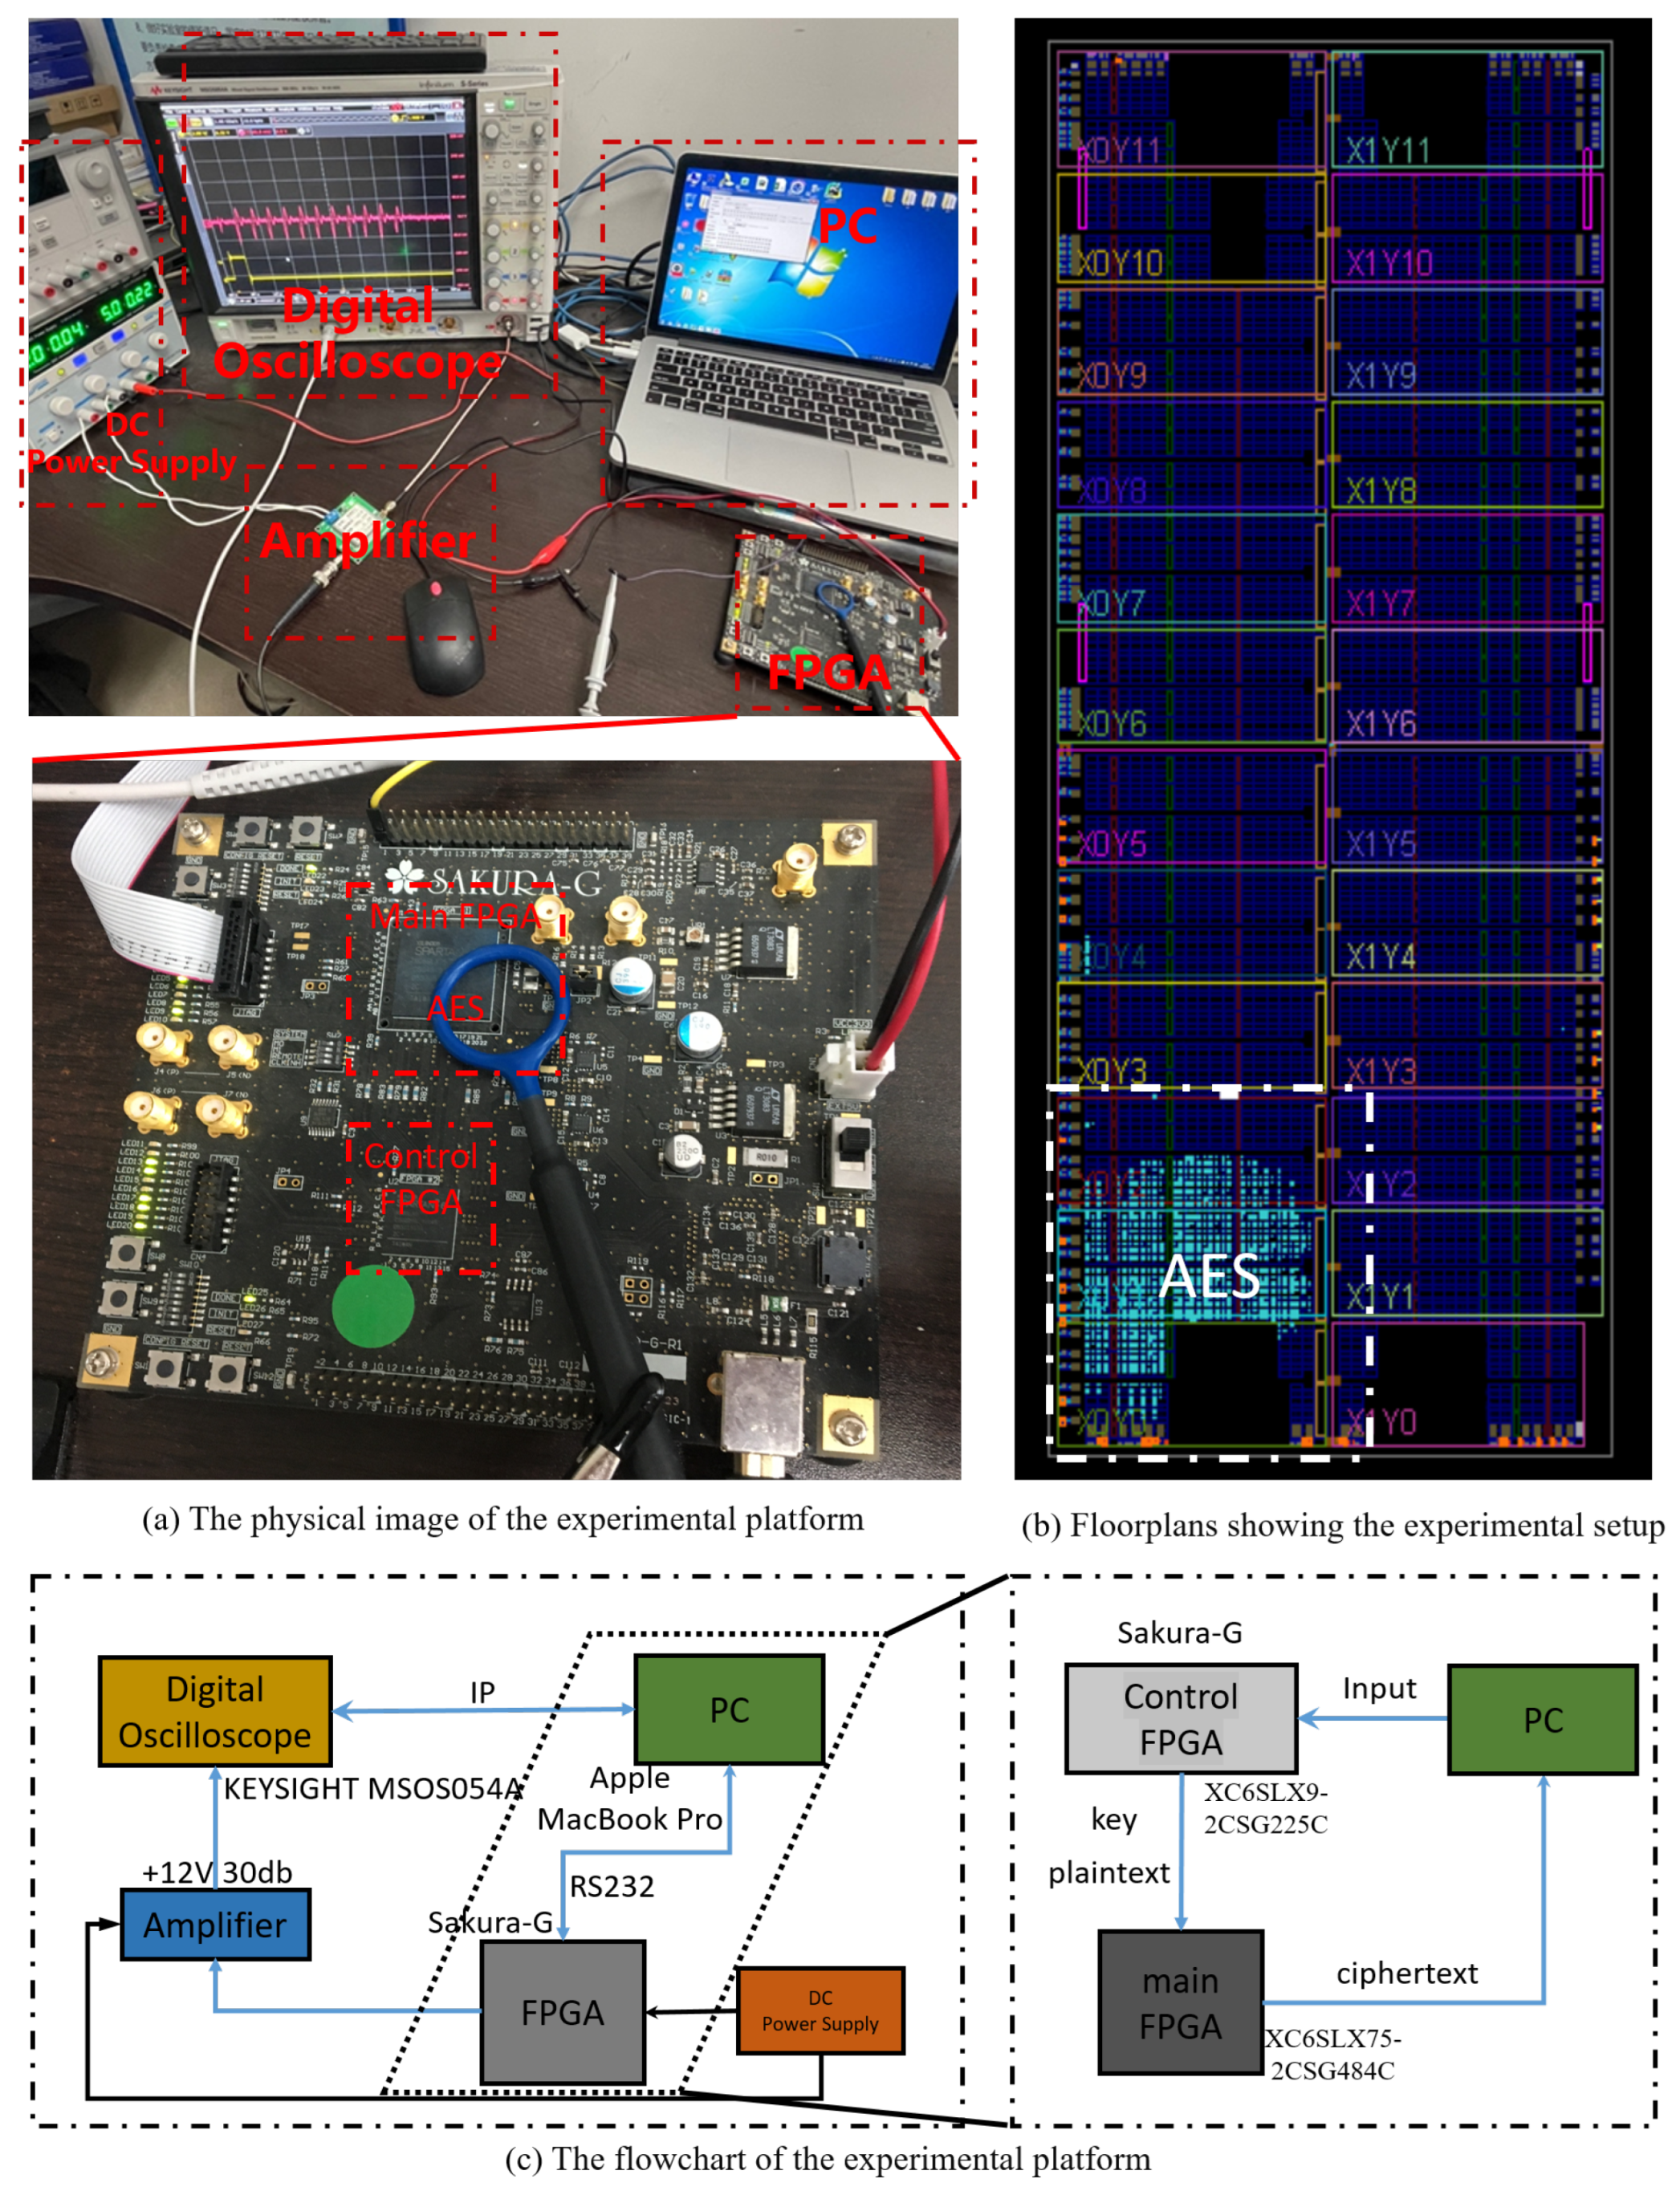
5.1. Real Data Acquisition

We conducted the experiment of acquiring real side-channel information leaked from integrated circuits in a typical indoor office environment. The experiment involved setting up a looped encryption process on an FPGA through a PC and recording each encryption operation of the AES algorithm. Simultaneously, an electromagnetic probe captured the electromagnetic radiation signals generated during the operation of the encryption chip. The electromagnetic signals were amplified and displayed on an oscilloscope before being saved on the PC. During the experiment, a near-field electromagnetic probe was placed above the encryption chip, and its position remained fixed. The specific details of the experimental setup are shown in Figure 4.
  • First, the PC sent the plaintext and key required for the encryption algorithm to the FPGA.
  • Next, the FPGA executed the AES-128 encryption algorithm, while the side-channel detection device collected the side-channel leakage signals from the proximity of the chip.
  • Then, the side-channel detection device transmitted the collected leakage signals to the oscilloscope, which displayed and saved the signals.
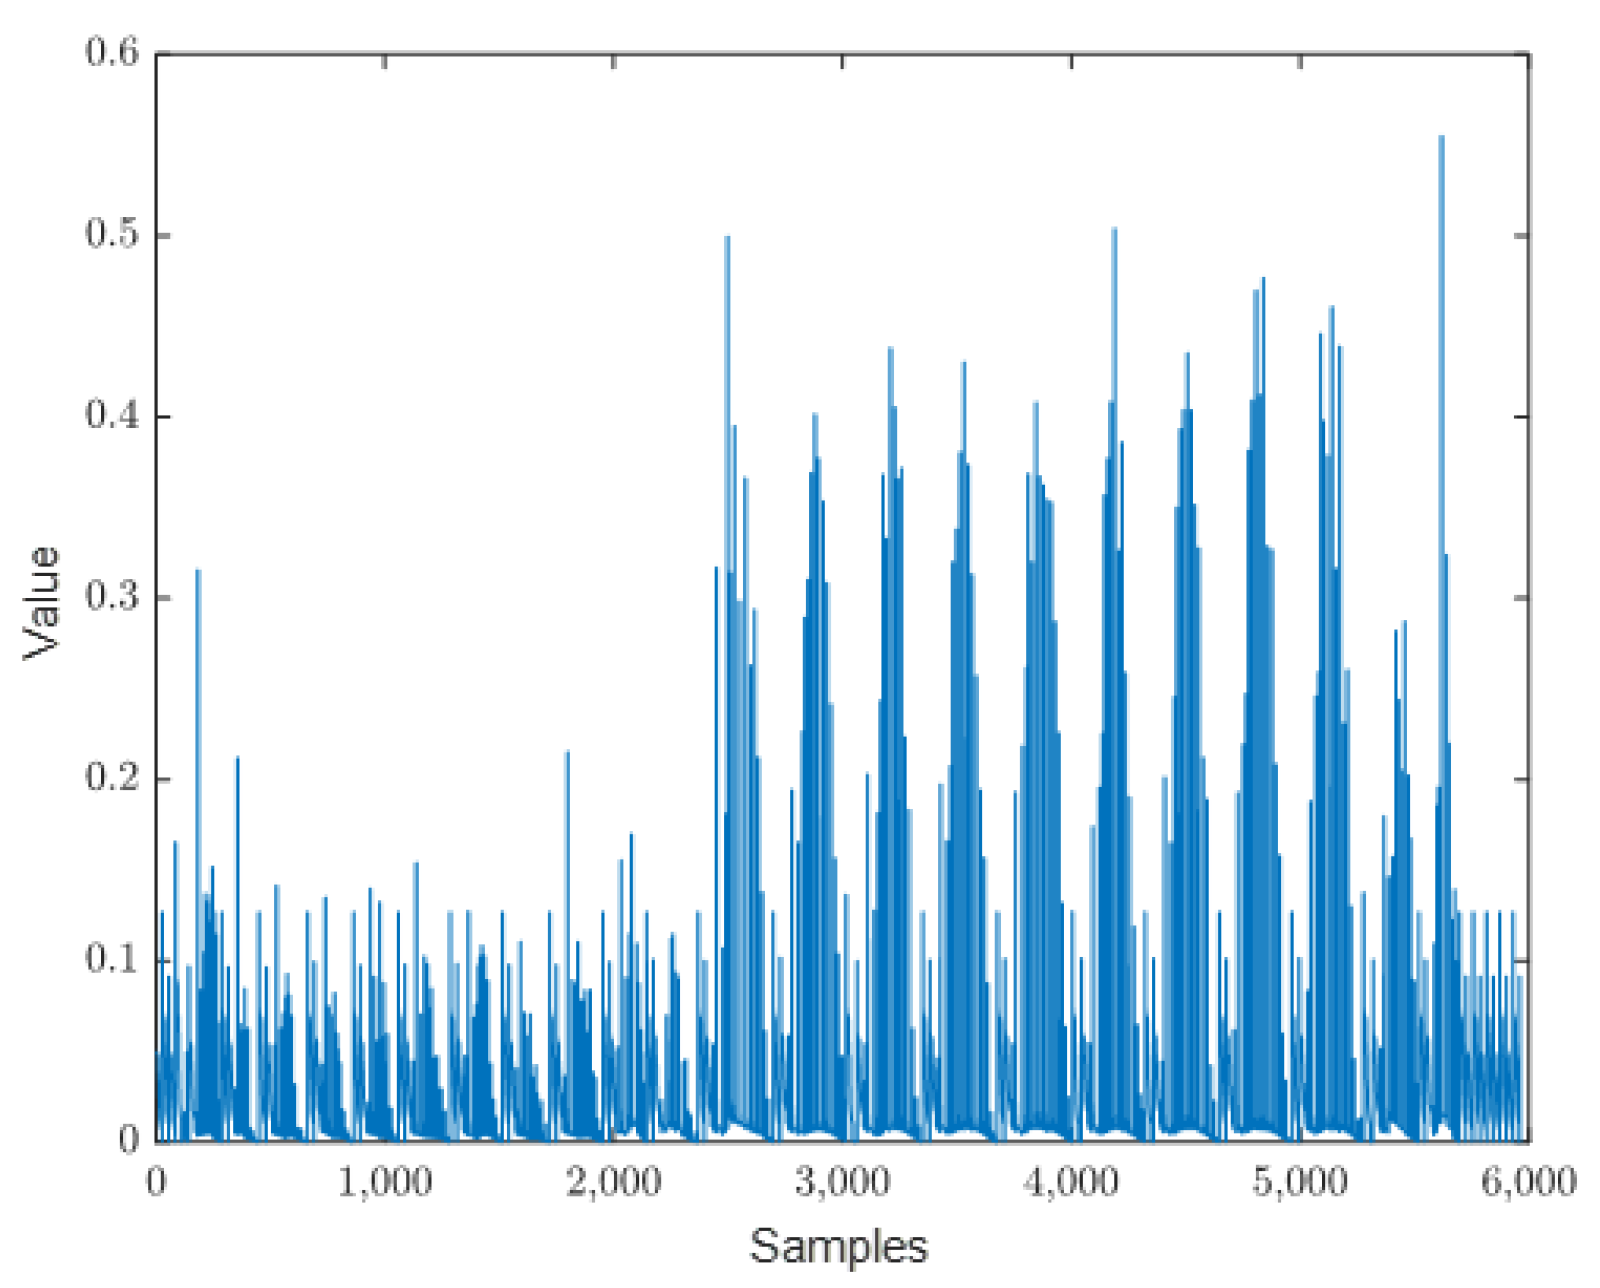
  • Finally, the oscilloscope sent the signals back to the PC, and the PC once again sent the plaintext and key to the FPGA, repeating the process to collect a large amount of required side-channel leakage information. The resulting raw electromagnetic leakage waveform of the complete AES encryption process is shown in Figure 5.

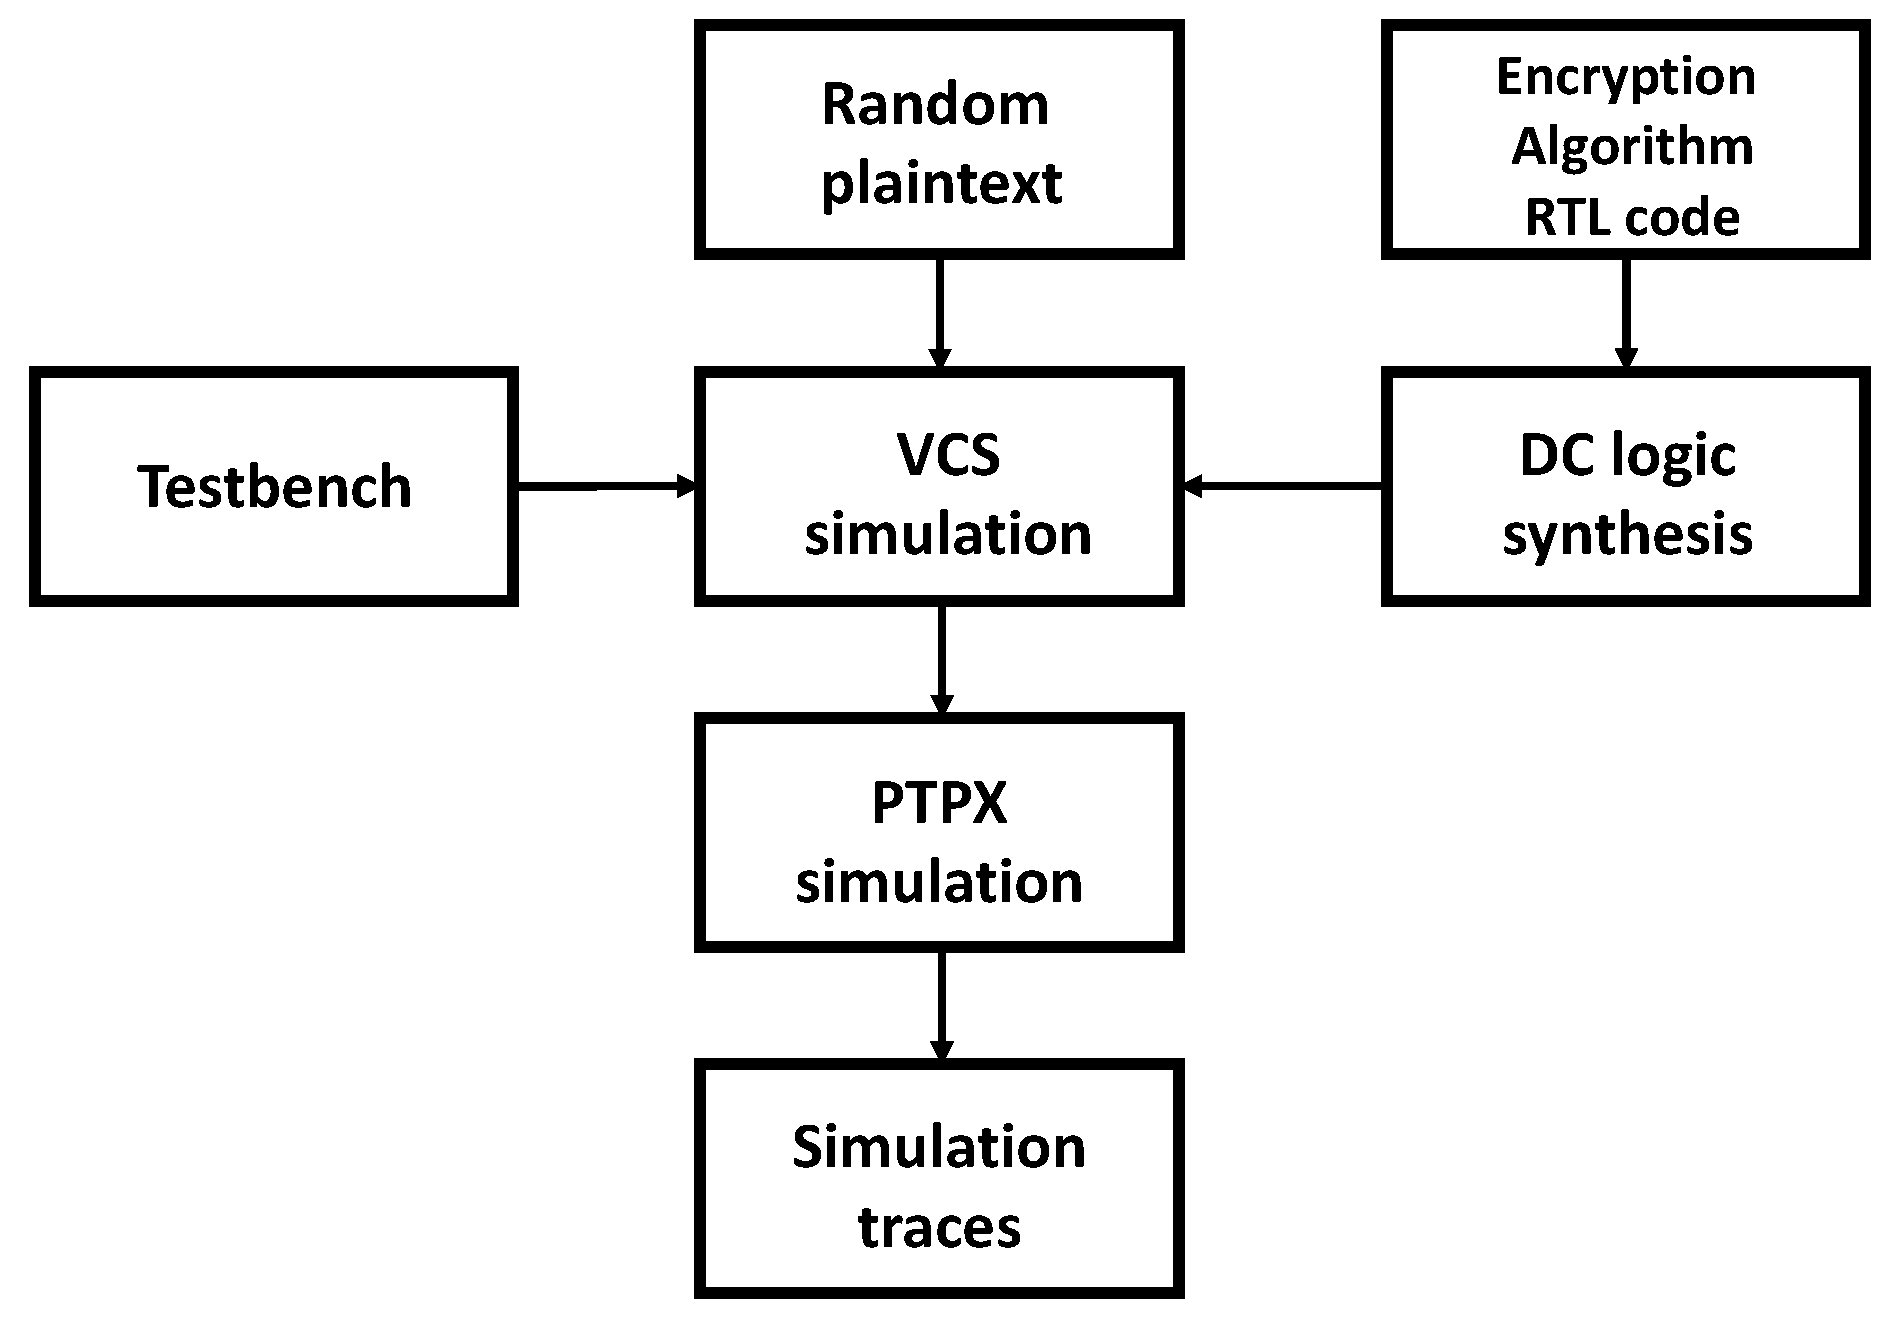
5.2. Simulation Data Acquisition

For data simulation, we utilized the Synopsys Version L-2016.03-SP1 suite of software tools in CentOS 6, including Design Compiler Version (DC), Verilog Compiled Simulator (VCS), and Prime Time PX (PTPX), as the experimental platform [29]. Among these tools, DC is a logic synthesis software that converts the circuit described in Verilog HDL into a gate-level netlist using technology library files. VCS is a functional verification software that allows the addition of test programs to verify the correctness of the design module’s functionality either in Verilog HDL or gate-level netlist. Prime Time is a static timing analysis software, and PTPX is an additional tool used for the static or dynamic power analysis of integrated circuit design modules. The entire simulation flow is illustrated in Figure 6.
  • First, we set the desired random plaintext for the encryption algorithm and ran the DC software, which read the Synopsys technology library files and RTL code of the encryption algorithm. The software performed logic synthesis to generate the gate-level netlist file;
  • Next, using the VCS tool, we read the gate-level netlist file, Verilog technology library files, and functional test files. After simulation, the tool generated a value change dump (VCD) file;
  • Then, the PTPX read the VCD file, technology library files, and gate-level netlist file to perform power calculations. The tool outputted a power accumulation file;
  • Finally, using MATLAB Version 2020 software, we read the power accumulation file and parsed it into the desired simulation waveform data. The resulting power leakage waveform of the complete AES encryption process, obtained through the above steps, is shown in Figure 7.

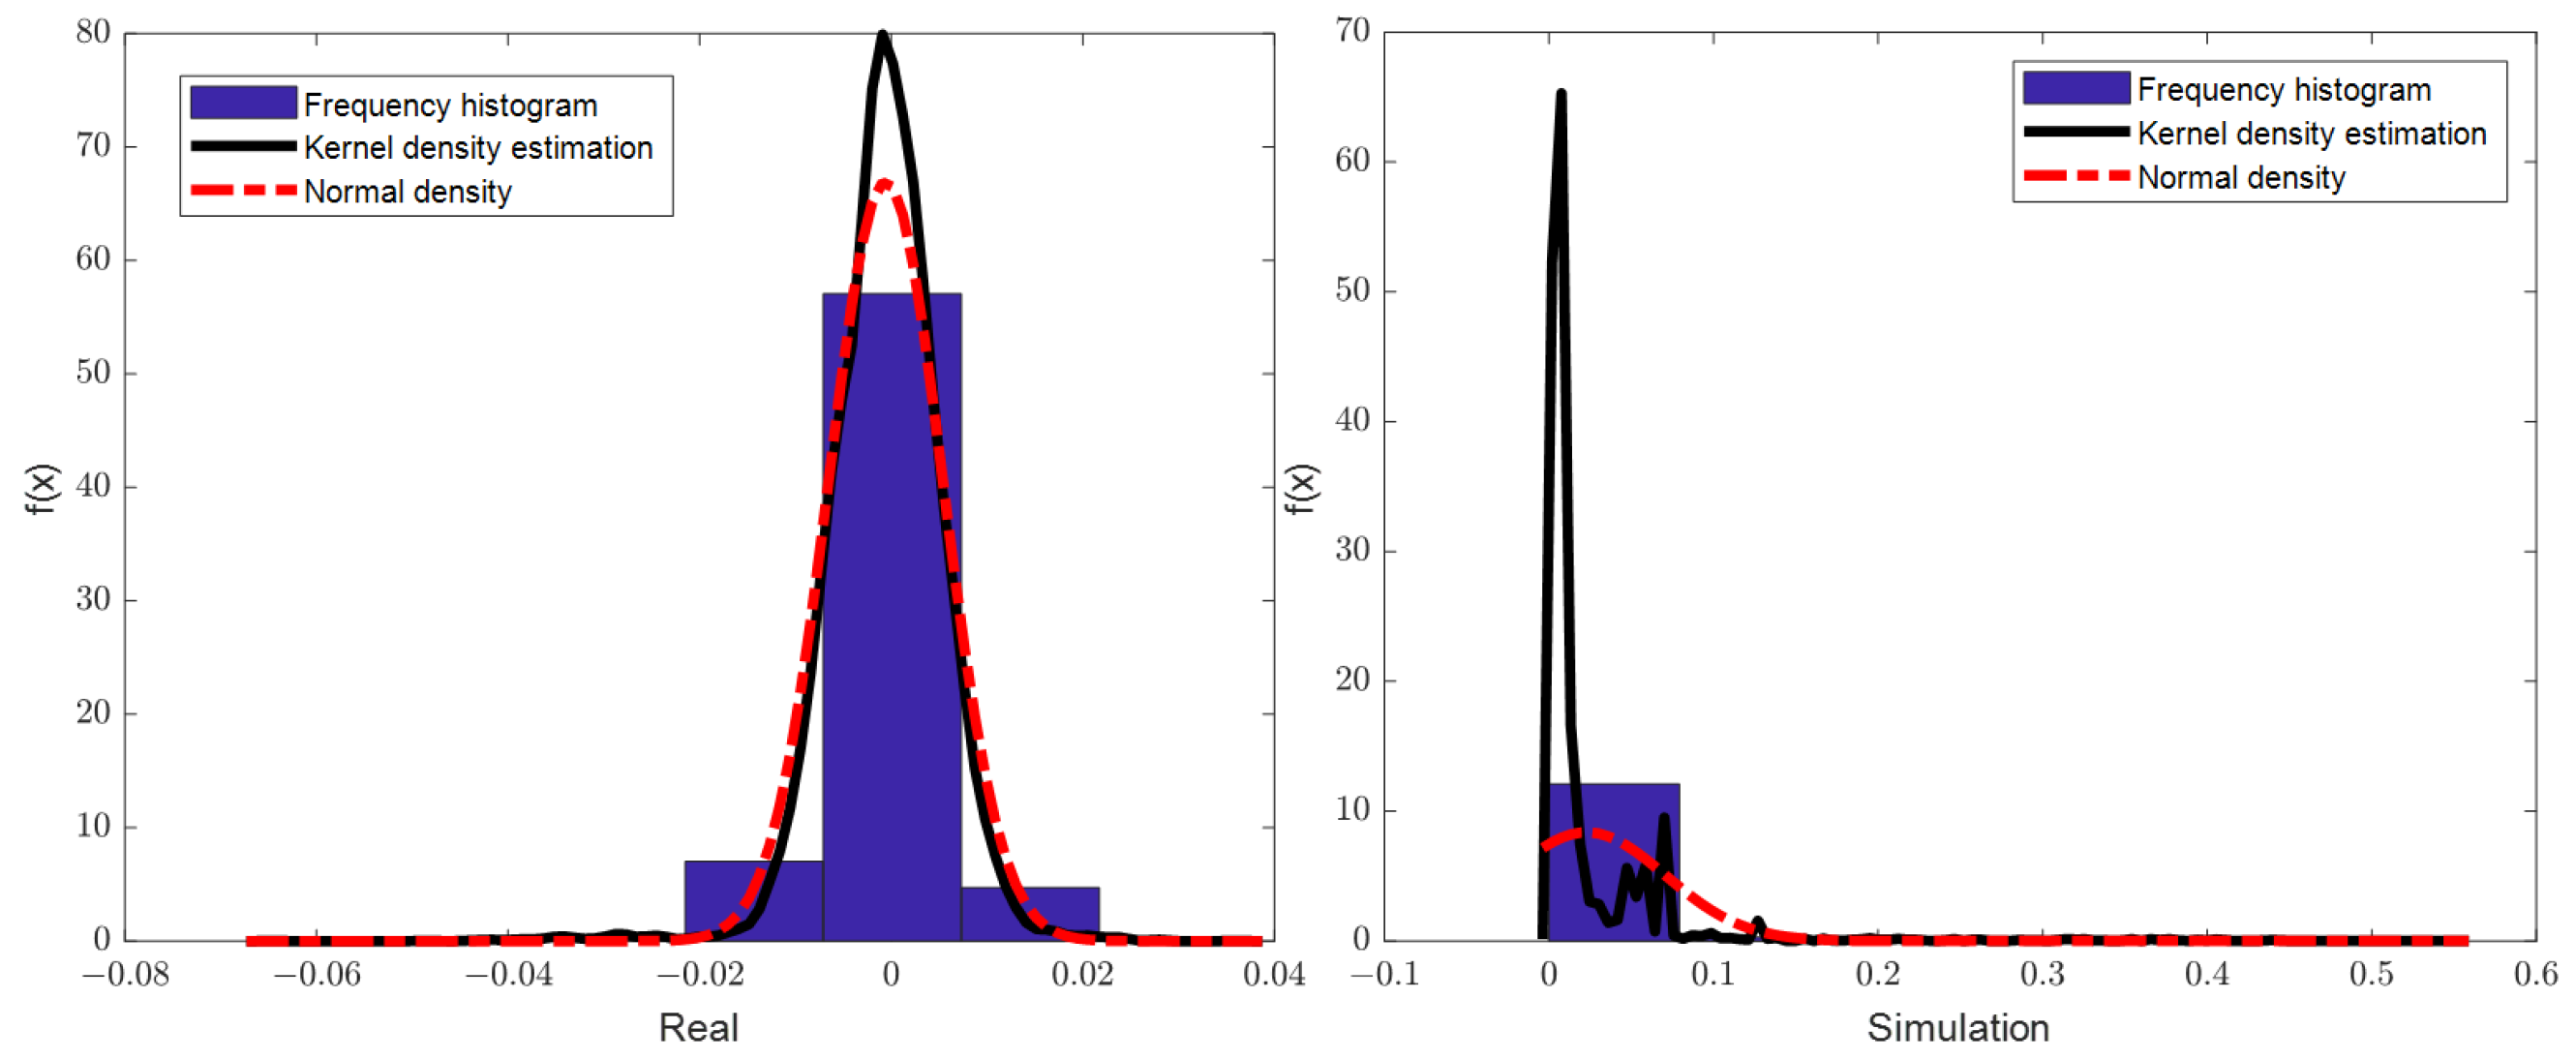
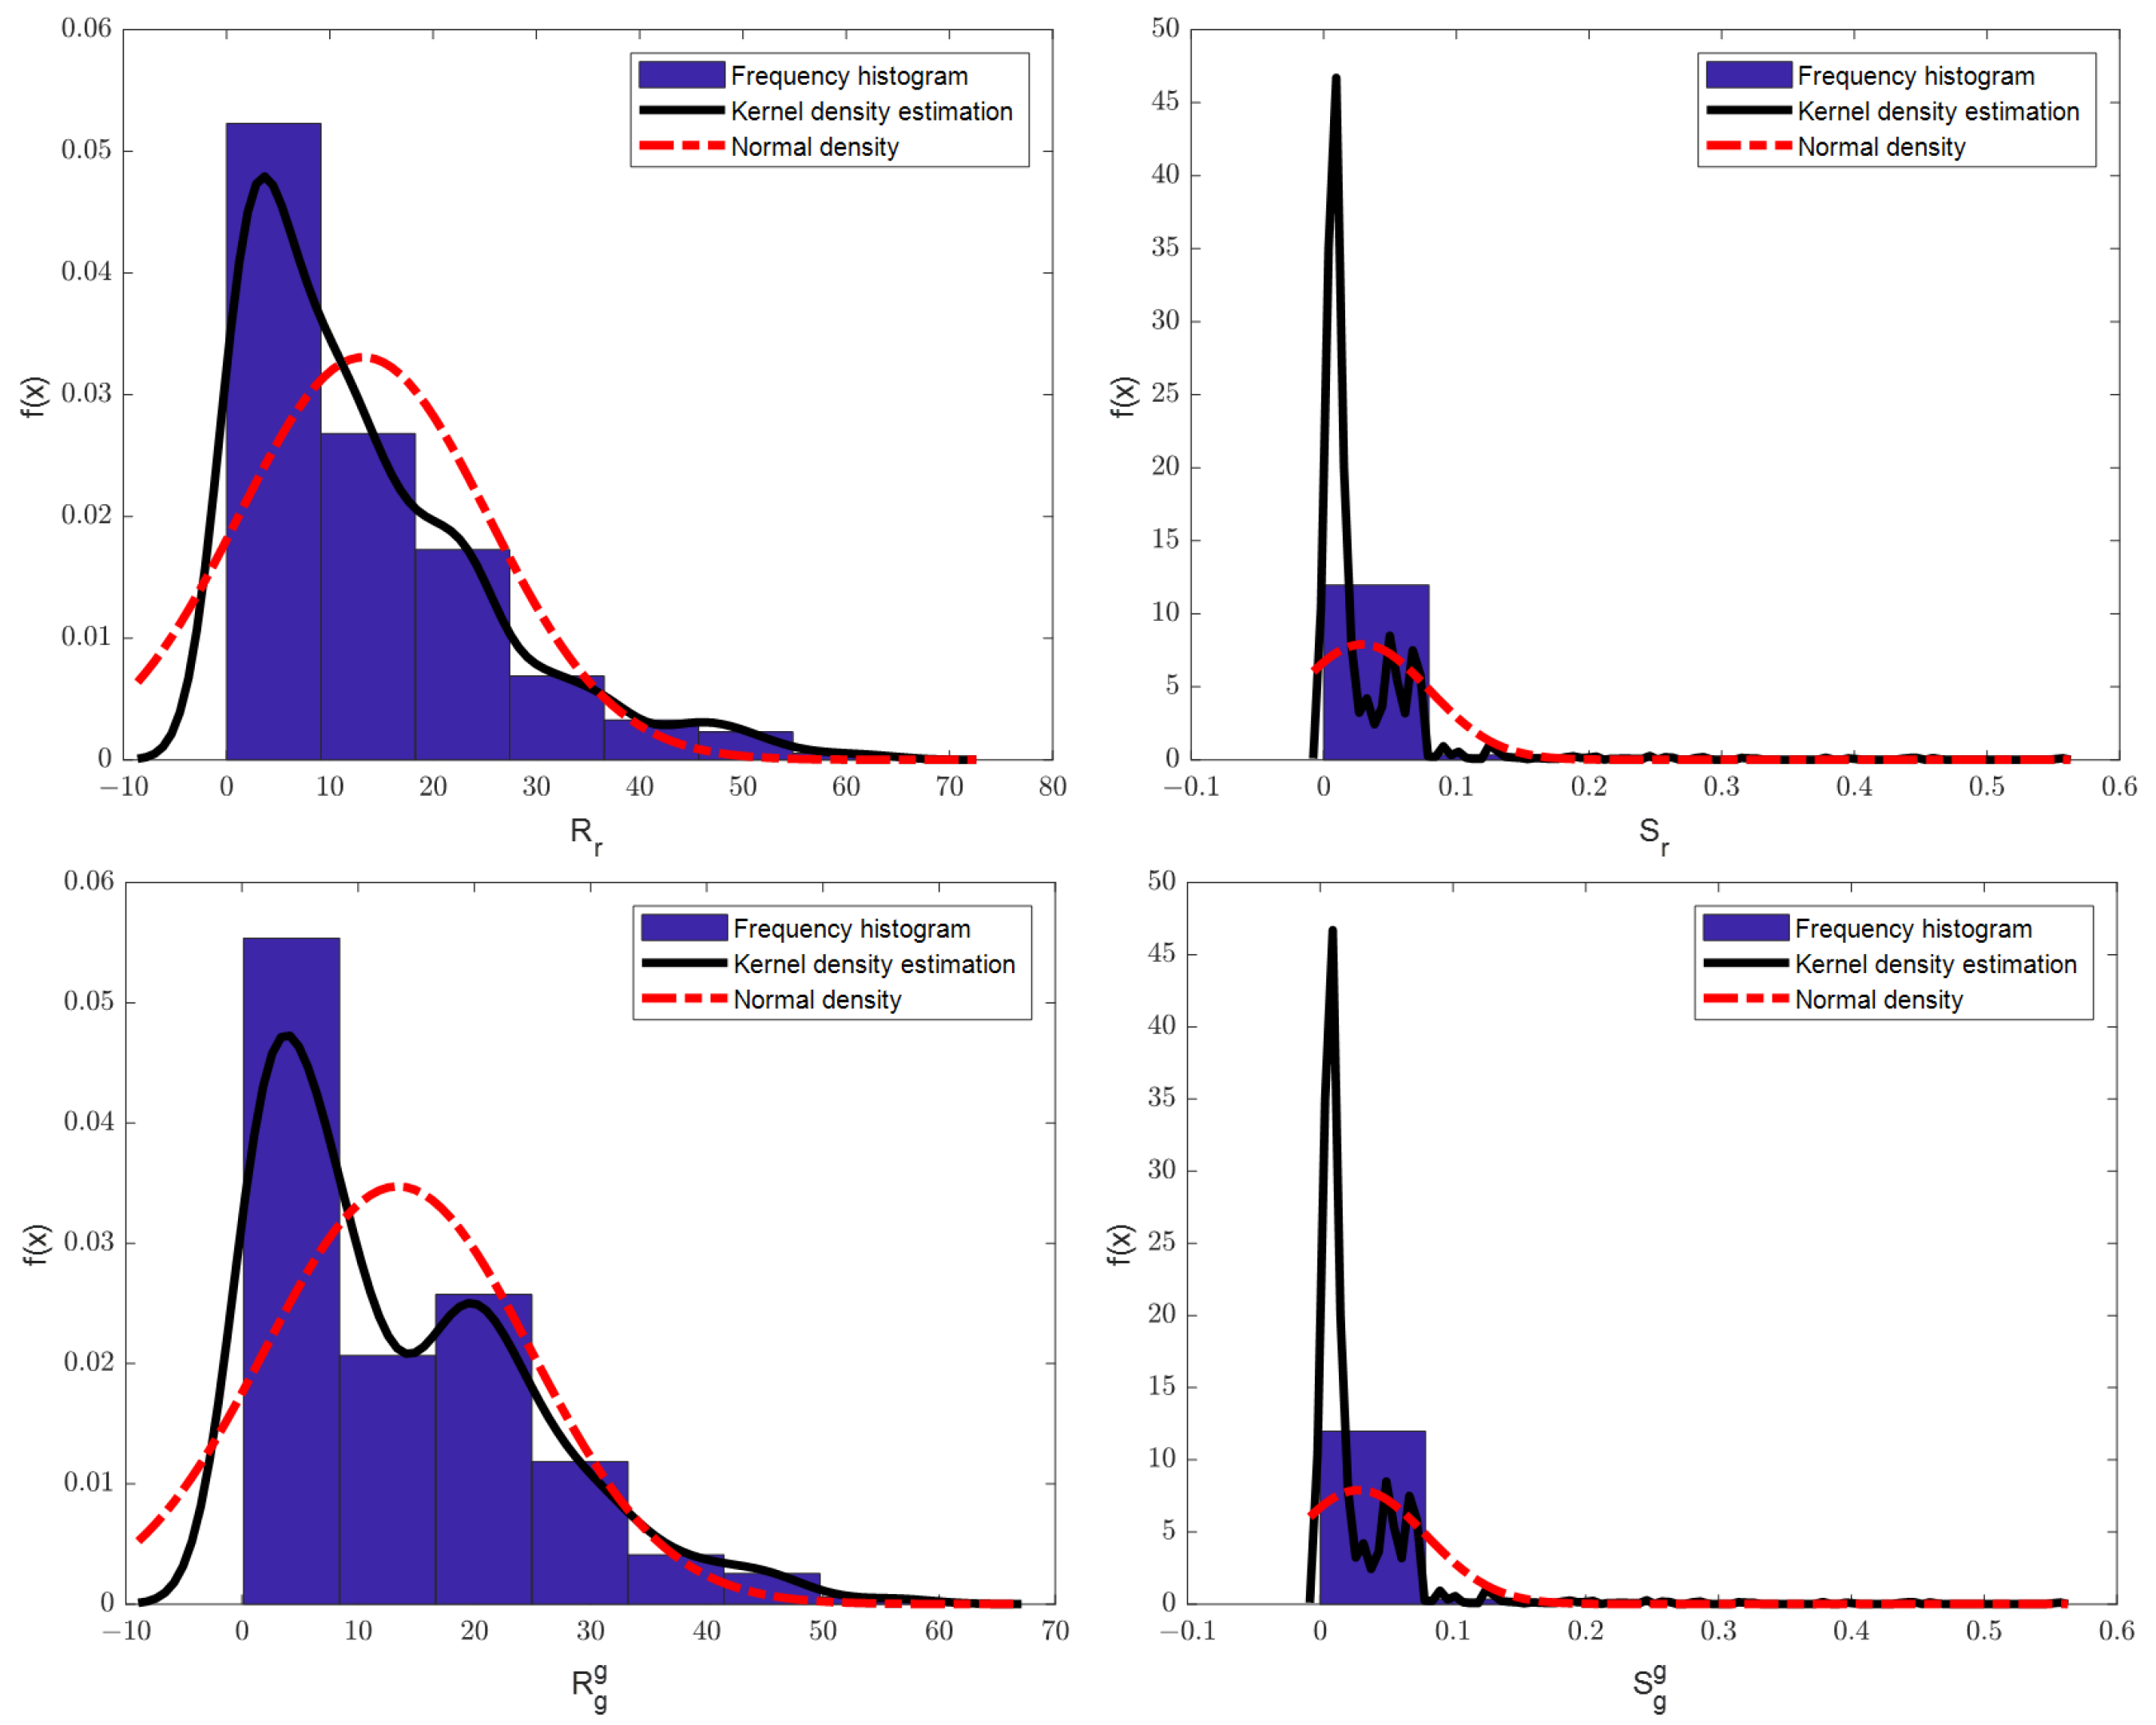
5.3. Kolmogorov–Smirnov Test Method

In the application of dataset selection, we incorporated a prior method based on the Kolmogorov–Smirnov test for selection. The Kolmogorov–Smirnov test (KS test) is a non-parametric statistical test used to determine whether two samples come from the same distribution or whether a sample comes from a specific distribution [30].
The principle of the KS test is to compare the differences between two cumulative distribution functions (CDFs). Suppose we have two samples, X and Y, and we want to determine if these two samples come from the same distribution. Let
X 1 , , X m i i d F ( x ) , Y 1 , , Y n i i d G ( y )
where the entire sample is independent, and F ( x ) and G ( y ) are continuous distribution functions. The test question of interest is
H 0 : F ( x ) G ( y ) H 1 : F ( x ) G ( y )
For dataset X, the calculation formula for the empirical distribution function (EDF) is as follows:
F m ( x ) = 1 m i = 1 m I ( x i x )
here, m represents the sample size, x i denotes the i-th observed value, and I represents the indicator function; it is equal to 1 if the condition x i x is true and it is equal to 0 otherwise.
So, the EDF of dataset Y can be written as
G n ( y ) = 1 n j = 1 n I ( y j y )
where n represents the sample size, y j denotes the j-th observed value, and I represents the indicator function as the same. The Glivenko theorem asserts the following:
sup x R F m ( x ) F ( x ) 0 , m
sup y R G n ( y ) G ( y ) 0 , n
This statement means that it is feasible to approximate the theoretical distribution function using the empirical distribution function. Therefore, Smirnov used the statistical test statistic D to test the aforementioned problem.
D = m a x i , j { F m ( X ( i ) ) G n ( Y ( j ) ) }
where F ( x ) and G ( y ) represent the empirical distribution functions of the X sample and Y sample, respectively. X ( i ) and Y ( j ) denote the order statistics of the X sample and Y sample, and m and n represent the sample sizes. The rejection region for H 0 is defined as its maximum value.
In the KS test, we also need to determine a significance level (p-value), which is typically set at 0.05. Then, based on the sample size and significance level, we consult tables or use computer software to obtain the critical value. If the KS statistic is bigger than the critical value, we reject the null hypothesis, indicating that the two samples do not come from the same distribution or that a sample does not come from a specific distribution. If the KS statistic is less than or equal to the critical value, we accept the null hypothesis, indicating that the two samples come from the same distribution or that a sample comes from a specific distribution.
The advantages of the KS test are that it does not require any assumptions about the data and is applicable to samples from any distribution. In summary, the KS test is a commonly used non-parametric statistical method for comparing whether two samples come from the same distribution or whether a sample comes from a specific distribution. It assesses the differences between the empirical distribution functions of the two samples and makes decisions based on the significance level.
In the data analysis of this paper’s experiments, we conducted data consistency analysis between the real data collected from the experimental platform and the simulated data obtained through computer software calculations. In the single-sample testing of the data, we analyzed the distribution characteristics of the data samples based on normal distribution, uniform distribution, Poisson distribution, and exponential distribution, respectively. The experimental results all supported the alternative hypothesis ( H 1 ) . From this, we can understand that it is challenging to analyze and verify the signal leakage of integrated circuit devices using conventional statistical distribution models. Therefore, we employed a two-sample testing method to compare the distribution of the simulated data signals with that of the analog data signals as an evaluation criterion for the data augmentation process. This further validated the consistency of the data samples and provided higher reliability for the final key attack part.
Using the Visdom visualization tool, we obtained the visual output of the EME-CycleGAN training process as shown in Figure 8. From left to right in the first row are S r , S g , r e c _ S and i d t _ S , and in the second row from left to right are R r , R g , r e c _ R and i d t _ R . Here, the rec and idt are defined as CycleGAN in [27]. In Figure 9, the first row shows the signal statistics of the original true signal and the original simulated signal. The second and third rows show the statistical results of the corresponding dataset in the EME-CycleGAN network, respectively.

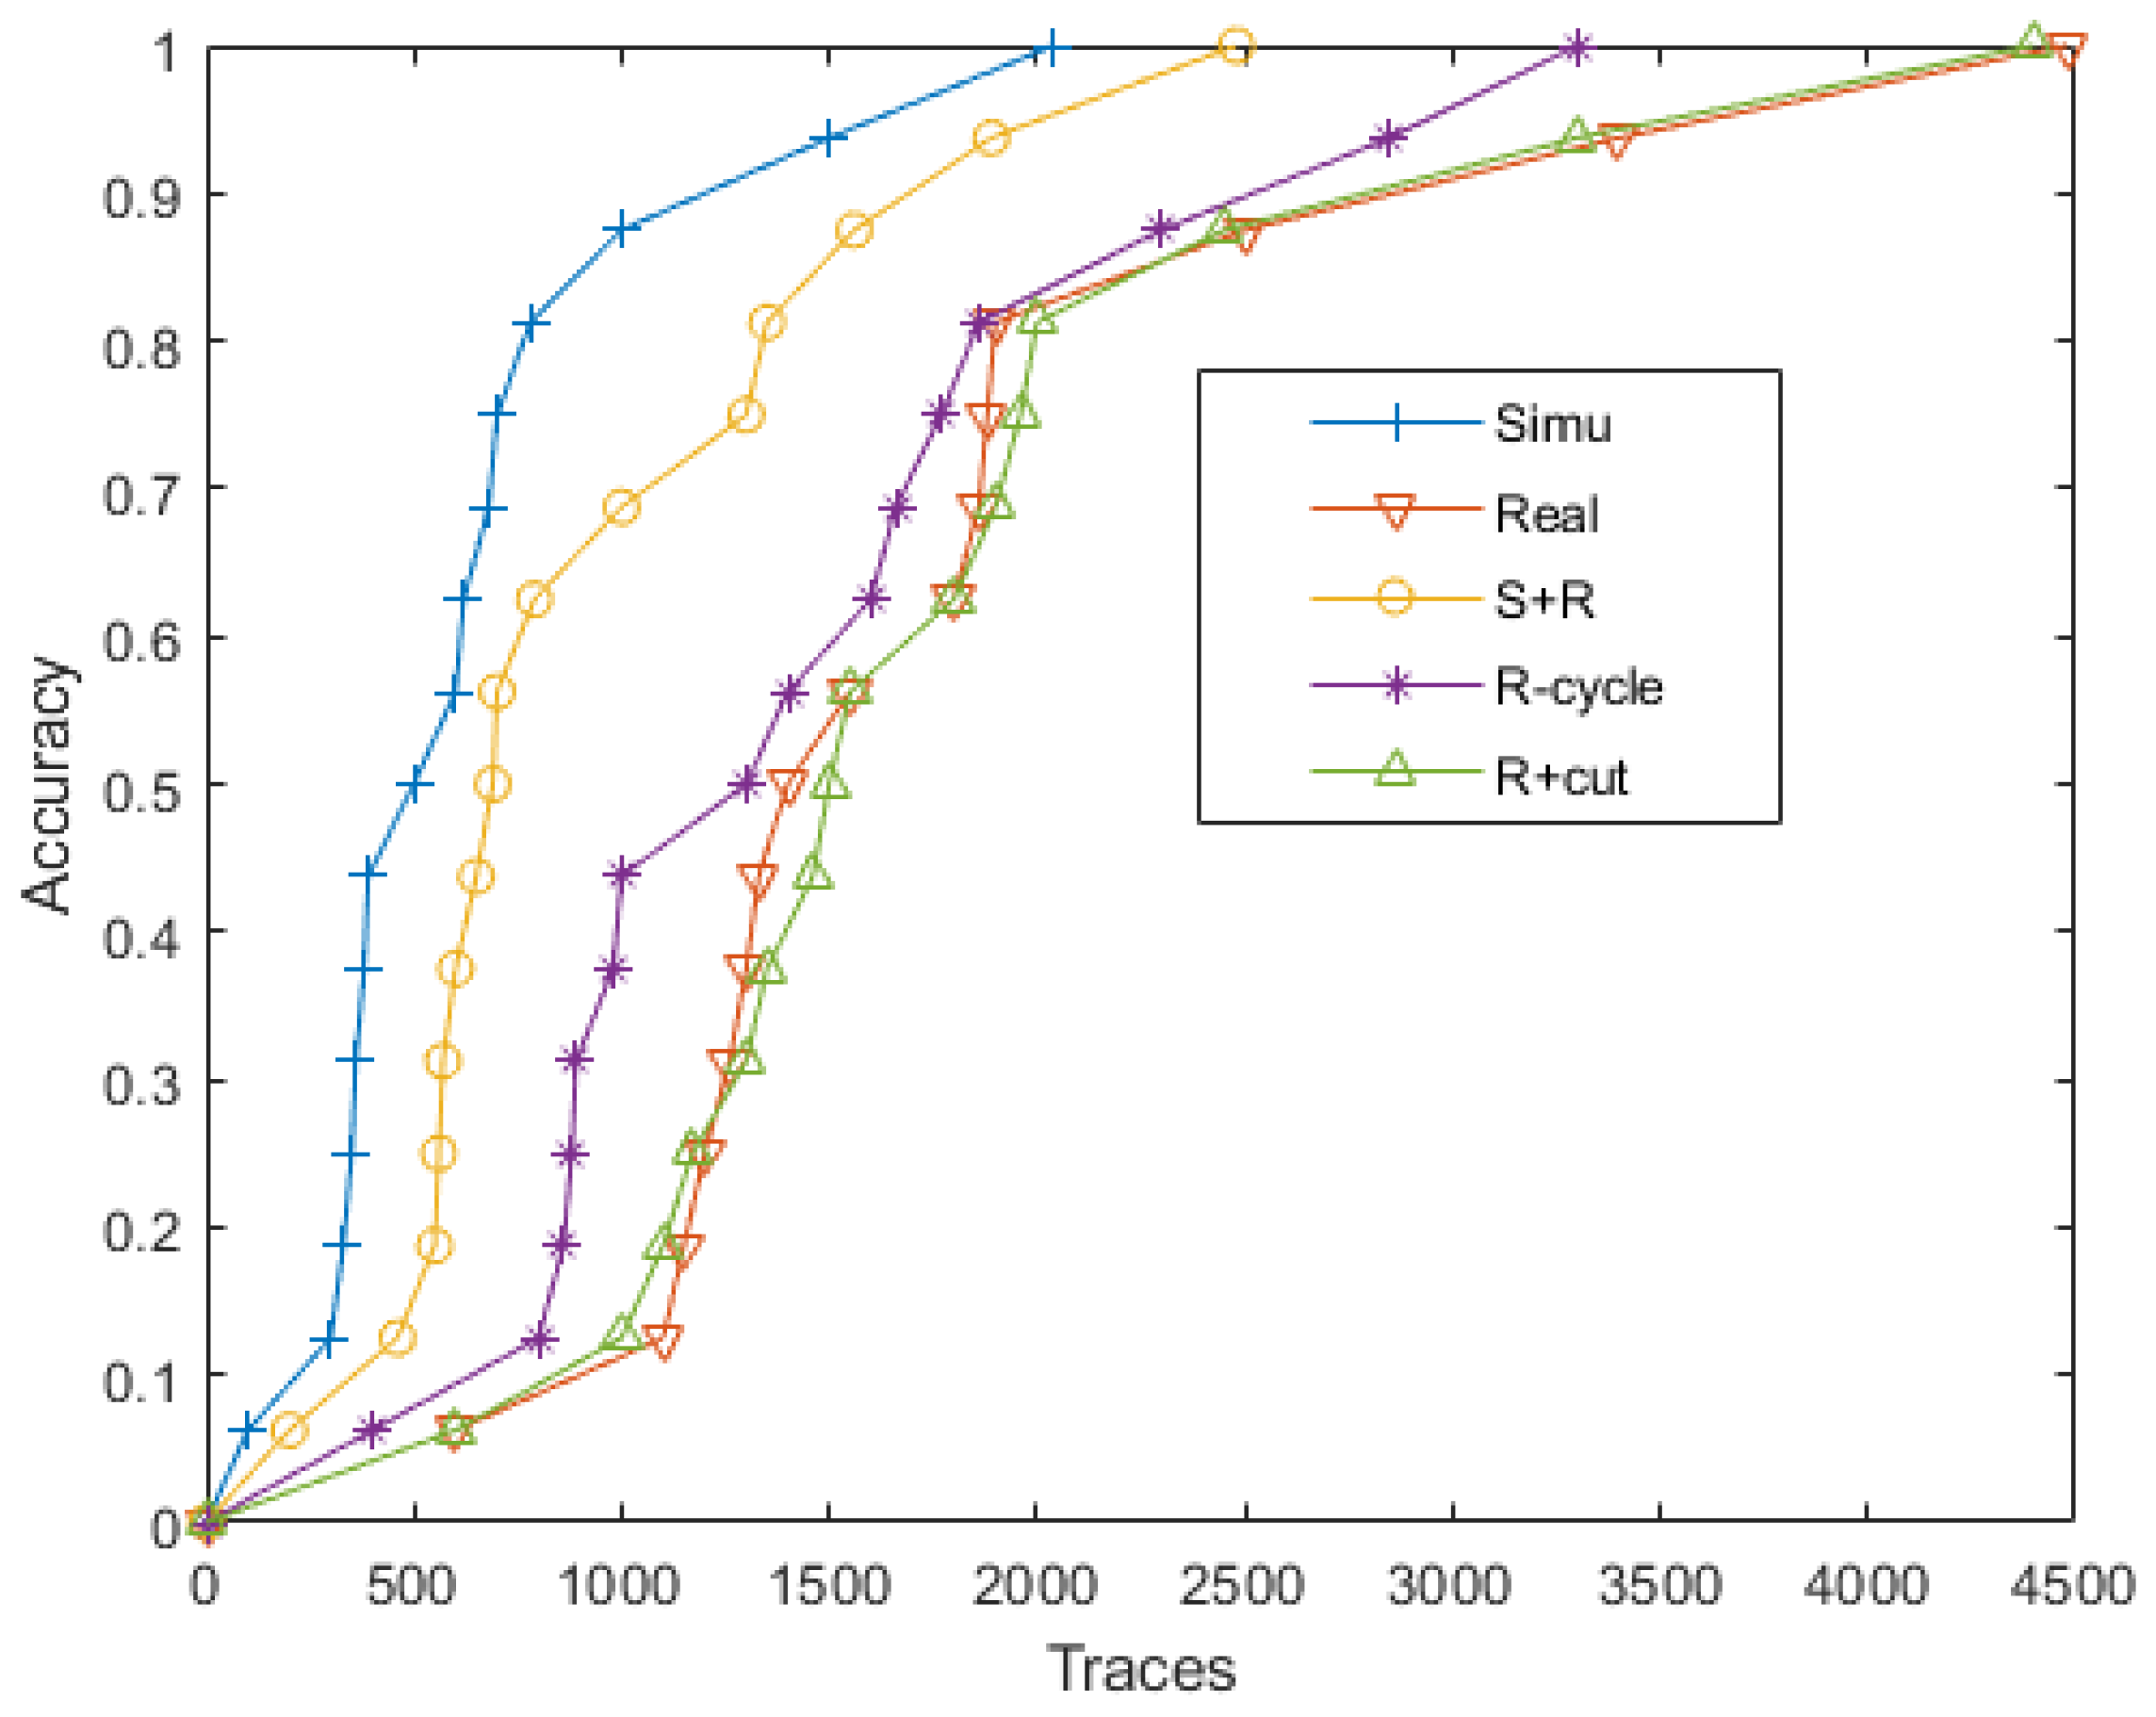
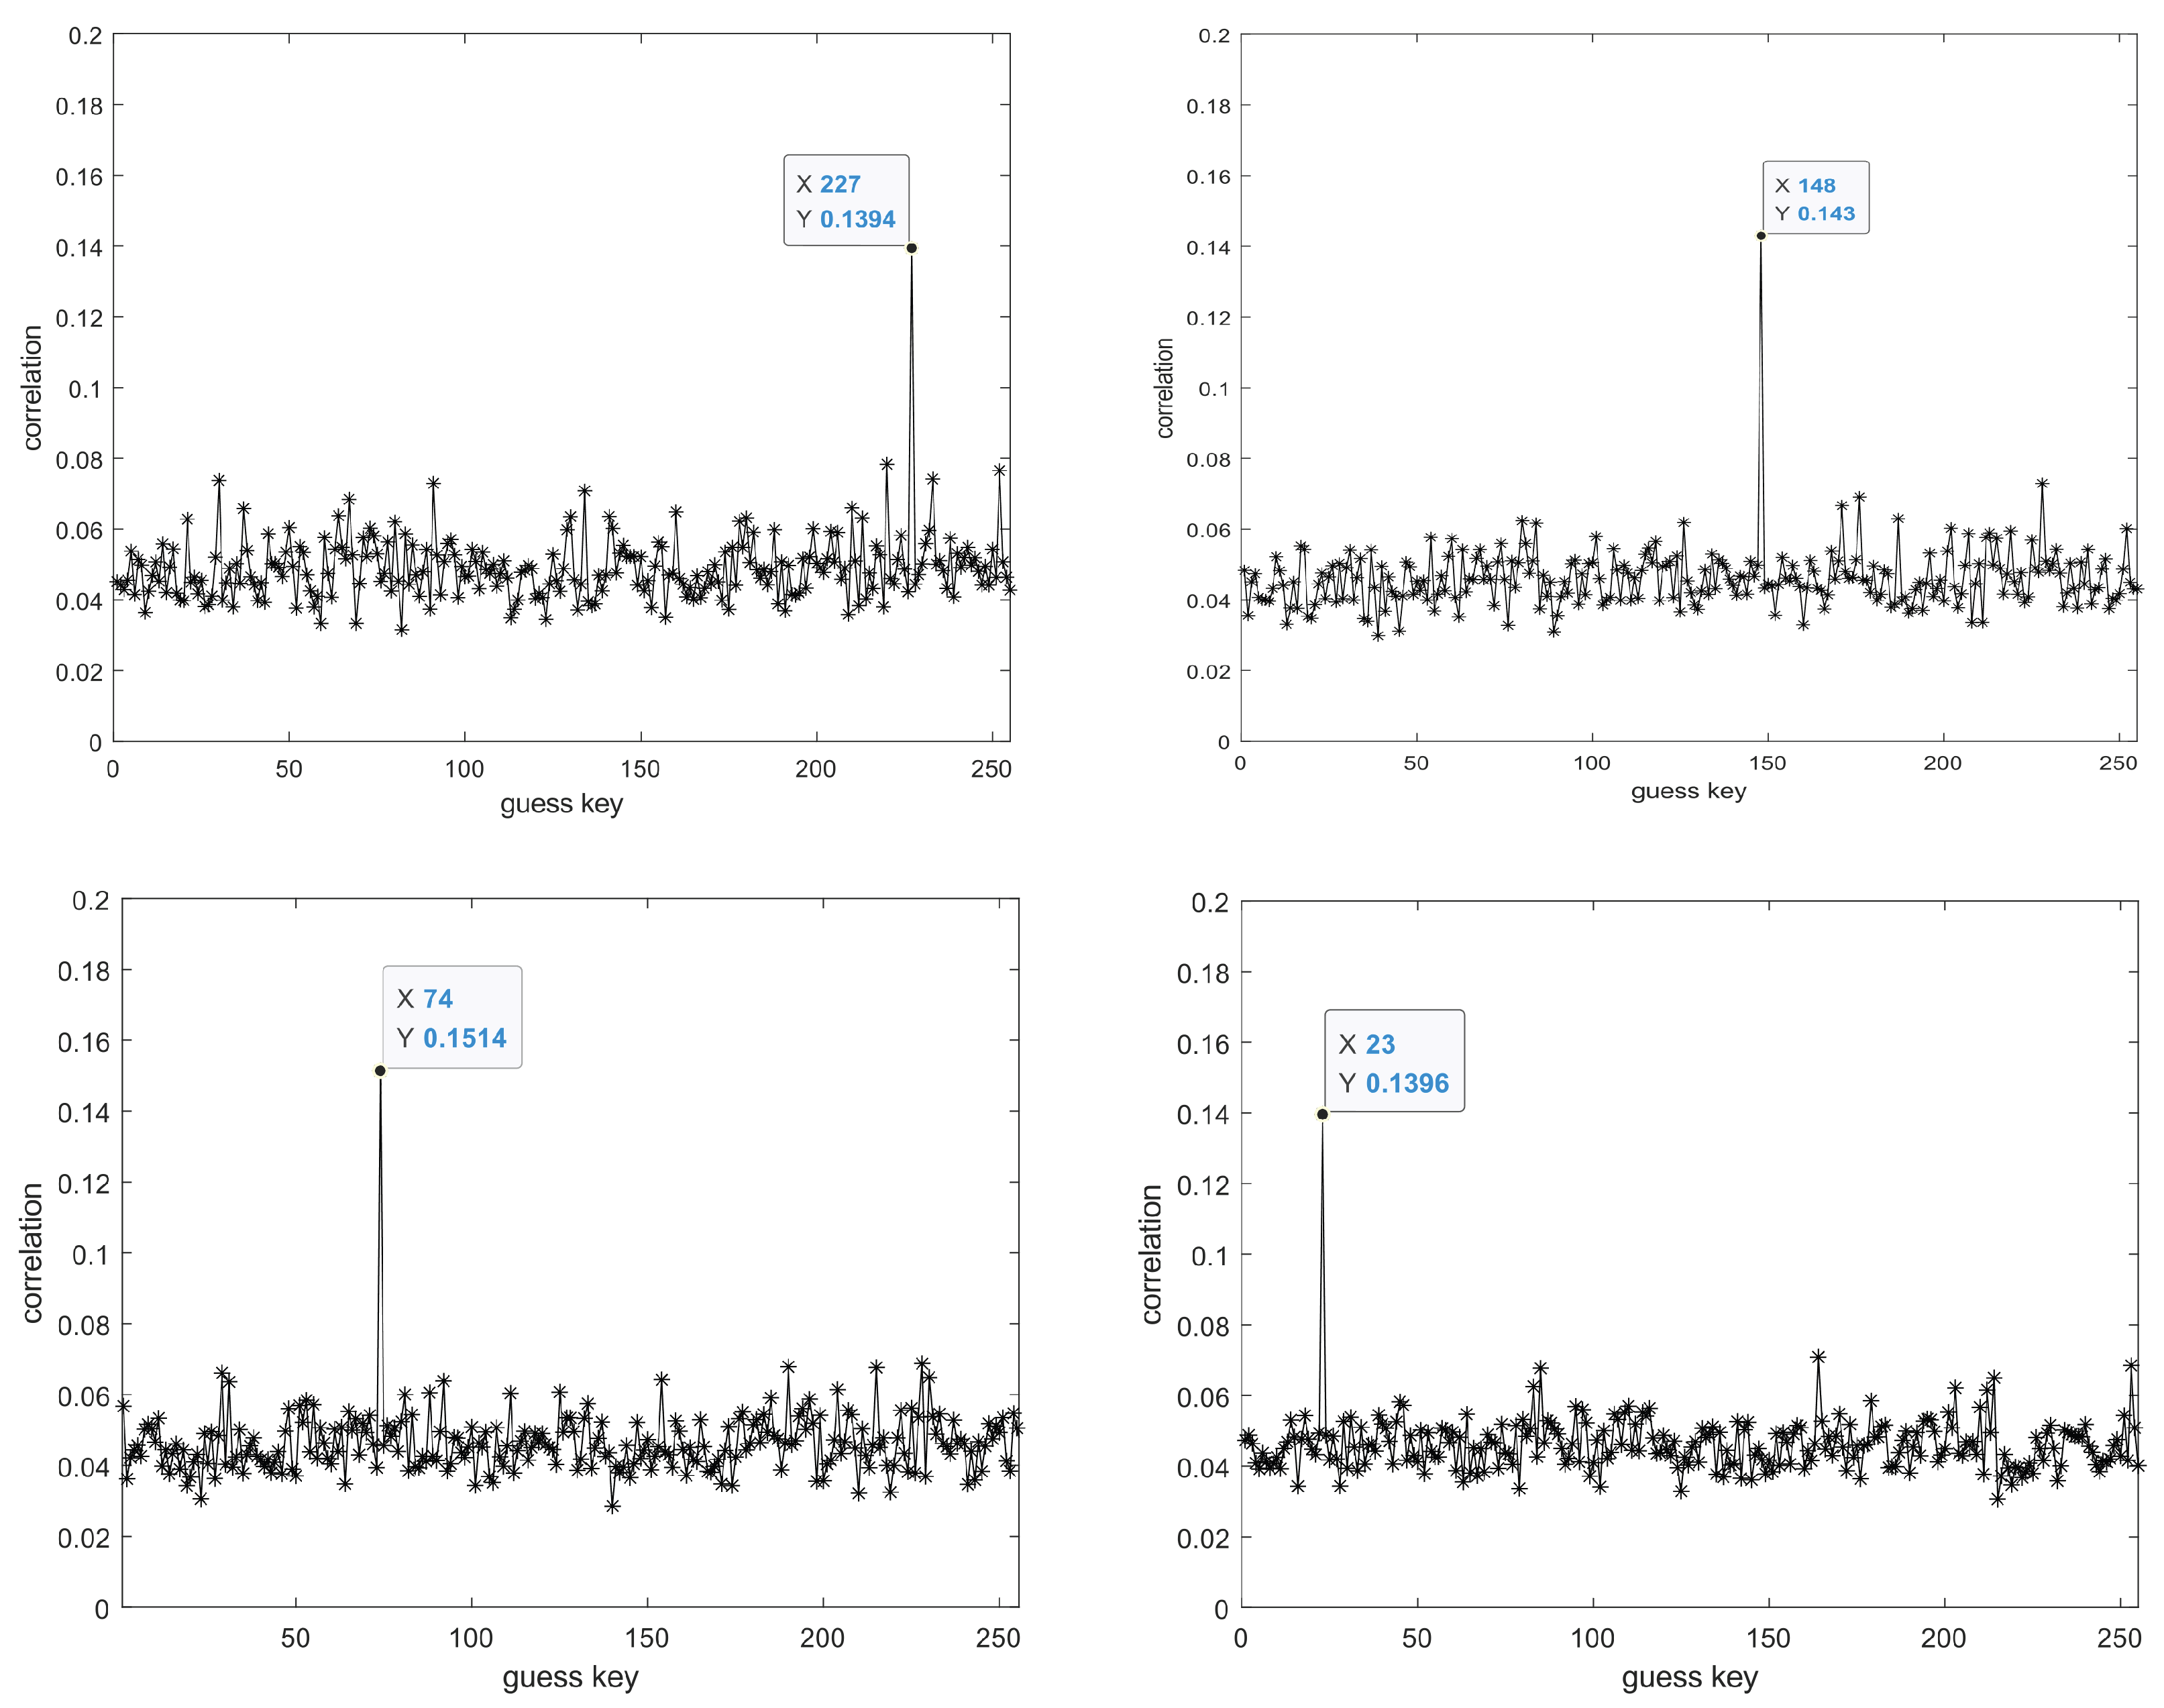
6. Correlation Power Analysis

After obtaining the effective dataset, we utilize the theoretical feasibility of the Hamming distance correlation model and take advantage of the reversibility property of each stage in AES to reduce the search space for key enumeration. We make guesses for the round key of the 10 t h round. The specific steps are as follows:
  • Select an appropriate intermediate value that satisfies the function f ( d , k t ) for the encryption algorithm of the target device, where d is the non-constant data known to the attacker, and k t is the target key that the attacker intends to attack, which is usually a small part of the cryptographic algorithm’s key. In this paper, the attack point is located at the last round of the encryption algorithm, hence the choice of d as the ciphertext.
  • On the side-channel information collection platform, perform M times encryption operations on the encryption chip using random plaintext and a fixed key. Each data of encryption operation d is denoted as d = ( d 1 , d 2 , , d M ) , where d i represents the i t h encryption and the corresponding electromagnetic leakage signal t is denoted as t = ( t 1 , t 2 , , t N ) with each leakage signal interest point being N. Therefore, the electromagnetic leakage signal matrix T generated by encryption is obtained, where
    T M × N = t 11 t 12 t 1 N t 21 t 22 t 2 N t M 1 t M 2 t M N
  • Calculate the hypothetical intermediate values Z of the encryption algorithm. Based on the target key k t of the attack in the encryption algorithm, set k = ( k 1 , k 2 , , k K ) , where K represents the number of values after enumerating k t . According to the recorded d = ( d 1 , d 2 , , d M ) in the encryption operation and the hypothetical key vector k = ( k 1 , k 2 , , k K ) , we obtain the intermediate value matrix Z:
    Z M × K = z 11 z 12 z 1 K z 21 z 22 z 2 K z M 1 z M 2 z M K
    where z i , j = f ( d i , k j ) i = 1 , 2 , , M ; j = 1 , 2 , , K .
  • Map the intermediate values Z to the hypothetical electromagnetic leakage matrix H according to the side-channel leakage model. In this paper, we chose the Hamming distance model; therefore,
    h i , j = a H W ( z i , j z i , j ) + b
    H N × K = z 11 z 12 z 1 K z 21 z 22 z 2 K z N 1 z N 2 z N K
    represents the Hamming distance of the two transition results, z i , j is the value before calculating the intermediate value, ⊕ represents the XOR operation, a is the proportionality coefficient of the side-channel signal, and b represents other side-channel leakages and noise unrelated to the cryptographic algorithm.
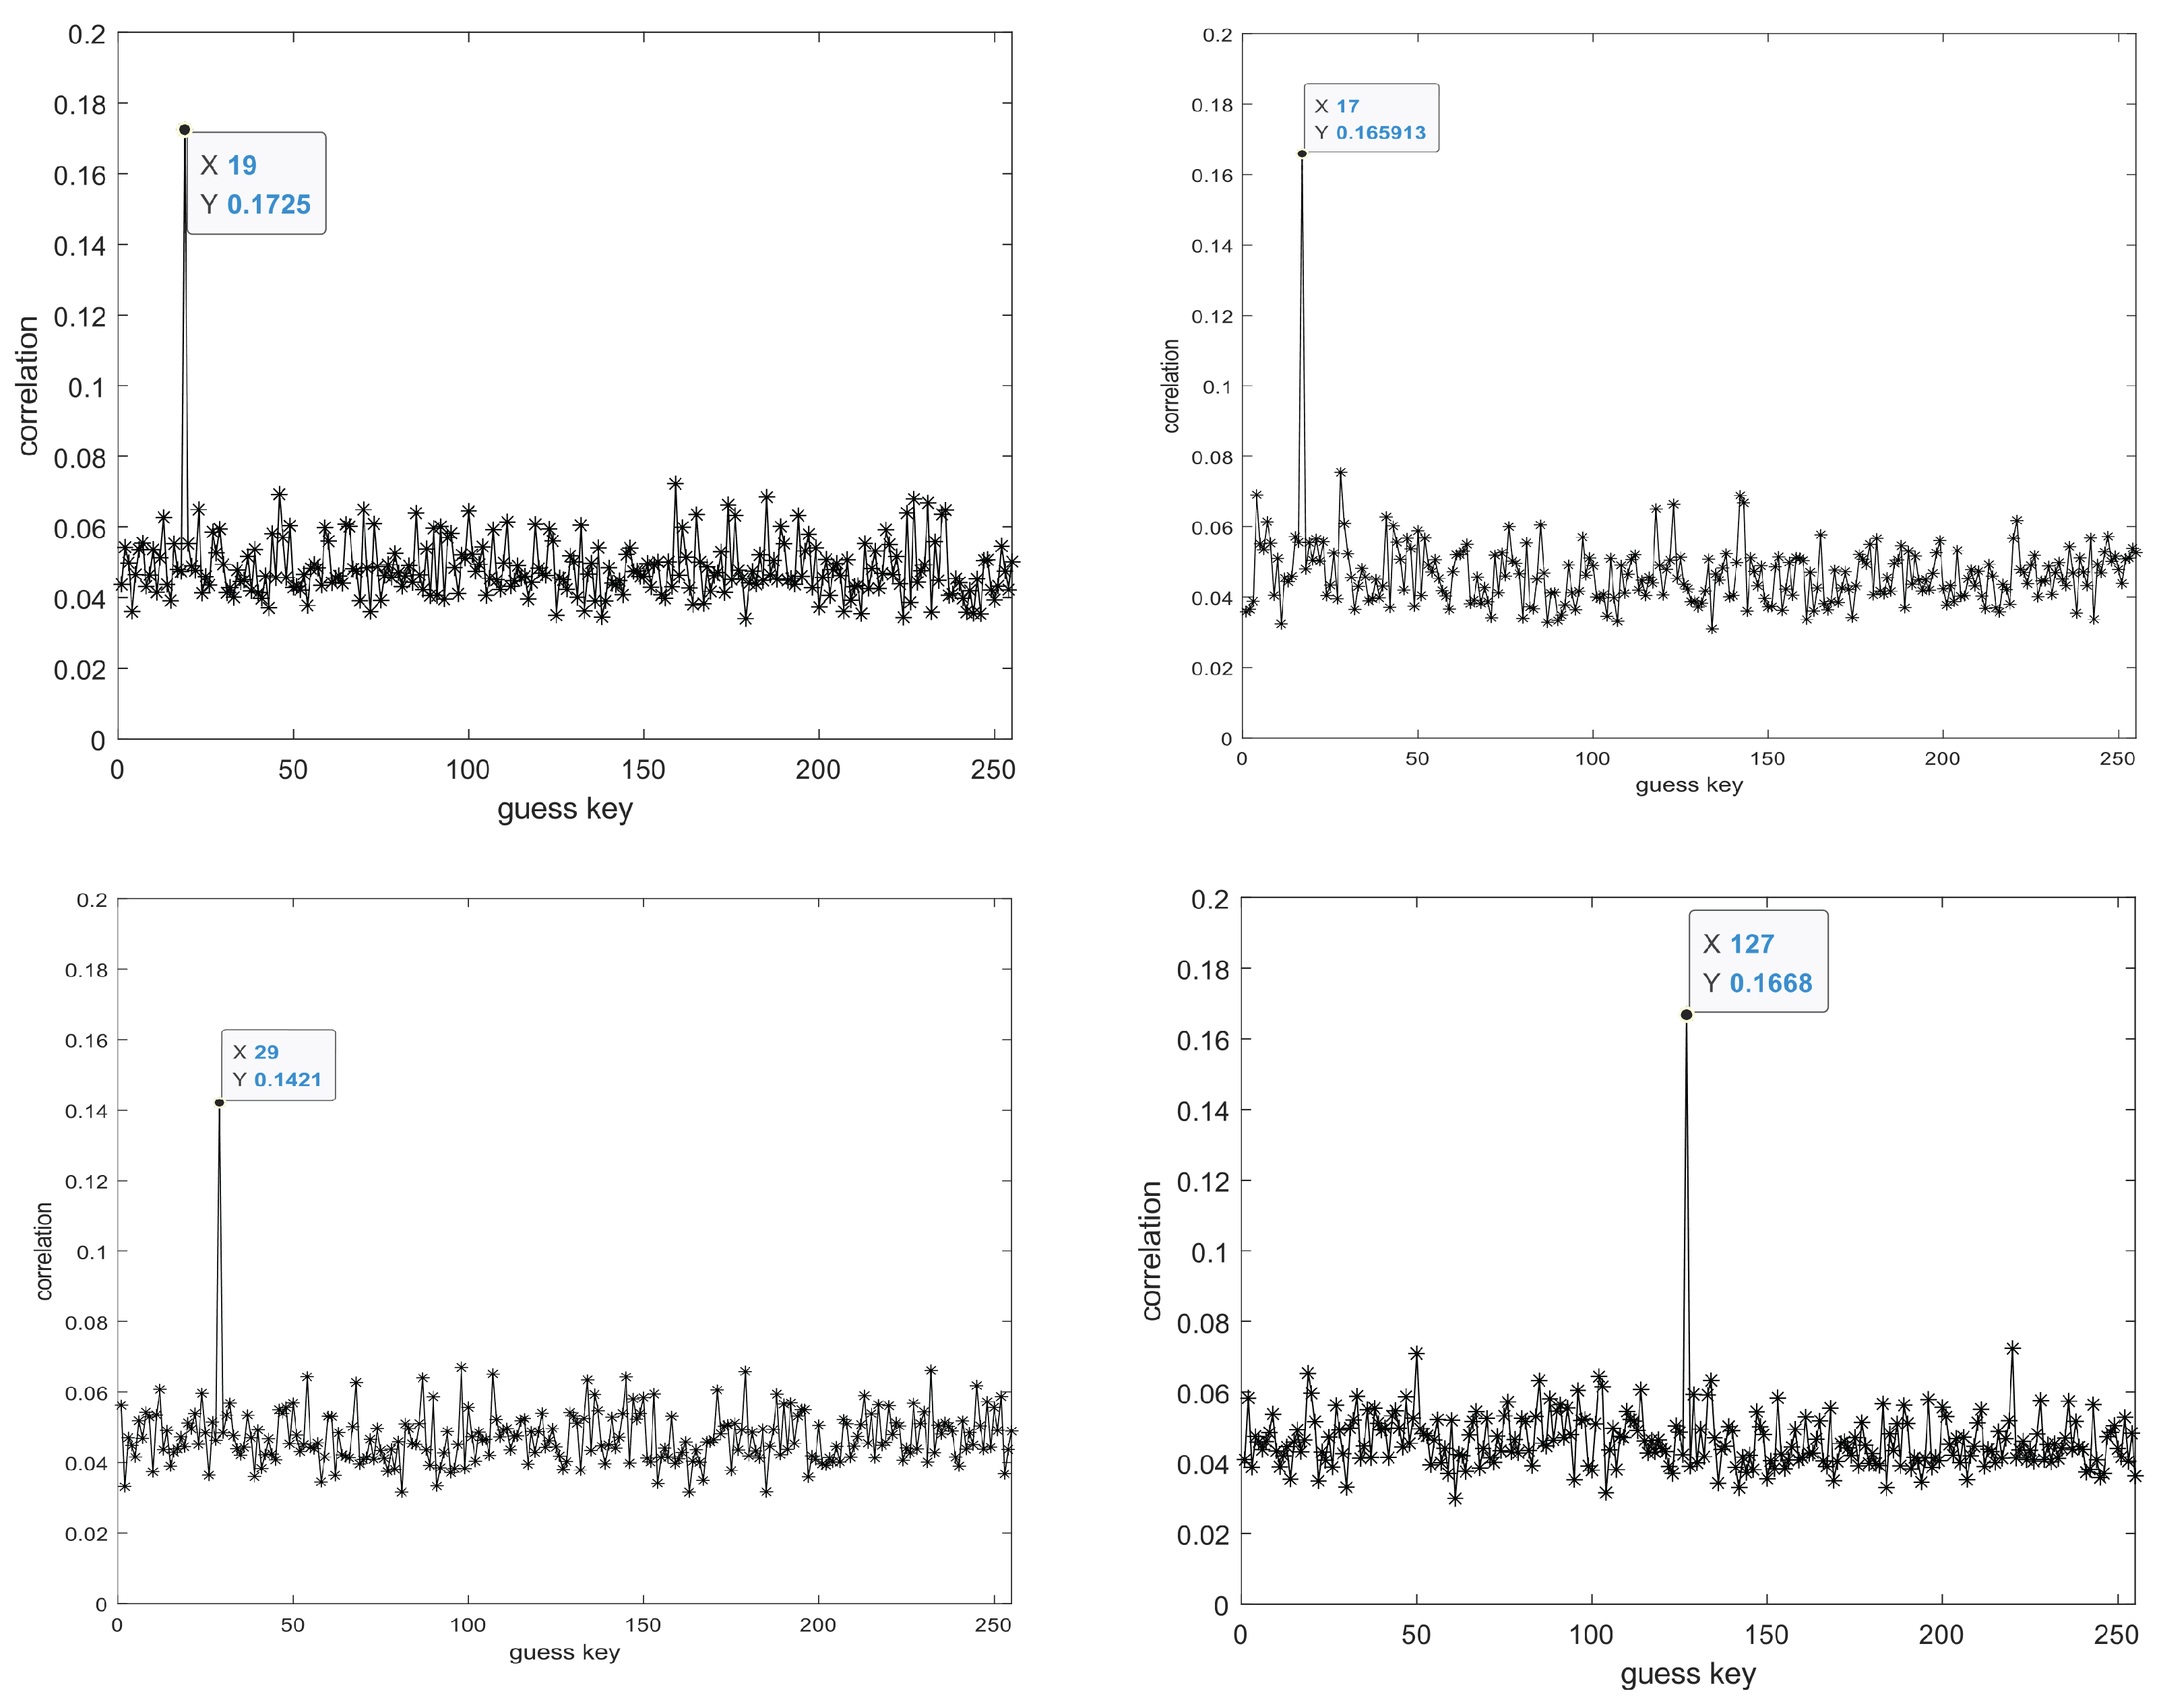
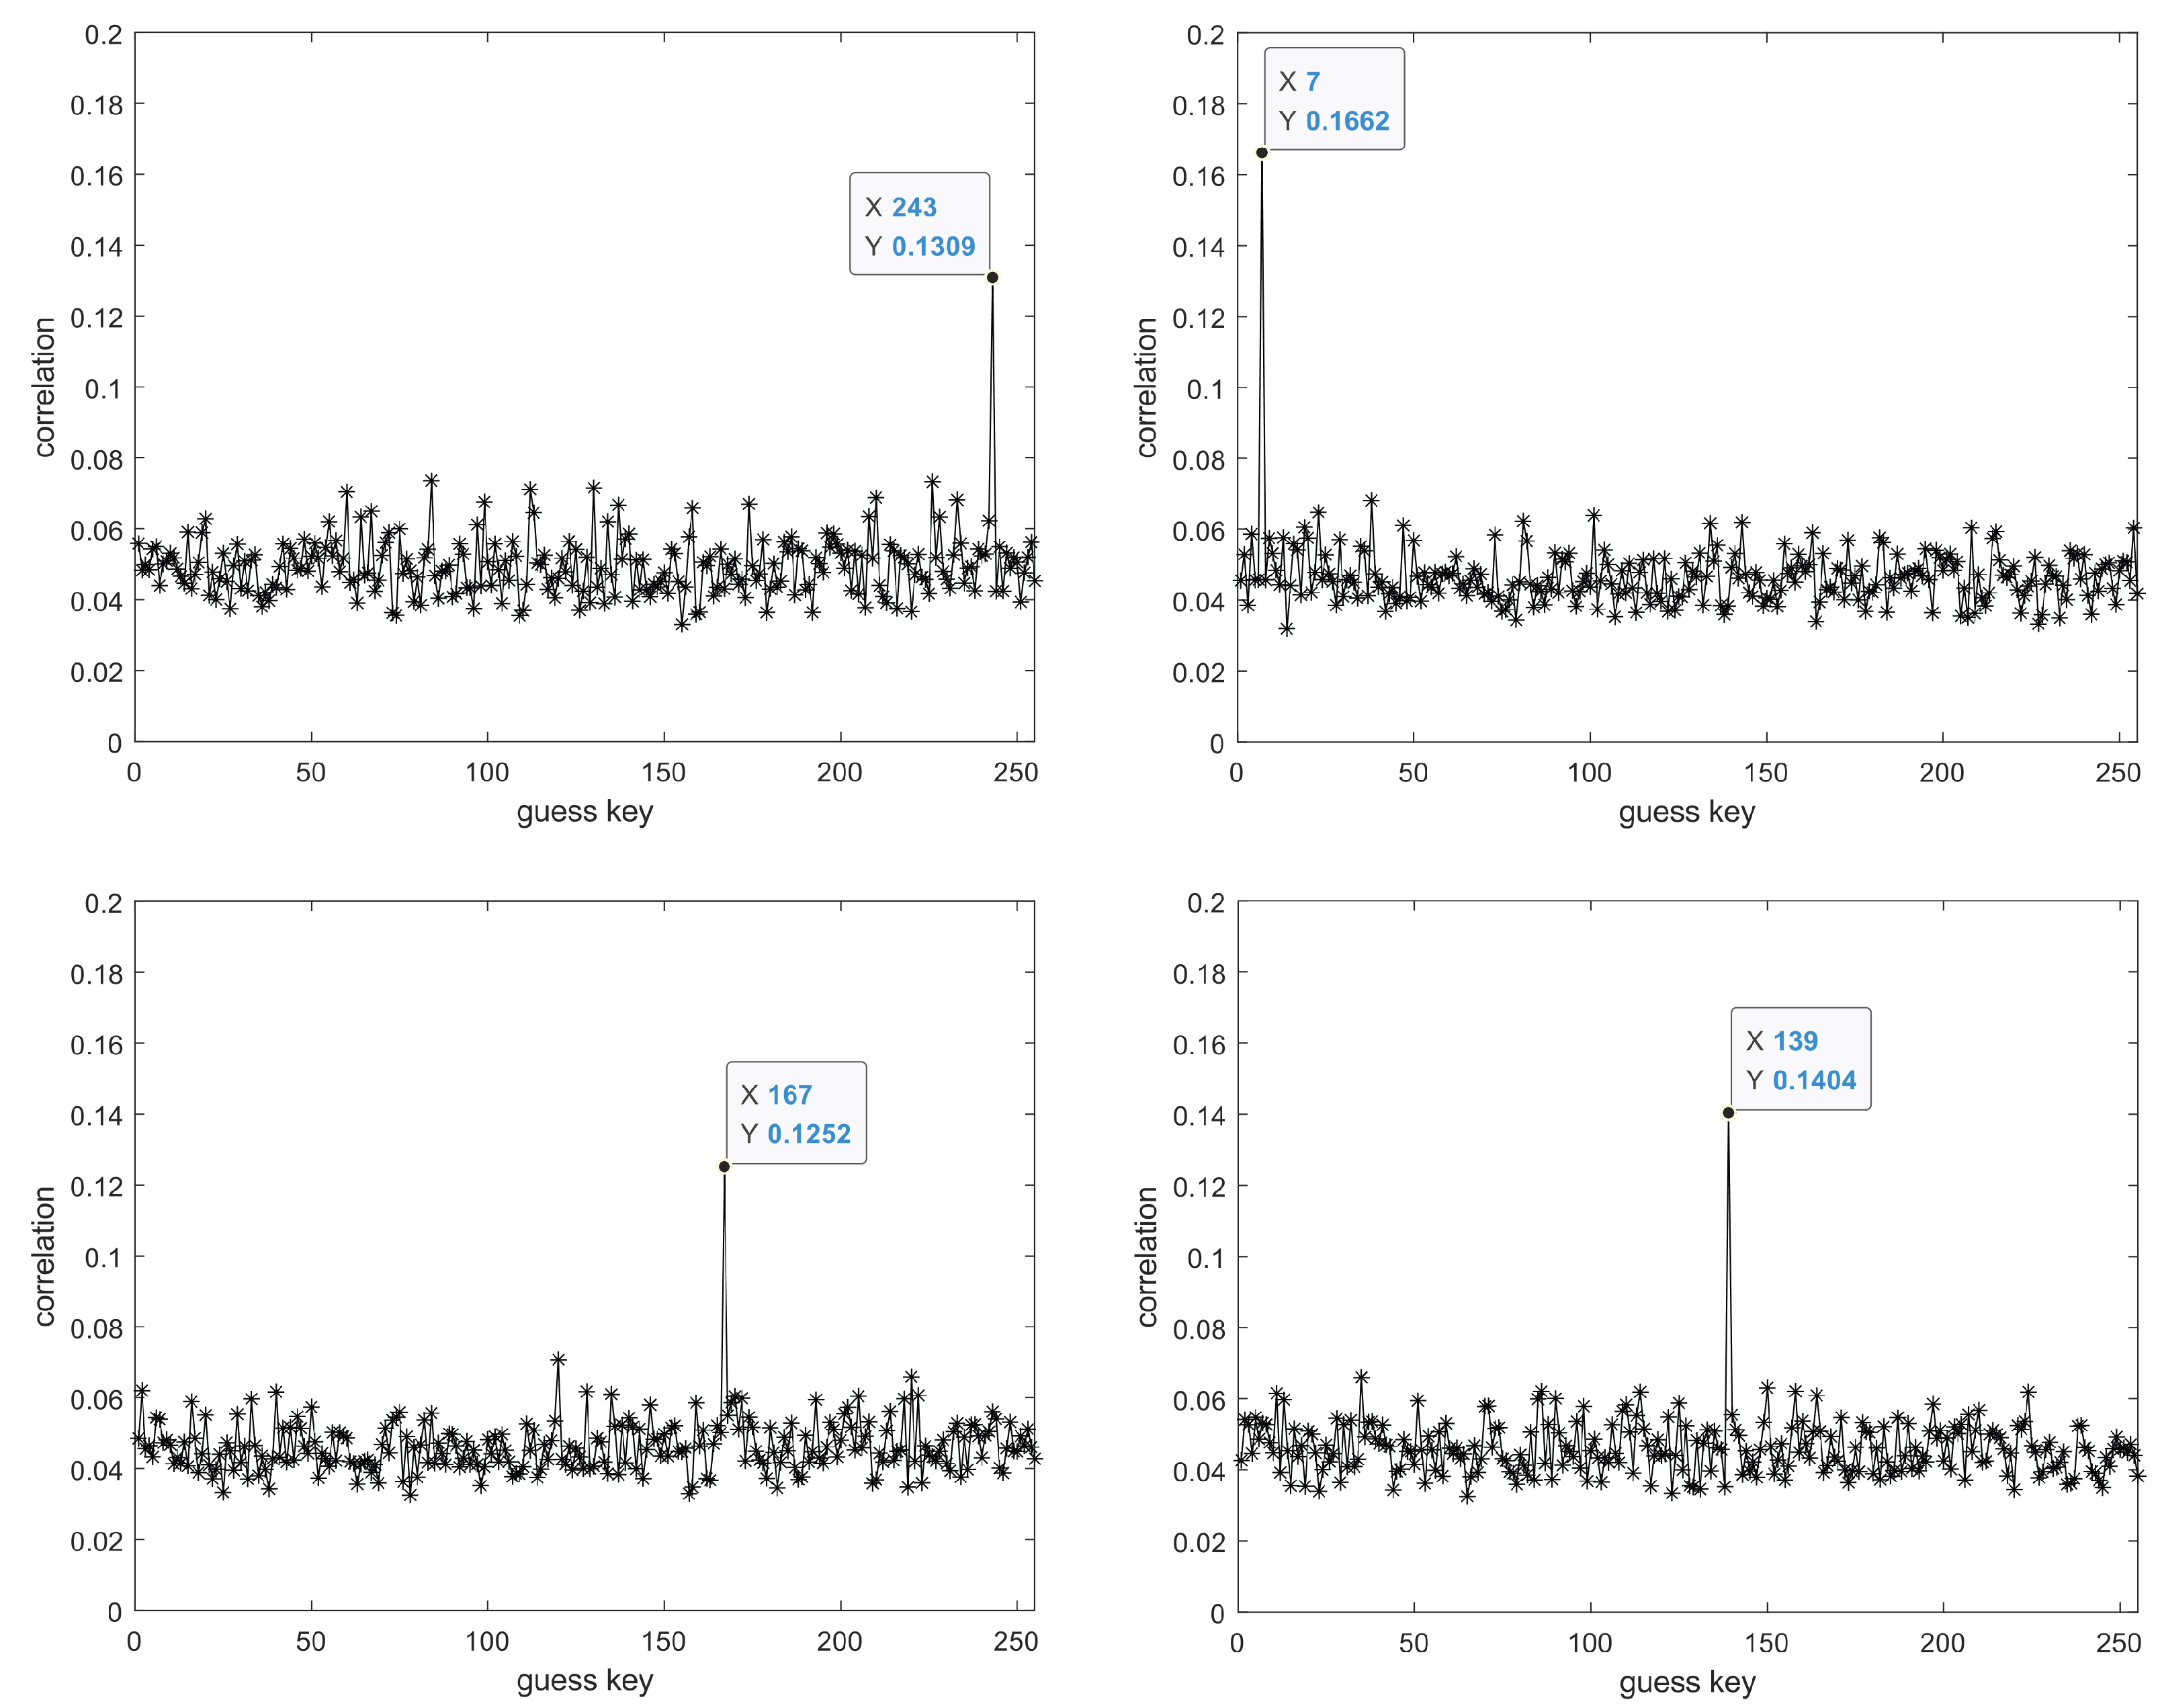
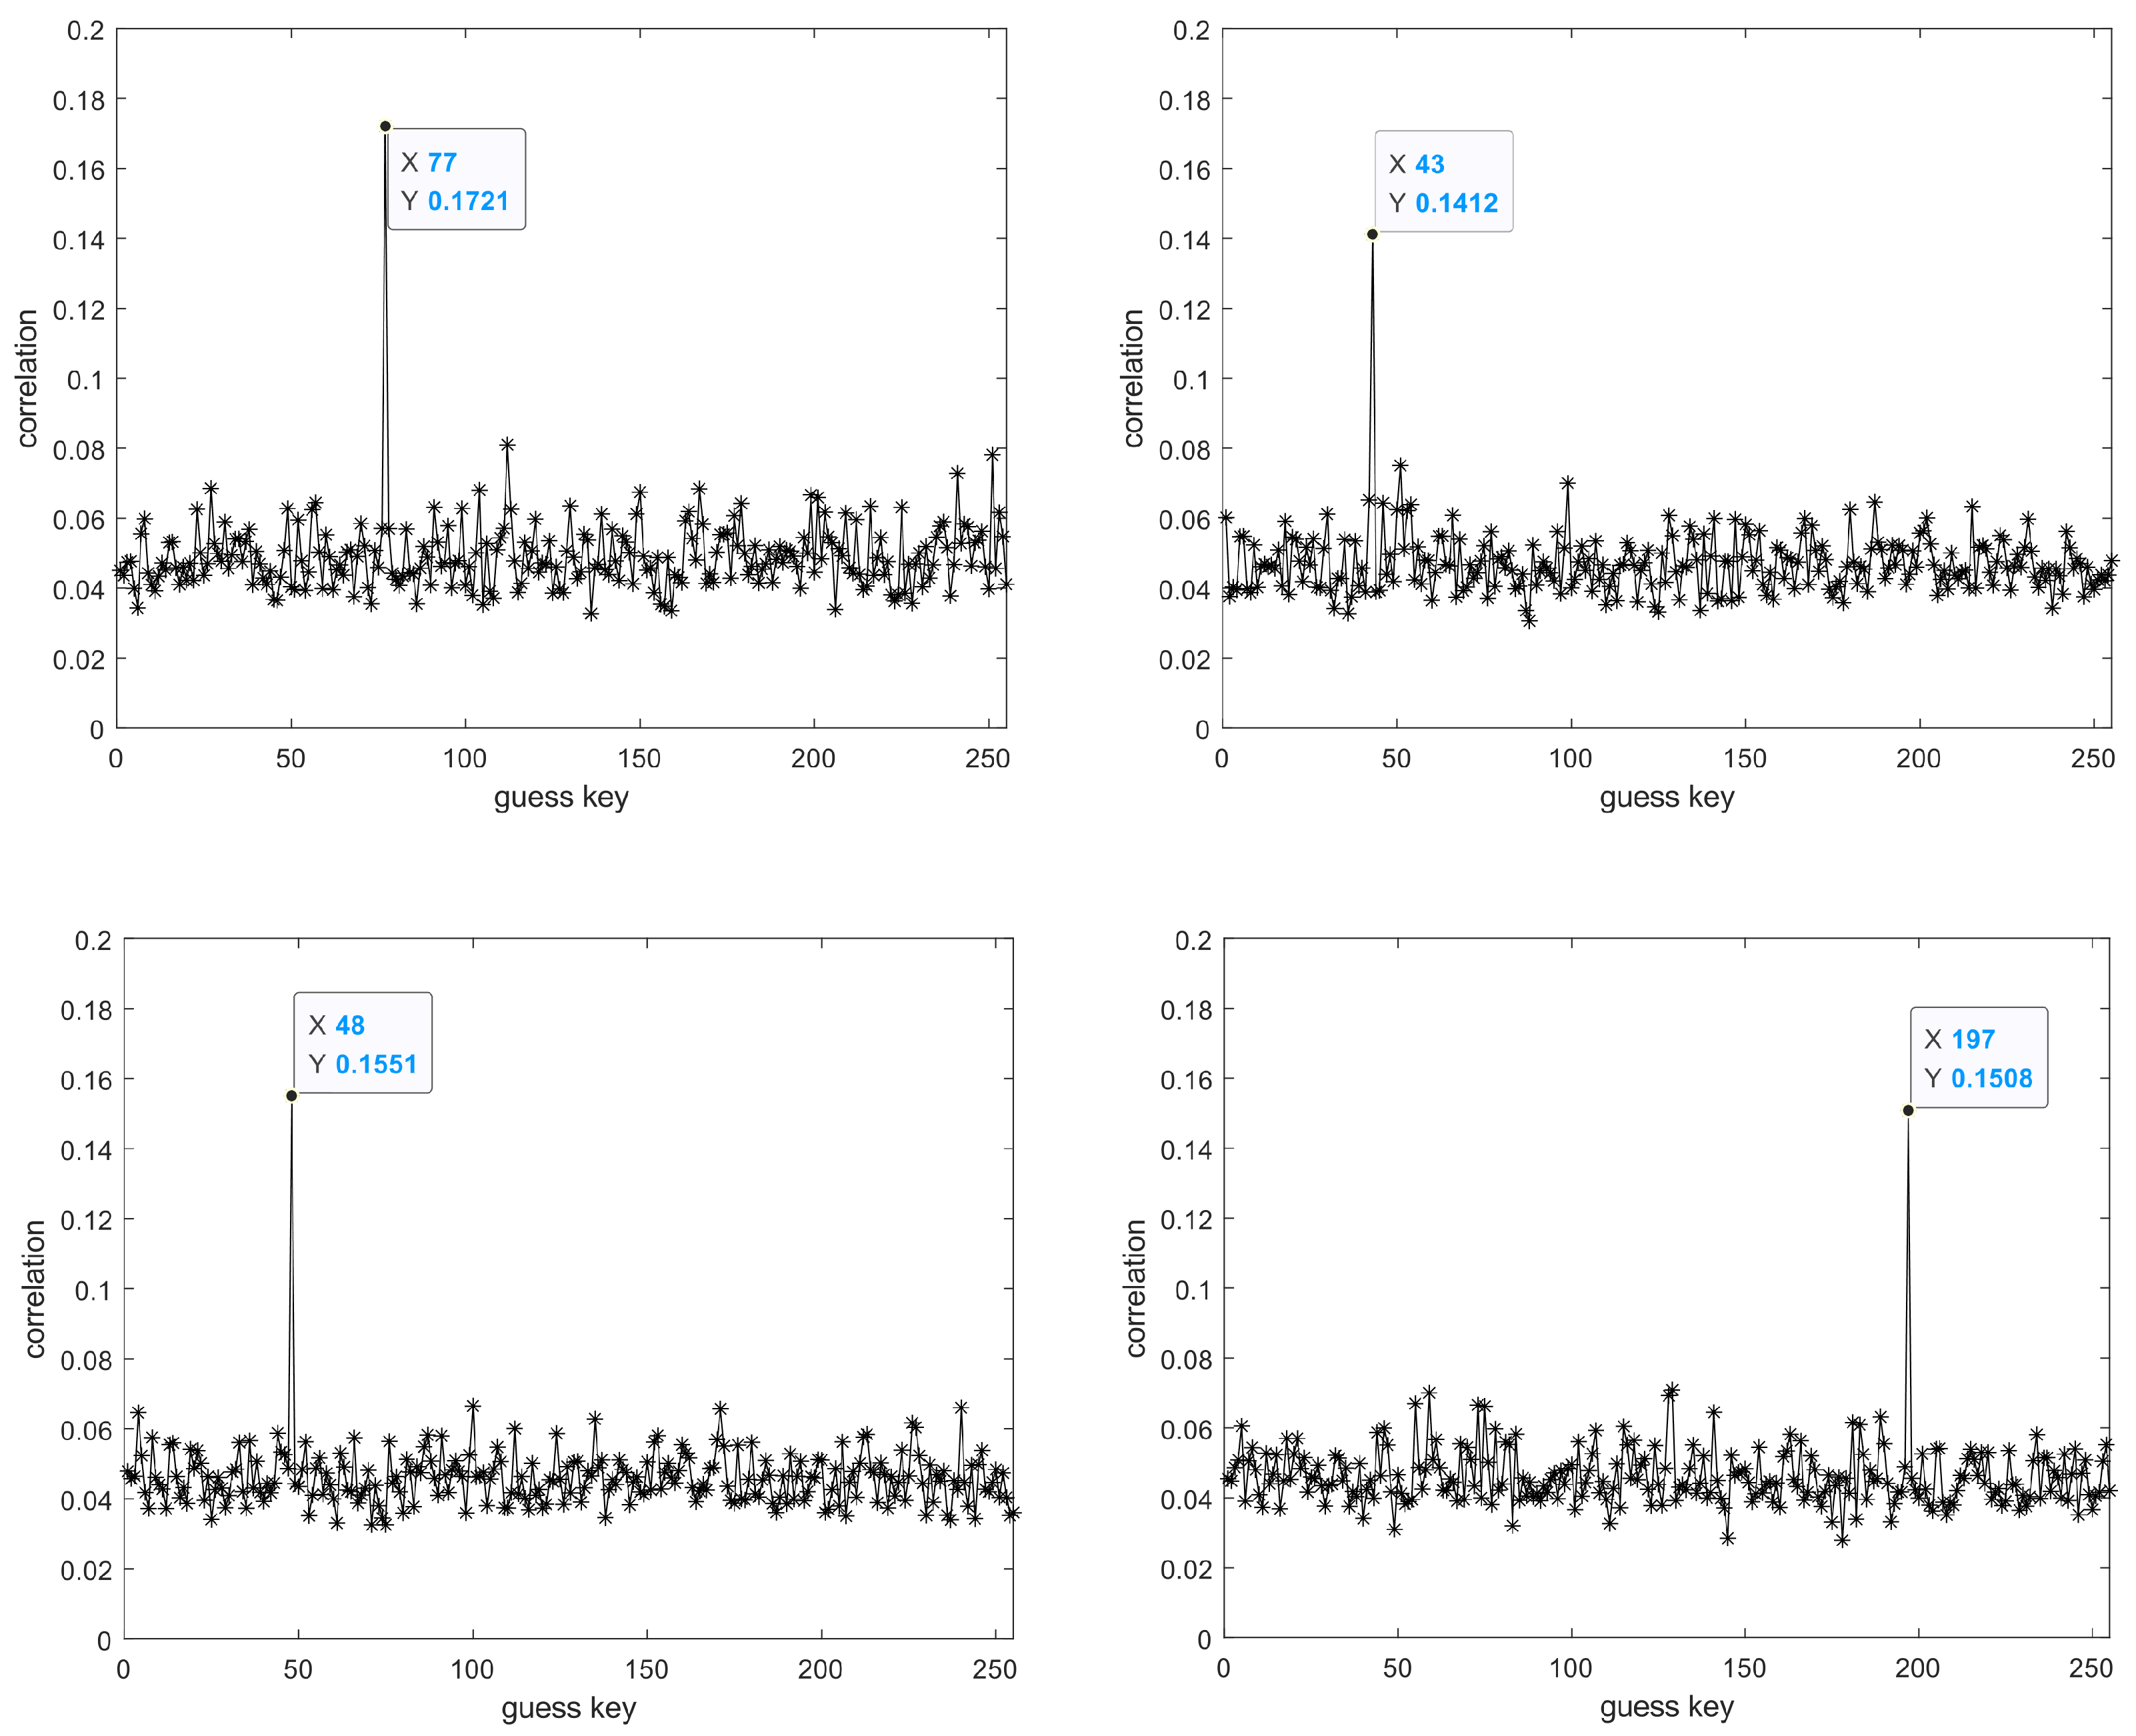
  • Conduct a correlation statistical analysis between the hypothetical electromagnetic leakage matrix H and the actual electromagnetic emission leakage matrix T. Compare the Pearson correlation coefficient for the hypothetical h i , j corresponding to each guessed key and the actual electromagnetic leakage emission signal t i , j to obtain the correlation matrix R. The guessed key corresponding to the maximum value in the matrix R is the final attack result.
    r i , j = k = 0 M 1 ( h k , i h i ¯ ) ( t k , j t j ¯ ) k = 0 M 1 ( h k , i h i ¯ ) 2 · k = 0 M 1 ( t k , j t j ¯ ) 2
In the experimental design, we set a fixed key k. After the key expansion process, we obtain the result of the 10th round subkey, which is denoted as k 10 . The decimal representation of k 10 = 13111 d 7 f e 3944 a 17 f 307 a 78 b 4 d 2 b 30 c 5 can be expressed as Table 1. Figure 10, Figure 11, Figure 12 and Figure 13 display the guessed results for the 16 bytes of the complete AES-128 key.
We conducted some comparative experiments using real and simulated signals in Figure 14. In the legend, S represents the experimental results of the simulated signals, while R represents for the real signals. Since the simulated signals are noise-free clean signals in an ideal environment, they have a higher success rate. We compared the experimental results of real data using the data augmentation method presented in this paper with those obtained using traditional augmentation methods. This method can reduce the amount of data required for a successful attack and has better results than traditional geometric augmentation methods.
Finally, we compared the related research work mentioned in the overview from three perspectives in Table 2. These three perspectives are the KS test results, data consistency and the number of energy traces required for a successful attack. Experimental results prove that our method effectively reduces the amount of data required for key analysis while ensuring data uniformity, reducing 900 pieces of data on the original basis.

7. Conclusions

In this manuscript, we proposed a data augmentation method for side-channel attacks on cryptographic integrated circuits. A cyclic adversarial generative network model suitable for generating one-dimensional electromagnetic signals was proposed, which can effectively expand small sample data. For the evaluation criteria of data augmentation effects on side-channel electromagnetic signals, the Kolmogorov–Smirnov Test is used to characterize the original and generated data, serving as the evaluation standard for our network model results and work. Finally, existing data are used to model and verify side-channel attacks, proving the effectiveness of key attacks. This method improves the effectiveness of small sample data and increases the success rate of attacks on small sample attack samples compared to traditional methods.

Author Contributions

Conceptualization, X.C., H.Z. and W.N.; methodology, X.C. and J.X.; validation, X.C. and Y.W.; formal analysis, X.C. and H.Z.; investigation, X.F. and X.C.; writing—original draft preparation, X.C.; writing—review and editing M.S.H., funding acquisition, H.Z. All authors have read and agreed to the published version of the manuscript.

Funding

This research was funded by the National Natural Science Foundation of China (62071057, 62302036), Aeronautical Science Foundation of China (2019ZG073001).

Data Availability Statement

Data sharing is available by emailing the corresponding author.

Conflicts of Interest

The authors declare no conflicts of interest.

References

  1. Joy Persial, G.; Prabhu, M.; Shanmugalakshmi, R. Side channel attack-survey. Int. J. Adv. Sci. Res. Rev. 2011, 1, 54–57. [Google Scholar]
  2. Lerman, L.; Bontempi, G.; Ben Taieb, S.; Markowitch, O. A Time Series Approach for Profiling Attack. In Security, Privacy, and Applied Cryptography Engineering; Hutchison, D., Kanade, T., Kittler, J., Kleinberg, J.M., Mattern, F., Mitchell, J.C., Naor, M., Nierstrasz, O., Pandu Rangan, C., Steffen, B., et al., Eds.; Series Title: Lecture Notes in Computer Science; Springer: Berlin/Heidelberg, Germany, 2013; Volume 8204, pp. 75–94. [Google Scholar] [CrossRef]
  3. Aljuffri, A.; Zwalua, M.; Reinbrecht, C.R.W.; Hamdioui, S.; Taouil, M. Applying thermal side-channel attacks on asymmetric cryptography. IEEE Trans. Very Large Scale Integr. (VLSI) Syst. 2021, 29, 1930–1942. [Google Scholar] [CrossRef]
  4. Kocher, P.C. Timing attacks on implementations of Diffie-Hellman, RSA, DSS, and other systems. In Proceedings of the Advances in Cryptology—CRYPTO’96: 16th Annual International Cryptology Conference, Santa Barbara, CA, USA, 18–22 August 1996; Proceedings 16. Springer: Berlin/Heidelberg, Germany, 1996; pp. 104–113. [Google Scholar]
  5. Paschali, M.; Simson, W.; Roy, A.G.; Göbl, R.; Wachinger, C.; Navab, N. Manifold exploring data augmentation with geometric transformations for increased performance and robustness. In Proceedings of the Information Processing in Medical Imaging: 26th International Conference, IPMI 2019, Hong Kong, China, 2–7 June 2019; Proceedings 26. Springer: Berlin/Heidelberg, Germany, 2019; pp. 517–529. [Google Scholar]
  6. de la Rosa, F.L.; Gómez-Sirvent, J.L.; Sánchez-Reolid, R.; Morales, R.; Fernández-Caballero, A. Geometric transformation-based data augmentation on defect classification of segmented images of semiconductor materials using a ResNet50 convolutional neural network. Expert Syst. Appl. 2022, 206, 117731. [Google Scholar] [CrossRef]
  7. Maharana, K.; Mondal, S.; Nemade, B. A review: Data pre-processing and data augmentation techniques. Glob. Transitions Proc. 2022, 3, 91–99. [Google Scholar] [CrossRef]
  8. Goodfellow, I.; Pouget-Abadie, J.; Mirza, M.; Xu, B.; Warde-Farley, D.; Ozair, S.; Courville, A.; Bengio, Y. Generative adversarial networks. Commun. ACM 2020, 63, 139–144. [Google Scholar] [CrossRef]
  9. Goodfellow, I.; Pouget-Abadie, J.; Mirza, M.; Xu, B.; Warde-Farley, D.; Ozair, S.; Courville, A.; Bengio, Y. Generative adversarial nets. Adv. Neural Inf. Process. Syst. 2014, 27, 2672–2680. [Google Scholar]
  10. Creswell, A.; White, T.; Dumoulin, V.; Arulkumaran, K.; Sengupta, B.; Bharath, A.A. Generative adversarial networks: An overview. IEEE Signal Process. Mag. 2018, 35, 53–65. [Google Scholar] [CrossRef]
  11. Wang, K.; Gou, C.; Duan, Y.; Lin, Y.; Zheng, X.; Wang, F.Y. Generative adversarial networks: Introduction and outlook. IEEE/CAA J. Autom. Sin. 2017, 4, 588–598. [Google Scholar] [CrossRef]
  12. Gui, J.; Sun, Z.; Wen, Y.; Tao, D.; Ye, J. A review on generative adversarial networks: Algorithms, theory, and applications. IEEE Trans. Knowl. Data Eng. 2021, 35, 3313–3332. [Google Scholar] [CrossRef]
  13. Hammami, M.; Friboulet, D.; Kéchichian, R. Cycle GAN-based data augmentation for multi-organ detection in CT images via Yolo. In Proceedings of the 2020 IEEE international conference on image processing (ICIP), Abu Dhabi, United Arab Emirates, 25–28 October 2020; IEEE: Piscataway, NJ, USA, 2020; pp. 390–393. [Google Scholar]
  14. Rashid, H.; Tanveer, M.A.; Khan, H.A. Skin lesion classification using GAN based data augmentation. In Proceedings of the 2019 41st Annual International Conference of the IEEE Engineering in Medicine and Biology Society (EMBC), Berlin, Germany, 23–27 July 2019; IEEE: Piscataway, NJ, USA, 2019; pp. 916–919. [Google Scholar]
  15. Bissoto, A.; Valle, E.; Avila, S. Gan-based data augmentation and anonymization for skin-lesion analysis: A critical review. In Proceedings of the IEEE/CVF Conference on Computer Vision and Pattern Recognition, Nashville, TN, USA, 20–25 June 2021; pp. 1847–1856. [Google Scholar]
  16. Zhu, X.; Liu, Y.; Li, J.; Wan, T.; Qin, Z. Emotion Classification with Data Augmentation Using Generative Adversarial Networks. In Advances in Knowledge Discovery and Data Mining; Series Title: Lecture Notes in Computer Science; Phung, D., Tseng, V.S., Webb, G.I., Ho, B., Ganji, M., Rashidi, L., Eds.; Springer International Publishing: Cham, Switzerland, 2018; Volume 10939, pp. 349–360. [Google Scholar] [CrossRef]
  17. Zhu, X.; Liu, Y.; Qin, Z.; Li, J. Data Augmentation in Emotion Classification Using Generative Adversarial Networks. arXiv 2017, arXiv:1711.00648. [Google Scholar]
  18. Frid-Adar, M.; Klang, E.; Amitai, M.; Goldberger, J.; Greenspan, H. Synthetic data augmentation using GAN for improved liver lesion classification. In Proceedings of the 2018 IEEE 15th international symposium on biomedical imaging (ISBI 2018), Washington, DC, USA, 4–7 April 2018; IEEE: Piscataway, NJ, USA, 2018; pp. 289–293. [Google Scholar]
  19. Huang, S.W.; Lin, C.T.; Chen, S.P.; Wu, Y.Y.; Hsu, P.H.; Lai, S.H. Auggan: Cross domain adaptation with gan-based data augmentation. In Proceedings of the European Conference on Computer Vision (ECCV), Glasgow, UK, 8–14 September 2018; pp. 718–731. [Google Scholar]
  20. Mariani, G.; Scheidegger, F.; Istrate, R.; Bekas, C.; Malossi, C. BAGAN: Data Augmentation with Balancing GAN. arXiv 2018, arXiv:1803.09655. [Google Scholar]
  21. Yang, H.; Zhou, Y. Ida-gan: A novel imbalanced data augmentation gan. In Proceedings of the 2020 25th International Conference on Pattern Recognition (ICPR), Milan, Italy, 10–15 January 2021; IEEE: Piscataway, NJ, USA, 2021; pp. 8299–8305. [Google Scholar]
  22. Jiangsha, A.; Tian, L.; Bai, L.; Zhang, J. Data augmentation by a CycleGAN-based extra-supervised model for nondestructive testing. Meas. Sci. Technol. 2022, 33, 045017. [Google Scholar] [CrossRef]
  23. Sandfort, V.; Yan, K.; Pickhardt, P.J.; Summers, R.M. Data augmentation using generative adversarial networks (CycleGAN) to improve generalizability in CT segmentation tasks. Sci. Rep. 2019, 9, 16884. [Google Scholar] [CrossRef] [PubMed]
  24. Xu, Z.; Qi, C.; Xu, G. Semi-supervised attention-guided cyclegan for data augmentation on medical images. In Proceedings of the 2019 IEEE International Conference on Bioinformatics and Biomedicine (BIBM), San Diego, CA, USA, 18–21 November 2019; IEEE: Piscataway, NJ, USA, 2019; pp. 563–568. [Google Scholar]
  25. Park, M.; Tran, D.Q.; Jung, D.; Park, S. Wildfire-detection method using DenseNet and CycleGAN data augmentation-based remote camera imagery. Remote Sens. 2020, 12, 3715. [Google Scholar] [CrossRef]
  26. Cap, Q.H.; Uga, H.; Kagiwada, S.; Iyatomi, H. Leafgan: An effective data augmentation method for practical plant disease diagnosis. IEEE Trans. Autom. Sci. Eng. 2020, 19, 1258–1267. [Google Scholar] [CrossRef]
  27. Zhu, J.Y.; Park, T.; Isola, P.; Efros, A.A. Unpaired Image-To-Image Translation Using Cycle-Consistent Adversarial Networks. In Proceedings of the IEEE International Conference on Computer Vision (ICCV), Venice, Italy, 22–29 October 2017. [Google Scholar]
  28. Cagli, E.; Dumas, C.; Prouff, E. Convolutional Neural Networks with Data Augmentation Against Jitter-Based Countermeasures: Profiling Attacks without Pre-processing. In Cryptographic Hardware and Embedded Systems—CHES 2017; Series Title: Lecture Notes in Computer Science; Fischer, W., Homma, N., Eds.; Springer International Publishing: Cham, Switzerland, 2017; Volume 10529, pp. 45–68. [Google Scholar] [CrossRef]
  29. Advanced ASIC Chip Synthesis Using Synopsys® Design CompilerTM Physical CompilerTM and PrimeTime®: Chapter 4; Kluwer Academic Publishers: Boston, MA, USA, 2002. [CrossRef]
  30. Fasano, G.; Franceschini, A. A multidimensional version of the Kolmogorov-Smirnov test. Mon. Not. R. Astron. Soc. 1987, 225, 155–170. [Google Scholar] [CrossRef]
Figure 1. The overall framework. (A) The experimental platform. (B) The data augmentation network. (C) The test method. (D) The Attack method.
Electronics 13 01348 g001
Figure 2. The basic structure of CycleGAN. (a) cycle structure. (b) the structure of generator for x. (c) the structure of generator for y.
Electronics 13 01348 g002
Figure 3. The EME-CycleGAN.
Electronics 13 01348 g003
Figure 4. The real data acquisition method.
Electronics 13 01348 g004
Figure 5. The real signal.
Electronics 13 01348 g005
Figure 6. The simulation data acquisition method.
Electronics 13 01348 g006
Figure 7. The simulation data.
Electronics 13 01348 g007
Figure 8. EME-CycleGAN training display.
Electronics 13 01348 g008
Figure 9. Signal characteristics display.
Electronics 13 01348 g009aElectronics 13 01348 g009b
Figure 10. From left to right, top to bottom, the displayed results are the guessed key results for the 1st to 4th bytes, respectively.
Electronics 13 01348 g010
Figure 11. From left to right, top to bottom, the displayed results are the guessed key results for the 5th to 8th bytes, respectively.
Electronics 13 01348 g011
Figure 12. From left to right, top to bottom, the displayed results are the guessed key results for the 9th to 12th bytes, respectively.
Electronics 13 01348 g012
Figure 13. From left to right, top to bottom, the displayed results are the guessed key results for the 13th to 16th bytes, respectively.
Electronics 13 01348 g013
Figure 14. The comparative results by real and simulated signals.
Electronics 13 01348 g014
Table 1. The hex to dec of k 10 .
Byte1Byte2Byte3Byte4Byte5Byte6Byte7Byte8
hex13111d7fe3944a17
dec1917291272271487423
Byte9Byte10Byte11Byte12Byte13Byte14Byte15Byte16
hexf307a78b4d2b30c5
dec2437167139774348197
Table 2. The comparision with other methods.
TypeMethodKS TestData ConsistencyTracesReduced
Geometric TransformationsMovement [5] H 1 No4400100
Flipping [6] H 0 Yes4800−300
Neural AugmentationDAGAN [8] H 0 Yes4000500
Ours H 0 Yes3400900
Disclaimer/Publisher’s Note: The statements, opinions and data contained in all publications are solely those of the individual author(s) and contributor(s) and not of MDPI and/or the editor(s). MDPI and/or the editor(s) disclaim responsibility for any injury to people or property resulting from any ideas, methods, instructions or products referred to in the content.

