Abstract
This study introduces a methodology for the real-time detection of human movement based on two legs using ultra-wideband (UWB) sensors. Movements were primarily categorized into four states: stopped, walking, lingering, and the transition between sitting and standing. To classify these movements, UWB sensors were used to measure the distance between the designated point and a specific point on the two legs in the human body. By analyzing the measured distance values, a movement state classification model was constructed. In comparison to conventional vision/laser/LiDAR-based research, this approach requires fewer computational resources and provides distinguished real-time human movement detection within a CPU environment. Consequently, this research presents a novel strategy to effectively recognize human movements during human–robot interactions. The proposed model effectively discerned four distinct movement states with classification accuracy of around 95%, demonstrating the novel strategy’s efficacy.
1. Introduction
In recent years, the rapid advancements and innovations in robotics have led to the increased integration of robots into daily life, work environments, and various industries [1,2,3,4,5]. As a part of this integration, the ability for robots to perceive human movements and behaviors accurately and respond appropriately has become increasingly important [6,7,8]. This capability is not only vital for the robot’s stability but also in improving the user convenience and work efficiency [9,10]. Therefore, a smooth response system between humans and robots has become one of the primary research topics in robotics [11,12]. To establish an effective response system, it is essential for robots to first discern and understand the current human movements. Addressing this challenge, this paper presents a methodology by which robots can perceive human movements.
In the domain of robotics, the accurate perception of user movement is paramount in enhancing the interaction between humans and robots. Currently, there is vigorous research in the fields of vision and laser sensing aimed at achieving this objective [13,14,15,16,17,18,19,20,21,22,23,24,25,26]. Vision-based systems are advantageous for their ability to capture detailed imagery, enabling the analysis of complex human postures with high accuracy. This is complemented by the richness of the visual information available, such as color and texture, which aids in the precise interpretation of human actions. Laser sensing, on the other hand, offers precision in distance measurement and is capable of tracking movements accurately, even under varied environmental conditions. However, methods utilizing vision or lasers come with the drawback of requiring large computational resources [27,28]. Additionally, vision and laser sensing faces challenges when temporary occlusions occur, such as when an obstacle momentarily obscures the person, making it difficult to discern their posture [29,30].
Contrary to these approaches, this study proposes a methodology that simply adds an additional UWB sensor to an existing UWB-based human-following robot [31,32]. This method enables the real-time classification of human movement using minimal CPU operations, without using deep learning tools. Additionally, by relying on the distance metrics between sensors, this technique can offer superior reliability in detecting human movement states over vision- or laser-based methods, particularly in situations where temporary visual obstructions of the user occur. Additionally, the robustness of the UWB sensors facilitates the robot’s ability to track movements with a reasonable degree of accuracy, even when the user is performing cornering maneuvers [32]. This means that the robot can effectively follow a person moving around corners, maintaining the tracking performance despite the user being momentarily beyond direct sight. This capability demonstrates the potential for the robot’s operational effectiveness in complex environments, where obstacles frequently obstruct the line of sight.
In this study, while dealing with human movements, movements initiated by both legs were especially focused on. The reason for focusing on the movement of both legs was as follows. In most situations, human locomotion is primarily carried out via the movement of the two legs. From this perspective, if a mobile robot can understand the actions of a person’s two legs, the robot will be able to actively respond to human movement.
In the case of huma-following robots, which utilize UWB sensors, it is especially important to discern the movements of both human legs. Traditional human-following robots [31,32,33] employing ultra-wideband (UWB) sensor technology ascertain the position of a user through bilateration, calculating the distance from the robot to the person. These systems typically follow the user based on their location. However, this approach is limited to only identifying the user’s position and does not provide any information on how the user is moving. As a result, this limitation leads to several challenges and issues. For instance, if a user simply sits down and stands up in the same spot, this action can result in distance change, causing the robot to mistakenly interpret it as a positional shift, leading to unintended movements. Similarly, if a worker stops and moves slightly to perform a simple task, the robot might perceive these minor movements as positional changes, reacting continuously and behaving in a manner inconsistent with the user’s intention. However, if the robot understands not only the user’s positional information but also the type of movement, the mobile robot can deal with the various situations appropriately.
In order to address the aforementioned challenges, this paper introduces a novel methodology that involves attaching an additional UWB sensor to the human body, thereby enabling the acquisition of distance measurements for both human legs. By observing the changes in distance values corresponding to both legs, this study discerned user movements, thereby revealing insights into the movements of the human legs, which was previously unattainable through conventional methods. In addition, to accurately interpret user movements, human movement states were initially categorized into four distinct states: stopped, walking, lingering, and sitting/standing. For each category, patterns in the distance values corresponding to the different movements were analyzed. Based on these patterns, a movement classification model was subsequently developed. The classification of each movement was conducted in the following three stages. First, a binary classification was performed to distinguish between stopped and non-stopped (walking, lingering, sitting/standing) states based on velocity and acceleration values derived from the distance data. A simple threshold was established for this purpose. Second, among the non-stopped movements, a further binary classification was conducted to differentiate walking from non-walking (lingering, sitting/standing) movements. To achieve this, human walking patterns were modeled, and the characteristics of these patterns were identified using the Fast Fourier Transform (FFT) and cosine similarity, facilitating movement classification. Third, the classification between lingering and sitting/standing was made by comparing the slope of the acceleration values of both legs over a specific period. Through these three stages, the user’s movements were comprehensively classified into the four specified states.
This paper initially introduces a methodology that prioritizes the classification of human movement states into four categories, focusing on the changes in the user’s location. Following this, it validates the suitability of attaching sensors to both legs of the user, based on the modeling of the human walking sequence. Subsequently, the paper analyzes patterns in the sensor data corresponding to the previously defined four states and proposes a model to classify these states based on the analyzed patterns. The paper concludes with an analysis of the experimental results.
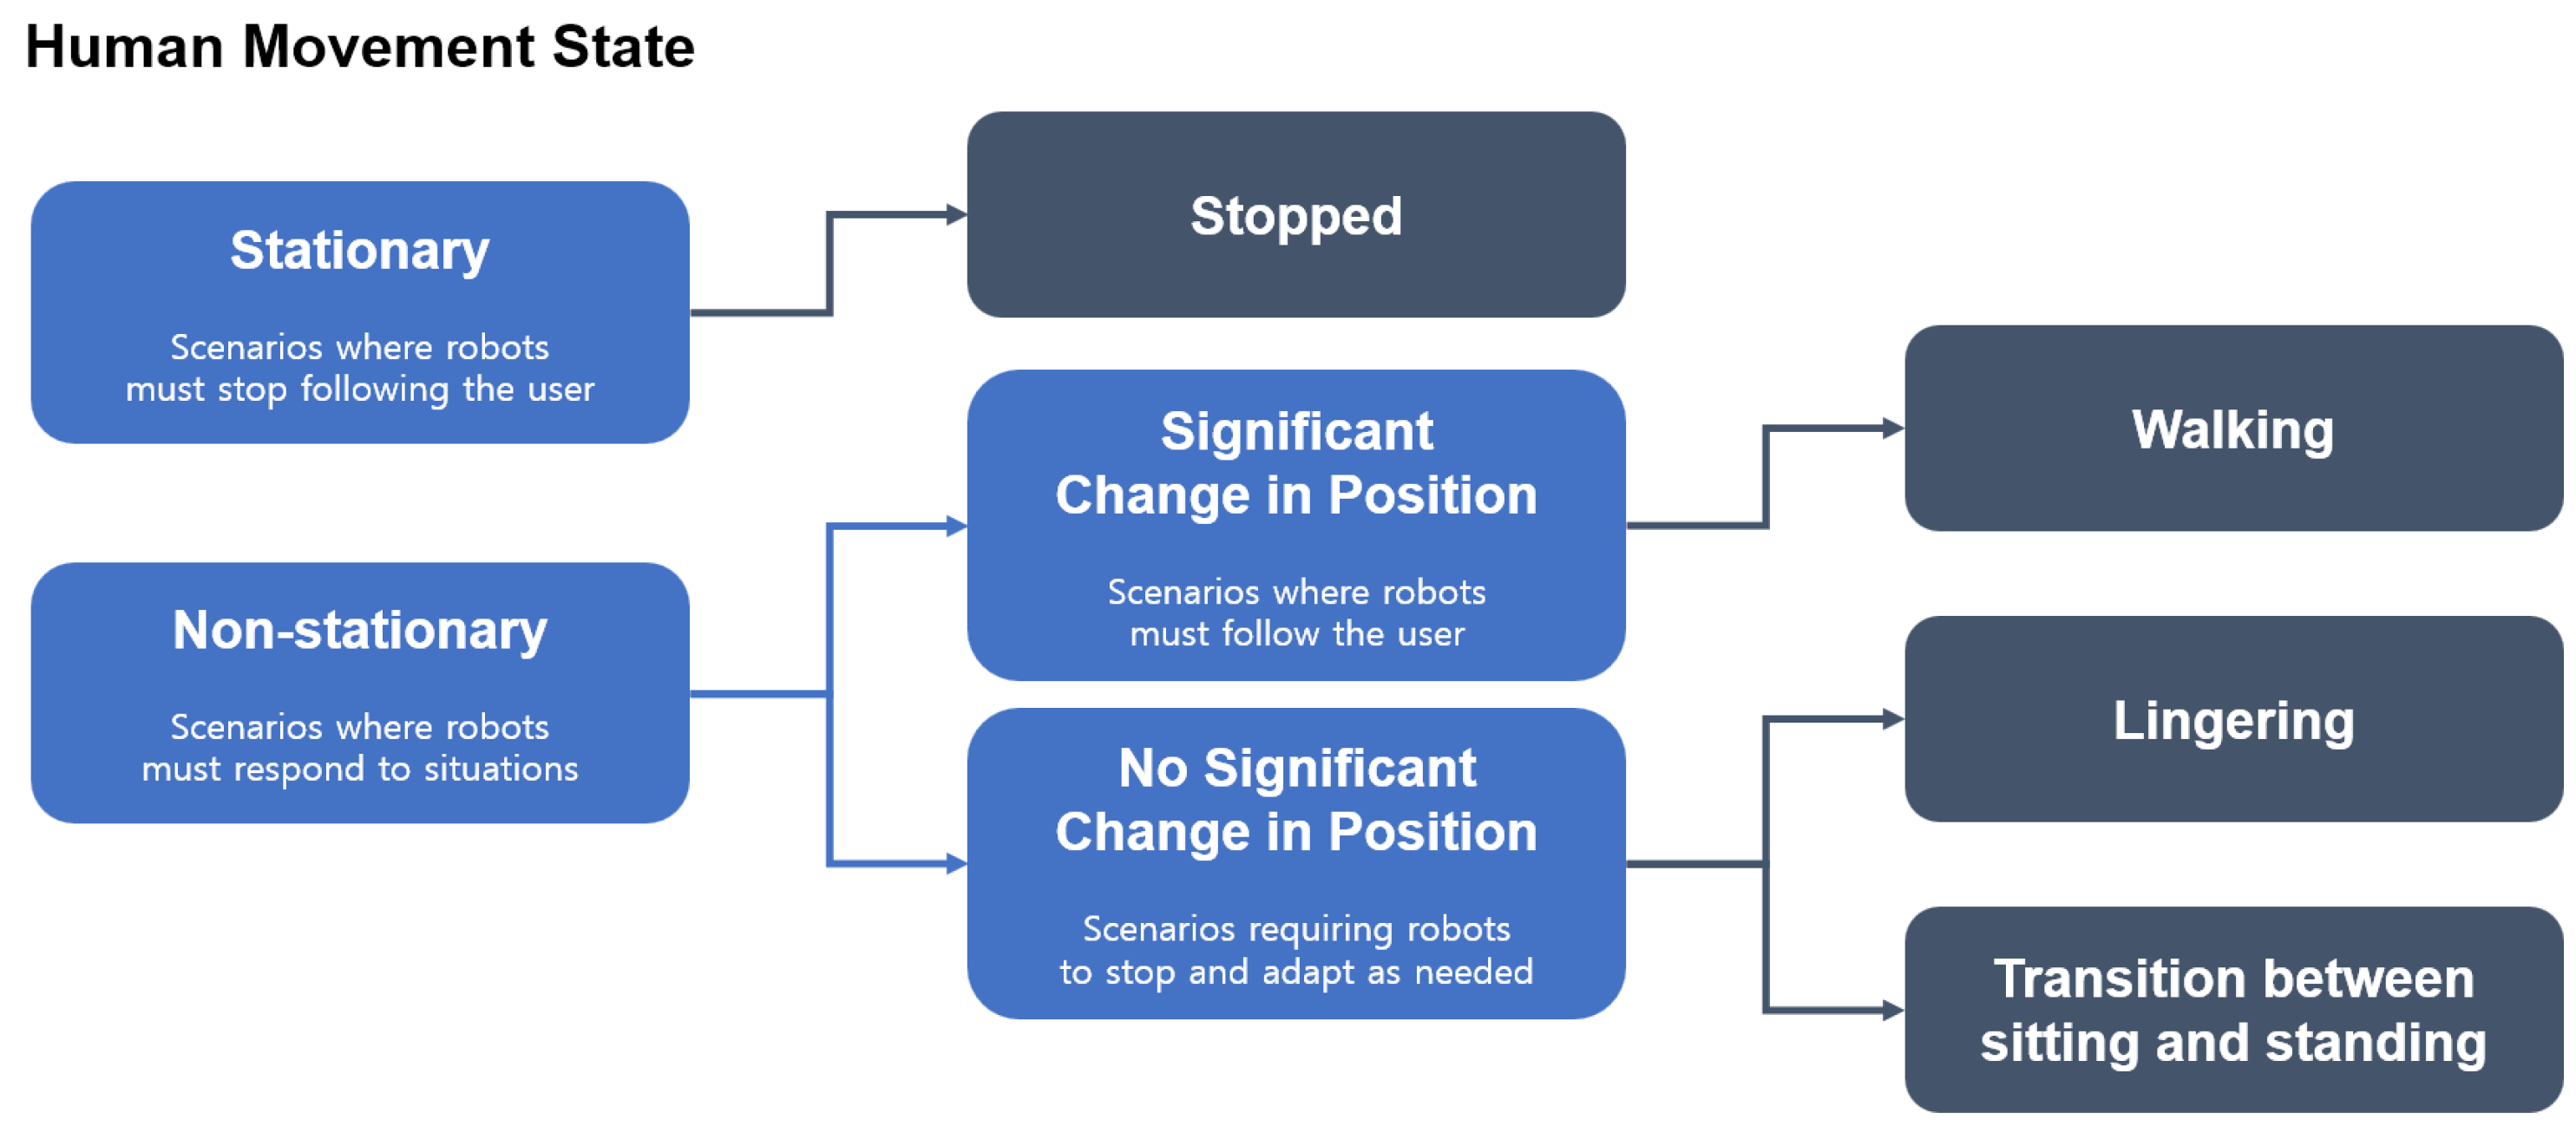
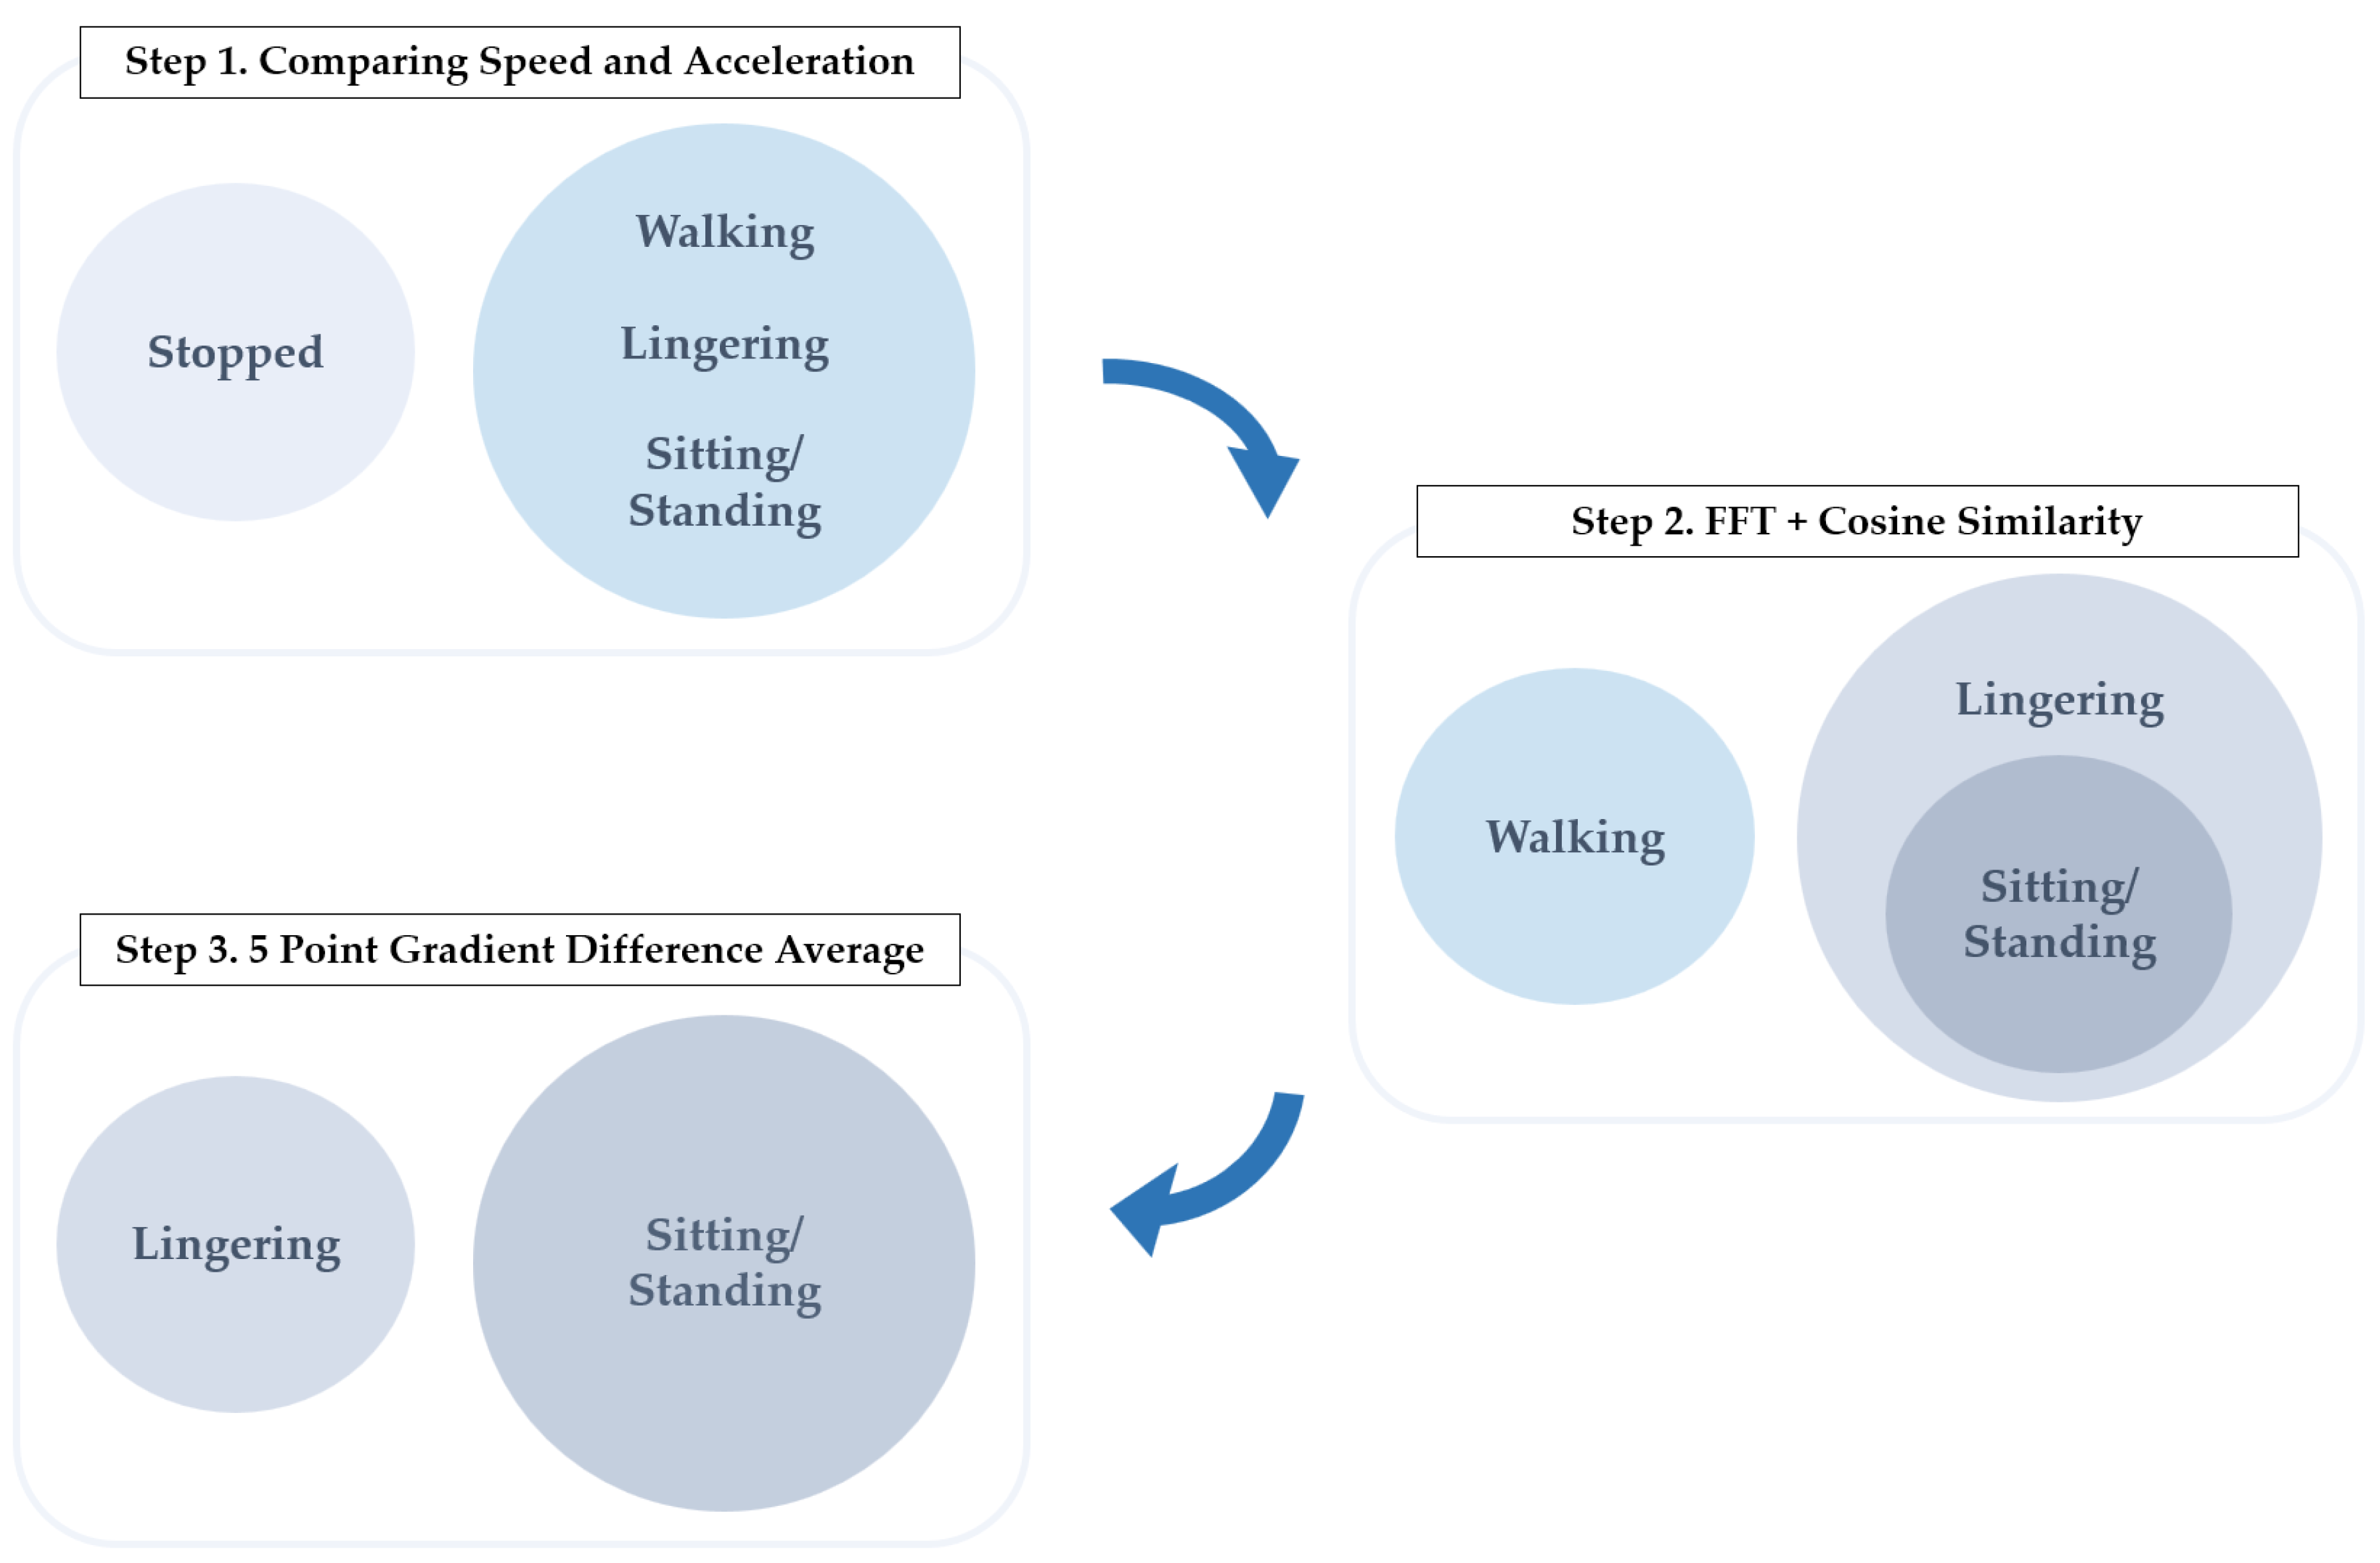
Designed in the structured manner shown in Figure 1, the study not only presents a novel approach to understanding and classifying human movements but also significantly contributes to the field of robotics by providing a comprehensive framework to enhance human–robot interaction. Through the meticulous application of this methodology, the paper aims to offer insights that pave the way for more intuitive and efficient human-following robots, thereby marking a step forward in the integration of robotic systems into human-centric environments.
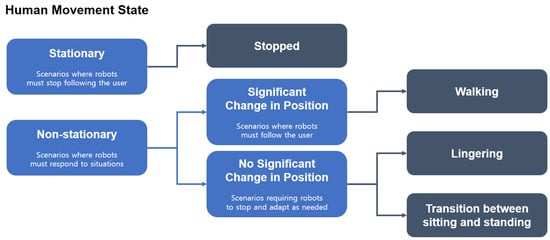
Figure 1.
Definition of human movement states.
2. Definition of Human Movement State
In prior research, the study of human movement typically focuses on the direction and speed of a person’s travel or on classifying a more diverse array of movements, including walking, jumping, jogging, lying down, standing, sitting, stair climbing, and falling. These studies are conducted to understand pedestrian gait states, to detect accidents such as falls during daily activities, and to quantify and define human movements for applications in kinesiology, biomechanics, and biomedicine. Tools such as soft-robotic-stretch (SRS) sensors, video cameras, piezoelectric accelerometers, pyroelectric infrared (PIR) sensors, Mica2 sensors, and IMU sensors have been utilized for these purposes [34,35,36,37,38,39,40].
In contrast to these existing studies, this research focuses on the movements exhibited by users in a working environment when interacting with a human-following robot. In scenarios wherein a robot is following a person, especially a worker, uncommon movements such as jumping or lying down are beyond the scope of this research and thus not considered. Instead, this model is specialized for scenarios that are probable during work-related activities.
In this study, human movements are categorized into four principal categories for the purpose of robot detection. To categorize movements associated with human locomotion, three main classifications were initially identified: stationary states, movements resulting in a change in location, and movements without a significant change in location. In a human-following robot, it is essential for the robot to categorize human movements into stationary and non-stationary states. Furthermore, it is crucial to subdivide the non-stationary states of human movement into those involving significant positional changes and those that do not.
The necessity to classify human movements into stationary and non-stationary states arises from the inherent sensor inaccuracies present in real-world robotic applications. Sensors attached to both the robot and the human subject are prone to errors, which can lead to false interpretations of user motion; a stationary human may be perceived as moving due to these errors, increasing the likelihood of the robot malfunctioning. In the context of a worker-following robot, which often involves carrying heavy loads and closely trailing a user, the ability to accurately discern the user’s stationary and mobile states becomes crucial. If the robot were to respond to error values while the user is stationary, this could lead to accidents within the working environment. Therefore, it is important to ensure precise differentiation for the safety of operational environments [9].
The reason for distinguishing between non-stationary human states that involve a change in position and those that do not is as follows. In cases of movements involving significant positional changes, such as walking, it is crucial for the robot to classify these as situations where it should follow the human’s shifting location. For movements that do not result in significant positional changes, such as lingering or transitions between sitting and standing, the robot should recognize that alterations in sensor-detected distances do not necessitate adjustments in response to the human’s location changes.
In this study, movements that do not result in a significant change in location are categorized as lingering and transitions between sitting and standing. In scenarios whereby workers need to squat to access materials from the robot’s payload, it is important that the robot does not misconstrue this action as a change in the worker’s position, which would otherwise lead to the unnecessary movement of the robot, potentially complicating the worker’s task or even causing a collision risk. Additionally, in a working environment, workers are likely to take occasional brief pauses to manage tasks. If a worker-following robot were to respond to every instance of such lingering, it would decrease the robot’s operational efficiency and similarly elevate the risk of accidents. Hence, for both efficiency and safety in robotic operations, it is imperative that robots discern lingering and sitting/standing behaviors and respond appropriately to each [9].
Therefore, within the scope of this study, human movements are systematically classified into three broad categories: a stationary state, movements resulting in a change in location, and movements without a significant change in location. Under this classification scheme, a stopped state corresponds to a stationary state in this paper. A walking state corresponds to movements that result in a location change. A lingering state and sitting/standing state correspond to movements without significant location changes. Consequently, human movement within the context of this research is categorized into four distinct types: stopped, walking, lingering, and sitting/standing.
3. Human Walking Sequence Modeling
Prior to developing a model for the classification of human movement states, this research first sought to establish the validity of using UWB sensors for movement classification and to determine the optimal placement of sensors for the accurate assessment of human motion. In order to achieve this objective, this section focused on modeling the walking state, identified as the most complex and characteristic among the four defined movements. By abstracting the human walking sequence and comparing it with actual experimental data, efforts were made to pinpoint the sensor placement that best captured the intricacies of the walking pattern.
Considering the inherent error margin of approximately 10 centimeters in UWB sensors, this research conducted a series of experiments to identify the optimal leg position for sensor attachment [41]. When the sensors are positioned at the upper part of the leg, close to the waist, the variation between the legs during walking is minimal, making it difficult to discern the characteristics of the human gait due to the inherent measurement error of approximately 10 centimeters associated with UWB sensors. Therefore, placing UWB sensors in proximity to the waist region proved to be inappropriate to capture the characteristics of the human gait. Conversely, positioning the sensors too low, beneath the knee, resulted in an increase in measurement errors due to the proximity of the UWB sensors to the ground, which is a characteristic limitation of UWB sensors, thus complicating the acquisition of clean patterns [42]. Considering these factors, the sensors were affixed slightly above the knee, and it was experimentally observed that the gait patterns derived from the measured distances at this location were more distinct compared to previous trials.
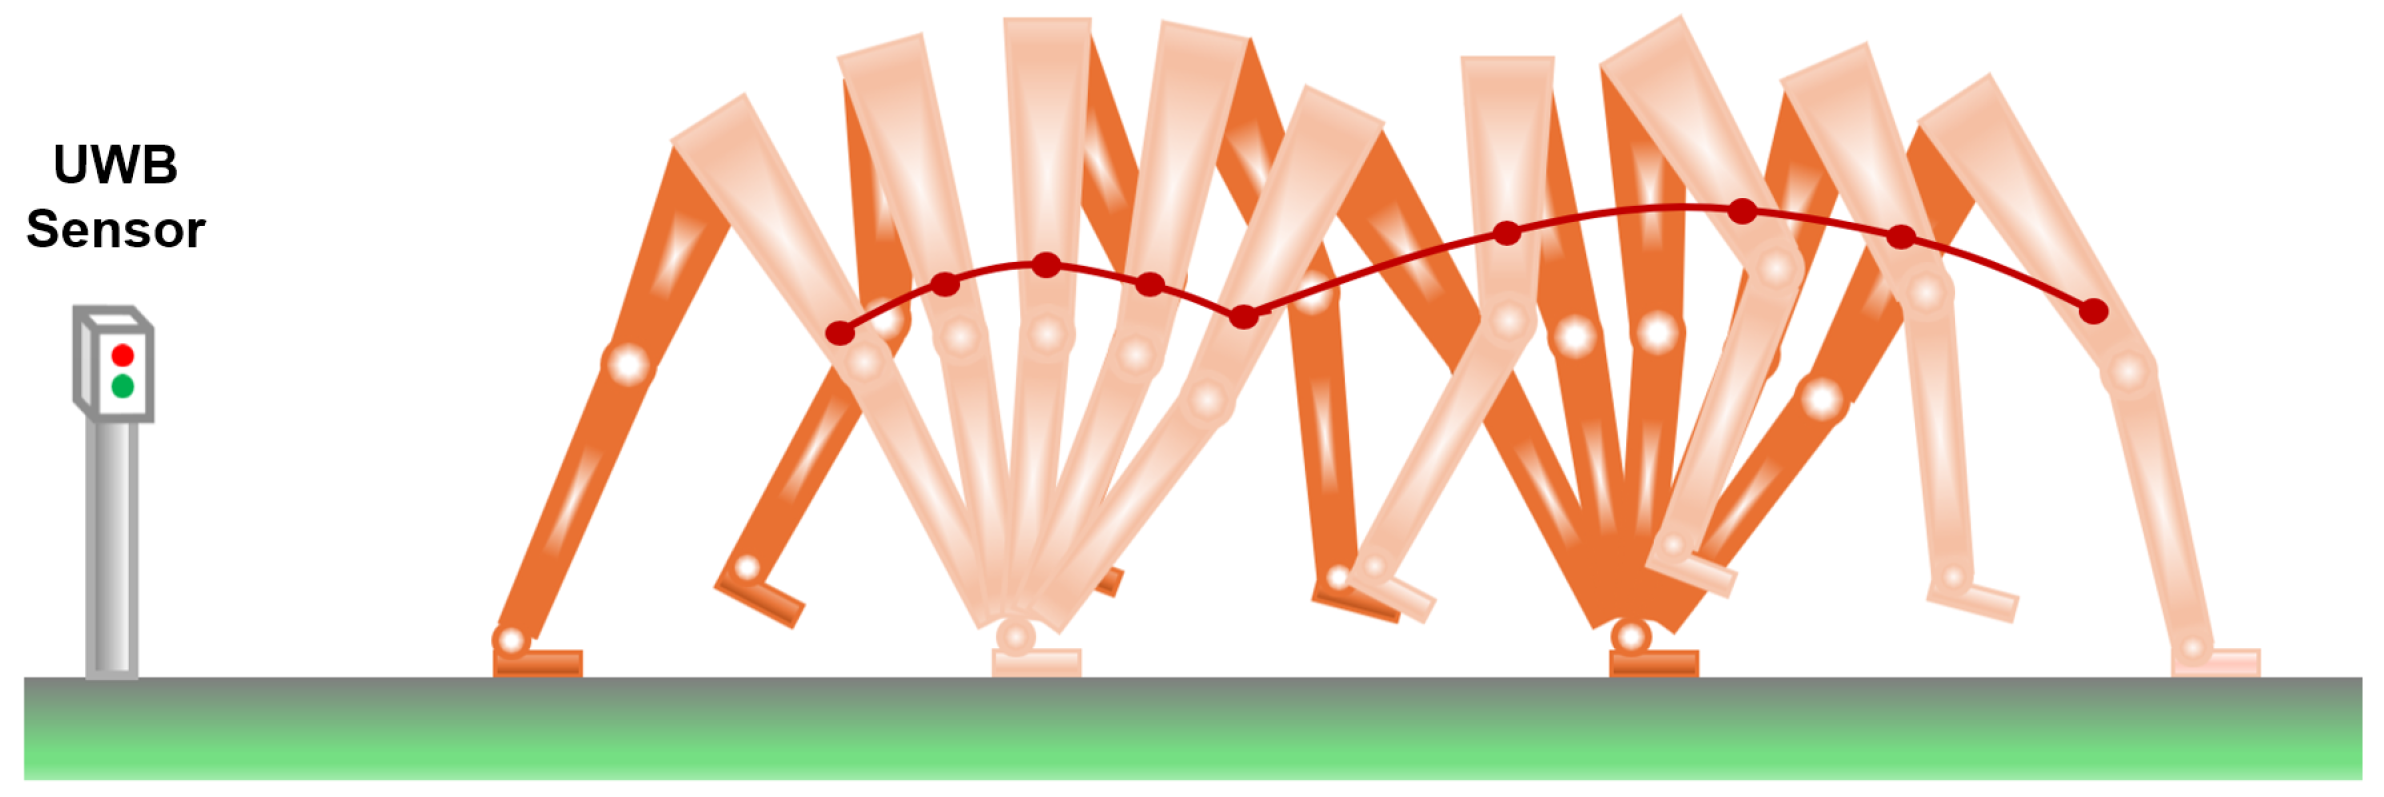
Therefore, to demonstrate that sensor placement slightly above the knee yielded clear and consistent gait patterns during walking, preliminary modeling was conducted to determine how the UWB sensor distance readings would manifest in ideal walking scenarios. For a visual representation, Figure 2 illustrates the trajectory of the sensors positioned directly above the knee during a human walking sequence. In Figure 2, the dark orange segment represents the left leg, while the light orange segment indicates the right leg. In the visualized patterns, it can be observed that, during the walking phase, the supporting leg maintains a straight alignment, largely unaffected by the movement of the knee joint. Concurrently, the hip point near the waist of the supporting leg serves as the pivot, enabling the opposite thigh to execute a circular motion, propelling forward. Considering these assumptions, the movement of the human legs during walking is represented by a combination of sine and cosine functions as follows.
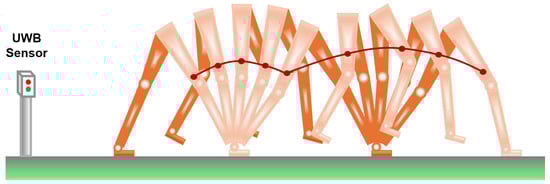
Figure 2.
Human walking sequence. The light orange area represents the right leg of the subject, while the dark orange area indicates the left leg. The red points denote specific points above the knees, highlighting the locations where the UWB sensors are attached on the legs. The red curved lines connecting these points illustrate the trajectory during walking.
Initially, the distance from the heel to a point slightly above the knee is defined as . Given the angle, , created by the supporting leg with the ground, the location directly above the knee can be depicted as , as detailed in Equation (1). The distance from this point to the waist is marked as . The position of the waist corresponds to Equation (2). Using these parameters, the position above the knee for the opposite leg can be denoted as . When the opposite thigh forms an angle, , with the ground, it aligns with Equation (3).
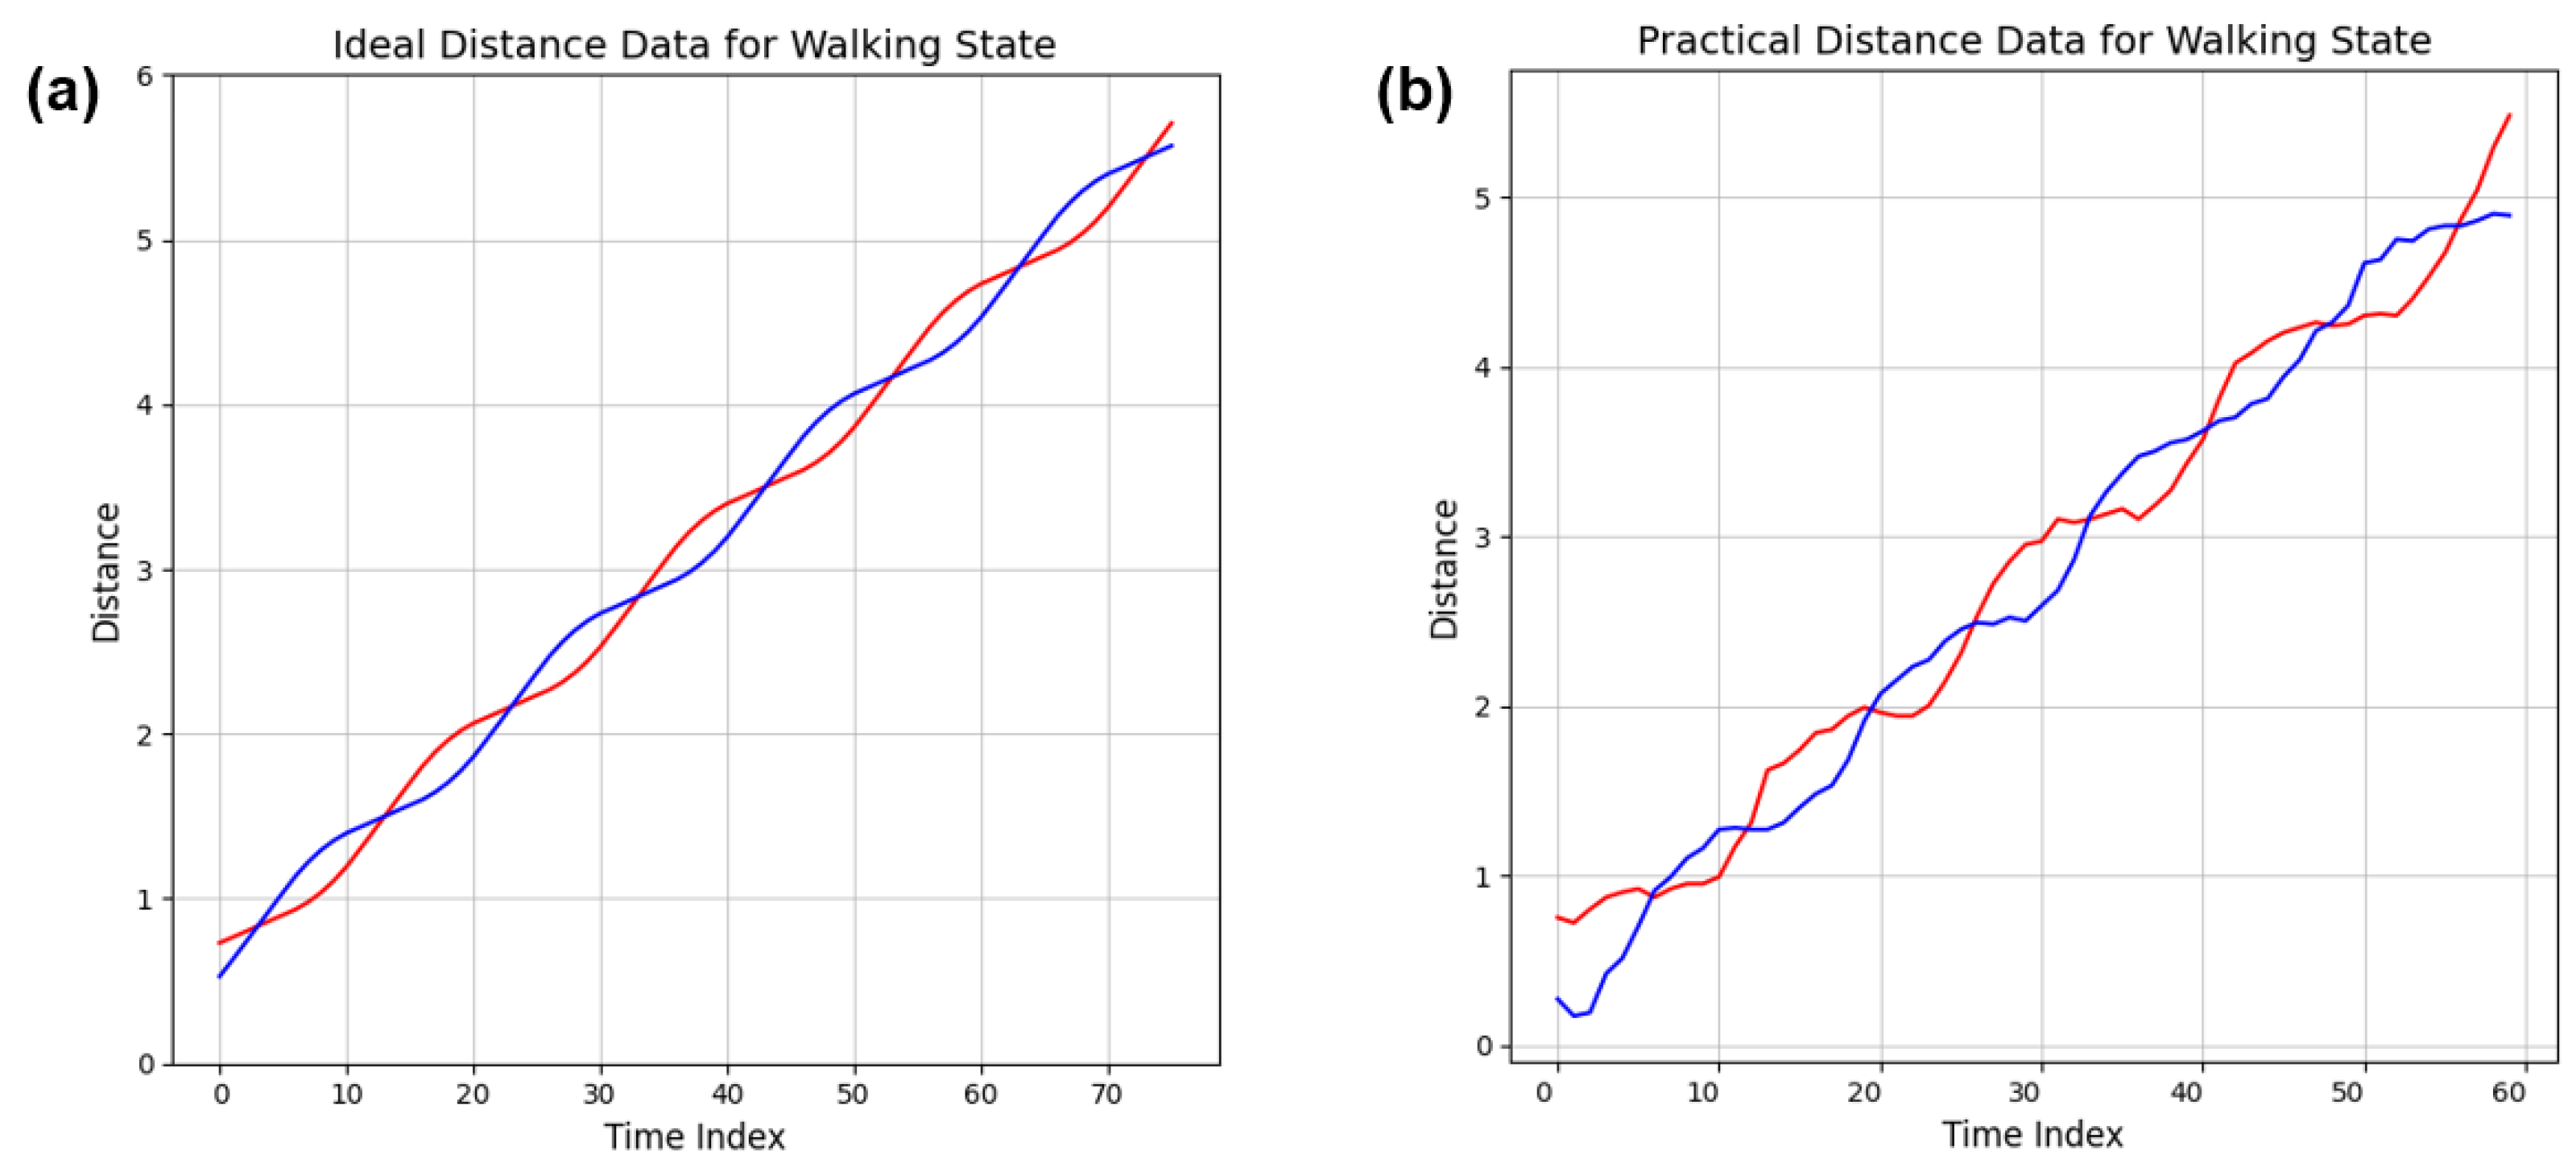
To compare the distance value data evident in the ideal walking pattern with the actual measured values, a simulation environment representing ideal conditions was conceptualized. To obtain a clean pattern, the values of and in the proposed equation were set to 0.5, analogous to the experimenter, and the maximum angle of leg separation during walking was established at 60 degrees. In the actual experimental environment, the distance from the robot’s UWB sensor to the UWB sensors on the person’s legs is measured. To reflect this, the simulation environment recorded the distances from the point (−2, 0.5) to the recurring patterns of and throughout the simulation. The specific point (−2, 0.5) was chosen in the simulation to mirror the actual experimental setup where the height of the UWB sensors on the robot’s legs from the ground was similar to the height of the UWB sensors on the experimenter’s legs from the ground. Consequently, in the simulation, the value and the y-coordinate of the specific point were set to be equal to maintain consistency with the experimental conditions. Furthermore, in actual situations, smoother transitions between both legs are expected to occur compared to the model constructed with the above equations. Therefore, a moving average was applied, as demonstrated in the ideal conditions represented in Figure 3.
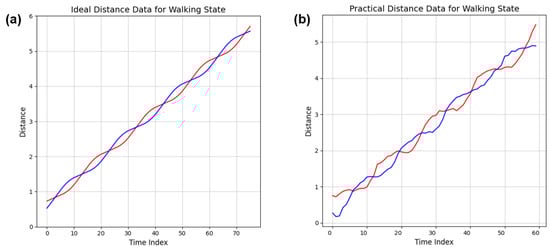
Figure 3.
Trajectories of distance values from a fixed point to both legs during a walking scenario. In the graph, the red line represents the right leg, while the blue line signifies the left leg. (a) modeled ideal conditions; (b) practically measured values.
Subsequently, an experiment was conducted to compare the ideal gait pattern with the practical pattern obtained from attaching UWB sensors to the legs. As observed in Figure 3, which displays the results of the experiment, the designed gait model closely mimics the actual walking pattern. This similarity suggests that when UWB sensors are attached slightly above the knees, they can effectively capture the characteristic crossing of the legs, thereby lending credibility to the use of UWB sensor measurements for the classification of complex gait patterns. This foundational understanding serves as the basis for the more in-depth analysis of human movement patterns in the subsequent sections of this paper.
4. Human Movement Pattern Analysis
In this study, user movements were classified into four distinct categories, stopped, walking, lingering, and sitting/standing, as per the definitions provided earlier. The analysis predominantly utilized distance measurements acquired from ultra-wideband (UWB) sensors attached to both legs of the human, which were used to calculate the distance to the robot.
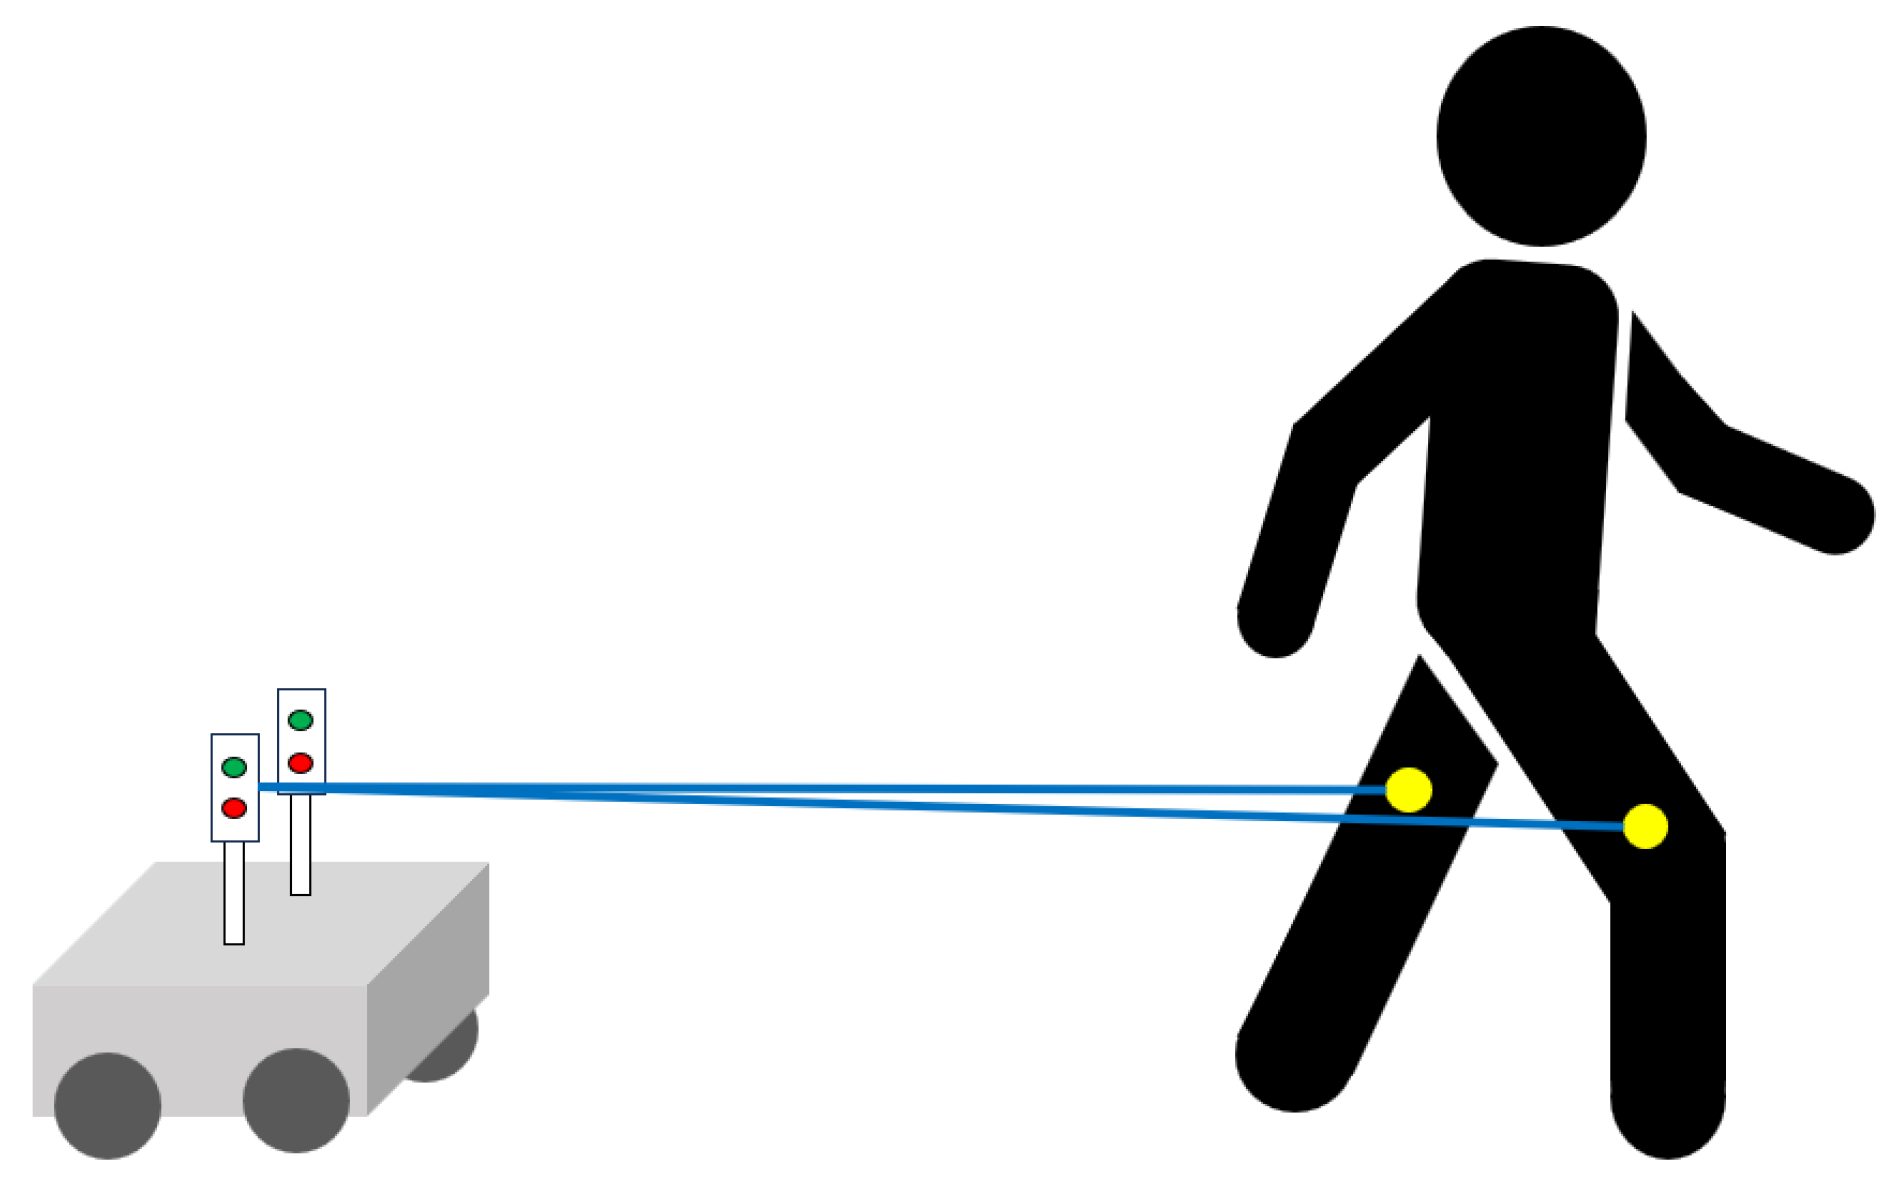
In Figure 4, a brief overview of the ultra-wideband (UWB) sensors employed in this study is provided prior to proceeding with the analysis. Two sensors were affixed to the robot, functioning as anchors, with the primary purpose of determining the user’s position through the process of bilateration. Although a single UWB sensor could suffice for position identification, two UWB sensors were attached to the user in this study. This configuration was chosen not only to precisely pinpoint the user’s location but also to leverage the movement data obtained from both legs, thereby accurately determining various user movements.
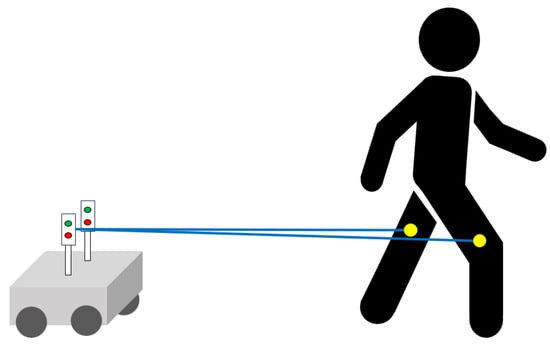
Figure 4.
Schematic of a human-following robot using two UWB sensors.
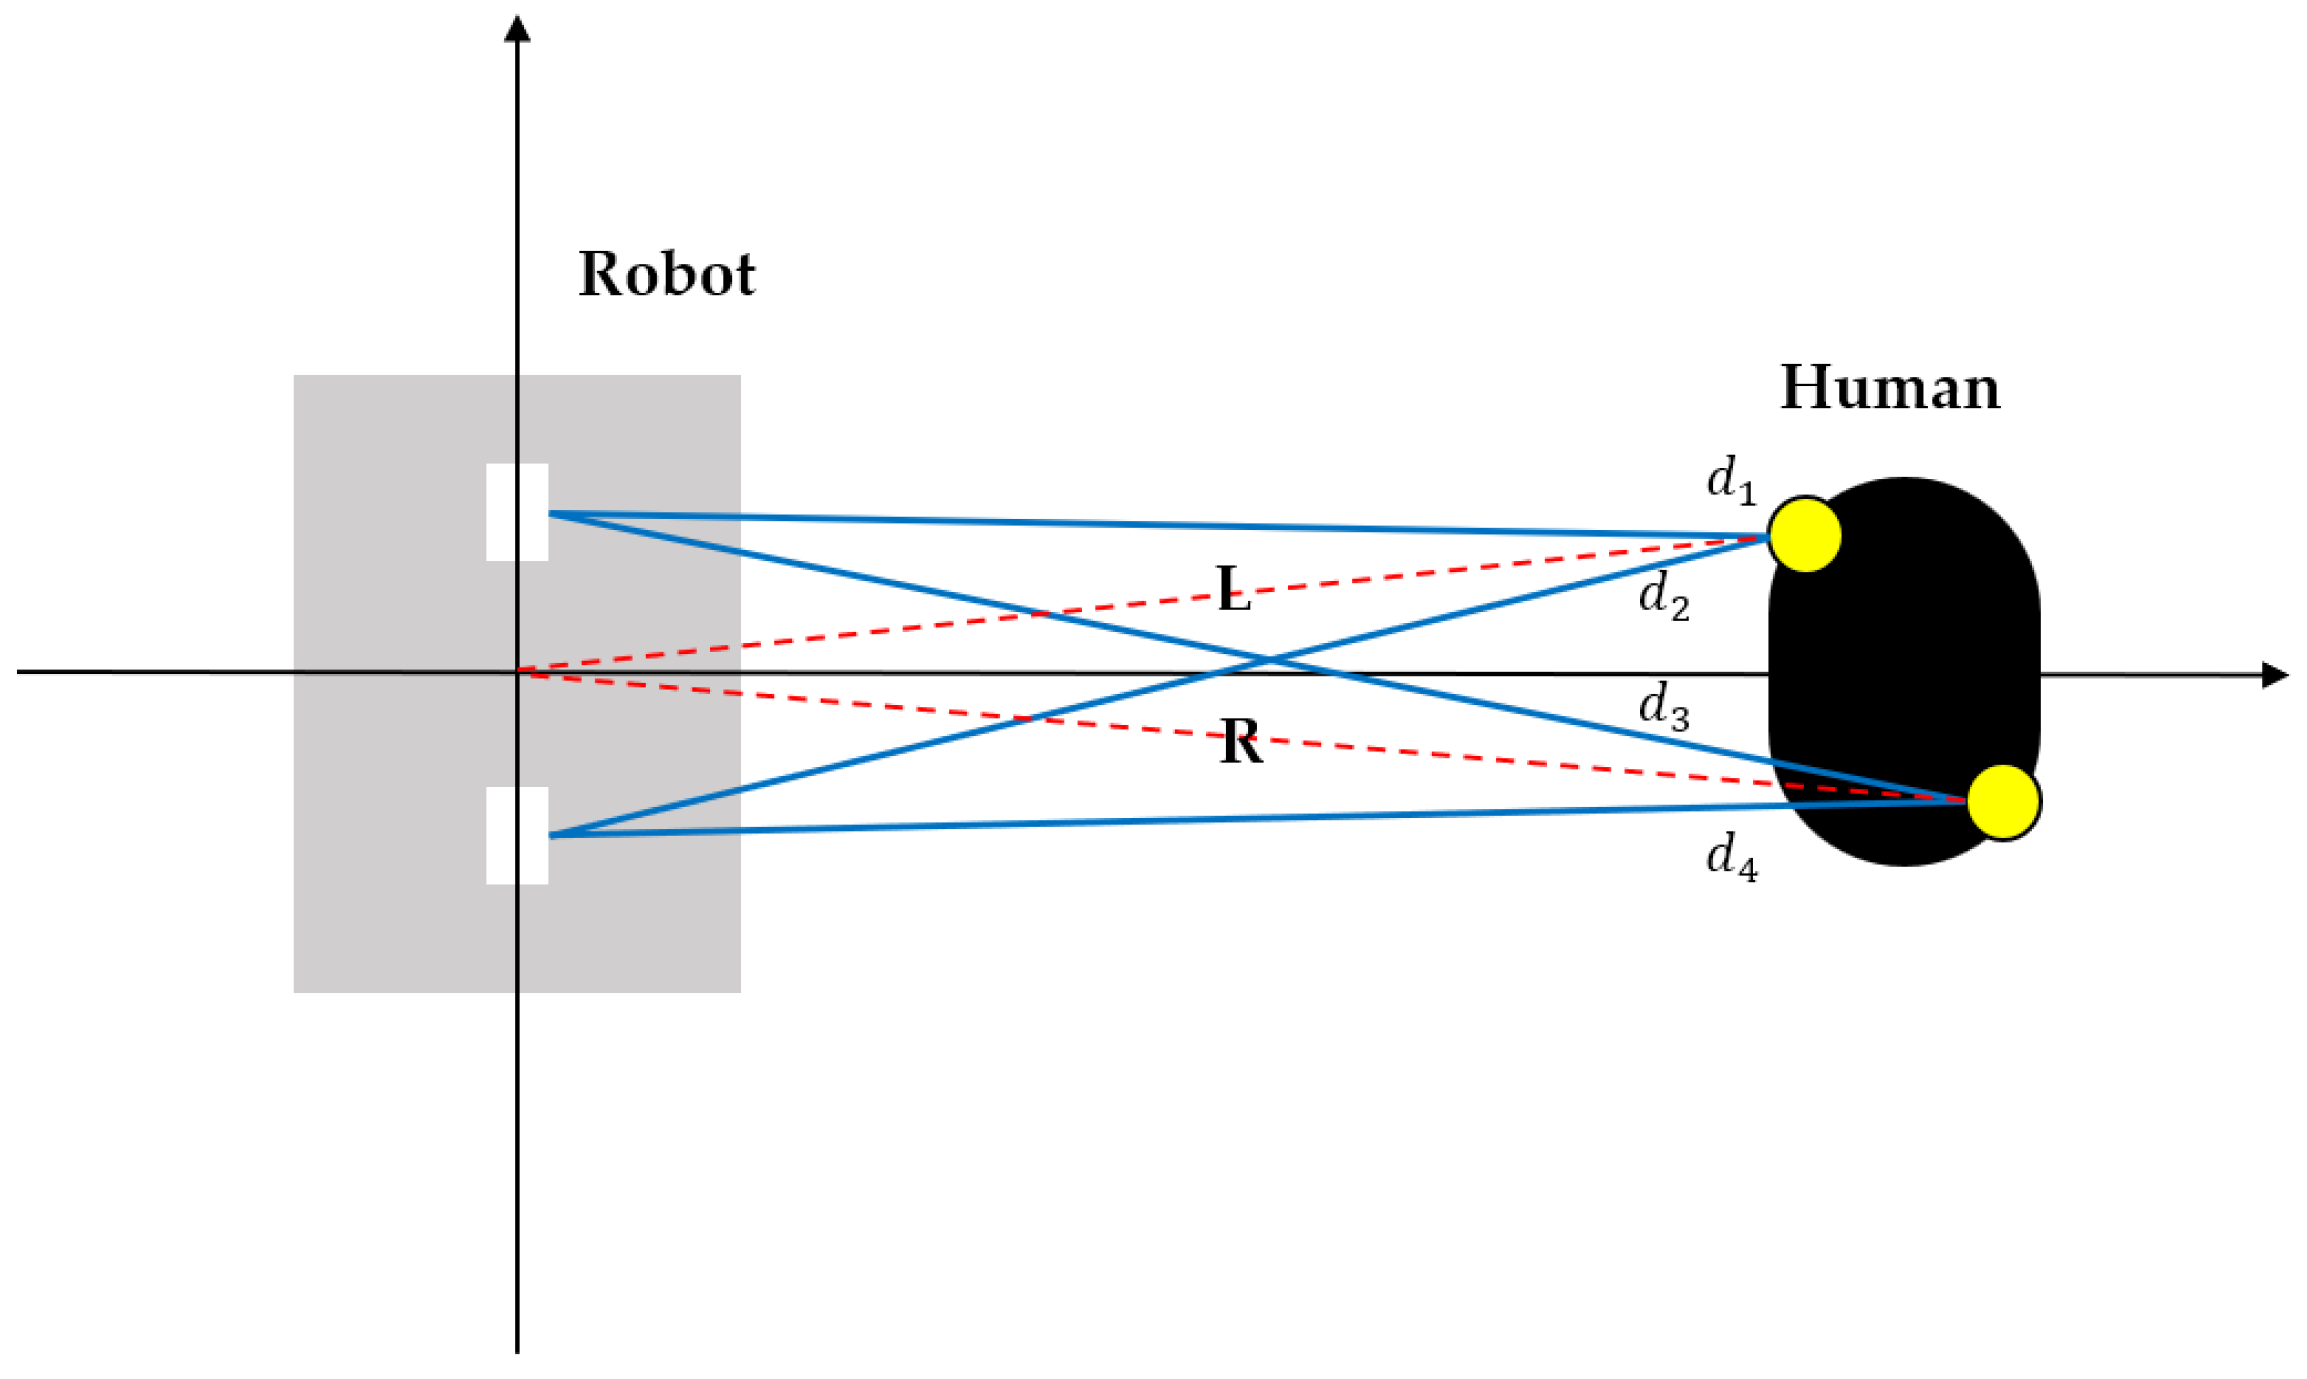
To implement this, the distance information of the two legs was represented as shown in Figure 5. If there are two UWB sensors on the robot and two on the person, a total of four distance values are generated. Among these values, the relevant distance is the one from the center of the robot to the user. Utilizing Stewart’s theorem [43], a well-known result in geometry, values L and R were derived as shown in Equation (4). Notably, the distance between the two UWB sensors on the robot was 0.6 m in the experiments.
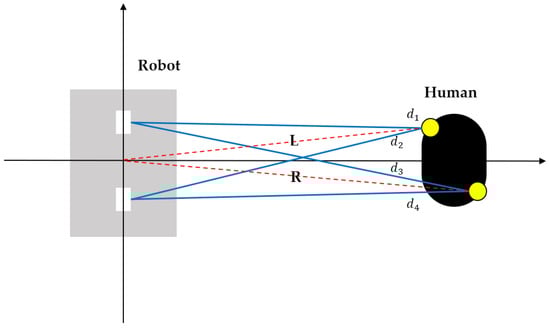
Figure 5.
Top view of human and robot.
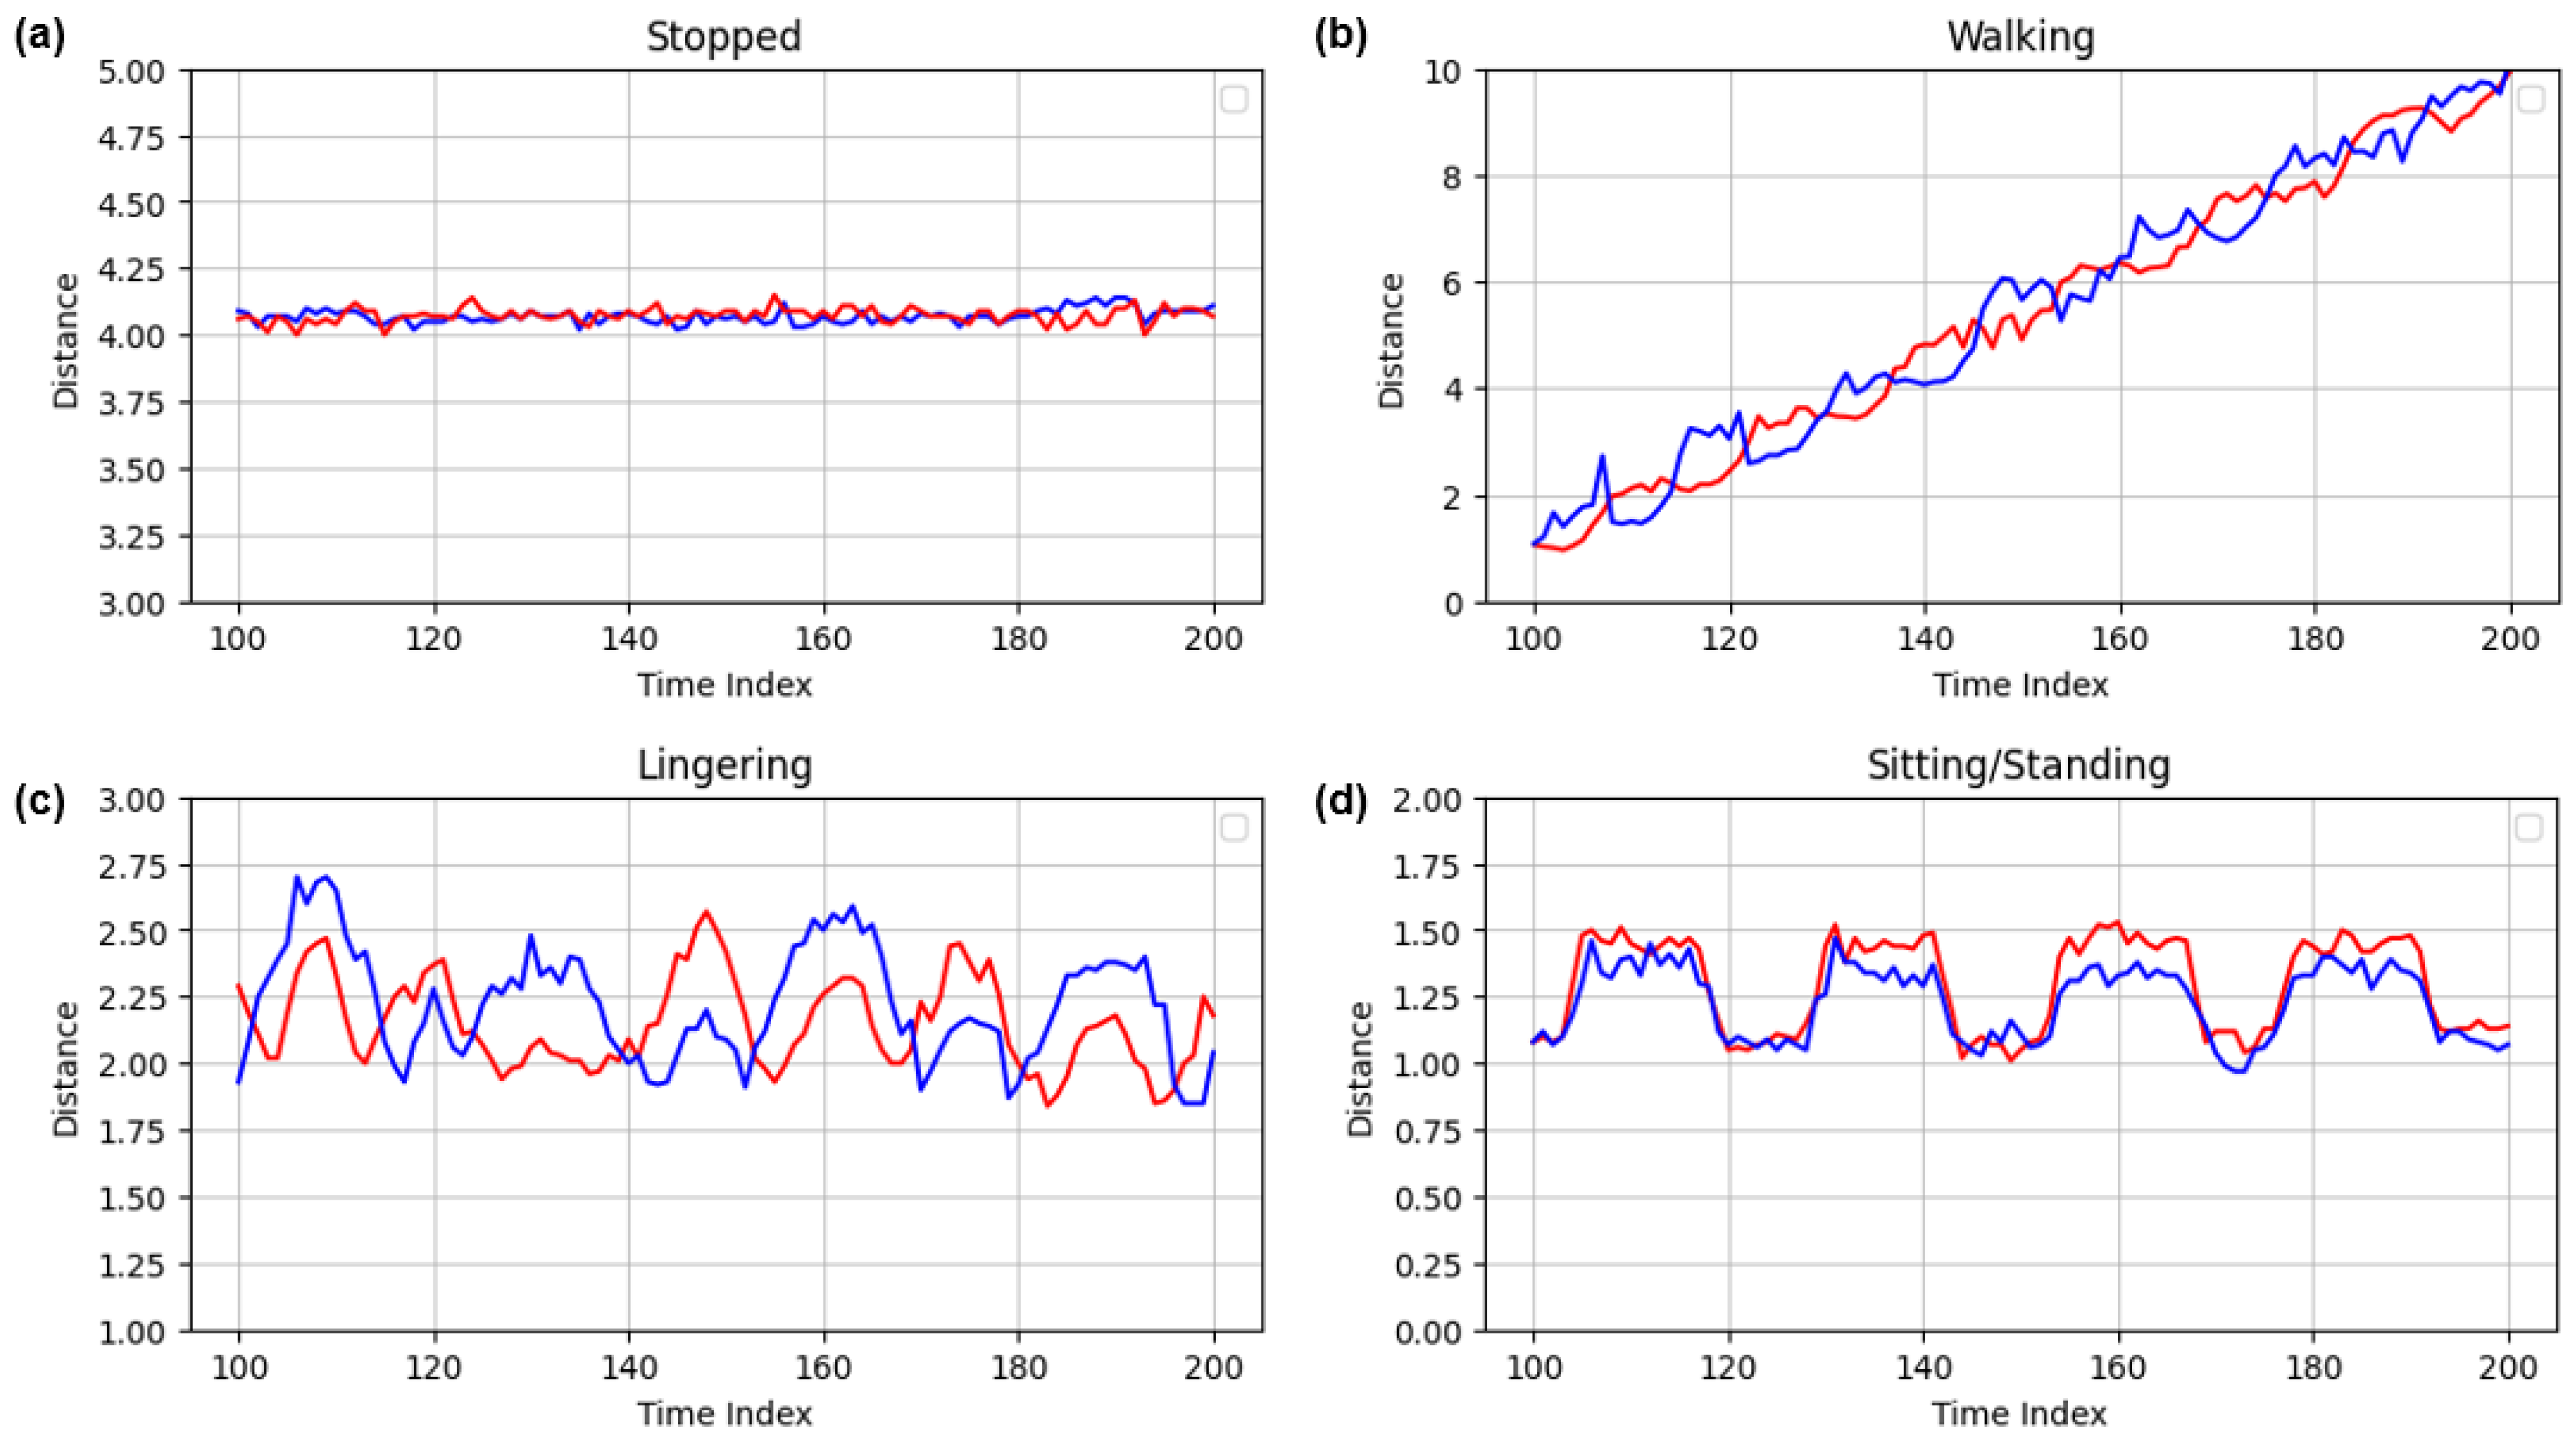
Utilizing the distance value L obtained from the left leg and the distance value R from the right leg, experiments were conducted for the four movement states previously defined. The experimental results are illustrated in Figure 6. Upon the detailed examination of the scenarios presented in Figure 6, a notable characteristic became apparent. In the walking scenario, the legs exhibited an alternating movement pattern with the distance values progressively increasing. In contrast, the other movement scenarios displayed synchronized motion of both legs, with the distance values exhibiting minimal fluctuations and remaining within a stable range.
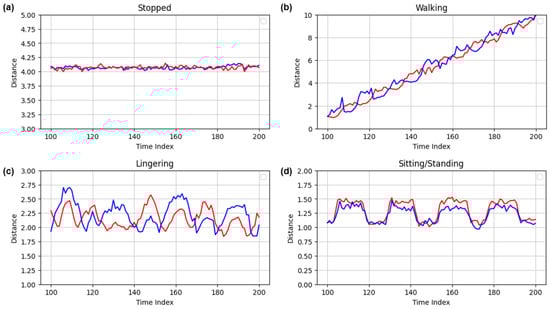
Figure 6.
Representative distance data for four types of human movement. In the graph, the red line represents the right leg, while the blue line signifies the left leg. (a) distance fluctuations recorded while the subject remains stationary; (b) distance changes measured between the legs while walking; (c) variations in the distance between the legs when the subject is lingering in place; (d) distance alterations observed between the legs during repeated transitions from sitting to standing.
This observation highlights a clear relationship between the legs’ movement patterns and their distance values from a specific point. Utilizing this relationship allows for the precise identification of the user’s activity. To enhance the visibility of these distinctive characteristics and to extract meaningful features from each movement pattern, a series of data processing steps were employed.
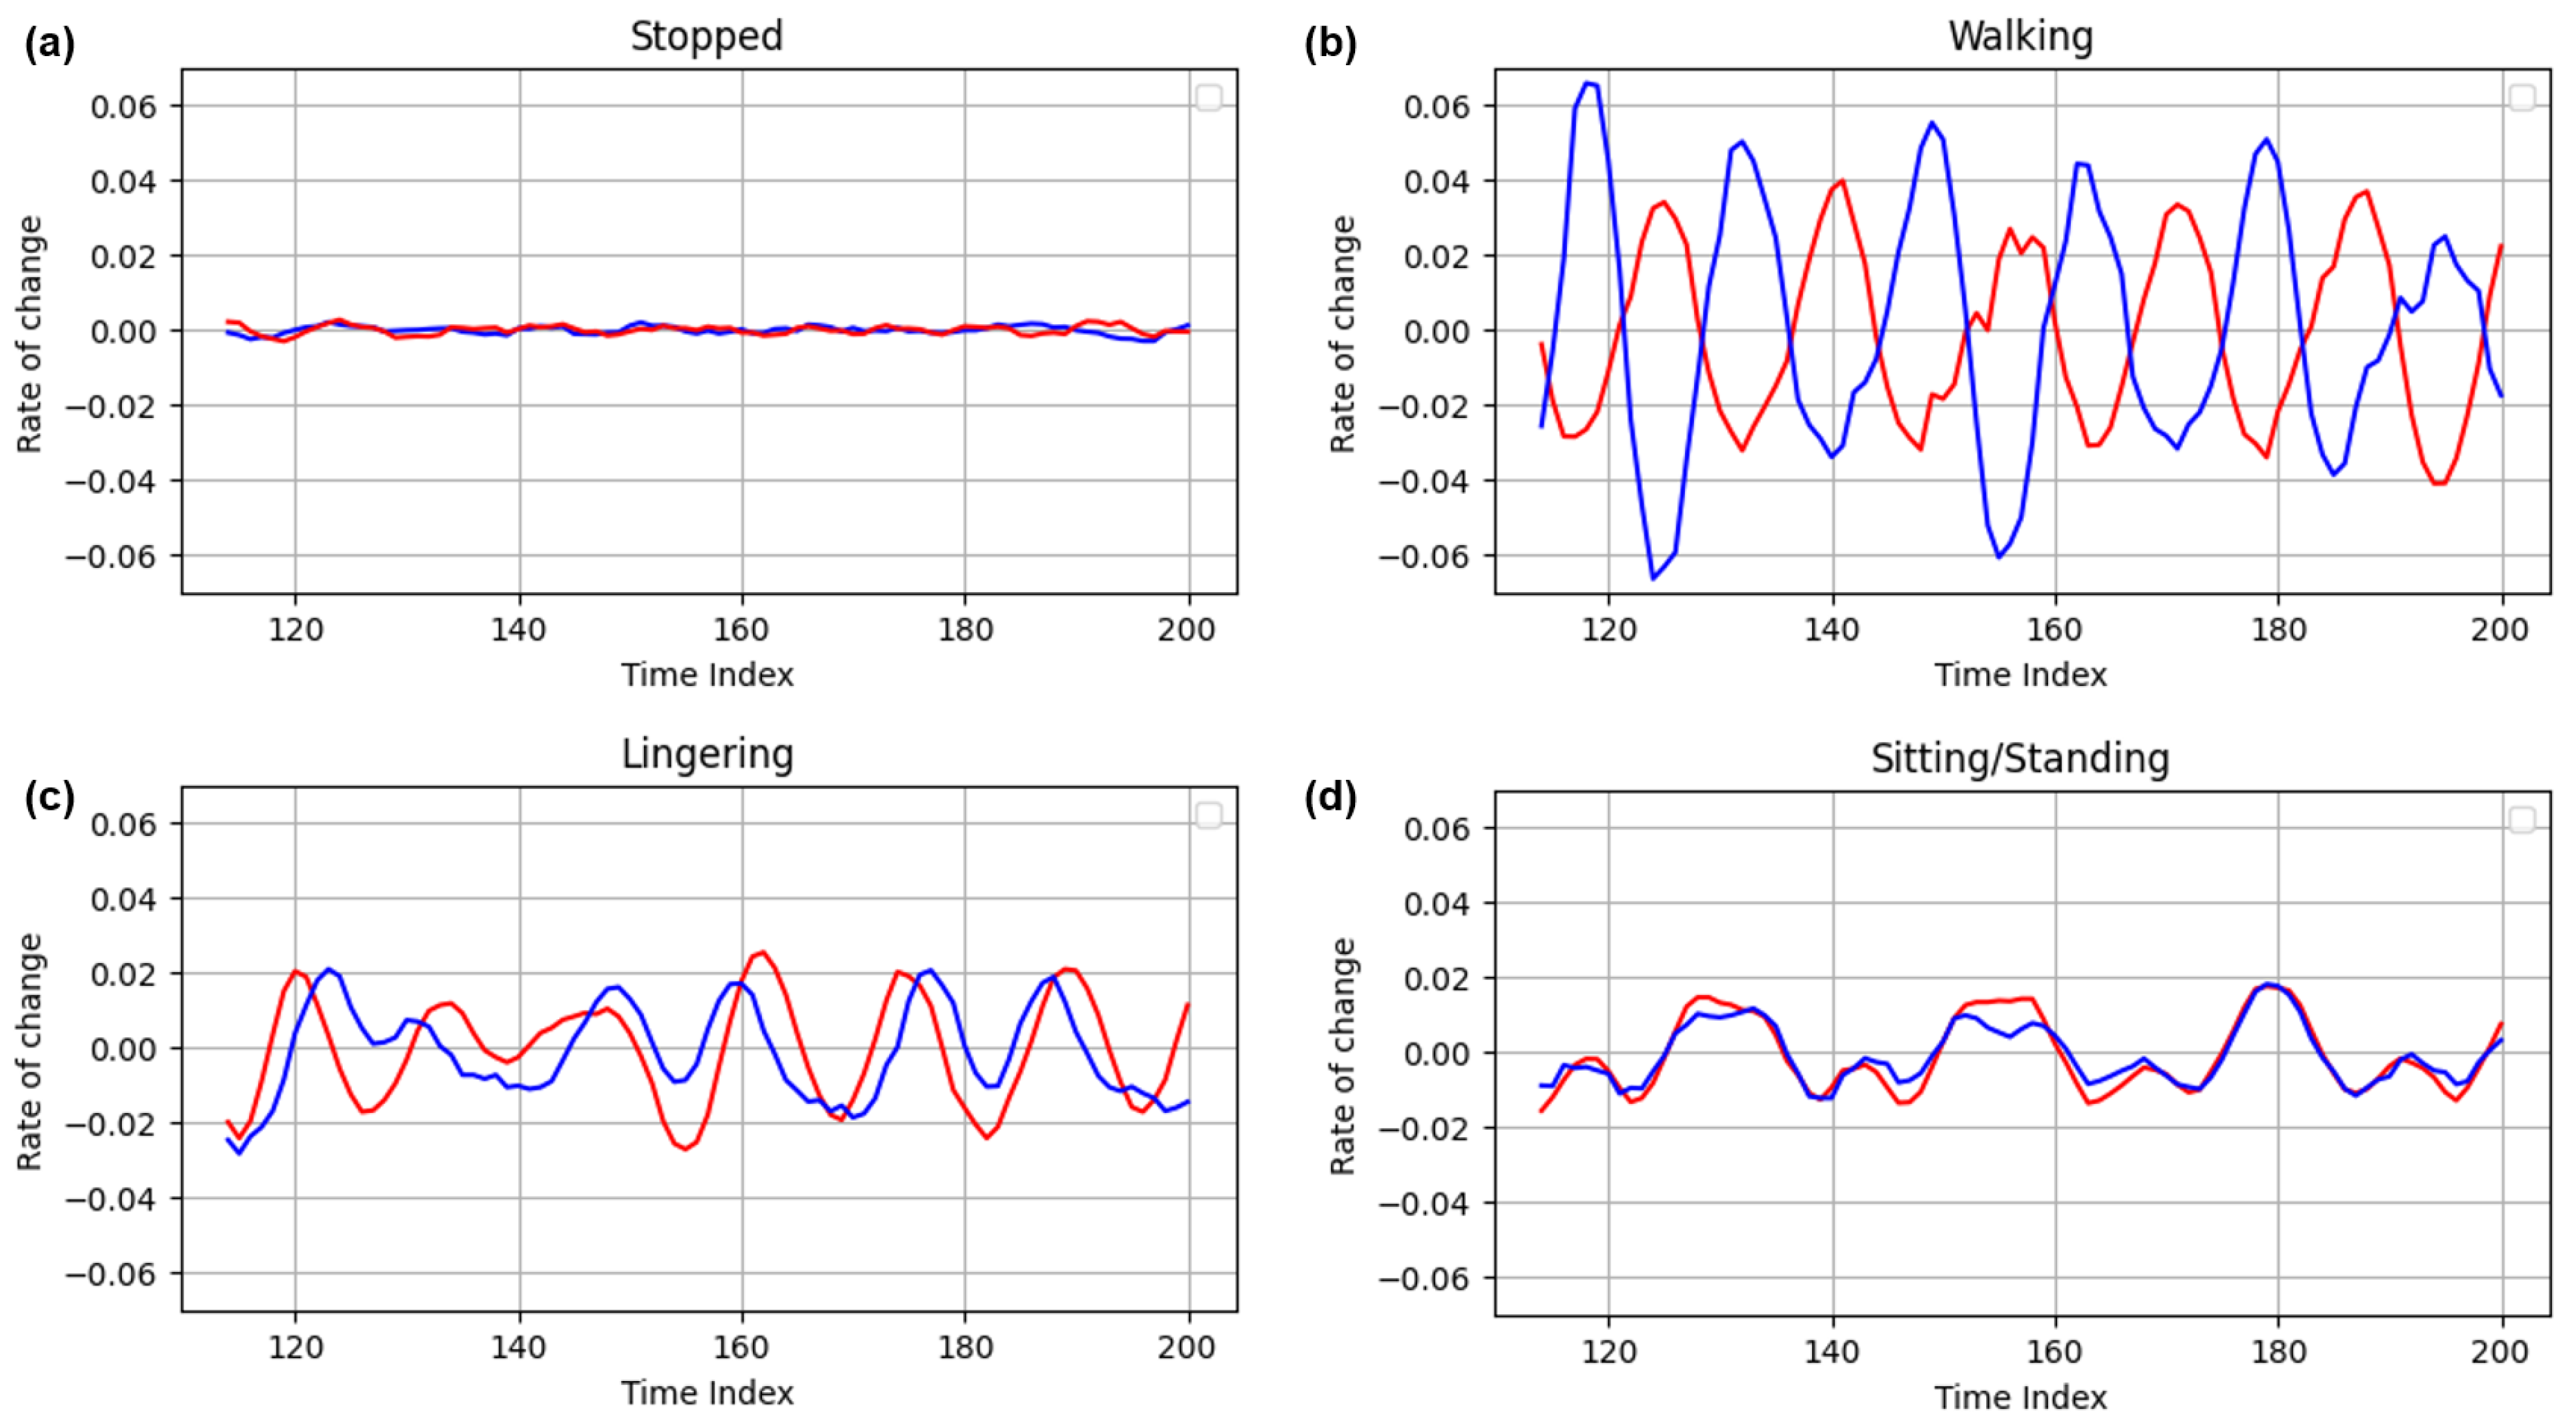
Initially, the raw data underwent a smoothing process via a moving average technique, which helped to reduce the inherent measurement errors of the UWB sensors. This was followed by first-order differentiation to highlight the rate of change in the distance values. Another round of moving average smoothing was applied to refine the data further. Subsequently, second-order differentiation was conducted to calculate the acceleration values, providing insights into the rapidity of movement changes. To emphasize the variations in movement patterns, these acceleration values were once again smoothed using a moving average. These processing steps led to the distinct separation of the various movement patterns, as illustrated in Figure 7. This enhanced clarity enables a more precise and insightful analysis of the user’s activities.

Figure 7.
Processed acceleration data for four distinct movement types. In the graph, the red line represents the right leg, while the blue line signifies the left leg. (a) smoothed acceleration changes while the subject is stationary; (b) smoothed acceleration data measured from the legs during walking; (c) smoothed acceleration fluctuations of the legs when the subject is lingering; (d) smoothed acceleration variations of the legs during repeated sitting-to-standing transitions.
Upon analyzing the acceleration data presented in Figure 7, significant characteristics are revealed. In the case of the walking movement, each leg operated autonomously, intersecting at specific instances. At these intersection points, the velocity of the supporting leg was reduced to a minimum, while the opposing leg simultaneously achieved its maximum velocity. As a result, the acceleration values approached zero at these intersection points. Additionally, due to the distinct movement patterns exhibited by each leg, their acceleration values tended to progress in opposite directions. This characteristic uniquely distinguished the walking state from other types of movement.
Conversely, during the lingering and sitting/standing states, the movement patterns generated by each leg exhibit pronounced similarities to one another. This resulted in the acceleration values following a parallel trajectory rather than diverging. The recognition and utilization of these observed differences in movement patterns played a crucial role in accurately classifying each specific type of movement state in subsequent analyses.
5. Human Moving Pattern Classification Method
In this section, the methodology used to classify individual states based on the previously established human movement state is presented, utilizing distance measurements taken by the robot from both legs of the user. This paper leverages a tree-structured algorithm, as defined in Figure 1, categorizing human movements efficiently in a CPU environment without the necessity for pattern classification methods such as deep learning. When classifying user movements using computer vision methods with deep learning, models such as VGG-16, ResNet-50, and GoogleNet are employed, which require the use of approximately 138 million, 25 million, and 7 million parameters, respectively, leading to considerable computational demands [44,45,46]. Contrastingly, the tree-structured algorithm proposed in this study is designed for computational efficiency, requiring fewer than 100 computations to effectively categorize human movements. This marked difference highlights the superior efficiency of our approach over deep learning methodologies, which rely on millions of parameters and extensive training periods.
As depicted in Figure 8, the initial step in this methodology is to ascertain whether the individual is moving or stopped. This differentiation is crucial as it not only enhances the operational efficiency of the robot but also presents clear demarcation from other movement patterns, justifying its placement at the top of the priority list. Following this, the walking state, which significantly influences changes in the user’s position, is identified and segregated. This is crucial because, in the case of a human-following robot, there must be a responsive system to detect changes in a person’s position and subsequently follow them, provided that they are not in a stationary state. Subsequent classifications are made for movements such as lingering and sitting/standing, which contribute to an enhanced user experience and increased stability in the robot’s operations. A variety of methods, including velocity and acceleration value comparisons, Fourier transformations, cosine similarity measures, and gradient change observations, are employed for these classifications.
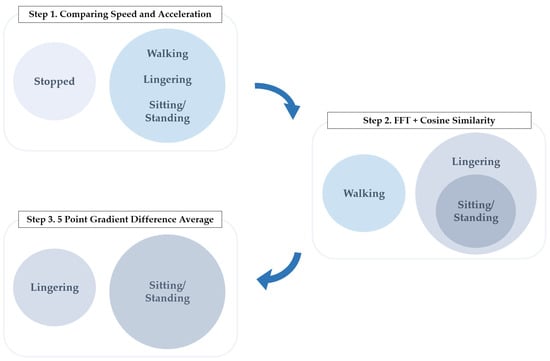
Figure 8.
Steps for classification of 4 human movement states.
Additionally, the rationale behind dividing the classification modeling process into three distinct steps is rooted in performance considerations. Specifically, if the Fourier transformation, utilized in Step 2, were to be employed as the sole method for the differentiation of all movement types, certain classifications would become challenging. For instance, the walking state can be identified due to the independent movement of each leg, resulting in crossing patterns in the distance value graphs of the legs, as previously explained. However, other states, such as stopped, sitting/standing, and lingering, are more difficult to distinguish using this method alone, as these involve less independent leg movements and more similar motion patterns. Similarly, if only the gradient difference comparison method used in Step 3 were to be applied, the stopped and sitting/standing states, wherein both legs move or remain still together, would show gradient differences close to zero. In contrast, walking and lingering, where the legs move independently, would exhibit larger gradient differences, making it challenging to accurately classify all four states using this method alone. Therefore, this paper initially proposes a basic model that classifies movements according to a tree structure in three steps. Subsequently, to further enhance the performance, an enhanced method is introduced. As a reference, the UWB sensor values are refreshed every 0.2 s. The velocity and acceleration values referenced herein are derived from the simple subtraction of consecutive sensor readings, without division by 0.2 s.
5.1. Step 1—Method to Distinguish between Stopped and Non-Stopped States
To accurately determine whether the current user’s state is stopped or non-stopped, it is imperative to comprehend the characteristics of the UWB sensor. The UWB sensor exhibits a distance measurement error of ±0.1 m. Consequently, even when a user is stationary, the sensor’s margin of error may cause it to mistakenly interpret the user as being in motion, potentially leading the robot to act in a manner that does not align with the user’s intentions.
Theoretically, a stationary user could exhibit a velocity of up to 0.1 − (−0.1) = 0.2 and acceleration of 0.2 − (−0.2) = 0.4 due to this sensor error. However, empirical tests with the UWB sensor attached to a person’s body demonstrated that the velocity magnitude seldom surpasses 0.02 when in a stopped state, and the acceleration magnitude consistently stays below 0.004. These findings indicate that the sensor error does not abruptly oscillate between its minimum and maximum values. Rather, it progressively increases or decreases, providing the rationale for the observed data and ensuring reliability in distinguishing between stopped and non-stopped states.
Given these observations, a velocity threshold of 0.02 and an acceleration threshold of 0.004 were set to distinguish between the stopped and non-stopped states. These thresholds effectively encompass all instances of the stopped state while ensuring that other movement states do not breach these boundaries. Within these thresholds, both velocity and acceleration tend to converge towards 0. For other movement states, such as walking, lingering, and sitting and stopping, the values consistently fall outside these thresholds. In all conditions except the stopped state, when the velocity approaches zero, acceleration takes on positive or negative values outside the established threshold. Conversely, if the acceleration approaches zero, the velocity exhibits positive or negative values outside the established threshold. Therefore, only in the stopped state do both the velocity and acceleration values appear within the established threshold limits.
5.2. Step 2—Method to Distinguish between Walking and Non-Walking States
To effectively distinguish between walking, lingering, and the states of sitting/standing, it is crucial to comprehend the characteristic patterns of the walking state manifested in repetitive waves. Figure 6 and Figure 7 provide clarity on this issue, illustrating the patterns of the distance values and smoothed acceleration values, respectively.
In the instance of walking, there is continuous movement as each leg alternates, leading to persistent changes in the user’s position. Analyzing the acceleration data reveals a fascinating pattern: the acceleration graphs for each leg consistently intersect, moving in opposite directions. This phenomenon, where the graph of one leg moves inversely to the other, can be aptly described as demonstrating reduced similarity between the graphs.
Conversely, during lingering, there is not any distinct or systematic pattern. Rather, the motion exhibits a degree of randomness. Upon closely examining the acceleration values for both legs, it becomes apparent that the movement patterns do not follow exact opposite directions. Instead, the patterns of movement seem to be mirrored, creating an impression of one leg appearing to chase the other.
For sitting/standing activities, distance values provide key insights. When a user sits, the UWB sensor’s relative distance increases sharply. Similarly, when the user stands up, there is a marked decline in the distance value. The simultaneous movement of both legs, as they fold during sitting or extend during standing, results in high similarity between the acceleration graphs of the two legs.
Based on the observed patterns, the similarity of the smoothed acceleration graphs generated by each leg serves as a classification tool. Lower similarity between the graphs of both legs suggests a walking state, while higher similarity indicates a lingering state or a sitting/standing state. To quantify the similarity between these graphs, the acceleration values over a specific period underwent decomposition into periodic components through the application of the Discrete Fourier Transform (DFT), as expressed in Equation (6). Cosine similarity was then applied to these components for comparison. Considering the need for real-time application, the Fast Fourier Transform (FFT) was chosen instead of the conventional Discrete Fourier Transform (DFT). The components obtained from the FFT for each graph were subsequently used to calculate the cosine similarity, as outlined in Equation (9). It is important to note that the similarity values range from −1 to 1, where a value closer to −1 indicates low similarity (characteristic of walking), and values near +1 denote high similarity, aligning with other types of movement.
Based on the observed patterns, the similarity of the smoothed acceleration graphs generated by each leg serves as a classification tool. Lower similarity between the graphs of both legs suggests a walking state, while higher similarity indicates a lingering state or a sitting/standing state. To quantify the similarity between these graphs, the acceleration values over a specific period underwent decomposition into periodic components through the application of the Fourier Transform (FT):
In this study, due to the discrete nature of the sensor values, the Discrete Fourier Transform (DFT) was specifically utilized:
Considering the need for real-time application, the Fast Fourier Transform (FFT) was chosen instead of the conventional Discrete Fourier Transform (DFT):
The components obtained from the FFT for each graph were subsequently used to calculate the cosine similarity, as outlined in Equation (9). It is important to note that the similarity values range from −1 to 1, where a value closer to −1 indicates low similarity (characteristic of walking), and values near +1 denote high similarity, aligning with other types of movement.
5.3. Step 3—Method to Distinguish between Lingering and Sitting/Standing
To discern the scenarios of lingering and sitting/standing, the differential gradient of the acceleration values obtained from each leg was utilized. Relying solely on the FFT and cosine similarity methodologies depicted in Section 5.2 posed challenges in distinguishing between these two movement states due to their almost identical graphical representations, often yielding similarity values close to 1. Nevertheless, upon meticulous analysis, a distinct pattern emerged: during transitions into sitting or standing positions, the legs exhibited nearly synchronous movements, resulting in almost identical acceleration profiles. This distinctive pattern sharply differentiates it from the lingering scenario, providing a solid foundation for categorization.
For sitting/standing, any sudden increase or decrease in acceleration corresponds to the act of sitting or standing, respectively. During these actions, the acceleration graphs for both left and right legs show striking similarities, leading to a gradient difference close to zero. In contrast, the lingering scenario reveals noticeable gradient differences between two consecutive points. To enhance the reliability of this method, rather than considering only two points, an average gradient difference across five points was computed and utilized as a threshold for classification. For this analysis, let the coordinates of the left leg acceleration vector be denoted as and those of the right leg as . By formulating Equation (10), all possible gradients across these five points can be computed. The average of these values was termed as the 5-point gradient difference average in this study.
5.4. Enhanced Method for Human Moving Pattern Classification
In Step 2, by leveraging the FFT results, most of the data related to walking, lingering, and sitting/standing motions were effectively classified using cosine similarity. Furthermore, the approach used in Step 3, which compared the gradient difference in the acceleration data between lingering motion and sitting/standing motion, was effective for the majority of the data sets. However, despite the effectiveness of these methods, some specific data points were not precisely classified.
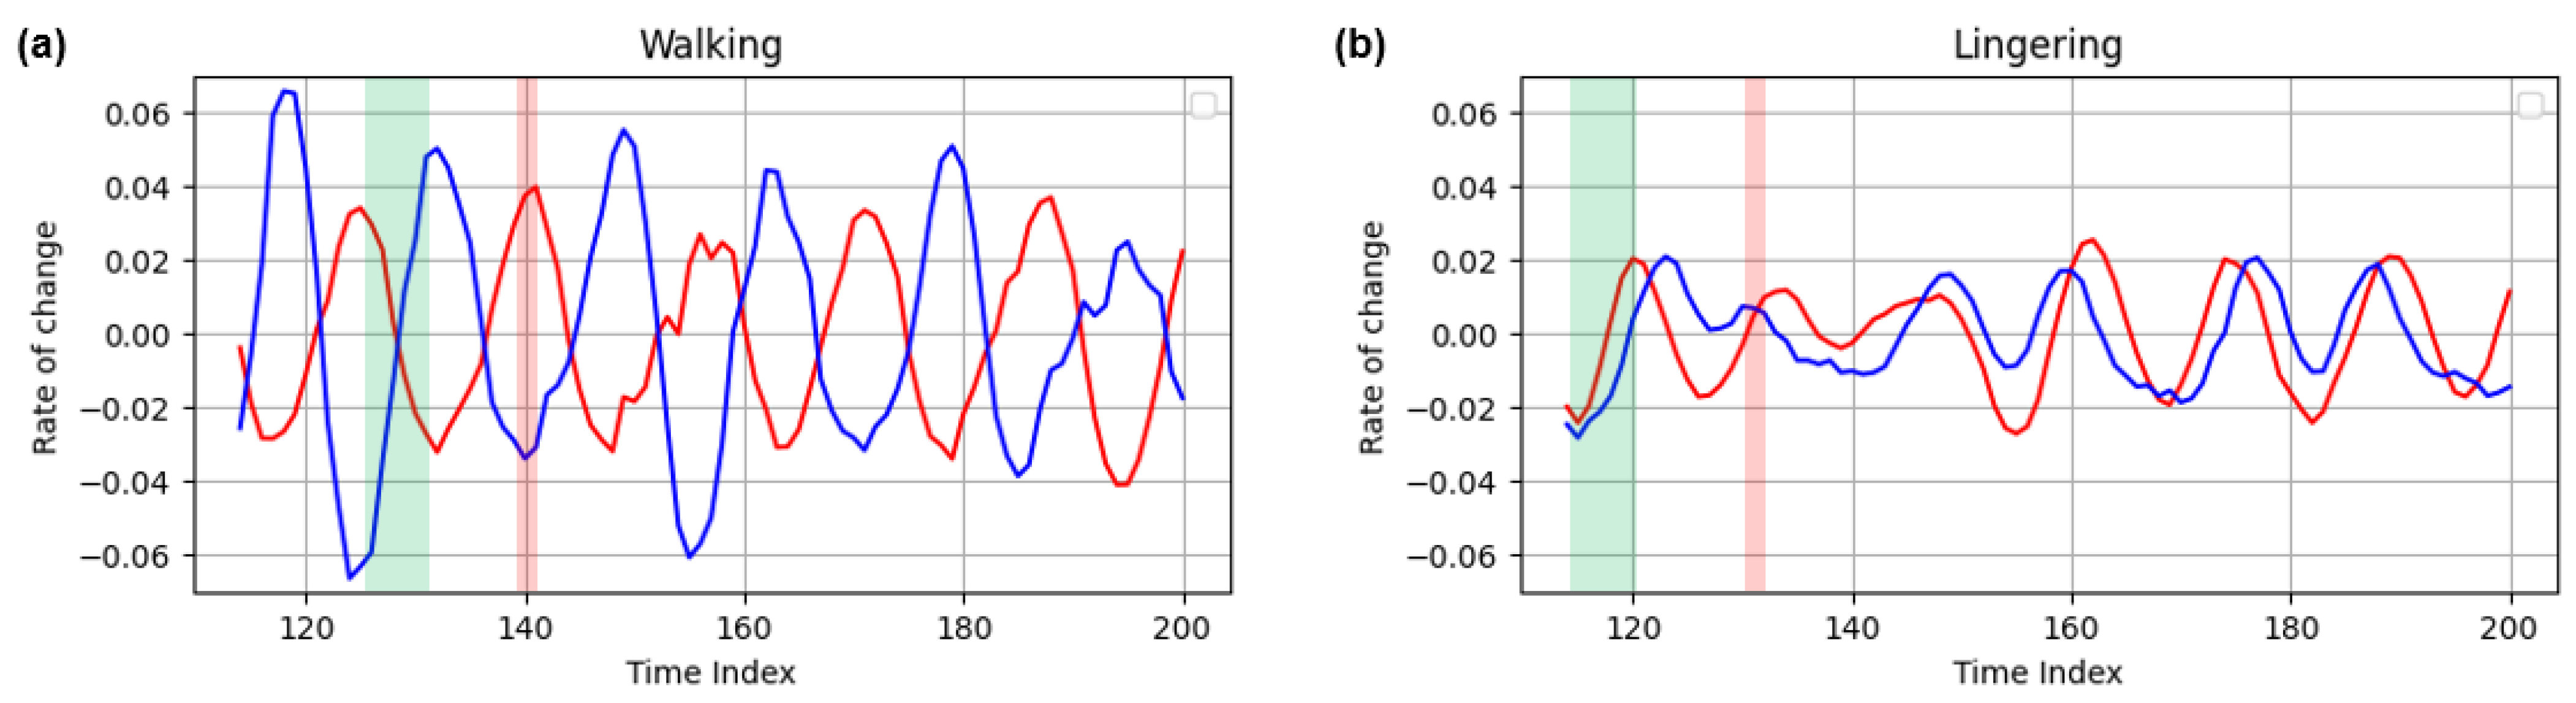
To elucidate the observed phenomena, Figure 9 is presented as an example. Figure 9 graphically depicts the acceleration values for both walking and lingering situations. In Figure 9, the green sections depict instances where the graph aligns with the intended pattern, while the red sections represent deviations from the expected trajectory. In the walking scenario, represented by the green regions, the graphs trend in opposing directions, leading to diminished similarity between the two graphs. Conversely, during lingering situations, the graphs derived from both legs adhere to a complementary pattern, exhibiting increased similarity. However, the red sections reveal anomalies. In walking scenarios, the gradient differences between consecutive points nearly converge to zero, enhancing their similarity. The lingering scenario, highlighted in the red region, diverges from its typical pattern, with the two graphs briefly intersecting, mimicking the walking pattern. This transient intersection arises because, during lingering, the patterns of the two legs momentarily shift, mirroring aspects of the walking pattern.
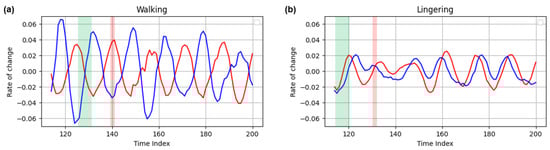
Figure 9.
Analysis of the observed anomalie. In the graph, the red line represents the right leg, while the blue line signifies the left leg. (a) examples of data acquired during walking, illustrating desired outcomes within the green box and undesired deviations within the red box; (b) instances of data captured while lingering, showing preferred directional results in the green box and non-preferred anomalies in the red box.
For this reason, while most scenarios manifest as intended, akin to the green region, there are sporadic occurrences of unintended situations resembling the red region. To address these inconsistencies, a straightforward and effective approach was implemented. While the majority of the data are classified correctly, transient misjudgments arise at specific points due to the inherent characteristics of human movement. In instances where making a decision at a particular point proves challenging, the system is designed to reference the immediately preceding data. It retains classification details from the last five instances, spanning a 1-s duration, and adopts the state most frequently identified during that interval. This method effectively manages such outlier scenarios.
6. Experiments and Results
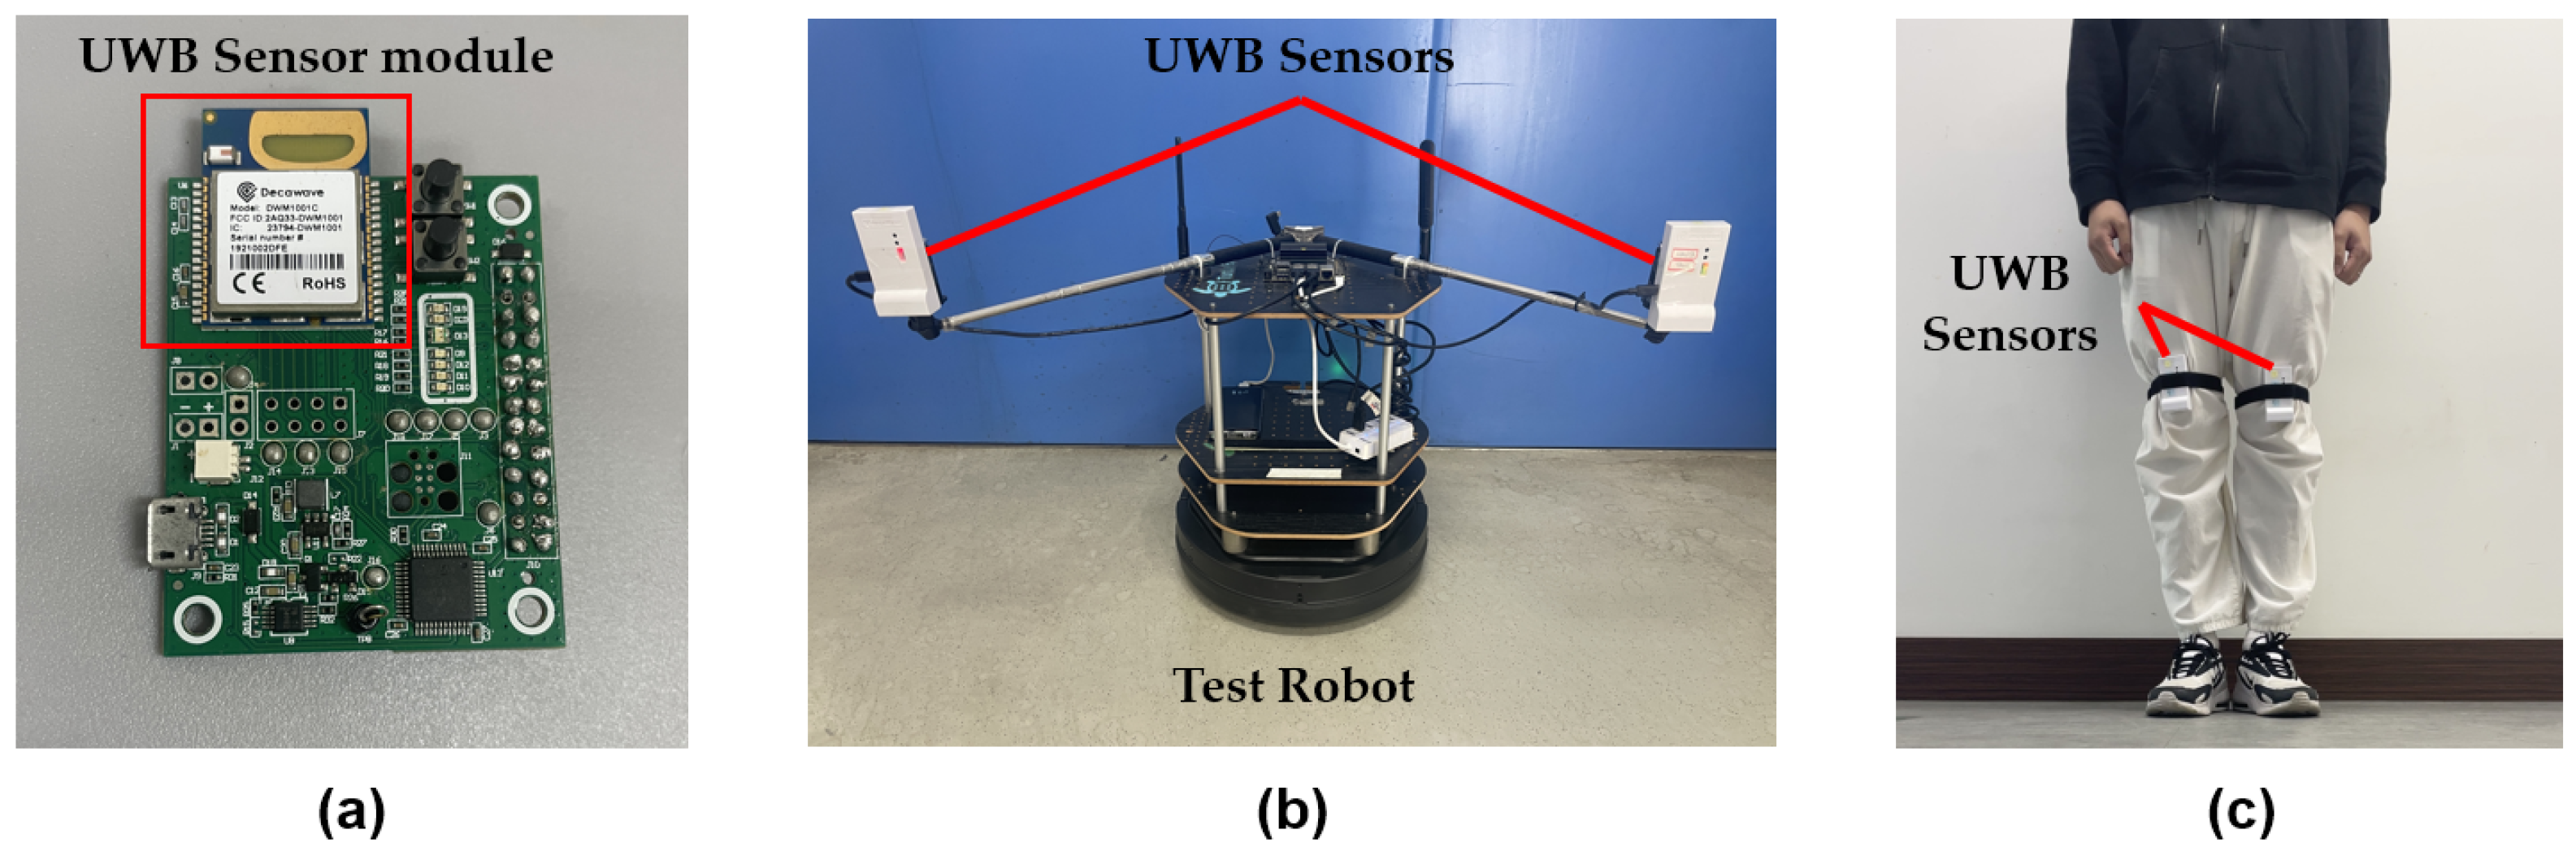
To evaluate the accuracy of the human moving pattern classification method proposed in this study, experiments were conducted across four distinct human movement scenarios: stopped, walking, lingering, and sitting/standing. Subsequently, after carrying out experiments for each of these scenarios, composite scenarios were designed and tested to demonstrate how the method discerned human actions in real-world situations. This involved setting up experiments that mimicked real-life conditions by combining elements from the initial four scenarios, thereby obtaining results that showcased the method’s effectiveness in accurately classifying human movements in complex and variable environments. Beginning with the experimental setup, Decawave’s ultra-wideband sensor was utilized. Specifically, as shown in Table 1, the model used wasDWM1001-DEV, boasting an operating frequency of 6.5 GHz and a detection frequency of 5 Hz, with sensor accuracy of ±10 cm [47].The equipment was sourced from Decawave, a part of Qorvo, from Dublin, Ireland. Two UWB sensors were mounted on the experimental robot at a distance of 60 cm apart. For human subjects, two sensors were affixed slightly above the knees on both legs, allowing for the acquisition of a total of four distance values from the robot to the person. To ensure the stability of the sensors’ positions on the legs during the experiments, they were securely fixed using velcro straps. The experimental setup can be seen in Figure 10.

Table 1.
Parameters and specifications of the UWB sensor and human movement.
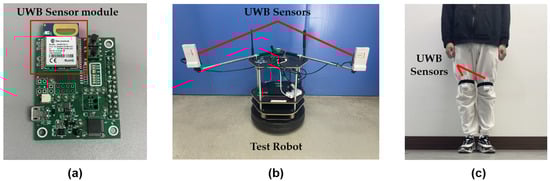
Figure 10.
Experimental setup with test robot and participant outfitted with UWB sensors: (a) the ultra-wideband (UWB) sensor module used for the experiment; (b) overall view of the autonomous robot equipped with UWB sensors; (c) participant’s legs fitted with UWB sensors in a real-world setting.
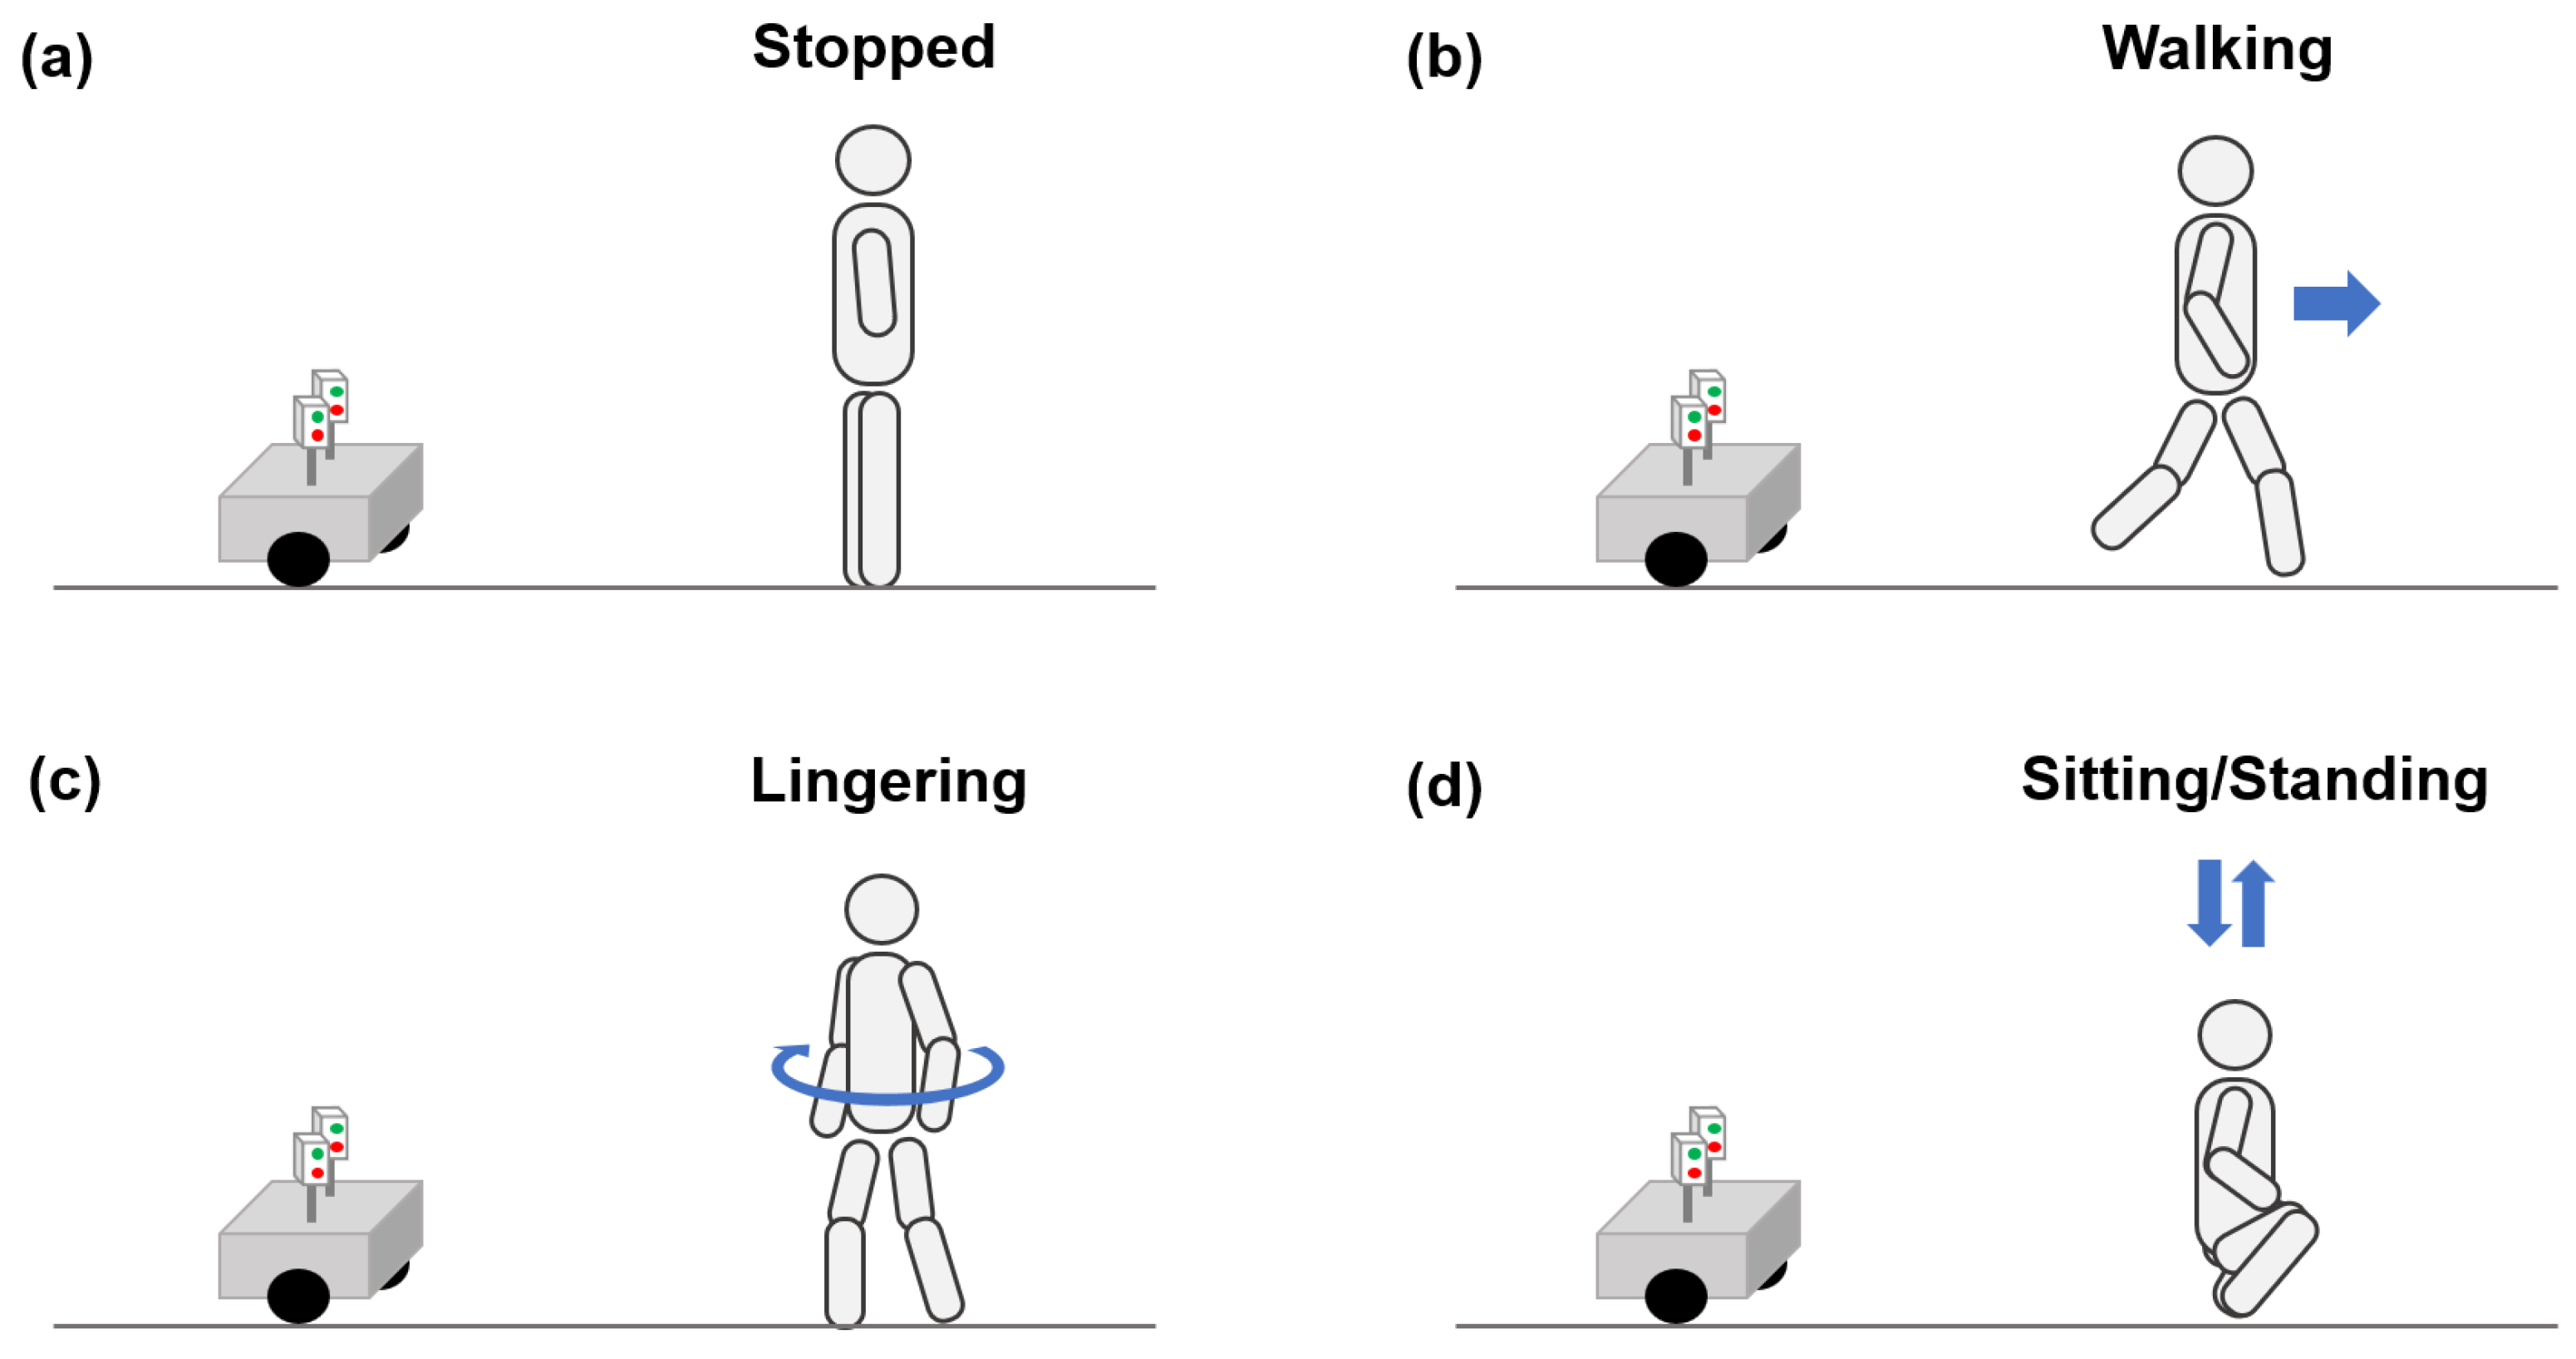
For this experiment, the authors of this paper conducted the tests personally. To validate the experimental methodology, the four situations were initially modeled as depicted in Figure 11. The participant was then instructed to act according to these models. By monitoring the participant’s actions, it was ensured that the data collected closely matched the modeled behaviors. During the experiment, the distance from the ground to the sensors on the participant’s legs was set at 0.6 m, and the distance from the sensors located on the participant’s legs to the waist was 0.4 m. The following details the four experimental scenarios.
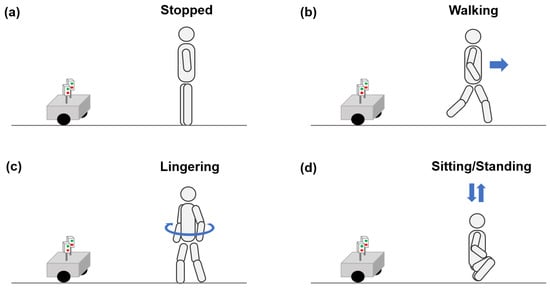
Figure 11.
Schematic representations of participant scenarios for different states in the experiment: (a) the participant in a stationary state; (b) the participant walking towards the robot; (c) the participant in a lingering state; (d) the participant transitioning between sitting and standing positions.
- Stopped Scenario
In this scenario, UWB sensors were attached to both legs of the user, maintaining a stationary position. Instead of attaching the UWB sensors to a static object, the decision was made to attach them to the body and minimize movement to capture information about human immobility. This approach was adopted to obtain data relevant to the stopped state.
- Walking Scenario
As elaborated in the Methods section under human walking sequence modeling, walking was executed in a manner whereby the cross movement of both legs was distinctly visible. The experiment was conducted with an average walking speed of 0.5–1 m/s. It was assumed that the walker would move in the direction facing the sensor for this experiment.
- Lingering Scenario
This scenario was designed with the assumption that one leg would be the primary mover, while the other would remain largely stationary. The primary leg briefly steps forward and returns to its original position. The other leg, although displaying minor directional shifts or movements in response to the motion of the primary leg, showed no other significant movement during the experiment.
- Sitting and Standing Scenario
After modeling the typical motions of sitting and standing, a scenario was conceived whereby both legs simultaneously descended as the user sat and rose as the user stood in place. This approach was designed to clearly delineate the actions of sitting down and standing up.
Based on the provided scenarios, experiments were conducted as depicted in Figure 12. Using these experiments, distance data were acquired from the UWB sensors on the robot to the UWB sensors on both legs of the participant in each respective situation. During this process, the modeled motions for each scenario were repeated to consecutively collect 100 data points for each, yielding a total of 400 data points. Subsequently, these distance data were utilized to perform classification.
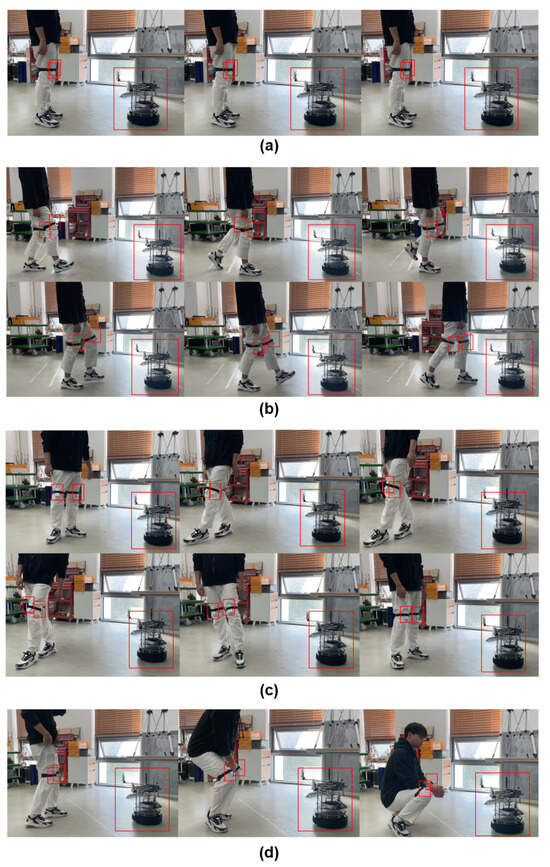
Figure 12.
Actual experimental setup. In the image, the large red box indicates the location of the robot, while the small red box denotes the position of the UWB sensor attached to the body. (a) actual experimental process of a stopped motion scenario; (b) actual experimental process of a walking motion scenario; (c) actual experimental process of a lingering motion scenario; (d) actual experimental process of a sitting/standing motion scenario.
For a precise analysis, the distance data were stored in the form of a CSV (Comma-Separated Values) file. The data were imported into Python, followed by the execution and visualization of Steps 1, 2, and 3. Specifically, for Step 1, which was the classification of the stopped state, classification was done simply through designating speed and acceleration thresholds. Due to this straightforward approach, visualization was not conducted for this step, and only an accuracy evaluation was performed.
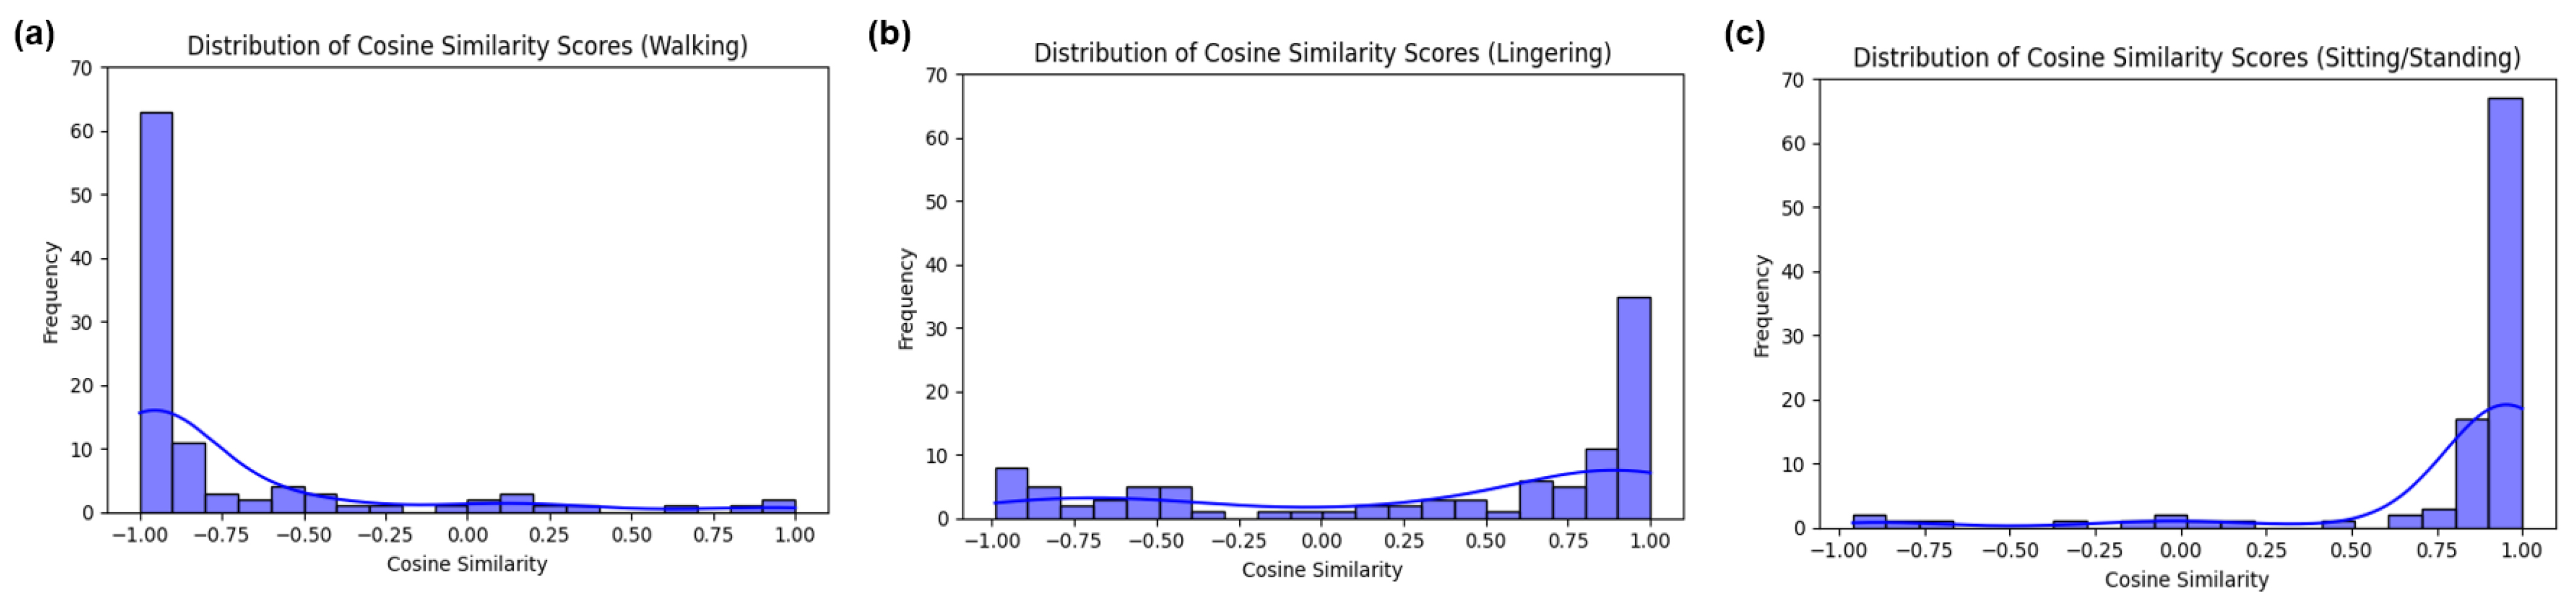
Following Step 2, the cosine similarity values were obtained as results. These results were then represented over time steps using Python. Additionally, to observe the distribution of results for each movement state, visualizations of the histogram and kernel density estimation were carried out for the cosine similarity outcomes as depicted in Figure 13. Consequently, in the walking scenario, since the acceleration values of both legs proceeded in opposite directions, the cosine similarity values were observed to be predominantly close to −1. For the lingering and sitting/standing situations, since both legs moved similarly, the cosine similarity values largely appeared to be close to 1.
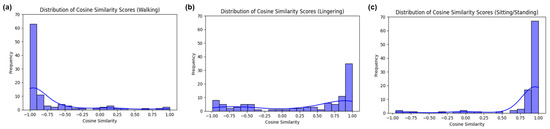
Figure 13.
Results utilizing FFT and cosine similarity from Step 2: (a) histogram and kernel density estimation of cosine similarity scores derived from the walking scenario dataset; (b) histogram and kernel density estimation of cosine similarity scores derived from the lingering scenario dataset; (c) histogram and kernel density estimation of cosine similarity scores derived from the sitting/standing scenario dataset.
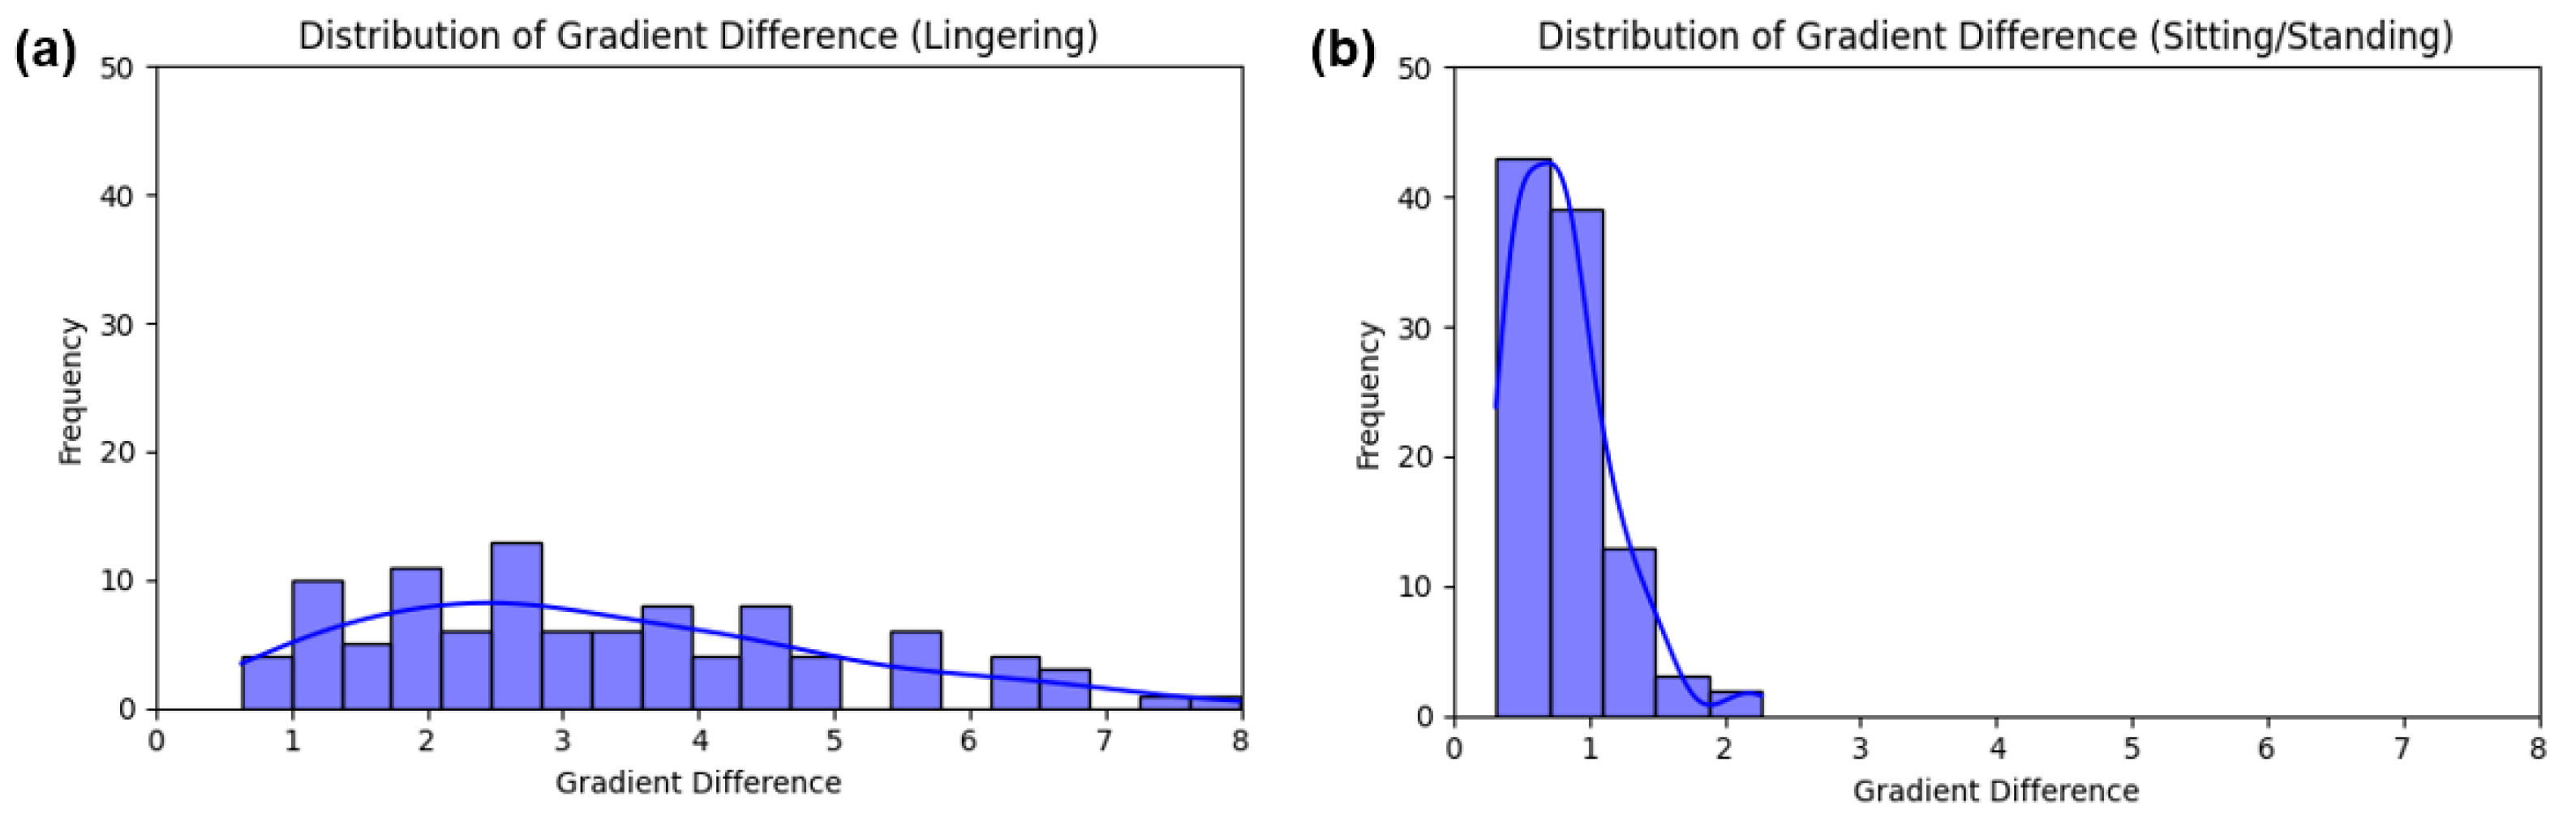
In Step 3, the outcome was derived using the slope differences of the acceleration values from the previous five points. Similarly, histograms and kernel density estimations were conducted to understand the distribution of outcomes for each movement state, as depicted in Figure 14. For the lingering state, as both legs moved somewhat independently, the histogram clearly showed a significant deviation in the slope differences of their acceleration values from 0. In the sitting/standing state, as the experiment was based on a scenario wherein both legs moved down and up simultaneously, the histogram revealed that the slope difference of the acceleration values between the legs was closely aligned to 0.

Figure 14.
Gradient difference analysis from Step 3: (a) histogram and kernel density estimation of gradient differences for the lingering scenario; (b) histogram and kernel density estimation of gradient differences for the sitting/standing scenario.
Following the thresholds mentioned in the Methods section, the data were classified. The classification accuracy results for each step can be observed in Table 2. For the basic model, Step 1 showed an impeccable 100% accuracy across all movement states: stopped, walking, lingering, and sitting/standing. Subsequently, in Step 2, the walking state exhibited accuracy of 84%, the lingering state had 78%, and the sitting/standing state demonstrated high accuracy of 96%. In Step 3, where the classification was conducted for the lingering and sitting/standing states, the accuracy rates were 87% and 91%, respectively. While the basic model showcased high accuracy, there were instances in which it failed to classify certain values correctly. To address these limitations, an advanced model for human movement classification, proposed in this paper, was implemented. Compared to the basic model, the advanced model in Step 1 maintained 100% accuracy for movement states. In Step 2, the accuracy for the walking state improved from 84% to 97%, the lingering state from 78% to 92%, and the sitting/standing state reached a perfect score of 100%. Moreover, in Step 3, the accuracy for the lingering state surged from 87% to 95%, and, for the sitting/standing state, it increased slightly from 91% to 93%. This resulted in average overall accuracy of approximately 95%.
Table 2.
Classification accuracy for different human moving states.
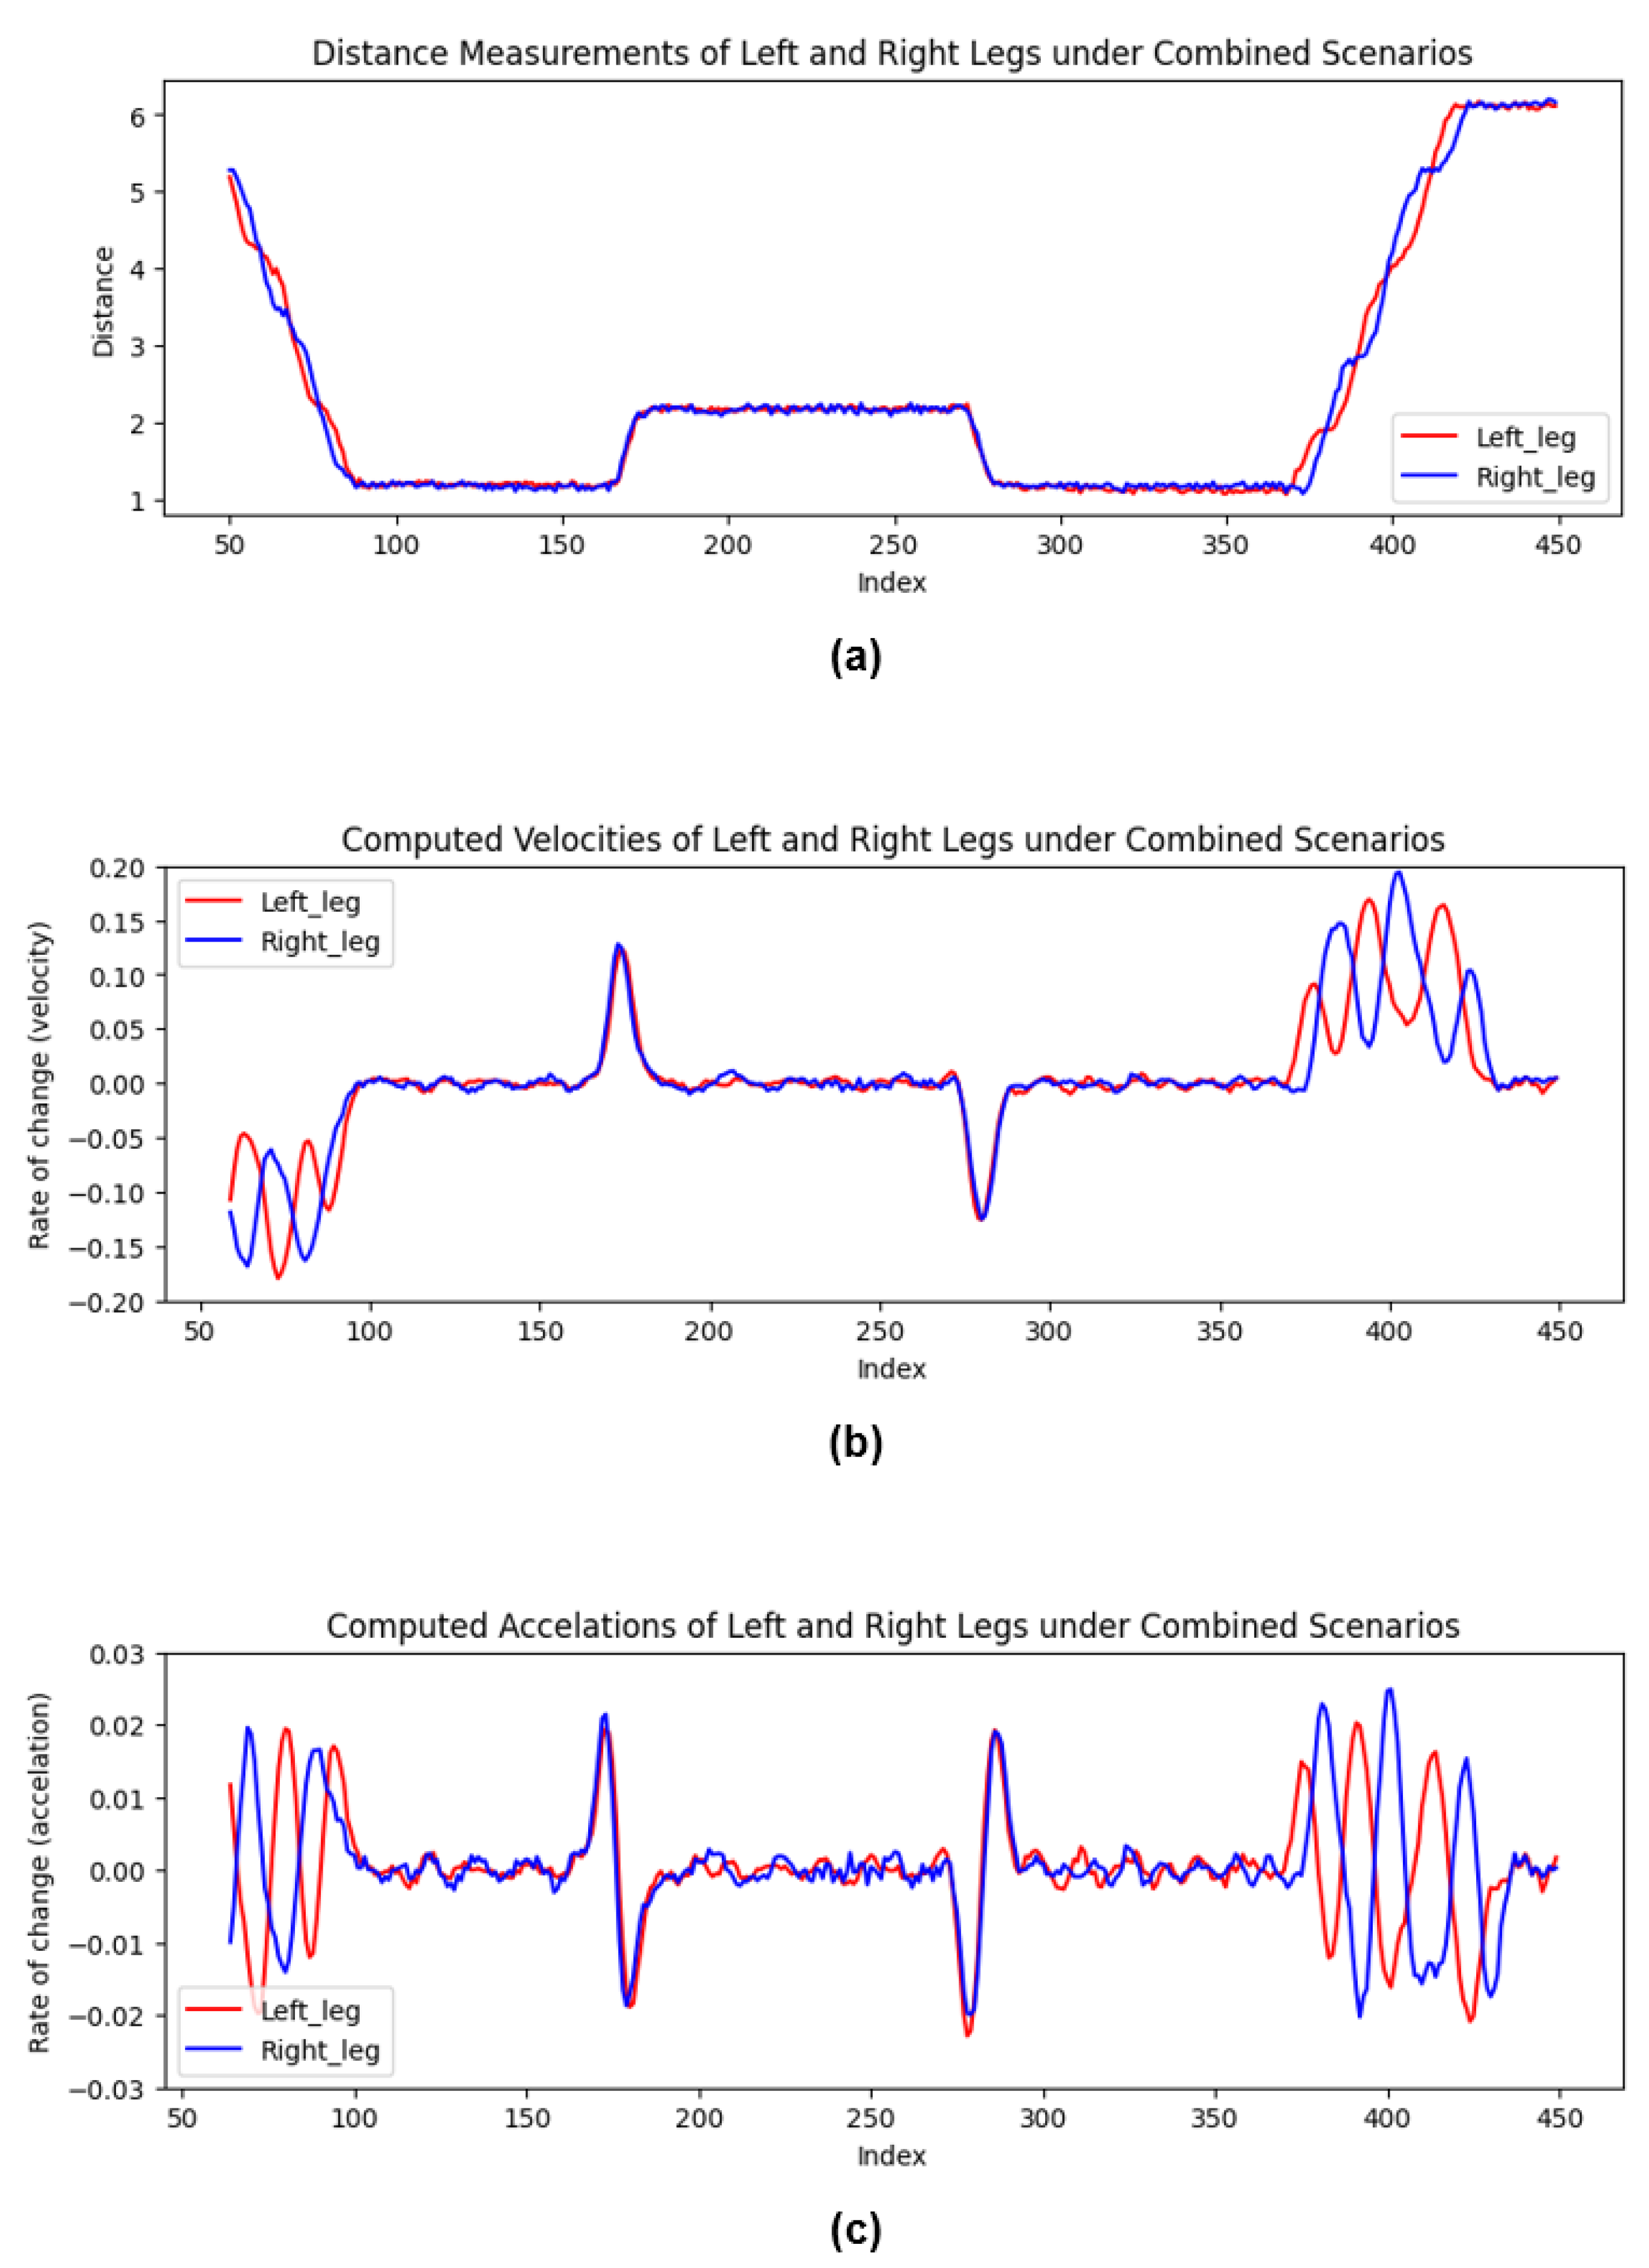
Additionally, to illustrate the outcomes in real-world settings when individuals engage in complex movements, further experiments were conducted. These experiments were designed considering a human-following robot environment, wherein a scenario was simulated with the user loading items onto the human-following robot and moving. The scenario unfolded as follows: the user approached the robot by walking, came to a stop in front of the robot, and then sat down to retrieve items from the robot; then, they stood up again and finally moved away from the robot. This complex scenario encompassed walking, stopping, and transitions between sitting and standing. The distance measurements obtained from this experiment, along with the calculated speed and acceleration values, are presented in Figure 15.
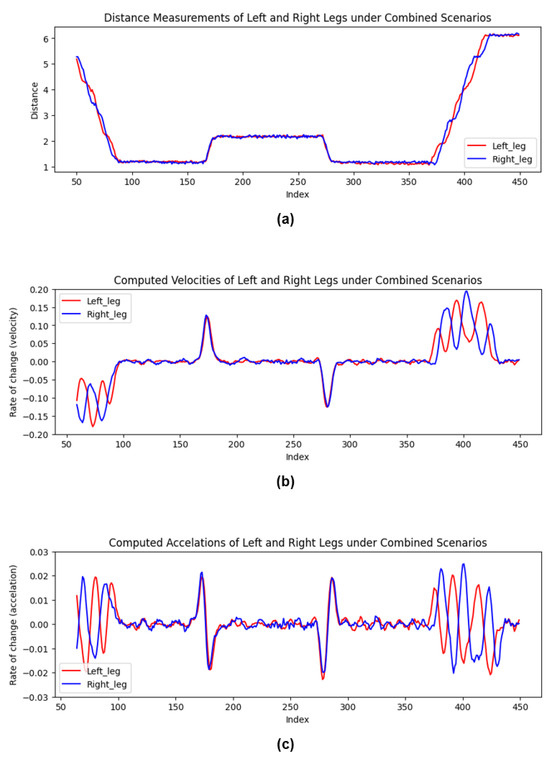
Figure 15.
Measured outcomes under a composite scenario, considering a real-world human-following robot context. The scenario simulated a user approaching the robot, stopping, sitting to pick up an item, standing, and then moving away from the robot. (a) Variation in measured distances; (b) changes in computed velocities after smoothing with a moving average; (c) changes in computed accelerations after smoothing with a moving average.
As illustrated in the results visualized in Figure 15, the data exhibited distinct movement states throughout the experiment. From the 50th to the 90th index, the subject is in a walking state. This is followed by a stopped state from the 90th to the 170th index. A transition between sitting and standing is observed from the 170th to the 180th index. The subject returns to a stopped state from the 180th to the 270th index, followed by another transition between sitting and standing from the 270th to the 280th index. The subject remains in a stopped state from the 280th to the 370th index, transitions back to a walking state from the 370th to the 420th index, and ultimately exhibits a stopped state again from the 420th to the 450th index. These segments effectively demonstrate the capability of the proposed method to classify complex human movements within a dynamic human-following robot environment.
For the speed and acceleration values, a moving average smoothing technique was applied to correct the values, resulting in a slight shift in the indices compared to the initial distance measurements. Despite this shift, the application of the previously mentioned three phases allowed for the clean classification of movement states. Due to the moving average, there was a mismatch between the indices of the actual measured distances and the calculated speed/acceleration values. Therefore, the fine adjustment of the indices was performed to account for this delay, and the experimental results were processed through the three-step methodology.
The final classification of movement states achieved accuracy of 95% for the stopped state, approximately 83% for the walking state, and 90% for transitions between sitting and standing. Overall, the method demonstrated accuracy of 92%, closely mirroring the individual measurement accuracy of 95%. This consistency underscores the model’s effectiveness in real-world scenarios, confirming its robust performance across different states of movement.
7. Conclusions
In this study, the focus was on enhancing human–robot interaction by allowing a robot equipped with UWB sensors to detect human movements in real time. The study presented an enhanced approach extending beyond the traditional method that utilized a pair of UWB sensors on a robot and a single UWB sensor on a person to derive two distance measurements and ascertain the person’s location through bilateration. This advancement involves affixing UWB sensors to each of the individual’s legs, thereby not only pinpointing the user’s location but also discerning their movement states, including sitting, walking, lingering, and transitioning between sitting and standing. These movement states, crucial in a workspace setting, were defined to aid the robot in recognizing and adapting to the human’s activities. By recognizing these behaviors, the robot is better equipped to support and interact with workers, thereby fostering a more collaborative environment.
In this study, distinct patterns for each movement state were elucidated using distance data between UWB sensors on robots and humans, based on distance measurements, velocity, and smoothed acceleration values. A three-stage classification method was proposed. In Step 1, velocity and acceleration thresholds were utilized to differentiate the stopped state from others. Step 2 employed the FFT and cosine similarity to distinguish walking motions from lingering and sitting/standing motions. In Step 3, the five-point gradient difference method introduced in the paper effectively differentiated between lingering motion and sitting/standing motion. The study’s three-step classification method demonstrated high efficacy in identifying human movement states, with the initial step perfectly distinguishing stationary states. Subsequent steps showed substantial accuracy, with improvements observed when an enhanced method incorporating brief historical data was applied. This approach yielded near-perfect accuracy rates across all movement states, achieving overall average accuracy of approximately 95%.
The final constructed model demonstrates that, with minimal computation in a CPU environment, it can effectively recognize and classify four types of movements with approximate accuracy of 95%. Additionally, in experiments simulating composite motion scenarios that considered real-world environments, the model achieved overall accuracy of 92%. This experimental outcome evidences the considerable success of the classification algorithm, offering a novel approach to detecting human movements in the field of robotics to enhance human–robot interaction. The methodology proposed in this paper addresses a significant challenge in follower robots utilizing UWB sensors. It not only tracks the location of a person but also understands and responds to their current behaviors, thereby improving both the safety and convenience of follower robots in work environments. In conclusion, the experimental methodologies and classification models introduced in this study are expected to make a significant impact on the field of robotics. By enabling robots to accurately interpret human intentions and behaviors, the research extends beyond follower robots with UWB sensors to a multitude of sectors, such as industrial safety, medical assistance, and personalized service robotics. This paves the way for enhanced service coordination and support, marking the advent of a new era of synergy between humans and robots across various operational environments.
Author Contributions
Conceptualization, M.N.; methodology, M.N.; software, M.N.; validation, M.N.; formal analysis, S.C.L.; data curation, M.N.; writing—original draft preparation, M.N.; writing—review and editing, H.A.; visualization, M.N.; project administration, H.A. and S.C.L. All authors have read and agreed to the published version of the manuscript.
Funding
Technology Development Program of the Ministry of SMEs and Startups: RS-2022-00141837; Daegu Gyeongbuk Institute of Science and Technology (DGIST) Research and Development Program of the Ministry of Science: 23-DPIC-13.
Institutional Review Board Statement
The study was approved by the Institutional Review Board of Daegu Gyeongbuk Institute of Science and Technology (DGISTIRB-2024-008-01 and 03/25/2024).
Informed Consent Statement
Informed consent was obtained from all subjects involved in the study.
Data Availability Statement
The data supporting the results reported in this study were collected through experiments conducted by the authors themselves. These data can be made available upon request for the purposes of ensuring the transparency and reproducibility of the research. The authors are prepared to provide the relevant data within a reasonable scope if requested. Currently, there are no specific privacy or ethical restrictions on these data, allowing interested researchers to directly contact the authors for access to them.
Conflicts of Interest
The authors declare no conflicts of interest.
References
- Bayram, B.; İnce, G. Advances in Robotics in the Era of Industry 4.0. In Industry 4.0: Managing the Digital Transformation; Springer International Publishing: Cham, Switzerland, 2018; pp. 187–200. [Google Scholar]
- Demir, K.A.; Döven, G.; Sezen, B. Industry 5.0 and Human-Robot Co-working. Procedia Comput. Sci. 2019, 158, 688–695. [Google Scholar] [CrossRef]
- Vysocky, A.; Novak, P. Human-robot collaboration in industry. Sci. J. 2016, 9, 903–906. [Google Scholar] [CrossRef]
- Heyer, C. Human-robot interaction and future industrial robotics applications. In Proceedings of the 2010 IEEE/RSJ International Conference on Intelligent Robots and Systems, Taipei, Taiwan, 18–22 October 2010; pp. 4749–4754. [Google Scholar]
- Rawassizadeh, R.; Sen, T.; Kim, S.J.; Meurisch, C.; Keshavarz, H.; Mühlhäuser, M.; Pazzani, M. Manifestation of Virtual Assistants and Robots into Daily Life: Vision and Challenges. CCF Trans. Pervasive Comput. Interact. 2019, 1, 163–174. [Google Scholar] [CrossRef]
- Haddadin, S.; Albu-Schaffer, A.; De Luca, A.; Hirzinger, G. Collision Detection and Reaction: A Contribution to Safe Physical Human-Robot Interaction. In Proceedings of the 2008 IEEE/RSJ International Conference on Intelligent Robots and Systems, Nice, France, 22–26 September 2008; pp. 3356–3363. [Google Scholar]
- Maurice, P.; Malaisé, A.; Amiot, C.; Paris, N.; Richard, G.-J.; Rochel, O.; Ivaldi, S. Human movement and ergonomics: An industry-oriented dataset for collaborative robotics. Int. J. Robot. Res. 2019, 38, 1529–1537. [Google Scholar] [CrossRef]
- Geravand, M.; Flacco, F.; De Luca, A. Human-robot physical interaction and collaboration using an industrial robot with a closed control architecture. In Proceedings of the 2013 IEEE International Conference on Robotics and Automation, Karlsruhe, Germany, 6–10 May 2013; pp. 4000–4007. [Google Scholar]
- Hägele, M.; Schaaf, W.; Helms, E. Robot assistants at manual workplaces: Effective co-operation and safety aspects. In Proceedings of the 33rd ISR (International Symposium on Robotics), Stockholm, Sweden, 7–11 October 2002; p. 97. [Google Scholar]
- Fryman, J.; Matthias, B. Safety of Industrial Robots: From Conventional to Collaborative Applications. In Proceedings of the ROBOTIK 2012: 7th German Conference on Robotics, Munich, Germany, 21–22 May 2012; pp. 1–5. [Google Scholar]
- Galin, R.R.; Meshcheryakov, R.V. Human-Robot Interaction Efficiency and Human-Robot Collaboration. In Robotics: Industry 4.0 Issues & New Intelligent Control Paradigms; Kravets, A.G., Ed.; Springer International Publishing: Cham, Switzerland, 2020; pp. 55–63. [Google Scholar]
- Thrun, S. Toward a Framework for Human-Robot Interaction. Hum.-Comput. Interact. 2004, 19, 9–24. [Google Scholar] [CrossRef]
- Poppe, R. Vision-based human motion analysis: An overview. Comput. Vis. Image Underst. 2007, 108, 4–18. [Google Scholar] [CrossRef]
- Moeslund, T.B.; Hilton, A.; Krüger, V. A survey of advances in vision-based human motion capture and analysis. Comput. Vis. Image Underst. 2006, 104, 90–126. [Google Scholar] [CrossRef]
- Chang, C.-C.; Tsai, W.-H. Vision-based tracking and interpretation of human leg movement for virtual reality applications. IEEE Trans. Circuits Syst. Video Technol. 2001, 11, 9–24. [Google Scholar] [CrossRef]
- Sung, Y.; Chung, W. Human tracking of a mobile robot with an onboard LRF (Laser Range Finder) using human walking motion analysis. In Proceedings of the 2011 8th International Conference on Ubiquitous Robots and Ambient Intelligence (URAI), Incheon, Republic of Korea, 23–26 November 2011; pp. 366–370. [Google Scholar]
- Zheng, C.; Wu, W.; Chen, C.; Yang, T.; Zhu, S.; Shen, J.; Kehtarnavaz, N.; Shah, M. Deep Learning-Based Human Pose Estimation: A Survey. ACM Comput. Surv. 2023, 56, 11. [Google Scholar] [CrossRef]
- Luo, Y.; Ren, J.; Wang, Z.; Sun, W.; Pan, J.; Liu, J.; Pang, J.; Lin, L. LSTM Pose Machines. In Proceedings of the IEEE Conference on Computer Vision and Pattern Recognition (CVPR), Salt Lake City, UT, USA, 18–23 June 2018; pp. 5207–5215. [Google Scholar]
- Wei, S.-E.; Ramakrishna, V.; Kanade, T.; Sheikh, Y. Convolutional Pose Machines. In Proceedings of the IEEE Conference on Computer Vision and Pattern Recognition (CVPR), Las Vegas, NV, USA, 27–30 June 2016; pp. 4724–4732. [Google Scholar]
- Sun, M.; Savarese, S. Articulated Part-Based Model for Joint Object Detection and Pose Estimation. In Proceedings of the 2011 International Conference on Computer Vision, Barcelona, Spain, 6–13 November 2011; pp. 723–730. [Google Scholar]
- Tian, Y.; Zitnick, C.L.; Narasimhan, S.G. Exploring the Spatial Hierarchy of Mixture Models for Human Pose Estimation. In Proceedings of the European Conference on Computer Vision (ECCV), Florence, Italy, 7–13 October 2012; Springer: Berlin/Heidelberg, Germany, 2012; pp. 256–269. [Google Scholar]
- Chen, Y.; Tian, Y.; He, M. Monocular human pose estimation: A survey of deep learning-based methods. Comput. Vis. Image Underst. 2020, 192, 1–20. [Google Scholar] [CrossRef]
- Yan, Q.; Xu, W.; Huang, J.; Cao, S. Laser and force sensors based human motion intent estimation algorithm for walking-aid robot. In Proceedings of the 2015 IEEE International Conference on Cyber Technology in Automation, Control, and Intelligent Systems (CYBER), Shenyang, China, 8–12 June 2015; pp. 1858–1863. [Google Scholar]
- Dimitrievski, M.; Veelaert, P.; Philips, W. Behavioral Pedestrian Tracking Using a Camera and LiDAR Sensors on a Moving Vehicle. Sensors 2019, 19, 391. [Google Scholar] [CrossRef] [PubMed]
- Roche, J.; De-Silva, V.; Hook, J.; Moencks, M.; Kondoz, A. A Multimodal Data Processing System for LiDAR-Based Human Activity Recognition. IEEE Trans. Cybern. 2022, 52, 10027–10040. [Google Scholar] [CrossRef] [PubMed]
- Koide, K.; Miura, J.; Menegatti, E. A portable three-dimensional LIDAR-based system for long-term and wide-area people behavior measurement. Int. J. Adv. Robot. Syst. 2019, 16, 1729881419841532. [Google Scholar] [CrossRef]
- Bakhtiarnia, A.; Zhang, Q.; Iosifidis, A. Single-layer vision transformers for more accurate early exits with less overhead. Neural Netw. 2022, 153, 461–473. [Google Scholar] [CrossRef]
- Goel, A.; Tung, C.; Lu, Y.-H.; Thiruvathukal, G.K. A Survey of Methods for Low-Power Deep Learning and Computer Vision. In Proceedings of the IEEE 6th World Forum on Internet of Things (WF-IoT), New Orleans, LA, USA, 2–16 June 2020; pp. 1–6. [Google Scholar]
- Rathnayake, T.; Khodadadian Gostar, A.; Hoseinnezhad, R.; Tennakoon, R.; Bab-Hadiashar, A. On-Line Visual Tracking with Occlusion Handling. Sensors 2020, 20, 929. [Google Scholar] [CrossRef] [PubMed]
- Zhu, L.; Menon, M.; Santillo, M.; Linkowski, G. Occlusion Handling for Industrial Robots. In Proceedings of the 2020 IEEE/RSJ International Conference on Intelligent Robots and Systems (IROS), Las Vegas, NV, USA, 25–29 October 2020; pp. 10663–10668. [Google Scholar]
- Feng, T.; Yu, Y.; Wu, L.; Bai, Y.; Xiao, Z.; Lu, Z. A Human-Tracking Robot Using Ultra Wideband Technology. IEEE Access 2018, 6, 42541–42550. [Google Scholar] [CrossRef]
- Dang, C.V.; Ahn, H.; Kim, J.-W.; Lee, S.C. Collision-Free Navigation in Human-Following Task Using a Cognitive Robotic System on Differential Drive Vehicles. IEEE Trans. Cogn. Dev. Syst. 2023, 15, 78–87. [Google Scholar] [CrossRef]
- Ahn, H.; Dang, C.V.; Lee, S.C. Complex-Valued Function Modeling of Bilateration and its Applications. IEEE Access 2023, 11, 92913–92925. [Google Scholar] [CrossRef]
- Yun, J.; Lee, S.-S. Human Movement Detection and Identification Using Pyroelectric Infrared Sensors. Sensors 2014, 14, 8057–8081. [Google Scholar] [CrossRef] [PubMed]
- Lugade, V.; Fortune, E.; Morrow, M.; Kaufman, K. Validity of Using Tri-Axial Accelerometers to Measure Human Movement—Part I: Posture and Movement Detection. Med. Eng. Phys. 2014, 36, 169–176. [Google Scholar] [CrossRef] [PubMed]
- Li, C.; Lin, M.; Yang, L.T.; Ding, C. Integrating the Enriched Feature with Machine Learning Algorithms for Human Movement and Fall Detection. J. Supercomput. 2014, 67, 854–865. [Google Scholar] [CrossRef]
- Chander, H.; Burch, R.F.; Talegaonkar, P.; Saucier, D.; Luczak, T.; Ball, J.E.; Turner, A.; Kodithuwakku Arachchige, S.N.K.; Carroll, W.; Smith, B.K.; et al. Wearable Stretch Sensors for Human Movement Monitoring and Fall Detection in Ergonomics. Int. J. Environ. Res. Public Health 2020, 17, 3554. [Google Scholar] [CrossRef] [PubMed]
- Darko, F.; Denis, S.; Mario, Z. Human Movement Detection Based on Acceleration Measurements and k-NN Classification. In Proceedings of the EUROCON 2007—The International Conference on “Computer as a Tool”, Warsaw, Poland, 9–12 September 2007; pp. 589–594. [Google Scholar]
- Del Rosario, M.B.; Redmond, S.J.; Lovell, N.H. Tracking the Evolution of Smartphone Sensing for Monitoring Human Movement. Sensors 2015, 15, 18901–18933. [Google Scholar] [CrossRef] [PubMed]
- De, P.; Chatterjee, A.; Rakshit, A. Regularized K-SVD-Based Dictionary Learning Approaches for PIR Sensor-Based Detection of Human Movement Direction. IEEE Sens. J. 2021, 21, 6459–6467. [Google Scholar] [CrossRef]
- Wang, M.; Chen, Z.; Zhou, Z.; Fu, J.; Qiu, H. Analysis of the Applicability of Dilution of Precision in the Base Station Configuration Optimization of Ultrawideband Indoor TDOA Positioning System. IEEE Access 2020, 8, 225076–225087. [Google Scholar] [CrossRef]
- Malik, W.Q.; Stevens, C.J.; Edwards, D.J. Multipath Effects in Ultrawideband Rake Reception. IEEE Trans. Antennas Propag. 2008, 56, 507–514. [Google Scholar] [CrossRef]
- Altshiller-Court, N. Stewart’s Theorem. In College Geometry: A Second Course in Plane Geometry for Colleges and Normal Schools, 2nd ed.; Barnes and Noble: New York, NY, USA, 1952; pp. 152–153. [Google Scholar]
- Simonyan, K.; Zisserman, A. Very Deep Convolutional Networks for Large-Scale Image Recognition. arXiv 2015, arXiv:1409.1556. [Google Scholar]
- He, K.; Zhang, X.; Ren, S.; Sun, J. Deep Residual Learning for Image Recognition. arXiv 2015, arXiv:1512.03385. [Google Scholar]
- Szegedy, C.; Liu, W.; Jia, Y.; Sermanet, P.; Reed, S.; Anguelov, D.; Erhan, D.; Vanhoucke, V.; Rabinovich, A. Going Deeper with Convolutions. arXiv 2014, arXiv:1409.4842. [Google Scholar]
- Decawave. DWM1001C Data Sheet. Available online: https://www.qorvo.com/products/d/da007950 (accessed on 23 October 2023).

Disclaimer/Publisher’s Note: The statements, opinions and data contained in all publications are solely those of the individual author(s) and contributor(s) and not of MDPI and/or the editor(s). MDPI and/or the editor(s) disclaim responsibility for any injury to people or property resulting from any ideas, methods, instructions or products referred to in the content. |
© 2024 by the authors. Licensee MDPI, Basel, Switzerland. This article is an open access article distributed under the terms and conditions of the Creative Commons Attribution (CC BY) license (https://creativecommons.org/licenses/by/4.0/).