1. Introduction
With the rise of mobile internet and improvement in economic levels, more and more people are opting for ride-hailing services to address their transportation needs. In 2020, the daily average order volume on the Didi (
https://www.didiglobal.com/ (accessed on 1 February 2024)) platform reached 500 million orders per day. Didi is a prominent mobile transportation platform offering a wide array of ride-hailing services to millions of users across Asia, Latin America, and Australia, providing services including taxi hailing, private car hailing, social ridesharing, and bike sharing. The platform utilizes sophisticated mobile technology to connect passengers with drivers, offering a convenient, fast, and safe way to navigate urban environments. By integrating various forms of transportation services into a single platform, Didi aims to optimize urban transit systems and promote a shift towards more sustainable mobility solutions. Eventually, the drivers complete the customers’ requests offline. Therefore, allocating these tasks to drivers in a reasonable, scientific, and effective manner is a challenging issue for ride-hailing platforms.
Take Didi as an example. The platform initially adopted a driver bidding model for task allocation. However, this design gave drivers more autonomy, leading to a low response rate for orders going to remote areas or for short distances, failing to guarantee user benefits. To improve the order response rate, Didi launched its Express car service in 2015, changing the task allocation model from driver bidding to platform-based algorithmic dispatch. This significantly improved the order response rate. However, in this scenario, the design of the algorithm affects the matching results. Assigning “lucrative orders” based on driver ratings often leads to a “winner-takes-all” phenomenon—drivers may put in the same working hours but end up with vastly different earnings, failing to meet the fairness needs at the driver level.
We find that, based on the dispatch model, effectively matching drivers and passengers affects the platform’s transaction efficiency, the quality of user experience, and the drivers’ willingness to work and faces three main challenges:
- (1)
Difficulty in balancing multiple benefits: Common-order matching strategies often use greedy algorithms, such as nearest assignment and first come, first served. These principles single-mindedly focus on the passenger’s perspective to achieve quality control and fair allocation. However, the results heavily depend on random factors such as the current spatial distribution and the timing of order arrivals, lacking effective protection mechanisms for drivers’ interests. Therefore, effectively balancing the interests of drivers, passengers, and the platform is a primary core issue;
- (2)
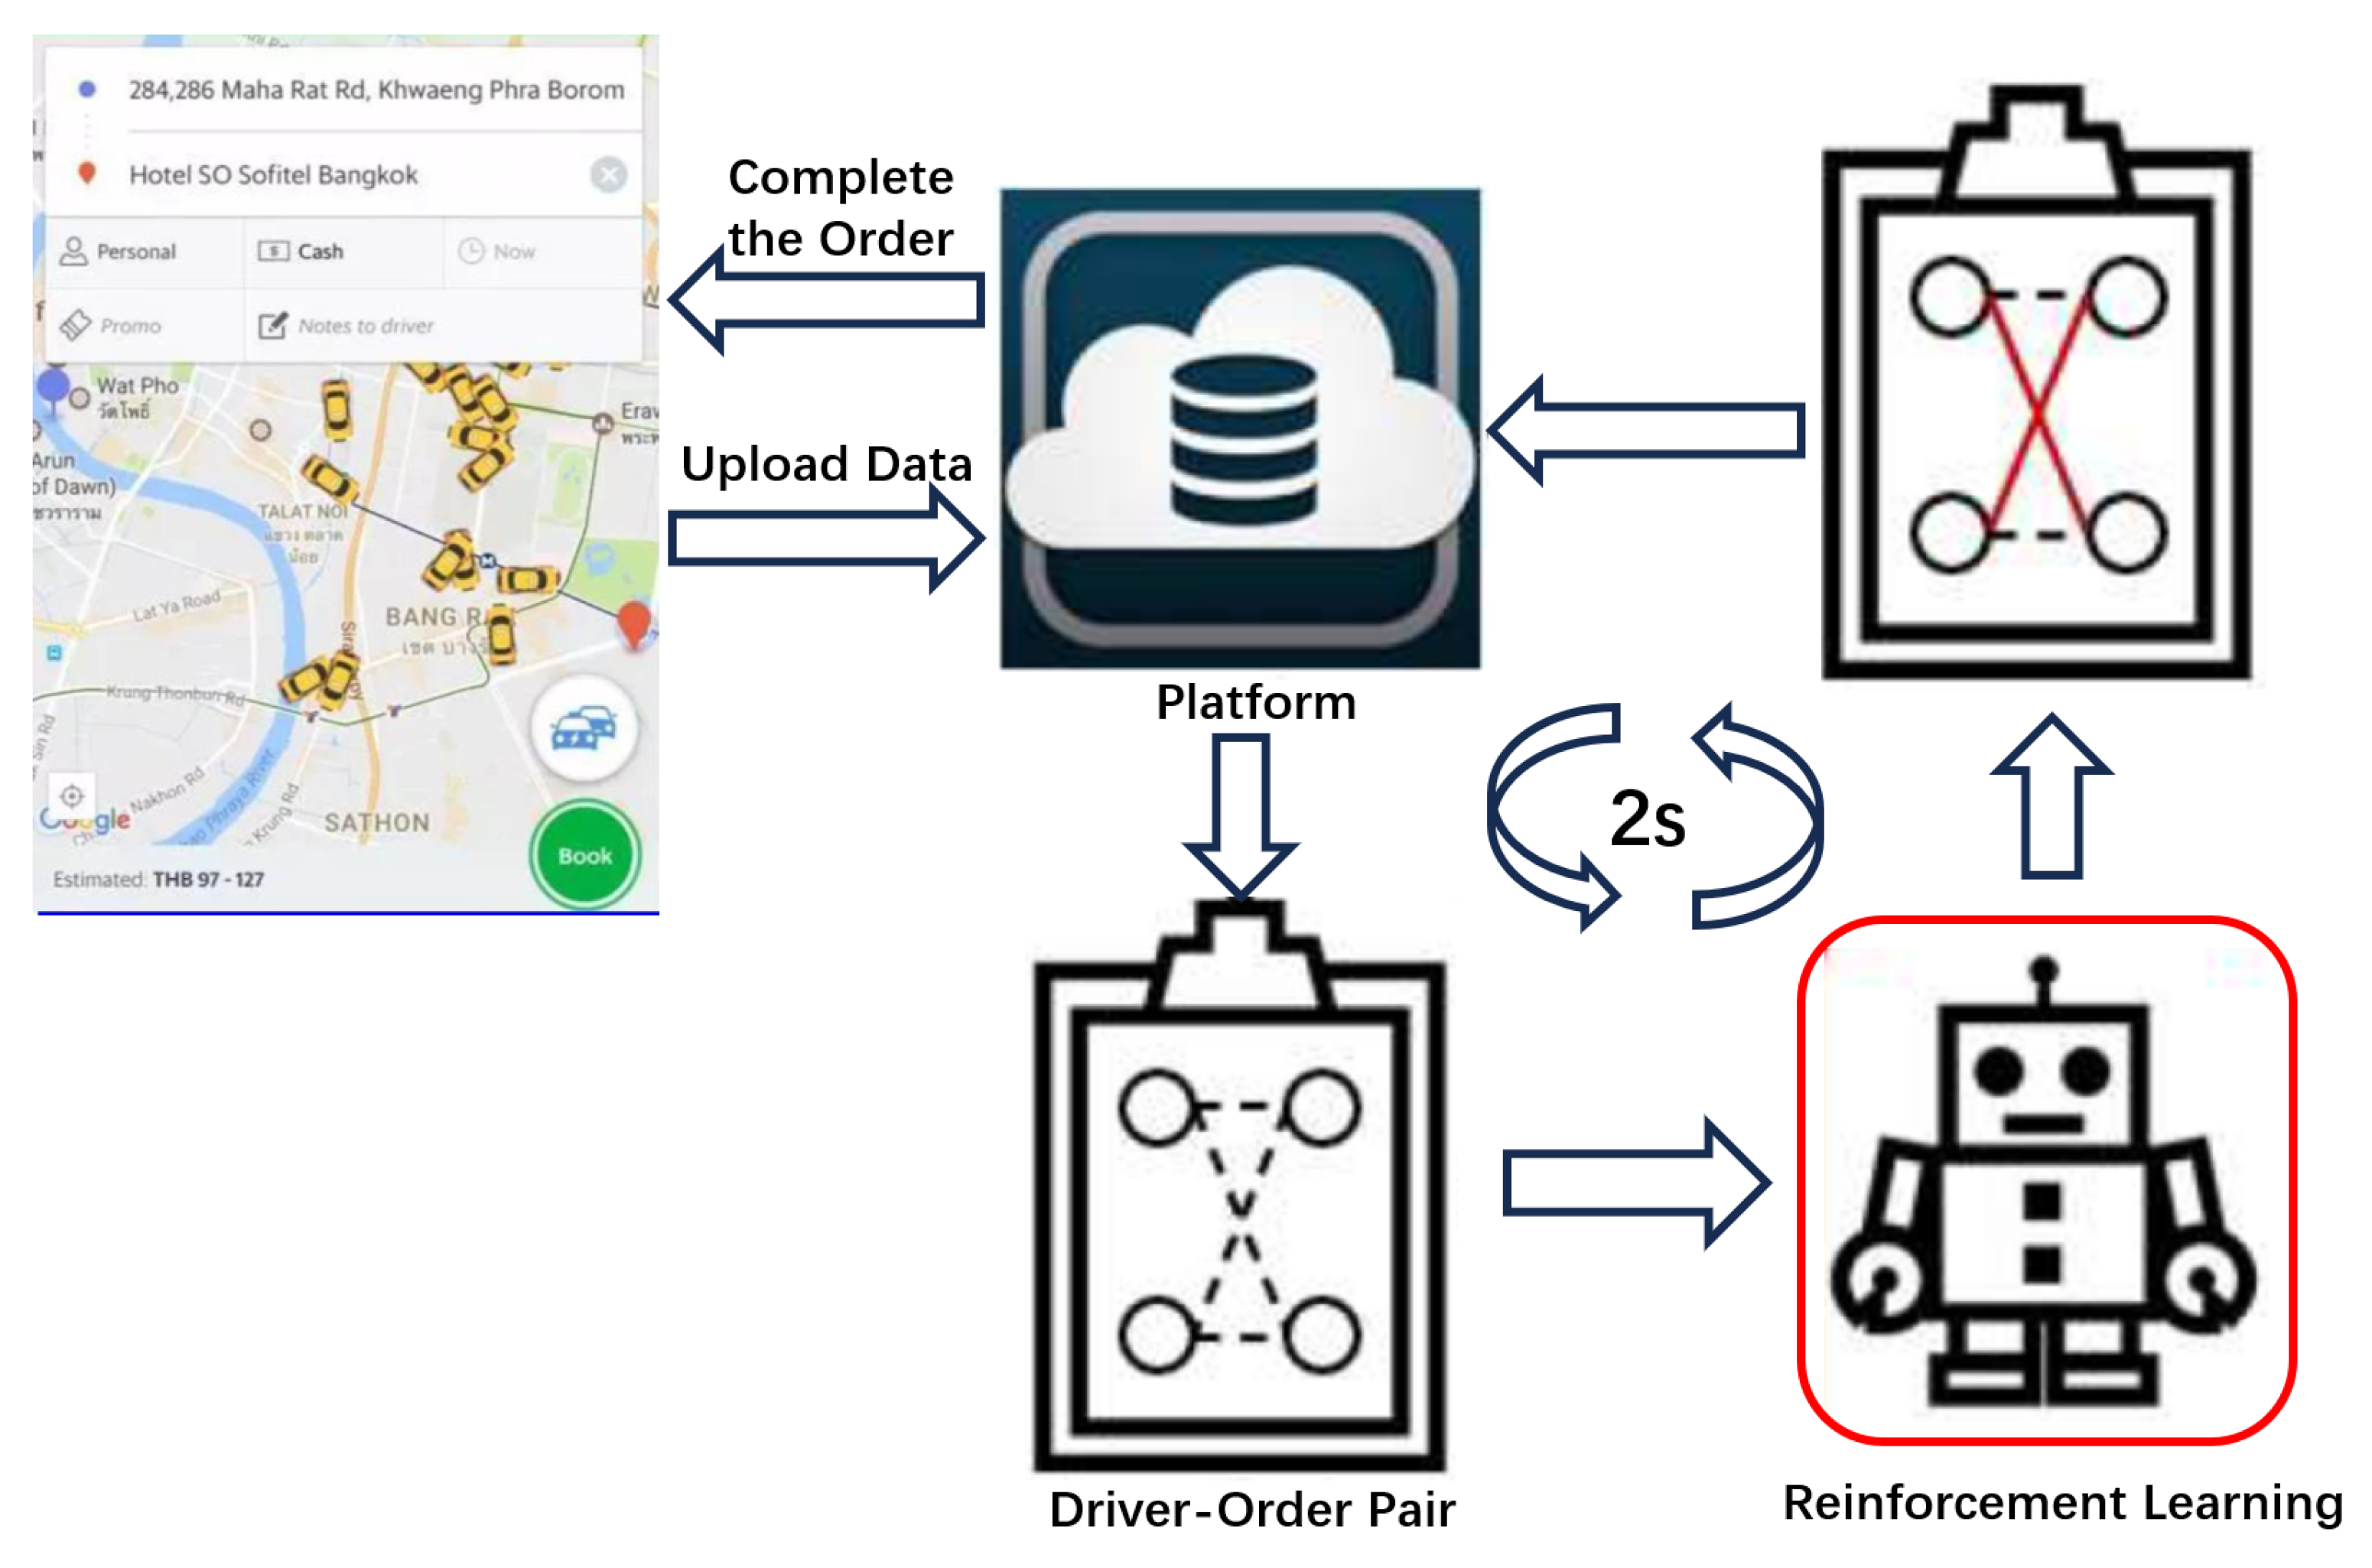
Difficulty in assessing future earnings: The current dynamic matching algorithms for ride-hailing services complete a new match between incoming orders and available drivers every two seconds. Even when considering balancing drivers’ earnings and prioritizing large orders for drivers with lower earnings for the day, such strategies are still based on historical experience and current situations. They overlook the driver’s subsequent spatial location and whether their service period can continue to be profitable, failing to effectively assess future situations. Thus, effectively evaluating the future earnings of drivers and then balancing the order distribution to achieve fairness in driver earnings are other core issues;
- (3)
Difficulty in designing a fair mechanism: Due to factors such as platform scoring, service time zones, and random elements, drivers may receive drastically different earnings despite putting in the same work hours and intensity. However, the existing research lacks assessment and protection of fairness. Therefore, designing reasonable constraints and fairness protection mechanisms is also a crucial core issue.
Additionally, traditional ride-hailing matching focuses on static scenarios, which do not align with real-world situations. However, in dynamic scenarios, if every order is matched immediately upon arrival, the matching results will overly depend on random factors like the order arrival sequence, which presents certain limitations. To achieve the best possible outcomes over a larger scope and improve matching efficiency while ensuring real-time performance, we adopt a time window matching model. Therefore, we design a system where, every two seconds, incoming orders and available drivers are combined into a large bipartite graph, and we aim to maximize the sum of the weights of the matching edges in this graph. However, reasonably designing the edge weights to effectively balance indicators like driver earnings and total platform revenue is also a challenging aspect of our research.
In line with practical application needs, we assume that our scenario has three characteristics: drivers’ statuses change constantly as orders arrive anytime and anywhere; drivers have a certain probability of rejecting orders; and the platform performs a match every two seconds. Considering the core aspects of our research and the predefined scenario, we address the issue of fairness-aware dynamic ride-hailing matching based on reinforcement learning (FMRL). First, we model drivers and passengers as nodes of a bipartite graph based on data uploaded by users and drivers, generating the bipartite graph through edge weight calculation and pruning algorithms. Then, we introduce reinforcement mechanisms and event window matching algorithms in the edge weight design, making it adaptive and overcoming the shortsightedness of traditional methods. Next, we generate matching results using bipartite graph matching algorithms like the KM algorithm. Finally, we verify the effectiveness of the proposed method through experiments on real datasets. In summary, the main contributions of this paper are as follows:
This paper introduces the temporal dependence of matching results on subsequent matches by employing reinforcement learning methods to predict this dependence. FMRL overcomes the shortsightedness inherent in traditional matching algorithms;
A series of optimization schemes, including time window matching models, pruning operations, and adjustment of indicator representations, are introduced. These enhancements significantly increase the algorithm’s adaptability and scalability to large datasets;
Through conducting experiments on ride-hailing matching algorithms, it is demonstrated that the fairness distribution algorithm based on reinforcement learning achieves substantial improvements over traditional algorithms. Specifically, enhancements of 81.4% in fairness, 28.5% in platform utility, and 79.7% in matching efficiency are observed.
2. Related Work
We divide the related work into two categories: ride-hailing matching algorithms and fairness mechanism design.
2.1. Ride-Hailing Matching Algorithms
In this paper, drivers are regarded as crowdsourced workers, and orders are seen as spatiotemporal crowdsourcing tasks. Therefore, the matching in ride hailing essentially belongs to task allocation in the field of spatiotemporal crowdsourcing. Didi and Uber (
https://www.uber.com/ (accessed on 1 February 2024)), as typical applications of spatiotemporal crowdsourcing in the field of ride hailing, have matching algorithms whose optimization is crucial for enhancing user experience, optimizing platform revenue, and ensuring fair earnings for drivers.
Traditional ride-hailing matching algorithms often rely on linear programming methods [
1], designing multiple constraints, and determining optimization objectives without considering the dynamic nature of scenarios. Linear programming can yield optimal solutions for modeled problems, but, in real, dynamic scenarios, drivers and passengers join and leave the platform at any time and place, and the platform must respond in real time to passenger requests, making it impossible to design effective algorithms for a global optimal solution. Moreover, the constraints of ride-hailing matching problems are variable, and the optimization objectives are diverse. Reasonable and complex linear programming models often have too high a complexity to be computationally effective.
Therefore, the current research often involves designing efficient approximate algorithms to solve the ride-hailing order matching problem. The most basic idea of approximate algorithms is based on real-time allocation using a greedy approach, meaning, when an order arrives, the matching occurs immediately based on the current optimal strategy for driver–passenger pairing. However, matching based solely on one-sided supply often has temporal limitations and high computational complexity. To balance real-time user needs, algorithmic approximation ratios, and computational resource consumption, fixed time window online matching methods are often used in practice [
2]—performing a match every fixed period. In the modeling of the matching problem, the current research often involves designing approximate algorithms based on bipartite graph matching [
3]. The main idea is to abstract drivers and passengers as nodes in a bipartite graph [
4,
5,
6], design edge weights to contain multidimensional information like spatiotemporal aspects, order cancellation rates, and expected earnings, and then use bipartite graph matching algorithms like the KM algorithm to find the maximum match.
Additionally, ride-hailing matching algorithms adopt methods such as the Distance-Based Greedy Algorithm (DG), Earnings-Ratio-Based Greedy algorithm (ERG), Integer Linear Programming (ILP) [
7], and Reassignment (REA) [
8]. The Distance-Based Greedy Algorithm assigns tasks to the driver nearest to the order’s starting point. The Earnings-Ratio-Based Greedy Algorithm ranks drivers in descending order based on a weighted amortization fairness index and orders in descending order of earnings ratio, then matches them sequentially to ensure driver fairness. Linear programming [
7,
9] transforms into an integer programming problem, taking passenger fairness as the optimization objective with constraints considering driver income fairness. The Reassignment algorithm [
8,
10] first calculates the allocation results based on order response rate and fairness and then adjusts based on these two allocation results, balancing between response rate and fairness.
However, in ride-hailing matching scenarios, the previous research [
7,
8,
11,
12,
13] on dual-objective optimization for total platform revenue and driver income fairness has the following limitations: (1) It overlooks the impact of existing arrangements on future spatiotemporal distribution and matching situations. Many current algorithms set application scenarios that overly exceed the settings of actual scenarios, neglecting many details. Moreover, the driver’s location and service status depend on the matching situation in previous time sequences. This dependency can affect the overall revenue and fairness of driver earnings from the matching results, making it difficult to verify the effectiveness of the algorithm in real scenarios. (2) Linear programming is a classic approach to solving this optimization problem. However, to balance total platform revenue and fairness among drivers’ incomes, ride-hailing matching is a dual-objective optimization problem. The computational complexity of linear programming algorithms is too high, making them unsuitable for expansion to real-world, large-scale data scenarios.
2.2. Fairness Mechanism Design
In addressing fairness mechanism design issues in dynamic ride-hailing matching algorithms, the existing research suffers from a narrow perspective and lacks individual measurement indicators [
14,
15,
16,
17]. Firstly, the current studies mainly optimize algorithms from the perspective of passengers or platforms, such as maximizing platform revenue or minimizing passenger waiting time, with fewer studies considering the perspective of drivers. Secondly, many allocation algorithms aim to optimize single global indicators such as maximizing total revenue [
3,
18,
19], minimizing travel costs [
4,
20], or reducing passenger waiting times [
21], failing to effectively balance the interests of all parties.
Recently, Refs. [
7,
8,
22,
23] have started to explore balancing objectives like driver income during the task allocation process. As future scenarios are unpredictable, algorithms allocate orders based only on historical data and current situations. To balance the income disparity among drivers, the Earnings-Ratio-Based Greedy Algorithm tends to assign high-value orders to lower-income drivers. However, this approach overlooks factors like the order’s destination and the driver’s future service zones, which can significantly impact their future earnings. This shortsightedness in existing research methods also impacts fairness to some extent. Moreover, platforms currently aim to maximize total revenue through matching optimization. In this context, many orders that do not yield high profits are discarded, and many drivers in ’cold zones’ are not allocated orders [
24,
25,
26], failing to meet fairness requirements.
In addition, in the matching scenario of ride-hailing services, existing algorithms are mostly based on the current scene and fixed algorithms for matching [
17,
27,
28], which cannot make reasonable use of past experience because they ignore future spatiotemporal distribution and income changes and have the shortcomings of shortsightedness and poor adaptability [
29]. Therefore, a preliminary idea is to introduce reinforcement learning into the algorithm design to overcome the problem of poor algorithm adaptability. Reinforcement learning has a wide range of applications in ride-hailing scenarios, such as dynamic pricing [
30] and online matching [
31,
32,
33]. Dynamic pricing [
30] sets different prices as actions, and the corresponding revenue is the total platform revenue generated by this pricing subsequently. Regarding online matching [
32], the existing research often models drivers as intelligent agents whose state, actions, and benefits can be intuitively defined. In practical scenarios, to avoid multi-agent problems, all drivers are often modeled as the same intelligent agent. Ref. [
34] integrates reinforcement learning for online matching, dividing ride-hailing matching into two parts: online planning and offline learning. Online planning defines edge weight calculation methods related to order price, location value, and pick-up distance and then completes matching through the maximum bipartite graph matching formula. Offline learning achieves value updates through temporal differential errors where the value of each grid depends on the driver’s income within that grid. Ref. [
18] achieved optimization based on [
34], representing each location as a vector and updating the value function of the driver’s location through a deep neural network. To make the value function smoother and more robust, Lipschitz regularization is adopted.
Due to the lack of research on fairness mechanisms in the field of ride-hailing matching, we expanded the scope of our fairness study to the domain of spatiotemporal crowdsourcing. In [
24], the author, based on the issue of computational resource allocation, detailed the theory of fair distribution, setting dynamic programming constraints and optimization objectives such as incentive sharing, customized allocation strategies, non-deception, and optimality. Refs. [
24,
35] extended this to the field of dynamic computational resource allocation, achieving dynamic fair distribution through the relaxation of some constraints in fair distribution theories. The research on fairness mechanisms often considers various task arrival distributions, testing the algorithm’s matching rate and fairness under different scenarios. We considered several task arrival distributions as follows: (1) adversarial order, where the order arrival is precisely the worst-case scenario for the algorithm; (2) random order, where order arrivals conform to the average real situation; (3) independent and identically distributed (i.i.d.), where dynamically arriving orders and task participants are distributed in a non-independent and identically distributed manner; (4) known i.i.d., where orders and participant distributions are non-independent and identically distributed and the algorithm is aware of these distribution characteristics in advance; (5) known adversarial distribution, where orders and participants satisfy a certain random, independent distribution, distinct from each other, and the algorithm knows their distribution characteristics in advance.
3. Problem Definition and Algorithm Evaluation Criteria
In this section, we first provide a definition of the problem; secondly, we introduce bipartite graph matching; then, we discuss the time window matching model. Following that, we offer formal definitions of the relevant entities and models within the algorithm, and, finally, we explore the rational design of algorithm evaluation metrics and provide their formal definitions.
3.1. Problem Definition
This subsection specifically describes the modeling approach for ride-hailing drivers’ orders and their symbolic abstract representation methods, as well as the algorithm matching model based on bipartite graphs.
3.1.1. Order and Driver
Definition 1. (Order) A ride-hailing order can be represented by a tuple , where respectively represent the starting point, destination, earnings, and duration of the task.
For each order, the starting and ending points are defined by the passenger who submits the order. Once the order is uploaded to the platform, the platform determines the earnings and duration of the task based on the distance between the starting and ending points, as well as external conditions like weather, supply and demand, and traffic. A commonly used algorithm for determining task arrival time is the estimated time of arrival [
36,
37,
38]. In the research scenario of this paper, since the error in the estimated time of arrival does not significantly affect the accuracy of the algorithm, to ensure the efficiency of the algorithm, the duration of the order as a multiple of the distance between the starting and ending points is defined.
Definition 2. (Driver) A ride-hailing driver can be represented by a tuple , where respectively represent the driver’s current location, income, and status.
Here, indicates the driver’s GPS information at time t. When the driver is in a free state, their income at time t is zero. When assigned to task r, their income is the unit time earnings brought by the order, calculated as .
Furthermore, a driver’s status can be categorized into three states: offline, idle, and on duty. The range of values for
is
. When the driver is offline,
is 0. When the driver is idle or on duty,
is 1. Within a time window, it is assumed that the value of
remains constant. A detailed explanation of the symbols used in this paper is provided in
Table 1.
In evaluating actual ride-hailing matching algorithms, many existing research approaches simulate batches of independent drivers for each time window based on the actual spatiotemporal distribution of drivers [
4,
21]. However, in reality, a driver’s matching result in one state often affects their spatiotemporal distribution in the next phase. Therefore, existing algorithm evaluation approaches overlook the impact of algorithms on driver distribution and cannot comprehensively evaluate the effectiveness of algorithms. To make the research scenario more realistic, FMRL maintains a fixed group of drivers and simulates changes in driver distribution through actual order acceptance, repositioning, and online/offline behaviors.
3.1.2. Bipartite Matching
Definition 3. (Bipartite Graph) The bipartite graph represents the matching status between drivers and orders at time t.
Here, the sets and respectively represent the set of orders available for matching and the set of idle drivers at time t. If driver w and order r can be matched, then there exists an edge in the bipartite graph. The weight of the edge is denoted by .
In setting the edge weights, traditional ride-hailing matching algorithms (such as the Distance-Based Greedy Algorithm or Earnings-Ratio-Based Greedy Algorithm) often set them according to the objectives they aim to optimize (e.g., distance between driver and order, earnings ratio of the order). In this paper, to design a ride-hailing matching algorithm that balances both the total efficiency of the platform and the fairness of driver income, the earnings of orders and the cancellation rate are taken into consideration. Here, the cancellation rate is predicted based on the customer’s historical order behavior.
3.2. Time Window Matching Model
To simplify the problem as much as possible, the existing research has largely focused on studying the ride-hailing matching problem in static scenarios where all information about drivers and orders is known in advance. Hence, with predetermined optimization objectives and constraints, and given that all inputs are known beforehand, static matching algorithms can achieve globally optimal solutions. However, in real-world scenarios, passenger orders often require real-time responses, making traditional offline solutions impractical.
To implement dynamic matching in ride-hailing services, an intuitive solution is to immediately match new orders with available drivers as they arrive. However, once a match is made, it cannot be undone, even if a more suitable driver becomes available in the next moment or if an order arrives that is closer to or more profitable for the already matched driver. Changing the match could improve overall performance. Therefore, the immediate matching algorithm has a shortsighted flaw, leading to local optima and compromising the global optimization goal. Additionally, this order-arrival-based computation model significantly reduces algorithm efficiency when the volume of orders increases, failing to meet the need for algorithmic efficiency.
To balance the real-time needs of passengers while considering algorithm efficiency and optimization objectives, this paper adopts a time window matching model [
7,
8]. In designing the size of the time window based on long-term exploration in the industry, FMRL chooses every two seconds [
39] as a time window in which to perform bipartite graph matching once for new orders arriving on the platform and idle drivers based on the designed algorithm strategy. The time window matching model is widely used in ride-hailing matching platforms [
18,
39,
40].
3.3. Algorithm Evaluation Criteria
This subsection primarily explores the evaluation criteria for algorithms that balance the overall efficiency of the platform with the fairness of driver income. First, we introduce the definition of platform utility evaluation metrics; secondly, we present the definition of fairness evaluation metrics and their representation for optimization.
3.3.1. Utility Function
Definition 4. (Utility Function) Given the set of drivers W and the set of tasks R, the total utility function of the platform is the sum of all drivers’ expected earnings before time T, expressed by the following equation: Here, each driver’s expected earnings depend on the sum of all matched order earnings during their service time as follows:
Based on this definition, the paper uses the utility function as an evaluation metric for the algorithm in optimizing the total revenue of the platform.
3.3.2. Fairness
In terms of fairness evaluation metrics, the existing research often uses amortized fairness [
7] to characterize and optimize income fairness among drivers.
Definition 5. (Amortized Fairness) Amortized fairness is defined as the unit time earnings of drivers during their online periods. However, due to the differences in working hours and patterns among drivers, amortized fairness does not adequately reflect the fairness of earnings between drivers. For instance, there will inevitably be differences in earnings between drivers who primarily work during the day and those who work at night. Additionally, the city in which a driver operates and their frequent areas of activity can also impact their unit time earnings. Therefore, enforcing the same unit time earnings for drivers in each time period and area can actually harm the fairness of driver income. To offset the impact of differences in driving habits, this paper defines weighted amortized fairness.
Definition 6. (Weighted Amortized Fairness) Weighted amortized fairness refers to the cumulative weighted earnings per unit time for drivers during their online periods.
where
represents the weighting factor used to normalize the income for different times of the day. Since drivers often assess their earnings based on daily and hourly wages in actual matching scenarios [
41], the formula defines
T as the interval for one day and
t as the interval for two seconds, with
being the average hourly wage of drivers during that time period.
As can be seen from the formula, weighted amortized fairness, building upon the concept of amortized fairness, divides each driver’s hourly earnings by the average hourly wage of drivers during that time period. This calculation method aims to eliminate the impact of drivers’ working habits on the fairness metric as much as possible. However, this type of fairness is established only on an individual driver basis. To evaluate the algorithm’s protection of individual driver fairness from a macro perspective, temporal earnings fairness is defined.
Definition 7. (Temporal Earnings Fairness) Given the set of drivers W and the dynamically arriving set of tasks R, the overall temporal earnings fairness of drivers is measured by the entropy change of the weighted average amortized fairness. The formula for calculating temporal earnings fairness, which is the metric for evaluating the fairness of the algorithm in this paper, is as follows: When F is larger, it indicates that the distribution of the amortized fairness metric among drivers is more dispersed, implying poorer income fairness among drivers. Therefore, the optimization objective for fairness is to minimize temporal earnings fairness.
4. Method
We adopt a fairness allocation algorithm based on reinforcement learning. First, we provide an overview of this approach, discussing its framework, implementation mechanism, and design philosophy. Next, we explore the specific implementation mechanisms, optimization ideas, and algorithmic processes of each submodule. Finally, we discuss the integration of the algorithm.
4.1. Algorithm Overview
The fairness allocation algorithm based on reinforcement learning optimizes the two following key metrics: total platform revenue and driver income fairness. In optimizing platform utility, traditional algorithms are limited by their inability to effectively forecast future arrivals, exhibiting shortsightedness compared to optimal matching results in static scenarios.
To overcome this shortsightedness, the fairness allocation algorithm based on reinforcement learning introduces a reinforcement learning mechanism in setting edge weights. It adjusts the weights according to the matching situation and the relative value of the order’s starting and ending regions, allowing the matching result to consider future order arrivals and driver spatiotemporal distribution. In terms of optimizing driver income fairness, the algorithm considers this aspect during the matching process, aiming to reduce the income disparity among drivers. The algorithm operates online, dynamically considering the supply and demand of drivers and orders. Additionally, by incorporating pruning and various acceleration mechanisms, the algorithm ensures efficient matching on large datasets, and the algorithm overview is shown in
Figure 1.
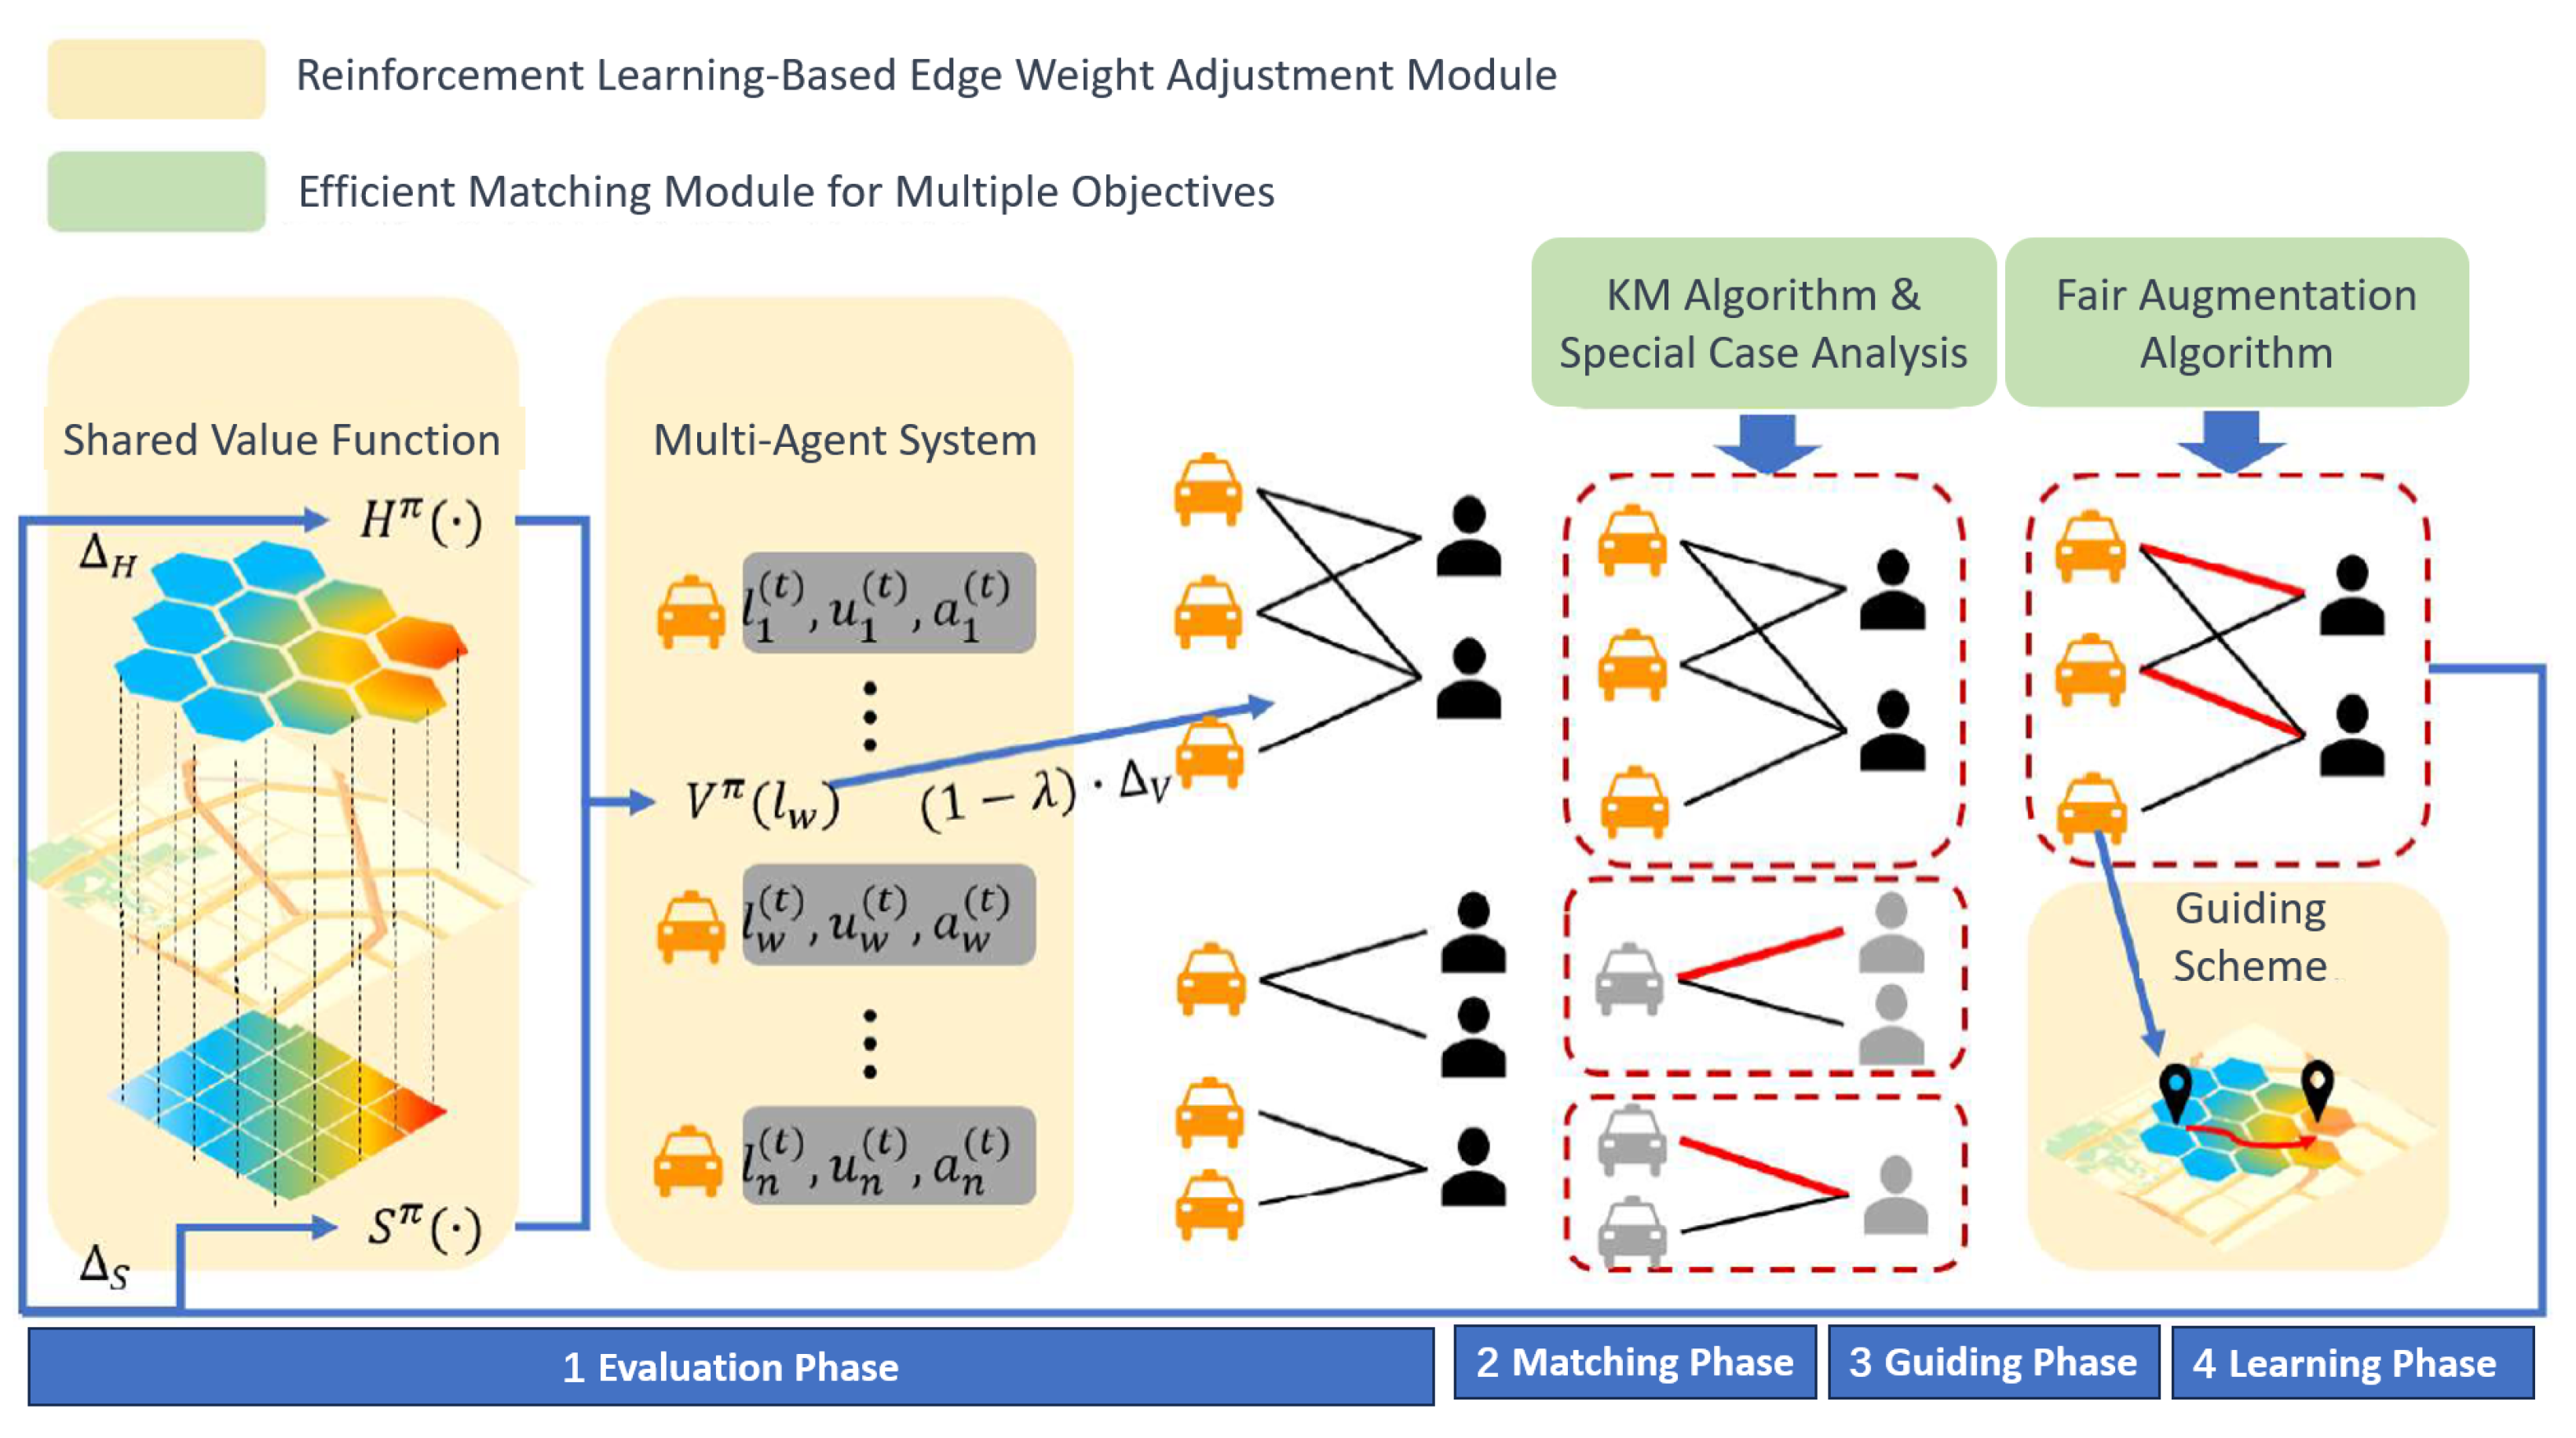
The fairness allocation algorithm based on reinforcement learning consists of a value prediction module based on reinforcement learning and an efficient matching module for multiple objectives, detailed in
Figure 2.
- (1)
Value prediction module based on reinforcement learning: This module adjusts the weights of edges in the bipartite graph to better reflect the two following optimization objectives: total platform efficiency and driver income fairness. In traditional solutions, edge weights are usually set as the earnings of individual orders to optimize platform efficiency. This module balances platform efficiency and driver income fairness by incorporating the impact of current matches on future spatiotemporal distribution and individual driver fairness metrics into the edge weight design. Here, total platform efficiency is reflected by the income of individual orders, and driver income fairness is represented by a regional value function reflecting the current and future volume of orders in a region. The adjustment of edge weights is achieved through online reinforcement learning. Additionally, to alleviate the cold start issue in online learning, a driver guidance algorithm is designed;
- (2)
Efficient matching module for multiple objectives: This module performs matching on the bipartite graph after the adjustment of edge weights. The core of this module is the Fairness Augmentation Algorithm, which fundamentally implements the KM algorithm. To ensure fairness, the augmentation process includes checks for temporal earnings fairness, achieving bipartite graph matching that balances fairness and efficiency. Furthermore, to enhance algorithm efficiency, the module improves performance in large-scale, sparse graphs through special case determinations.
4.2. Value Prediction Module Based on Reinforcement Learning
This subsection introduces the specific implementation mechanism of the reinforcement learning mechanism.
4.2.1. Edge Weight Adjustment Formula Based on Online Reinforcement Learning
In reinforcement learning, an agent continually interacts with the environment and updates the value function based on the feedback to its actions from the environment. represents the expected cumulative reward that agent w can obtain under the current state by taking the next action according to policy . The optimal policy can be learned by constantly interacting with the environment and evaluating the feedback obtained from these interactions.
In the ride-hailing matching scenario, each driver is an agent. In each time window, the agent can perform one of the following two actions: serve the order r assigned by the platform or remain idle. The corresponding rewards for these choices are and 0, respectively, representing the driver’s expected income from making this choice. The state of driver w is represented as , where is their location in time window t. To more accurately optimize the driver–task matching situation in each time window from both the perspective of fairness and total revenue, represents the value function obtained by driver w making a choice under policy in time window t.
As the optimization objective includes fairness, ensuring as small a difference as possible in each driver’s income, some trade-offs must be made in total platform revenue. Therefore, optimizing for fairness to some extent contradicts the goal of maximizing total platform revenue. Under two conflicting optimization objectives, directly specifying policy
presents certain difficulties. Hence, we adopt an iterative approach to learning the value function with the policy, as demonstrated below.
where
represents the learning rate, and the calculation formula for
is as follows:
The introduction of the reinforcement mechanism is aimed at better characterizing and predicting future scenarios. Therefore, whether the policy is learned or not is not the primary concern of this paper. For convenience, after formulating the value function based on iterative updates, its superscript is omitted. Additionally, the matching algorithm incorporating online reinforcement learning is also applicable to learning short-term dynamic data.
4.2.2. Reducing the Size of the State Space
For an agent, i.e., a driver, in a given time window, changes can be made in both spatial and service states. The spatial state is represented by , and the time state by . If a city is divided into square kilometers, and time is divided into the average service duration of an order, which is 20 min, the combined spatial and temporal states result in a state space of over 500,000 choices for each agent. Even if each agent works for 14 h a day—the maximum allowed by the platform—and makes one state change in each time window, the maximum number of states explored per day is only 250,000. The vastness of the state space, coupled with the limited capacity to explore it, makes it difficult for agents to effectively learn through reinforcement. Therefore, it is necessary to reduce the size of the state space. However, simple state discretization does not adequately address this issue. This paper adopts the following two methods to reduce the state space available to agents.
- (1)
Approximating the spatial value function
Previously, to eliminate the impact of individual driver service patterns on fairness metrics, drivers’ earnings were divided by the average earnings of drivers in that hour. Compared to an hour, the average duration of each order is only twenty minutes, making the temporal factor’s impact on the function’s value negligible. Therefore, in calculating the value function for individual orders, only the spatial factor’s impact on the function value is considered, i.e.,
. Thus, the update function can be rewritten as follows:
where
is the discount factor. When the duration of an order is longer, the value function of the destination has a smaller influence on the driver’s decision to accept the order, effectively correcting the approximation error for long-distance requests.
- (2)
Information sharing among agents
In the ride-hailing matching scenario, all drivers’ actions are aligned with the goal of optimizing their total earnings. Therefore, drivers in the same spatiotemporal state should have a converging assessment of the value of a certain location. Consequently, all agents adopt a shared value function, which effectively circumvents the limited exploration capabilities of individual agents and, to some extent, alleviates the challenges that a large state space poses to the convergence of the value function. By applying this strategy, the update equation can be simplified as follows:
where
is the normalized learning rate,
l is the region in which the driver is located, and the value function of region
l is the sum of this expected original value function and the ‘earnings’ of all drivers in that region during this time window.
The contributions of the above two optimization strategies to reducing the size of the state space can be summarized as follows: (1) By applying an approximate spatial value function, the temporal factor’s impact can be ignored, reducing the state space size from to . (2) Using information sharing among agents allows all drivers to collaboratively explore a single value function, thereby greatly reducing both the total number of states in the state space and the relative value of the state space exploration capability.
4.2.3. Algorithm Adaptability
In traditional ride-hailing matching applications, space is often discretized [
40], limiting the portability of value function computation methods. To eliminate this impact, this paper smooths the value function over space with the following specific strategies: (1) discretizing space into two layers based on different division methods; (2) smoothing the value functions of different layers.
In this paper, the two layers of discretization are hexagonal and quadrilateral layers. The hexagonal layer is composed of hexagonal grids, while the quadrilateral layer is composed of quadrilateral grids. Based on the geometric characteristics of these two types of grids, different smoothing strategies are set. In the hexagonal layer, each grid has six symmetric sides and six completely equivalent adjacent grids. The value function is smoothed through the adjacent grid values around the central grid, making it more fitting for irregular urban layouts. In the quadrilateral layer, the latitude and longitude of the sides are identical, making it more suitable for exploring reasonable value functions in regular areas. In
Figure 3, the value function of the hexagonal layer reflects the distribution of the city’s main thoroughfares, and the value function of the quadrilateral layer reflects the radiation situation of the city center. Thus, by combining these two types of regional division, a location’s value can be effectively and comprehensively characterized. Next, we will provide a detailed introduction to the geometric characteristics of hexagonal and quadrilateral layers.
- (1)
Characteristics of hexagonal layers:
- (a)
Uniformity and symmetry: Due to their six-fold symmetry, hexagonal layers offer higher uniformity and symmetry compared to quadrilateral layers. This means that, in a hexagonal layer, each cell has a consistent distance to its neighboring cells, which helps reduce directional bias during spatial analysis [
42];
- (b)
Coverage efficiency: Hexagons provide the smallest perimeter for the same area, which means they are more material efficient when covering large areas compared to quadrilateral layers. Therefore, in applications requiring equal area division, hexagonal layers can cover space more effectively, reducing edge effects;
- (c)
Adjacency consistency: Hexagonal layers have six direct neighbors. This consistency aids in more accurate spatial analysis, especially in simulating natural phenomena (such as fluid dynamics or population migration), providing a better reflection of actual conditions.
- (2)
Characteristics of quadrilateral layers:
- (a)
Simplicity and compatibility: Quadrilateral layers have a simple structure and are highly compatible with existing map projections and computer display systems, making them easy to implement and use, especially in standard GIS (Geographic Information System) software and computer graphics;
- (b)
Computational efficiency: In some computational processes, quadrilateral layers may offer higher computational efficiency due to their simple structure. For example, in raster analysis or image processing, quadrilateral layers can directly correspond to pixel layers, simplifying calculations;
- (c)
Adaptability: Quadrilateral layers can better adapt to irregular boundaries and linear structures, which is particularly useful in applications such as urban planning and architectural layout. Quadrilateral layers can be more easily resized and shaped to fit specific geographical features.
Finally, the smoothed value function is defined as follows:
where
H and
S respectively represent the value functions of the hexagonal and quadrilateral layers, and their update methods are as shown in Equation (
10).
and
respectively indicate the smoothing directional offsets for the two layers, meaning that the value function of each location is the average value of the adjacent quadrilateral and hexagonal grid layers.
4.2.4. Avoiding the Cold Start Problem
Due to the characteristics of online reinforcement learning, the value function is initialized to 0 in the initial stage of online learning, causing the estimated edge weights to degenerate into initial weights (the earnings of individual orders). This problem is known as the cold start problem. The cold start issue results in the inability of the matching results to effectively incorporate predictions for future orders in the initial stage of matching.
To overcome the cold start issue, this paper guides drivers to appropriate locations in the initial stage of learning. Where a driver is guided depends on the distance and the increment of the value function. To simplify this issue, the hexagonal region value function is used as a guiding objective.
4.2.5. Algorithm Integration
The edge weight adjustment method based on reinforcement learning comprises three stages: evaluation, learning, and guidance.
The primary purpose of the evaluation stage is to analyze the current state of the environment and make reasoned estimates of the value of various grids. This stage uses historical data and real-time information (such as driver locations, passenger requests, and rejection rates) to assess the value of each area, thereby determining which areas are more attractive to drivers, as shown in Algorithm 1.
Suppose a city is divided into multiple hexagonal grids. During the evaluation stage, the algorithm identifies that a particular hexagonal grid area (Area A) experiences a significant increase in ride requests during the evening rush hour, while adjacent Area B has relatively lower demand. Based on this information, the algorithm adjusts the value score of Area A upwards, reflecting its high demand during specific times.
| Algorithm 1: The evaluation stage of the value prediction module. |
![Electronics 13 00775 i001]() |
The learning stage of the value prediction module, based on actual matching results, updates the value functions of the quadrilateral and hexagonal network layers, and the learning stage updates the value functions based on the analysis of matching results, i.e., it learns and adjusts the value assessments of each area based on the actual effectiveness of matches. The goal of this stage is to ensure that the value prediction module can continuously adapt to changes in the environment, improving the accuracy of predictions and matching efficiency, as shown in Algorithm 2.
Continuing with the evaluation stage example: if the adjusted matching strategy leads to an increased rate of driver acceptance in Area B, the learning stage would update the value score for Area B based on this outcome. This indicates that increasing the attractiveness of Area B helps balance driver distribution and improve service coverage.
| Algorithm 2: The learning stage of the value prediction module. |
![Electronics 13 00775 i002]() |
To avoid drivers in ‘cold zones’ waiting blindly for a long time, the guidance stage of the value prediction module directs idle drivers to locations where they are more likely to receive orders. Based on the actual value functions of each location and their proximity, the algorithm provides real-time recommendations to drivers, helping them more efficiently locate their next passenger. The guidance stage of the value prediction module is shown in Algorithm 3.
In the scenario evaluation and learning example, suppose the algorithm determines that Area C is expected to have high demand in the next few hours. The guidance stage would recommend drivers nearby to move towards Area C even if the current request volume in that area is not high. This predictive guidance helps preempt potential demand spikes, reducing passenger wait times.
| Algorithm 3: The guidance stage of the value prediction module. |
![Electronics 13 00775 i003]() |
4.3. Efficient Matching Module for Multiple Objectives
This module specifically discusses how the matching algorithm optimizes for both total platform efficiency and driver income fairness.
For dual-objective optimization problems [
43], the existing research often adopts linear programming algorithms [
7] and reallocation algorithms. However, linear programming algorithms are often very inefficient due to the complexity of constraints and the diversity of optimization goals. Meanwhile, reallocation algorithms require different matching results for different optimization goals followed by adjustments and trade-offs between these results. Neither method is straightforward or efficient. This paper embeds fairness checks directly into the matching process for efficient optimization of both objectives.
The basic augmentation algorithm uses the KM algorithm [
44] to maximize total platform efficiency. The core idea of the KM algorithm is to traverse each node in the graph and find an augmenting path that alternates between unmatched and matched edges. If the sum of the weights of unmatched edges is greater than that of the matched edges, the matched edges are turned into unmatched edges, and vice versa, to increase the total platform efficiency in the current match.
The core idea of the Fairness Augmentation Algorithm is to check the future earnings ratio of each driver when a replaceable augmenting path is found. If there is a significant difference in future earnings between drivers, this augmenting path is not used. However, refusing augmentation for the sake of fairness can somewhat reduce total platform revenue. Moreover, checking fairness for each augmentation adds some time, affecting the efficiency of the algorithm. To minimize the impact on total revenue and efficiency, only the fairness difference between two adjacent drivers on the augmenting path is checked. If it is within a certain range, the augmentation is accepted. Algorithm 4 describes the Fairness Augmentation Algorithm, which has a time complexity of
, where
,
.
| Algorithm 4: Fairness Augmentation Algorithm. |
![Electronics 13 00775 i004]() |
5. Experiments
This section first introduces the specific experimental setup, including the hardware environment, datasets, and comparison algorithms. Next, a preliminary assessment of the experimental results is provided. Then, using real-world datasets, detailed analysis and interpretation of the algorithm’s effectiveness are conducted. Finally, the fairness and effectiveness of the fairness-aware dynamic ride-hailing matching based on reinforcement learning (FMRL) algorithm are evaluated.
5.1. Experimental Setup
The order data for the experiment come from real data of the Didi ride-hailing platform from three major cities in Southwest, East, and Central China. Based on actual driver data, behaviors such as order rejection and logging on and off are simulated. To verify the portability of the proposed algorithm to different city data, experiments were conducted on real data from these three cities over a period of 21 days. To validate the effectiveness, fairness, and efficiency of the algorithm horizontally, four common algorithms in the ride-hailing matching scenario are used as benchmark algorithms.
The specific environment uses an Intel Xeon CPU E5-2630 v4 with 12 GB of RAM, running on Centos 7 OS, and the programming language is Python 3.8.
5.2. Comparison Algorithms
- (1)
Distance-Based Greedy Algorithm (DG): Based on the idea of greediness, this algorithm matches each request to the nearest driver. It is a simple and naive algorithm widely used in the industry;
- (2)
Earnings-Ratio-Based Greedy Algorithm (ERG): Within a time window, firstly, idle drivers are sorted in descending order based on weighted amortized fairness, and incoming platform orders are sorted in descending order of earnings ratio. Then, matching is performed according to the order of the two sorted lists, ensuring drivers with lower earnings ratios receive the more profitable orders as much as possible;
- (3)
Integer Linear Programming (ILP) algorithm [
7]: This is the first work to use amortized fairness as an income fairness evaluation criterion. In this algorithm, the amortized fairness of drivers is taken as the optimization objective;
- (4)
Reassignment algorithm [
8] (REA): First, two types of matching results are obtained based on total platform utility and driver fairness, then adjustments are made based on these two results, striking a balance between total platform utility and fairness. This is currently the only method that optimizes across both dimensions of total platform utility and fairness.
5.3. Algorithm Evaluation
This subsection evaluates the algorithm in three dimensions: fairness, platform utility, and efficiency. Definitions of fairness and platform utility have already been introduced in
Section 3, and efficiency is assessed by the time consumed by the matching algorithm to process orders per hour. The specific parameters of the algorithm are shown in
Table 2.
The experiment was conducted on real data from three major cities in Southwest, East, and Central China, labeled as cities A, B, and C. The overall experimental results are summarized in
Table 3.
Table 3 briefly describes the fairness and efficiency indicators of the algorithm on datasets from the three cities. Across the data from all three cities, our proposed algorithm showed an improvement of 45.5% to 81.4% in fairness indicators on weekdays and 52.0% to 86.7% on weekends compared to the baseline algorithms. For platform utility indicators, there was an improvement of 7.7% to 29.1% on weekdays and 11.3% to 28.5% on weekends, as shown in
Table 4.
Figure 4 visually present the utility function, amortized fairness, and temporal earnings fairness distribution for the five algorithms.
It is evident that the proposed FMRL outperforms the other four algorithms in terms of efficiency, effectively ensuring the income fairness of drivers.
In specific algorithm comparisons, compared to the Integer Linear Programming (ILP) algorithm, FMRL showed an average improvement of 68.4% in fairness and 22.1% in platform utility. Compared to the Reassignment algorithm (REA), it showed an average improvement of 69.3% in fairness and 20.1% in platform revenue. Overall, the proposed algorithm consistently outperformed the baseline algorithms on real order data from the three cities in terms of total platform revenue and fairness.
Figure 5 compares the efficiency of different algorithms in cities A, B, and C.
The Distance-Based Greedy Algorithm (DG) and the Earnings-Ratio-Based Greedy Algorithm (ERG), due to their simplistic algorithmic concepts, have time complexities of and , respectively. As their problem-solving approach and mathematical modeling are consistent, these two algorithms have a similar runtime to our proposed algorithm, but their results are poorer in terms of fairness and efficiency metrics due to their single-objective greedy approach.
The Integer Linear Programming (ILP) algorithm and Reassignment algorithm (REA), due to their fundamentally different approaches and methods, can take up to eight times longer to run than the algorithm proposed in this paper. Additionally, changes in traffic conditions significantly impact the runtime of these two baseline algorithms. During peak hours, when orders flood in, the time consumption of these algorithms surges. Furthermore, the efficiency of the ILP algorithm is also constrained by the number of drivers, and the algorithm’s efficiency does not significantly improve even when there are fewer orders.
5.4. Case Analysis
To scientifically elucidate the effectiveness of the algorithm, this subsection delves into an in-depth analysis of the algorithm’s operating mechanism based on data from city A.
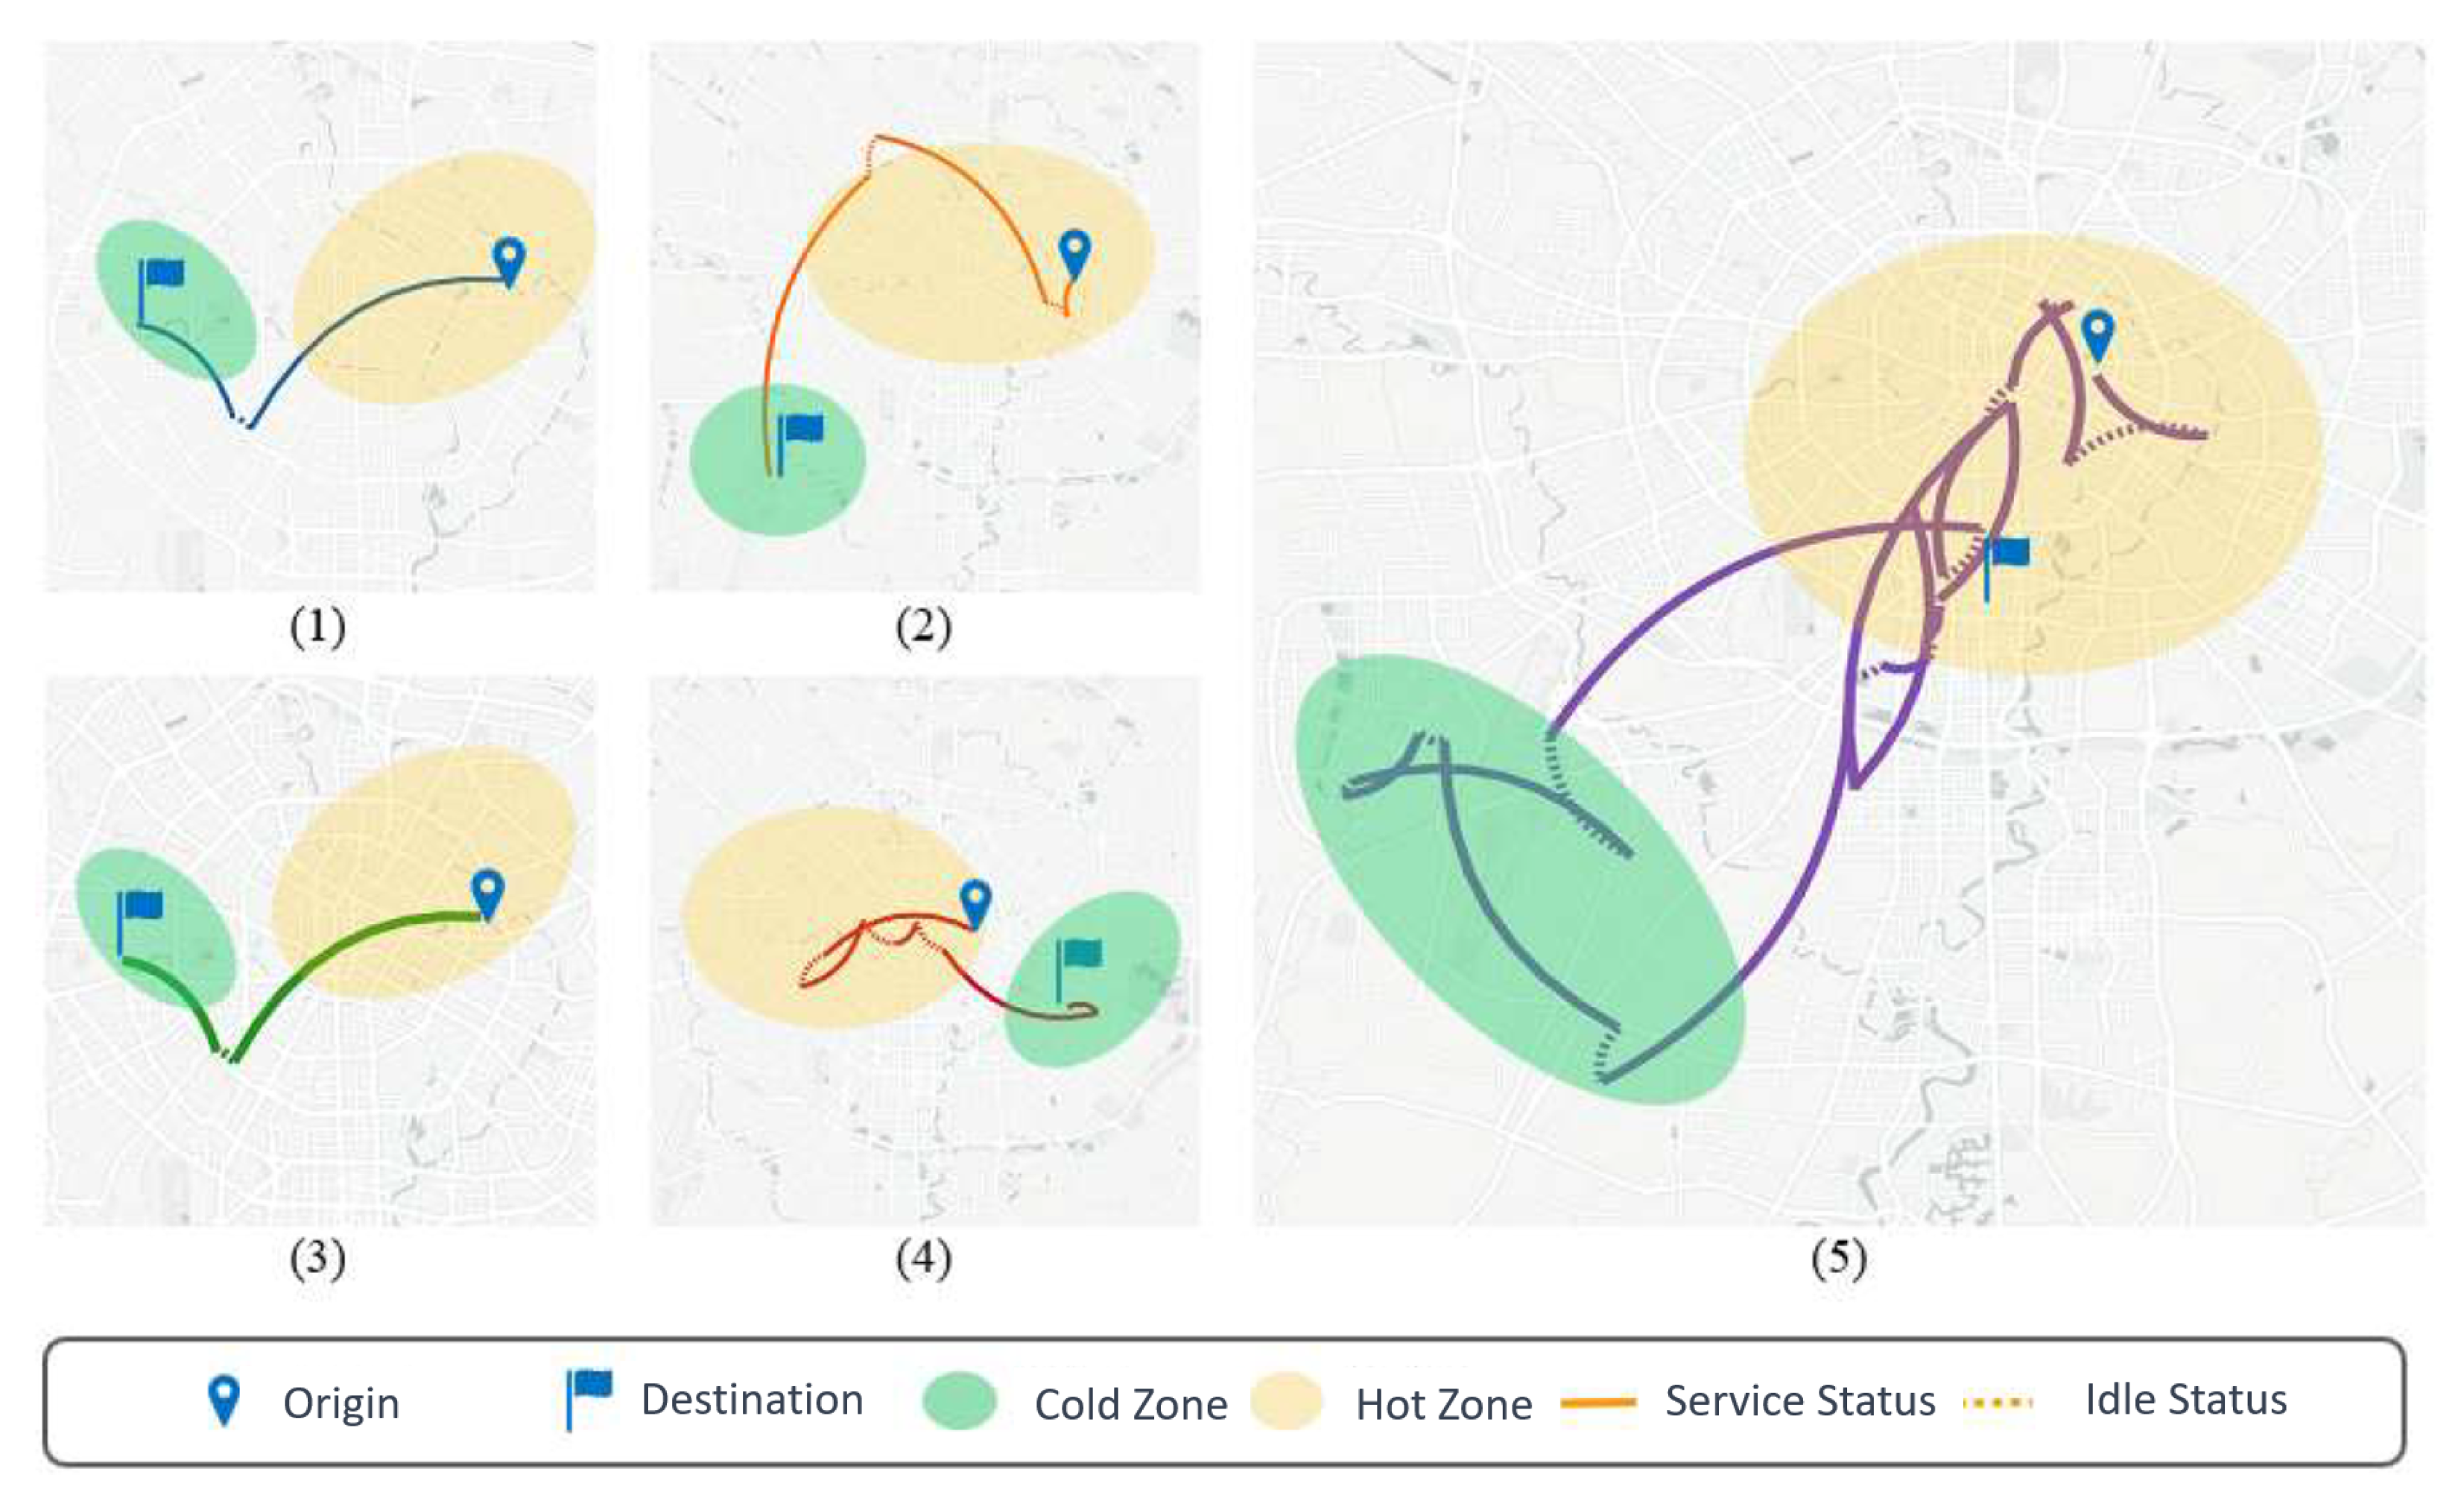
Figure 6 shows the adjustment mechanisms of different allocation algorithms for long-distance orders from city A’s data.
Figure 6(1) corresponds to the Distance-Based Greedy Algorithm,
Figure 6(2) to the Earnings-Ratio-Based Greedy Algorithm,
Figure 6(3) to the Integer Linear Programming algorithm,
Figure 6(4) to the Reassignment algorithm, and
Figure 6(5) to the Fairness Matching Reinforcement Learning (FMRL) algorithm, i.e., the FMRL algorithm proposed in this paper.
The Distance-Based Greedy Algorithm only matches drivers to the nearest orders, failing to effectively balance driver income and the prediction of future order arrivals. Once a match is made, even if more suitable orders arrive later, the driver cannot be matched to them. This approach does not effectively ensure driver income fairness.
The Earnings-Ratio-Based Greedy Algorithm only considers the highest earnings ratio of previous orders received by a driver when matching. Drivers serving the highest-earning orders are later matched to orders with lower earnings ratios. It does not take the distance between orders and drivers into account, resulting in lost platform revenue. It also fails to effectively assess future earnings, harming driver income fairness.
The Integer Linear Programming algorithm reduces the priority of a driver to receive orders after serving a long-distance order as their earnings ratio becomes very high.
The Reassignment algorithm strikes a balance between fairness and platform efficiency. Experimental results show that it can improve platform efficiency by increasing order matching rates. However, it still fails to consider situations where drivers in remote areas cannot receive orders; thus, it does not effectively ensure driver income fairness.
The Fairness Matching Reinforcement Learning (FMRL) algorithm takes into account the impact of current allocations on future spatiotemporal distribution and fairness. In addition, the guidance algorithm for drivers effectively avoids leaving drivers stranded in remote areas. As shown in the figure, when a driver completes several orders in the central area and their earnings ratio is high, the platform tends to assign them a long-distance order. Afterwards, to prevent drivers in remote areas from being unable to receive orders for extended periods, the platform guides them to areas where they can receive orders, helping them return to central areas.
5.5. Algorithm Fairness Evaluation
One of the core contributions of this paper is the incorporation of weighted amortized fairness.
Figure 7a shows the daily changes in the number of drivers, the number of requests, and the weighted amortized fairness
(the reciprocal of the median income per unit time of drivers).
From the number of drivers and orders, we can infer the traffic situation for each time period. There is a surge in the volume of driver orders from 6 AM to 8 AM, reaching a peak at noon and then gradually declining. The variation in the weighted amortized fairness generally follows this pattern. Temporally, its trend slightly precedes the volume of driver orders, thereby effectively predicting future traffic conditions.
Figure 7b shows the hourly wages of 3500 randomly selected drivers. It is evident from the graph that the FMRL algorithm effectively ensures the fairness of driver income. Compared to other algorithms, the distribution by the algorithm proposed in this paper averages the income of the 3500 drivers, reducing the number of drivers with excessively high and low incomes.
5.6. Algorithm Effectiveness Evaluation
To holistically assess the effectiveness of the algorithm, the four baseline algorithms and the proposed algorithm are evaluated on weekdays and weekends across the dimensions of amortized fairness and total platform revenue.
Table 5 shows that, even though the Integer Linear Programming algorithm and the Reassignment algorithm among the benchmarks consider the fairness indicator, the FMRL algorithm still achieves an improvement of 57.9% to 62.2% in fairness indicators and 17.3% to 17.6% in total platform efficiency compared to the other four benchmark algorithms.
When evaluating the performance of the five algorithms on weekdays and weekends, the proposed algorithm showed stable performance and consistent improvement, performing even better on weekend data. In conclusion, the FMRL algorithm outperforms existing algorithms in terms of total platform efficiency, driver fairness, and algorithmic efficiency.
6. Conclusions and Future Work
This section first summarizes our work presented in this paper and then reflects on and anticipates future works.
6.1. Conclusions
This paper has designed a fairness-oriented dynamic matching algorithm for ride-hailing services, effectively optimizing both the total platform efficiency (expected total income of drivers) and driver income fairness (weighted amortized fairness entropy among drivers). The core contributions of this work are as follows:
- (1)
Considering future matching scenarios: To overcome the shortsightedness of existing research algorithms and to optimize the fairness allocation algorithm globally, future potential spatiotemporal distributions of drivers and orders are reasonably considered when making matches. Additionally, a guidance algorithm is designed to direct drivers to areas where they are likely to receive future orders, preventing the issue of drivers waiting a long time without orders;
- (2)
Designing a reinforcement-learning-based fair allocation algorithm: The value function at each location incorporates the matching results of previous orders, thus introducing the value function of the start and end points of orders into the edge weight. This approach allows the driver–order edge weight to reflect future earnings scenarios. Moreover, the value functions of locations are determined jointly by quadrilateral and hexagonal layers, effectively reflecting the distribution of the city center and main thoroughfares. This calculation method performs well in cities of various sizes, making the algorithm highly portable;
- (3)
Validation on real datasets: The algorithm’s effectiveness, fairness, and efficiency were validated through experiments on real datasets. Unlike previous studies where drivers are generated independently at each moment, this experiment considered the impact of the matching algorithm on the real distribution of drivers, maintaining a fixed group of drivers and simulating their behaviors of logging on and off and accepting and rejecting orders. Thus, the data were more closely aligned with real situations, making the experimental results more credible.
6.2. Future Work
There are several issues to be explored and expanded upon in future research.
Firstly, regarding fairness calculation indicators, currently, only the income fairness of the driver community is considered. Issues like preferential treatment of certain customers by platforms such as Ele.me highlight the need for ensuring fairness among customer groups as well. In the future, the connotation and definition of passenger fairness indicators can be explored, and constraints for this type of fairness can be introduced into the algorithm.
Secondly, the existing definitions of fairness have certain limitations and are only applicable to specific groups for specific problems. Therefore, based on this, more generalized definitions and mechanisms for fairness can be explored.
Finally, simulators that mimic real traffic conditions are a current research hotspot. In the future, designing simulators that more closely resemble real situations can be explored, for instance, maintaining a fixed group of passengers, protecting current data as much as possible in the generation process, and ensuring greater autonomy. Additionally, the efficiency of simulators should be considered, requiring cross-platform integration and parallel operations.


