1. Introduction
The digital transformation of the manufacturing industry value chain is the enabling foundation for advancing the manufacturing industry towards the high end of the value chain. The collaborative mode of the manufacturing industry value chain based on third-party cloud platforms provides support for integrating business data resources and business collaboration among enterprise clusters in the entire automotive industry chain, including OEMs, suppliers, distributors, and service providers. Through business integration and data integration on third-party cloud platforms, enterprise clusters such as automotive OEMs, component suppliers, vehicle dealers, and repairers have formed a cross-enterprise value chain collaborative network, thereby the collaborative mode of multiple value chains in the manufacturing industry emerges.
The multi-value chain constitutes an organic aggregation comprising multiple industrial value chains, with core enterprises serving as central nodes. Through a series of value-added activities, it extends business collaboration among enterprises limited to single value chains to multiple value chains. The essence of multi-value chain collaboration lies in integrating business data resources for value chain collaboration based on cloud platforms, thus realizing the business collaboration mode across enterprise value chains and industrial value chains.
Business data resources refer to the processes and forms utilized by enterprises for collaborative business purposes, offering a comprehensive data description of a business entity. To organize and manage business data resources supporting multi-value chain collaboration and to facilitate enterprise users in exploring the data value, numerous teams have developed multi-value chain data spaces [
1,
2].
The multi-value chain data space is a complex data environment characterized by attributes such as “multi-temporal, multi-level, multi-modal, and multi-agent” characteristics. The complexity of this data environment primarily manifests in four aspects: (1) the structural complexity of business data resources; (2) the semantic heterogeneity of business data resources; (3) the complexity of relationships among business data resources; and (4) the variability of the data utility value across different usage scenarios. Therefore, clarifying the categories of business data resources from multiple dimensions is an important approach to simplifying the complexity of the data environment.
However, in multi-value chain data spaces, the physical and logical distribution of data storage is either structured or unstructured. The modalities, formats, and granularity of the data are irreconcilable yet interdependent, creating management demands fraught with uncertainty. Therefore, it is challenging to identify a unified data management framework capable of effectively managing these complex data resources. Reference [
3] proposed a semantic association-based big data classification method. Although this method relies on event-driven data classification and mining, it cannot avoid the issue of a data cold-start. Nevertheless, this study achieves multimodal, multi-entity, and multi-level big data classification management from the perspective of semantic categorization.
In the context of digital transformation, understanding “data as a representation of the objective world” is particularly important [
4,
5]. Clustering and classification are fundamental data intelligence methods for understanding the real world through data [
6]. There are two primary logics for data classification: business collaboration logic and physical storage logic. Classifying business data from the perspective of business collaboration logic is primarily a method to characterize business features and value using data [
7]. On the other hand, classifying data based on the logic of physical storage aims to facilitate data management rather than understanding or extracting business value [
8].
A multi-value chain data space [
9] is a typical foundational platform that features a complex data environment. This paper addresses issues such as the lack of methods for managing business data resources in complex data environments, the difficulty of structured data integration, and the challenges in business semantic recognition. A semantic management-based approach for business data resource classification is proposed. Additionally, the shared management of multi-value chain business data across different value chain stages faces numerous challenges in data security and privacy management, which undoubtedly increase the complexity of data management. Therefore, classifying data provides a foundational basis for the precise identification of sensitive data and tiered classification for data security management.
The core work of this study is the Business Data Resource Classification Algorithm for a Multi-Value Chain Data Space (BDRCA4MVCDS), a semantic association-based data clustering algorithm that serves as a framework for managing complex physical data through classification aligned with business logic. Within this algorithmic framework, we constructed a multi-value chain business vocabulary and proposed a BERT (Bidirectional Encoder Representation from Transformers, BERT)-based semantic feature transformation for business data resources, simplifying the complex multi-level, multimodal data environment using business relationships. Finally, we not only achieved the classification management of business data resources, but also demonstrated, through comparisons with two other algorithms, the excellent performance, stability, and adaptability of the proposed clustering algorithm in classifying and clustering business data resources in multi-value chain data spaces.
This study is structured around three main aspects: problem identification, the proposal of a research framework, and the validation of the proposed method. The overall organization of the content is as follows.
The
Section 1 is the introduction. This section analyzes the complexity of data objects and the tools used to manage data platforms, highlighting the numerous challenges faced in big data management.
The
Section 1 is the introduction. This section analyzes the complexity of data objects and the tools used to manage data platforms, highlighting the numerous challenges faced in big data management. Against this backdrop, it summarizes the role of multi-value chain data spaces in simplifying complex data environments and identifies research needs to address the lack of business data resource management methods, challenges in structured data integration, and difficulties in semantic recognition. On this basis, the research theme of this paper is introduced.
The
Section 2 is a review of related research. We compare the progress of current research from two perspectives: the physical storage logic of data and the business logic. It is then pointed out that research on industrial data classification lacks a business semantic perspective, which hinders the realization of the data value. Finally, the importance of research on semantic-based data clustering and classification is emphasized. This leads to a discussion of the main contributions of this study.
The
Section 3 introduces the model framework of the semantic association-based business data resource clustering algorithm. It provides a detailed explanation of the semantic-based multi-value chain business data resource relationship model, the construction process of the multi-value chain business vocabulary, the technical details of business data resource feature transformation, and the KT-MEC-based clustering algorithm.
The
Section 4 primarily demonstrates the effectiveness and superior performance of the core components of this study, such as BDRCA4MVCDS, through clustering performance evaluation and a comparison of various clustering algorithms.
The final section presents the conclusion and summary of this paper. This part distills the main work and contributions of this study while highlighting the existing limitations of the current research. It also discusses the data security management challenges brought about by semantic-based classification management in data sharing across different value chain stages.
2. Related Research Work
Data are crucial for all enterprises as almost all business activities require it. During business execution, data are created and utilized in all daily operations, making it a critical input for almost all decisions. The data composition pattern based on business logic implicitly contains a significant amount of valuable business knowledge within enterprises; therefore, research on the classification/clustering of business data is an important means of making implicit knowledge explicit.
Reference [
10] introduced a two-stage industrial data classification method based on data mining and association rule discovery, aiming to enhance the efficiency of enterprise business data management. In a study of machining industry data space, Reference [
11] constructed a “process-artifact” at the core of the data model description to achieve decentralized industrial data classification management. Reference [
12] interpreted industrial data through ontology or knowledge, linking data with intelligent applications to facilitate enterprise decision making. Reference [
13] enhanced the data value of ERP systems through a classification model based on the data quality; the essence of this work is a DIKW-based data intelligence research unfolded through the data classification model. Reference [
14] addressed the data storage issues in power systems by proposing a graph data organization and management model based on domain ontology and its complex relationships. This approach improved the data query efficiency and data sharing capabilities. The above research on industrial data classification management focuses on the data physical storage logic, aiming to improve the data quality from a data resource management perspective.
Semantic-based data clustering and classification research is an industry consensus for reducing the complexity of big data management [
15]. It offers the following main advantages: (1) Traditional methods often rely on surface-level data features, overlooking the contextual relationships between data. Semantic-based approaches, by exploring the deeper meanings of data, can reveal complex underlying patterns [
16,
17]. (2) By utilizing semantic similarities or semantic-enhanced classifiers, data can be more accurately clustered or classified into the correct categories [
16,
18]. (3) Semantic-based methods are not only applicable to structured data, but also can efficiently handle unstructured data (such as text, images, and videos), enabling the integrated analysis of multimodal data and supporting the unified processing of complex data [
19].
However, current research on semantic-based data clustering and classification mainly relies on machine learning and other black-box algorithm models to construct classifiers [
20,
21]. This heavily depends on the quality of the training dataset for the model algorithms, and the reliability of the classification predictions remains to be verified [
21]. Therefore, we aim to leverage the prior knowledge of domain experts to directly understand data objects from a business logic perspective. This approach is more conducive to making implicit data explicit and revealing tacit knowledge.
Eliminating the barriers to understanding data objects from a semantic perspective is a crucial prerequisite for enhancing the utility value of data. At the same time, the platform tools for managing data objects are also a complex system. This paper, focusing on a multi-value chain data space, proposes the business data resource clustering algorithm BDRCA4MVCDS, which differs from the aforementioned related work in several key ways, as follows: (1) BDRCA4MVCDS adheres to the classification and management of business data resources from the business logic of data. This algorithm enriches the way of managing the physical storage of data sources in the data space. (2) BDRCA4MVCDS enhances the semantic expression of business data resources by analyzing the semantic associations between them, aligning with the multi-level data environment of the multi-value chain data space. (3) BDRCA4MVCDS constructs business documents and a library of business classification tags for multiple value chains, creating conditions for establishing a unified business semantic environment, which most related research works have not considered.
3. Method—Business Data Resource Clustering Algorithm Based on Business Semantic Associations
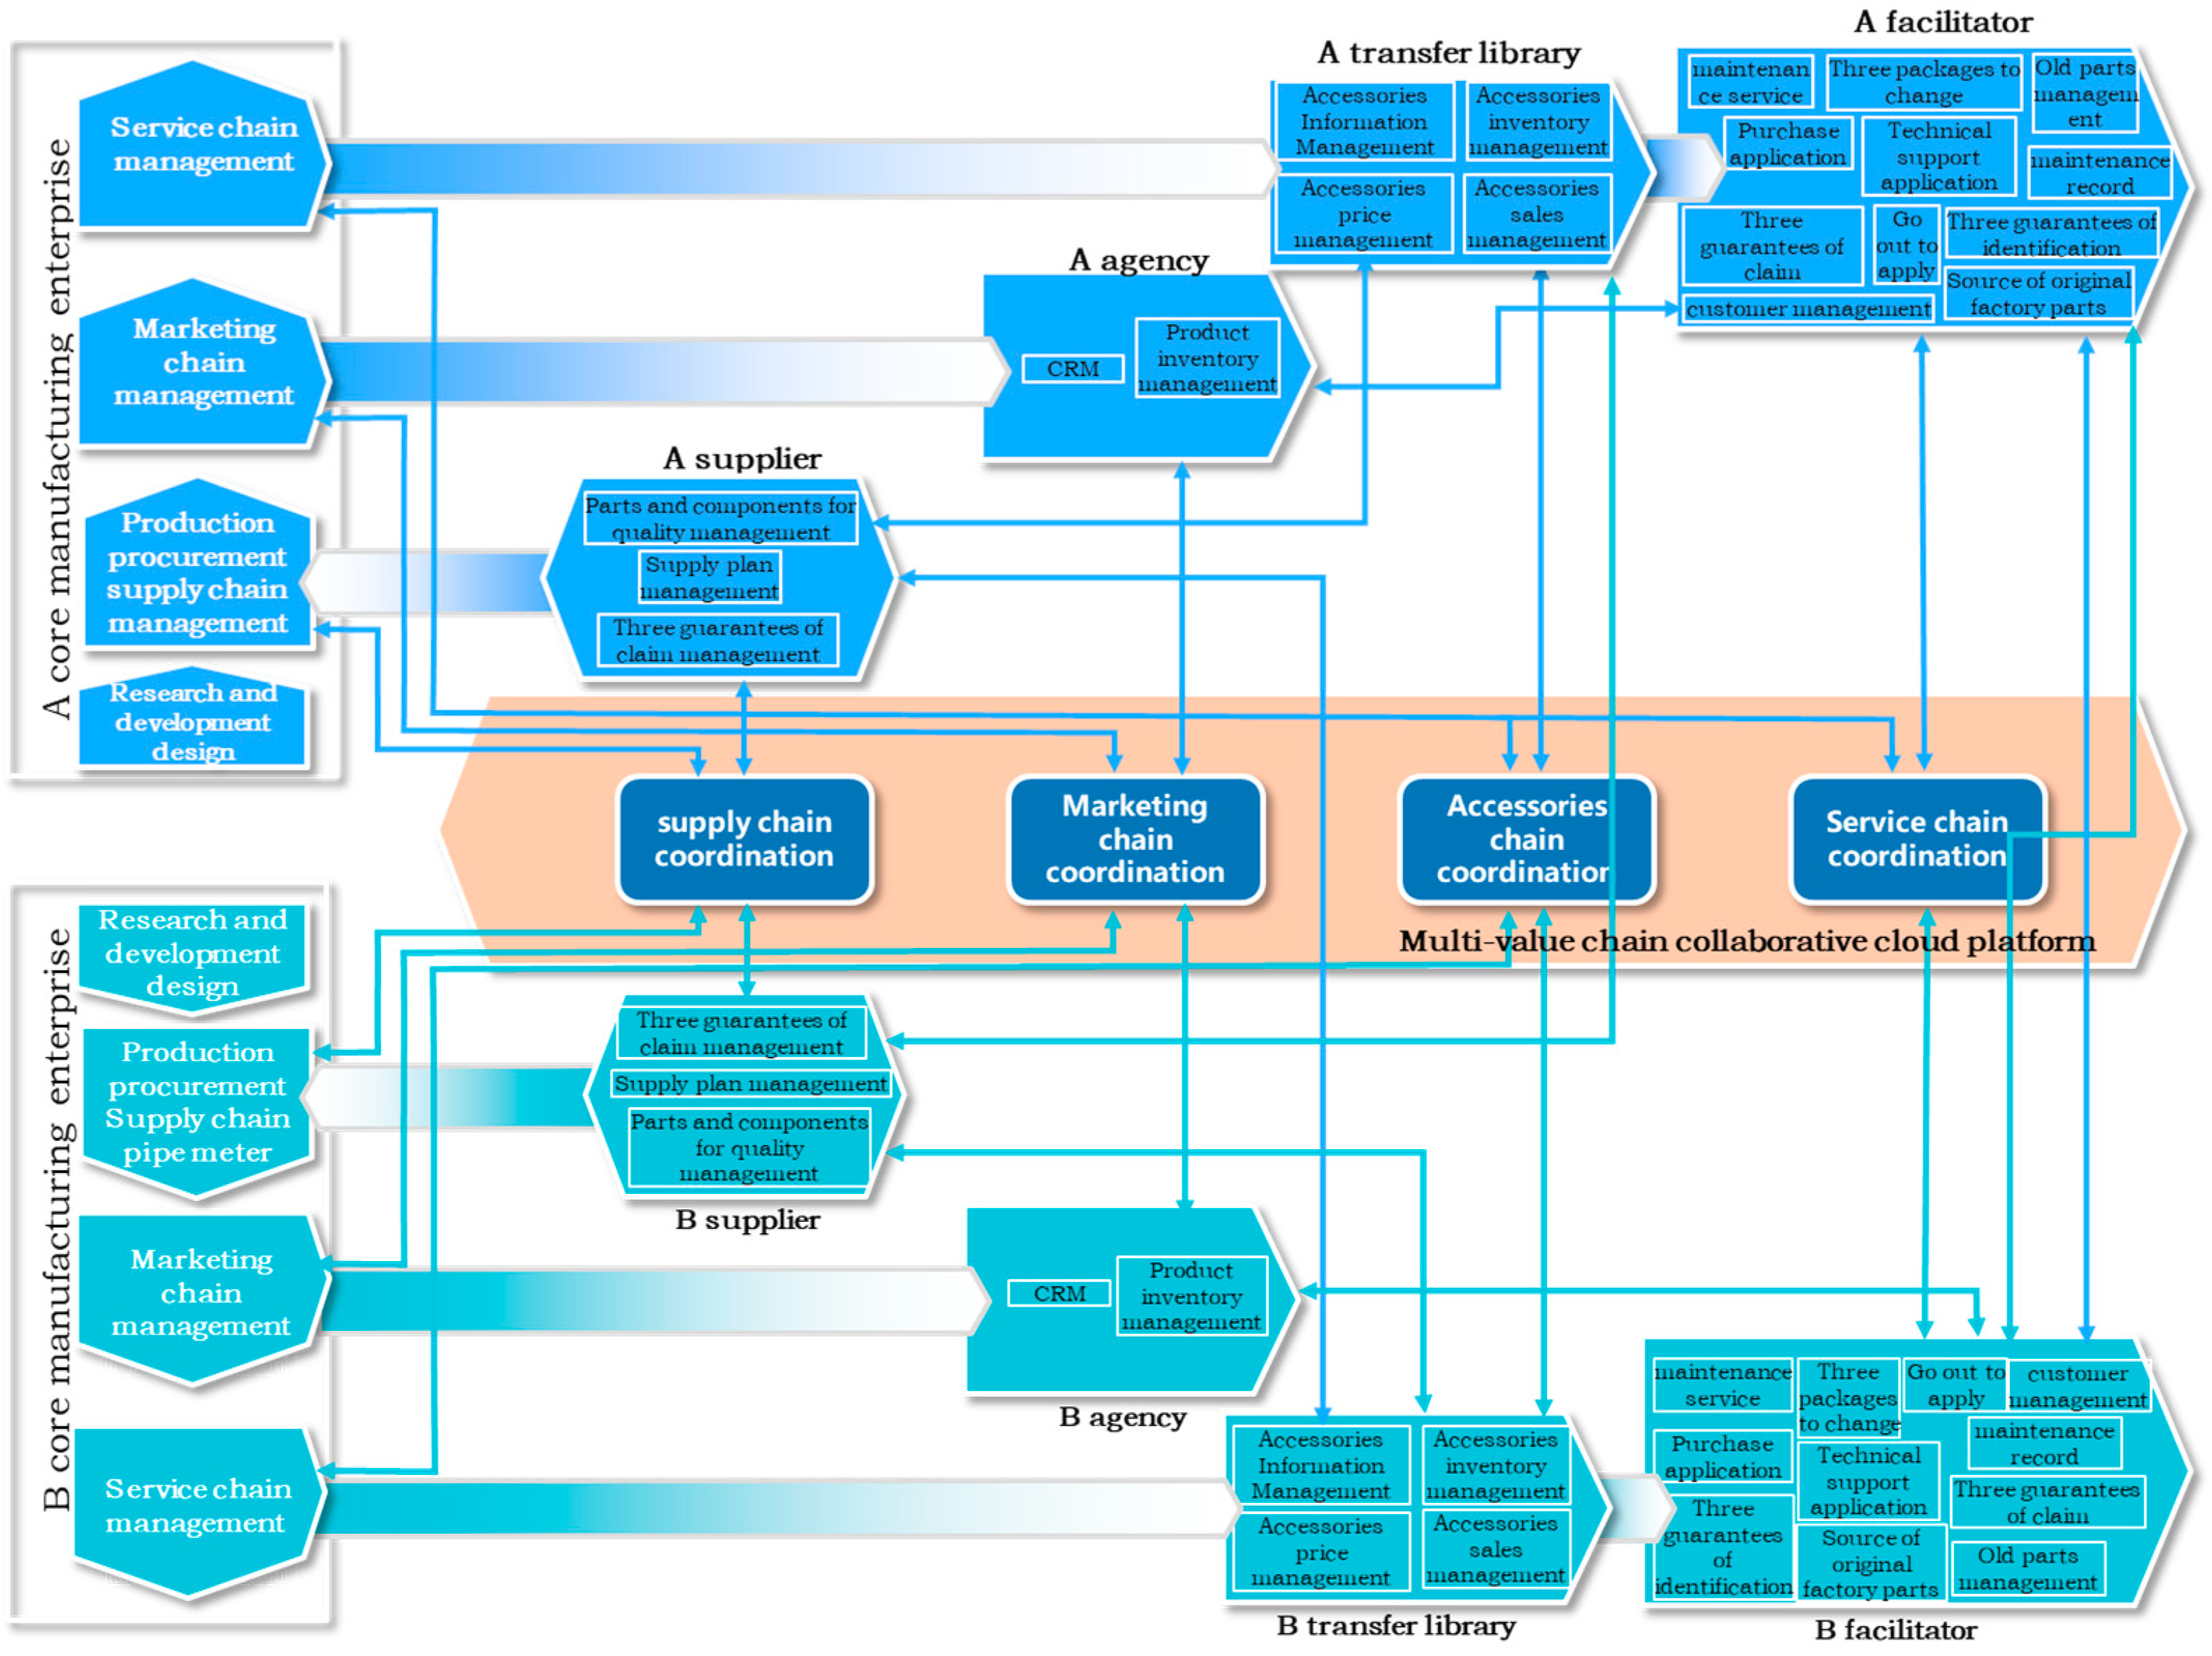
The multi-value chain is an organic collective comprising multiple value chains led by core manufacturing enterprises. The value activities between the chains extend the business synergies originally existing only within single chains to multiple chains, thereby achieving effective integration and restructuring of business resources among different value chains. The following is a multi-value chain business collaborative network system in the automotive industry based on cloud platforms, mainly consisting of core manufacturing enterprise value chain, supply value chain, marketing value chain, parts (maintenance) value chain, and service value chain. Multi-Value Chain Business Collaboration Model can be seen in
Figure 1.
The business collaboration system of multi-value chains is a complex system. This determines the complexity of the data environment in the multi-value chain data space. This complexity primarily manifests in the interplay between the spatiotemporal distribution of data and the heterogeneous distribution of physical storage, which, however, lack semantic coherence. Nonetheless, the semantic-based analysis of business data resource associations is crucial for unifying the distribution of business and physical storage boundaries among business data resources. Thus, clustering analysis of business data resources in the data space necessitates simplifying the data environment and, importantly, overcoming the classification analysis barriers stemming from the distribution of business and physical storage.
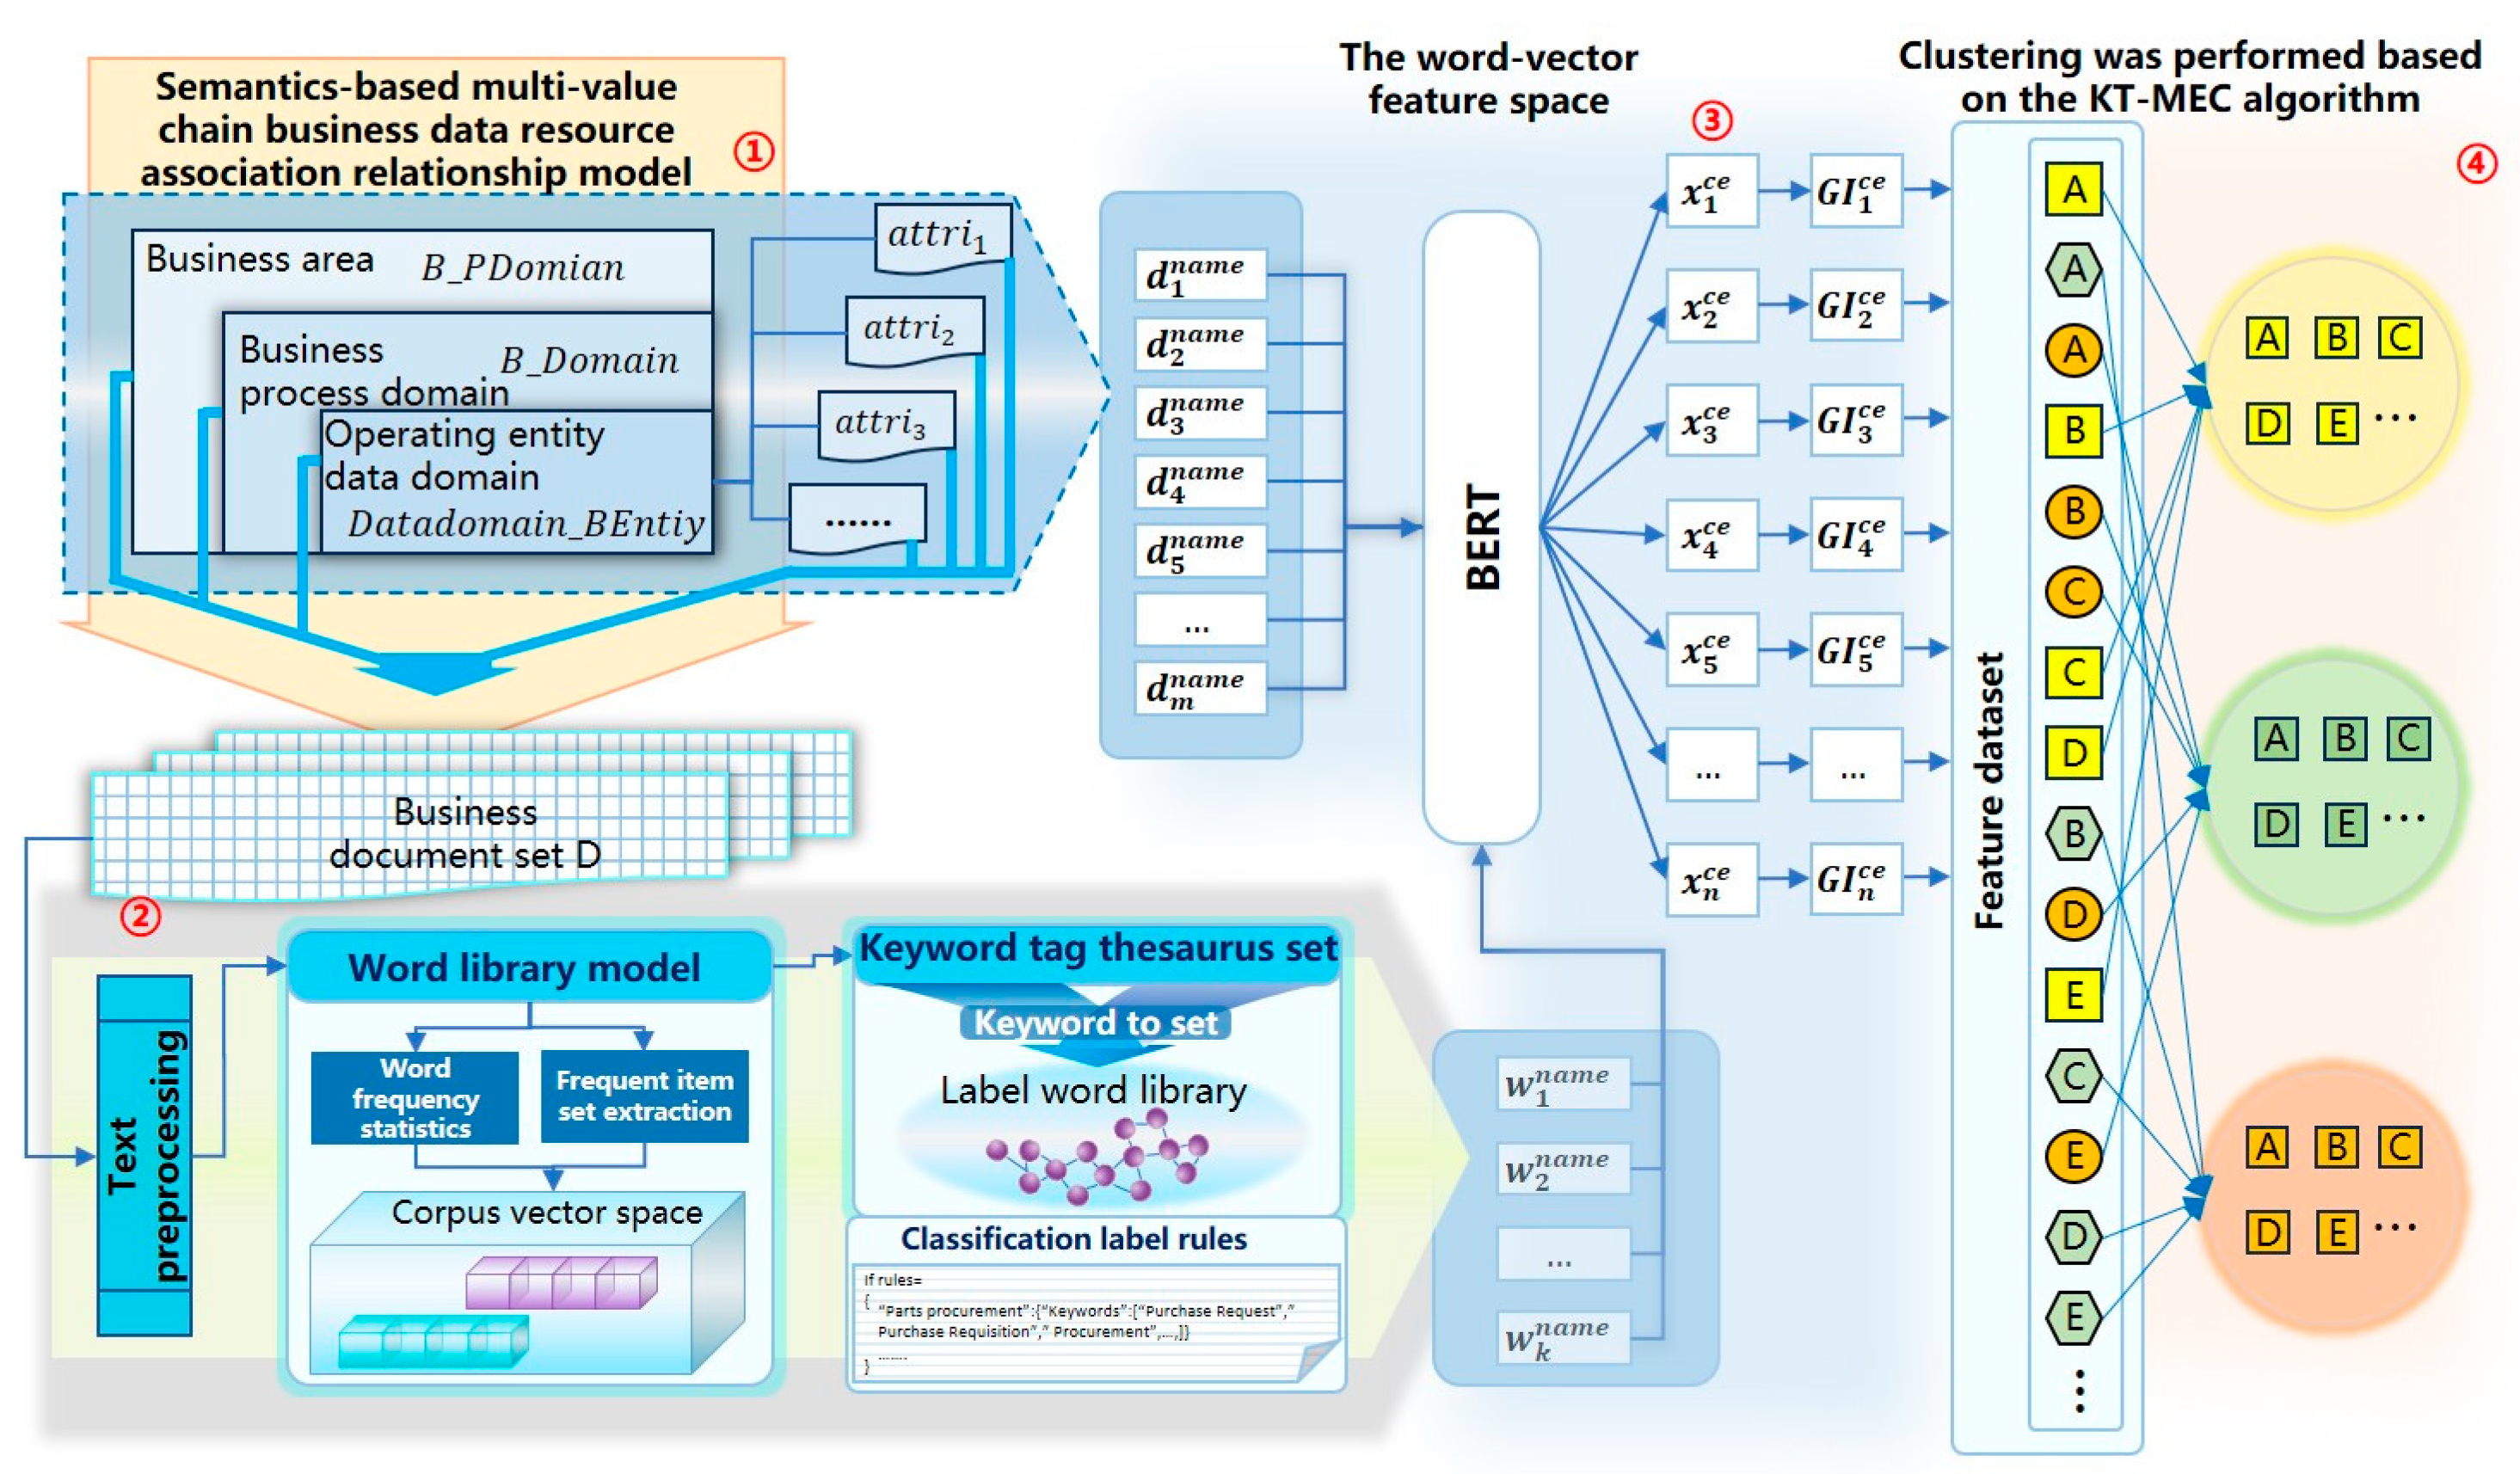
Consequently, we have developed a business data resource classification algorithm (BDRCA4MVCDS) tailored for the multi-value chain data space. The essence of this algorithm is a business data resource classification algorithm based on business semantic associations, as shown in
Figure 2. Step 1 entails constructing a semantic association model for business data resources in the multi-value chain, thereby standardizing the relationships between pertinent business concepts. Step 2 involves building a business vocabulary for multi-value chain, further studying the design rules of business data resource classification tags. Step 3 entails extracting attributes of business entity instances as well as the business data resource classification tags obtained in Step 2, and converting them into feature vectors. Step 4 entails performing clustering analysis and assessing its effectiveness.
This section presents the detailed design of the core modules of this algorithm, which mainly includes, firstly, proposing a semantic-based multi-value chain business data resource association model, which enhances semantic expression by utilizing the association relationships of business data resources. Secondly, constructing a business vocabulary for multi-value chain, laying the foundation for labeling the classification tags of business data resources. Thirdly, creating a word vector space for business data resources based on the BERT model, facilitating the implementation of clustering analysis work.
3.1. Semantic-Based Model of Association Relationships for Multi-Value Chain Business Data Resources
The primary research object of the multi-value chain business model is business entities. From the perspective of business process execution, business entities are static and dynamic business information/documents generated, approved, filled out, and transmitted by business users. IBM defines this from the perspective of business execution by information systems as Artifacts [
22]. Each business entity expresses relatively standardized business concepts in the business domain and business processes. By fully identifying all business entities and their associated relationships in the multi-value chain business collaboration process, a multi-value chain business model can be designed.
The multi-value chain business collaboration system is a complex system [
23]. To facilitate the elucidation of the application process of the data space model, this section constructs a semantic model of multiple value chains in the procurement business domain.
The relationships between business entities can be initially determined using a business framework of “business domain–business process–business entity”. From this framework, it can be understood that business domain, business process, and business entity are concepts at different levels. Researching the relationships between business entities can be described using RDF (Resource Description Framework) based on the associations between concepts.
# Description Class
owl:BEntityConcept rdf:type rdfs:Class.
owl:B_PDomainConcept rdf:type rdfs:Class.
owl:B_DomainConcept rdf:type rdfs:Class.
# Describing the hierarchical relationships between concepts
owl:BEntityConcept rdfs:subClassOf owl:B_PConcept.
owl:B_PConcept rdfs:subClassOf owl:B_DomainConcept.
# Define Properties
owl:isPartOf rdf:type rdf:Property.
owl:includes rdf:type rdf:Property.
# Express Relationships
owl:BEntityConcept ex:isPartOf owl:B_PDomianConcept.
owl:B_PDomianConcept ex:includes owl:B_DomainConcept. |
Definition 1. Binary association is defined as a triplet , where is the name of the association and and are two concepts. If and belong to the same class, it is termed an intra-level association; if not, it is referred to as an inter-level association.
Combined with the RDF mentioned above, the inter-level association relationships between concept classes are
If business entity concepts and other classes are instantiated, there are association relationships between instances of each concept class, constituting intra-level associations.
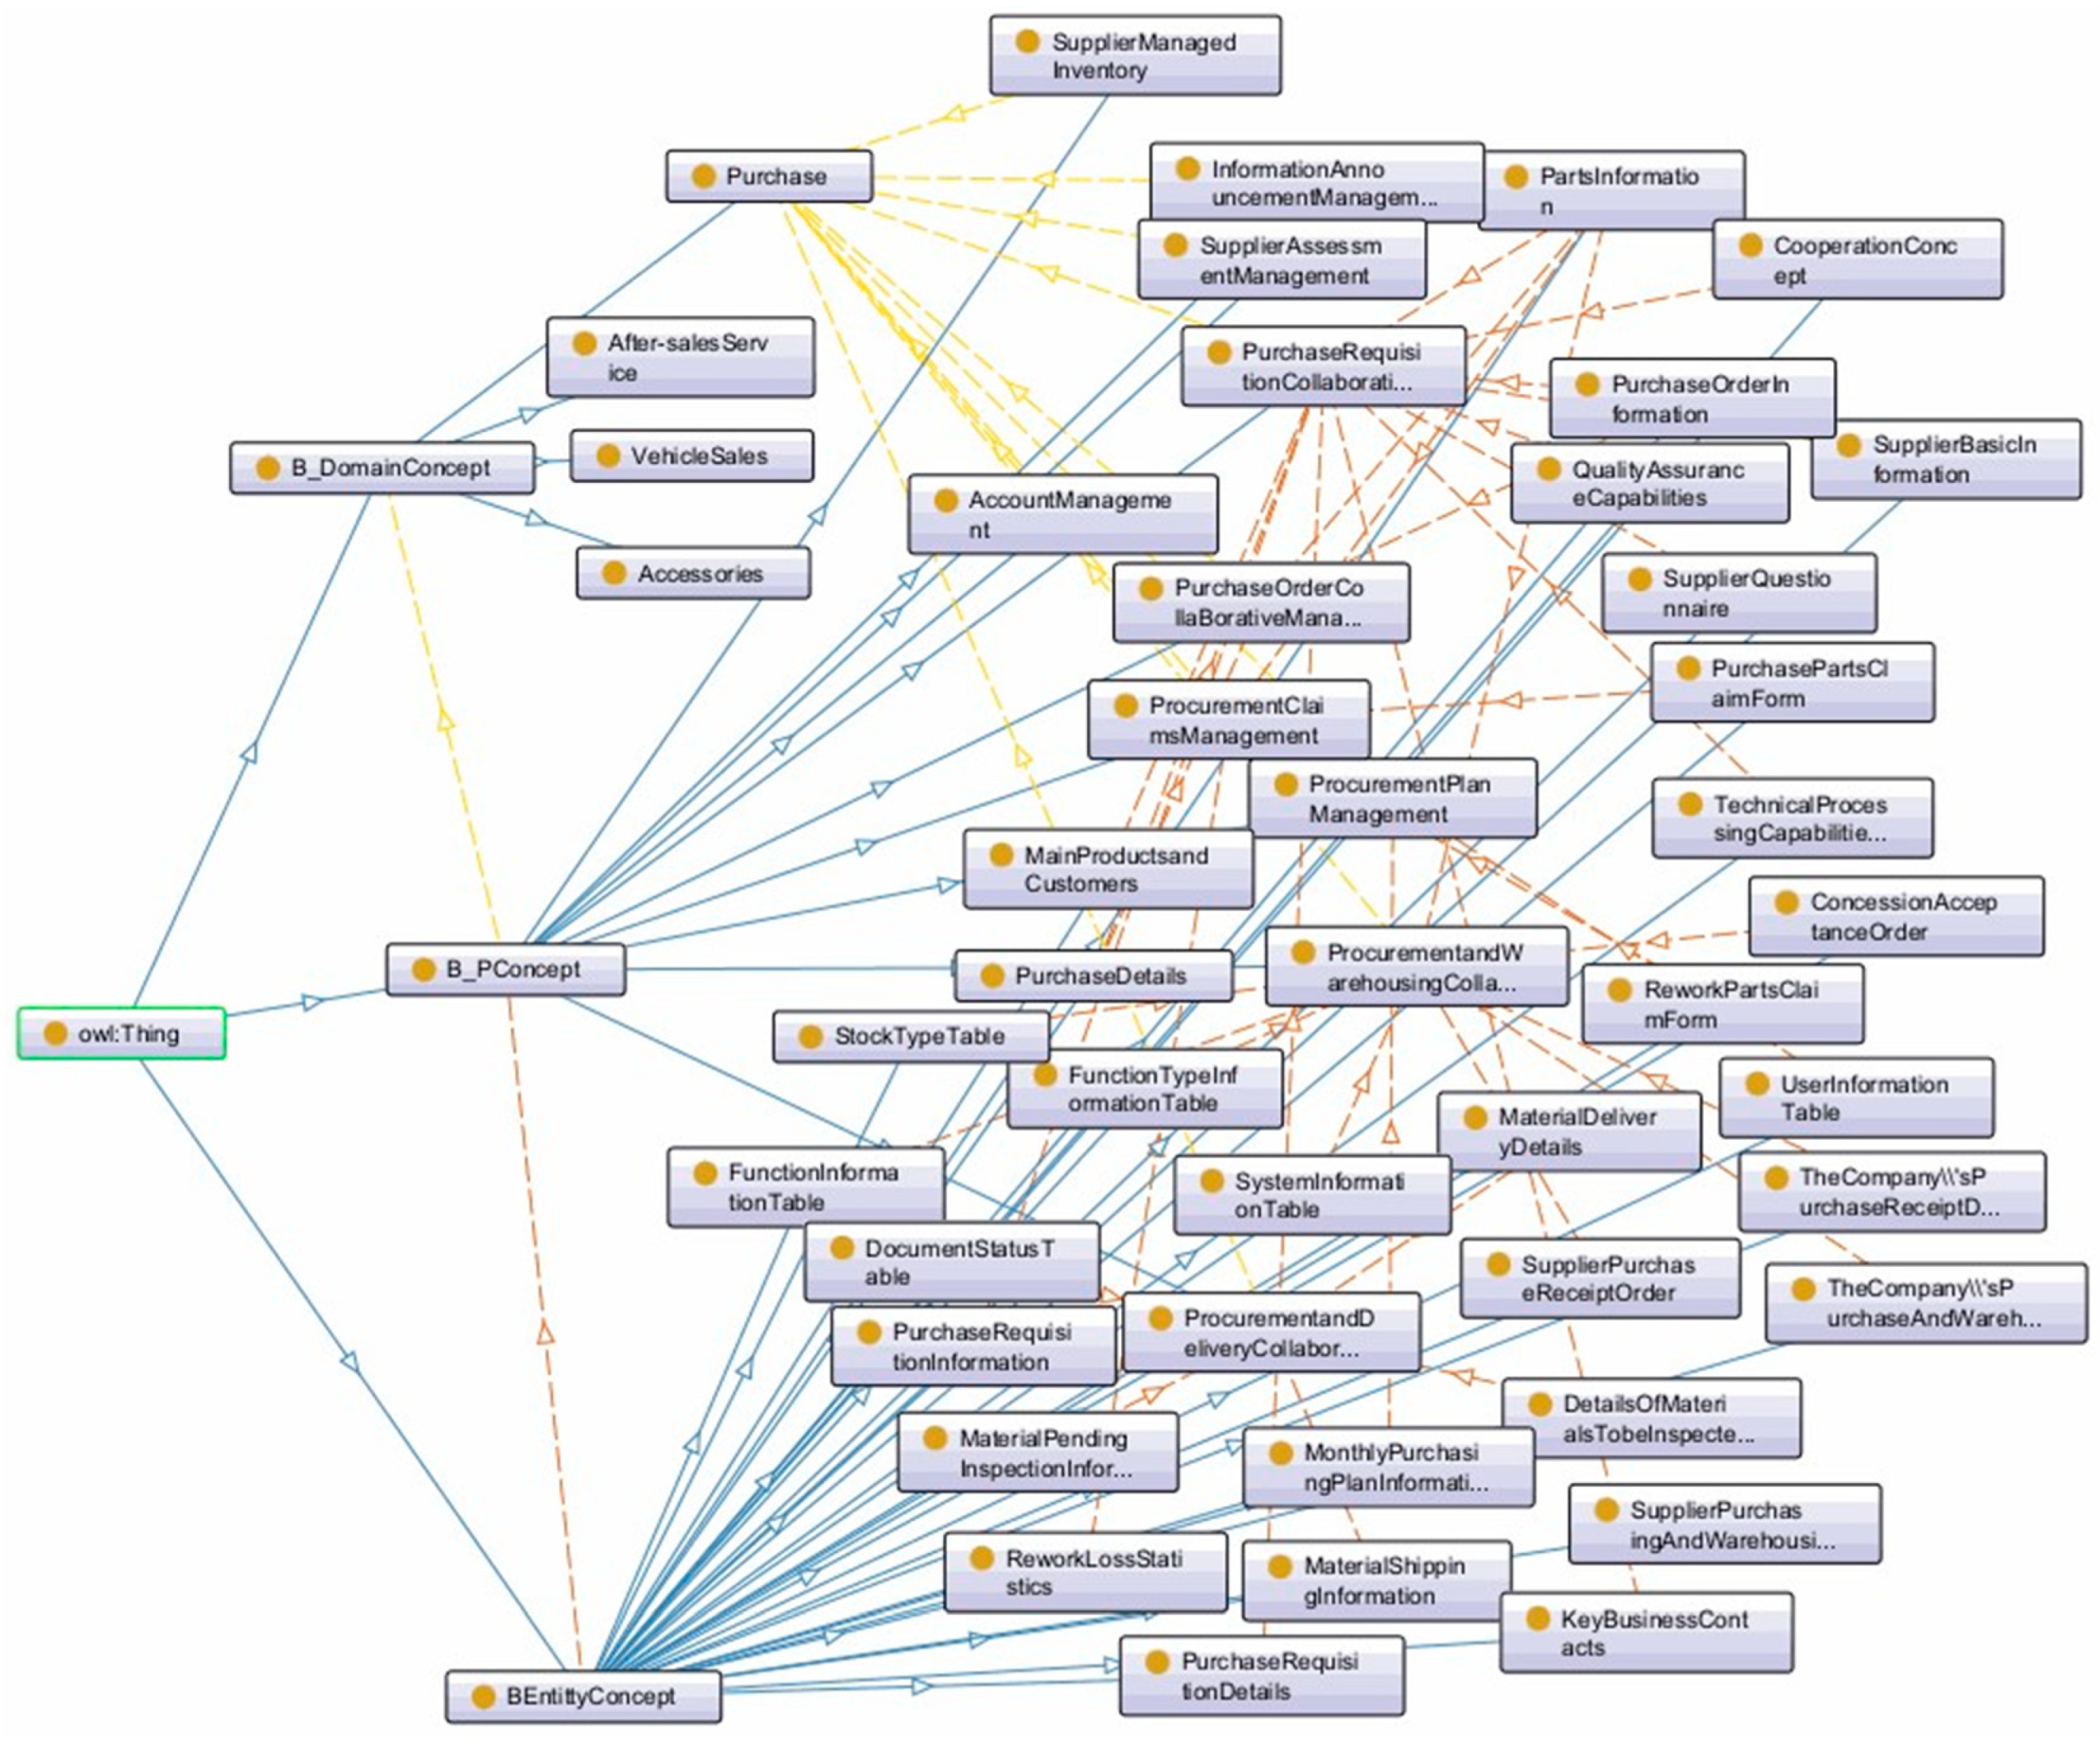
This paper chooses to use the Protégé tool for conducting research on the semantic model of multi-value chains. The design of the model’s concepts and their relationships is depicted in
Figure 3. Based on the design of the top-level concept classes, Business Domain Concept (
), Business Process Concept (
), and Business Entity Concept (
), further designs were made for the subclass concepts contained in these three classes. This includes business process concepts such as “purchase order management” and “supplier information management”, as well as business entity concepts like “parts information table” and “enterprise information table.” The design of relationships between concepts primarily relies on the definition of inter-level associations between concept classes (Definition 1), leading to the construction of the inter-level association relationship
. The properties after concept instantiation represent the value domains of the concepts. Semantic Association Model of Multi-Value Chain Business Data Resources can be seen in
Figure 4.
3.2. Construction of the Multi-Value Chain Business Vocabulary
The research on the multi-value chain business vocabulary is an important step in the semantic analysis of business data resources. Conducting research on the classification of business data within a unified semantic environment is essential for delving deeper into the business value of data.
3.2.1. Construction of Business Documents
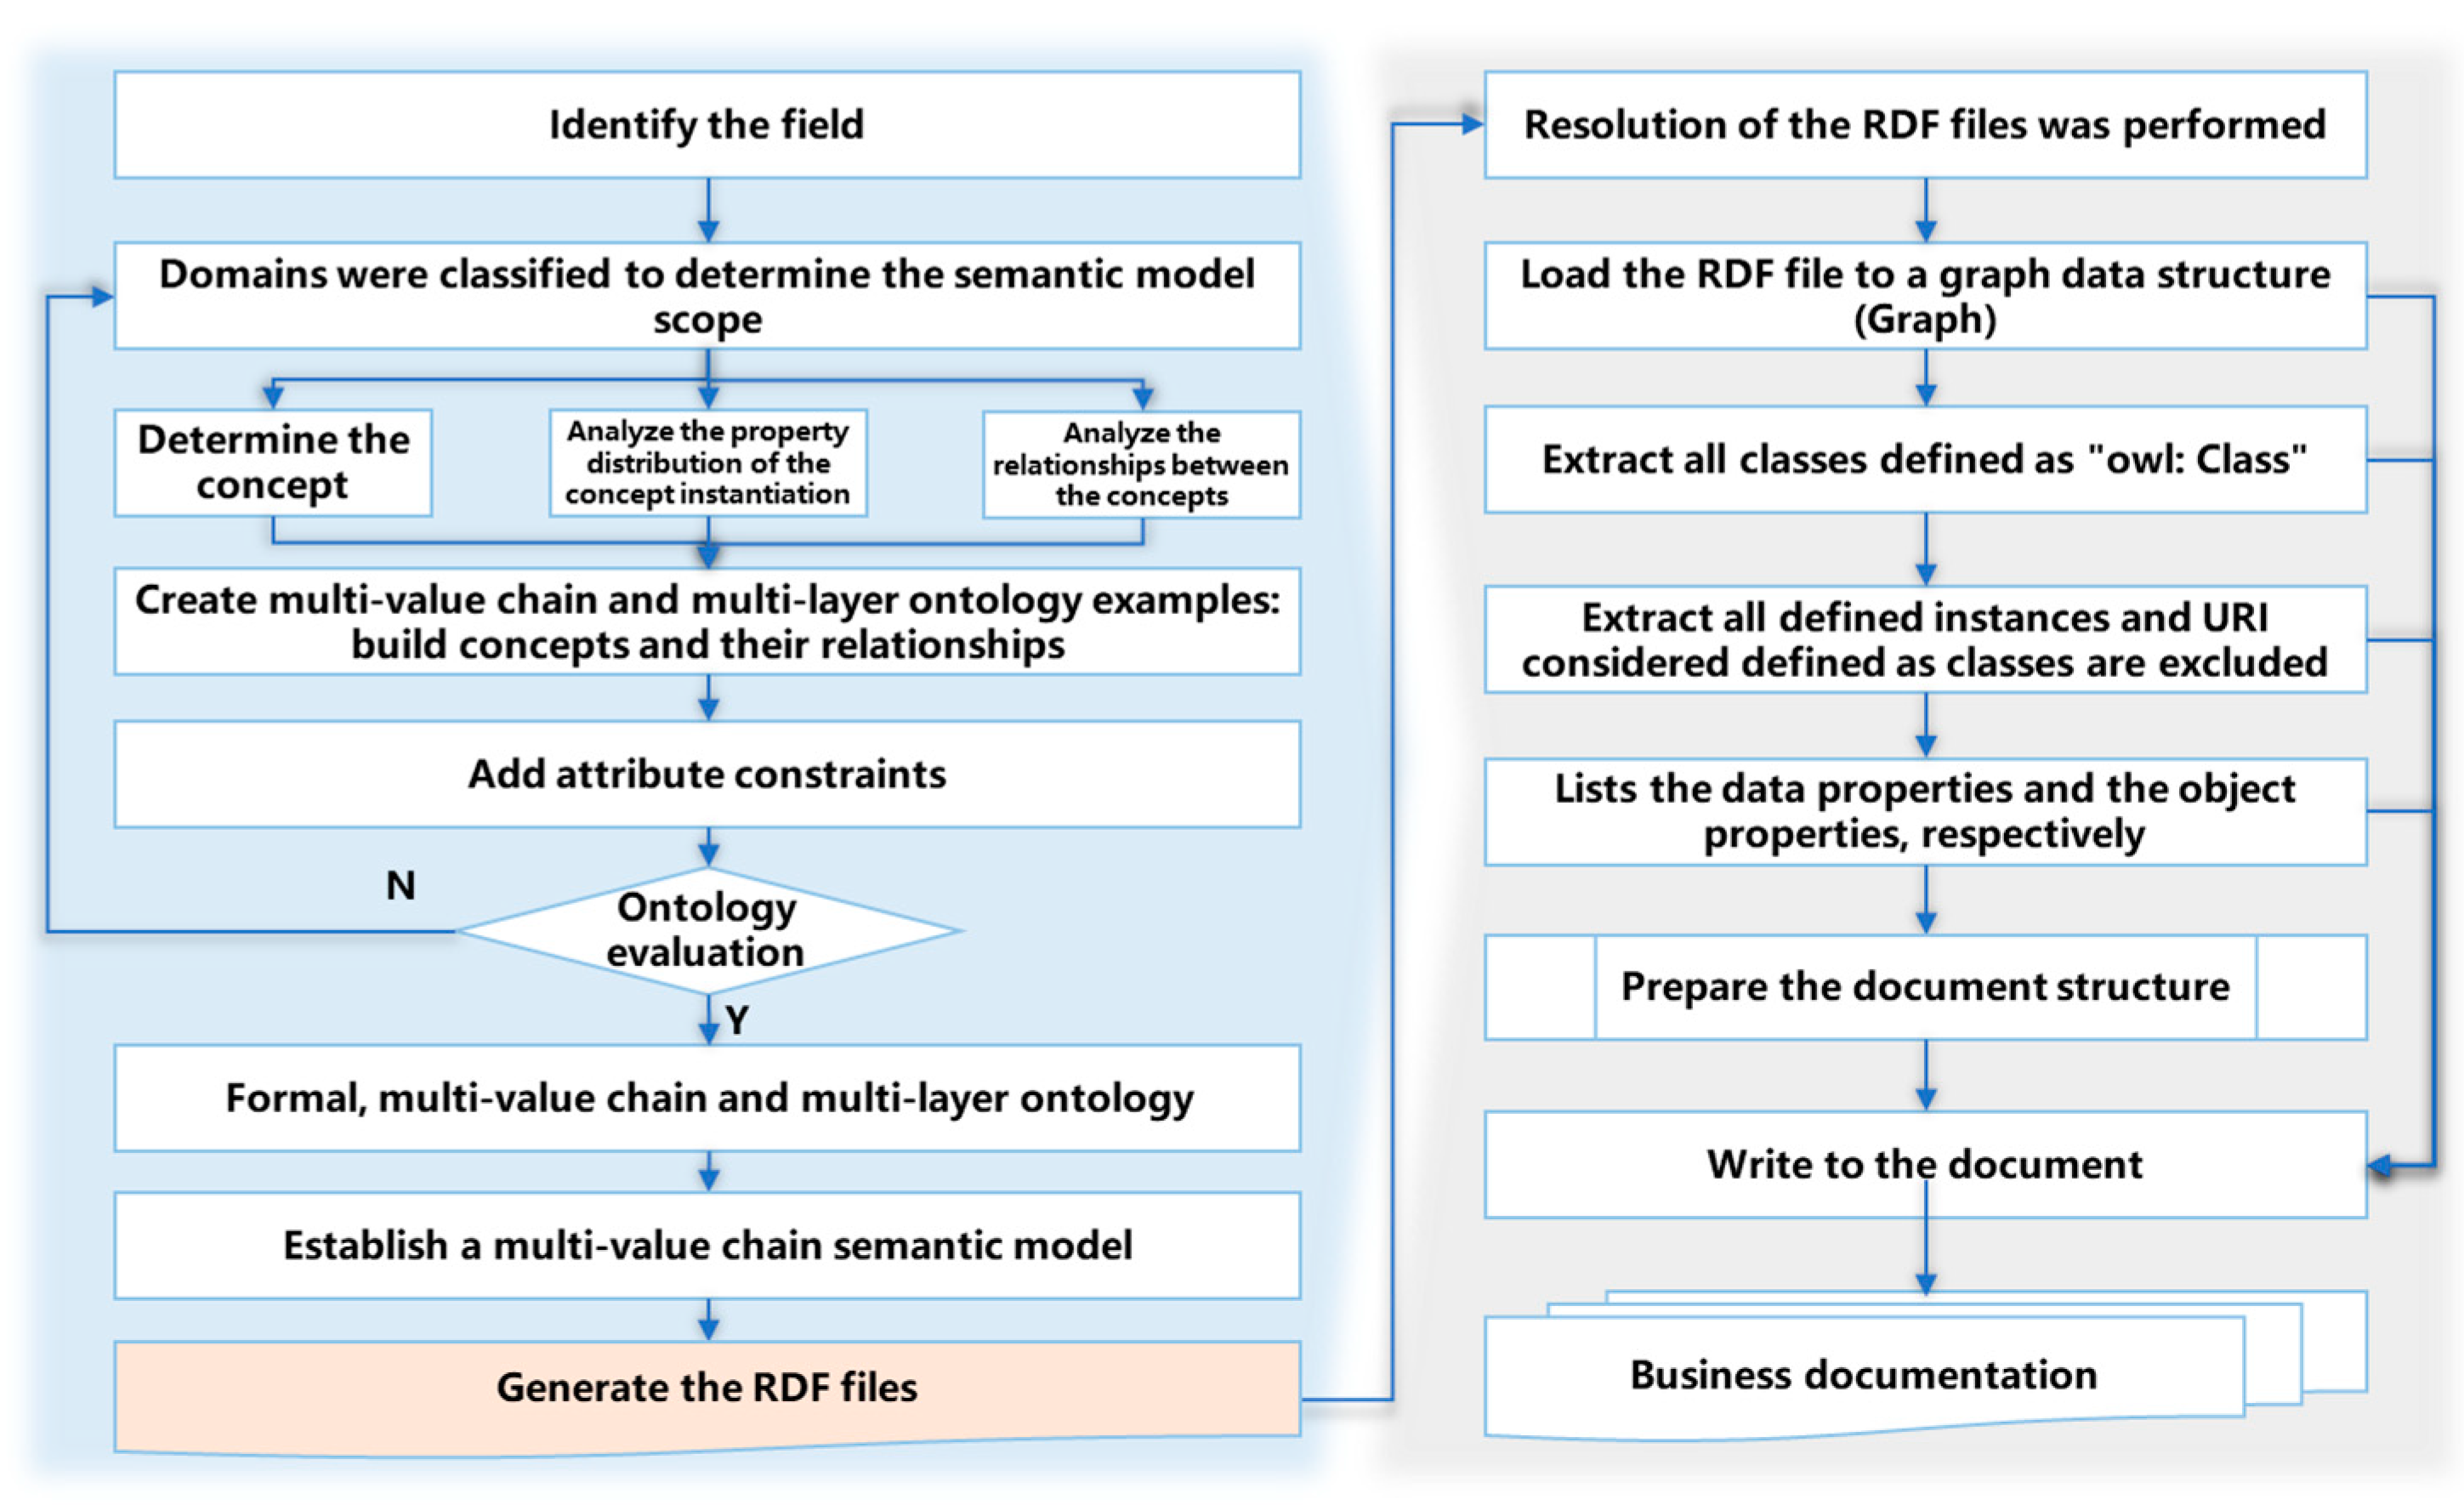
As the multi-value chain business semantic model contains standardized business terms and vocabulary, the RDF file generated by the model can be directly provided to the multi-value chain business documents. The document construction process is depicted in
Figure 5. Initially, the RDF file generated by the multi-value chain business semantic model is parsed, loaded into a Graph, and then the concept classes and instances defined by the model are extracted. Subsequently, data properties and object properties are outputted accordingly, and these contents are ultimately written into the document, resulting in the creation of multi-value chain business documents.
The pseudo-code for constructing multi-value chain business documents is as follows (Algorithm 1).
| Algorithm 1: Extract Concepts and Properties from RDF |
Input: RDF file path ‘rdf_file_path’
Output: Business document ‘D.txt’
1. Initialize a new graph ‘G’
2. Load RDF data from ‘rdf_file_path’ into graph ‘G’
//Create a graph to load RDF data
3. Extract all classes from graph ‘G’
//Classes are extracted as subjects of type OWL.Class
for each class ‘cls’ in graph ‘G’:
Output ‘cls’
end for
4. Identify all instances in graph ‘G’, excluding definitions of classes
//Instances are subjects with a type, excluding those that are classes
for each instance ‘inst’ in graph ‘G’:
Determine the types of ‘inst’ excluding class types
Output ‘inst’ with its types
end for
5. Extract all data properties from graph ‘G’
//Data properties are subjects of type OWL.DatatypeProperty
for each data property ‘dp’ in graph ‘G’:
Output ‘dp’
end for
6. Extract all object properties from graph ‘G’
//Object properties are subjects of type OWL.ObjectProperty
for each object property ‘op’ in graph ‘G’:
Output ‘op’
end for |
3.2.2. Construction of Business Classification Tag Vocabulary
The construction of the business classification tag word library is initiated based on the content of the business document D.txt. The process encompasses three primary steps: text preprocessing, word library model construction, and creation of the label keyword word library set. Defined rules and algorithms underpin each step to guarantee the precision and utility of the word library.
The construction of the word library model relies on the term frequency (TF), defined as the frequency of occurrence of a particular word in a given document, expressed as follows:
where
signifies the term frequency of word t in the business document
, count(
) represents the number of occurrences of word
in the business document
, and
signifies the total number of words in the business document
.
The construction algorithm is delineated as follows:
Step 1: Text preprocessing. Preprocess the text data in the business document, including removing stop words, punctuation marks, and performing word lemmatization, to prepare for the subsequent construction of the word library.
Step 2: Word library model construction.
Step 2.1: Term frequency statistics. |
Step 2.2: Constructing a vocabulary list, collect all the words that have appeared in the business document D.txt to form a vocabulary list, i.e.,
Step 2.3: Vectorizing the vocabulary list to describe the distribution of words in the document.
Step 3: Construction of the label keyword word library set.
Step 3.1: Designing business rules for label classification.
Step 3.2: Extracting keyword sets.
Step 3.3: According to the business rules for label classification, filtering the keyword sets to obtain the classified label word library. |
The pseudo-code for constructing the business classification tag word library is presented below (Algorithm 2):
| Algorithm 2: Construct Business Classification Label Lexicon |
Input: Business document//Input collection of business documents
Output: ClassificationLabelLexicon//Output classified label lexicon
1. Initialize Vocabulary as an empty list//Initialize an empty list for vocabulary
2. Initialize DocumentWordCounts as an empty dictionary//Initialize a dictionary to hold word counts
//Step 1:Text Preprocessing
3. For each document in BusinessDocuments:
a. CleanText = Preprocess(document)//Preprocess the document to remove stopwords, punctuation, and perform lemmatization
b. Words = Tokenize(CleanText)//Tokenize the cleaned text into words
c. For each word in Words:
i. If word not in Vocabulary:
- Add word to Vocabulary//Add new words to the vocabulary
ii. If word in DocumentWordCounts:
- DocumentWordCounts[word] += 1//Increment word count for existing words
else:
- DocumentWordCounts[word] = 1//Initialize word count for new words
//Step 2: Lexicon Model Construction
4. For each word in Vocabulary:
a. Calculate TF(word) = DocumentWordCounts[word]/len(Vocabulary)//Calculate term frequency for each word
5. Vectorize Vocabulary//Convert the vocabulary into a vector form based on term frequency
//Step 3: Construction of Label Keyword Lexicon
6. Define BusinessRules//Define business rules for classification based on specified categories and thresholds
7. Initialize RuleBasedLabelLexicon as an empty dictionary//Initialize an empty dictionary for the rule-based label lexicon
8. For each category in BusinessRules:
8.1. Initialize category_keywords = BusinessRules [category] [“keywords”]//Get the keywords for the category
8.2. Initialize keyword_counts = 0//Initialize count of keywords found in documents
8.3. For each word in Vocabulary:
i. If word in category_keywords:
- keyword_counts += 1//Increment count if word is a keyword for the category
8.4. If keyword_counts ≥ BusinessRules [category] [“threshold”]:
- RuleBasedLabelLexicon [category] = keyword_counts//Add category to lexicon if threshold is met
9. Return RuleBasedLabelLexicon // Return the constructed classified label lexicon |
3.3. Transformation of Multi-Value Chain Business Data Resource Features
This paper adopts the pre-trained Bidirectional Encoder Representations from Transformers (BERT) model [
24] to uniformly construct the word vector feature space of business classification tag word library and attribute text of business entity instances. This aims to extract deep semantic features, thereby facilitating efficient analysis and processing of business data. Leveraging the pre-trained Bidirectional Encoder Representations from Transformers (BERT) model to construct the word vector feature space for both the business classification tag word library and the attribute text of business data resources. This is carried out to extract deep semantic features, facilitating efficient clustering analysis of business data. The specific implementation steps are outlined as follows:
Step 1: Preprocessing
Step 1.1: Remove invalid characters, tokenize, and lemmatize.
Step 1.2: Align business entity instance attributes with classification tags to ensure consistency.
Step 2: Load BERT model: Load the pre-trained BERT model for text conversion.
Step 3: Text conversion: Input preprocessed text into the BERT model to extract embedding vectors for each word or phrase.
Step 4: Feature space construction: Combine the vectors of each text to form a complete word vector feature space, which is used for subsequent business data analysis.
Step 5: Output dataset file: Save the data of the feature space as a file for subsequent analysis. |
The pseudo-code for algorithm execution is as follows (Algorithm 3):
| Algorithm 3: Construct BERT-based Vector Feature Space with Dataset Output |
Input: BusinessTexts, PretrainedBERT
Output: FeatureSpaceFile
1. Load PretrainedBERT
2. Initialize FeatureSpace as an empty matrix
3. For each text in BusinessTexts:
3.1. CleanText = Preprocess(text)//Include normalization, tokenization, and lemmatization
3.2 AlignedText = AlignAttributesAndLabels(CleanText)//Align attributes and labels
3.3 Tokens = Tokenize(AlignedText)
3.4 Embeddings = BERT_Embed(Tokens, PretrainedBERT)
3.5 Append Embeddings to FeatureSpace
4. Save FeatureSpace to FeatureSpaceFile//Save the matrix to a file format
5. Return FeatureSpaceFile |
3.4. Business Data Resource Clustering Analysis Based on KT-MEC
Traditional clustering methods include methods based on grids, models, hierarchies, etc. However, traditional clustering methods are based on the situation where sample data are sufficient or data are not contaminated. The business data resources in the multi-value chain data space based on third-party platforms are heterogeneous from multiple sources. In the process of matching business data resources, clusters obtained by directly using the great entropy clustering (MEC) algorithm are prone to clustering failure. The literature [
25] and others proposed the KT-MEC algorithm based on the classic MEC algorithm, integrating historical membership and historical clustering centers, solving the problem that traditional clustering algorithms cannot be well applied to small samples or samples contaminated by data.
This paper applies the KT-MEC algorithm [
25,
26] to the clustering process of business data resources, thereby maximizing the accuracy of business data resource classification. The iterative formula analysis of the KT-MEC algorithm is as follows.
The objective function of the
algorithm is
where
, assuming the sample space
, where
represents the
i-th sample,
represents the number of samples,
is the total number of categories, and
represents the dimensionality of the samples. This sample space contains
different classes, where
represents the
j-th sample;
represents the membership degree of the
j-th sample in the target domain to the center of the
i-th class;
represents the membership degree of the
j-th sample point in the source domain to the center point of the
i-th class, representing historical membership knowledge;
represents the sample center point of the
i-th class in the target domain;
represents the sample center of the
i-th class in the source domain, representing historical clustering center knowledge;
represents the distance between the
j-th sample and the center of the
i-th class;
is the regularization coefficient; and
represent the balancing operators adjusting the learning degree of historical clustering centers and historical membership degrees.
In the above formula, represents the data samples, represents the class center matrix composed of , represents the source domain class center, represents the source domain membership degree, and represents the historical membership degree. Since the class centers and membership degrees contain rich information, they can be used as knowledge for clustering research. Therefore, is a knowledge transfer based on historical class centers, and is a knowledge transfer of the target domain’s membership degree relative to historical class centers. This is the core idea behind the maximum entropy clustering algorithm with knowledge transfer.
Based on the Lagrange conditions and extreme optimization methods, the iterative formulas for the center points V and membership degrees U when solving Equation (3) for the optimal solution are obtained. The specific derivation process is as follows:
Initially, construct the Lagrange expression as follows:
hen, let
and solve for,
where
; according to the iterative Equations (8) and (9), the optimal class centers
V and membership degrees
U of the target domain can be finally obtained.
The core algorithm steps of KT-MEC are as follows:
Step 1: Select initial class centers V and V′ (source domain class centers) and initialize membership degrees U and U′ (historical membership degrees).
Step 2: Update the membership degrees U of each sample point using the current class centers V and historical class centers V′.
Step 3: Update the class centers V—update the class centers based on the newly calculated membership degrees U and historical membership degrees U′.
Step 4: Iterate steps 2 and 3 until the update change of the class centers V is smaller than a certain threshold or reaches the maximum number of iterations, then stops iterating. |
4. Result and Discussion—Comparative Experimental Evaluation
Multi-value chain business data resources are a type of big data with complex associative relationships. The identification of the association relationship of business data resources and the realization of the classification and management of data are the focus of this research. This section aims to demonstrate the effectiveness and accuracy of the proposed analysis framework and its algorithms through comparative experiments between a framework based on associative relationships of business data resources and a direct classification analysis of business data resources. The experimental computer configuration used is cloud computing resources with 3.1GHz CPU, 64 GB memory, and 24 GB GPU memory.
4.1. Experimental Design
4.1.1. Experimental Dataset
The experiment used two datasets, both derived from backup data sources in real production environments [
27], comprising procurement data for automotive parts from a total of 4657 companies. These data primarily cover 22 business data entities across business value chain domains such as automotive parts procurement value chains and accessory (operations and maintenance) value chains, comprising a total of 3486 data attributes, with individual entities containing up to 397,962 rows of data [
9]. According to the experimental setup, the data were divided into two groups: (1) a dataset with labeled data after relationship analysis and (2) a raw dataset, representing business data resources without undergoing business association analysis.
4.1.2. Design of Evaluation Parameters
This experiment introduces metrics such as Precision, Recall, and the F1 score (H-mean value) to evaluate the performance of the model. The corresponding calculation formulas are as follows:
In the formula, TP represents true positives (correctly predicted positive instances); TN represents true negatives (correctly predicted negative instances); FP represents false positives (misclassifications, negative instances incorrectly predicted as positive); and FN represents false negatives (missed detections, positive instances incorrectly predicted as negative). A higher H-mean score indicates a better performance.
4.2. Analysis of Algorithm Evaluation
The experiment primarily utilized identical computer configurations and datasets to compare the precision, recall, and H-mean values of three different algorithms. The objective is to elucidate the effectiveness of the proposed BDRCA4MVCDS in this study. The following provides a brief explanation of these three algorithms and outlines the purpose of the comparative analysis.
The BDRCA4MVCDS algorithm, i.e., the algorithm proposed in this paper.
The KMeans algorithm based on business semantic association (referred to as KABSA), utilizing the semantic association model of multi-value chain business data resources, multi-value chain business vocabulary, and the creation of a business data resource word vector space based on the BERT model. As the final step, the KMeans algorithm is used to classify business data resources in a multi-value chain data space.
The KMeans algorithm, directly performing clustering analysis on business data resources (the raw dataset).
4.2.1. Analysis of the Impact of Semantic Relationships of Business Data Resources on Data Classification
By contrasting the BDRCA4MVCDS algorithm with the KMeans algorithm, the KABSA algorithm, and the KMeans algorithm, the importance of the semantic association of business data resources in managing the classification of business data resources in the multi-value chain data space is illustrated. As shown in
Figure 6, the F1 values of the BDRCA4MVCDS algorithm, the KABSA algorithm, and the KMeans algorithm are 0.89, 0.85, and 0.39, respectively. The BDRCA4MVCDS algorithm and the KABSA algorithm significantly outperform the KMeans algorithm in terms of the accuracy, recall, and F1 score. Both the BDRCA4MVCDS algorithm and the KABSA algorithm utilize the algorithmic framework proposed in this paper, differing only in the clustering algorithm employed for the final clustering analysis. The KMeans algorithm, on the other hand, directly conducts a clustering analysis on the transformed word vectors of business data resources.
The experiment confirmed that establishing a semantic association model for multi-value chain business data resources enhances the semantic expression of business data resources to a certain extent. Furthermore, the semantic-based analysis of business data resource associations is more conducive to simplifying the data hierarchy structure of the multi-value chain data space. Therefore, the algorithm proposed in this paper exhibits good application effects in the classification and management of business data resources in the multi-value chain data space.
4.2.2. Analysis of the Complexity of Business Data Resource Data Structures
The KT-MEC algorithm employed in the BDRCA4MVCDS algorithm is essentially a hierarchical clustering method, capable of displaying hierarchical clustering results at different levels, suitable for clusters of different shapes and sizes, and can generate dendrograms, assisting in understanding how data points are gradually merged into groups. The KABSA algorithm adopts the K-means clustering method, which, although computationally efficient, is sensitive to the selection of initial centroids and may easily fall into local optima when processing data with hierarchical structures.
As shown in
Figure 7, both the BDRCA4MVCDS algorithm and the KABSA algorithm achieved good performance in the clustering analysis, but overall, the BDRCA4MVCDS algorithm outperforms the KABSA algorithm. This is because the multi-value chain data space is a complex multi-level data environment, and the hierarchical clustering provided by the BDRCA4MVCDS algorithm can capture this hierarchical and complex class boundary, while the K-means clustering may fail to effectively separate these clusters due to its assumption about the shape of the clusters.
4.2.3. Comprehensive Comparative Analysis of BDRCA4MVCDS Algorithm
To delve deeper into the comprehensive performance of the BDRCA4MVCDS algorithm proposed in this paper, a comparative experiment was devised between the BDRCA4MVCDS algorithm and the KABSA algorithm. The data used in the controlled experiment comes from real production environments. To more intuitively demonstrate the performance of the algorithm, we preprocessed the experimental dataset, creating eight datasets through random sampling. Subsequently, both the BDRCA4MVCDS algorithm and the KABSA algorithm were independently applied to these eight datasets for clustering analysis. Following each algorithmic analysis, the precision, recall, and F1 values were recorded. Line graphs depicting the evaluation parameters for the two sets of experiments are presented in
Figure 8.
(1) Design of Experimental Evaluation Metrics
The comparative experiment produced evaluation parameters for the clustering analysis of eight datasets, each analyzed independently by the BDRCA4MVCDS and KABSA algorithms. To further compare and elucidate the classification effects of the two algorithms on business data resources in the multi-value chain data space, we devised evaluation metrics for algorithmic stability and adaptability. These metrics aim to demonstrate the superiority of the proposed BDRCA4MVCDS algorithm.
① Stability
Calculate the standard deviation of each evaluation parameter (Precision, Recall, and F1) across multiple experiments. A smaller standard deviation signifies better stability. If one algorithm exhibits a significantly lower standard deviation than another, it may be more suitable for the overall data scenario.
In the equation, represents the mean and represents the value of the i-th experiment.
② Adaptability
Evaluate the adaptability of the algorithm using the average of the Precision, Recall, and F1 values from multiple algorithm experiments. A higher average value indicates the better performance of the algorithm on different datasets, indicating stronger adaptability. High adaptability means that the algorithm can better handle different datasets and is suitable for variable or unknown types of datasets.
where
is the value of the
i-th experiment.
(2) Evaluation of Experimental Results
① Statistical Significance Test Analysis
To determine whether the two algorithms are statistically significant and eliminate random fluctuation effects, this paper introduces the Wilcoxon signed-rank test to perform a significance analysis of algorithm performance evaluation. The results of the statistical significance test analysis are shown in
Table 1.
The Wilcoxon test for the performance metrics Precision, Recall, and F1 of the two algorithms resulted in p-values of 0.2076, 0.1282, and 0.2075, all significantly greater than 0.05. This indicates that there is no significant difference in performance between the two algorithms.
② Comprehensive Performance Evaluation of the Algorithm
Using the above-designed experimental evaluation metrics, calculate the standard deviation and mean of all indicators (Precision, Recall, and F1) for each dataset processed by these two sets of experiments. Utilize the algorithm’s evaluation metrics to calculate the stability and adaptability of both algorithms, as depicted in
Table 2.
This paper designed evaluation metrics for stability and adaptability to compare the performance of the BDRCA4MVCDS algorithm and the KABSA algorithm. We defined the algorithm’s stability using the standard deviation of metrics such as Precision, Recall, and F1 over multiple experiments, where lower standard deviation indicates better stability. We further defined the algorithm’s adaptability through the mean values of these parameters, where higher mean values indicate better adaptability. Through experimental comparative calculations, the standard deviations of Precision, Recall, and F1 for the BDRCA4MVCDS algorithm are consistently smaller than those for the KABSA algorithm in both sets of experiments. In terms of the adaptability evaluation, the standard deviations of the Precision, Recall, and F1 of the BDRCA4MVCDS algorithm are all larger than those of the KABSA algorithm. The analysis of stability and adaptability in the two sets of experiments reveals that the proposed BDRCA4MVCDS algorithm exhibits superior characteristics in both aspects.
5. Conclusions
This paper analyzes the complex data environment of multi-value chain data spaces, studies the characteristics of business data resources, and establishes that clustering/classification is a form of data intelligence for perceiving the real world.
By analyzing the issues in data classification management within the current complex data environment, we proposed the Business Data Resource Clustering Algorithm for a Multi-Value Chain Data Space (BDRCA4MVCDS) and described the components of the model framework in detail.
Through the evaluation of clustering effectiveness for business data resources and a performance comparison of multiple clustering algorithms, we demonstrate the validity and superior performance of the core components proposed in this paper, including BDRCA4MVCDS. Comparative experiments analyzed the clustering performance of various algorithms for business data resources. By comparing the semantic-based clustering algorithm with the KMeans algorithm, the direct role of semantic association in data classification was identified. The comparison between clustering algorithms with and without a knowledge transfer module further reveals the adaptability of the BDRCA4MVCDS algorithm to the multi-level, complex data environment of multi-value chain data spaces.
Additionally, we observed that the BDRCA4MVCDS algorithm is essentially a semantic-based data clustering algorithm, addressing two primary issues: first, simplifying complex data environments using a semantic association model, and second, overcoming the challenges of cold start and over-reliance on data quality in semantic-based data classification.
This paper proposed a technical solution to address the challenges of data sharing management in the context of multi-value chain business collaboration. In the next steps, we plan to conduct in-depth research on issues such as data security and privacy management in shared management across different value chain stages, as well as the computational performance optimization of data clustering algorithms.


