

Knowledge Extraction from LLMs for Scalable Historical Data Annotation


Abstract
1. Introduction
- Data integrity is a primary challenge in developing datasets of this nature, as certain phenomena, such as immaterial historical records, are difficult to quantify [7]. Specifically, historical data are inherently biased due to missing records [8], a problem that becomes more pronounced as we examine increasingly distant past periods.
- Subjectivity poses another significant challenge. Reaching consensus on historical data annotation is difficult due to the subjective nature of historical interpretation.
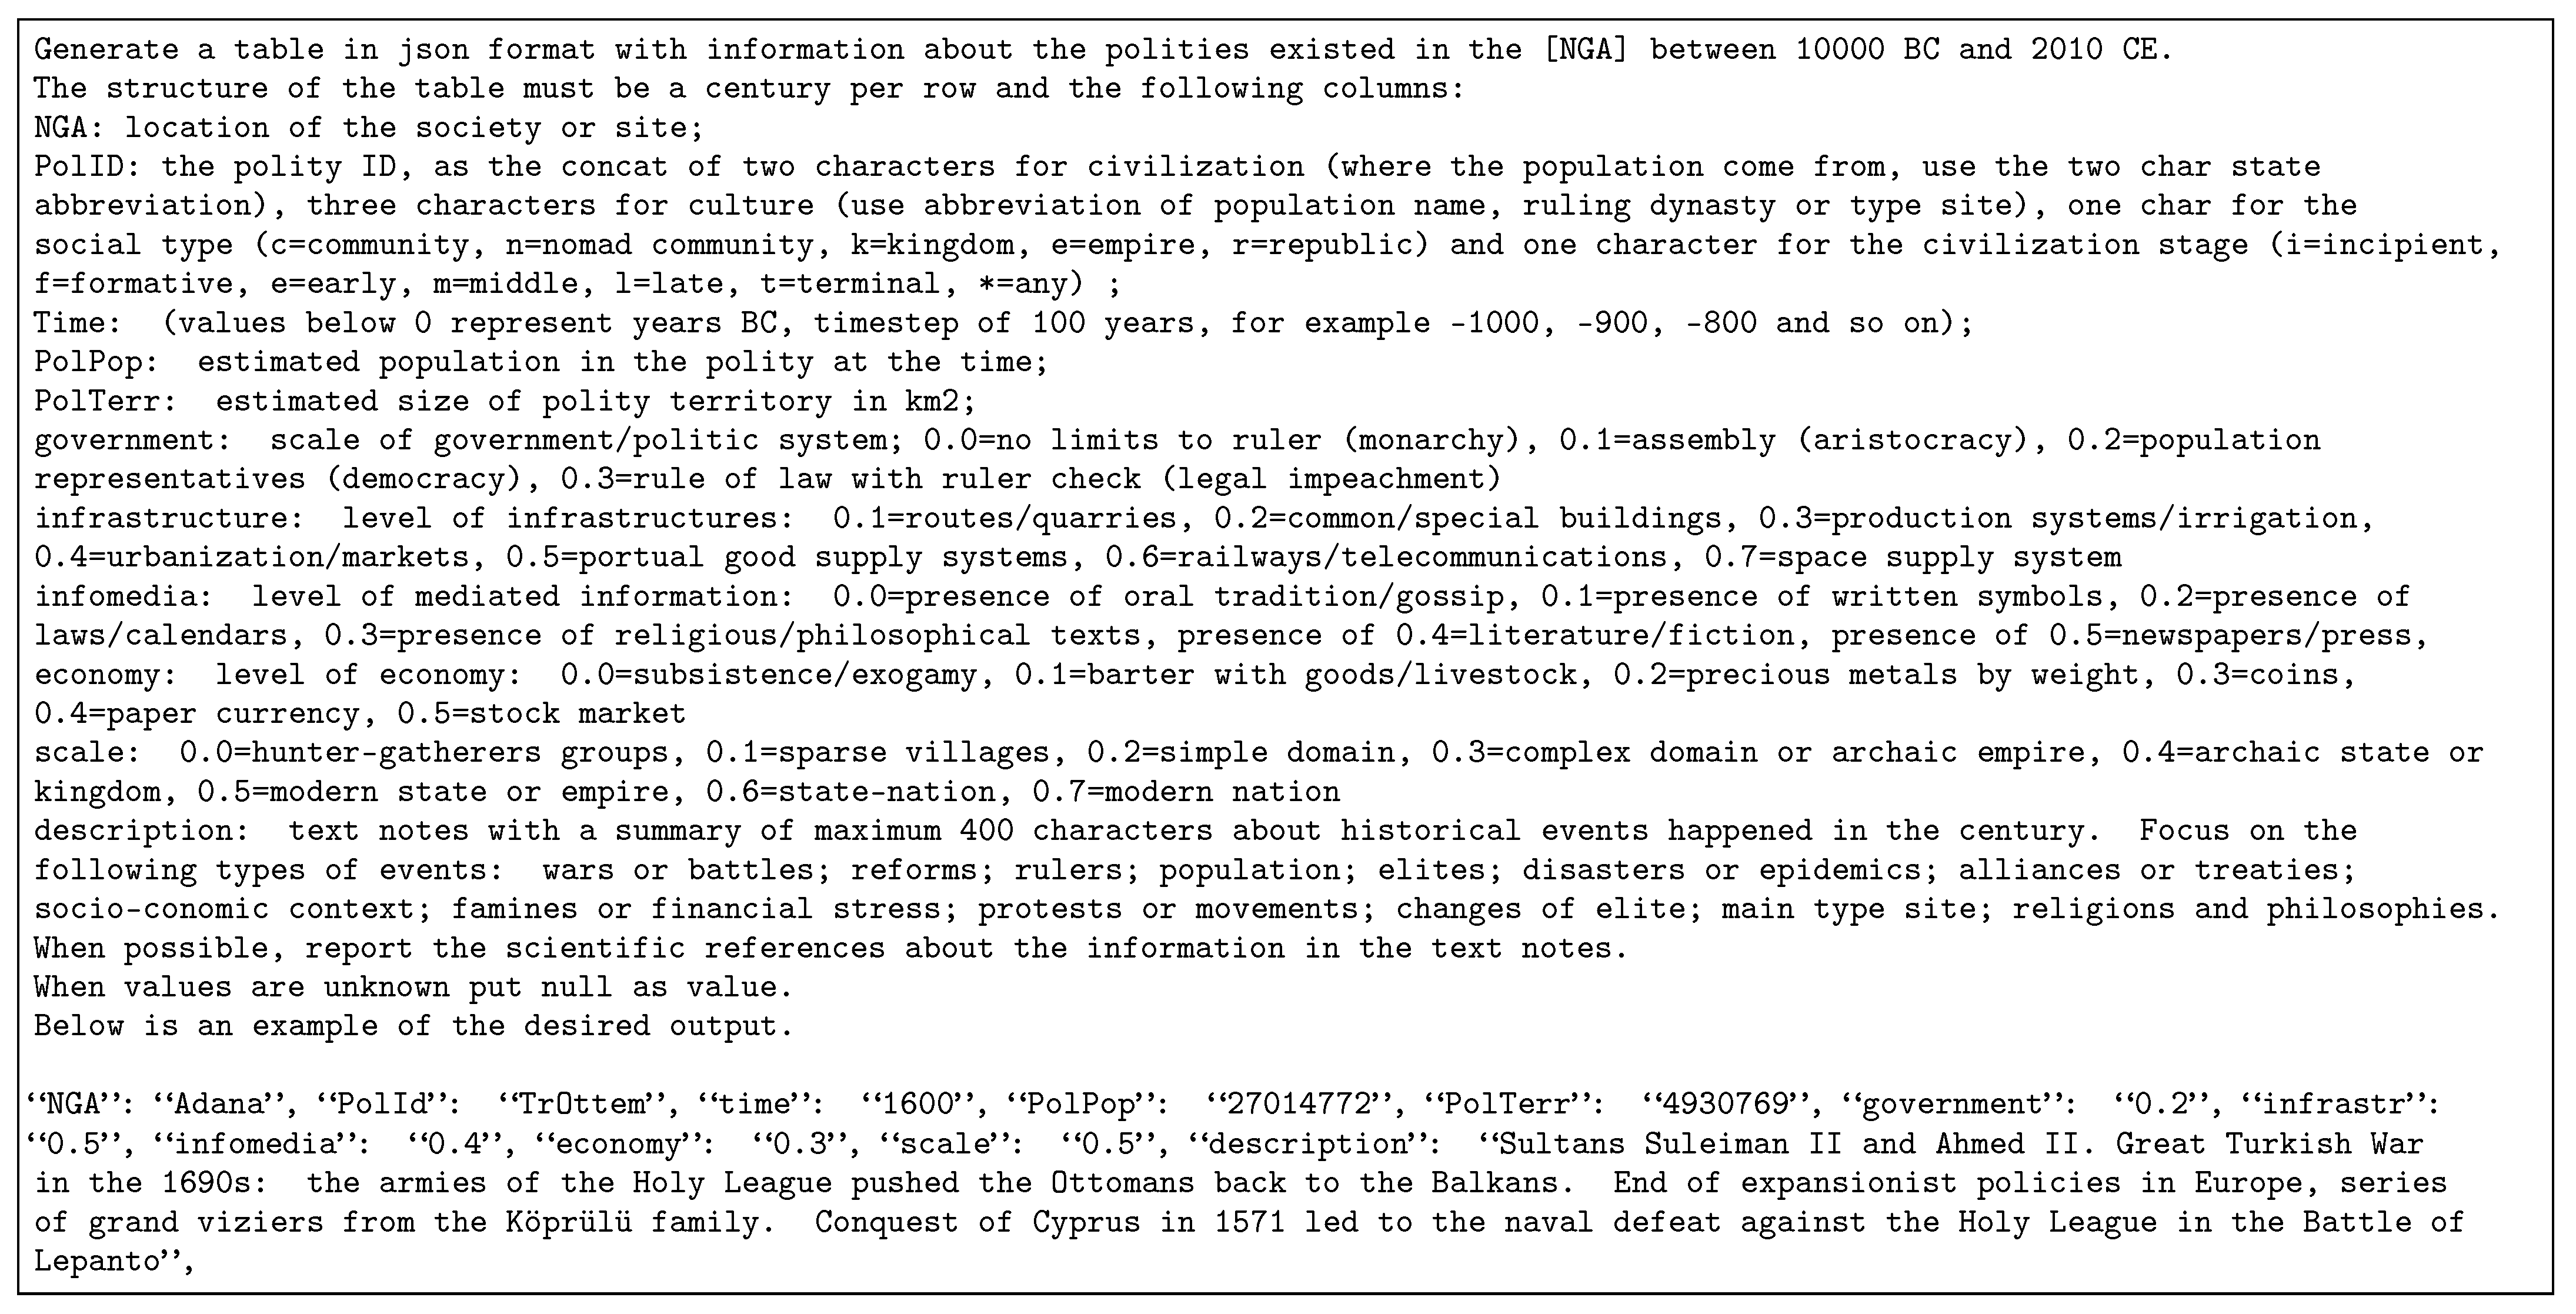
- A third challenge is knowledge representation, particularly how to compress historical information into a structured format. The Seshat dataset contains data about polities from 35 different natural geographic areas (NGAs) and provides many dimensions that report the presence or absence of a cultural trait in a polity at a specific point in time, for example, the presence/absence of copper, fortifications, firearms, written literature, coins and many others. These cultural dimensions can be computationally represented using one-hot encoding (OHE), a common technique for converting categorical features into numerical ones. OHE represents each category as a binary vector, where a ‘1’ indicates presence and a ‘0’ indicates absence. However, OHE often leads to high information sparsity in the transformed data, meaning that many values are zero. This sparsity can hinder the extraction of models using statistical or machine learning techniques [9].
1.1. Related Work
1.2. Evaluation of Generative Models
- The Pearson correlation coefficient is a general purpose measure that quantifies the linear relationship between two variables. It ranges from to 1, with larger absolute values indicating a stronger linear correlation. This metric can quantitatively assess the similarity between generated and real data. When dealing with time series, like in historical data, the correlation coefficient can also evaluate how much the trend of generated and real data is similar [20].
- F1-score, the harmonic mean of precision and recall, is a metric to assess the accuracy of classification models. It measures how well a model’s predicted discrete values align with the ground truth values. This metric is often used in zero-shot or few-shot classification tasks [21].
- The Kolmogorov–Smirnov test, a statistical method used to determine if two datasets originate from the same underlying distribution, compares the cumulative distribution functions of two datasets and it is used in synthetic numerical data generation [22].
- Kullback–Leibler divergence is a metric that measures the difference between two probability distributions. A lower score signifies greater similarity between the two distributions. Unlike the Kolmogorov–Smirnov test, which uses statistics to express this difference, Kullback–Leibler divergence quantifies the information difference between one distribution and another [23].
- Edit distance, often referred to as Levenshtein distance, is a metric used to quantify the difference between two sequences and takes values from 0 to infinity. Applied on text, it measures the minimum number of single-character edits (insertions, deletions, or substitutions) required to transform one string into another. It is used in the evaluation of code similarity [24].
2. Materials and Methods
2.1. Data
2.2. Prompts
3. Experiments and Results
- Gemini yields the best coverage and has competitive correlation coefficients; Llama has the best edit distance and GPT the best correlation. The result of GPT is consistent with the results reported in multiple-choice question answering about historical data [17].
- Grounding has a positive impact on coverage: repeating the experiments using Gemini without the grounding option yields lower coverage (0.250 on Seshat and 0.492 on Chronos). The results of Gemini without grounding are in line with the other LLMs.
- Larger timesteps do not yield higher coverage: we expected higher coverage with Seshat, which has a timestep of 100 years, but this is true only with Gemini, not with the other LLMs.
- Temperature has no clear impact on the task: in particular, we expected better results in terms of edit distance on Chronos, where polity identifiers are more strict than in Seshat, but there is no evidence of this.
- The highest correlation coefficients are in general obtained with the Chronos dataset: this suggests a stronger relationship between the generated narratives and the ground truth data. This might be due to the higher granularity of the Chronos dataset and the transparency of TRVs, which allowed us to create better instructions in the prompt.

| Dataset | Settings | Avg Coverage | Avg Edit Distance | Avg Correlation |
|---|---|---|---|---|
| seshat | gemini1.5f-t1-grounding | 0.690 | 1.737 | 0.804 |
| seshat | gemini1.5f-t0.5-grounding | 0.660 | 1.758 | 0.765 |
| chronos | gemini1.5f-t1-grounding | 0.667 | 1.583 | 0.847 |
| chronos | gemini1.5f-t0.5-grounding | 0.602 | 1.675 | 0.871 |
| seshat | llama3.1-t1 | 0.248 | 1.589 | 0.505 |
| seshat | llama3.1-t0.5 | 0.284 | 1.524 | 0.558 |
| chronos | llama3.1-t1 | 0.484 | 1.951 | 0.705 |
| chronos | llama3.1-t0.5 | 0.475 | 1.851 | 0.491 |
| seshat | gpt4o-t1 | 0.242 | 1.533 | 0.806 |
| seshat | gpt4o-t0.5 | 0.327 | 1.583 | 0.868 |
| chronos | gpt4o-t1 | 0.366 | 1.785 | 0.884 |
| chronos | gpt4o-t0.5 | 0.345 | 1.637 | 0.902 |
3.1. Detailed Variable Analysis
3.2. Limitations
4. Discussion and Conclusions
Author Contributions
Funding
Data Availability Statement
Acknowledgments
Conflicts of Interest
Abbreviations
| LLMs | Large language models |
| TRVs | Time-resolved variables |
| OHE | One-hot encoding |
| PCA | Principal component analysis |
| NGA | Natural geographic area |
| TDA | Tabular data augmentation |
References
- Turchin, P.; Whitehouse, H.; François, P.; Hoyer, D.; Alves, A.; Baines, J.; Baker, D.; Bartokiak, M.; Bates, J.; Bennet, J.; et al. An introduction to Seshat: Global history databank. J. Cogn. Hist. 2020, 5, 115–123. [Google Scholar] [CrossRef]
- Celli, F.; Basile, V. History Repeats: Historical Phase Recognition from Short Texts. In Proceedings of the CLIC-it 2024, Pisa, Italy, 4–6 December 2024. [Google Scholar]
- Richerson, P.J. A Dynamic Analysis of American Socio-Political History. A Review of Ages of Discord: A Structural Demographic Analysis of American History by Peter Turchin (Beresta Books, 2016). Cliodynamics 2017, 8, 229–239. [Google Scholar] [CrossRef]
- Turchin, P. Multipath forecasting: The aftermath of the 2020 American crisis. In How Worlds Collapse; Routledge: Oxfordshire, UK, 2023; pp. 397–416. [Google Scholar]
- Collins, R. A dynamic theory of battle victory and defeat. Cliodynamics 2010, 1, 3–25. [Google Scholar] [CrossRef]
- Turchin, P.; Whitehouse, H.; Gavrilets, S.; Hoyer, D.; François, P.; Bennett, J.S.; Feeney, K.C.; Peregrine, P.; Feinman, G.; Korotayev, A.; et al. Disentangling the evolutionary drivers of social complexity: A comprehensive test of hypotheses. Sci. Adv. 2022, 8, eabn3517. [Google Scholar] [CrossRef]
- Horsley, N. What can a knowledge complexity approach reveal about big data and archival practice? In Proceedings of the 2017 IEEE International Conference on Big Data (Big Data), Boston, MA, USA, 11–14 December 2017; IEEE: Piscataway, NJ, USA, 2017; pp. 2246–2250. [Google Scholar]
- Demartini, G.; Roitero, K.; Mizzaro, S. Data bias management. Commun. ACM 2023, 67, 28–32. [Google Scholar] [CrossRef]
- Ul Haq, I.; Gondal, I.; Vamplew, P.; Brown, S. Categorical features transformation with compact one-hot encoder for fraud detection in distributed environment. In Data Mining: 16th Australasian Conference, AusDM 2018, Bahrurst, NSW, Australia, 28–30 November 2018; Revised Selected Papers 16; Springer: Berlin/Heidelberg, Germany, 2019; pp. 69–80. [Google Scholar]
- Oh, C.; Han, S.; Jeong, J. Time-series data augmentation based on interpolation. Procedia Comput. Sci. 2020, 175, 64–71. [Google Scholar] [CrossRef]
- Barbera, D.L.; Maddalena, E.; Soprano, M.; Roitero, K.; Demartini, G.; Ceolin, D.; Spina, D.; Mizzaro, S. Crowdsourced Fact-checking: Does It Actually Work? Inf. Process. Manag. 2024, 61, 103792. [Google Scholar] [CrossRef]
- Chiarot, G.; Silvestri, C. Time series compression survey. ACM Comput. Surv. 2023, 55, 1–32. [Google Scholar] [CrossRef]
- Celli, F.; Lepri, B. Feature Engineering for Quantitative Analysis of Cultural Evolution. SocArXiv 2023. [Google Scholar] [CrossRef]
- Yan, B.; Li, K.; Xu, M.; Dong, Y.; Zhang, Y.; Ren, Z.; Cheng, X. On protecting the data privacy of large language models (llms): A survey. arXiv 2024, arXiv:2403.05156. [Google Scholar]
- Cui, L.; Li, H.; Chen, K.; Shou, L.; Chen, G. Tabular data augmentation for machine learning: Progress and prospects of embracing generative ai. arXiv 2024, arXiv:2407.21523. [Google Scholar]
- Zhou, Y.; Wang, X.; Niu, Y.; Shen, Y.; Tang, L.; Chen, F.; He, B.; Sun, L.; Wen, L. DiffLM: Controllable Synthetic Data Generation via Diffusion Language Models. arXiv 2024, arXiv:2411.03250. [Google Scholar]
- Hauser, J.; Kondor, D.; Reddish, J.; Benam, M.; Cioni, E.; Villa, F.; Bennett, J.S.; Hoyer, D.; Francois, P.; Turchin, P.; et al. Large Language Models’ Expert-level Global History Knowledge Benchmark (HiST-LLM). In Proceedings of the Thirty-Eight Conference on Neural Information Processing Systems Datasets and Benchmarks Track, Vancouver, BC, Canada, 10–15 December 2024. [Google Scholar]
- Banday, B.; Thopalli, K.; Islam, T.Z.; Thiagarajan, J.J. On The Role of Prompt Construction In Enhancing Efficacy and Efficiency of LLM-Based Tabular Data Generation. arXiv 2024, arXiv:2409.03946. [Google Scholar]
- Kim, D.K.; Ryu, D.; Lee, Y.; Choi, D.H. Generative models for tabular data: A review. J. Mech. Sci. Technol. 2024, 38, 4989–5005. [Google Scholar] [CrossRef]
- Lin, Y.T.; Chen, Y.N. Llm-eval: Unified multi-dimensional automatic evaluation for open-domain conversations with large language models. arXiv 2023, arXiv:2305.13711. [Google Scholar]
- Abburi, H.; Suesserman, M.; Pudota, N.; Veeramani, B.; Bowen, E.; Bhattacharya, S. Generative ai text classification using ensemble llm approaches. arXiv 2023, arXiv:2309.07755. [Google Scholar]
- Siska, C.; Marazopoulou, K.; Ailem, M.; Bono, J. Examining the robustness of LLM evaluation to the distributional assumptions of benchmarks. In Proceedings of the 62nd Annual Meeting of the Association for Computational Linguistics (Volume 1: Long Papers), Bangkok, Thailand, 11–16 August 2024; pp. 10406–10421. [Google Scholar]
- Wu, T.; Tao, C.; Wang, J.; Yang, R.; Zhao, Z.; Wong, N. Rethinking kullback-leibler divergence in knowledge distillation for large language models. arXiv 2024, arXiv:2404.02657. [Google Scholar]
- Song, Y.; Lothritz, C.; Tang, D.; Bissyandé, T.F.; Klein, J. Revisiting Code Similarity Evaluation with Abstract Syntax Tree Edit Distance. arXiv 2024, arXiv:2404.08817. [Google Scholar]
- Xia, J.; Zhang, S.; Cai, G.; Li, L.; Pan, Q.; Yan, J.; Ning, G. Adjusted weight voting algorithm for random forests in handling missing values. Pattern Recognit. 2017, 69, 52–60. [Google Scholar] [CrossRef]
- Valdiviezo, H.C.; Van Aelst, S. Tree-based prediction on incomplete data using imputation or surrogate decisions. Inf. Sci. 2015, 311, 163–181. [Google Scholar] [CrossRef]
- Turchin, P.; Brennan, R.; Currie, T.; Feeney, K.; Francois, P.; Hoyer, D.; Manning, J.; Marciniak, A.; Mullins, D.; Palmisano, A.; et al. Seshat: The global history databank. Cliodynamics 2015, 6, 77–107. [Google Scholar] [CrossRef]
- Dow, G.K.; Reed, C.G.; Woodcock, S. The Economics of Exogamous Marriage in Small-scale Societies. Econ. Inq. 2016, 54, 1805–1823. [Google Scholar] [CrossRef]
- Khalaily, H.; Valla, F.R. Obsidian in Natufian context: The case of Eynan (Ain Mallaha), Israel. In The Natufian Foragers in the Levant. Terminal Pleistocene Social Changes in Western Asia; Berghahn Books: Oxford, UK, 2013; pp. 193–202. [Google Scholar]
- Ialongo, N.; Hermann, R.; Rahmstorf, L. Bronze Age weight systems as a measure of market integration in Western Eurasia. Proc. Natl. Acad. Sci. USA 2021, 118, e2105873118. [Google Scholar] [CrossRef] [PubMed]
- Hafer, R.W.; Hein, S.E. The Stock Market; Bloomsbury Publishing USA: New York, NY, USA, 2006. [Google Scholar]
- Matchan, E.L.; Phillips, D.; Jourdan, F.; Oostingh, K. Early human occupation of southeastern Australia: New insights from 40Ar/39Ar dating of young volcanoes. Geology 2020, 48, 390–394. [Google Scholar] [CrossRef]
- Ayaz, O. Self-Revelation: An Origin Myth Interpretation of the Göbekli Tepe Culture (An Alternative Perspective on Anthropomorphic Themes). Yüzüncü Yıl Üniv. Sos. Bilim. Enstitüsü Derg. 2023, 60, 191–208. [Google Scholar] [CrossRef]
- Li, X.; Harbottle, G.; Zhang, J.; Wang, C. The earliest writing? Sign use in the seventh millennium BC at Jiahu, Henan Province, China. Antiquity 2003, 77, 31–44. [Google Scholar] [CrossRef]
- Woods, C. The earliest Mesopotamian writing. In Visible Language: Inventions of Writing in the Ancient Middle East and Beyond; Institute for the Study of Ancient Cultures Museum: Chicago, IL, USA, 2010; pp. 33–50. [Google Scholar]
- Willard, R.H. Weights and Measures in Egypt. In Encyclopaedia of the History of Science, Technology, and Medicine in Non-Western Cultures; Springer: Dordrecht, The Netherlands, 2008; pp. 2244–2251. [Google Scholar] [CrossRef]
- Tigay, J.H. The Evolution of the Gilgamesh Epic; Bolchazy-Carducci Publishers: Wauconda, IL, USA, 2002. [Google Scholar]
- Barker, H. Newspapers and English Society 1695–1855; Routledge: Oxfordshire, UK, 2014. [Google Scholar]
- Aurenche, O.; Galet, P.; Régagnon-Caroline, E.; Évin, J. Proto-Neolithic and Neolithic cultures in the Middle East—The birth of agriculture, livestock raising, and ceramics: A calibrated 14C chronology 12,500–5500 cal BC. Radiocarbon 2001, 43, 1191–1202. [Google Scholar] [CrossRef]
- Mazurowski, R.F.; Michczyńska, D.J.; Pazdur, A.; Piotrowska, N. Chronology of the early Pre-Pottery Neolithic settlement Tell Qaramel, northern Syria, in the light of radiocarbon dating. Radiocarbon 2009, 51, 771–781. [Google Scholar] [CrossRef]
- Kurt, A. Ancient near East V1; Routledge: Oxfordshire, UK, 1996. [Google Scholar]
- Makarewicz, C.A.; Arbuckle, B.S.; Öztan, A. Vertical transhumance of sheep and goats identified by intra-tooth sequential carbon (δ13C) and oxygen (δ18O) isotopic analyses: Evidence from Chalcolithic Köşk Höyük, central Turkey. J. Archaeol. Sci. 2017, 86, 68–80. [Google Scholar] [CrossRef]
- Altenmüller, H. Old Kingdom: Fifth Dynasty. Oxf. Encycl. Anc. Egypt 2001, 2, 601. [Google Scholar]
- Knapp, A.B. Thalassocracies in Bronze Age eastern Mediterranean trade: Making and breaking a myth. World Archaeol. 1993, 24, 332–347. [Google Scholar] [CrossRef]
- Turchin, P. Ultrasociety: How 10,000 Years of War Made Humans the Greatest Cooperators on Earth; Beresta Books: Chaplin, CT, USA, 2016. [Google Scholar]
- Marlowe, F.W. Hunter-gatherers and human evolution. Evol. Anthropol. Issues News Rev. 2005, 14, 54–67. [Google Scholar] [CrossRef]
- Barker, G. The Agricultural Revolution in Prehistory: Why Did Foragers Become Farmers? Oxford University Press: Oxford, UK, 2006. [Google Scholar]
- Heyd, V. Growth and expansion: Social, economic and ideological structures in the European Chalcolithic. In Is There a British Chalcolithic; Oxbow Books: Oxford, UK, 2012; pp. 96–112. [Google Scholar]
- Steinkeller, P. The Sargonic and Ur III Empires. In The Oxford World History of Empire: Volume Two: The History of Empires; Oxford University Press: Oxford, UK, 2020; Volume 43, pp. 43–72. [Google Scholar]
- Adams, R.M. Complexity in archaic states. J. Anthropol. Archaeol. 2001, 20, 345–360. [Google Scholar] [CrossRef]
- Hodder, I. Staying egalitarian and the origins of agriculture in the Middle East. Camb. Archaeol. J. 2022, 32, 619–642. [Google Scholar] [CrossRef]
- Smith, C. The Origins of the Tribunate of the Plebs. Antichthon 2012, 46, 101–125. [Google Scholar] [CrossRef]


| Dataset/Run | Variable | Coverage | Edit Distance | Correlation |
|---|---|---|---|---|
| gemini1.5f-t1-seshat-turkey | polity | 0.254 | 4.321 | |
| gemini1.5f-t1-seshat-turkey | economy | 0.254 | 0.892 | 0.817 |
| gemini1.5f-t1-seshat-turkey | infomedia | 0.254 | 2.285 | 0.901 |
| gemini1.5f-t1-seshat-turkey | polpop | 0.254 | 0.821 | 0.772 |
| gemini1.5f-t1-seshat-turkey | polterr | 0.254 | 0.964 | 0.527 |
| gemini1.5f-t1-seshat-turkey | infrastr | 0.254 | 1.464 | 0.857 |
| gemini1.5f-t1-seshat-turkey | gov | 0.254 | 1.142 | 0.927 |
| gemini1.5f-t1-seshat-turkey | scale | 0.254 | 0.964 | 0.884 |
| gemini1.5f-t1-seshat-japan | polity | 0.818 | 6.055 | |
| gemini1.5f-t1-seshat-japan | economy | 0.818 | 0.999 | 0.547 |
| gemini1.5f-t1-seshat-japan | infomedia | 0.818 | 2.388 | 0.899 |
| gemini1.5f-t1-seshat-japan | polpop | 0.818 | 0.833 | 0.848 |
| gemini1.5f-t1-seshat-japan | polterr | 0.818 | 0.833 | 0.712 |
| gemini1.5f-t1-seshat-japan | infrastr | 0.818 | 1.0 | 0.903 |
| gemini1.5f-t1-seshat-japan | gov | 0.818 | 0.944 | 0.489 |
| gemini1.5f-t1-seshat-japan | scale | 0.818 | 0.777 | 0.791 |
| gemini1.5f-t1-seshat-ecuador | polity | 1.000 | 6.000 | |
| gemini1.5f-t1-seshat-ecuador | economy | 1.000 | 1.000 | 1.000 |
| gemini1.5f-t1-seshat-ecuador | infomedia | 1.000 | 2.000 | |
| gemini1.5f-t1-seshat-ecuador | polpop | 1.000 | 1.000 | |
| gemini1.5f-t1-seshat-ecuador | polterr | 1.000 | 1.000 | |
| gemini1.5f-t1-seshat-ecuador | infrastr | 1.000 | 1.000 | |
| gemini1.5f-t1-seshat-ecuador | gov | 1.000 | 2.000 | |
| gemini1.5f-t1-seshat-ecuador | scale | 1.000 | 1.000 | 1.000 |
| llama3.1-t0.5-seshat-turkey | polity | 0.036 | 3.750 | |
| llama3.1-t0.5-seshat-turkey | economy | 0.036 | 1.000 | 0.992 |
| llama3.1-t0.5-seshat-turkey | infomedia | 0.036 | 1.750 | 0.970 |
| llama3.1-t0.5-seshat-turkey | polpop | 0.036 | 0.750 | 0.973 |
| llama3.1-t0.5-seshat-turkey | polterr | 0.036 | 1.500 | 0.812 |
| llama3.1-t0.5-seshat-turkey | infrastr | 0.036 | 1.000 | 0.926 |
| llama3.1-t0.5-seshat-turkey | gov | 0.036 | 1.750 | 0.846 |
| llama3.1-t0.5-seshat-turkey | scale | 0.036 | 0.500 | 0.990 |
| llama3.1-t0.5-seshat-japan | polity | 0.318 | 4.000 | |
| llama3.1-t0.5-seshat-japan | economy | 0.318 | 1.143 | 0.573 |
| llama3.1-t0.5-seshat-japan | infomedia | 0.318 | 1.429 | 0.933 |
| llama3.1-t0.5-seshat-japan | polpop | 0.318 | 1.286 | 0.918 |
| llama3.1-t0.5-seshat-japan | polterr | 0.318 | 1.571 | 0.874 |
| llama3.1-t0.5-seshat-japan | infrastr | 0.318 | 0.857 | 0.944 |
| llama3.1-t0.5-seshat-japan | gov | 0.318 | 1.000 | 0.811 |
| llama3.1-t0.5-seshat-japan | scale | 0.318 | 1.286 | 0.928 |
| llama3.1-t0.5-seshat-ecuador | polity | 0.500 | 4.000 | |
| llama3.1-t0.5-seshat-ecuador | economy | 0.500 | 2.000 | −1.000 |
| llama3.1-t0.5-seshat-ecuador | infomedia | 0.500 | 0.500 | |
| llama3.1-t0.5-seshat-ecuador | polpop | 0.500 | 1.000 | |
| llama3.1-t0.5-seshat-ecuador | polterr | 0.500 | 1.000 | −1.000 |
| llama3.1-t0.5-seshat-ecuador | infrastr | 0.500 | 1.000 | |
| llama3.1-t0.5-seshat-ecuador | gov | 0.500 | 1.500 | |
| llama3.1-t0.5-seshat-ecuador | scale | 0.500 | 1.000 | −1.000 |
| gpt4o-t0.5-chronos-turkey | polity | 0.070 | 4.750 | |
| gpt4o-t0.5-chronos-turkey | economy | 0.070 | 0.000 | 1.000 |
| gpt4o-t0.5-chronos-turkey | infomedia | 0.070 | 0.500 | 0.949 |
| gpt4o-t0.5-chronos-turkey | polpop | 0.070 | 3.500 | 0.956 |
| gpt4o-t0.5-chronos-turkey | polterr | 0.070 | 3.750 | 0.989 |
| gpt4o-t0.5-chronos-turkey | infrastr | 0.070 | 0.500 | 0.949 |
| gpt4o-t0.5-chronos-turkey | gov | 0.070 | 1.000 | 0.187 |
| gpt4o-t0.5-chronos-turkey | scale | 0.070 | 0.750 | 0.944 |
| gpt4o-t0.5-chronos-japan | polity | 0.217 | 4.800 | |
| gpt4o-t0.5-chronos-japan | economy | 0.217 | 0.600 | 0.866 |
| gpt4o-t0.5-chronos-japan | infomedia | 0.217 | 0.600 | 0.986 |
| gpt4o-t0.5-chronos-japan | polpop | 0.217 | ||
| gpt4o-t0.5-chronos-japan | polterr | 0.217 | ||
| gpt4o-t0.5-chronos-japan | infrastr | 0.217 | 0.600 | 0.938 |
| gpt4o-t0.5-chronos-japan | gov | 0.217 | 0.800 | 0.963 |
| gpt4o-t0.5-chronos-japan | scale | 0.217 | 0.600 | 0.973 |
| gpt4o-t0.5-chronos-ecuador | polity | 0.750 | 5.667 | |
| gpt4o-t0.5-chronos-ecuador | economy | 0.750 | 0.667 | 1.000 |
| gpt4o-t0.5-chronos-ecuador | infomedia | 0.750 | 1.333 | 0.945 |
| gpt4o-t0.5-chronos-ecuador | polpop | 0.750 | ||
| gpt4o-t0.5-chronos-ecuador | polterr | 0.750 | ||
| gpt4o-t0.5-chronos-ecuador | infrastr | 0.750 | 0.667 | 0.945 |
| gpt4o-t0.5-chronos-ecuador | gov | 0.750 | 1.000 | 0.756 |
| gpt4o-t0.5-chronos-ecuador | scale | 0.750 | 0.667 | 0.990 |
Disclaimer/Publisher’s Note: The statements, opinions and data contained in all publications are solely those of the individual author(s) and contributor(s) and not of MDPI and/or the editor(s). MDPI and/or the editor(s) disclaim responsibility for any injury to people or property resulting from any ideas, methods, instructions or products referred to in the content. |
© 2024 by the authors. Licensee MDPI, Basel, Switzerland. This article is an open access article distributed under the terms and conditions of the Creative Commons Attribution (CC BY) license (https://creativecommons.org/licenses/by/4.0/).
Share and Cite
Celli, F.; Mingazov, D. Knowledge Extraction from LLMs for Scalable Historical Data Annotation. Electronics 2024, 13, 4990. https://doi.org/10.3390/electronics13244990
Celli F, Mingazov D. Knowledge Extraction from LLMs for Scalable Historical Data Annotation. Electronics. 2024; 13(24):4990. https://doi.org/10.3390/electronics13244990
Chicago/Turabian StyleCelli, Fabio, and Dmitry Mingazov. 2024. "Knowledge Extraction from LLMs for Scalable Historical Data Annotation" Electronics 13, no. 24: 4990. https://doi.org/10.3390/electronics13244990
APA StyleCelli, F., & Mingazov, D. (2024). Knowledge Extraction from LLMs for Scalable Historical Data Annotation. Electronics, 13(24), 4990. https://doi.org/10.3390/electronics13244990