Abstract
Aiming at the problems of insufficient power supply capacity, unbalanced load, and poor safety and reliability of the urban power grid, a flexible DC optimization control strategy is proposed to support the interconnection of power grid zones. Firstly, the steady-state and transient optimal control objectives are established to meet the safety and economic operation requirements of the grid; secondly, comprehensive evaluation indexes are constructed, covering load balancing, network loss, and voltage deviation, and a step-by-step approximation method is used to quickly solve the optimal power of the flexible DC, so as to realize the optimal control of the urban grid in the steady state. Meanwhile, a multi-terminal flexible DC adaptive sag control strategy based on the power margin of the converter station is designed to reasonably allocate the emergency power support in each partition after a fault and reduce the frequency deviation of the heavily loaded nodes. Taking the urban grid as an example, a simulation model of the grid structure with a 750 KV outer ring and a 220 KV inner ring is constructed, and the simulation results verify the effectiveness of the proposed method and its engineering practicability.
1. Introduction
While effectively reducing short-circuit currents and solving the safety hazards of electromagnetic ring networks [1], ring network structures also bring new challenges. For example, during steady-state operation, due to the natural distribution of the current, it may not be possible to achieve economically optimal operation; the capacity of transmission and substation equipment may be strained and excess coexisting, making it difficult to carry out comprehensive coordination; and when faults lead to component overloading, it is not possible to flexibly utilize the surplus power supply capacity of the neighboring sub-districts, and it may be necessary to take load switching or even load-cutting measures, which will in turn reduce the reliability of the power supply.
Flexible DC, with its active and reactive power decoupling control [2], the convenience of multi-terminal system construction, and flexible control mode, has become a new solution to the problem of zonal operation. The interconnection of urban power grid zones is realized through flexible DC, which can coordinate the power distribution between zones in steady state and significantly improve the operation economy, flexibility, and controllability of the power grid [3]; in case of faults leading to component overloading, the emergency control function of flexible DC can provide inter-zonal power support, further enhancing the security and stability of the power grid [4].
Flexible DC optimization control to support the zonal interconnection of urban grids contains two aspects: steady-state current optimization and fault power support. For steady-state DC power optimization, the literature [5,6] focuses on multi-terminal DC or DC grids and explores the effect of control strategies in reducing DC voltage fluctuations and lowering system losses, but pays insufficient attention to the interactions and constraints between AC and DC systems. For the zonal flexible interconnection of urban grids, the AC/DC system as a whole needs to be evaluated to better match the actual operation. In terms of flexible DC emergency power support, literature [7] analyzes the power mathematical model and control method of the MMC-HVDC converter and proposes to use decoupled PI control to limit the power output, which realizes the emergency power support and improves the low-voltage ride-through capability of the converter. Literature [8] proposes a coordinated control strategy for VSC-MTDC systems to improve the frequency and voltage dynamics of the receiver system during LVRT and recovery. Literature [9] proposes a combined approach incorporating a virtual passive filtering method and an equivalent current sampling method to provide additional damping to suppress high-frequency oscillations Literature [10] proposes the use of a prioritized emergency power support coordination strategy in AC/DC hybrid systems to effectively mitigate line overload and improve frequency stability during current transfer. Some scholars are currently working on improving the multi-terminal DC sag control. For example, literature [11] proposes to present an adaptive sag control strategy based on virtual synchronous generator technology, which is used to solve the problem of inertia that cannot be provided by using dq double-loop control in a voltage-source type multi-terminal flexible dc transmission system. Literature [12] proposed an adaptive sag control strategy for the shortcomings of the traditional sag control strategy that the parameters are difficult to calibrate, the control accuracy is low, and it is difficult to adapt to a variety of operating conditions, so that the sag coefficients can be automatically adjusted according to the different operating conditions, thus reducing the transient power oscillations.
Although existing studies provide some foundation for this paper, most of the literature mainly focuses on new energy grid-connected and microgrid scenarios [13,14,15,16] and explores the control strategies of flexible DC in coping with the stochastic volatility of new energy power generation and the wind-solar-storage multi-energy complementation. However, these studies often neglect the special needs and challenges of zonal interconnection in urban grids. In the ring network, the complexity of zonal interconnection requires that the flexible DC control strategy can adapt to the power demand and system stability constraints of different zones, but the existing studies have paid insufficient attention to this. Currently, the studies on zonal flexible interconnection of power grids are mostly focused on the planning level [17,18,19,20,21,22], while there are fewer in-depth discussions on the actual flexible DC optimization and control techniques. Therefore, there is an urgent need to develop adaptable flexible DC optimization and control techniques for the actual operational requirements of power grids to ensure the efficient, safe, and stable operation of the system.
This paper first establishes the optimal control objectives for grid-partitioned flexible interconnection under both steady-state and transient conditions. For the steady-state control objective, a stepwise approximation method is employed to efficiently determine the optimal power of flexible DC based on a comprehensive set of evaluation indices that account for network loss, load balancing, and voltage deviation. For the transient control objective, a multi-terminal adaptive sagging control strategy is designed for flexible DC systems, enabling emergency power support during grid partitioning. Additionally, a multi-terminal flexible DC control strategy is developed through system power simulation, and the adaptive sagging control strategy is further refined using simulation techniques. Finally, the effectiveness and engineering feasibility of the proposed method are validated through simulation modeling.
2. Functionality of Flexible Interconnections in Grid Zones and Optimization Control Objectives
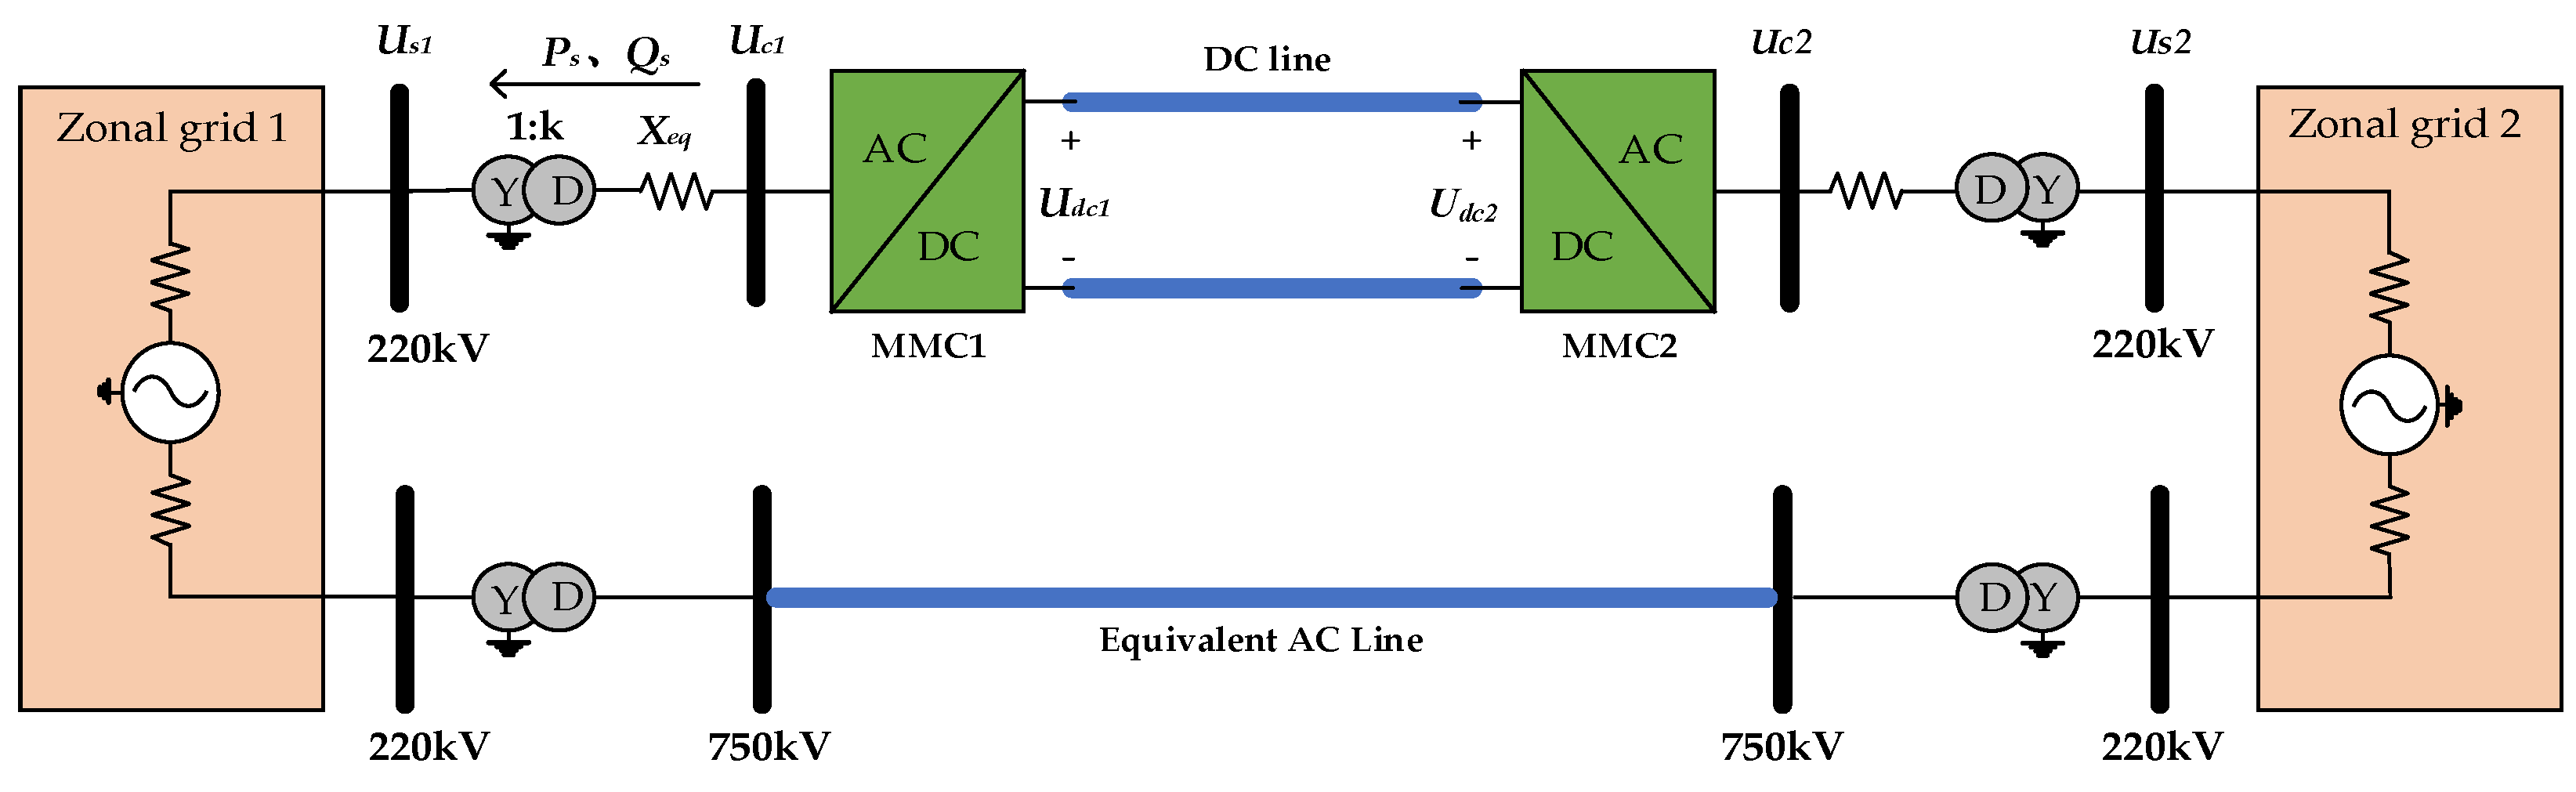
The schematic diagram of the flexible interconnection structure for the urban grid partition is shown in Figure 1. The two partitioned grids are connected via a 750 KV transmission line and are supplied by a 750/220 KV liaison transformer. To mitigate the risk of electromagnetic loop networks, the 220 KV partitioned grid is interconnected flexibly through flexible DC.
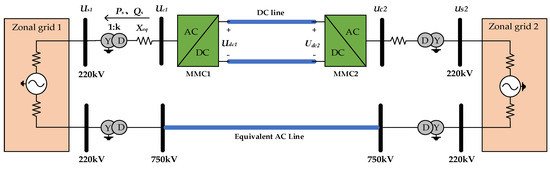
Figure 1.
Flexible DC transmission.
Neglecting the conditions of the converter transformer and line resistance, the voltage source converter outlet fundamental frequency voltage and the AC system side bus voltage together in the converter transformer and phase reactor equivalent reactance Xeq, which can be simplified to derive the flexible DC converter station and the AC system between the transmission of active power and reactive power respectively, as Equation:
From the above equation, it can be seen that the transmission of active power of flexible DC mainly depends on the phase shift angle of with respect to , and the exchange of reactive power mainly depends on the fundamental wave amplitude of the AC-side output voltage of the converter, , therefore, by adjusting the phase shift angle of the output voltage of the converter station and the amplitude of , it is possible to control the magnitude and direction of the active and reactive power transmitted by the flexible DC transmission system, and to achieve the ability of four-quadrant operation. The four-quadrant operation capability can be realized by adjusting the output voltage shift angle .
2.1. Functions of Grid-Partitioned Flexible Interconnection
With the continuous growth of the proportion of new energy and the rapid development of flexible transmission technology, regional power grids have gradually broken the previous relatively independent mode of operation and realized the “soft connection” between power grids through the application of power electronic devices [23]. This “soft connection” technology allows the exchange of active power between grids under normal operating conditions, which significantly improves the load balancing capacity, power supply capacity, and overall reliability of the grid. This model facilitates the effective coordination of the various regions of the grid, enhances the overall stability of the system, and improves the responsiveness to unforeseen situations.
Under this grid interconnection mode, when a fault occurs in one of the interconnected areas, the unaffected sub-areas can quickly provide active and reactive power support to effectively stabilize the bus voltage and frequency levels in the faulty sub-area, thus preventing fault extension and maintaining stable grid operation. In order to fully utilize the advantages of flexible transmission devices, the following key functions must be available [24]:
(1) Steady-state current optimization: During normal grid operation, load distribution is optimized to reduce system losses and maximize the consumption of new energy sources in order to achieve a balanced grid load. This includes adjusting the power delivery from the new energy-rich areas to the load center areas according to the source-load matching characteristics of each sub-area. This optimization not only helps to alleviate power supply tension and reduce the abandonment of wind power, but also effectively optimizes the current distribution and improves the overall operating efficiency of the grid.
(2) Emergency power mutual aid: In the event of grid failure or maintenance resulting in a shortage of active power in one area of the grid, the flexible transmission device can provide minute-level large-scale rapid power support according to the power supply margins of neighboring areas. This support mechanism can realize wide-scale power transfer and fault support to ensure the stability of the grid and the continuity of power supply.
2.2. Optimized Control Objectives of Grid-Partitioned Flexible Interconnection
The use of flexible DC technology to optimize the zonal interconnection of the grid, directly connecting each 220 KV grid zone through flexible DC, aims to significantly improve the flexibility of power control. Against the backdrop of increasing demand for grid capacity expansion, traditional AC interconnection methods are often faced with problems such as rising short-circuit current levels and increased control difficulties. Flexible DC technology, through its unique flexibility and regulation advantages, is able to realize efficient interconnection and cooperative work between grid partitions without significantly increasing short-circuit current.
(1) Steady-state operation. During normal operation or planned maintenance of the power grid, the flexible DC system is mainly responsible for optimizing power scheduling and distribution, with the core objective of reducing the overall loss of the system and achieving load balancing of the power grid. In this process, FDC can flexibly adjust the power flow, analyze the power supply capacity and load condition of each partition in real time, and reasonably allocate resources. For example, when the load of a certain sub-district is light, the FDC system can transmit the excess power to the sub-district with a heavier load to alleviate the pressure on the power supply of the sub-district. This not only improves the overall operational efficiency of the grid but also helps to reduce the abandonment of wind power and photovoltaic power caused by the imbalance between supply and demand. By optimizing power dispatch, the FDC system can find the optimal operating point within the operating range, thus achieving load balance and minimizing system losses. The introduction of flexible DC technology makes the power grid perform better in dealing with new energy grid connections. In the South Xinjiang region, new energy resources such as wind energy and light energy are abundant, but their fluctuation and intermittency also bring challenges to the stable operation of the power grid. With its fast response and power regulation capability, the flexible DC system can better adapt to the fluctuating characteristics of new energy power generation, ensure the full utilization and consumption of new energy power, and thus improve the economy and environmental protection of the entire power grid.
(2) Transient operation. In the event of grid failure, such as transmission line or main transformer failure or overload, the flexible DC system needs to quickly provide emergency power support to ensure the stable operation of the grid. Especially in the mode of zonal interconnection, when a fault occurs in a certain zone, FDC can quickly deploy power resources from the non-faulty zone to provide emergency active power support for the faulty zone. In this way, it can effectively alleviate the overload phenomenon in the faulty partition, avoid the risk of voltage instability or even voltage collapse, and ensure the continuous and stable operation of the power grid system. Compared with the traditional AC interconnection method, the advantages of flexible DC in fault handling are more obvious. It not only realizes precise power regulation but also makes dynamic adjustments according to the real-time operating status and load conditions of the grid, thus enhancing the flexibility and efficiency of fault handling. This emergency power support mechanism helps prevent the spread of faults and widespread system destabilization, maximizing the security and reliability of the grid. After fault handling is completed, the system can resume normal power distribution through flexible DC, ensuring a smooth transition and operational recovery of the entire grid.
3. Flexible DC Power Optimization Strategies for Steady-State Operating Conditions
3.1. Synthesized Assessment
By establishing specific evaluation indexes, the steady-state current distribution of urban zonal grids under different FDC delivery powers is evaluated to determine the optimal operating power. The comprehensive evaluation indexes are established as follows:
where: is the comprehensive score of urban zonal grid under a certain transmission power of flexible DC; is the normalized load balancing index; is the normalized network loss index; is the normalized line voltage deviation index; a, b, and c are the weights of the three indexes, which are calculated using the method based on information entropy theory.
3.1.1. Load Equalization
Under the steady-state condition, FDC is controlled to deliver power from the light-load partition to the heavy-load partition, to equalize the load rate of the main transformer in each partition, to improve the utilization efficiency of the main transformer, and to reduce the degree of dispersion of the load rate of the main transformer in each partition. In order to facilitate the analysis and comparison between different indicators, the normalized load balancing indicators are established as follows:
where and are the standard deviation of all transformer loading rates within the urban grid before and after the commissioning of FDC, respectively; is the minimum value of the standard deviation of the main transformer loading rate within the adjustable power range of FDC.
In order to measure the discrete degree of main transformer load rate, the standard deviation of the load rate of all transformers within the city grid is calculated as follows:
where σ is the standard deviation of the loading rate of N transformers; , and are the power, capacity and loading rate of the ith 500 KV main transformer, respectively; and is the arithmetic mean of the loading rate of main transformers.
3.1.2. Network Loss
Under the steady-state condition, controlling the power delivered by FDC can make the current distribution between sub-districts uniform, reduce the line network loss and transformer loss, and improve the system operation economy. In order to compare and analyze the network loss of the urban sub-district grid before and after the commissioning of FDC, the normalized power loss indexes are adopted as follows:
where , , respectively, is the sum of network losses in all sub-districts of the city grid before and after the commissioning of the FDC; is the minimum value of network losses within the adjustable range of the FDC power.
The network loss includes 220 KV line loss and 750/220 KV transformer loss, as well as FDC converter and line loss. The calculation formula is as follows:
where for the urban grid network loss; , for line loss and transformer loss; for the flexible DC converter loss.
3.1.3. Voltage Deviation
In the AC/DC hybrid system, the voltage is closely related to the power balance of the network, so the voltage deviation of all nodes is used as the performance index of the system.
where and are the standard deviation of all transformer voltages within the city grid before and after the commissioning of FDC; is the minimum value of main transformer voltage quasi-differential within the adjustable range of FDC power.
where is the standard deviation of voltage of main 750 KV transformers; , , are the actual voltage, rated voltage, and voltage deviation rate of the ith 750 KV main transformer; is the arithmetic mean of voltage deviation rate of main transformers.
3.2. Optimal Power Solution Method
The load balancing indexes , network loss index, and line voltage deviation index have different characteristics, and with the increase in the power delivered by the FDC in the steady-state operation, the three-phase indexes are all increasing and then decreasing, but the power corresponding to the turning point is different, and the load balancing effect is more obvious. The calculation process of the optimal power of the flexible DC zonal interconnection device in steady state is shown below.
- Step 1: Count the power of each 750 KV main transformer in the zonal operation mode of the city grid online, and calculate the standard deviation of the main transformer load ratio , network loss , and line voltage deviation U before the commissioning of the FDC.
- Step 2: Determine the operating range of FDC power between zones according to the constraints of line rated power and main transformer capacity [,].
- Step 3: Set the initial FDC power , the power growth direction d, the initial step of power growth s, and the convergence accuracy ε.
- Step 4: Calculate the standard deviation of main transformer loading rate σ1, network loss P1 and voltage deviation U, for each partition under the FDC transmission power . Substitute them into Equations (2), (6) and (1) to get , , , and the comprehensive score G.
- Step 5: If , then update the optimal score , while continuing to increase the flexible DC power , return to step 4; if , then update the step s = s/2, while reducing the flexible DC power , to solve the optimal power accurately. Determine whether s is greater than ε; if so, turn to step 4; otherwise, it can be determined that the power corresponding to is the optimal flexible DC power .
4. Flexible DC Power Control Strategy Based on Grid Zonal Fault Conditions
4.1. Sub-Regional Power Supply Capacity Assessment
The supply capacity of a 220 KV zonal grid in the power grid is mathematically a typical multidimensional, multi-constrained nonlinear programming problem with an objective function:
where is assumed to be the power supply capacity of 220 KV sub-district; is the load of 220 KV sub-district; is the sum of 750 KV main transformer injection power in the sub-district; is the sum of generating unit output in the sub-district.
The constraints to be considered are as follows:
(1) 750 KV main transformer injection power constraints. That is, the power injected into any 750 KV main transformer in the sub-district shall not exceed the rated value.
(2) 220 KV line transmission power constraints
(3) Voltage inequality constraints. That is, the voltage at each bus in the sub-division shall be maintained within the specified limits.
In Equations (13)–(15), , are the actual power and rated value of 750 KV main transformer ; , are the actual value and rated value of the transmitted power of 220 KV line ; and , , are the specified upper operating limit, rated value of the voltage and the specified lower operating limit of the voltage of divisional busbar .
4.2. Adaptive Droop Control Strategy Based on Power Margin of Converter Station
The traditional sag control method regulates the power of the converter station according to a fixed sag coefficient, which shows insufficient flexibility and economy under complex operating conditions, cannot adapt to different operating conditions, and does not fully consider the actual load and the dynamic power margin of the converter station. In order to solve this problem, the task of DC voltage stabilization is assigned to multiple converter stations by considering the operating conditions and power margins of the converter stations. The converter station with a small power margin shares less unbalanced power, while the converter station with a large power margin takes on more unbalanced power to ensure a more reasonable power distribution and avoid the situation that the converter station cannot respond to the DC network trend changes due to full load under the traditional sag control.
In order to improve the flexibility of the sag coefficient, an adaptive sag control method is designed in this study to dynamically adjust the sag coefficient according to the power margin of the converter station. The method adopts the curve control characteristic instead of the linear control characteristic: when the power margin of the converter station is large, the sag coefficient is small, the voltage control effect is better, and more unbalanced power can be borne; with the reduction in power margin, the sag coefficient gradually increases, and the power distribution characteristic improves, and the power sharing decreases, so that several converter stations can reach the full-load state at the same time.
The classical sag control characteristics are described as follows:
, denote the actual and reference values of DC voltage, respectively; , the actual and reference values of DC power, respectively; k is the sag coefficient; , the maximum and minimum values of DC voltage, respectively; , the maximum and minimum values of DC power, respectively.
The adaptive sag control designed in this paper is described as follows:
Among them: .
The value of ξ can be used to describe the power margin of the converter station; the closer the value of |ξ| is to 1, the smaller the power margin of the converter station, and the converter station operates at full load when |ξ| = 1.
Adaptive sag control can ensure that the emergency power support quantity is reasonably allocated in case of failure, avoiding the situation that the fixed sag coefficient causes the converter station to be overloaded and unable to respond, and each converter station can “do what it is capable of” according to its own power margin. The DC voltage generated by adaptive sag control is smaller when the converter station has a larger power margin and has better DC voltage stability. When the power margin of the converter station is larger, the adaptive sag control produces smaller DC voltage changes and better DC voltage stability.
4.3. Design of Multi-Terminal Flexible DC Control Strategies for Supporting Sub-Area Interconnection of Urban Power Grids
First, the power supply capacity of each partition is evaluated according to the methodology described in Section 4.1 to determine the maximum power supply energy for each partition.
The zonal power supply margin index is calculated as follows:
where is the partition power supply margin index; is the available power supply capacity of the partition; is the total initial load of the partition.
Utilizing multi-terminal flexible DC to realize flexible interconnection between multiple sub-districts of the urban power grid, the sender and receiver are reasonably selected according to the power supply margin of each sub-district, with sub-districts with larger power supply margins as senders and sub-districts with smaller power supply margins as receivers; the capacity of the sender converter station is reasonably determined according to the available power supply capacity of the sub-districts and the rated current of DC lines; and the capacity of the receiver converter station is determined according to the maximum power that may be received, so that the power supply capacity of each sub-district can be given full play to. The capacity of the receiving end converter station is determined according to the maximum power that may be received, so as to fully utilize the power supply capacity of each partition.
During normal operation, the converter stations with large power margins are set to adopt adaptive sag control, and those with small power margins are set to adopt constant active power control, and the reactive power control modes of the converter stations are reasonably selected according to the strength of the reactive voltage support in each sub-district. The optimal operating power is calculated according to the method described in Section 2 to realize the comprehensive optimization of network loss and load balancing.
When there is a risk of overloading the line or main transformer due to a fault, adaptive sag control of multi-terminal flexible DC is used to provide emergency power support from the non-faulty partition to the faulty partition to eliminate the overloading situation. According to the different control modes of the fault partition converter station, it can be categorized into the following two cases:
(1) The fault partition converter station adopts constant active power control. Calculate the fault partition line or main transformer overload as:
where is the component overload; is the post-fault power; is the line or transformer rated power.
In order to eliminate line or transformer overloading, change the fault zoned converter station active power reference value to:
where and are the reference values of active power before and after the fault in the converter station, is the total number of overloaded components, and is the overload of the ith component.
After changing the reference value of active power of the converter station in the fault partition, the DC network power is unbalanced and the DC voltage decreases, and other converter stations with adaptive sag control increase the active power injected into the DC network with the decrease in DC voltage, and finally the system power is balanced, the DC voltage is stabilized, and the component overload is eliminated.
Utilizing multi-terminal flexible DC fast regulation capability to eliminate component overload in time, but at this time the system is not at optimal operation, and the converter station power is larger. Further consider increasing the fault partitioning power on to replace the flexible DC power in order to enhance the system security and stability margins.
(2) Adaptive sag control is adopted for fault partition converter station. In order to eliminate component overload, it is necessary to accurately control the flexible DC power, so switching the fault partition converter station for the fixed active power control and the rest of the non-fault partition converter station adopts the adaptive sag control, and the succeeding control method is as in the case.
5. Calculus Analysis
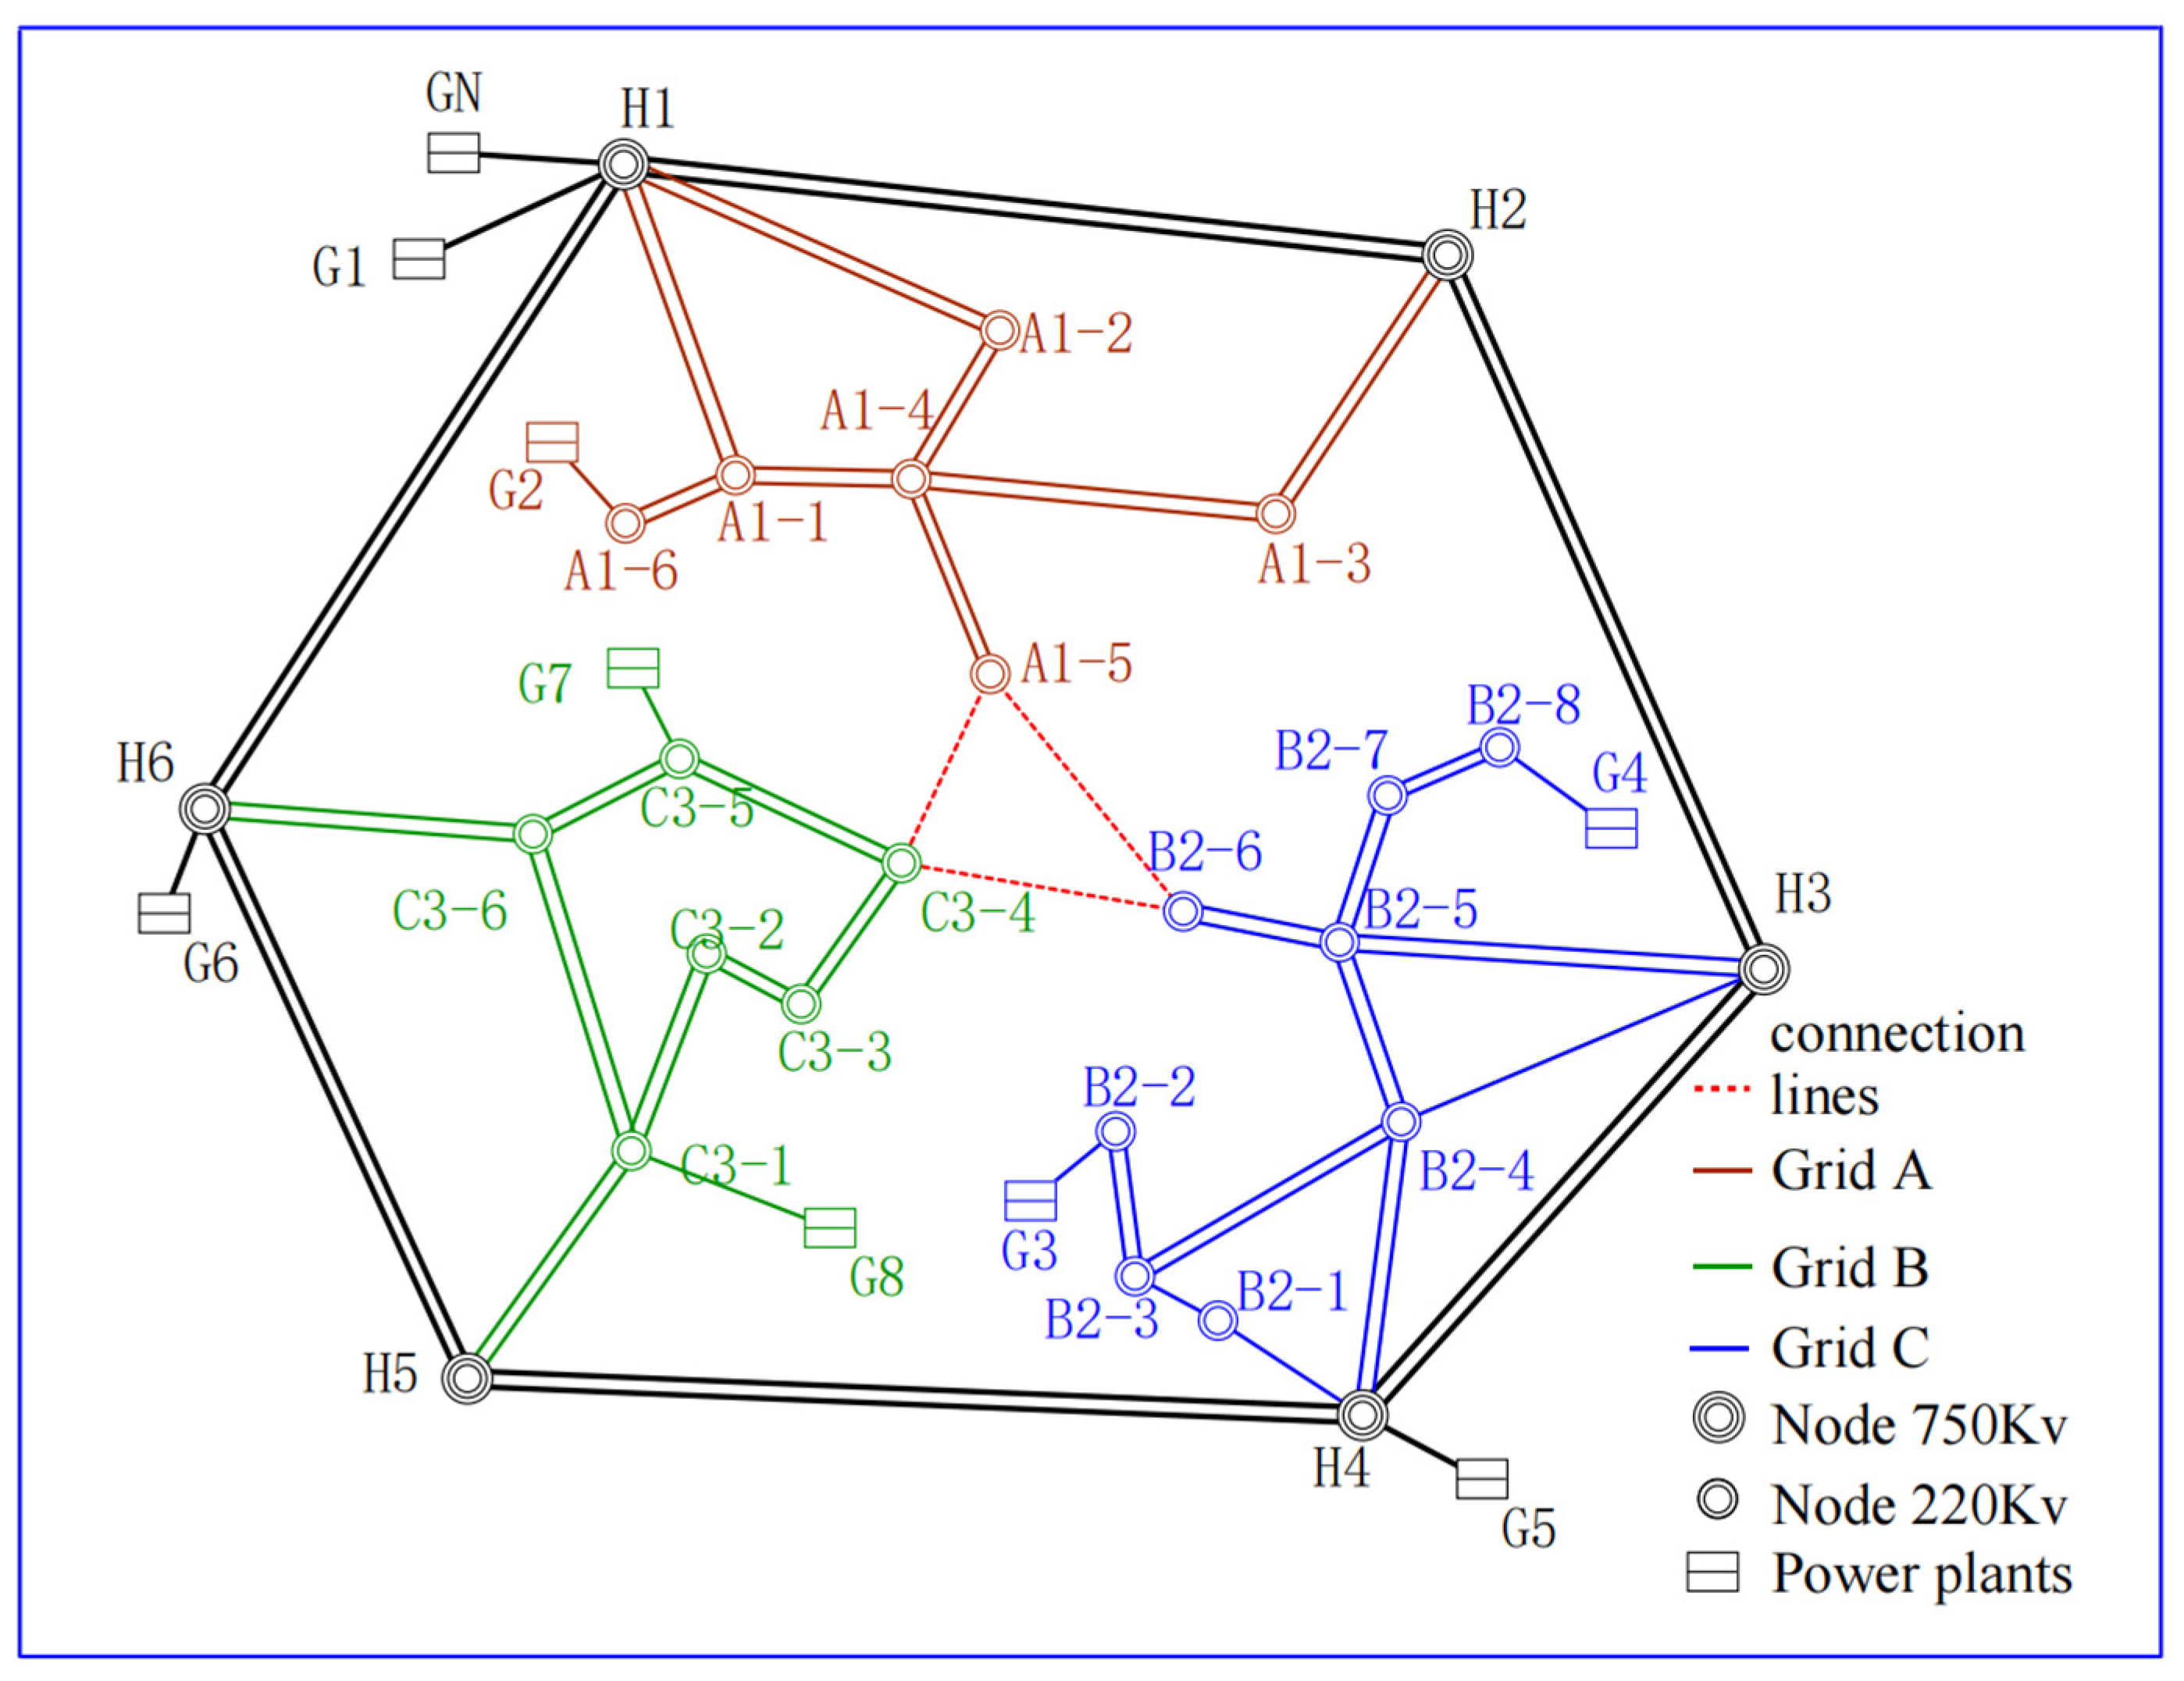
The power grid structure in the southern Xinjiang region of China is primarily composed of a 750 KV ultra-high voltage outer ring network and a 220 KV zonal power supply. Based on the characteristics of the grid in southern Xinjiang, this paper uses Version 3.8 PSD-BPA software to construct the structural model of the 750 KV outer ring network and the 220 KV inner ring network for simplified analysis. The grid structure is divided into three regions: A, B, and C, as shown in Figure 2. The power plant parameters, line parameters, and other related information are provided in Table A1 in Appendix A. The simulation experiments are conducted using PSD-BPA (Power System Design-BPA) software, which is widely used for power system analysis and design. PSD-BPA supports steady-state and transient analysis, power flow calculations, fault analysis, optimization scheduling, and various other power system calculations.
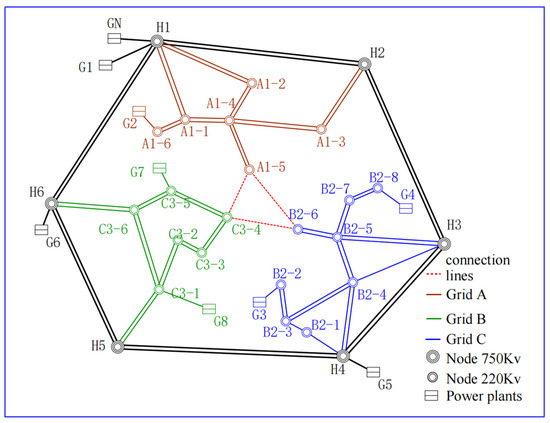
Figure 2.
Grid structure.
The outer ring of regions A, B, and C is networked at 750 KV voltage level, and the inner ring is interconnected at 220 KV voltage level. Assuming that the internal areas A, B and C are supplied by 220 KV AC interconnection, the power system current distribution is shown in Figure A1 in Appendix A.
According to the analysis of the current distribution, area C has the heaviest load, area A is the second heaviest, and area B has the lightest load. Through the 220 KV AC line, node B2–6 in zone B delivers 386.0 MW of active power to node C3–4 in zone C, while 55.0 MW is delivered to node A1–5 in zone A. In addition, node A1–5 in zone A delivers 329.4 MW of active power to node C3–4 in zone C. Overall, in the AC interconnecting mode, zones A and B serve as the sources of power output, while zone C acts as the main power input area. After the trend analysis, the total power delivered by nodes A1–5 and B2–6 to zone C is 715.4 MW.
5.1. Flexible DC Power Optimization Strategy for Steady-State Case
The capacity, voltage deviation rate, and load rate of the 750 KV and 220 KV transformers under grid partitioned operation are detailed in Appendix A, Table A1. The optimal power of flexible DC is calculated using the stepwise approximation method, and the calculation process is shown in Appendix A, Table A2.
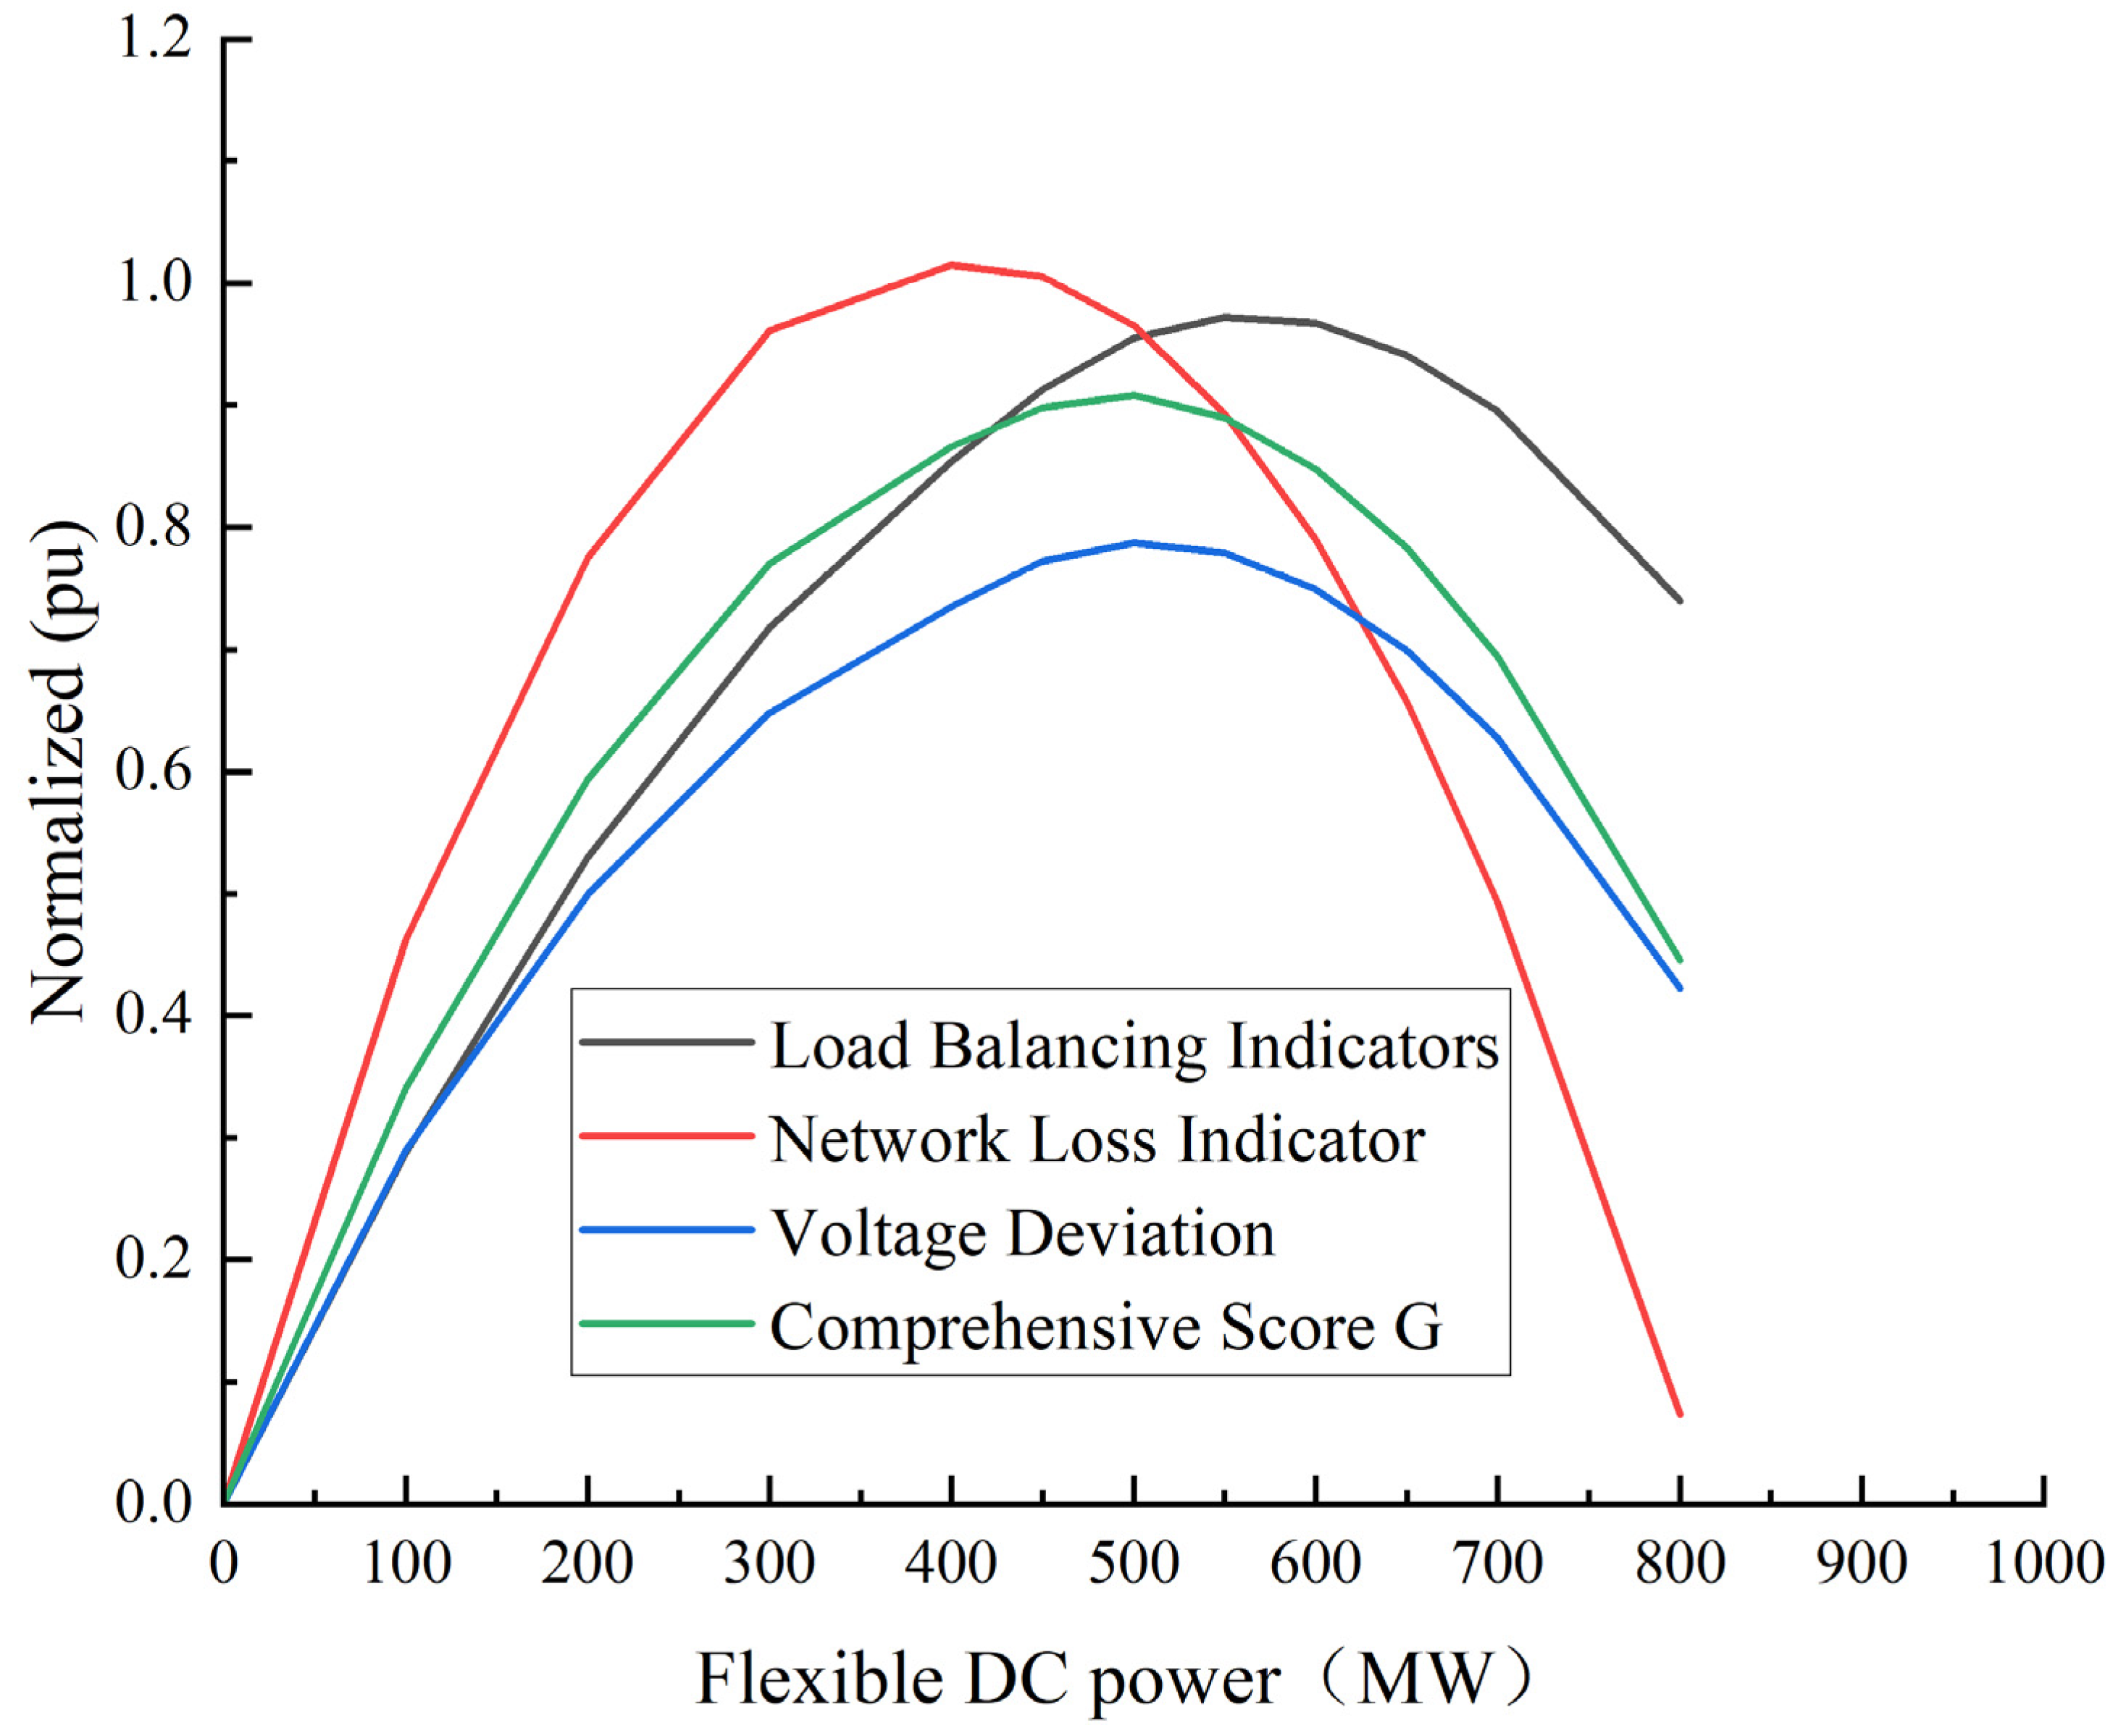
Curve fitting is performed on the calculation results, and the results are shown in Figure 3. With the increase in the flexible DC power, the values of the indicators show the trend of increasing and then decreasing, but the turning point power is different. Among them, the flexible DC power with the smallest network loss ranges from 300 to 600 MW, which reflects the result of the joint effect of the network loss of the sending end and the receiving end zoning.

Figure 3.
Various indexes with flexible DC power change curve.
The method based on information entropy theory is used to calculate the weight coefficient of each index, which can reflect the information size of each index. Among them, the weight of load balancing index is 0.4, and the weights of voltage deviation index and network loss index are both 0.3. When the power of FDC is 520 MW, the comprehensive evaluation index G reaches the maximum value, and at this time, the combined effect of load balancing and network loss is optimal, so the optimal power of FDC is 520 MW.
The current distribution under the flexible DC transmission mode is shown in Figure A2 in Appendix A.
5.2. Interzonal Power Support in Emergencies
As shown in Table 1 below, the maximum supply capacity, actual active output, total load, active standby, and supply margin for zones A, B, and C are shown. It can be seen that zone C is more heavily loaded, while in contrast, the supply margins in zones A and B are more adequate.

Table 1.
Power supply margins for each sub-division.
Based on the hierarchical zonal grid structure, multi-terminal flexible DC can be used to directly connect to each 220 KV zonal grid, and without increasing the short-circuit current level, the flexible power control capability of flexible DC can be utilized to realize economic operation under normal operating conditions and emergency power support under fault conditions. When an N −2 fault occurs at node C3–4 and node C3–3 in zone C, zones A and B can provide emergency support for zone C through flexible DC transmission. According to the optimal power calculation results, the optimal power of the flexible DC is 520 MW, in which the C3–4 node receives 400 MW of power from zones A and B.
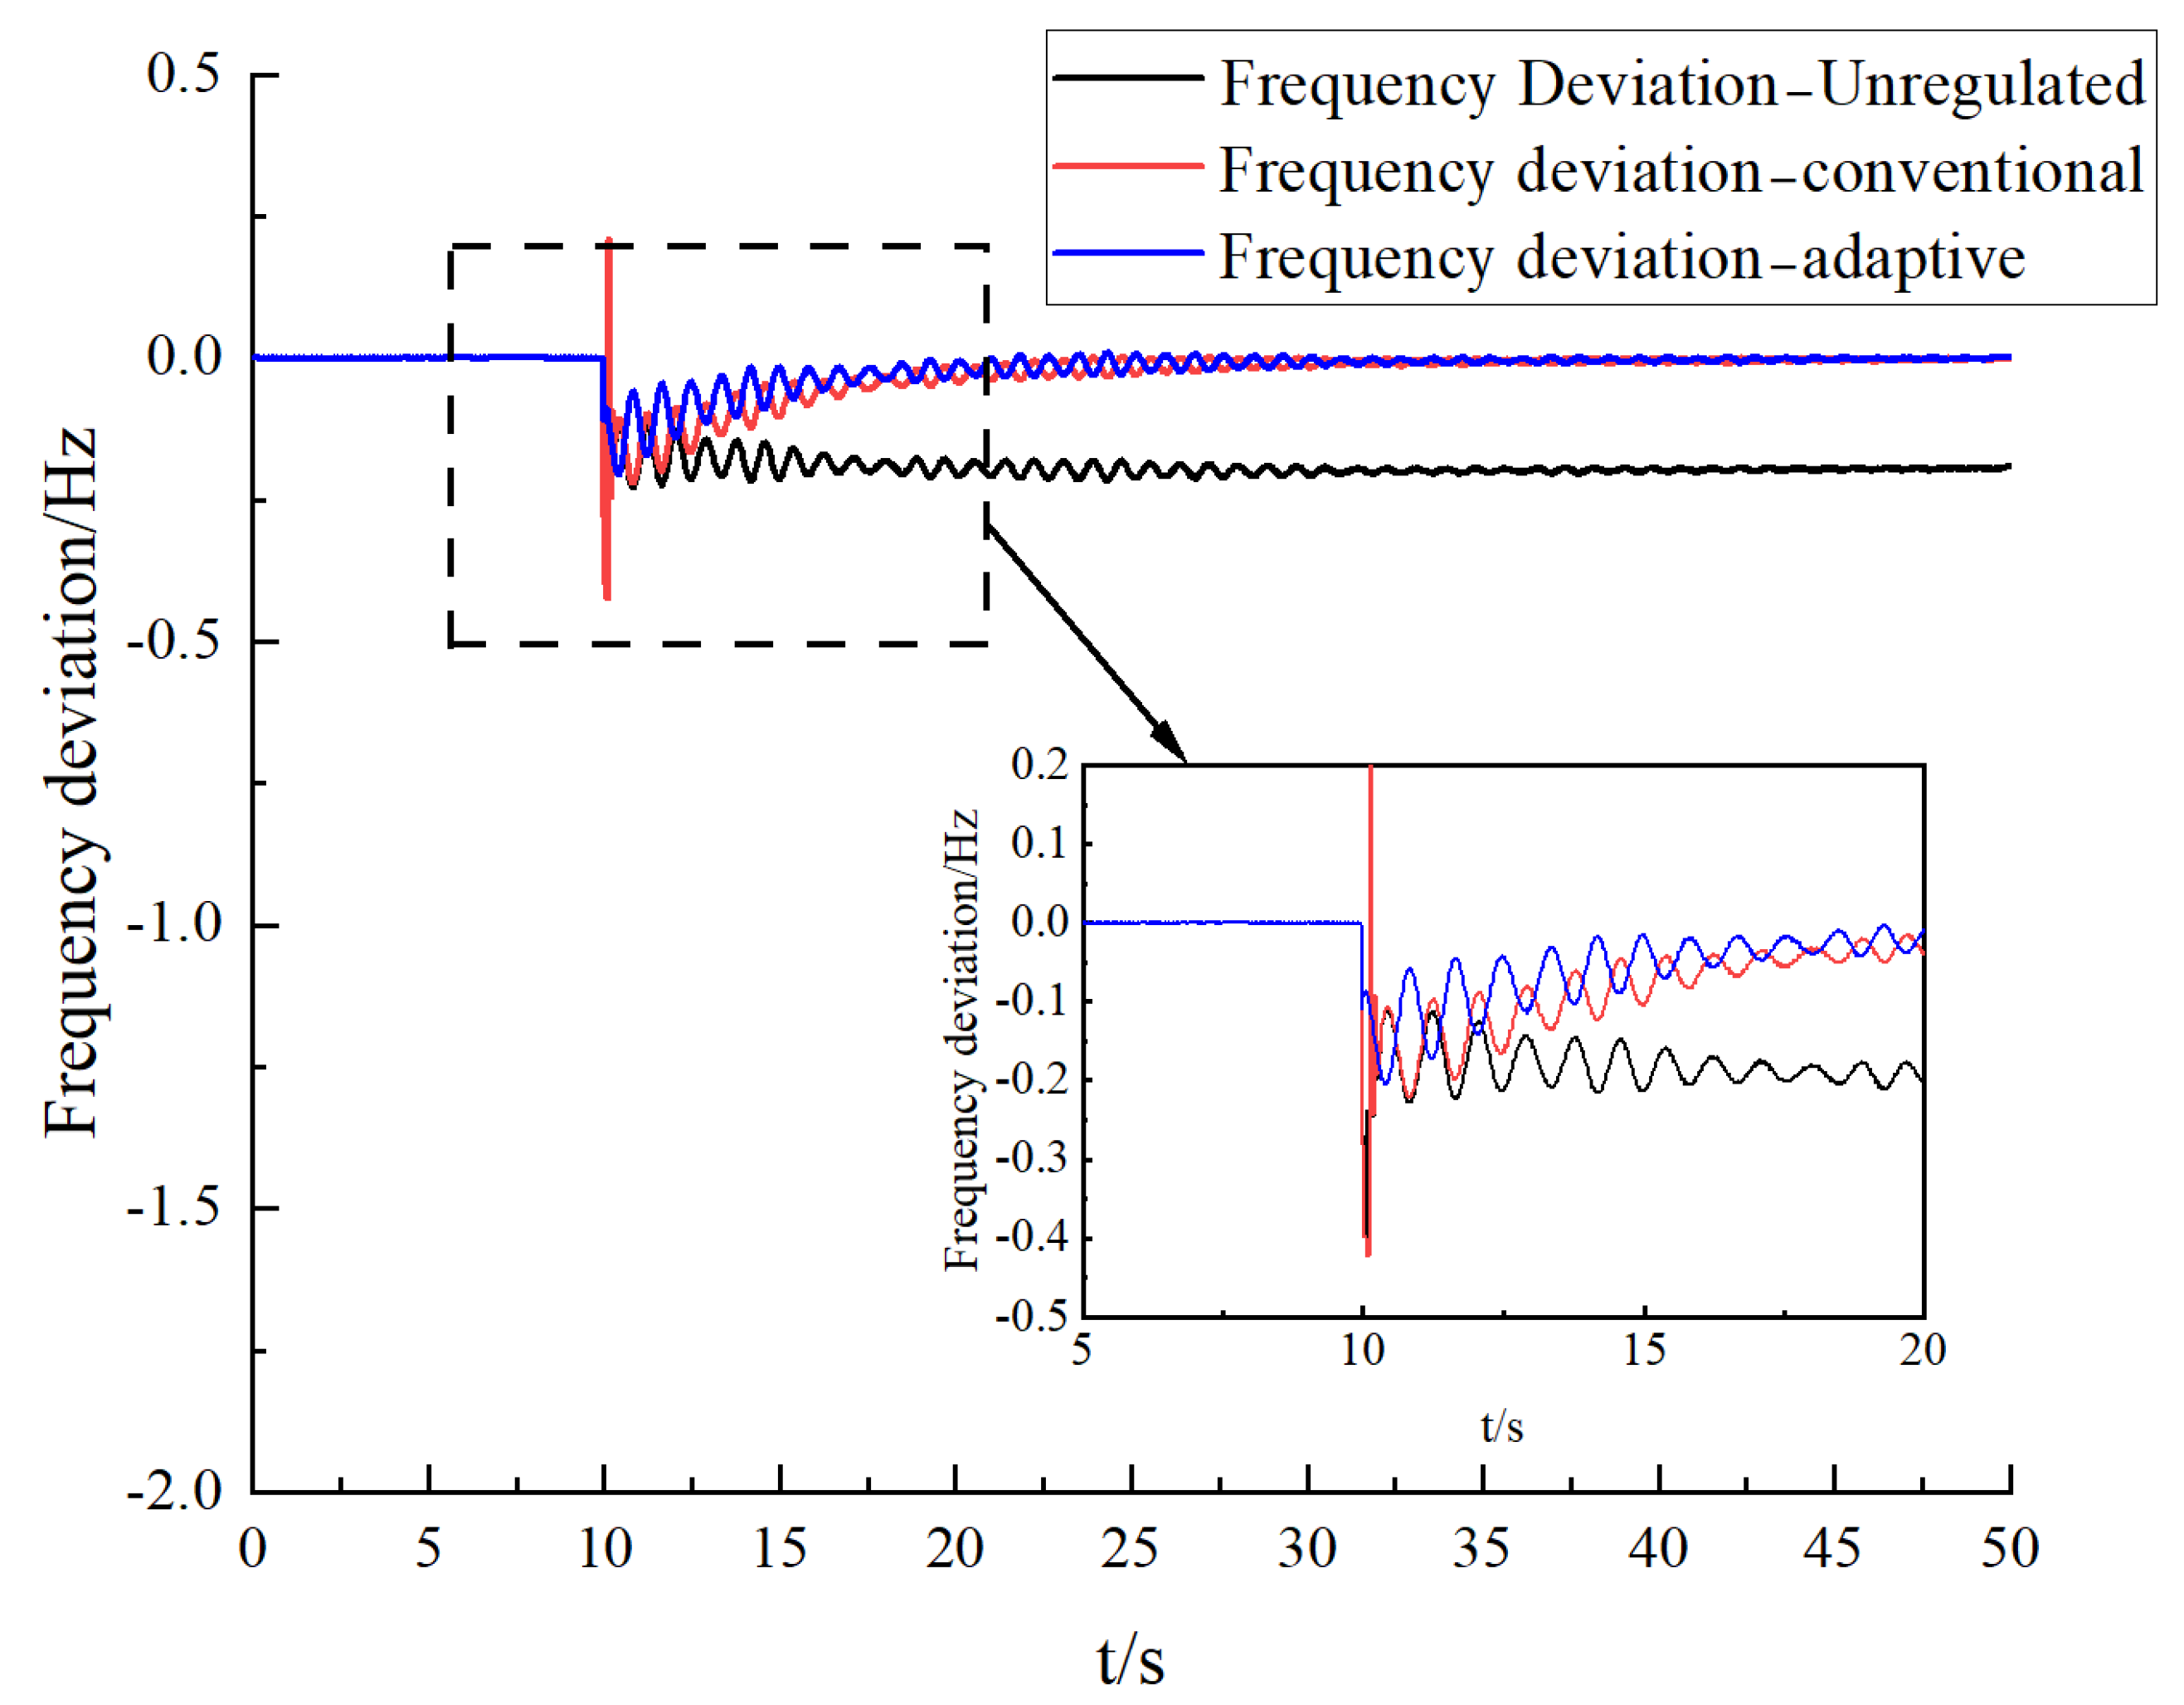
It is assumed that an N −2 short-circuit fault occurs in the line between node C3–3 and node C3–4 during the 500th cycle of the grid’s fundamental frequency, and the circuit breakers on both sides operate in the 5th cycle until the fault is cleared. Before the fault occurred, node C3–3 delivered 79.4 MW of active power to node C3–4 through the double circuit. After the fault occurs, the circuit breaker of the line between node C3–3 and node C3–4 trips, and zones A and B maintain the active power balance at node C3–4 by generating an additional 79.4 MW of power in an emergency. The power fluctuation curve is shown in Figure 4.
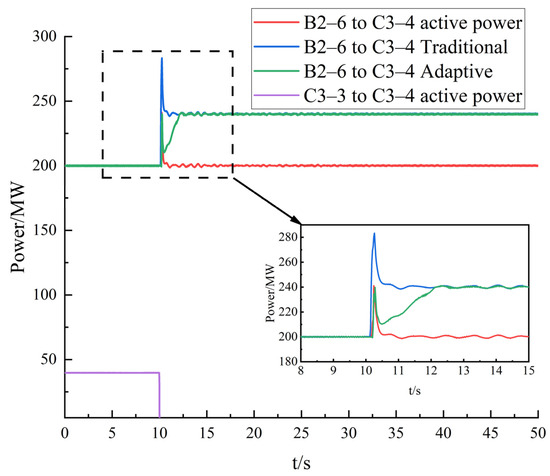
Figure 4.
Power change curve.
As can be seen in Figure 4, at the occurrence of the 500th circumferential fault, the line between node C3–3 and node C3–4 is disconnected, and the active power delivered in the single circuit rapidly decreases from 39.7 MW to 0, and the active power of the two circuits is reduced by a total of 79.4 MW. By urgently regulating the power of the flexible DC transmission, the frequency fluctuation of the C3–4 node can be effectively reduced, and the load shedding is avoided. The frequency deviation of the C3–4 node is shown in Figure 5.
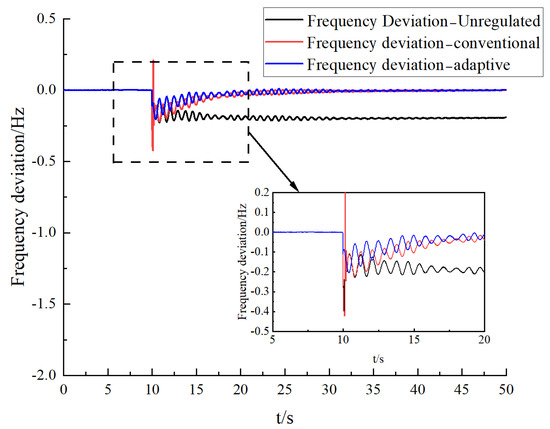
Figure 5.
C3–4 nodal frequency deviation change curve.
Figure 5 shows that without active power regulation, the bus voltage will drop significantly. Compared with the traditional active power regulation strategy, the overshooting amount is larger and the overshooting time is longer in the traditional method, while the adaptive power regulation measures proposed in this paper can effectively improve the overshooting amount and overshooting time.
In the case of constant reactive power, increasing the active power of the flexible DC transmission leads to the node voltage drop, as shown in Figure 6. However, through measures such as increasing reactive power, the balance of bus voltage can be maintained to prevent the voltage from dropping too deeply.
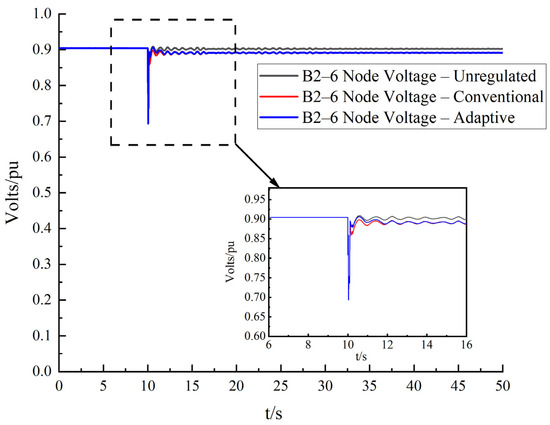
Figure 6.
B2–6 nodal voltage fluctuation curve.
6. Conclusions
In this paper, the optimal control strategy of multi-terminal flexible DC transmission is proposed for the hierarchical zoning structure of the urban power grid, and the economic operation under normal operating conditions and emergency power support under fault conditions are realized without increasing the short-circuit current level. The optimal power of the flexible DC is calculated by the successive approximation method, and it is verified that zones A and B can effectively support zone C under heavy load conditions to ensure the stability of the system.
Simulation results show that the adaptive power regulation strategy proposed in this paper can effectively reduce the system overshooting amount and overshooting time and enhance the emergency response capability of the system when a fault occurs. In addition, the measure of increasing reactive power when increasing active power can effectively maintain the balance of bus voltage and prevent the voltage from dropping too deeply.
In summary, the research results of this paper have important engineering significance and practical value for improving the operational reliability of urban power grids and the application of flexible DC transmission.
Author Contributions
Conceptualization, Z.Z. and D.N.; methodology, Z.Z. and D.N.; software, Z.Z. and Q.D.; validation, Z.Z., Z.L. and X.W.; formal analysis, Z.Z. and D.N.; investigation, Q.D.; resources, Z.L.; data curation, X.W.; writing—original draft preparation, Z.Z. and D.N.; writing—review and editing, Z.Z., D.N., Q.D., Z.L. and X.W.; visualization, Z.L.; supervision, X.W.; project administration, Z.Z. and D.N.; funding acquisition, Z.Z. All authors have read and agreed to the published version of the manuscript.
Funding
This research was funded by Research on large-scale new energy transmission and operation control technology in southern Xinjiang, grant number DQ30DK24000R.
Data Availability Statement
Data is contained within the article.
Acknowledgments
We would like to express our sincere gratitude to all those who provided constructive suggestions on this website and to the experts who participated in the editing and review of this article for their valuable contributions.
Conflicts of Interest
Author Zimin Zhu, Dongliang Nan, Qingxi Duan, Zhen Liu and Xiaofang Wu were employed by the company Electric Power Research Institute of State Grid Xinjiang Electric Power Co., Ltd. The authors declare that the research was conducted in the absence of any commercial or financial relationships that could be construed as a potential conflict of interest.
Appendix A
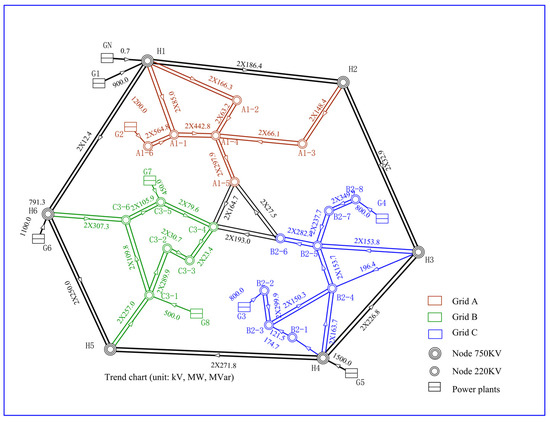
Figure A1.
Exchange of networking trends.
Figure A1.
Exchange of networking trends.
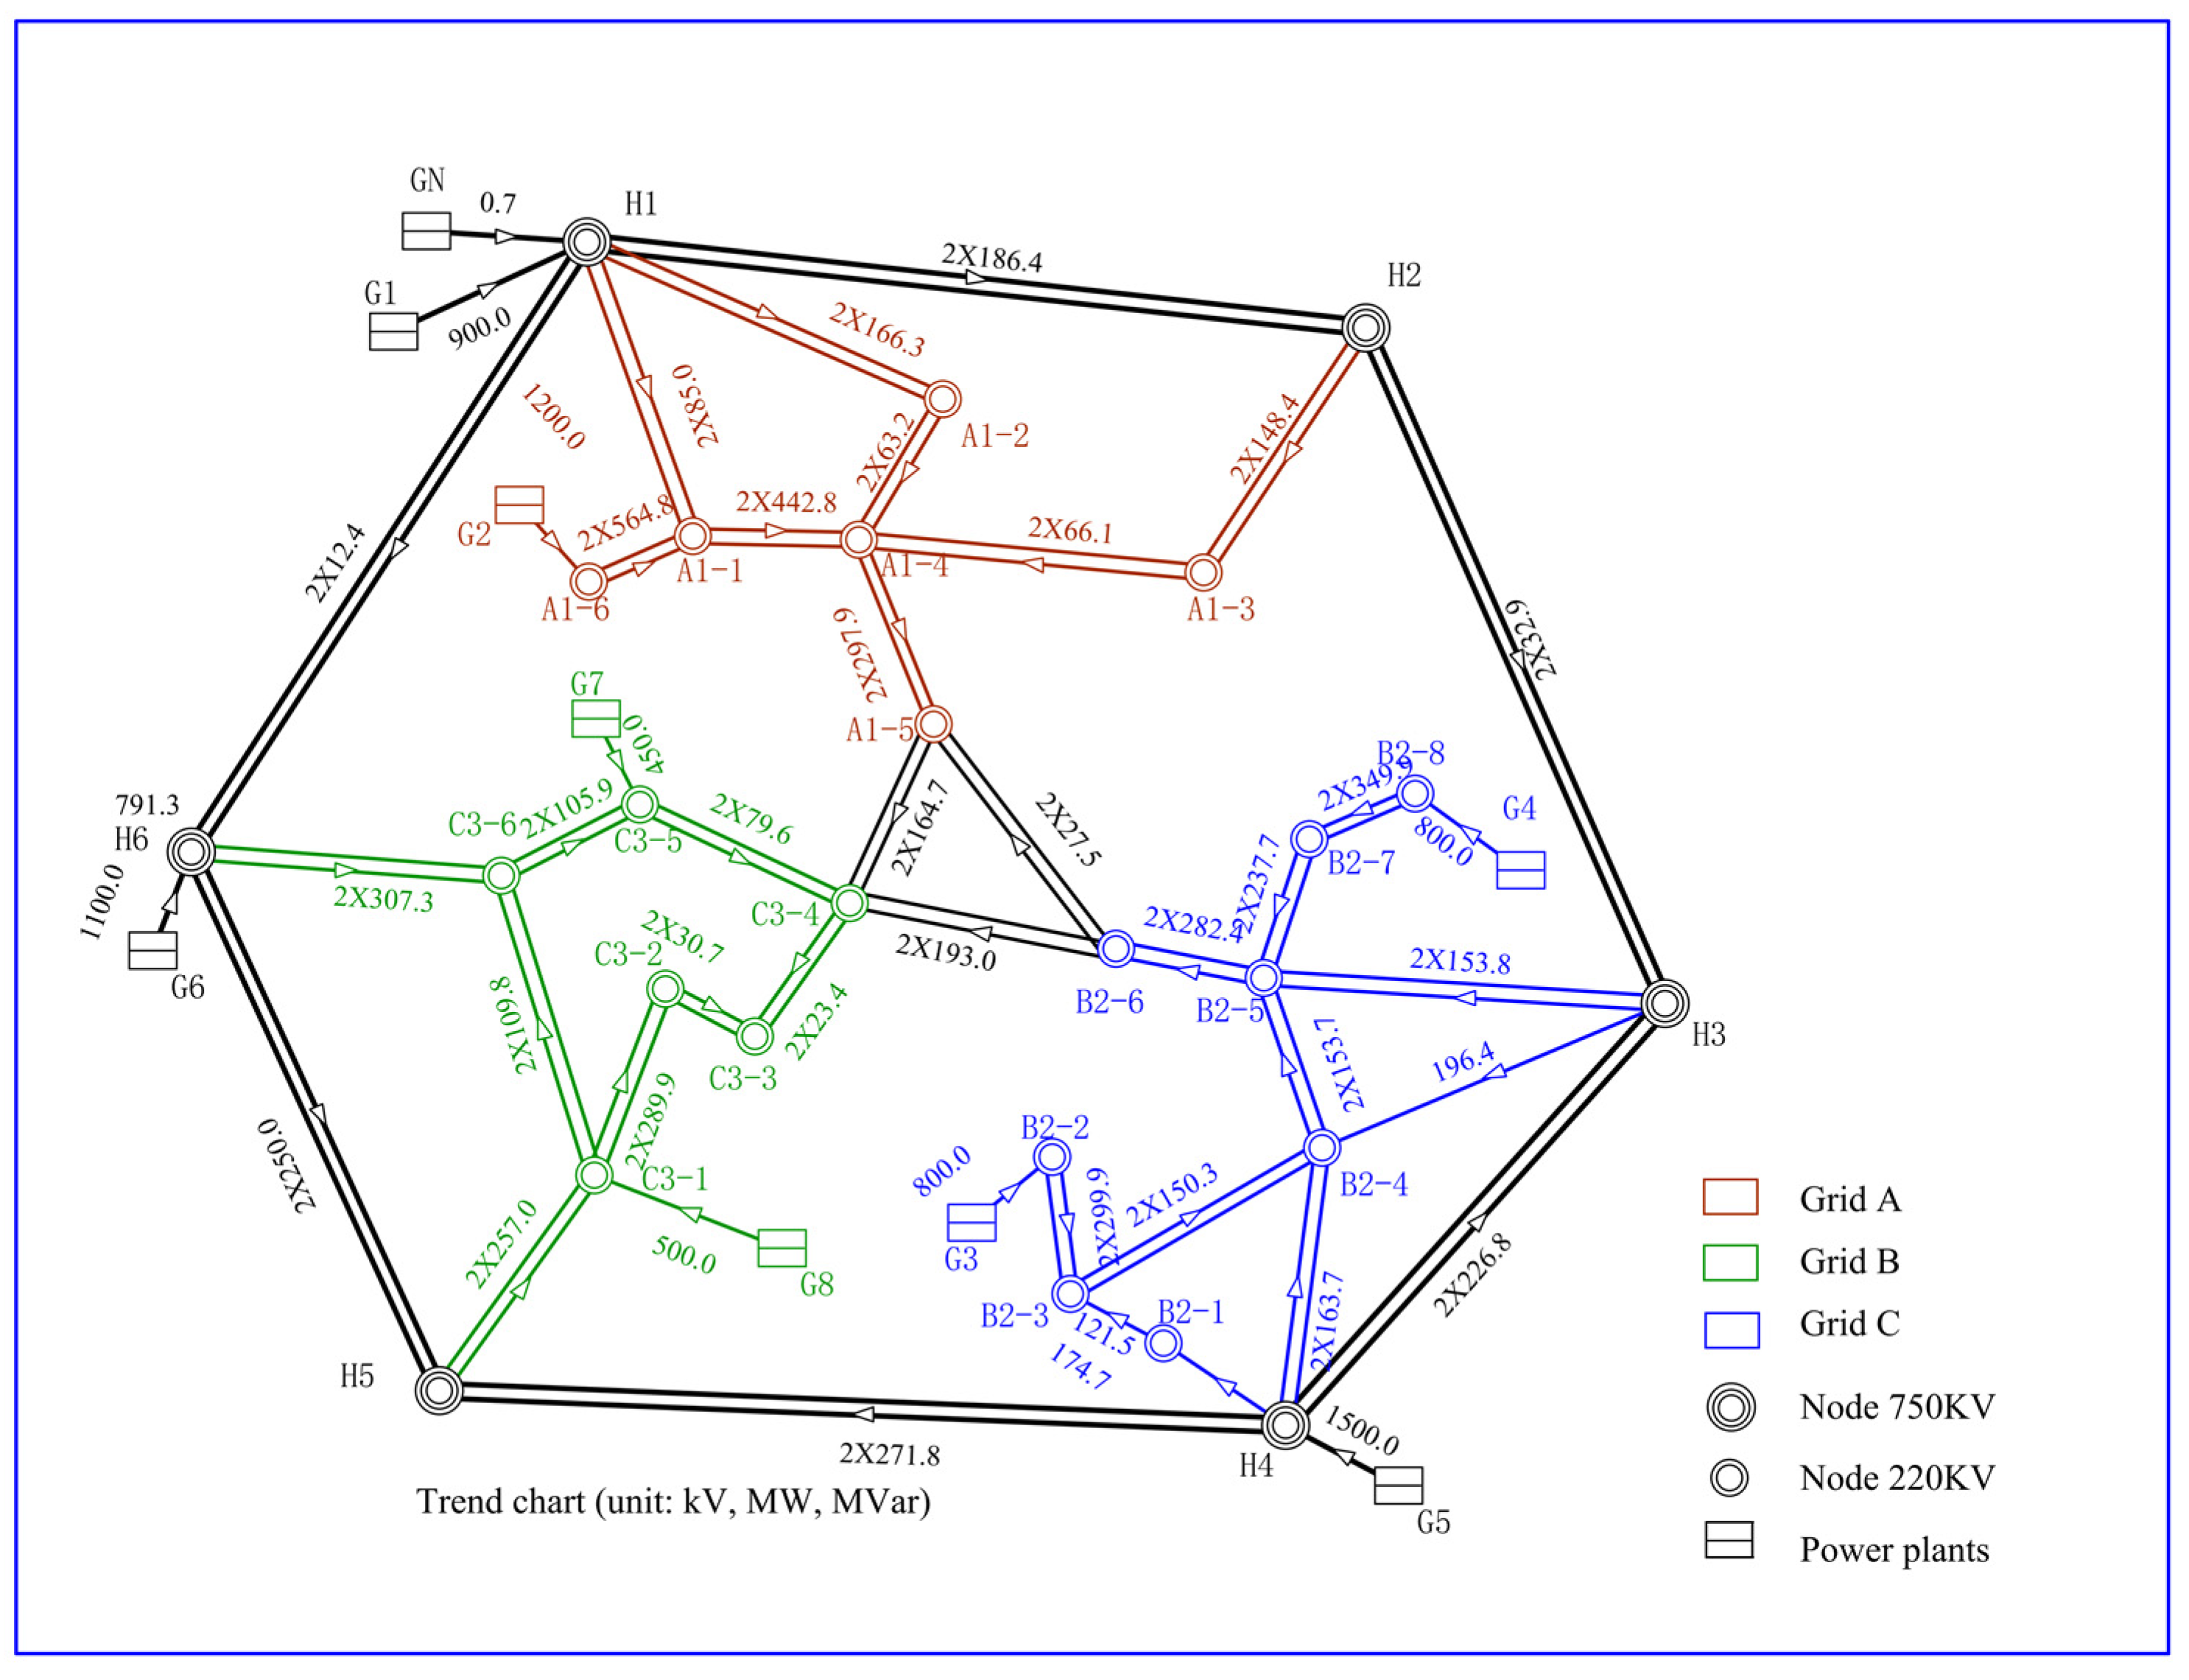
Table A1.
Nodal parameters for regions A, B and C.
Table A1.
Nodal parameters for regions A, B and C.
| Allocated Area | Primary Side | Input Voltage | Secondary Side | Input Voltage | Actual Power | Rated Capacity | Transformer Load Factor |
|---|---|---|---|---|---|---|---|
| A | H1 | 750 | H1–2 | 220 | 355.7 | 500 | 71.14% |
| H1–1 | 220 | H1 | 750 | 176.3 | 500 | 35.26% | |
| GN | 20 | H1 | 750 | 83 | 500 | 16.60% | |
| G2 | 20 | A1–6 | 220 | 1256.6 | 1500 | 83.77% | |
| G1 | 20 | H1 | 750 | 918.1 | 1500 | 61.21% | |
| B | H4–1 | 220 | H4 | 750 | 176 | 500 | 35.20% |
| G3 | 20 | B2–2 | 220 | 804.7 | 1500 | 53.65% | |
| G4 | 20 | B2–8 | 220 | 811.3 | 1500 | 54.09% | |
| G5 | 20 | H4 | 750 | 1528.9 | 1500 | 101.93% | |
| C | H6 | 750 | G6 | 20 | 1122.8 | 1500 | 74.85% |
| H6 | 750 | H6–1 | 220 | 622.5 | 1500 | 41.50% | |
| G7 | 20 | C3–5 | 220 | 514.7 | 1500 | 34.31% | |
| G8 | 20 | C3–1 | 220 | 523.7 | 1500 | 34.91% |
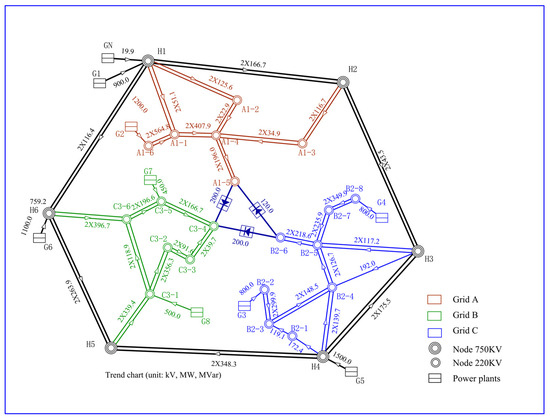
Figure A2.
Flexible networking trend.
Figure A2.
Flexible networking trend.

Table A2.
Evaluation indicators.
Table A2.
Evaluation indicators.
| Flexible DC Power (MW) | Transformer Load Factor Standard Deviation | Total Voltage Deviation | Total Network Loss | Load Balancing Metrics | Network Loss Indicator | Voltage Deviation Indicator | Combined Score G |
|---|---|---|---|---|---|---|---|
| 0 | 0.1325 | 0.0596 | 482.453 | 0 | 0 | 0 | 0 |
| 100 | 0.1203 | 0.0541 | 482.028 | 0.278 | 0.476 | 0.2 | 0.314 |
| 200 | 0.1095 | 0.0493 | 481.736 | 0.522 | 0.802 | 0.22 | 0.515 |
| 300 | 0.1004 | 0.0452 | 481.575 | 0.729 | 0.983 | 0.225 | 0.654 |
| 400 | 0.0934 | 0.042 | 481.565 | 0.888 | 0.993 | 0.25 | 0.728 |
| 450 | 0.093 | 0.0419 | 481.56 | 0.898 | 1 | 0.26 | 0.737 |
| 500 | 0.0923 | 0.0415 | 481.622 | 0.915 | 0.93 | 0.42 | 0.771 |
| 550 | 0.0911 | 0.041 | 481.632 | 0.94 | 0.919 | 0.51 | 0.805 |
| 600 | 0.0894 | 0.0402 | 481.711 | 0.979 | 0.831 | 0.48 | 0.785 |
| 650 | 0.0885 | 0.0398 | 481.891 | 1 | 0.629 | 0.47 | 0.73 |
| 700 | 0.0886 | 0.0399 | 481.973 | 0.998 | 0.537 | 0.36 | 0.668 |
| 800 | 0.0911 | 0.041 | 482.411 | 0.663 | 0.047 | 0.32 | 0.375 |
References
- Yang, N.; Liu, J.H.; Chen, D.J. Research on generation methods of partition scheme of electromagnetic loop network considering regional source-load equilibrium. CSEE 2021, 41, 4462–4479. [Google Scholar]
- Yuan, Z.C.; Guo, P.Q.; Liu, G.W. Review on control and protection for renewable energy integration through VSC-HVDC. High Voltage Eng. 2020, 46, 1460–1475. [Google Scholar]
- Xu, L.D.; Guo, J.C.; Guo, T. Research on flexible interconnection of urban power grid. Southern Energy Constr. 2023, 46, 1473–1488. [Google Scholar]
- Ma, R.; Sun, H.; Qin, L. An emergency coordinated control strategy to improve the transient stability of a single-ended distribution network with flexible interconnection channel blocking. Sensors 2023, 23, 8467. [Google Scholar] [CrossRef] [PubMed]
- Yang, R.F.; Yu, Y.N.; Wang, G.L. Series-Connected DC voltage harmonics compensation circuit and application in multi-terminal DC. Trans. China Electrotech. Soc. 2021, 36, 554–562. [Google Scholar]
- Wu, M.Z.; Chen, W.H. Overview of research on stability and control of VSC-HVDC. Power Gener. Technol. 2019, 40, 28–39. [Google Scholar]
- IEEE C37.118-2005; IEEE Standard for Synchrophasors for Power Systems. The Institute of Electrical and Electronics Engineers: New York, NY, USA, 2006.
- Wang, Z.; Wu, J.L.; Liu, R.X. A P-Q Coordination Control Strategy of VSC-HVDC and BESS for LVRT Recovery Performance Enhancement. Electronics 2024, 13, 741. [Google Scholar] [CrossRef]
- Chao, W.J.; Deng, C.P. High-Frequency Oscillation Suppression Strategy for Flexible DC Transmission Systems Based on Additional Joint Damping. Electronics 2023, 12, 2825. [Google Scholar] [CrossRef]
- Su, H.C.; Shao, Z.X. Research on emergency power control of AC-DC hybrid power system with Flexible DC. Transactions of China Electrotech. Soc. 2023, 38, 5590–5604. [Google Scholar]
- Luo, L.; Wang, Y.H.; Chen, S.Y. Adaptive droop control of multi-terminal direct current based on virtual synchronous generator control strategy. Sci. Technol. Eng. 2021, 21, 7116–7121. [Google Scholar]
- Bai, G.Y.; Li, C.B.; Meng, F.C. Research on an adaptive droop control strategy applied in voltage source converter based multi-terminal high voltage direct current transmission system. Electr. Eng. 2022, 23, 1–8. [Google Scholar]
- Zhao, L.X.; Wang, X.G. Power coordinated control strategy of concentrating solar power with thermal storage and new energy stations integrated by three-terminal VSC-HVDC. Electr. Mach. Control 2024, 28, 131–142. [Google Scholar]
- Liu, K.Q. Research on Coordinated Control Strategy of MTDC System with Renewable Energy Integration. Master’s Thesis, Lanzhou Jiaotong University, Lanzhou, China, 2020. [Google Scholar]
- Cao, M.J.; Hu, Z.C. Day-ahead Optimal Dispatch Method for Flexible DC System with Pumped Storage Hydropower Plant and New Energy Power Generation. Autom. Electr. 2021, 45, 36–44. [Google Scholar]
- Chen, L.; Zhuang, L.; Wang, Z.Y. Auxiliary control strategy of DC voltage for variable speed pumped storage units in an HVDC transmission system. Power Syst. Prot. Control 2022, 50, 154–162. [Google Scholar]
- Li, B.; He, J.; Li, Y. The improved topology and control strategy for the HCLC in the Multiterminal Flexible DC grid. IEEE J. Emerg. Sel. Top. Power Electron. 2020, 9, 1795–1807. [Google Scholar] [CrossRef]
- Zaheb, H.; Ahmadi, M.; Rahmany, N.A.; Danish, M.S.S.; Fedayi, H.; Yona, A. Optimal Grid Flexibility Assessment for Integration of Variable Renewable-Based Electricity Generation. Sustainability 2023, 15, 15032. [Google Scholar] [CrossRef]
- Xiao, J.; Li, S.C.; Huang, R.L. Siting method and demonstration application of flexible interconnection in urban power grid partition. Electr. Power Constr. 2016, 37, 10–20. [Google Scholar]
- Xu, Y.T.; Feng, Q.H.; Tan, Z.K. Optimal power restoration strategy for multi-terminal flexible interconnected distribution networks based on flexible interconnection device and network reconfiguration. Trans. China Electrotech. Soc. 2024, 39, 2696–2709. [Google Scholar]
- Jiang, X. Locating and Sizing of Partition Flexible Interconnection Device in Urban Power Grids. Master’s Thesis, Tianjin University, Tianjin, China, 2018. [Google Scholar]
- Zhang, Z.W. Planning and Control Technology of VSC-HVDC Applied to 220KV Zonal Interconnection of Urban Power Grids. Master’s Thesis, North China Electric Power University, Beijing, China, 2019. [Google Scholar]
- Li, B.; Chen, M.Y.; Zhong, H.W. A review of long-term planning of new power systems with large share of renewable energy. Proc. CSEE 2023, 43, 555–581. [Google Scholar]
- Dong, X.H.; Hua, Z.H.; Shang, L. Morphological characteristics and technology prospect of new distribution system. High Voltage Eng. 2021, 47, 3021–3035. [Google Scholar]


Disclaimer/Publisher’s Note: The statements, opinions and data contained in all publications are solely those of the individual author(s) and contributor(s) and not of MDPI and/or the editor(s). MDPI and/or the editor(s) disclaim responsibility for any injury to people or property resulting from any ideas, methods, instructions or products referred to in the content. |
© 2024 by the authors. Licensee MDPI, Basel, Switzerland. This article is an open access article distributed under the terms and conditions of the Creative Commons Attribution (CC BY) license (https://creativecommons.org/licenses/by/4.0/).