Article

Optimization Strategy for Integrated Energy Microgrids Based on Shared Energy Storage and Stackelberg Game Theory

1
Xi’an Dynamic Inspection and Testing Co., Ltd., Xi’an 710061, China
2
School of Electrical Engineering and Automation, Nantong University, Nantong 226019, China
3
China National Testing Holding Group Co., Ltd., Beijing 100000, China
*
Authors to whom correspondence should be addressed.
Electronics 2024, 13(22), 4506; https://doi.org/10.3390/electronics13224506
Submission received: 21 October 2024 / Revised: 11 November 2024 / Accepted: 15 November 2024 / Published: 16 November 2024

Abstract

:
The implementation of community power generation technology not only increases the flexibility of electricity use but also improves the power system’s load distribution, increases the overall system efficiency, and optimizes energy allocation. This article first outlines the operational context of the system and analyzes the roles and missions of the various participants. Subsequently, optimization models are developed for microgrid operators, community power storage facility service providers and load aggregators. Next, the paper explores the game relationship between microgrid operators and load aggregators, proposing a model based on the Stackelberg game theory and proving the presence and singularity of the Stackelberg equilibrium solution. Finally, simulations are conducted using Yalmip tools and the CPLEX solution on the MATLAB R2023a software platform. A combination of heuristic algorithms and solver methods is employed to optimize the strategies of microgrid operators and load aggregators. The research findings show that the proposed framework is not only able to achieve an effective balance of interests between microgrid operators and load aggregators but also creates a win–win situation between load aggregators and shared energy storage operators. Additionally, the solution algorithms used ensure the protection of data privacy.

1. Introduction

As global environmental concerns grow, we are facing an urgent need to accelerate the transition to renewable energy. Renewable energy includes both traditional and modern sources, with traditional energy sources potentially posing environmental and health challenges, while modern energy sources play a key role in addressing these issues [1]. Shared energy storage services are particularly important in the emerging economic model, as they help overcome many of the problems faced by the traditional model [2]. Such services not only significantly improve energy efficiency but also play a crucial role in facilitating renewable energy integration, optimizing grid operations and reducing energy costs. Supported by internet technologies, cloud storage provides the technological basis for energy sharing [3] and economic efficiency and also plays a key role in stabilizing the generation of renewable energy sources such as solar and wind [4,5].
In traditional energy storage frameworks, each user independently owns and operates their own storage facilities within a single distributed framework, but this approach has significant limitations. Firstly, the investment required for individually building and maintaining storage facilities is substantial and often fails to deliver the expected benefits. Additionally, some grid-designed storage systems require large installation spaces [6]. The sharing economy has extended into various fields, with the sustainability of shared economy models drawing significant attention. Cooperation between the various stakeholders is one of the possible methods for encouraging the further growth of the sharing economy in a sustainable way [7]. Users no longer need to invest individually in expensive storage equipment; instead, they can benefit from storage technology through shared models, addressing the cost inefficiency of individual frameworks. This model distributes the cost of storage systems among multiple users, reducing the investment risk for individual users and enhancing the overall flexibility and stability of the energy system.
From a game theory perspective, the introduction of a shared electricity storage mechanism at the domestic customer level will allow users to buy and store electricity during times of low prices and to discharge it at times of peak prices [8], which can effectively reduce storage costs while increasing the benefits of storage devices. Considering the issue of redundant shared storage capacity among users, reference [9] introduces a degradation ratio for the adjustment of the distribution outcome of the shared memory, further reducing the scale of storage configuration and lowering configuration costs. Reference [10] proposes an energy allocation scheme for shared storage based on the Stackelberg game theory, where the shared storage system operates in coordination with the distribution network and microgrid. The storage provider plans the shared storage capacity, and the distribution network and microgrid determine the rental capacity based on pricing, with shared storage adjusting rental prices, accordingly, creating a leader–follower game relationship. This approach can improve energy utilization efficiency while increasing the economic benefits for all parties involved. Reference [11] adds a photovoltaic (PV) electricity production system on the consumer side, which allows the power produced from the PV system to either be consumed immediately or stored via the shared storage system [12]. The study found that the peak storage performance of the shared storage system and a single PV generation system can minimize total energy costs.
In practice, the scheduling of electricity and heat is often closely connected. With electric heaters, operators can also obtain a flexible transformation from electrical energy to heat energy, thus maximizing the return on investment. Many integrated energy systems only meet the electrical load response needs and fail to address both electrical and thermal load responses simultaneously. References [13,14] propose a multi-microgrid hybrid energy-sharing framework for a cogeneration and demand response in integrated thermal and electrical energy systems, considering both power and heat production while integrating with photovoltaic equipment. This model allows for the sharing of both thermal and electrical energy among different parties, making it more complex and comprehensive and better suited for real-life applications. Unlike most analyses that focus on electricity price changes, the study in reference [15] emphasizes the analysis of heat price fluctuations, exploring the game between operators and users within an integrated electricity–heat energy model. Reference [16] investigates the interplay of providers of shared electricity storage and various consumers and proposes a mechanism for a shared electricity storage service for prosumers of multiple photovoltaic systems in the framework of a community energy internet. The study establishes a so-called win–win model for the providers of shared electricity storage systems and the consumers. Reference [17] considers the role of wind energy and proposes a wind power–renewable energy-based heating combined system to increase the effectiveness of energy use and to decrease the energy demand of electricity and heating systems. Reference [18] adds solar power generation on the user side and establishes a model combining solar energy with shared storage, using shared distributed generation to reduce overall energy losses and increase revenues for all parties involved. Reference [19] explores the energy interaction mechanism between a distributed shared storage system and multiple industrial users in an industrial park context, finding that the distributed shared-storage configuration method shows significant advantages in reducing initial investments and electricity costs for industrial users, which is important for promoting diversified development of user-side storage.
This paper comprehensively considers the relationships between the microgrid operator, the consumer side and the provider of the shared energy storage system. It establishes a comprehensive energy microgrid model based on a hierarchical game theory framework, with the microgrid operator as the upper-level policymakers and consumers as the lower-level followers. The microgrid operator sets the electricity and heat prices, while the user side responds to these prices by reasonably planning their electricity and heat purchases for the day. To validate the feasibility of the framework created in this work, the optimization outcomes under different scenarios are compared to draw final conclusions.
In the next section, this paper will detail the modeling process of an integrated energy microgrid system, including the interaction model of electrical and thermal energy, constraints and system revenue calculations to ensure the sustainability and economy of the system in operation. Subsequently, this paper will explore the solutions based on the master–slave game theory to analyze the interaction between the microgrid operator and the user side and verify the validity and feasibility of the proposed model through a case study to demonstrate its potential and advantages in practical applications. Finally, this paper will summarize the research results and propose directions for future research.

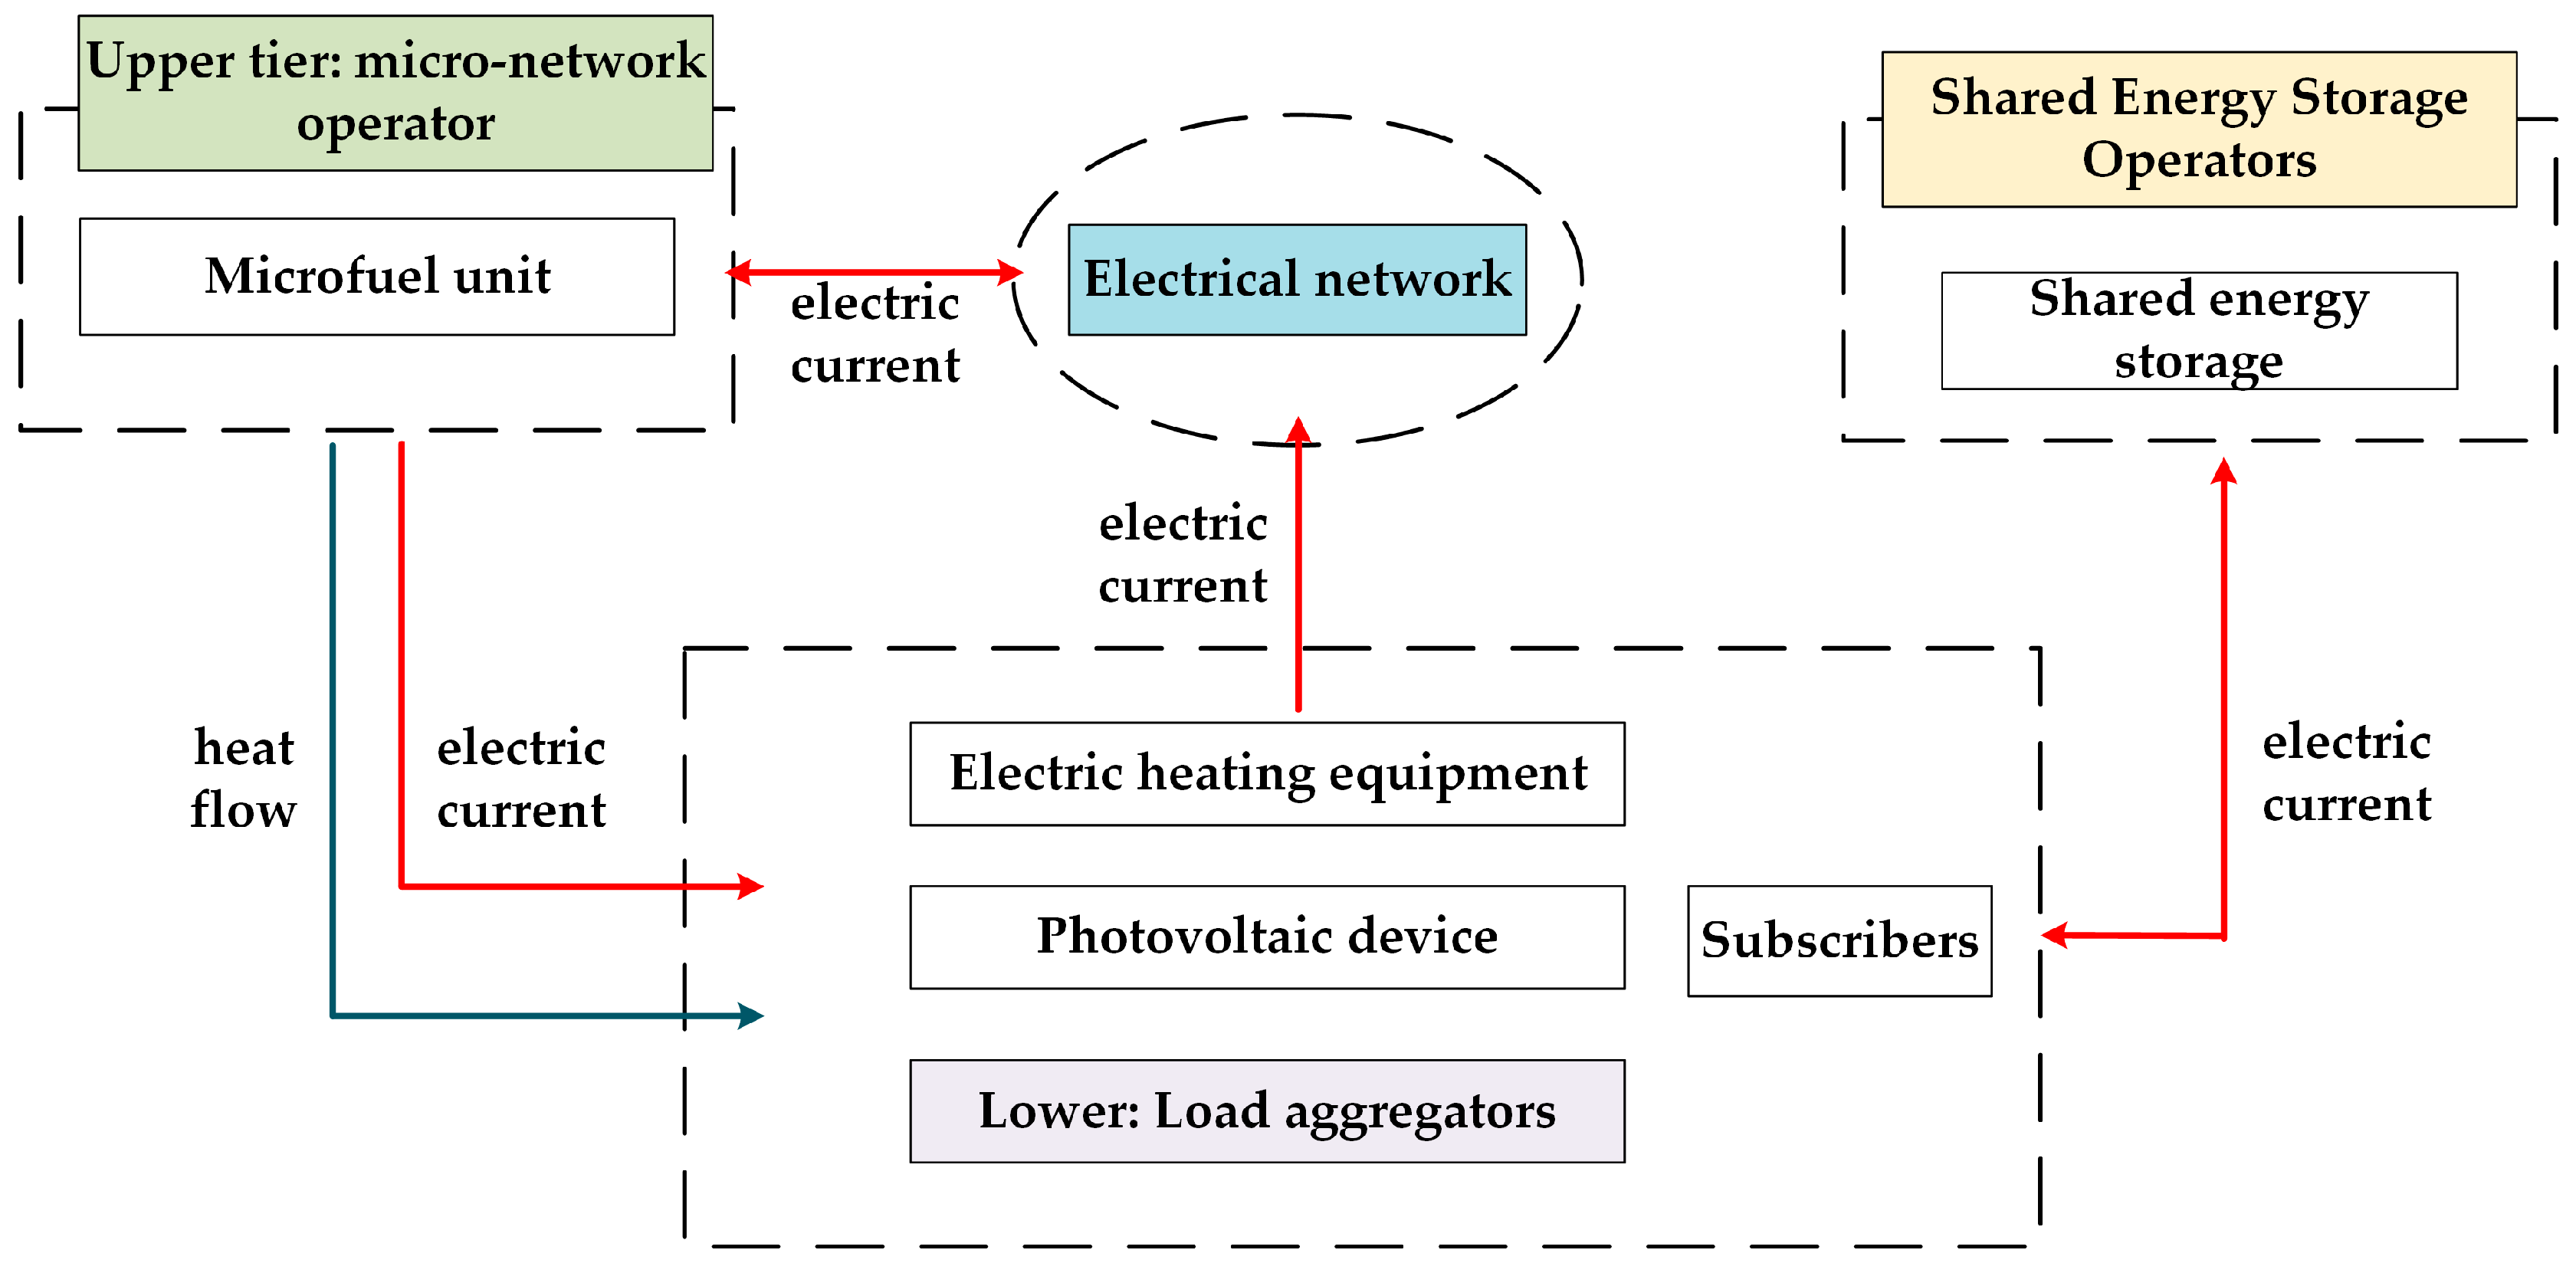
2. Modeling of Integrated Energy Microgrid Systems

Figure 1 illustrates the electrical and thermal interaction relationships between the microgrid operator, shared energy storage provider, user side and the main grid. The microgrid operator primarily engages in energy trading, providing electricity and thermal services to users. The shared electricity storage provider primarily offers storage capacity on the user side, charging service fees based on the storage or retrieval capacity utilized by the user. The user side can purchase electricity from the microgrid operator or sell electricity to the main grid, while the current exchange with the shared energy storage provider is bidirectional.

2.1. Electric Energy Interaction Model

2.1.1. Upper-Level Model

The microgrid operator, acting as the upper-level decision-maker, sets the electricity and heat prices for the day. The operator can engage in bidirectional electric energy interactions with the main grid, functioning as an intermediary between the users and the grid. Additionally, any surplus electricity can be sold back to the network. The microgrid operator is also equipped with a gas turbine, which supplies both electrical power and thermal energy to the consumer side. The relationship between the electric output of the gas turbine and the natural gas consumption is as follows:
P h M T , e = η e M T F h M T
where P h M T , e is the electrical energy produced by the gas turbine during the period h; η e M T is the energy production ratio of the microturbine plant; F h M T represents the natural gas consumption of the gas turbine during time period h.
The relationship between the fuel cost and the electrical power output of the unit over the h-th interval during a day may be represented as:
E h M T = F n g Q L H V η e M T P h M T , e
where F n g represents the average natural gas price per cubic meter; Q L H V represents the lower heating value of natural gas.

2.1.2. Lower-Level Model

On the customer site, which operates as a follower at a lower level, users respond to the pricing strategy of the microgrid operator. The user side is equipped with electric heating devices and photovoltaic systems. The user’s electrical load is classified into a moveable load and a fixed load. The flexible load can be flexibly scheduled and shifted across different time periods in response to changes in electricity prices and user demand. Further subdivision of the flexible load includes time-shiftable loads and interruptible loads. The electric heating devices also contribute to some level of electrical consumption. The electricity load of the user aggregator over the h-th time interval within a day may be described as:
L h l , e = L h l , f + L h l , s + Δ L h l , e
where L h l , e is the total electrical load of the user aggregator over the course of a day, L h l , f is the rigid electrical load, L h l , s is the flexible electrical load, and Δ L h l , e is the additional electrical load due to electric heating.
The flexible electrical load can be further expressed as:
L h l , s = P s e l + P z e l
where P s e l represents the time-varying power of the electrical consumer; P z e l represents the intermittent nature of the power load.
The time-shiftable electrical load typically aims to optimize system operation by shifting the electrical load from one time interval to another in response to system incentives. During a scheduling cycle, the total amount of load shifted out of one interval is equal to the amount shifted into another, which can be expressed as:
t = 1 T P s e l ( t ) = 0
Considering that users will be able to save or retrieve a specified quantity of electrical energy in any given period of time over the course of the day, and taking into account the demand response of the consumer’s power load, the net power load of the consumer’s aggregator for the h-th time period inside a day may be represented as:
L h l , c = L h l , f + L h l , s ¯ + Δ L h l , e + L h l , E S S L h l , g
where L h l , g represents the predicted output of the PV installation by the user aggregator during the h-th time period within a day; L h l , E S S represents the quantity of electricity that is stored in the shared energy storage system or that is withdrawn from it by the user aggregator during the h-th time period within a day, with a positive value for storage and a negative value for retrieval; L h l , c is positive/negative, indicating that the user aggregator is purchasing/selling electricity from/to the microgrid operator during that time period.
The PV generation system converts solar energy into electrical energy through PV panels. The output capacity is primarily influenced by a number of variables, such as the amount of solar radiation, environmental conditions, temperature and other physical factors. Its mathematical model can be expressed as:
P t P V = P S T C G I N G G S T C 1 + k T C T r
T C = T A + G N G G × T r 20 0.8
where P t P V represents the initial output capacity of the PV power generation plant, G I N G represents the solar irradiance intensity during time period h; G S T C represents the rated value of solar irradiance intensity, and P S T C is the maximum amount of power that can be output by the photovoltaic system; T r is the reference value of the temperature of the photovoltaic module, and k represents the power temperature coefficient; T C represents the actual measured surface temperature of the photovoltaic panel, and T A represents the ambient temperature.

2.1.3. Shared Energy Storage Model

Electric energy storage is a crucial power supply component in integrated energy systems. The operator of the shared energy storage device will primarily supply energy services on the consumer site. Unlike traditional models, where each user individually charges or discharges their own storage, this model considers the community framework as a whole. Users charge and discharge energy with the shared storage provider, who charges service fees based on the storage or retrieval capacity used by the users. The rental fee per unit of capacity set by the operator influences users’ enthusiasm for utilizing the service.
The energy storage device operates in two modes: charging and discharging. The mathematical model representing the charging and discharging processes can be expressed as:
E h E S S = E h 1 E S S 1 ψ E E S + ( η c E S S P h l , c P h l , d / η d   E S S ) Δ t
where P h l , c is the amount of charging power provided by the consumer aggregator within the community during the h-th time period, and P h l , d is the discharging power of the consumer aggregator within the community during the h-th time period; η c E S S represents the transmission efficiency during the charging process, and η d   E S S represents the transmission efficiency during the discharging process; and ψ E E S is the self-loss rate of the electric energy storage system. For the joint energy storing system to maintain its performance, it is assumed that the net charging and discharging power should sum to zero over a full cycle.

2.2. Electric Energy Constraints

Microgrid Operator: the corresponding constraints on the electricity selling price set by the microgrid operator can be expressed as:
λ h E G , b < λ h M G O , s < λ h E G , s
where λ h E G , b represents the electricity purchase price from the grid during the h-th time period within a day, λ h E G , s represents the selling price of electricity during the h-th time period, and λ h M G O , s represents the electricity selling price set by the microgrid operator during the h-th time period.
The constraint for the time-shiftable electrical load can be expressed as:
P s e l min P s e l ( t ) P s e l max
where P s e l min represents the minimum value of the time-shiftable electrical load, and P s e l max represents the maximum value of the time-shiftable electrical load.
Interruptible electrical load refers to the load that users can reduce or stop in response to system incentives based on the importance level of their electricity needs. This helps alleviate the system’s power supply pressure. The constraint can be expressed as:
P z e l max P z e l ( t ) 0
where P z e l max represents the maximum value of the interruptible electrical load.
The overall flexible electrical load adjustment is subject to the following constraint:
L h l , s ¯ L h l , s L h l , f + L h l , s ε
where E represents the maximum allowable proportion of the load adjustment in the h-th time period within a day; L h l , s ¯ L h l , s represents the amount of electric load adjustment by the user aggregator during the h-th time period within a day, without considering Δ L h l , e ; L h l , s ¯ represents the adjusted flexible electrical load of the user aggregator during the h-th time period within a day.
h = 1 H L h l , s ¯ L h l , s = k h = 1 H L h l , f + L h l , s
where k represents the proportion of the total load adjustment by the user aggregator within a day. The larger E and k are, the more flexible the user aggregator’s load adjustment is in each time period, and the greater the demand response capability on the user side. The adjusted flexible electrical load over the course of a day is equal to the flexible electrical load before adjustment.
The combined charge or discharge power of all consumers at any moment within a cycle T must not be greater than the maximum limit of the capacity of the shared energy management system. Therefore, the capacitance of the system at every point in time has to meet the following condition:
E m i n E S S E h E S S E m a x E S S
where E m i n E S S represents the minimal allowable storage capacitance of the shared energy storage system, and E m a x E S S is the maximal allowable storage capacitance.
The charge and discharge energy of all consumers in every time interval is subject to the permissible power limits of the shared energy storage system. At each time interval h, the following constraint is given:
E h + 1 E S S E h E S S Δ t P m a x E S S , c P h l , c P h l , d E h + 1 E S S E h E S S Δ t P m a x E S S , d P h l , c P h l , d
where P m a x E S S , c is the allowable charge capacity of the shared energy storage system, and P m a x E S S , d is the allowable discharge capacity.

2.3. Thermal Energy Response Model

Microgrid Operator: The heat output of the microwave gas engine is equal to the thermal power purchased by the user aggregator from the microgrid operator during the h-th time period within a day. The heat output of the microwave gas engine during the h-th time period can be expressed as:
P h M T , h = η h F h M T
η h = 1 η e M T η l o s s M T
where P h M T , h is the thermal power output of the gas turbine during the h-th time period, and η l o s s M T represents the heat loss rate; η h represents the thermal efficiency of the gas turbine unit.
User Side: The source of the user’s thermal load is not limited to the microgrid operator; users can also convert electricity to heat using their own electric heating devices. If the power cost from the network is low, users can utilize electric heating devices to generate heat, thereby meeting their thermal demands while optimizing their own benefits.
L h u , h = η u Δ L h l , e
where η u represents the conversion efficiency of the electric heating device.
If the microgrid operator’s thermal sales tariff is greater than the cost of electric heating, users choose to generate heat using electric heating devices. The corresponding thermal load can be expressed as:
L h l , h = L h u , h Δ L h l , h
where Δ L h l , h represents the actual thermal load reduced by the user aggregator during the h-th time period within a day.
When the heat selling price from the microgrid operator is lower than the cost of electric heating, users choose to purchase heat from the operator. The corresponding thermal load can be expressed as:
L h l , h = L h M G O , h Δ L h l , h
where L h M G O , h represents the thermal power provided by the microgrid operator during the h-th time period within a day.

2.4. Thermal Energy Constraints

γ h M G O , min < γ h M G O , s < γ h M G O , max
where γ h M G O , s represents the heat selling cost of the microgrid operator at the h-th time interval within a day, γ h M G O , min represents the minimum heat price, and γ h M G O , max represents the maximum heat price.
0 Δ L h l , h Δ L max l , h
where Δ L max l , h represents the maximum allowable thermal load reduction by the user aggregator during the h-th time period within a day.
0 L h u , h L max   u , h
where L h u , h represents the electric heating output on the user side during the h -th time period within a day; L max   u , h represents the maximum allowable thermal output during the electric heating process for the user aggregator.

2.5. System Revenue Calculation

Microgrid Operator Revenue Model:
E M G O l , e = λ h M G O , s max L h l , c , 0
where E M G O l , e represents the revenue from electricity transactions between the microgrid operator and the user side during the h-th time period within a day.
E M G O 1 E G , e = h = 1 H λ h E G , b L h l , c P h M T , e
where E M G O 1 E G , e represents the revenue from power exchanges realized with the grid when the power supplied by the microturbine on the microgrid operator’s side is sufficient to satisfy the consumption on the consumer’s side during the h-th time period.
E M G O 2 E G , e = h = 1 H λ h E G , s L h l , c P h M T , e
where E M G O 2 E G , e represents the cost of electricity transactions with the grid when the electricity provided by the micro gas turbine on the microgrid operator’s side is insufficient to meet the user-side demand during the h-th time period.
E M G O l , h = h = 1 H u h P h M T , h γ h M G O , s
where E M G O l , h represents the revenue generated from providing heating to the user side during the h-th time period.
E M T = h = 1 H E h M T
where E M T represents the gas cost for the microgrid operator over the course of a day.
In summary, the total revenue of the microgrid operator within a day can be expressed as:
E M G O = E M G O 1 E G , c + E M G O l , e + E M G O l , h E M T E M G O 2 E G , e
Shared Energy Storage Provider Model: The revenue function of the shared energy storage service provider during a day may be described as:
F E S S = F + E S S F E S S
where F + E S S represents the total fees that users need to pay within a day for using the shared energy storage system [20], and F E S S represents the costs that the shared energy storage service provider needs to pay for charging and discharging operations.
F + E S S = λ h E S S h = 1 H P h l , c + P h l , d
where λ h E S S represents the charge to be made to the energy storage operator per electricity unit of charge or discharge during the h-th time period within a day.
F E S S = δ P h = 1 H P h l , c ( t ) + P h l , d ( t )
where δ P represents the operating and servicing expenses of the electrical energy storage system.
User-Side Revenue Model:
E l u ( e ) = h = 1 H a L h l , e ¯ 2 + b L h l , e ¯ + c
L h l , e ¯ = L h L f f + L h l , s ¯ + Δ L h l , e + L h l , E S S
where E l u ( e ) represents the utility function of the user aggregator for electricity consumption during the h-th time period [21]; a, b, c, represents a parameter of the user aggregator’s electricity utility function. Equation (29) describes the electricity utility function in the form of a quadratic function [22].
When the user aggregator needs to purchase electricity from the microgrid operator, the cost can be expressed as:
E l 1 M O G , e = h = 1 H λ h M O G , s L h l , c
When the user aggregator sells electricity to the microgrid operator, the revenue can be expressed as:
E l 2 M O G , e = h = 1 H λ h M O G , b L h l , c
The fee that the user aggregator is required to pay for using the shared energy storage service can be expressed as:
E l M O G , h = E M O G l , h
In summary, the total revenue of the user aggregator within a day can be expressed as:
E l = E l 2 M O G , e + E l u ( e ) E l M O G , h + F + E S S E l 1 M O G , e h = 1 H β Δ L h l , h 2
Figure 2 illustrates the various constraints for different models. The microgrid operator is mainly subject to electricity price constraints, heat price constraints, interruptible power constraints, and adjustable power load constraints. The shared energy storage provider involves charging and discharging constraints, as well as storage capacity constraints. On the user side, there are mainly electricity load constraints, electric heating power constraints, energy storage power constraints, and photovoltaic power generation constraints.

3. Solving the Leader–Follower Game Model

3.1. Theoretical Basis of the Leader–Follower Game Theory

Leader–follower game theory, also known as Stackelberg game theory, is a strategic model in which participants are divided into leaders and followers. The formulation and announcement of strategies follow a clear sequence: the leader first formulates a strategy, and the follower then selects a strategy that maximizes their own benefit based on the information provided by the leader. The leader then decides whether to accept the follower’s strategy. This game model is hierarchical, reflecting real-world situations where one party has the advantage of making the first decision. The leader’s initial decision influences the follower’s choice of strategy, thereby having a profound impact on the overall outcome of the game.
In the Stackelberg game, the mathematical expression for the leader is as follows:
min x i k f i x k , y k 1
  s . t .   g i = x k , y k 1 h i = x k , y k 1 , i N
where k is the count of games; N is the count of leaders; and M is the count of followers.
The mathematical expression for the follower in the Stackelberg game is as follows:
min y i k f i x k , y k 1
  s . t .   g j = x k , y k 1 h j = x k , y k 1 , i M
where x k , y k are the strategies of the participants, respectively.
The conditions for the equilibrium point of the Stackelberg game are as follows:
x i * , y j * arg min f i x i * , y j * x i * , y j * arg min f i x i * , y j , i N , j M
where x i * , y j * is the set of optimal strategies of the game, i.e., the equilibrium solution.

3.2. Pricing Models

In the Stackelberg game between a microgrid operator and users, there is a sequential order of actions. The upper-level operator first sets the energy prices for the day, including electricity and heat prices. Users, as followers, then develop their energy consumption plans based on the established prices, taking into account the storage rental costs. If the microgrid operator sets the prices too high or too low, the user aggregator will dynamically adjust its electricity and heat consumption. Conversely, the microgrid operator will revise its pricing strategy based on the user aggregator’s consumption levels until an optimal pricing strategy is found. When the game reaches a Stackelberg equilibrium, it indicates that the followers have made the best decisions based on the leader’s strategy, and the leader has accepted this strategy. At this point, no participant can unilaterally adjust their strategy to increase their profit or decrease their cost. In this context, the strategies published by the upper-level microgrid operator are denoted as λ h M G O , b , λ h M G O , s , and E M G O ; in this context, E M G O represents the microgrid operator’s revenue for the day. The strategies of the lower-level user aggregator are denoted as L h l , s ¯ , Δ L l , h , L l , E S S , L l , E S S , and E l ; in this context, L h l , s ¯ represents the set of flexible load strategies adjusted by the user aggregator for the day; Δ L l , h represents the set of strategies for users to aggregate and reduce thermal energy within a day; L l , E S S represents the range of policies for consumers to use common energy storage facilities throughout the day; E l represents the revenue of the user aggregator within a day.

3.3. Solution Steps

The objective function for both the user aggregator and the microgrid operator is to maximize profits within a single day. The user aggregator needs to determine the optimal distribution of flexible electrical loads, the reduction in thermal loads and the amount of electrical energy participating in shared energy storage services. The microgrid operator needs to determine the optimal electricity and heat prices for the day. Genetic algorithms are used to iteratively update the upper-level microgrid operator’s selling and purchasing electricity prices based on data, while the subordinate issue is resolved directly with CPLEX. The actual resolution sequence is as follows:
(a)
Set the initial parameters, k = 0, set the population size m to 40, the count of iterations to 120, the mutation rate to 5%, the crossover probability to 90%, and the convergence error E = 0.01;
(b)
Initially create m sets of random electricity sales prices and heat prices for the microgrid operator with the genetic algorithm, and then pass these parameters to the user aggregator.
(c)
k = k + 1;
(d)
Transmit the m sets of electricity selling prices and heat selling prices generated by the microgrid operator in step (b) to the user aggregator. Use the CPLEX solver to determine the optimal distribution of flexible electrical load, the reduction in thermal load, and the amount of electrical energy participating in shared energy storage services. Calculate and record the current profit E l k , then provide the updated data to the microgrid operator. The microgrid operator will then compute and record the current profit E M O G k .
(e)
The new electricity and heat prices for the microgrid operator are generated via the processes of selection, crossover and migration of a genetic program. Repeat steps (d) to compute the microgrid operator’s revenue E M O G k and the user aggregator’s revenue E l k .
(f)
If E M O G k > E M O G k , execute E M O G k + 1 = E M O G k , E l k + 1 = E l k 1 ; Or, E M O G k + 1 = E M O G , E l k + 1 = E l k 1 .
(g)
If E M O G k + 1 E M O G k E and E l k + 1 E l k ε terminate the program, or return to step (c).

3.4. Proof of the Presence and Singularity of the Stackelberg Equilibrium

This paper sequentially proves the presence of Stackelberg equilibrium solutions in the four cases discussed. The strategy set for the upper-level microgrid operator is ( λ M O G , s , γ M O G , s ) and the lower-level user aggregator’s strategy set is ( L l s ¯ , Δ L l , h , L l , E S S ). Clearly, the strategy sets of all participants in the game represent finite closed subsets within the game theory domain. According to reference [23], the Stackelberg equilibrium is present if the underlying game fulfills the conditions below:
(1)
The microgrid operator’s and the user aggregator’s incomes are constant functions with respect to their respective strategy sets;
(2)
The user aggregator’s revenue satisfies a fitted constant function relative to its strategy set;
To prove (1): For the four scenarios, this is clearly satisfied.
To prove (2): L h l , c > 0 , L h l , E S S > 0 (the remaining cases can be proved similarly), and the user-side revenue can be expressed as:
E h l = λ h M O G , s L h l , c + a L h l , f + L h l , s ¯ + Δ L h l , e + L h l , E S S + b L h l , f + L h l , s ¯ + Δ L h l , e + L h l , E S S + c γ h M O G , s L h M O G , s + η d L h l , E S S λ h E S S β Δ L h l , h 2
where E h l equals a fitted constant function in terms of L h l , s ¯ , the other terms are all linear functions with respect to L h l , s ¯ ; therefore, the overall function is fitted convex with respect to L h l , s ¯ ; E h l equals a fitted constant function in terms of L h l , E S S , and the other terms are all linear functions in terms of L h l , E S S ; therefore, the overall function is fitted convex with respect to L h l , E S S . It is important to note that the thermal output diagram for electric heating by users is constant, and their strategy is given by Equation (27); therefore, the terms containing L h u , h can be viewed as constant functions with respect to E h l .
According to reference [24], the equilibrium is considered to be unique if the following constraints are fulfilled:
(1)
For the strategies provided by the microgrid operator, there exists a unique optimal strategy for the user aggregator;
(2)
For the strategies provided by the user aggregator, there exists a unique optimal strategy for the microgrid operator;
To prove (1): For example, considering L h l , c > 0 , L h l , E S S > 0 , the other cases are identical. Calculate the second-order partial derivatives of E h l in terms of L h l , s ¯ , Δ L h l , h , L h l , E S S , respectively:
2 E l , h L h l , s ¯ 2 = 2 a < 0
2 E l , h Δ L l , h 2 = 2 β < 0
2 E l , h L l , E S S 2 = 2 a < 0
In the parameters of this study, α < 0 , β > 0 ; therefore, the function has local maxima with respect to each strategy at L h l , s o ¯ , Δ L h l , h o , and L h l , E S S o . Considering the constraints on the variable domains, the optimal strategy for the user aggregator can be expressed as:
L l , h o p t s ¯ L l , h o s ¯ , ε L h l , s + L h l , f + L h l , s , L h l , s ε L h l , s + L h l , f
Δ L l , h o p t l , h { Δ L l , h o l , h , 0 , Δ L m a x l , h }
Δ L h l , E S S o p t { Δ L h l , E S S o , 0 , P m a x E S S , c , P m a x E S S , d }
To prove (2): For example, considering L h l , M O G L h l , c > 0 , L h l , M O G L h l , c P h M T , e > 0 , the remaining cases are similar. Substitute a set of optimal solutions { L h l , s ¯ o , Δ L h l , h o , Δ L h l , h o } for the user aggregator into E h M O G , and then compute the second-order partial derivatives of E h M O G in terms of λ h   M O G , b , λ h   M O G , s .
2 E h M O G λ h M O G , s 2 = 1 a
2 E h   M O G γ h   M O G , s 2 = 1 β
Furthermore, the Hessian matrix of the microgrid operator can be given:
H = 1 / a 0 0 1 / β
In conclusion, the Stackelberg equilibrium resolution is unique.

4. Specific Example

4.1. Case Study Model

Using a small residential community as a case study, each residential unit is provided with photovoltaic power production systems, electricity storage for heating and electricity storage for cooling. The microgrid manager within the community is provided by a micro gas turbine, assuming the following: the day is partitioned to H = 24 time intervals, the rental fee for the shared energy storage service provider is 0.33 RMB (kWh) per day, the proportion of flexible load adjustment at the consumer site k is approximately 15%, the comfort level coefficient β is 0.1 RMB (kW2), and the high and low thresholds for the thermal load are 0.15 kW (RMB) and 0.5 kW (RMB), respectively. The calculation scenario is shown in Table 1, with the optimization results of the parties’ benefits under four scenarios shown in Table 2, and other parameters are detailed in Table 3.
The example scenario is shown in Table 1, where for h [ 1 , 2 , , H ] , for scenario 1, just set μ h = 0 , E h M O G = 0; for scenario 2, set L h l , E S S = 0; for scenario 3, set μ h = 0 ; for scenario 4, set μ h = 1 .
We applied the proposed model to the scenario mentioned above, using MATLAB software for programming implementation. For the genetic programming algorithm, the probability of crossover and mutation are set to 90% and 5%, respectively, and the population is size 40.
Analyzing the data in Table 2, in scenario 2, the user aggregator’s revenue increased by RMB 56.56 compared to scenario 1, while the microgrid operator’s revenue decreased by RMB 110.04. This is because, in scenario 2, the user side is equipped with electric heating devices, which, when combined with the user’s thermal load demand response, further enhance the flexibility of thermal energy demand on the user side. In scenario 3, the user aggregator’s revenue increased by RMB 659.64 compared to scenario 1, while the microgrid operator’s revenue decreased by RMB 253.19. At the same time, the shared energy storage operator earned a profit of RMB 705.42. This is because, in scenario 3, users can utilize shared energy storage services, significantly improving their ability to adjust electrical loads, thus reducing their dependence on the microgrid operator for electricity supply and demand. In scenario 4, the user aggregator’s revenue increased by RMB 957.93 compared to scenario 1, while the microgrid operator’s revenue decreased by RMB 356.52. Meanwhile, the shared energy storage operator earned a profit of RMB 710.22. This is because the user side is equipped with both electric heating devices and shared energy storage services, maximizing the user’s ability to regulate both electricity and heat.
In conclusion, under the model established in this study, the introduction of shared energy storage and electric heating devices has made the users’ electricity and heat options more flexible, significantly increasing the user aggregator’s revenue.

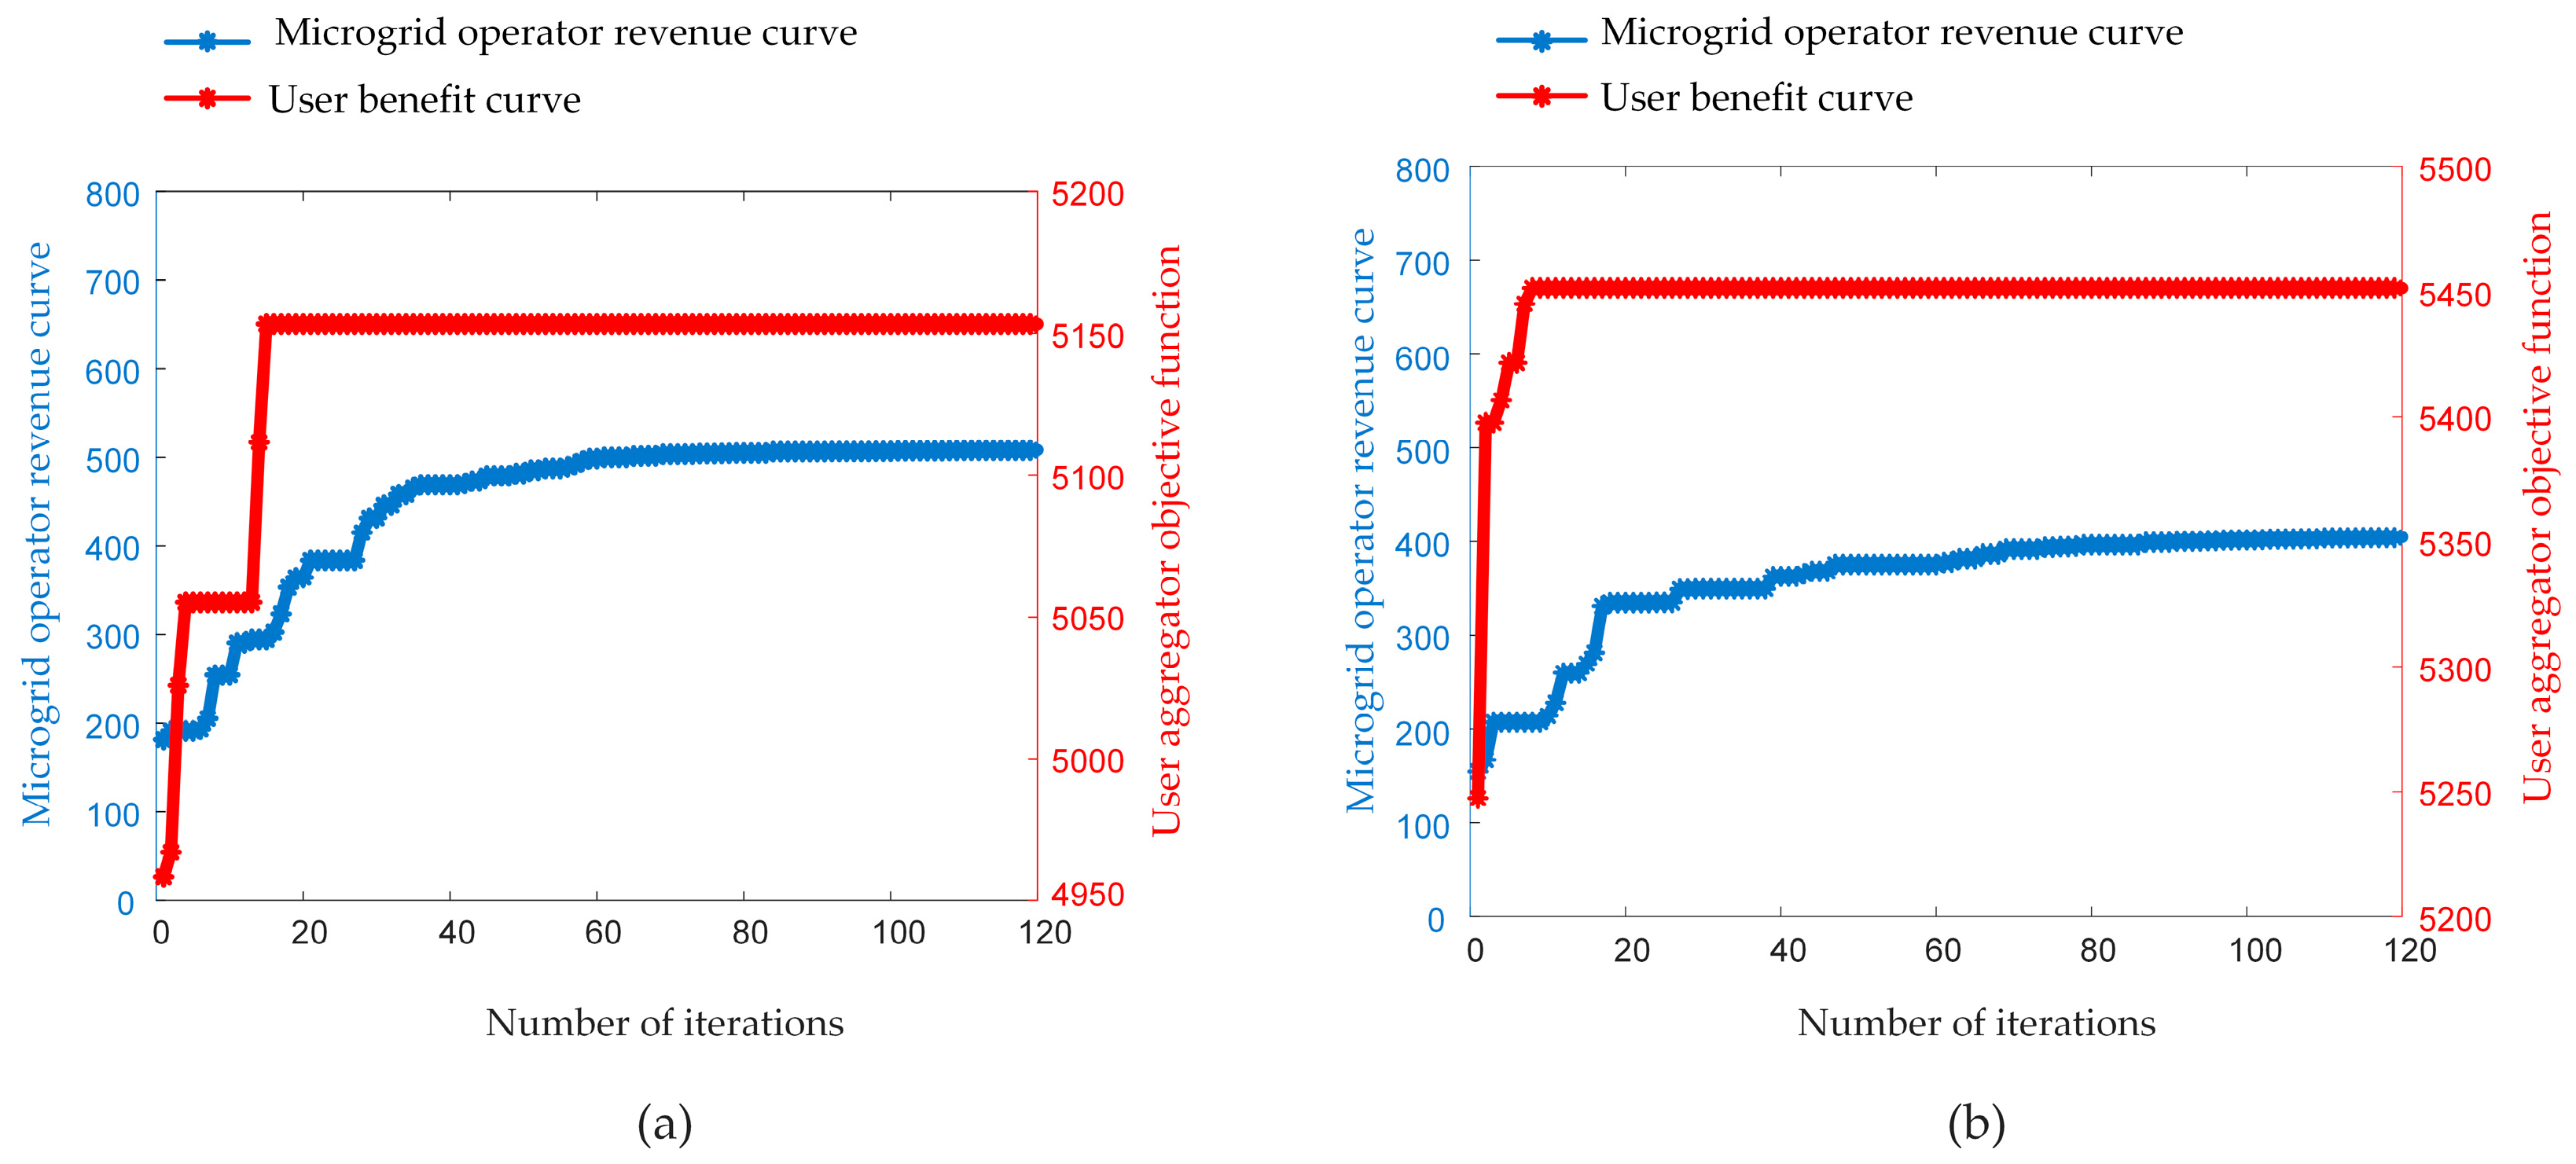
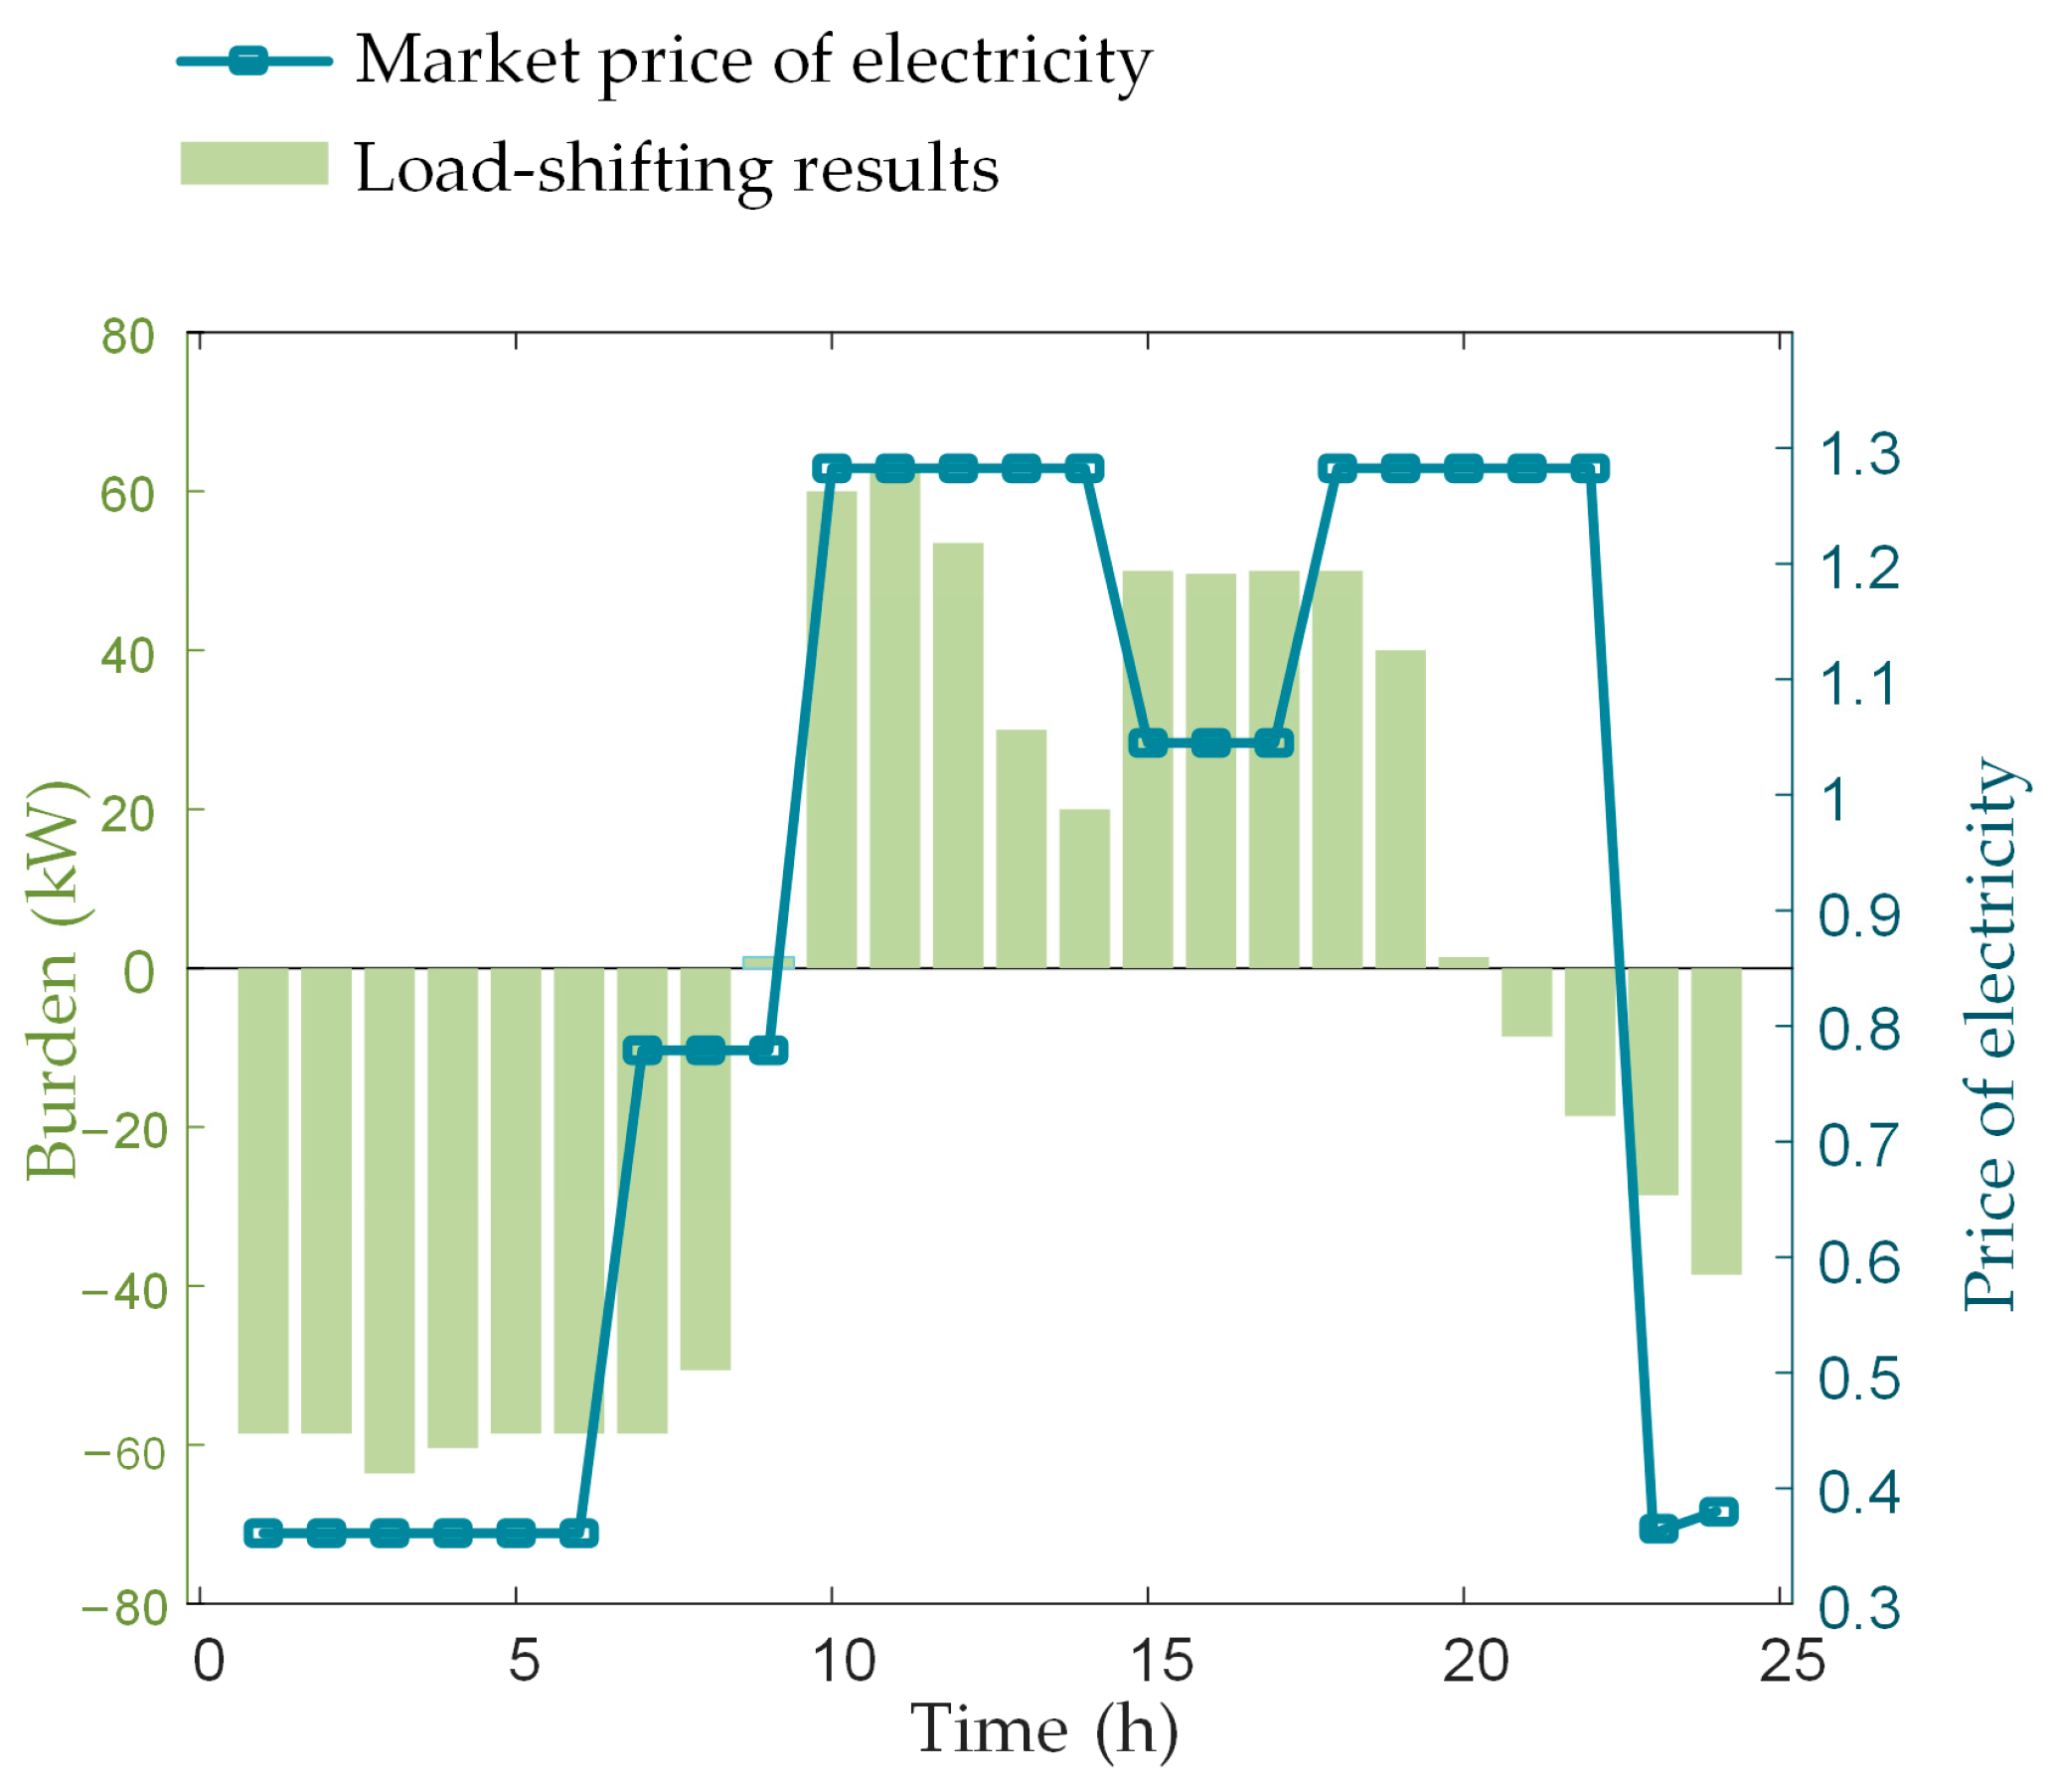
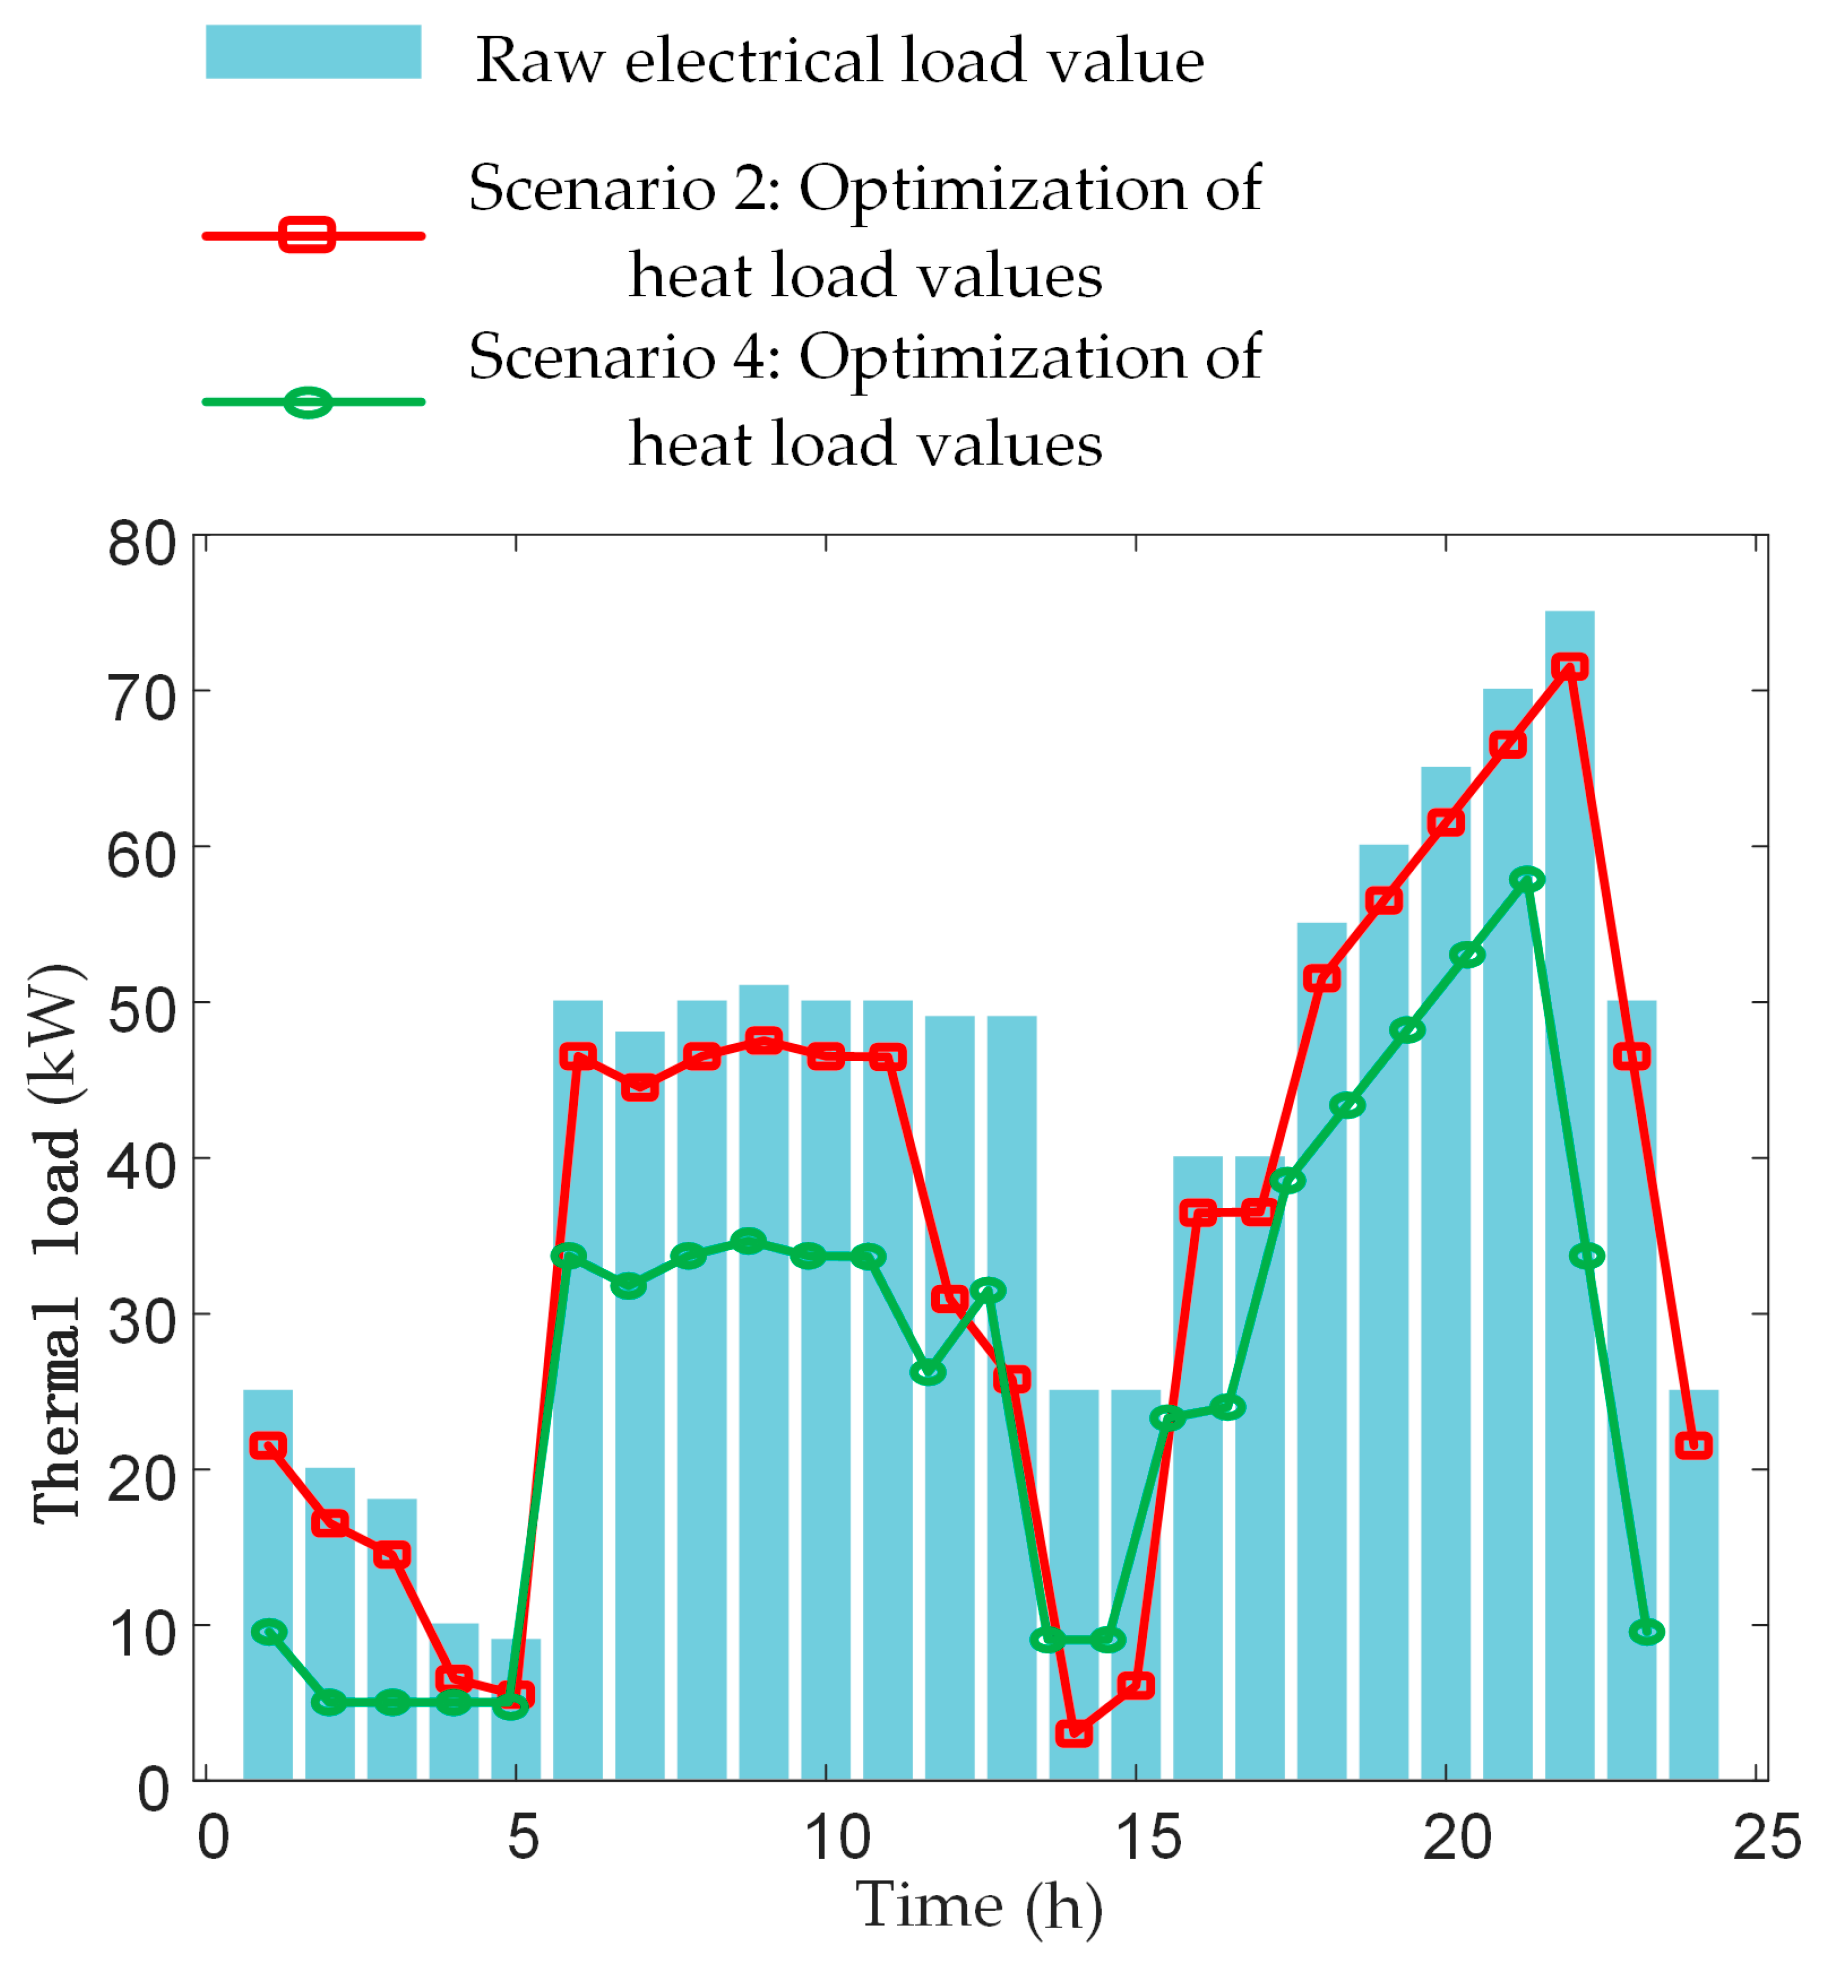
4.2. Scenario Optimization Results

It illustrates the iterative revenue for scenario 3 and scenario 4 in Figure 3. Subfigures (a) and (b) represent the iterative revenues for Scenario 3 and Scenario 4, respectively. In these scenarios, both user revenue and microgrid operator revenue converge at iterations 101 and 110, respectively, indicating the Stackelberg equilibrium solution. In scenario 3, the user revenue is RMB 5153.22, and the microgrid operator revenue is RMB 507.33. In scenario 4, the user revenue is RMB 5451.51, and the microgrid operator revenue is RMB 404.24. The user revenue in scenario 4 is RMB 298.29 higher than in scenario 3, while the microgrid operator revenue decreases by RMB 103.09. This is because scenario 4 includes both shared energy storage services and electric heating devices, optimizing the user’s electricity and heat response adjustments.
In the field of research on heuristic algorithms, academics generally recognize the limitations of these algorithms in finding globally optimal solutions. Specifically, heuristic algorithms typically aim to find locally optimal solutions rather than globally optimal solutions due to their reliance on simplified problems and rules of thumb to quickly generate feasible solutions. In computational complexity theory, many optimization problems are classified as NP-hard, implying that they are at least as difficult to solve as NP-complete problems and that there exists no known polynomial-time algorithm that guarantees finding an optimal solution. Nevertheless, heuristic algorithms show their unique advantages in specific domains, such as engineering design, production scheduling as well as logistics and distribution, because they are able to provide high-quality approximate solutions in a reasonable amount of time. The application value of such algorithms lies in their ability to provide practical solutions to complex problems with limited computational resources. It should also be mentioned that the difference in iteration counts across scenarios can be attributed to two main factors: on the one hand, the randomness in generating algorithm parameters due to steps like mutation and recombination in the genetic algorithm; on the other hand, the upper-level problem in the model, which involves microgrid operator pricing, is unaffected by the scenario settings. The scenario settings influence the complexity of the lower-level user-side model (where the user’s energy choice strategies become more diverse). Compared to previous research models (which did not consider factors like a user’s electric heating, use of shared energy storage services, and integrated electricity–heat demand responses), the algorithm framework adopted in this study does not exhibit significant changes in solving complexity, thus demonstrating a certain degree of general applicability.
Figure 4 shows the optimized electricity and heat pricing for the microgrid operator in scenarios 3 and 4. Subfigures (a) and (b) represent the electricity price changes for Scenario 3 and Scenario 4, respectively, while subfigures (c) and (d) represent the heat price changes for Scenario 3 and Scenario 4, respectively. During the periods from 00:00 to 07:00, 14:00 to 15:00 and 23:00 to 24:00, the electricity price is relatively low, with fluctuations occurring during the intermediate time periods. This is due to the involvement of electric heating devices and shared energy storage services in scenario 4, which participate in the adjustment of the user-side electricity and heat loads, reflecting the further interplay between the microgrid operator and the user side.
Figure 5 illustrates the relationship between market electricity prices and negative load-shifting results in scenario 4. When market prices are low, the load shift amount is negative, indicating that the actual electricity load is higher than the forecasted value. This is because of the implementation of the common energy storage facility, where users increase their electricity purchases and store it when prices are low. Conversely, when market prices are high, the load shift amount is positive, indicating that the current load is smaller than the predicted value. During price peaks, users can utilize the electricity stored at lower prices to generate power, allowing for more efficient planning of electricity usage and maximizing their revenue, which aligns with real-world scenarios.
Figure 6 shows the optimization of electric loads in both scenarios 2 and 4. Compared to scenario 2, scenario 4 increases electric load consumption during off-peak periods, such as from 00:00 to 09:00 and 20:00 to 24:00, while reducing load consumption during peak periods from 10:00 to 19:00. This achieves the goal of “peak shaving and valley filling”. Users increase their electricity purchases from the microgrid operator at times of low market prices and decrease their purchases at times of high market prices, corresponding to the variations in electricity prices across different time periods. This further validates the feasibility of the optimization strategy. Compared to scenario 2, the optimization effect in scenario 4 is more pronounced, with more load consumption during off-peak periods and a more significant reduction during peak periods. This improvement is attributable to the incorporation of shared energy storage in scenario 4, allowing users to accumulate power at off-peak periods and discharge it at peak periods.
In Figure 7, it shows the optimized heat load results for Scenarios 3 and 4. Compared to the original heat load, both scenarios exhibit a significant reduction in heat load consumption, primarily because of the implementation of the common energy storage facility in both scenarios. However, scenario 4 shows a more pronounced optimization effect on the heat load compared to scenario 3. This is because scenario 4 also incorporates electric heating devices, allowing users to utilize stored electricity to generate heat when electricity prices are low, especially when both electricity and heat prices are high. The availability of more diverse options for heat load management, combined with the coordination of electric heating devices and the user side’s heat demand response, further optimizes the heat load, thereby enhancing user-side revenue.
Figure 8 reflects the changes in user heat load across different time periods in scenarios 3 and 4. Subfigure (a) and (b) represent the changes in user heat load for Scenario 3 and Scenario 4, respectively. In scenario 3, users are limited to purchasing heat from the operator, which imposes more constraints. However, in scenario 4, the introduction of electric heating devices allows users to combine heat purchases from the microgrid operator with heat generated by electric heating devices. This flexibility enables users to plan more effectively based on the heat and electricity prices offered by the microgrid operator, choosing the option with the lower heating cost to maximize their revenue. As a result, users can manage their heat usage more efficiently with more flexible and diverse heat sources.
Genetic algorithms simulate the process of natural selection by searching for optimal solutions in a population of candidate solutions through selection, crossover and mutation operations. Our GA implementation consists of the following steps:
(1)
Initialization: randomly generate an initial population of 40 candidate solutions.
(2)
Fitness evaluation: calculate the fitness value of each candidate solution, which is based on the optimization objective of the problem.
(3)
Selection: select the best candidate solutions for crossover and mutation operations based on the fitness value.
(4)
Crossover: combines two excellent candidate solutions with a 90% probability of producing new offspring.
(5)
Mutation: randomly change some genes in the offspring with a 5% probability to increase the diversity of the population.
(6)
New generation of populations: select a new generation of populations based on fitness values and repeat steps 2–5 until the stopping conditions are met.
In MATLAB, we set the scaling factor to F = 0.5 and the crossover factor to CR = 0.9. The parameter settings are as follows: set the number of individuals to groupSize = 40; chromosome length to groupDimension = 48; the maximum number of genetic generations to MAXGEN = 120; variant population to v = zeros (groupSize, groupDimension); crossover population to u = zeros (groupSize, groupDimension); and boundary processing population to Unew = zeros (groupSize, groupDimension). Then, initialize the population population = smartGroupInit, population generation counter gen = 0, initial fitness fitness = 0, and user gain user = 0; for the whole population mutate, v = mutate (population, F, MAXGEN, gen), and crossover operation u = crossover (population, v, CR). The boundary processing and assignment of generations are then performed. Finally, the optimal adaptation and prices of electricity and heat sales and user benefits are tracked, and scenario 4 reaches convergence at 110 iterations in 78.68 s.

5. Conclusions

With technological advancements and the introduction of various electric heating devices, users now have more flexibility in choosing between electricity and heat. The traditional model, where microgrid operators primarily dictate electricity and heat prices, has significantly limited user options and harmed user-side interests. This approach is becoming increasingly unsuitable for real-world applications.
The integrated energy microgrid model proposed in this paper significantly improves the flexibility in power and heat selection on the user side by introducing shared energy storage and electric heating mechanisms. The results of this study show that the revenue of the user aggregator reaches RMB 5451.51 in scenario 4, which is an increase of RMB 957.93 compared to RMB 4493.58 in scenario 1. Meanwhile, the microgrid operator’s revenue decreases to RMB 404.24 in scenario 4, showing a significant increase in user-side benefits. The profit of the shared energy storage operator also reaches RMB 705.42 and RMB 710.22 in scenarios 3 and 4, respectively, indicating the effectiveness of the shared energy storage service. With this optimization strategy, users are able to store electricity at low electricity prices and discharge it at high electricity prices, resulting in higher economic benefits. Future research could further explore the impact of the shared energy storage provider’s rental fees on the overall economic model to more fully reflect the reality of the three-party participation game.
Shared energy storage technology enables more flexible electricity and thermal responses at the consumer site. Users can charge during off-peak periods and optimize their energy storage and discharge based on their actual needs, thereby increasing their revenue. In the model proposed in this paper, the microgrid operator must consider both its own interests and the previous day’s user electricity consumption patterns when setting electricity and heat prices. This comprehensive model aims to achieve a win–win situation for both customers and shared energy storage providers.
Furthermore, the model studied in this paper not only incorporates the electricity–heat-coupling relationship at the upper level but also introduces electric heating devices at the user side, allowing electricity to be converted into heat, thereby creating a more integrated electricity–heat-coupling relationship. This approach more comprehensively addresses the electricity and heat response needs of the user side.
In this paper, the game involves the microgrid operator and the user side, with the operator acting as the leader and the follower of the user side. In real-world situations, the shared energy storage supplier could also take part in the simulation. The optimal lease fee for the shared energy storage supplier is another area worth exploring, as it introduces new considerations for user decisions. Developing a model where all three parties—microgrid operator, user side, and shared energy storage provider—engage in a game would better reflect real-world scenarios.

6. Research Gaps and Future Research Directions

Despite the progress made in recent years in research on integrated energy microgrids and shared energy storage systems, there are still some notable research gaps that need to be further explored and filled. The following are a few of the major research gaps:
(1)
Insufficient analysis of multi-stakeholder games: Existing studies have mostly focused on the game between microgrid operators and users, lacking comprehensive consideration of shared energy storage service providers. Future research should explore multiparty game models to analyze the mutual influence and cooperation among microgrid operators, users and shared energy storage service providers to achieve a more comprehensive optimization strategy.
(2)
Dynamic Pricing Mechanisms and Inadequate Demand Response: Current research often assumes that electricity and heat prices are static, failing to fully consider the impact of dynamic changes in market prices on user behavior. In addition, the customer-side demand response is usually regarded as a single-load adjustment and lacks in-depth analysis of flexible switching between electricity and heat. Future research should combine dynamic pricing mechanisms with the diversity of user demand responses to promote efficient resource allocation.
(3)
Insufficient analysis of economics and sustainability: Although shared energy storage systems improve energy utilization efficiency, their economics and sustainability still require in-depth research. The current literature is limited in analyzing its return on investment, operating costs and environmental benefits, and future research should assess the economics and sustainability of shared energy storage systems in different application scenarios through empirical analyses to provide support for decision-making.
(4)
Research on Risk Awareness and Trading Strategies for Energy Storage: Risk awareness in energy storage systems has not been sufficiently emphasized in energy trading. In the literature [25], a mixed integer linear programming model is used to mitigate the voltage imbalance at the lowest investment cost, and the robustness is improved. Literature [26] investigates an integrated risk measurement and control methodology for stochastic energy trading strategies in wind energy storage systems, which can be considered for risk measurement and control in electrical energy systems as well. Future research can further explore the integration of risk awareness and energy trading strategies for energy storage using robust optimization and stochastic optimization methods to improve the security and effectiveness of trading. This will help optimize the allocation and use of energy storage resources in an uncertain environment.

Author Contributions

Conceptualization, Z.Y. and Z.W.; methodology, F.Y.; software, F.Y.; validation, D.W.; formal analysis, N.L.; investigation, N.L.; resources, Z.W.; data curation, Z.W.; writing—original draft preparation, Z.Y.; writing—review and editing, Z.Y.; visualization, F.Y.; supervision, F.Y. and D.W.; project administration, F.Y. All authors have read and agreed to the published version of the manuscript.

Funding

This research was funded by the National Natural Science Foundation of China (Grant NO. 52377104).

Data Availability Statement

The original contributions presented in the study are included in the article; further inquiries can be directed to the corresponding author.

Conflicts of Interest

Authors Zhilong Yin and Zhiguo Wang were employed by the company Xi’an Dynamic Inspection and Testing Co., Ltd. Authors Dong Wang and Na Li were employed by the company China National Testing Holding Group Co., Ltd., Beijing, China. The remaining authors declare that the research was conducted in the absence of any commercial or financial relationships that could be construed as a potential conflict of interest.

References

  1. Shrestha, A.; Mustafa, A.A.; Htike, M.M.; You, V.; Kakina, M. Evolution of energy mix in emerging countries: Modern renewable energy, traditional renewable energy, and non-renewable energy. Renew. Energy 2022, 199, 419–432. [Google Scholar] [CrossRef]
  2. Feng, L.; Jian, Q.Z.; Tian, H.; Zhao, L.; Liu, R.; Zhao, E.G. Optimal dispatch and economic evaluation of zero carbon park considering capacity attenuation of shared energy storage. Electr. Power Constr. 2022, 43, 112–121. [Google Scholar]
  3. Bradbury, K.; Pratson, L.; Patiño-Echeverri, D. Economic viability of energy storage systems based on price arbitrage potential in real-time U.S. electricity markets. Appl. Energy 2014, 114, 512–519. [Google Scholar] [CrossRef]
  4. Zhu, W.J.; Song, K.X.; Gu, Y.L.; Luo, Y.G.; Shu, J.; Weng, H.; Li, Z.Y. Allocating the capacity of shared energy storage for wind farm groups based on the over-limit power export risk. Front. Energy Res. 2023, 10. [Google Scholar] [CrossRef]
  5. Khanal, S.; Khezri, R.; Mahmoudi, A.; Kahourzadeh, S. Optimal capacity of solar photovoltaic and battery storage for grid-tied houses based on energy sharing. IET Gener. Transm. Distrib. 2023, 17, 1707–1722. [Google Scholar] [CrossRef]
  6. Dai, R.; Esmaeilbeigi, R.; Charkhgard, H. The utilization of shared energy storage in energy systems: A comprehensive review. IEEE Trans. Smart Grid 2021, 12, 3163–3174. [Google Scholar] [CrossRef]
  7. Li, C.; Hou, Y.; Gao, M.H.; Yang, Y.X. Exploring the influencing factors of sharing economy sustainability based on a two-mode social network analysis. In Proceedings of the 2019 16th International Conference on Service Systems and Service Management (ICSSSM), Shenzhen, China, 13–15 July 2019; pp. 1–5. [Google Scholar]
  8. Zhou, Y.L.; Ci, S.; Lin, N.; Li, H.J.; Yang, Y. Distributed energy management of P2P energy sharing in energy Internet based on cloud energy storage. In Proceedings of the 9th Acm International Conference on Future Energy Systems, Karlsruhe, Germany, 12–15 June 2018; pp. 173–177. [Google Scholar]
  9. Chen, H.Y.; Liu, Y.; Xu, L.X.; Li, Z.W. Optimal configuration of shared energy storage on residential user side considering capacity reduction. Electr. Power Constr. 2023, 44, 43–57. [Google Scholar]
  10. Zhang, B.Q.; Huang, J.W. Shared energy storage capacity configuration of a distribution network system with multiple microgrids based on a stackelberg game. Energies 2024, 17, 13. [Google Scholar] [CrossRef]
  11. Kim, I.; Kim, D. Optimal capacity of shared energy storage and photovoltaic system for cooperative residential customers. In Proceedings of the International Conference on Information and Communications (ICIC) 2017, Hanoi, Vietnam, 26–28 June 2017; pp. 293–297. [Google Scholar]
  12. Chen, K.; Zhang, Z. In-flight wireless charging: A promising application-oriented charging technique for drones. IEEE Ind. Electron. Mag. 2024, 18, 6–16. [Google Scholar] [CrossRef]
  13. Ye, J.; Zhao, D.Y.; Zhang, L.; Li, Z.H.; Zhang, T. Research on combined electricity and heating system scheduling method considering multi-source ring heating network. Front. Energy Res. 2021, 9. [Google Scholar] [CrossRef]
  14. Liu, N.A.; Wang, J.; Wang, L.F. Hybrid energy sharing for multiple microgrids in an integrated heat-electricity energy system. IEEE Trans. Sustain. Energy 2019, 10, 1139–1151. [Google Scholar] [CrossRef]
  15. Wang, C.T.; Zhang, X.Y.; Wang, Y.C.; Xiong, H.B.; Ding, X.; Guo, C.X. Pricing method of electric-thermal heterogeneous shared energy storage service. Energy 2023, 281, 128275. [Google Scholar] [CrossRef]
  16. Liu, N.; Yu, X.; Wang, C. Energy sharing management for microgrids with PV prosumers: A stackelberg game approach. IEEE Trans. Ind. Inform. 2017, 13, 1088–1098. [Google Scholar] [CrossRef]
  17. Jin, Y.H.; Zhang, J.L.; Wu, X.; Shen, J.; Lee, K.Y. Coordinated control for combined heat and power load of an integrated energy system. IFAC World Congr. Autom. Control Meet. Soc. Chall. 2021, 53, 13184–13189. [Google Scholar] [CrossRef]
  18. Fleischhacker, A.; Auer, H.; Botterud, A. Sharing solar PV and energy storage in apartment buildings: Resource allocation and pricing. IEEE Trans. Smart Grid. 2019, 10, 3963–3973. [Google Scholar] [CrossRef]
  19. Liu, Y.J.; Dai, H.; Liu, Z.J.; Liu, R.G. Configuration and investment benefit analysis of decentralized shared energy storage for multiple types of industrial users. Electr. Power Autom. Equip. 2021, 41, 256–264. [Google Scholar]
  20. Dong, S.; Wang, C.F.; Liang, J.; Dong, X.M.; Liang, Z.T.; Li, H.D. Multi-objective optimal day-ahead dispatch of integrated energy system considering power-to-gas operation cost. Autom. Electr. Power Syst. 2018, 42, 8–15+121. [Google Scholar]
  21. Zhao, X.L.; He, G.Y. Power utility evaluation of residential electrical appliances. Autom. Electr. Power Syst. 2016, 40, 53–59. [Google Scholar]
  22. Wu, L.L.; Jing, Z.X.; Wu, Q.H.; Deng, S. Equilibrium strategies for integrated energy systems based on stackelberg game model. Electr. Power Syst. Autom. 2018, 42, 142–150+207. [Google Scholar]
  23. Deng, X.C.; Guo, H.H. Existence of the equilibrium solution of a two-stage leaders-followers game. Math. Econ. 2009, 26, 50–53. [Google Scholar]
  24. Liu, N.; He, L.; Yu, X.; Ma, L. Multiparty energy management for grid-connected microgrids with heat- and electricity-coupled demand response. IEEE Trans. Ind. Inform. 2018, 14, 1887–1897. [Google Scholar] [CrossRef]
  25. Lee, J.-O.; Kim, Y.-S.; Jeon, J.-H. Robust Optimization Method for Voltage Balancer Planning in Bipolar DC Distribution Systems. IEEE Trans. Power Syst. 2024, 39, 6592–6604. [Google Scholar] [CrossRef]
  26. Xiao, D.; Chen, H.; Cai, W.; Wei, C.; Zhao, Z. Integrated risk measurement and control for stochastic energy trading of a wind storage system in electricity markets. Prot. Control Mod. Power Syst. 2023, 8, 1–11. [Google Scholar] [CrossRef]
Figure 1. Schematic diagram of microgrid framework.
Electronics 13 04506 g001
Figure 2. Different types of constraints.
Electronics 13 04506 g002
Figure 3. Iterative revenue chart for scenarios 3 and 4.
Electronics 13 04506 g003
Figure 4. Electricity and heat pricing chart of the microgrid operator in scenarios 3 and 4.
Electronics 13 04506 g004
Figure 5. Market electricity price and negative load-shifting relationship in scenario 4.
Electronics 13 04506 g005
Figure 6. Optimized electric load results for scenarios 2 and 4.
Electronics 13 04506 g006
Figure 7. Optimized heat load results for scenarios 3 and 4.
Electronics 13 04506 g007
Figure 8. User heat load changes in scenarios 3 and 4.
Electronics 13 04506 g008
Table 1. Description of the four scenarios.
SceneShared Energy StorageElectric Heating Equipment
Scene 1NONO
Scene 2NOYES
Scene 3YESNO
Scene 4YESYES
Table 2. Optimized profits of microgrid operator, users aggregator and shared energy storage service provider.
SceneMicro-Network Operator/RMBUser Aggregator/RMBShared Energy Storage Provider/RMB
Scene 1760.524493.58151.792
Scene 2650.484550.23183.294
Scene 3507.335153.22157.415
Scene 4404.245451.51180.428
Table 3. Other parameters of the model.
ParametersValue
User aggregatora−0.05
b4
c0
η h l 0.9
ε 0.2
β 0.1
Δ L m a x l , h 15 kW
L m a x u , h 60 kW
Shared energy storage systems E m i n E S S 300 kWh
E m a x E S S 1350 kWh
E N 1500 kWh
P m a x E S S , c 50 kWh
P m a x E S S , d 50 kWh
S O C 0 0.5
η c E S S 0.95
η d E S S 0.95
Disclaimer/Publisher’s Note: The statements, opinions and data contained in all publications are solely those of the individual author(s) and contributor(s) and not of MDPI and/or the editor(s). MDPI and/or the editor(s) disclaim responsibility for any injury to people or property resulting from any ideas, methods, instructions or products referred to in the content.

