
Surface Defect Detection of Steel Balls Based on Surface Full Expansion and Image Difference

 ,
,
Abstract
1. Introduction
2. Basic Theory
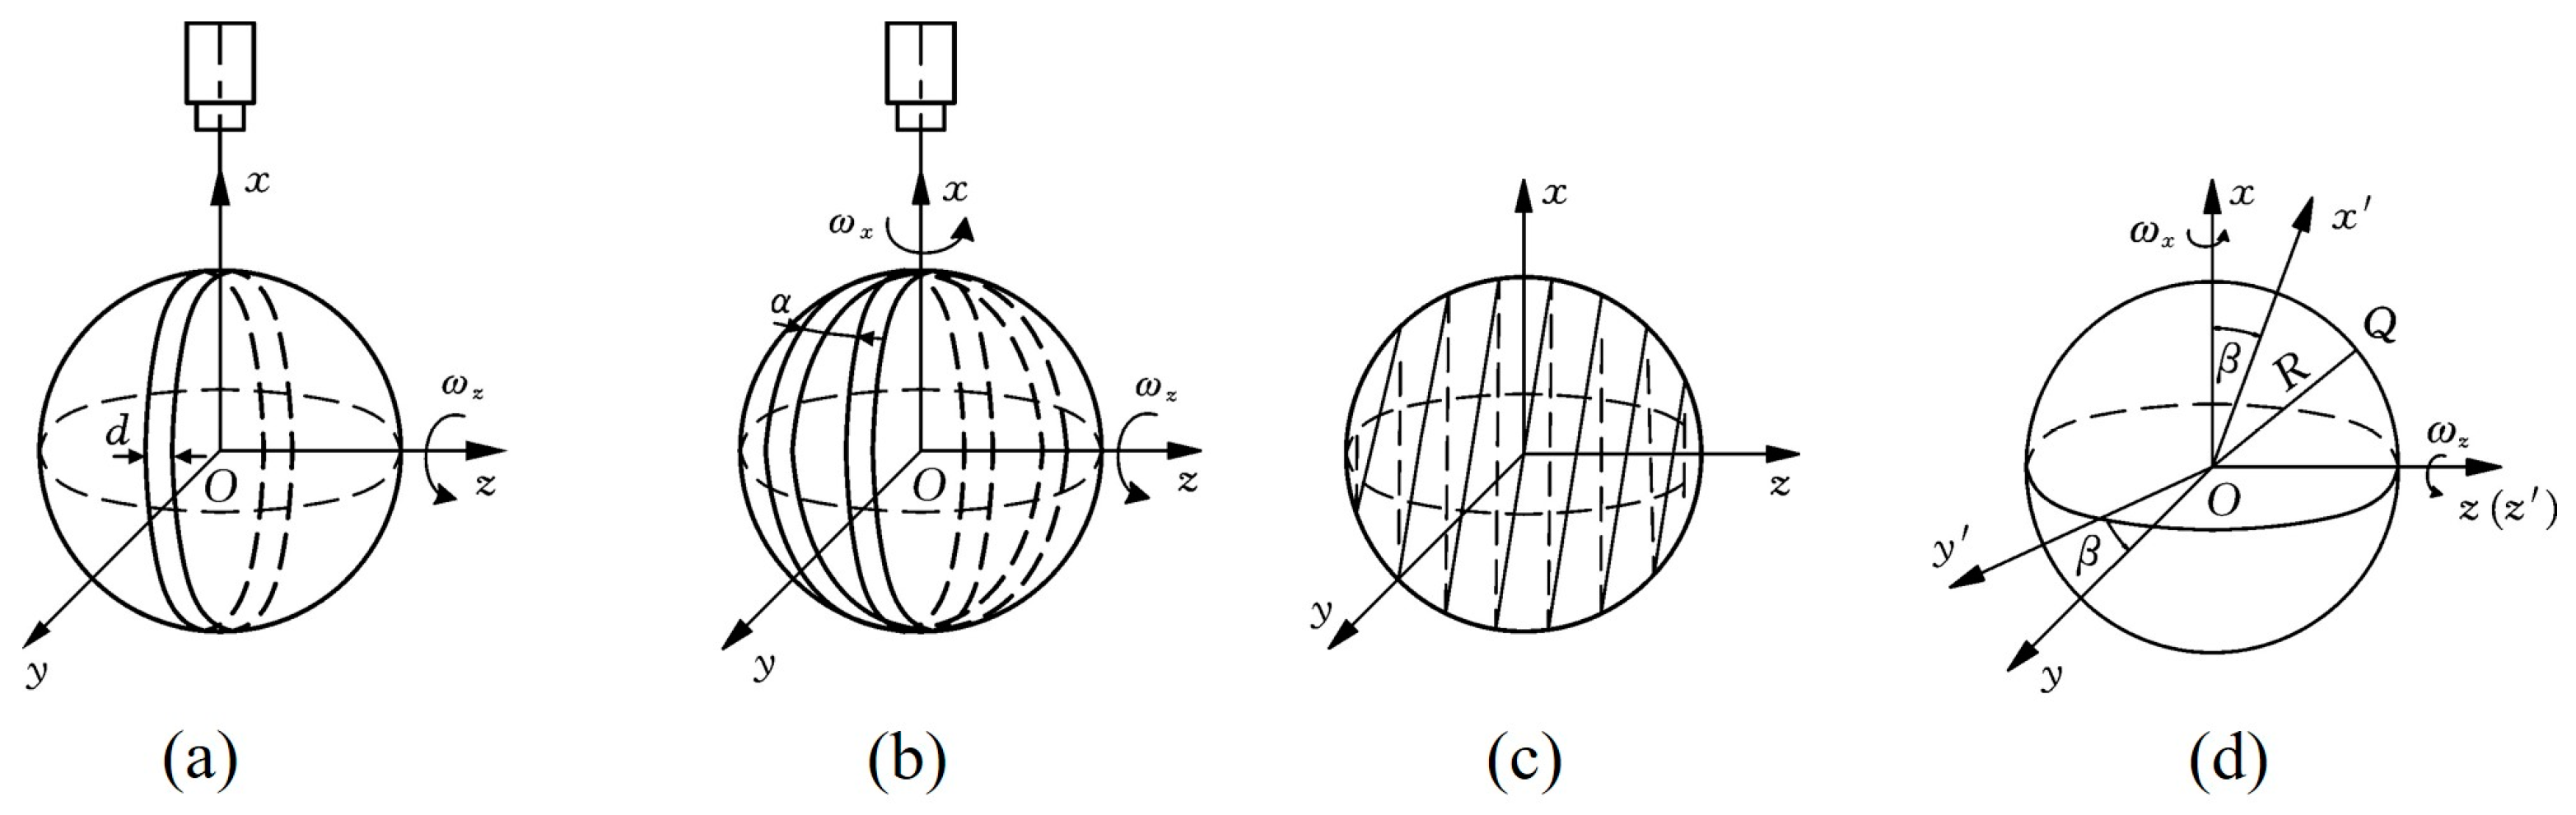
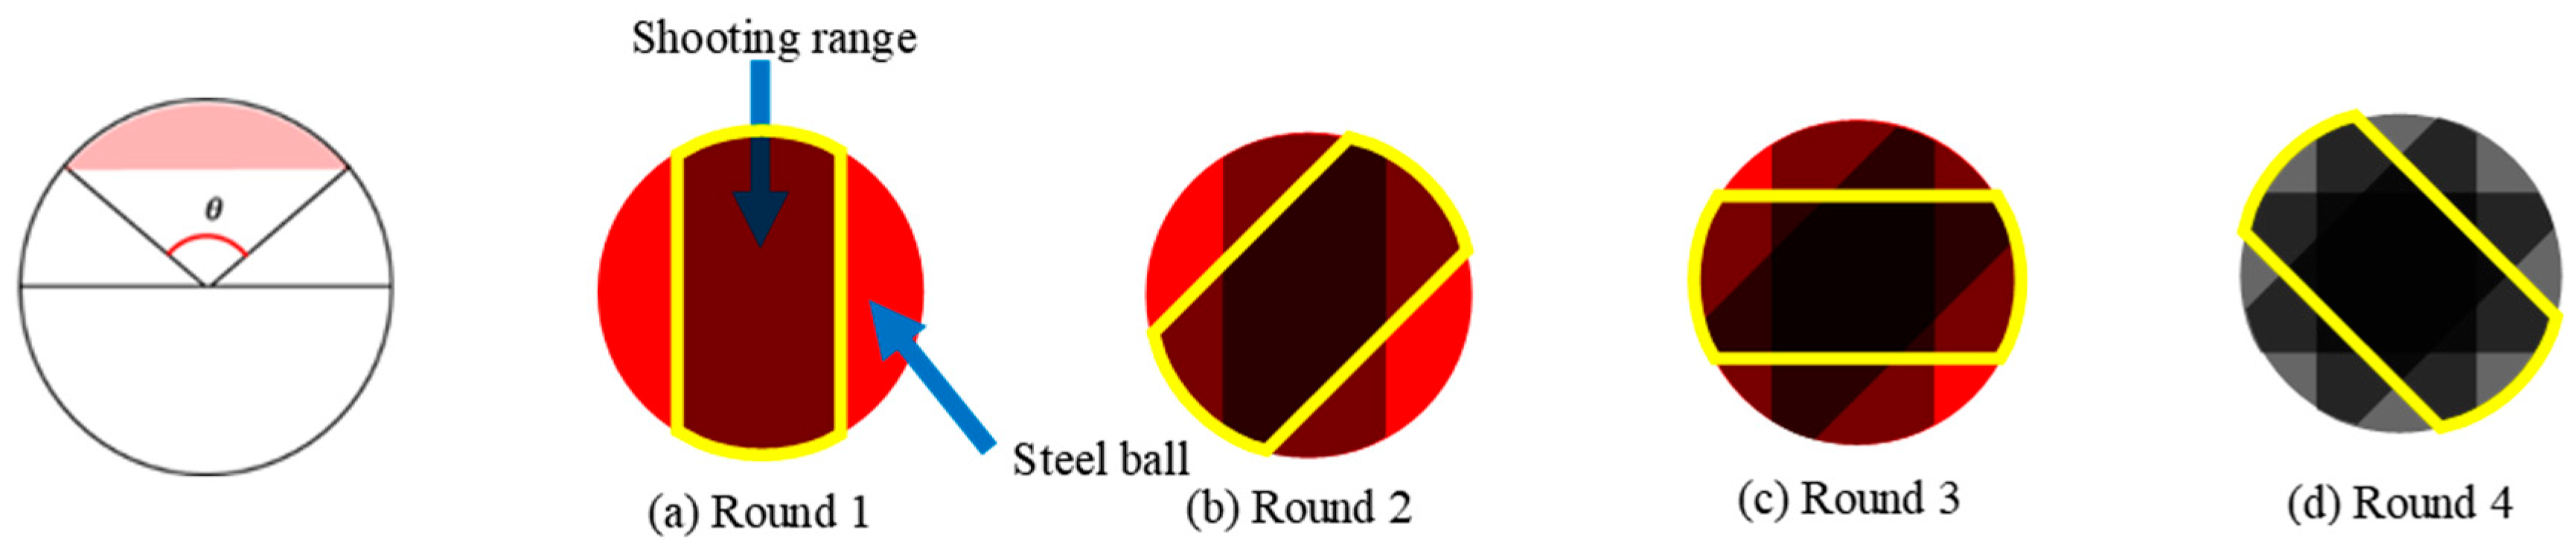
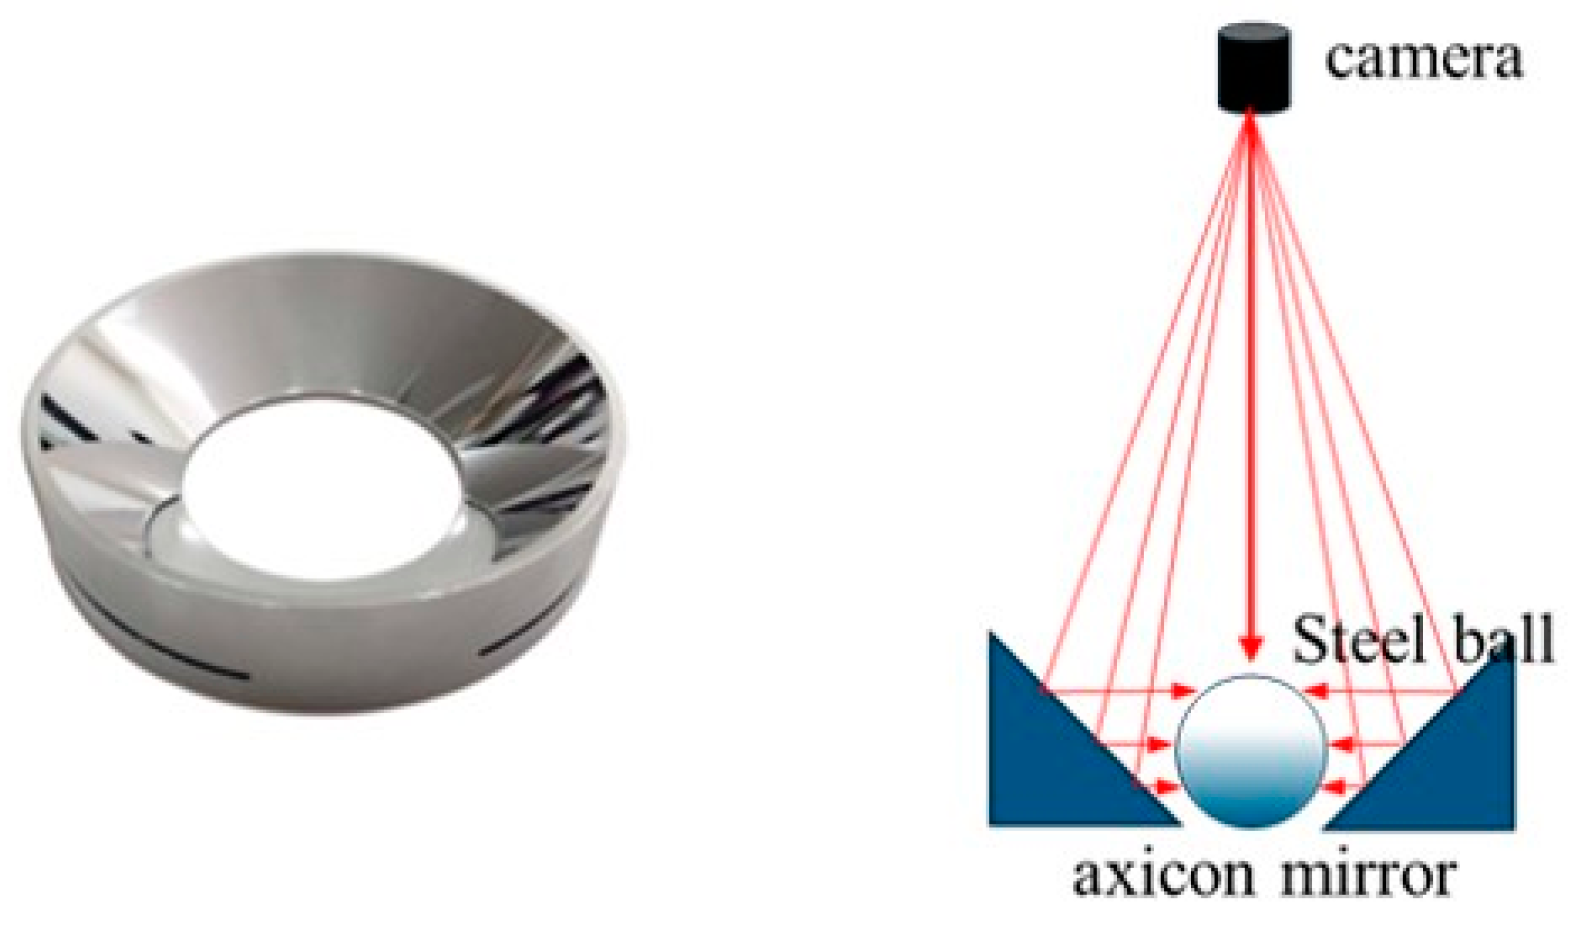
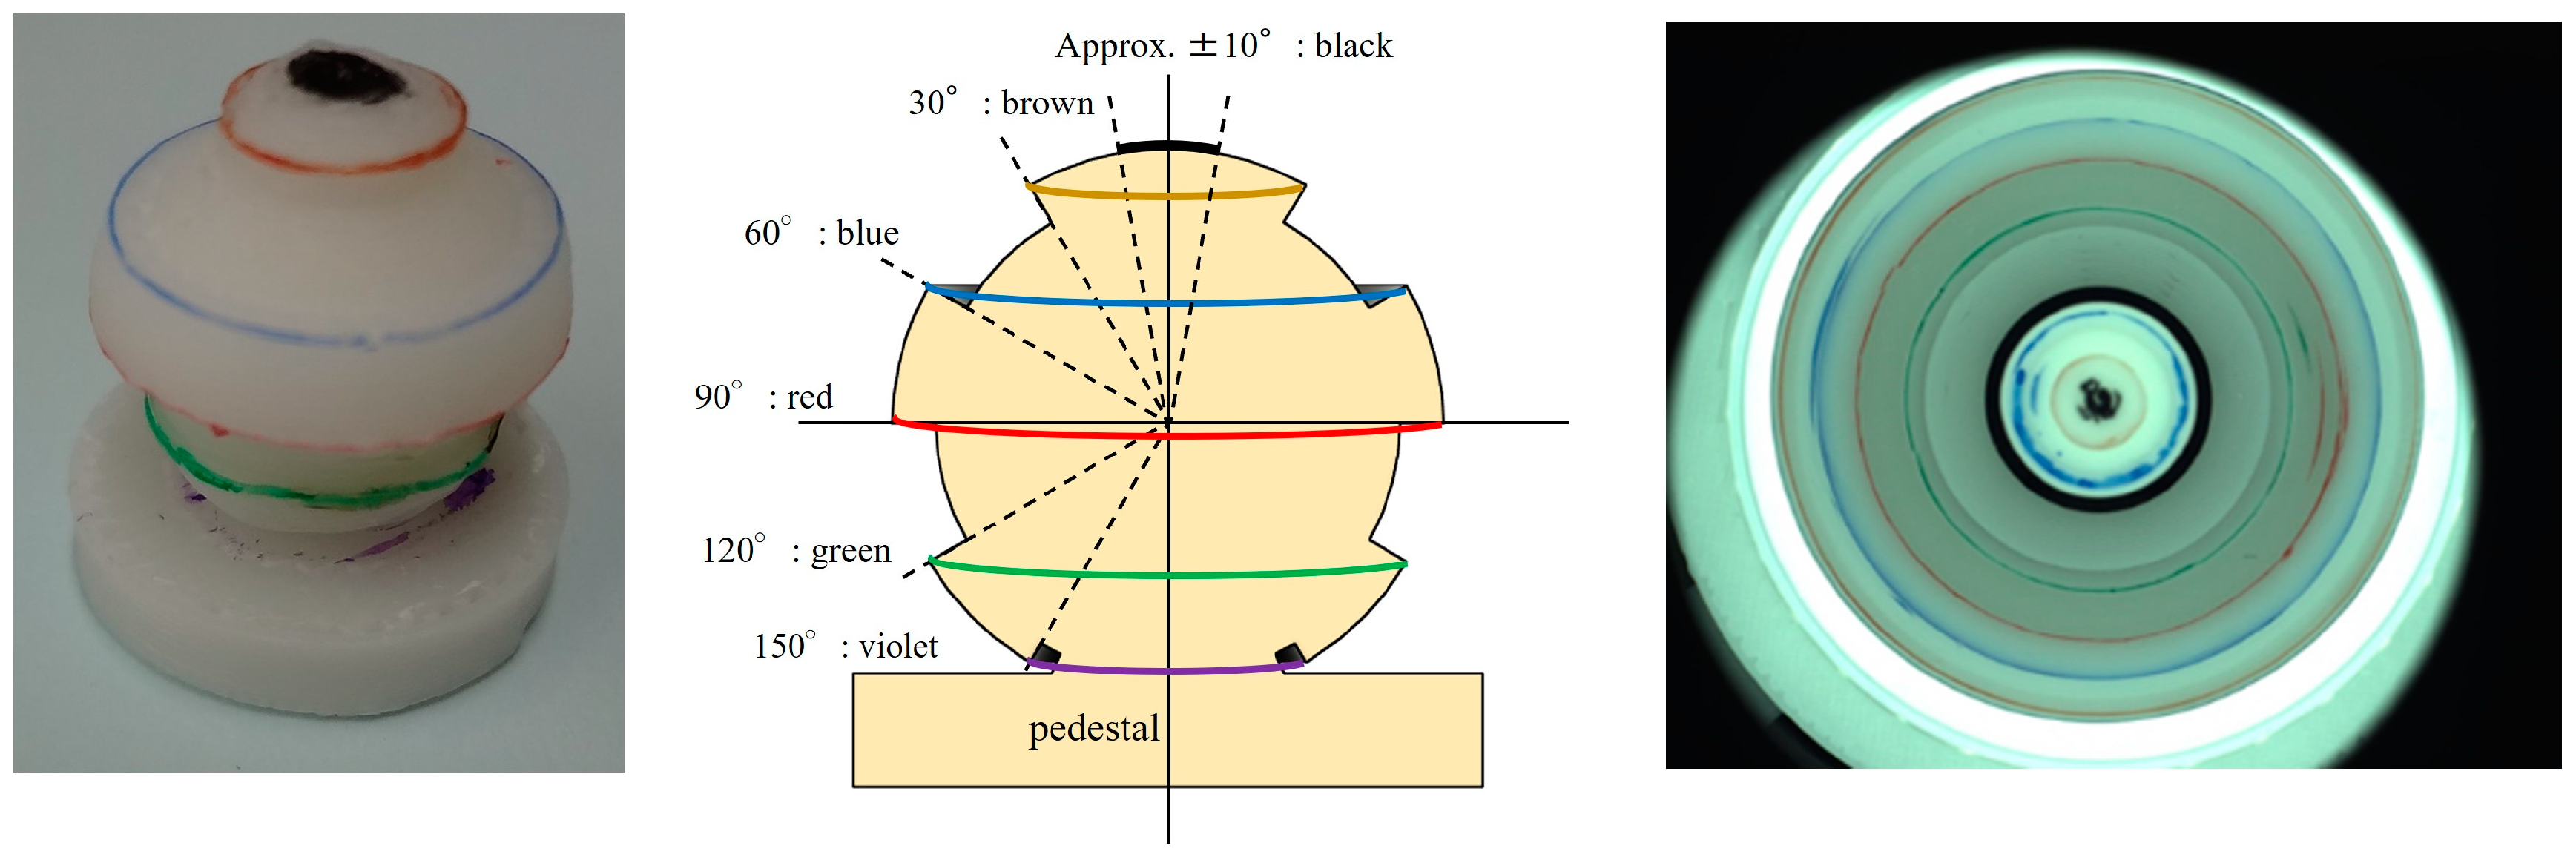
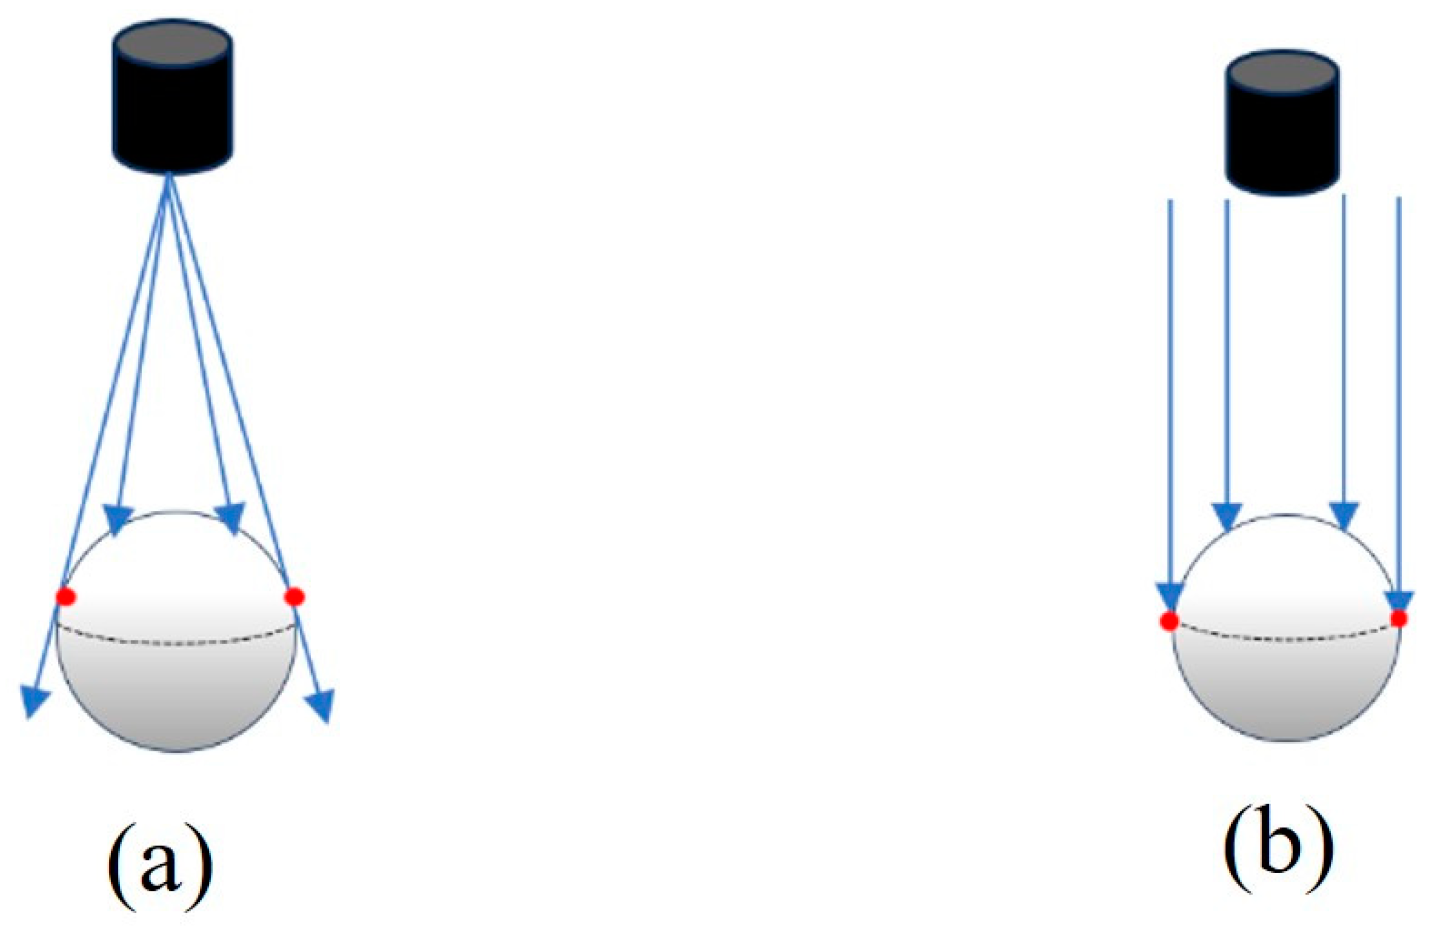
2.1. Principle of Full Expansion of Steel Ball Surface
2.2. Basic Principle of Image Difference
2.2.1. Background Difference Method
2.2.2. Adjacent Frame Difference Method
2.2.3. Adaptive Threshold Method
3. The ACID-Based Steel Ball Surface Defect Detection Method
3.1. Full Expansion of Steel Ball Surface Based on Axial Cone Mirror
3.2. Surface Defect Detection of Steel Balls Based on Improved Image Difference
- (a)
- Background modeling
- (b)
- Acquisition of adaptive threshold and defect detection
4. Experimental Results and Analysis
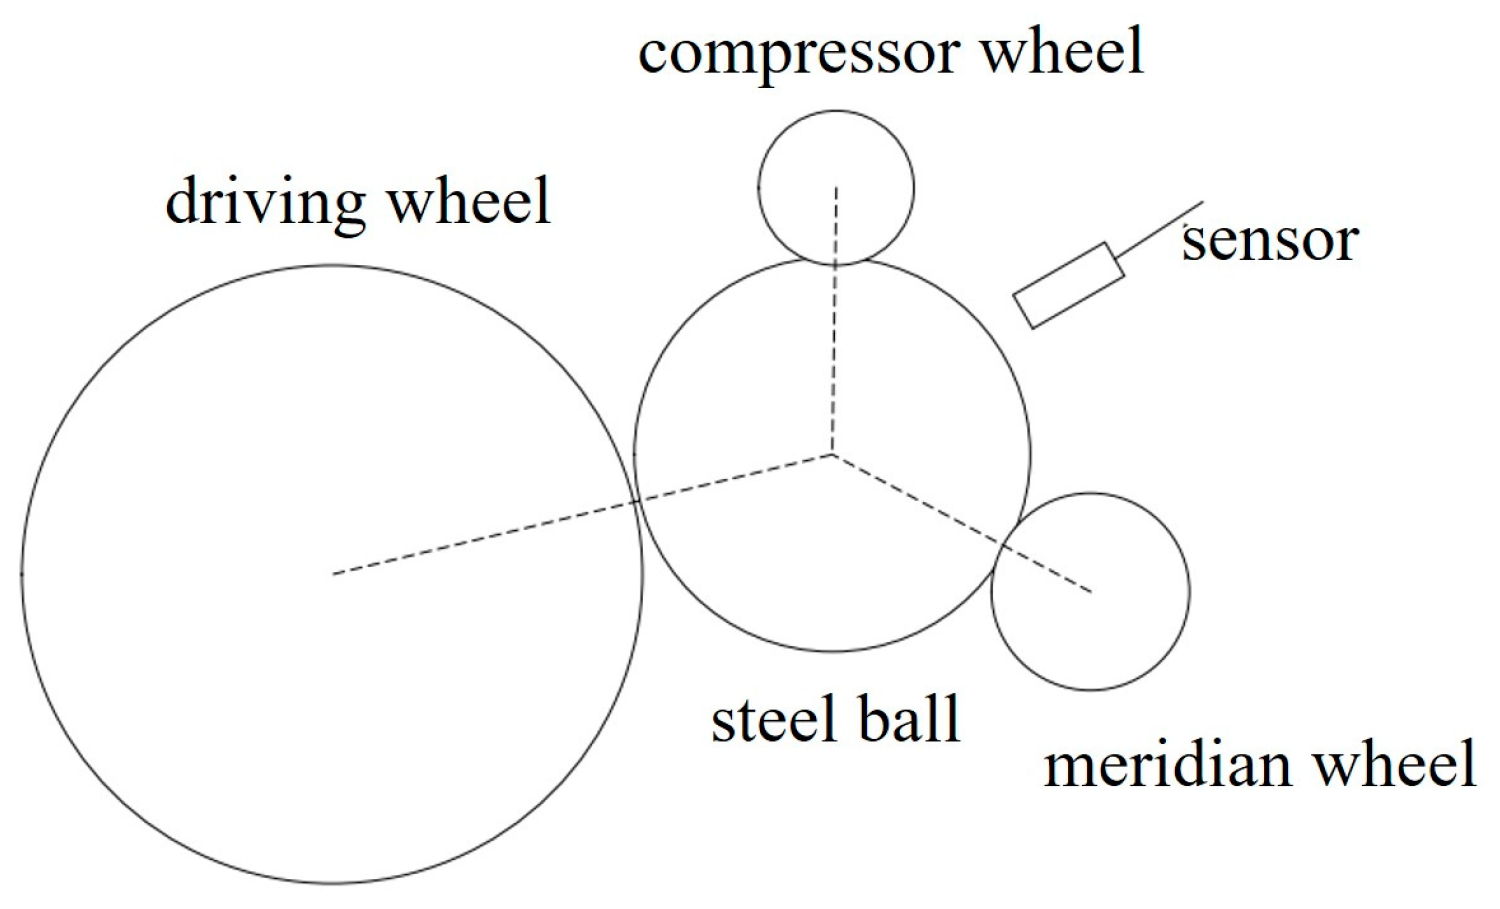
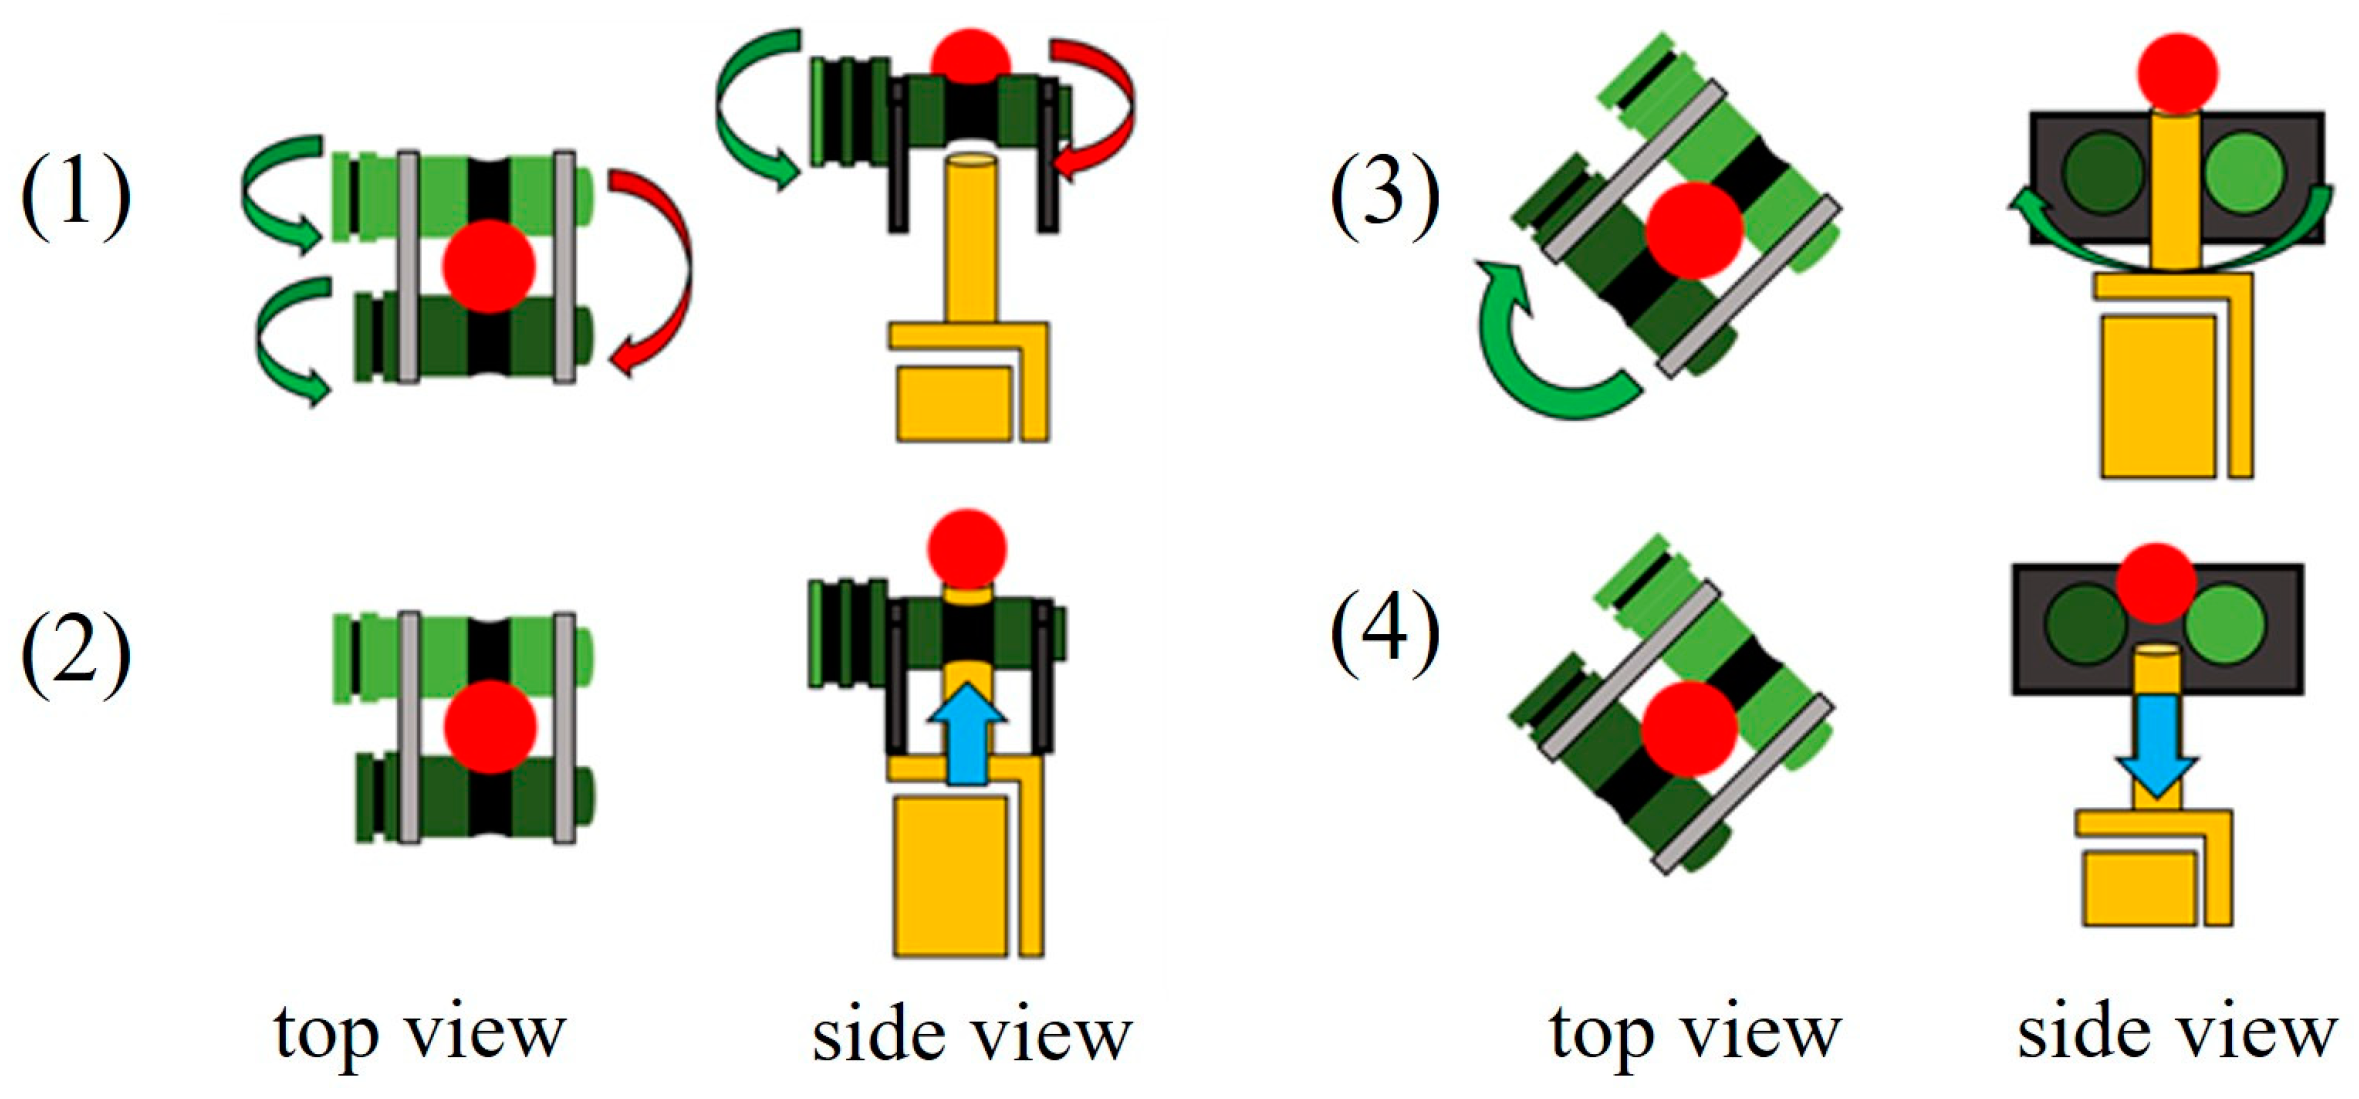
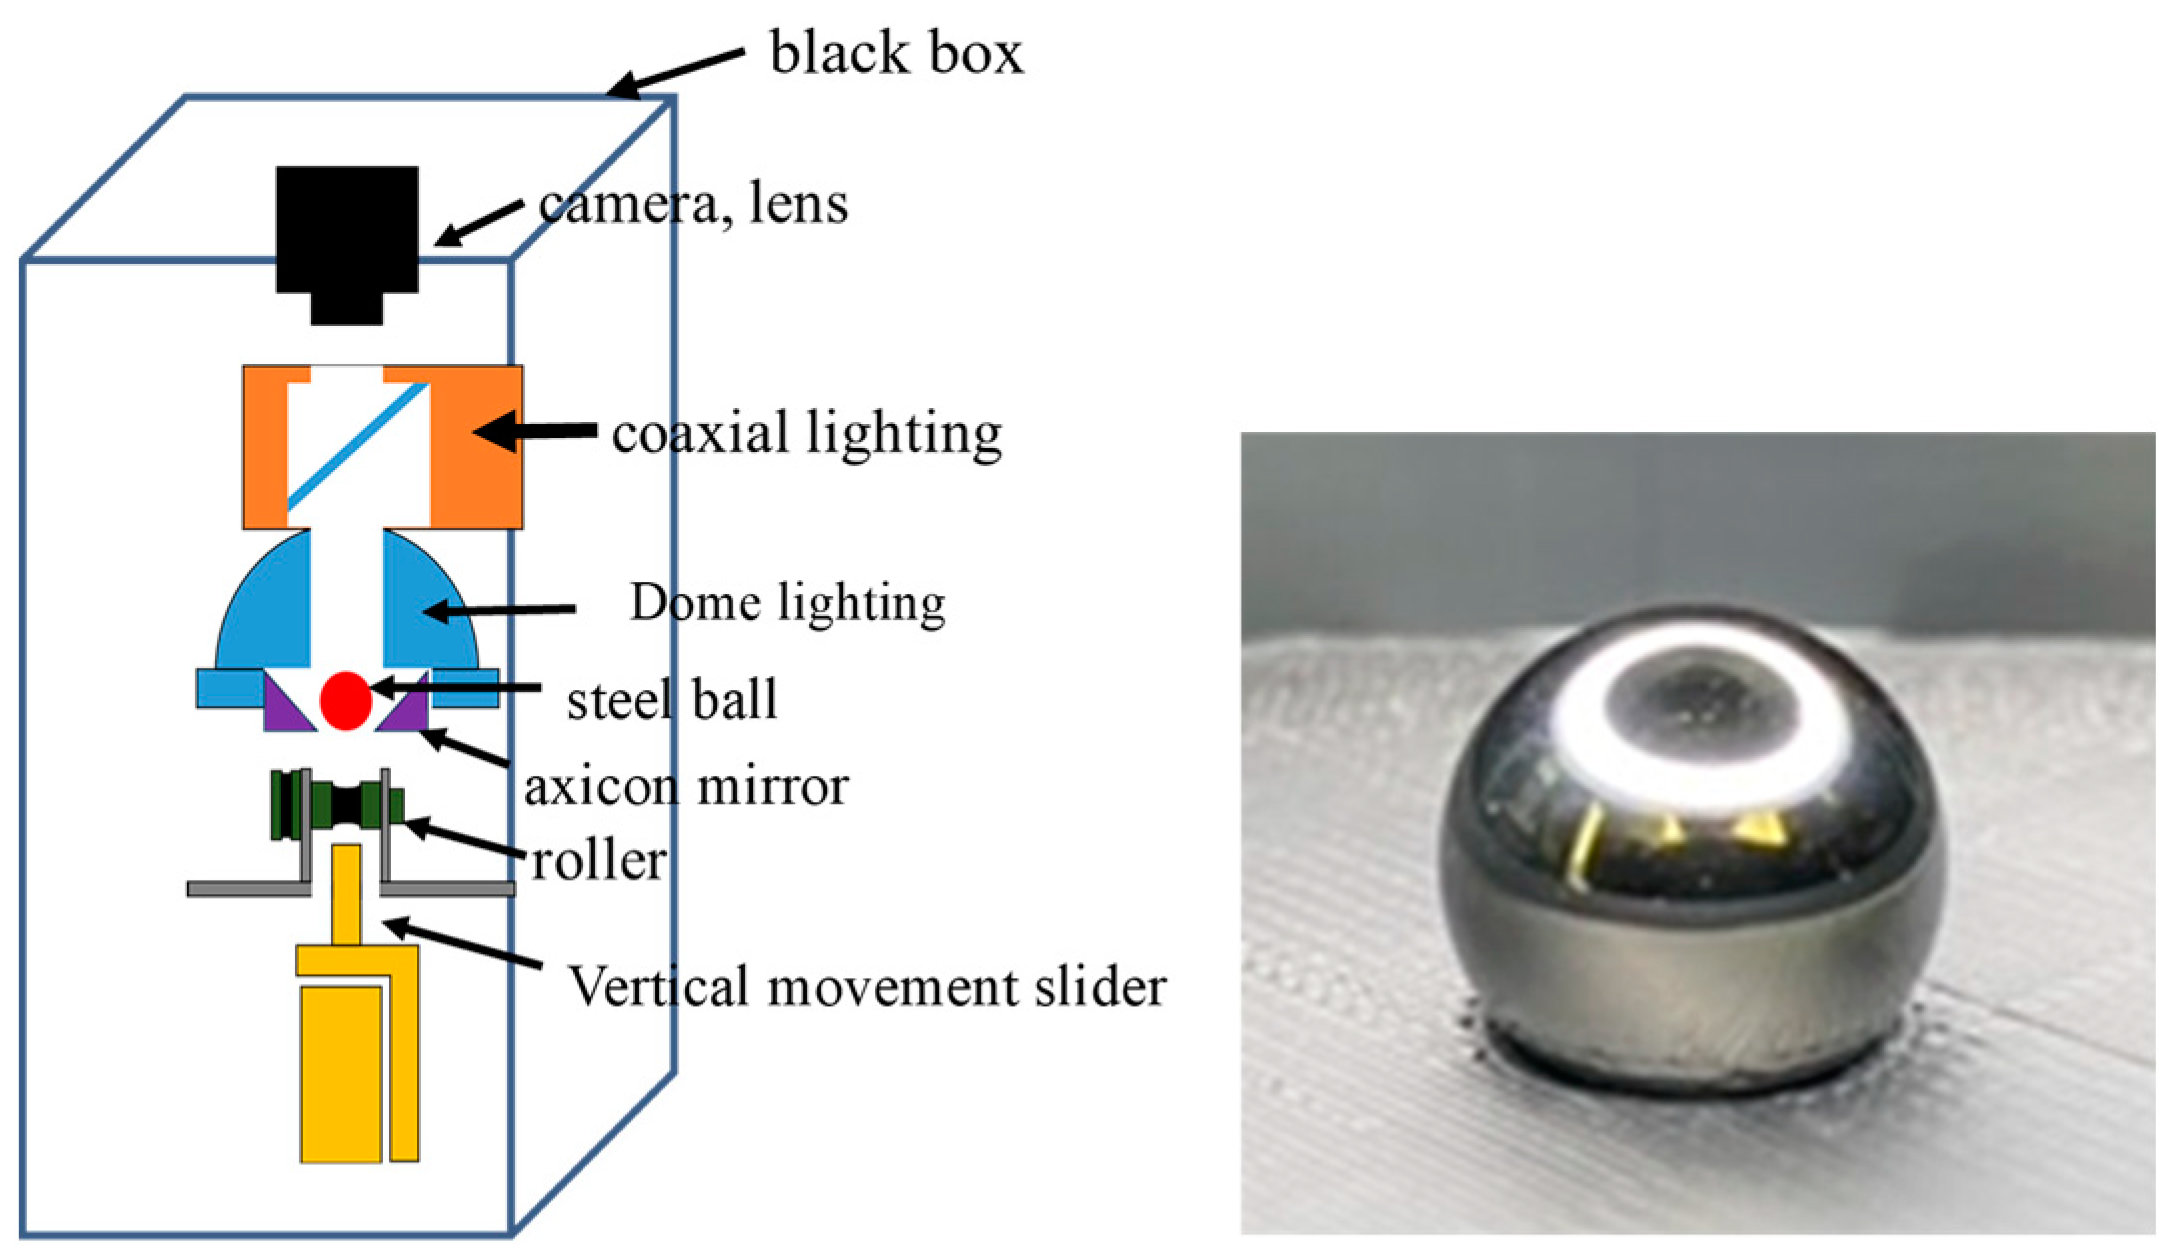
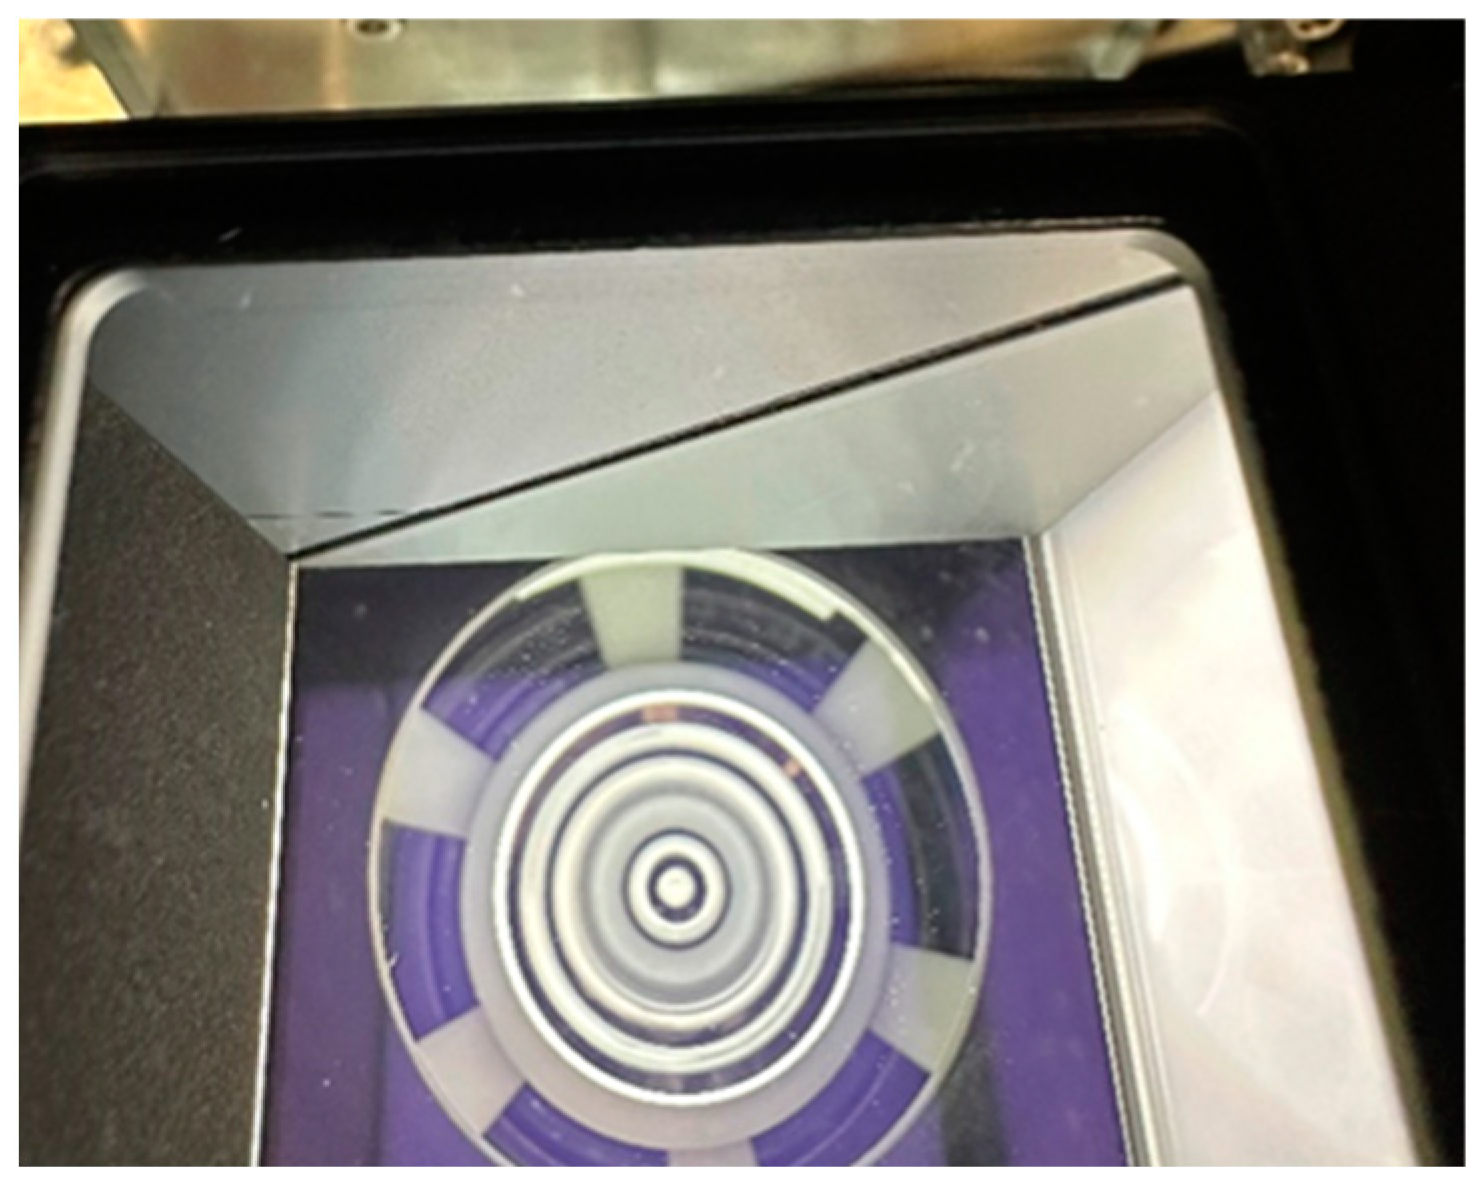
4.1. Steel Ball Surface Image Acquisition Platform Construction
- (1)
- Imaging system: The system is primarily composed of a camera and a lens. Telecentric lenses are often used in visual inspection because they can capture distortion-free images, but they have the disadvantage of a narrower shooting range. In this study, a normal lens is used to capture both the surface of the ball and the surface of the axial lens. Figure 8 shows the difference between the normal lens and the telecentric lens.
- (2)
- Illumination system: The platform is equipped with two types of lighting: dome lighting and coaxial lighting. Dome lighting illuminates the entire surface of the dome uniformly, but it is supplemented by coaxial lighting to illuminate the upper area of the dome due to shadows on the top caused by the holes in the camera position. The combination of the two illumination methods ensures that the surface of the steel ball is uniformly and fully illuminated, avoiding the detection of blind spots due to uneven lighting. Figure 9 shows the results of the different illumination methods: when only the dome lighting is used (Figure 9a), the upper part of the steel ball is dark; when only the coaxial lighting is used (Figure 9b), only the upper part is illuminated; and when the two types of illumination are used at the same time (Figure 9c), the entire steel ball is illuminated.
- (3)
- Mechanical transmission and surface expansion system: The mechanical transmission component mainly consists of a lifting mechanism and a vertical moving slider, which allows precise adjustment of the distance between the steel ball and the lens, ensuring optimal image focus and clarity. Additionally, the equipment’s position can be flexibly adjusted, enabling effective detection of steel balls of varying sizes. The surface expansion system comprises an axicon mirror and a hollow turntable. Through the optical reflection of the axicon mirror, the three-dimensional curved surface of the steel ball is transformed into a two-dimensional plane.
- (4)
- Optical Isolation System: The optical isolation system is primarily composed of a detection black box and a light source adjustment device. Due to the high reflectivity of the steel ball’s surface, the black box encloses the platform to prevent interference from external light sources. By adjusting the intensity of the light source, the reflection spots on the steel ball’s surface are minimized, thereby enhancing image quality and improving the accuracy of detection [28].
4.2. Steel Ball Surface Image Acquisition
4.3. Detection of Surface Defects on Steel Balls
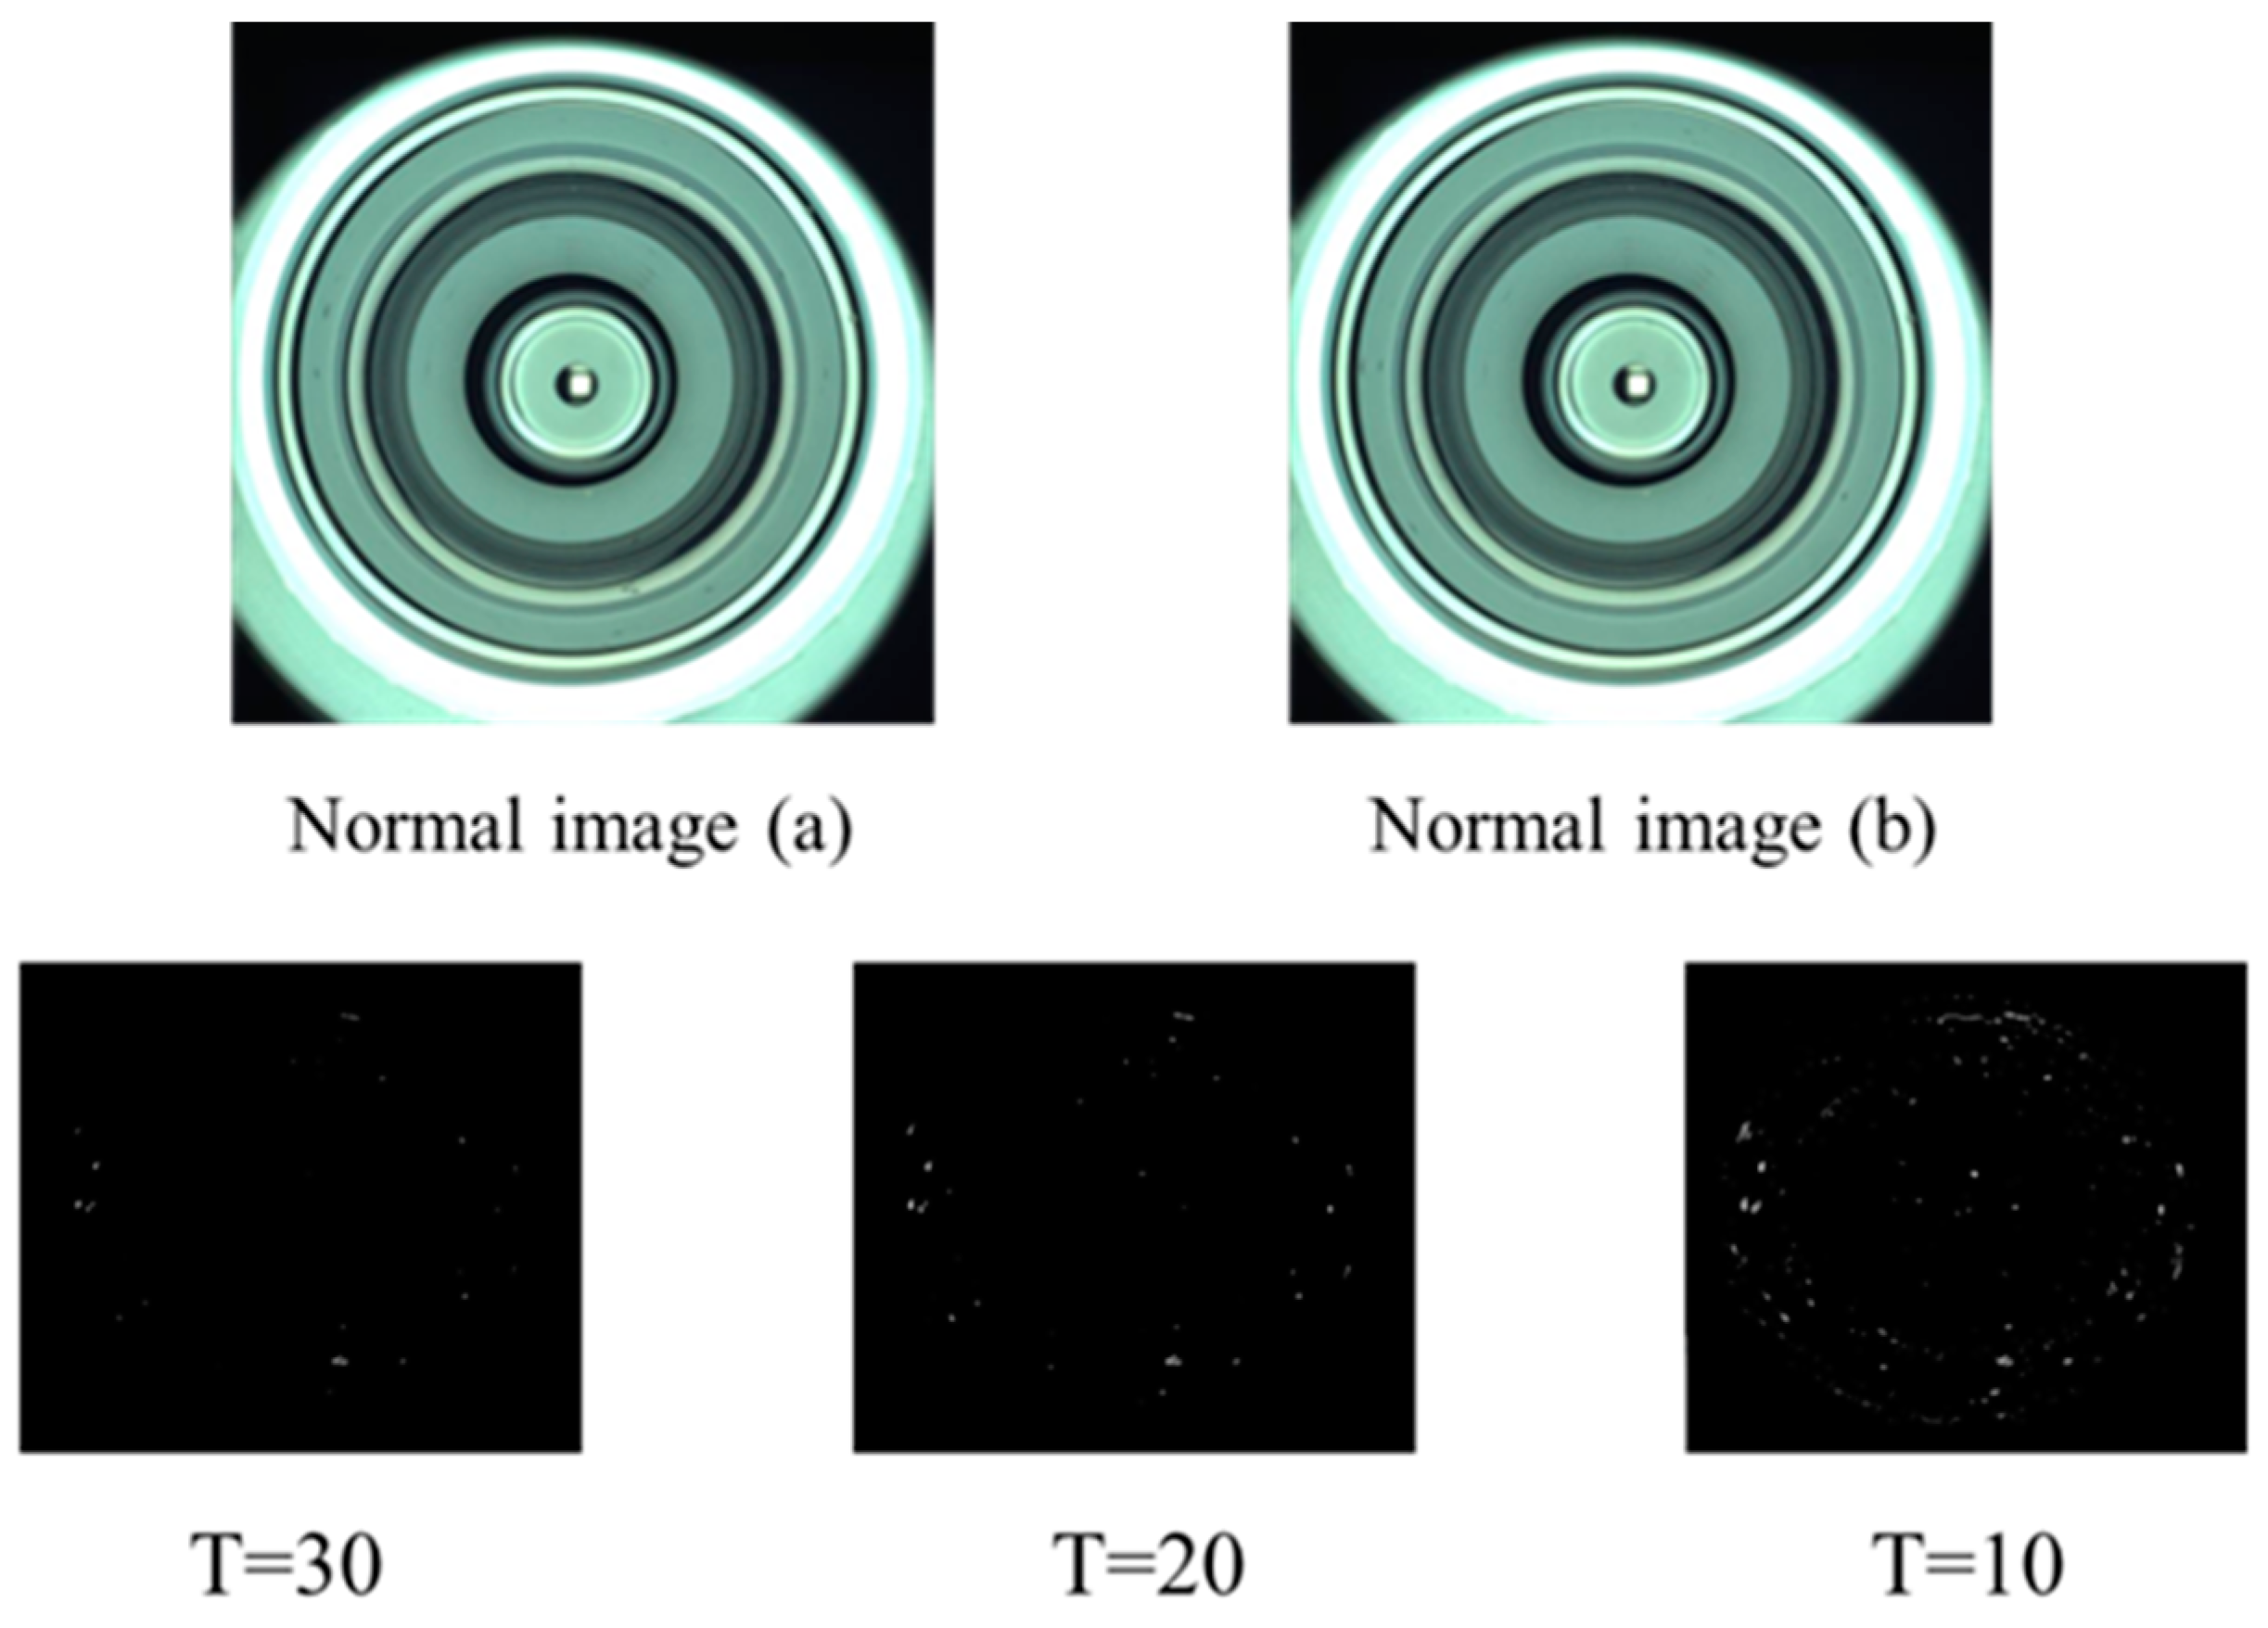
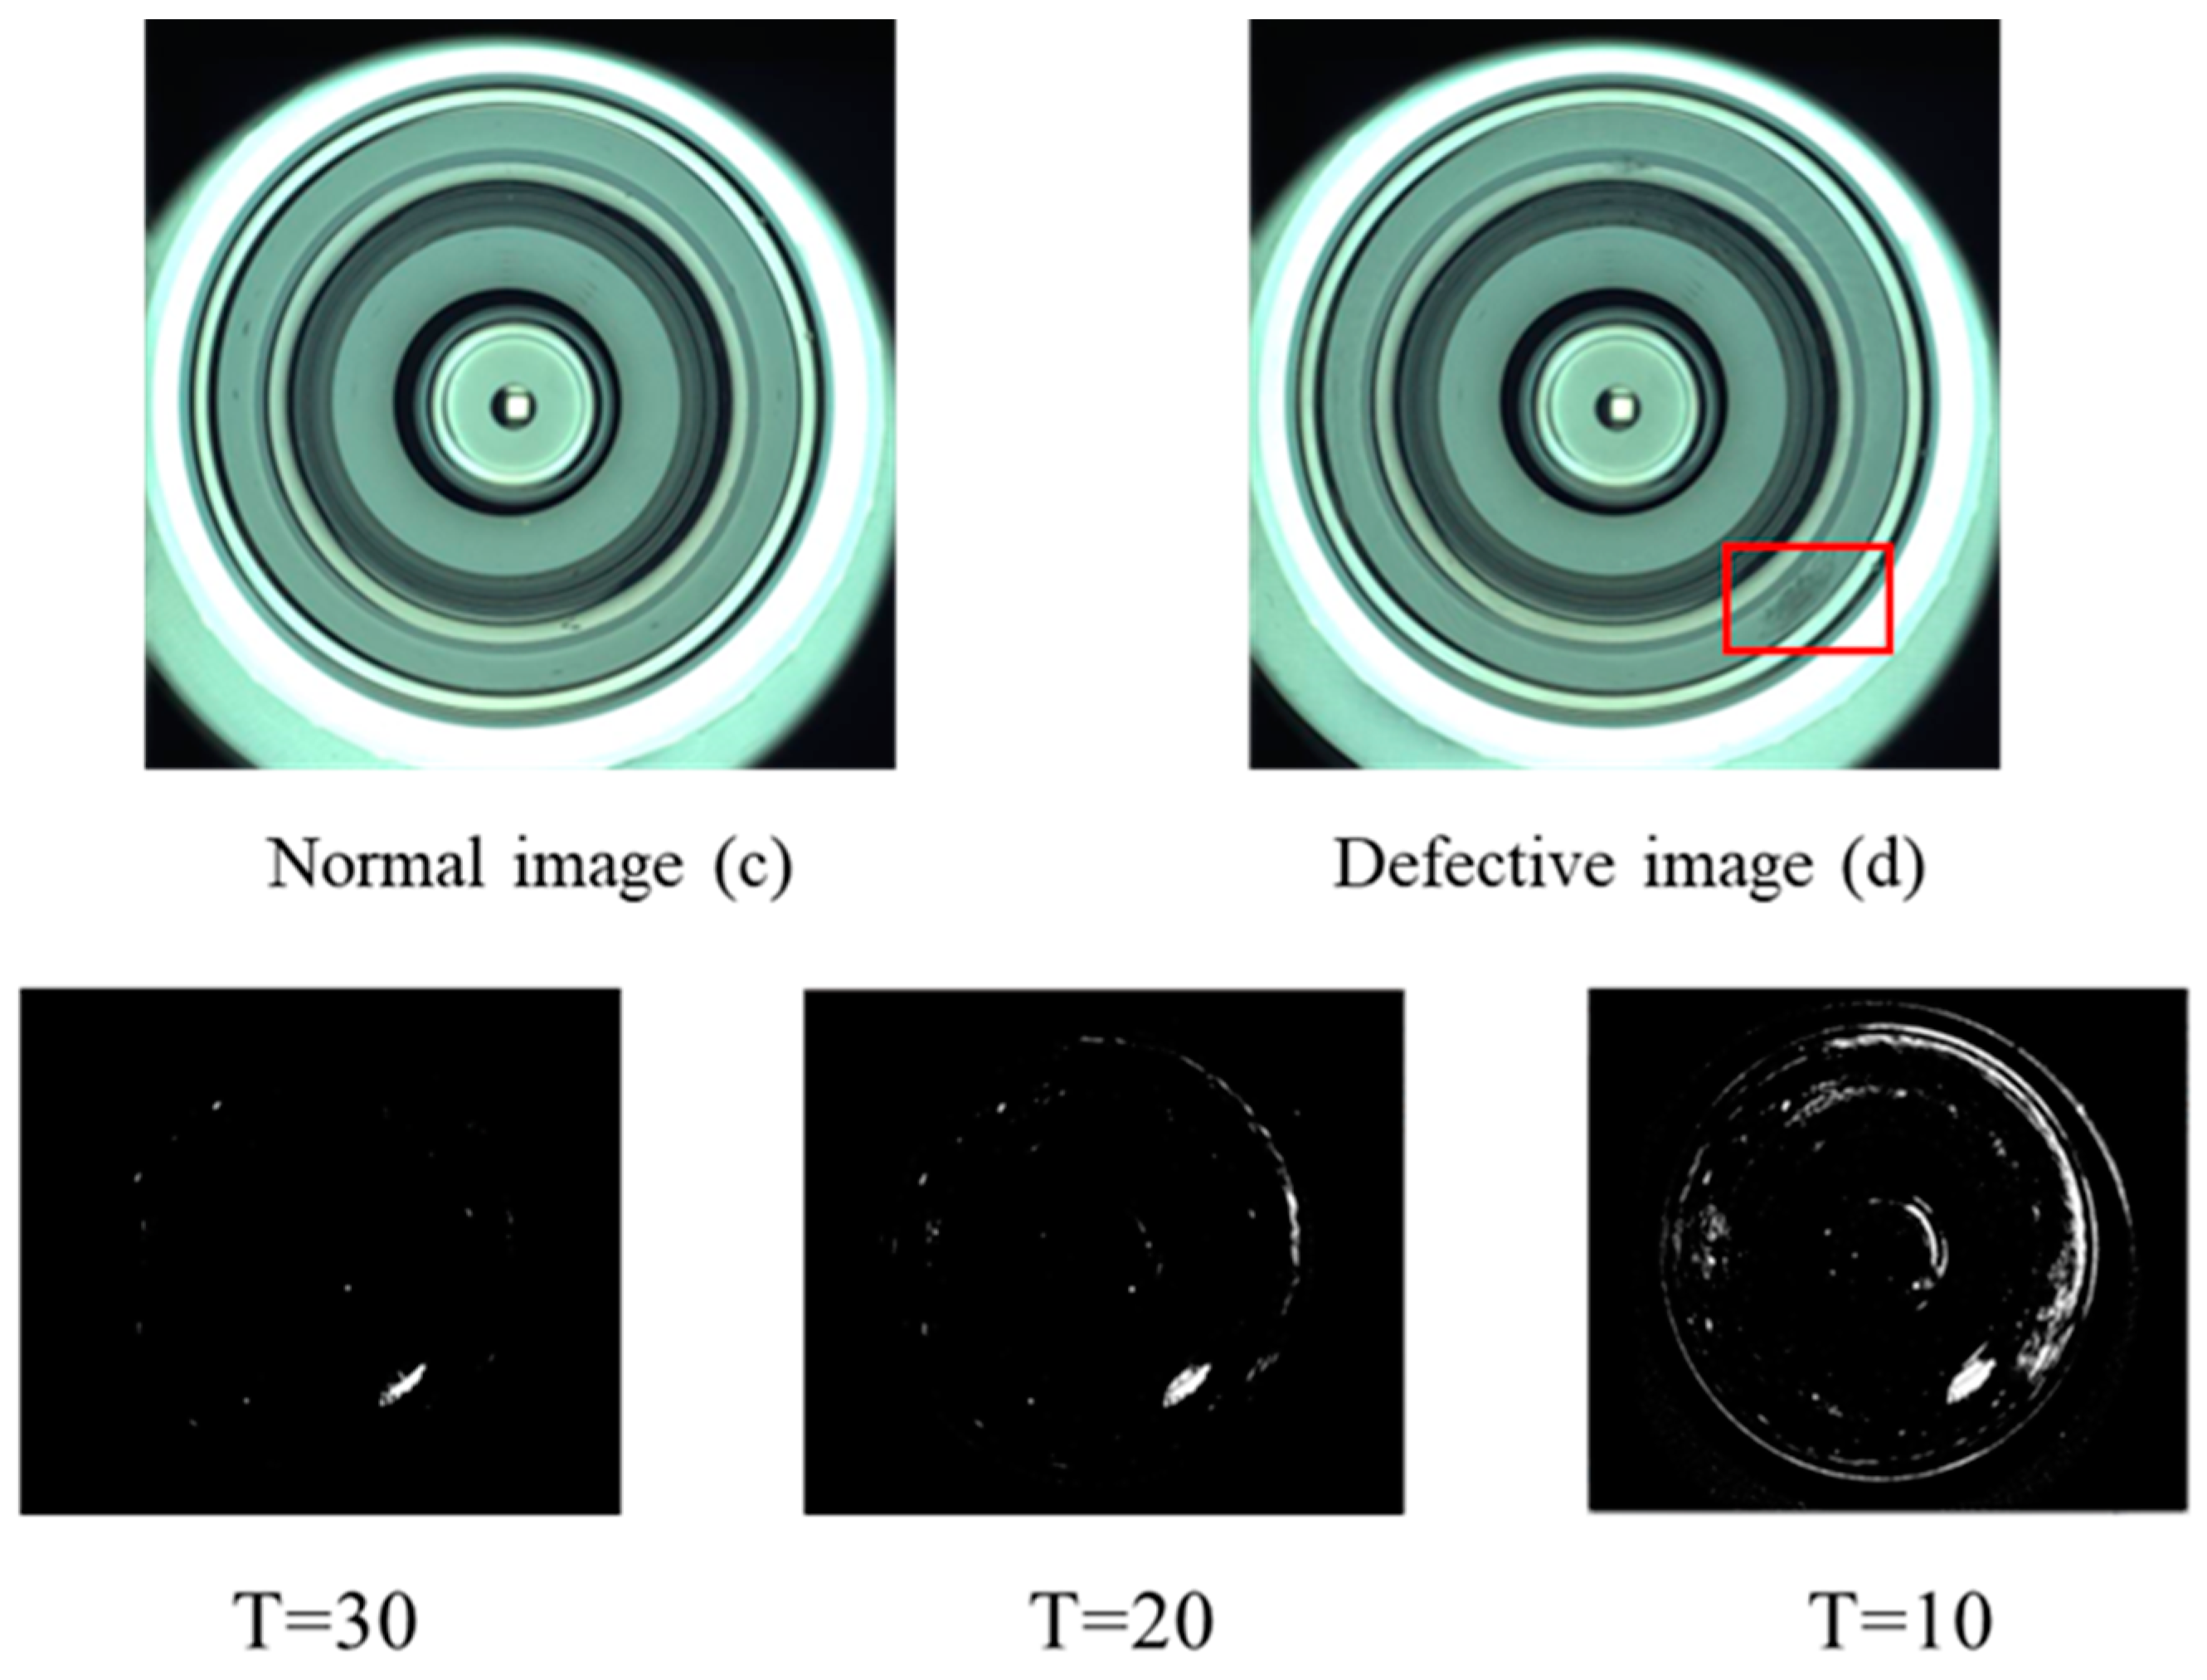
4.3.1. Defect Detection Based on Traditional Background Difference
- (1)
- Comparison of two normal images
- (2)
- Comparison of normal image and defective image
4.3.2. Defect Detection Based on Improved Image Difference
- (1)
- Background modeling
- (2)
- Defect detection
4.3.3. Analysis and Discussion
5. Conclusions
- This paper introduces a novel application of the axial cone mirror’s optical reflection principle to achieve a rapid and comprehensive unfolding of the three-dimensional surface of steel balls into two-dimensional images, and the complete surface image can be obtained in only two shots. Compared with the traditional unfolding method that uses rollers to capture images one by one (requiring 32 images to cover the entire surface), this method simplifies the acquisition process, significantly enhances detection efficiency, reduces equipment wear, and provides greater stability and adaptability.
- The innovative use of adaptive thresholding and adjacent frame difference techniques in this method creates a more efficient and lightweight detection process, which realizes the lightweight of the detection process. The method can automatically adapt to different lighting conditions and defect types, reduce noise interference, and ensure stability and high-precision detection in complex environments. The accuracy rates for detecting cluster, scratch, and stain reach 98%, 96%, and 98%, respectively.
- The methodology presented within this paper holds broad potential for practical industrial applications: the detection efficiency and applicability of the system are significantly improved by the combination of axial cone mirror expansion and improved image difference techniques. The method is not only applicable to defect detection on the surface of steel balls, but also provides a reference and technical basis for defect detection on other complex curved structures. In the future, we will leverage generative AI (e.g., GANs) and data augmentation [30,31] to create high-quality synthetic images, enhancing system robustness and adaptability to diverse defects and complex environments.
- This study has limitations when applied to different sizes of steel balls. Future research will consider adjusting the lens parameters and unfolding algorithms to accommodate different sizes. Integration with digital twin technology will also be explored to enable real-time monitoring and feedback in the manufacturing environment to further improve the intelligence and adaptability of the system [32].
Author Contributions
Funding
Data Availability Statement
Conflicts of Interest
References
- Cimpoesu, N.; Paleu, V.; Panaghie, C.; Roman, A.-M.; Cazac, A.M.; Cioca, L.-I.; Bejinariu, C.; Lupescu, S.C.; Axinte, M.; Popa, M.; et al. Mechanical Properties and Wear Resistance of Biodegradable ZnMgY Alloy. Metals 2024, 14, 836. [Google Scholar] [CrossRef]
- Lu, W.; Xue, J.; Pu, W.; Chen, H.; Wang, K.; Jia, R. A Calculation Method of Bearing Balls Rotational Vectors Based on Binocular Vision Three-Dimensional Coordinates Measurement. Sensors 2024, 24, 6499. [Google Scholar] [CrossRef] [PubMed]
- Zhou, H.; Dong, C.; Chen, F.; Cheng, L.; Wu, C.; Weng, H. A review of methods for detecting surface defects on steel balls. Equip. Manuf. Technol. 2018, 10, 7–11+47. [Google Scholar]
- Pan, H. Establishment of Automatic Evaluation System for Surface Quality of Steel Balls and Its Application. Ph.D. Thesis, Harbin Institute of Technology, Harbin, China, 2000. [Google Scholar]
- Tohoku Techno Arch Corporation. Non-Destructive Testing Equipment for Spheres. Japan Patent PA_2000398156, 3 April 2003.
- Kakimoto, A. Detection of surface defects on steel ball bearings in production process using a capacitive sensor. Measurement 1996, 17, 51–57. [Google Scholar] [CrossRef]
- Amatsuji Steel Ball Mfg. Co. Laser Type Steel Ball Appearance Inspection System. Japan Patent PA_200816442, 17 July 2008.
- Kawasaki, K. Automatic Ultrasonic Ball Inspection Method and Apparatus. Method and Apparatus for Automatic Inspection of Balls by Ultrasonic Flaw Detection. Japan Patent PA_201012762, 10 June 2010. [Google Scholar]
- Song, X. Surface Defect Detection of Bearing Steel Balls Based on Machine Vision. Master’s Thesis, Henan University of Science and Technology, Luoyang, China, 2009. [Google Scholar]
- Li, L. Research on the Key Technology of Rapid Detection of Highly Reflective Spherical Defects Based on Vision. Ph.D. Thesis, Tianjin University, Tianjin, China, 2013; pp. 1–5. [Google Scholar]
- Song, Y. Research on Streak Detection Method for Highly Reflective Spherical Surface Defects. Master’s Thesis, Tianjin University, Tianjin, China, 2017; pp. 1–4. [Google Scholar]
- Papacharalampopoulos, A.; Tzimanis, K.; Sabatakakis, K.; Stavropoulos, P. Deep Quality Assessment of a Solar Reflector Based on Synthetic Data: Detecting Surficial Defects from Manufacturing and Use Phase. Sensors 2020, 20, 5481. [Google Scholar] [CrossRef] [PubMed]
- Stavropoulos, P.; Papacharalampopoulos, A.; Petridis, D. A vision-based system for real-time defect detection: A rubber compound part case study. Procedia CIRP 2020, 93, 1230–1235. [Google Scholar] [CrossRef]
- Li, L.; Ren, T.-M.; Feng, M. Research on surface defect identification of steel balls based on improved K-CV parameter optimization support vector machine. Adv. Mech. Eng. 2023, 15, 16878132231218586. [Google Scholar] [CrossRef]
- Pu, H.M.; Wang, Z.; Kang, Y.H. An orthogonal clamping method and mechanism for spiral full unfolding of steel balls. China Mech. Eng. 2019, 30, 2010–2015. [Google Scholar]
- Zhao, Y.-L.; Wang, S.-Y.; Bao, Y.-D.; Xiang, J.-Z. Design and simulation of full surface unfolding mechanism of steel ball. J. Harbin Inst. Technol. 2017, 22, 9–14. [Google Scholar] [CrossRef]
- Xiang, J.; Zhao, C.; Zhao, Y.; Tan, Y.; Jiang, C.; Deng, J.; Zhang, S.; Hu, D.; Yan, Z. Effective area analysis of image-based steel ball defect detection. J. Harbin Inst. Technol. 2017, 22, 65–69. [Google Scholar] [CrossRef]
- Kawabata, O.; Ukita, H. Investigation of appearance inspection method for all surfaces of steel balls. In Proceedings of the Dynamic Image Processing Application Workshop (DIA2023), Toyama, Japan, 3–4 March 2023; pp. 66–70. [Google Scholar]
- Garcia-Garcia, B.; Bouwmans, T.; Silva, A.J.R. Background subtraction in real applications: Challenges, current models and future directions. Comput. Sci. Rev. 2020, 35, 100204. [Google Scholar] [CrossRef]
- Cermelli, F.; Mancini, M.; Bulo, S.R.; Ricci, E.; Caputo, B. Modeling the background for incremental learning in semantic segmentation. In Proceedings of the IEEE/CVF Conference on Computer Vision and Pattern Recognition, Seattle, WA, USA, 13–19 June 2020; pp. 9233–9242. [Google Scholar]
- Chen, J.; Wu, Q.; Liu, D.; Xu, T. Foreground-background imbalance problem in deep object detectors: A review. In Proceedings of the 2020 IEEE Conference on Multimedia Information Processing and Retrieval (MIPR), Shenzhen, China, 6–8 August 2020; IEEE: Piscataway, NJ, USA, 2020; pp. 285–290. [Google Scholar]
- Meier, T.; Ngan, K.N. Automatic segmentation of moving objects for video object plane generation. IEEE Trans. Circuits Syst. Video Technol. 1998, 8, 525–538. [Google Scholar] [CrossRef]
- Liu, J.; Huang, Y.; Zhang, M.; Zhou, S.; Nie, C.; Li, M.; Zhang, L. Detecting Steam Leakage in Nuclear Power Systems Based on the Improved Background Subtraction Method. Processes 2024, 12, 1538. [Google Scholar] [CrossRef]
- Soeleman, M.A.; Nurhindarto, A.; Muslih, M.; Karis, W.M.; Muljono, M.; Zami, F.A.; Pramunendar, R.A. Adaptive threshold for moving objects detection using gaussian mixture model. TELKOMNIKA Telecommun. Comput. Electron. Control 2020, 18, 1122–1129. [Google Scholar] [CrossRef]
- Barron, J.T.A. Generalization of Otsu’s method and minimum error thresholding. In Computer Vision—Proceedings of the ECCV 2020 16th European Conference, Glasgow, UK, 23–28 August 2020; Proceedings, Part V 16; Springer International Publishing: Cham, Switzerland, 2014; pp. 455–470. [Google Scholar]
- Laiginhas, R.; Cabral, D.; Falcão, M. Evaluation of the different thresholding strategies for quantifying choriocapillaris using optical coherence tomography angiography. Quant. Imaging Med. Surg. 2020, 10, 1994–2005. [Google Scholar] [CrossRef] [PubMed]
- Jiang, M.-H.; Fu, L.-H.; Wang, Z.; Song, Y.-H. A new method for specular curved surface defect inspection-based on reflected pattern integrity. J. Meas. Sci. Instrum. 2016, 7, 221–228. [Google Scholar] [CrossRef]
- Liu, Q.; Zhang, J.; Huang, J. Detection and classification of steel ball surface defects based on machine vision. Bearing 2013, 10, 44–48. [Google Scholar] [CrossRef]
- Qian, X.; Gan, X.; Liu, X.; Lu, Y.; Zhang, X.; Ju, A.; Ma, X. Neighbourhood denoising and image differencing for detecting surface defects in carbon fibre tow spreading. J. Donghua Univ. (Nat. Sci. Ed.) 2024, 1–6. [Google Scholar] [CrossRef]
- Stavropoulos, P.; Papacharalampopoulos, A.; Sabatakakis, K. Online Quality Inspection Approach for Submerged Arc Welding (SAW) by Utilizing IR-RGB Multimodal Monitoring and Deep Learning. In Flexible Automation and Intelligent Manufacturing: The Human-Data-Technology Nexus; Kim, K.-Y., Monplaisir, L., Rickli, J., Eds.; Springer International Publishing: Cham, Switzerland, 2023; pp. 160–169. [Google Scholar]
- Lian, J.; Jia, W.; Zareapoor, M.; Zheng, Y.; Luo, R.; Jain, D.K.; Kumar, N. Deep-Learning-Based Small Surface Defect Detection via an Exaggerated Local Variation-Based Generative Adversarial Network. IEEE Trans. Ind. Inform. 2020, 16, 1343–1351. [Google Scholar] [CrossRef]
- Stavropoulos, P.; Papacharalampopoulos, A.; Sabatakakis, K.; Mourtzis, D. Metamodelling of Manufacturing Processes and Automation Workflows towards Designing and Operating Digital Twins. Appl. Sci. 2023, 13, 1945. [Google Scholar] [CrossRef]


| Name | Model | Source |
|---|---|---|
| Camera | STC-MCS500U3V | Omron Sentech (Kyoto, Japan) |
| Lens | SV3514H | VS Technology (Kyoto, Japan) |
| Coaxial lighting | FA OPX-S50W2 | Optex FA (Kyoto, Japan) |
| Dome lighting | FA OPD-S100W | Optex FA (Kyoto, Japan) |
| Axial cone mirror | Customization | VS Technology (Kyoto, Japan) |
| Lifting mechanism | EC-T3L-30-1-1-CJL | IAI (Shizuoka, Japan) |
| Vertical moving slider | EC-TW4L-50-S1-B | IAI (Shizuoka, Japan) |
| Area Threshold | ||||
|---|---|---|---|---|
| 100 | 150 | 200 | ||
| Binarization threshold | 30 | 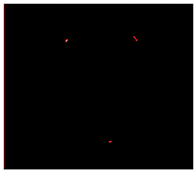 (1) | 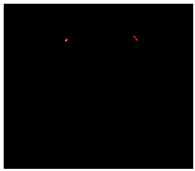 (2) |  (3) |
| 20 |  (4) | 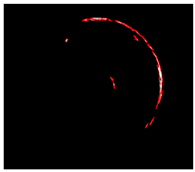 (5) | 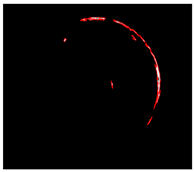 (6) | |
| 10 | 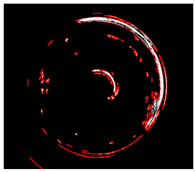 (7) | 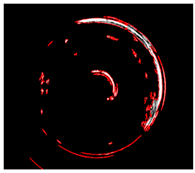 (8) | 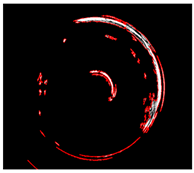 (9) | |
| Area Threshold | ||||
|---|---|---|---|---|
| 100 | 150 | 200 | ||
| Binarization threshold | 30 |  (10) | 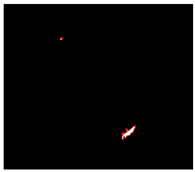 (11) |  (12) |
| 20 | 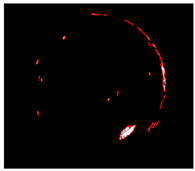 (13) | 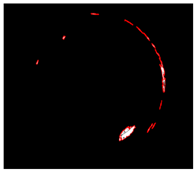 (14) |  (15) | |
| 10 | 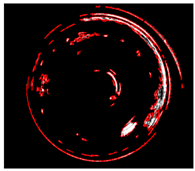 (16) | 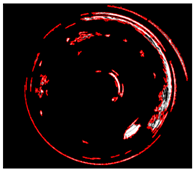 (17) | 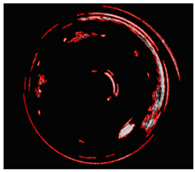 (18) | |
| Defect Type | Sample Size | Missed Detections (Improved Method) | Detection Rate (Improved Method, %) | Missed Detections (Traditional Method) | Detection Rate (Traditional Method, %) |
|---|---|---|---|---|---|
| Cluster | 50 | 1 | 98% | 7 | 86% |
| Scratch | 50 | 2 | 96% | 10 | 80% |
| Stain | 50 | 1 | 98% | 8 | 84% |
| Sample Image | Conventional Method | Improved Method | |
|---|---|---|---|
| Cluster |  |  |  |
| Scratch | 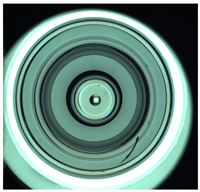 | 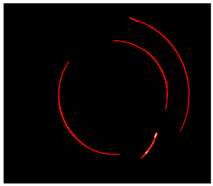 |  |
| Stain | 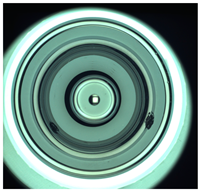 |  | 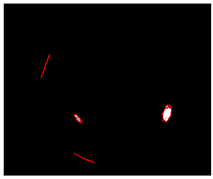 |
Disclaimer/Publisher’s Note: The statements, opinions and data contained in all publications are solely those of the individual author(s) and contributor(s) and not of MDPI and/or the editor(s). MDPI and/or the editor(s) disclaim responsibility for any injury to people or property resulting from any ideas, methods, instructions or products referred to in the content. |
© 2024 by the authors. Licensee MDPI, Basel, Switzerland. This article is an open access article distributed under the terms and conditions of the Creative Commons Attribution (CC BY) license (https://creativecommons.org/licenses/by/4.0/).
Share and Cite
Li, C.; Ni, H.; Ukida, H.; Zhang, J.; Wang, B.; Lv, S. Surface Defect Detection of Steel Balls Based on Surface Full Expansion and Image Difference. Electronics 2024, 13, 4484. https://doi.org/10.3390/electronics13224484
Li C, Ni H, Ukida H, Zhang J, Wang B, Lv S. Surface Defect Detection of Steel Balls Based on Surface Full Expansion and Image Difference. Electronics. 2024; 13(22):4484. https://doi.org/10.3390/electronics13224484
Chicago/Turabian StyleLi, Chen, Hongjun Ni, Hiroyuki Ukida, Jiaqiao Zhang, Bo Wang, and Shuaishuai Lv. 2024. "Surface Defect Detection of Steel Balls Based on Surface Full Expansion and Image Difference" Electronics 13, no. 22: 4484. https://doi.org/10.3390/electronics13224484
APA StyleLi, C., Ni, H., Ukida, H., Zhang, J., Wang, B., & Lv, S. (2024). Surface Defect Detection of Steel Balls Based on Surface Full Expansion and Image Difference. Electronics, 13(22), 4484. https://doi.org/10.3390/electronics13224484