Article

Deep Learning Assisted Diagnosis of Chronic Obstructive Pulmonary Disease Based on a Local-to-Global Framework

by
Nian Cai
1,†,
Yiying Xie
1,†,
Zijie Cai
1,
Yuchen Liang
1,
Yinghong Zhou
1,* and
Ping Wang
2
1
School of Information Engineering, Guangdong University of Technology, Guangzhou 510006, China
2
Department of Hepatobiliary Surgery, The First Affiliated Hospital of Guangzhou Medical University, Guangzhou 510120, China
*
Author to whom correspondence should be addressed.
These authors contributed equally to this work.
Electronics 2024, 13(22), 4443; https://doi.org/10.3390/electronics13224443
Submission received: 8 October 2024 / Revised: 8 November 2024 / Accepted: 11 November 2024 / Published: 13 November 2024

Abstract

:
To aid the diagnosis of chronic obstructive pulmonary disease (COPD), a local-to-global deep framework with group attentions and slice-aware loss is designed in this paper, which utilizes the chest CT sequences of the patients as the network input. To fully mine the medical hints submerged in the CT slices, two types of group attentions are designed to extract local–global features of the grouped slices. Specifically, in each group, a group local attention block (GLAB) and a group global attention block (GGAB) are designed to extract local features in the CT slices and long-range dependencies among the grouped slices. To alleviate the influence of different numbers of CT slices in the chest CT sequences for different patients, a slice-aware loss is proposed by incorporating a normalized coefficient into the cross-entropy loss. Experimental results indicate that the designed deep model performs a good COPD identification on a real COPD dataset with 96.08% accuracy, 94.12% sensitivity, 97.06% specificity, and 95.32% AUC, which is superior to some existing deep learning methods.

1. Introduction

Chronic obstructive pulmonary disease (COPD) is a common disease with the characteristics of irreversible airway obstruction, involving both the small airways (chronic obstructive bronchiolitis) and emphysema. This condition makes the air trapped in the lungs rather than fully exhaled, resulting in shortness of breath during exertion [1,2,3]. Additionally, COPD is the leading cause of death worldwide [4,5,6]. Especially, the incidence of COPD in China has continuously increased, with the number of affected people accounting for a quarter of the global COPD population [7]. CT scanning is a convenient and promising technique for early diagnosis of COPD [8,9,10]. Clinically, doctors conduct a subjective analysis on hundreds of CT scans of the COPD patient to evaluate the proportion of lesion bubbles in the lung for diagnosis, which consumes a significant amount of human and material resources [11]. Thus, computer aided diagnosis (CAD) is significant for early diagnosis of COPD with CT scanning.
Due to its data-driven ability of self-learning hierarchical features from medical images [12], deep learning has successfully been applied for COPD diagnosis. Ramadoss et al. [13] directly employed a ResNet-50 model to identify chest X-ray images with/without emphysema, which were chosen from an NIH Chest X-ray dataset. Parui et al. [14] treated each chest CT image as an individual instance and employed the VGG16 network for classification to diagnose COPD. Polat et al. [15] employed Inception-V3 to classify each segmented CT image for the diagnosis of COPD. All the above methods directly employ a deep learning network to classify each CT image for the diagnosis of COPD, which leads to the neglect of spatial information within the lesion areas of the lungs. To avoid this issue, some studies employ 2D snapshots of the 3D lung airway tree reconstructed by CT scans to train the 2D deep networks for the identification of COPD. Du et al. [16] designed a simple ensemble learning method based on three convolutional neural network (CNN) models with the same network architecture, which are utilized to separately deal with three snapshots from ventral, dorsal, and isometric views. Based on the study in [16], Wu et al. [17] employed nine-views 2D snapshots to characterize the 3D airway tree and lung field, in which three 2D snapshots in ventral, dorsal, and isometric views were for the 3D airway tree and six snapshots in front, rear, left, right, top, and bottom views were for the 3D lung field. Also, a majority voting method based on nine ResNet-26 models was utilized to identify the COPD. Ho et al. [18] performed the aided diagnosis of COPD by means of a 3D CNN, whose inputs were the parametric response mapping (PRM) visualizations of CT images of the lung. Ahmed et al. [19] extended the VoxResNet to a 3D network to analyze CT lung images for COPD diagnosis. However, these methods require substantial memory and computational power, which slows down the inferences to limit their real-time or large-scale clinical applications.
To expedite the diagnostic process for COPD, some researchers have applied deep learning to fully mine medical hints in complete CT sequence images of patients’ lungs. Xue et al. [20] proposed a multiple instance learning method to identify COPD based on CT sequence images, in which a Resnet-50 was pretrained to extract image features, followed by a two-stage attention for instance identification. Xu et al. [21] divided the lung into eight sections to randomly select a CT image from the sequence images corresponding to each section. Then, three machine learning methods, involving citation k-nearest-neighbor, multiple instance support vector machine, and expectation-maximization diverse density, were utilized to identify the COPD instances via the features of eight CT images extracted by a pretrained AlexNet. Humphries et al. [22] evenly selected 25 axial CT slices from the lung CT sequence, which were input into the deep network consisting of a CNN and a long–short-term memory (LSTM) for COPD diagnosis. Although these sequence-based deep learning methods consume less computation resources to achieve faster inferences compared to 3D methods, they only select some CT images from the sequence rather than the whole sequence images for analysis. This selection overlooks information about the edges of pulmonary alveoli and local contextual details, which will influence the subsequent medical evaluation.
To fully reveal the medical hints submerged in the CT sequence images for COPD diagnosis, all the images of the CT sequence acquired from the COPD patient are utilized for analysis in this paper. To this end, a local-to-global deep framework with group attentions and slice-aware loss is elaborately designed to evaluate the CT sequence acquired from the COPD patient, involving the stages of group local–global feature extraction, sequence global feature extraction and prediction. Specifically, in the stage of group local–global feature extraction, local lesion features in each CT image and long-range dependencies within a group of CT images are extracted by the designed group local attention block (GLAB) and group global attention block (GGAB), respectively. In the stage of sequence global feature extraction, we cascaded the BiLSTM module to capture the inherent medical correlations among the CT groups. Finally, a slice-aware loss is designed to adapt the designed model to the CT sequence with various numbers of CT images.
Summarily, several contributions are presented in this paper.
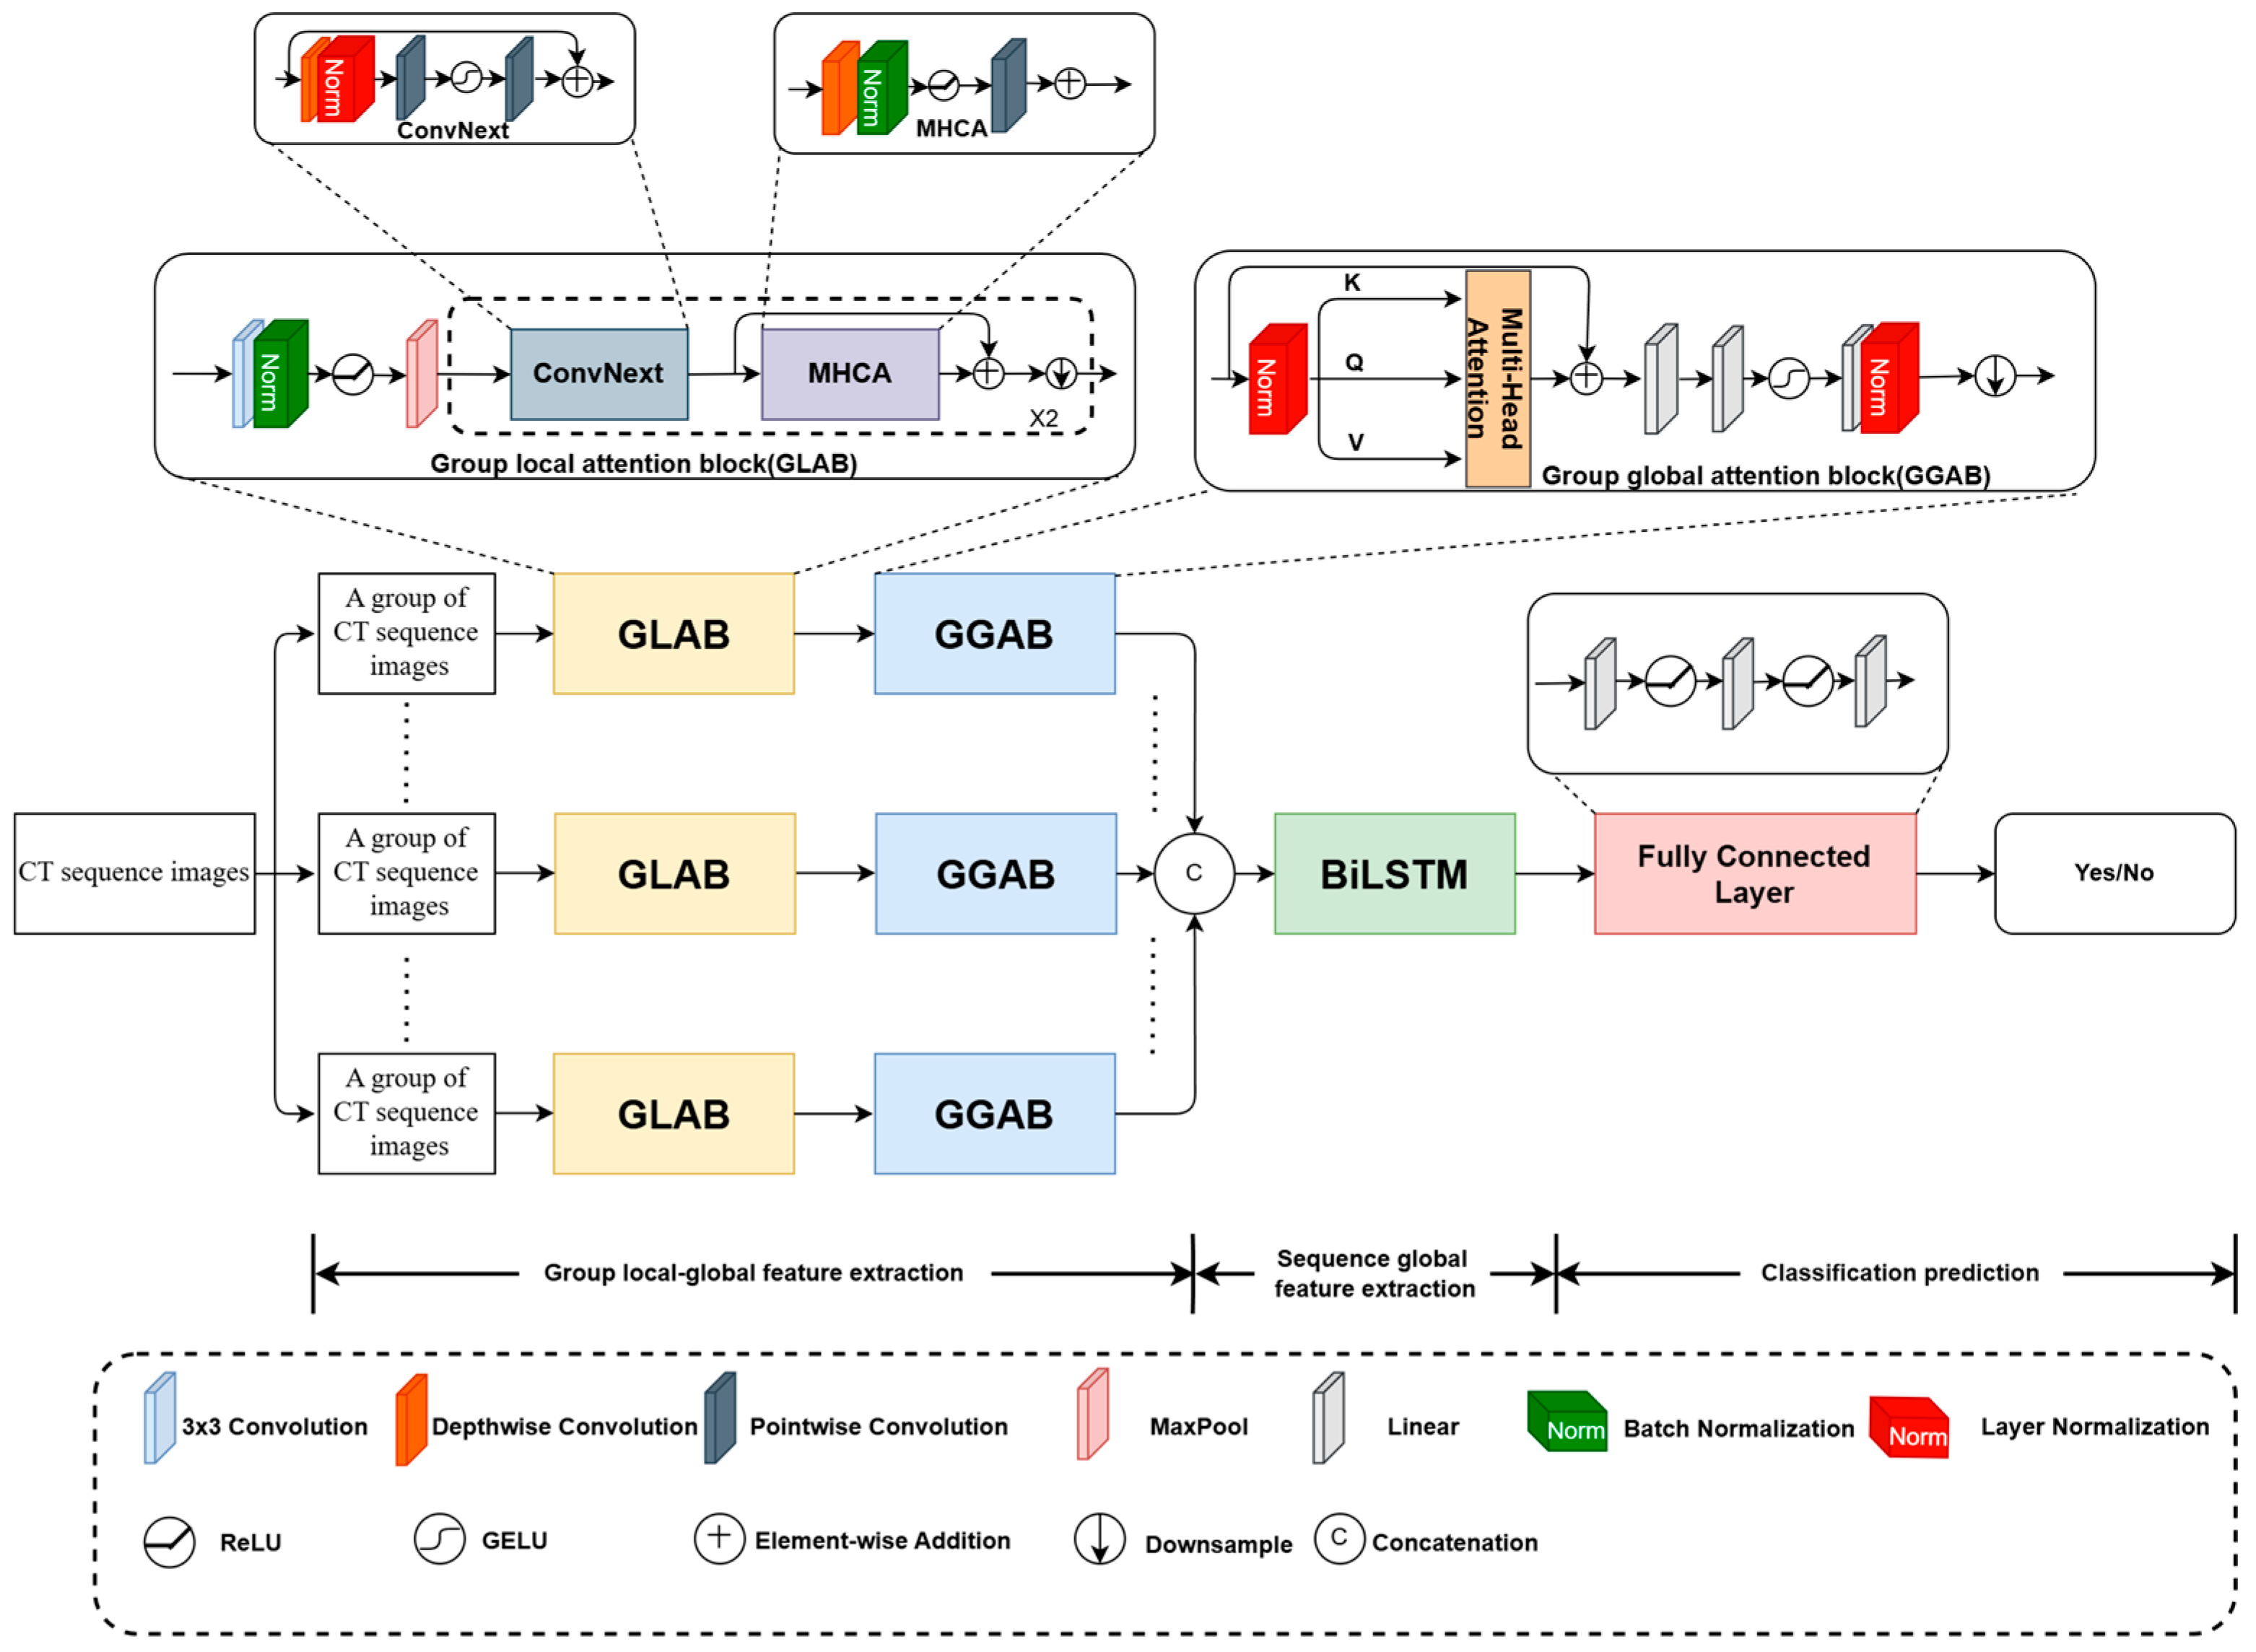
  • Previous studies selected some CT images from the whole CT sequence for COPD diagnosis, which cannot well capture the contextual details from successive CT slices. To this end, all the images of the CT sequence are analyzed for COPD CAD by a designed local-to-global deep framework with group attentions.
  • To reveal the contextual information submerged in the CT images and among the CT slices, two types of group attentions are designed, involving GLAB for local image feature extraction and GGAB for long-range dependency extraction.
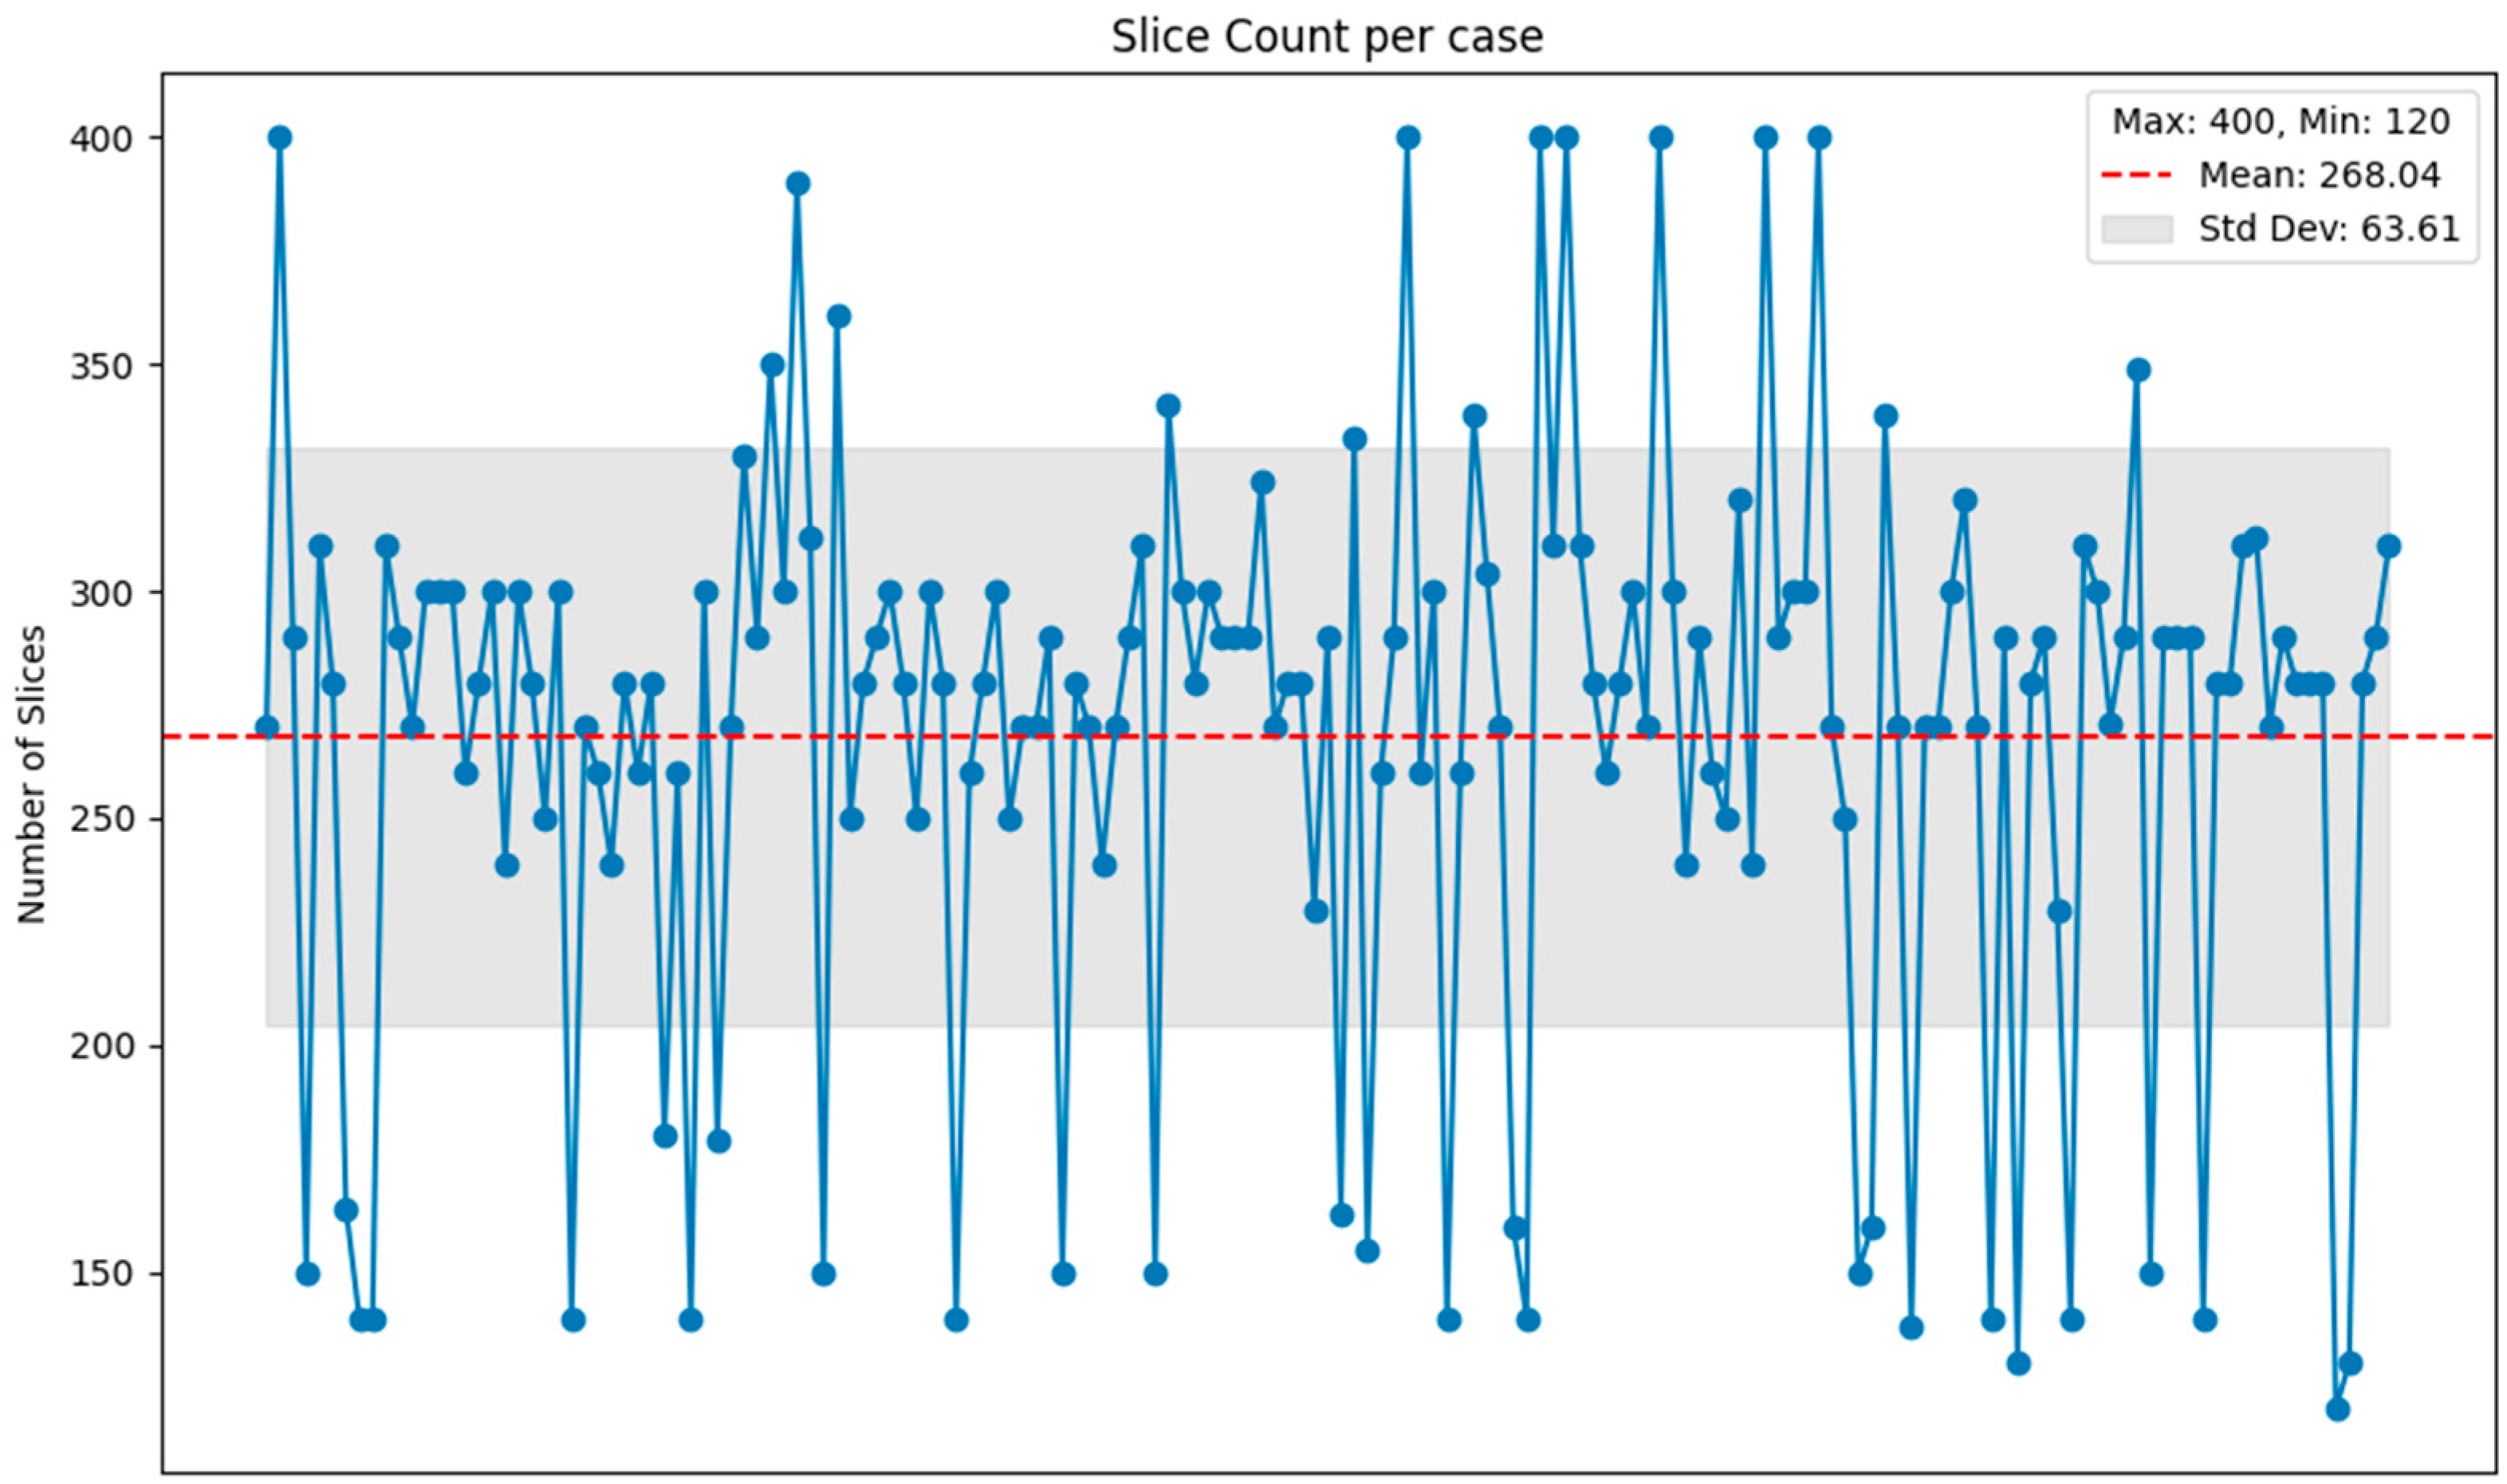
  • Since the number of CT slices for a COPD patient influences the model’s prediction performance, a slice-aware loss is designed to adapt the model to the CT sequence with various numbers of CT images, which integrates a normalized function into the cross-entropy loss.

2. Materials

All the CT sequences for COPD patients were collected and provided by the First Affiliated Hospital of Guangzhou Medical University. Each chest CT sequence has an image resolution of 512 × 512, an average pixel spacing of 0.68 mm, and an average slice thickness of 1.143 mm. After the clinicians’ careful evaluation, they provided 161 cases for this study, involving the patients with COPD and normal individuals, with a total of approximately 43,100 chest CT slices. We present some CT images acquired from the patients with/without COPD. As indicated in Figure 1, the bullae, emphysema, and airway wall thickening emerge in the CT images with COPD. Commonly, there are different numbers of CT slices in different CT sequences for the patients, as indicated in Figure 2, which will possibly influence the designed model’s performance. This will be addressed by the designed slice-aware loss, which will be introduced in the latter section.
All the cases were randomly divided into two sets for training and testing, respectively. That is, the training set consisted of 110 cases, with 71 cases for normal individuals and 39 cases for COPD patients. Five-fold cross-validation was performed on the training set. The testing set comprised 51 cases, with 34 cases for normal individuals and 17 cases for COPD patients. The category labels are primarily annotated by clinicians. They used CT image visualization software, such as ITK-SNAP 3.8, to observe the patients’ lung CT scans and subsequently labeled them accordingly. It is noted that the data collected for research purposes is subject to informed patient consent, but due to confidentiality agreements, the data do not support open access at this time.
We used the AdamW optimizer to train our model, with the learning rate of 0.00003, the weight decay of 0.05, exponential decay rates beta 1 (first decay) and beta 2 (second decay) of 0.9 and 0.999, respectively, and 200 epochs. All the experiments were performed on a Dell workstation equipped with an RTX A6000 48 GB GPU (NVIDIA, Santa Clara, CA, USA) and an Intel Xeon(R) Gold 5218R 2.10GHz CPU. The codes were built on the Pytorch1.10. Four commonly used metrics were utilized to evaluate the models’ performance, involving accuracy (ACC), sensitivity (SEN), specificity (SPE) and area under curve (AUC).

3. Methods

3.1. Architecture of the Designed Local-to-Global Deep Framework

Figure 3 illustrates the architecture of the designed local-to-global deep framework for COPD CAD, involving the stages of group local–global feature extraction, sequence global feature extraction and classification prediction. The CT sequence acquired from the COPD patient are first adaptively divided into several groups with some CT slices for subsequent group local–global feature extraction. Unlike the parallel processing approach [23], each group of CT slices successively pass through a GLAB and a GGAB to extract contextual information submerged in the CT images and among the CT slices. Next, the contextual information from all the groups is concatenated and input into a BiLSTM [24] to capture the inherent medical correlations among the CT groups in the stage of sequence global feature extraction. Finally, a fully connected layer is cascaded at the end of the designed framework to predict whether the patient has COPD.

3.2. GLAB

Due to the advantages of efficient computational performance and strong representational ability, ConvNeXt has been widely embedded in many networks to efficiently extract features [25,26]. Thus, to capture local features in the CT images, the GLAB is designed by combining ConvNeXt and multi-head convolutional attention (MHCA) [27]. As illustrated in Figure 3, GLAB successively involves a 3 × 3 convolutional layer, a batch normalization layer, a ReLU layer, a MaxPool layer, and two ConvNeXt + MHCA + downsample blocks with residual connections.
Assume x i as the i-th group of CT slices divided by the sequence of a COPD patient; it successively passes through a 3 × 3 convolutional layer, a batch normalization layer, a ReLU layer, and a MaxPool layer to achieve the feature maps f i 1 as
f i 1 = M a x P o o l ( R e L U ( B N ( C o n v 3 × 3 ( x i ) ) ) ) ,
where C o n v 3 × 3 ( ) is a convolutional operation with a 3 × 3 kernel and a stride of 1. R e L U ( ) is the output of the rectified linear unit (ReLU). B N ( ) represents the operation of batch normalization. M a x P o o l ( ) is the maxpooling operation with a 2 × 2 kernel. Then, the feature maps f i 1 pass through a ConvNeXt, formulated as
f ~ i 2 = C o n v N e X t f i 1 .
Here, the ConvNeXt is composed of a depthwise convolution layer, a layer normalization layer, two pointwise convolution layers, a Gaussian error linear unit (GELU), and a residual connection, formulated as
C o n v N e X t f i 1 = P W G E L U P W L N D W f i 1 + f i 1 ,
where D W ( ) is convolutional operation with a 3 × 3 kernel and a stride of 1. L N ( ) is the layer normalization operation. P W ( ) is the pointwise convolutional operation with a 1 × 1 kernel and a stride of 1. G E L U ( ) is the output of GELU to introduce non-linear mapping.
Next, the feature maps f ~ i 2 pass through a MHCA with a residual connection and a downsample layer to achieve the group local attention features f i 2 for the i-th group of CT slices, formulated as
f i 2 = D o w n s a m p l e M H C A f ~ i 2 + f ~ i 2 .
Here, the MHCA captures information from h parallel representation subspaces ( f ~ i 1 2 , f ~ i 2 2 , …, f ~ i h 2 ) with a concatenation operation C o n c a t ( ) , formulated as
M H C A f ~ i 2 = C o n c a t C A f ~ i 1 2 , C A f ~ i 2 2 ,   , C A f ~ i h 2 W P ,
where W P is a projection operation (i.e., a point-wise convolution). C A ( ) is single-head convolutional attention, defined as
C A f ~ i 2 = ο W ,   T m ,   T n ,         T m , n f ~ i 2 ,
where T m and T n represent adjacent tokens in the input feature f ~ i 2 . ο ( ) is an inner product with the trainable parameter W and input tokens T m , n .
It is noted that Equations (2)–(6) are repeated twice in the GLAB to achieve the final group local attention features for the i-th group of CT slices.

3.3. GGAB

To capture the long-range dependencies among the CT slices, the multi-head self-attention (MHSA) [27] in the Transformer model is introduced to design the GGAB, since it has the ability of long-term dependency learning via the ability of jointly attending multiple positions. As illustrated in Figure 3, GGAB involves two LN layers, a multi-head self-attention (MHSA), a residual connection, three linear layers, a GELU, and a downsample layer.
After the group local attention features f i 2 for the i-th group of CT slices successively pass through the LN layer and the MHSA with a residual connection, the feature maps f ~ i 3 can be achieved as
f ~ i 3 = M H S A L N f i 2 + f i 2 ,
M H S A f i 2 = C o n c a t A 1 f i 1 2 , A 2 f i 2 2 , A h f i h 2 W p ,
where f i 2 = [ f i 1 2 , f i 2 2 , …, f i h 2 ] denote h multi-head features in channel dimension. A ( ) is a self-attention operator, formulated as
A X = A t t e n t i o n X · W Q , X · W K , X · W V ,
where W Q , W K , W V are linear layers for context encoding. A t t e n t i o n ( ) represents a standard attention, formulated as
A t t e n t i o n Q , K , V = s o f t m a x Q K T V ,
where s o f t m a x ( ) is a softmax function to normalize the attention distribution.
Next, the feature maps f ~ i 3 pass through three linear layers, a GELU, an LN layer, and a downsample layer to achieve the group global attention features f i 3 , formulated as
f i 3 = D o w n s a m p l e ( L N ( L i n e a r ( G E L U ( L i n e a r ( L i n e a r ( f ~ i 3 ) ) ) ) ) ) ,
where L i n e a r ( ) is the linear operation. Finally, all the group global attention features extracted from all the groups of CT slices are concatenated to construct the group local-global features f for a sequence of a COPD patient.

3.4. BiLSTM

If the sequence for a COPD patient involves a large number of CT slices, long-range dependencies among the groups will be alleviated with the increasing number of the groups although the GGAB can capture long-range dependencies among the adjacent CT slices. Thus, in the stage of sequence global feature extraction, the BiLSTM [24] is cascaded behind the stage of group local–global feature extraction to capture the inherent medical correlations among the CT groups, since it can offer a good generalization on small datasets, and simultaneously capture both forward and backward sequence information with its inherent sequential characteristics. Finally, the sequence global features output by the BiLSTM pass through a fully connection (FC) layer to predict whether the patient has a COPD (i.e., y = 0 or 1), formulated as
y = F C ( B i L S T M f ) ,
where B i L S T M ( ) and F C ( ) denote the operations of the BiLSTM and the FC layer, respectively.

3.5. Slice-Aware Loss

To alleviate the influences of different numbers of CT slices for different patients, a slice-aware loss is designed based on the cross-entropy loss, formulated as
L S L C = S l c × 1 2 i = 1 2 y i T log p i .
In (13), S l c is a coefficient calculated as
S l c = T T m a x T m i n ,
where T is the number of slices for a patient in the training set, T m a x is the maximal number of slices for a patient in the training set, and T m i n is the minimal number of slices for a patient in the training set. y i represents the true label, and p i represents the model’s predicted result.

4. Results

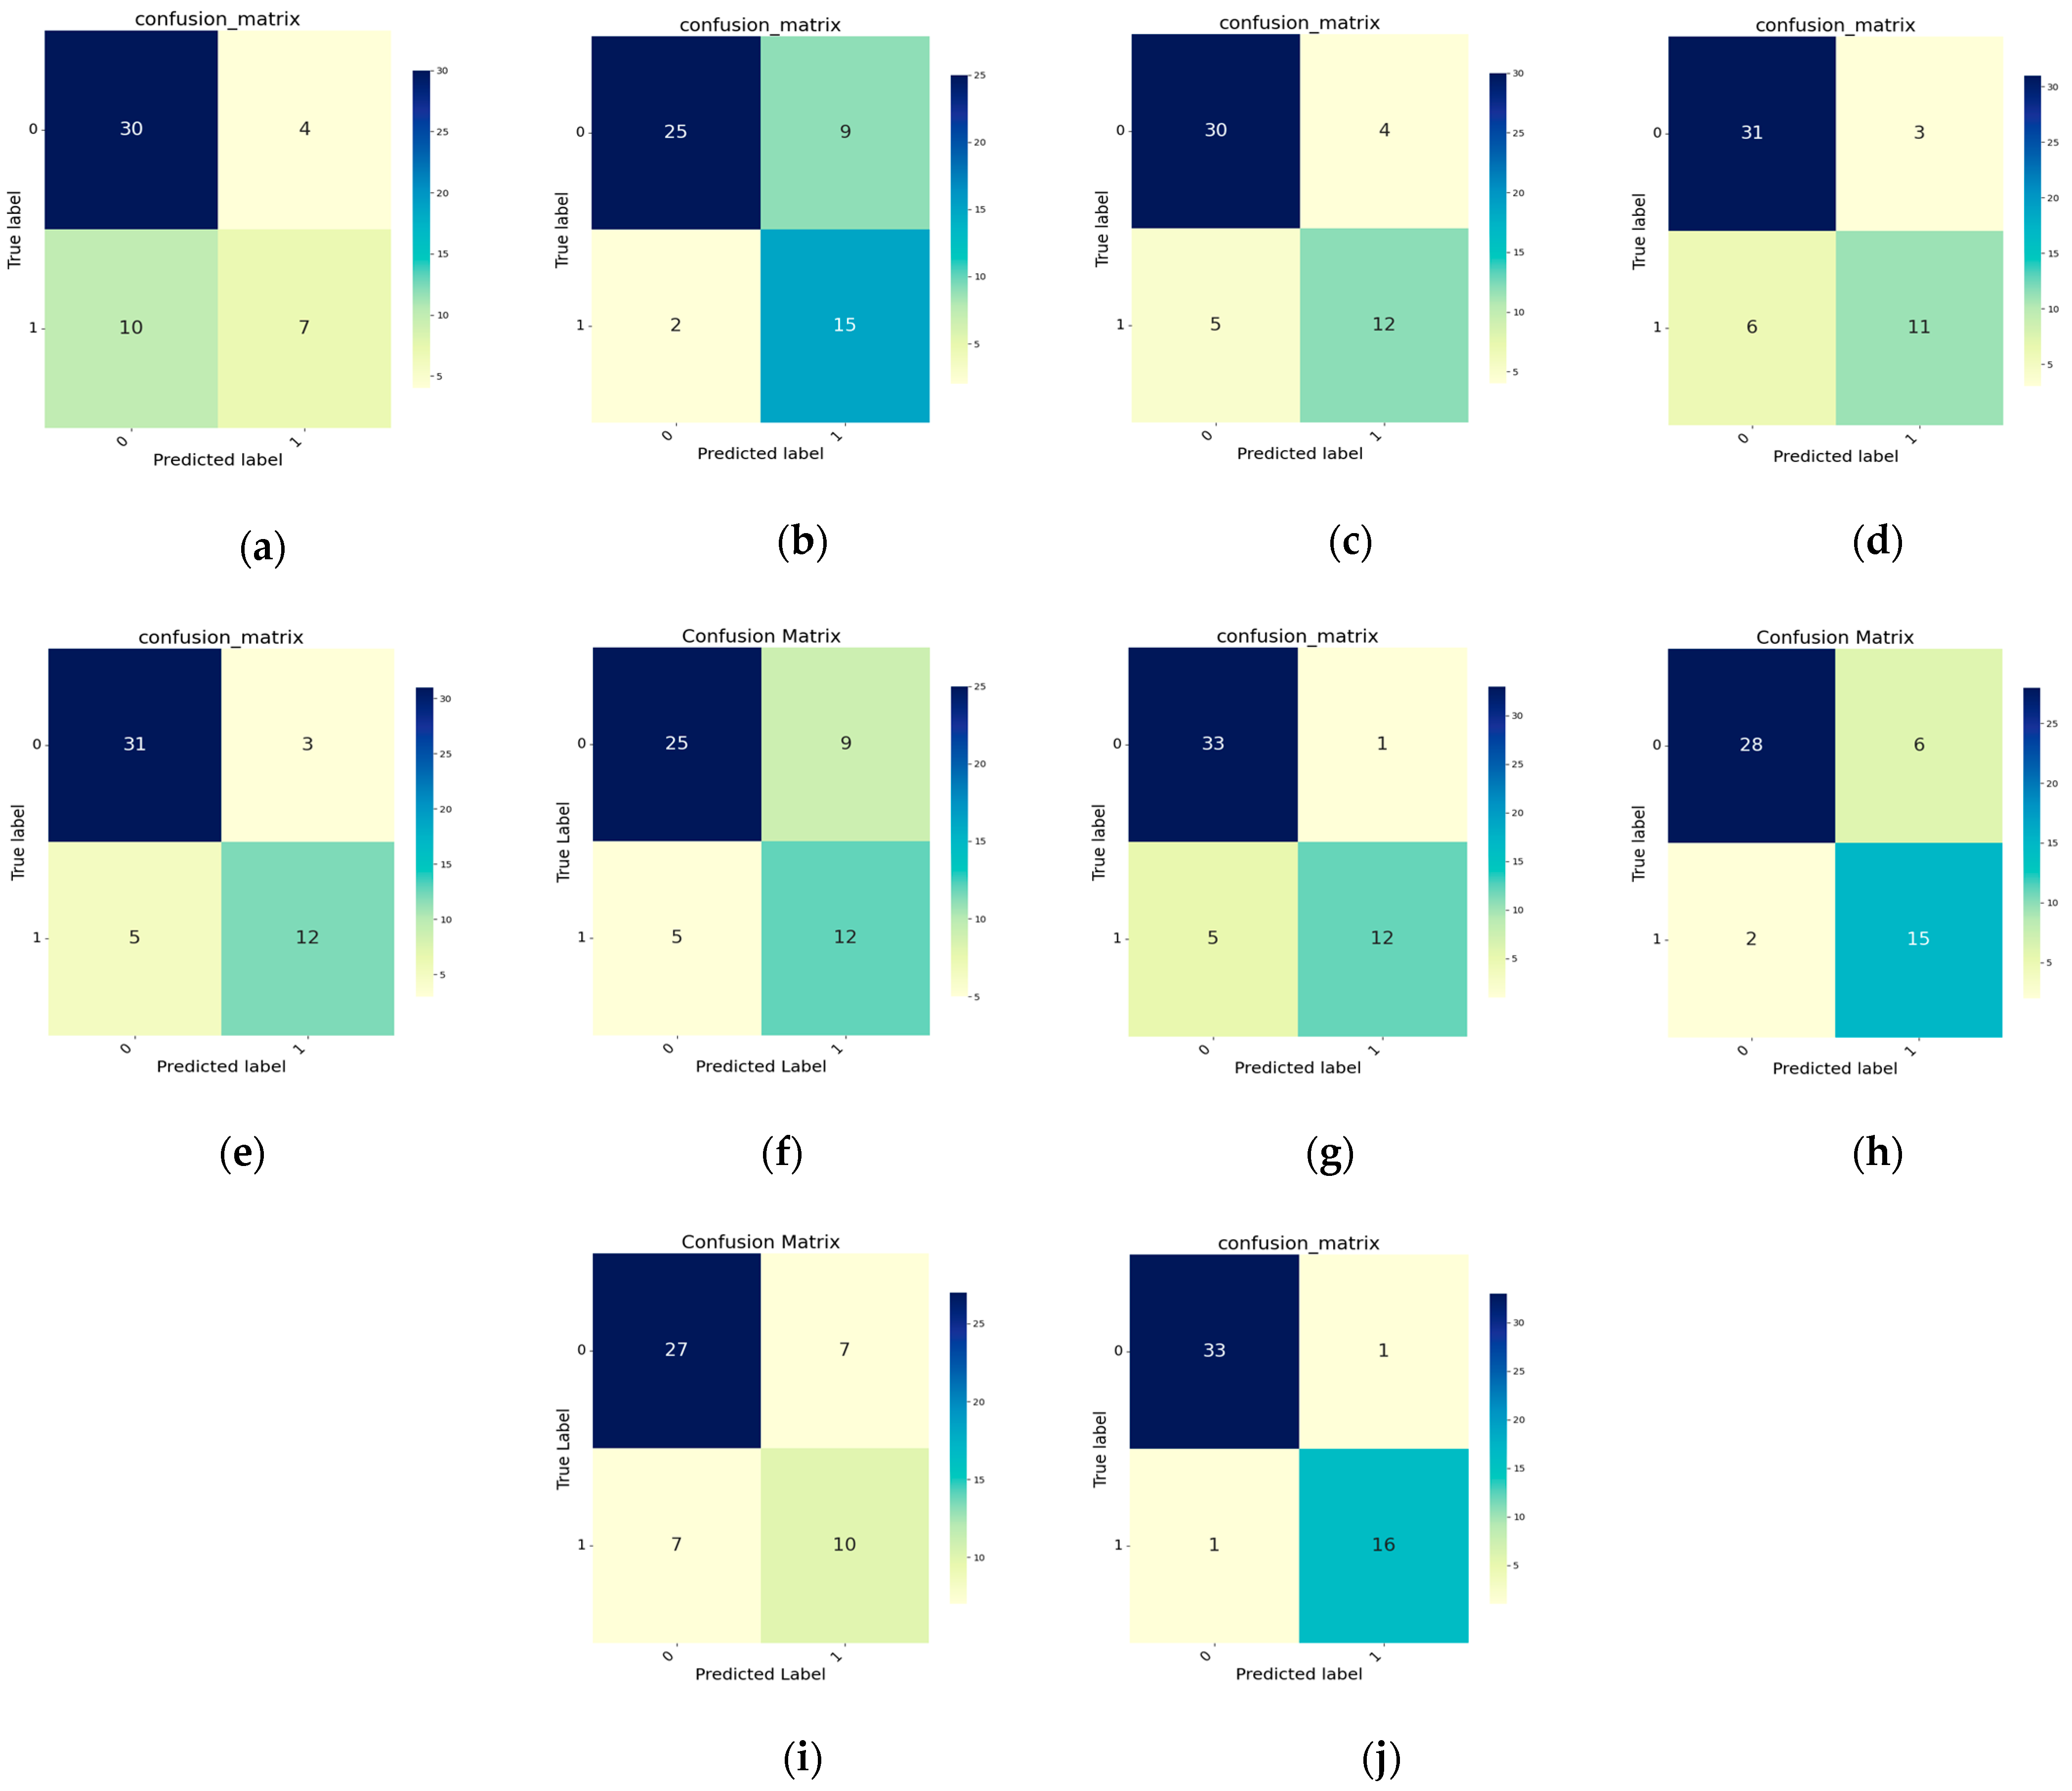
4.1. Comparison Experiments

To validate the designed local-to-global deep framework, it was compared with several existing deep models related to COPD diagnosis, such as Shah et al. [28], Ahmed et al. [19], Xu et al. [21], Kolias et al. [29], Humphries et al. [22], Varchagall et al. [30], Kienzle et al. [31], Xie et al. [32] and Geng et al. [33]. For fair comparisons, all baseline models were re-implemented and trained under the same conditions on our dataset.
As illustrated in Table 1, Shah et al. [28] achieves the worst performance for COPD diagnosis, since its simple convolution cascading architecture results in the loss of detailed features with the increase in the network depth. Moreover, another reason is that it has no related network structure to capture the long-range dependencies and even global features of the CT slices in the chest CT sequence. Xu et al. [21] extracts the features via the transferred AlexNet model and employs a multiple instance learning strategy to analyze randomly selected consecutive CT slice images, which can take into account the correlation between adjacent slices. Thus, it achieves a fair diagnostic performance of 82.52% AUC.
Although the Transformer architecture can capture long-range dependencies, Geng et al. [33] demonstrates poor performance for COPD diagnosis, achieving only an AUC of 72.32%. This underperformance is primarily due to the Transformer’s limitations in effectively capturing critical spatial features when the data are limited. Additionally, Geng et al.’s approach flattens the image data into a linear vector, resulting in the loss of essential spatial information.
Since the 3D convolutions can capture the inter-slice correlations in the CT sequence, four 3D CNN-based deep models, i.e., Ahmed et al. [19], Varchagall et al. [30], Kienzle et al. [31], Xie et al. [32] perform better than VGG-19. Moreover, they all have some residual connections, which can to some extents avoid the loss of detailed features with the network transmission. It is noted that Kienzle et al. [31] achieves the second-best diagnostic outcome among all the models, with a performance of 92.90% AUC. This is because, in addition to 3D convolutions and residual connections, some elaborate designs for 3D ConvNeXt improve its ability to extract local features along with long-range dependencies, which involves changing the stage compute ratio, changing stem to “Patchify”, and grouping convolutions with large kernels.
Different from 3D CNN-based deep models, Kolias et al. [29] and Humphries et al. [22] utilize RNN and LSTM to extract global correlations between the slices of the chest CT sequence, respectively. Since RNN has the disadvantage of gradient vanishing for long time series, MIA-COV19D will lose long-range dependencies when the chest CT sequence has a large number of CT slices, which will degrade its classification performance for COPD. Nevertheless, MIA-COV19D utilizes the whole sequence to predict a probability for each CT slice via the CNN-RNN network and makes the final decision via a voting scheme that makes the final decision. These facts possibly make MIA-COV19D achieve the third best AUC performance of 87.37% for COPD diagnosis. However, 64.71% sensitivity means that many COPD patients are not recognized, which is terrible in clinical practice. Comparatively, CNN + LSTM achieves fairly good performance in terms of the four metrics, although it simply cascades a CNN and an LSTM.
Comparatively, our designed deep model achieves the best performance in terms of four metrics, with a performance of 96.08% accuracy, 94.12% sensitivity, 97.06% specificity, and 95.32% AUC. Figure 4 illustrates confusion matrices for COPD diagnosis via different deep models, which are consistent with the quantitative results illustrated in Table 1. Specifically, our designed deep model only mis-diagnoses two patients, i.e., one COPD patient is mis-recognized as non-COPD and one non-COPD case is considered as COPD. This can be attributed to two schemes. One is that two designed group attentions can extract local image features in the CT images along with long-range dependencies in the chest CT sequence. The other is that the proposed slice-aware loss can adapt the model to the CT sequence with various numbers of CT images.

4.2. Ablation Experiments

4.2.1. Influences of Different Modules

Three key modules are employed for the designed local-to-global deep model to perform COPD diagnosis, which are GLAB for extracting local image features, GGAB for extracting long-range dependencies, and BiLSTM for extracting inherent medical correlations among the CT groups. To validate the three modules on the designed deep model, an ablation experiment was conducted, in which the baseline model also utilized the grouping strategy to divide the CT sequence into several groups. Different from the designed local-to-global deep model, the baseline model consists of four convolutional blocks for group feature extraction, LSTM for sequence global feature extraction, and a fully connected layer for classification prediction.
As indicated in Table 2, although the baseline model can almost identify all the COPD patients, but mis-identify many normal cases as COPD ones, resulting in a high sensitivity of 94.12%, a low specificity of 67.65%, and thus a fairly low AUC of 89.10%. If the GLAB is substituted for the first three convolutional blocks, the baseline model with the GLAB achieves a little better AUC performance than the baseline model (AUC: 91.18% vs. 89.10%), demonstrating that specificity significantly increases (SPE: 88.24% vs. 67.65%) and but sensitivity to some extents decreases (SEN: 70.59% vs. 94.12%). If the GGAB or BiLSTM is substituted for the last convolutional block or LSTM, respectively, the corresponding model achieves above similar identification performance. The combination of any two modules can further improve the COPD identification ability of the baseline model. Especially, if the two types of group attentions, i.e., GLAB and GGAB, are substituted for the four convolutional blocks, the corresponding model achieves the second-best AUC of 94.81%. However, the model with GLAB and GGAB achieves a relatively low sensitivity of 70.59%, indicating that some COPD patients are not identified. This is possibly because long-range dependencies among the CT groups cannot be well captured by the LSTM. Thus, due to the integration of GLAB, GGAB, and BiLSTM, the designed local-to-global deep model achieves the best COPD identification with the performance of a high accuracy of 96.08%, a high sensitivity of 94.12%, a high Specificity of 97.06%, and a high AUC of 95.32%.

4.2.2. Influence of the Number of CT Slices in Each Group

An experiment was conducted to discuss the influence of the number of CT slices in each group on the designed deep model. As indicated in Table 3, with the increase in the number of CT slices in each group, the identification ability of the designed deep model first increases and then decreases, especially in terms of sensitivity which is significant in clinical practice. When each 10 CT slices are grouped for the chest CT sequence of the patient, the designed model achieves the best COPD identification performance. Thus, unless specifically stated, the number of CT slices in each group is set to 10 for the grouping strategy in our study.

4.2.3. Discussion on Loss Function

To demonstrate the influence of the number of CT slices in the CT sequence on the designed model’s performance, we conducted two experiments to evaluate the designed models with different inputting schemes (fixed and variable) and with different losses (cross entropy loss and slice-aware loss). It is noted that, for a fixed inputting scheme, slice-aware loss is essentially a variant of cross entropy loss, as formulated as (13). As indicated in Figure 1, the number of CT slices per case has an average of 268.04 slices, ranging from 120 to 400. Thus, for fixed inputting scheme, the designed model separately utilized 120, 268, and 400 CT slices as the inputs. If CT slices were more than the fixed inputs, extra slices were removed; if CT slices in a sequence were less than the fixed inputs, the zero-padding technique was employed to increase the number of CT slices to the fixed one.
As indicated in Table 4, for the fixed inputting scheme, the model with 268 CT slices as the inputs performs better than those with 120 CT slices and with 400 CT slices. Especially, the model with 400 CT slices achieves the worst diagnostic performance with 64.71% sensitivity and 88.58% AUC. This is possibly because the zero-padding technique introduces the noise into the CT sequences, which degrades the diagnostic performance. Compared with the models with the fixed inputting scheme, the models with variable inputting scheme perform better for COPD diagnosis. Especially, the model with slice-aware loss performs better than that with cross entropy loss in terms of all the metrics. This is because the proposed slice-aware loss integrates a normalized function into the cross-entropy loss to adapt the model to the CT sequence with various numbers of CT images.

5. Conclusions

Deep learning is effective for analyzing the chest CT sequence for the CAD of COPD. In this paper, a local-to-global deep framework is designed to perform COPD identification, which utilizes the chest CT sequence of the patients as the network input. The designed deep framework consists of the stages of group local–global feature extraction, sequence global feature extraction, and classification prediction. In the stage of group local–global feature extraction, GLAB and GGAB are designed to successively extract contextual information submerged in the grouped CT slices. Then, the BiLSTM followed by a fully connected layer is utilized for COPD identification. A slice-aware loss is proposed to adapt the designed model to the CT sequence with various numbers of CT images, which integrates a normalized coefficient into the cross-entropy loss. Ablation experiments indicate that GLAB, GGAB, and slice-aware loss provide different contributions to the designed local-to-global deep model. Comparison experiments indicate that the designed model is superior to several existing deep learning models, with the identification performance of 96.08% accuracy, 94.12% sensitivity, 97.06% specificity, and 95.32% AUC.
Although the designed deep model can perform a good identification task for COPD, which only analyzes the chest CT sequences of the patients, multi-modal medical data are widely studied for comprehensive CAD of various diseases. In the future, we will collect CT data and clinical data of lung function and incorporate these multi-modal medical data into the designed deep framework for comprehensive COPD identification. In this case, the framework will be modified to adapt to the multi-modal data input. Moreover, only 161 cases with approximately 43,100 chest CT slices are provided by a single medical center, which influences the generalization study. This limitation indicates that although the designed model performs well on our small dataset, it may overfit when applied to larger or multi-center datasets. This is because the model trained on the small dataset possibly does well in capturing inherent medical features from different data distributions of the large datasets, leading to a decline in performance. Additionally, since the model was trained on the data from a single medical center, it may be influenced by the specific imaging equipment and patient characteristics, making it challenging to adapt to new data distributions in other clinical settings. In the future, we will collect a large number of cases from multiple medical centers through research cooperation, which can verify the generalization of the designed framework, and then optimize it to implement future clinical applications. Also, domain transferring is an alternative method to alleviate the influence of the single-center data.

Author Contributions

Conceptualization, N.C.; methodology, N.C. and Y.X.; software, Z.C. and Y.X.; validation, N.C. and Y.X.; formal analysis, N.C.; investigation, Y.X.; resources, Z.C. and Y.L.; data curation, Y.X. and Y.L.; writing—original draft preparation, N.C. and Y.X.; writing—review and editing, N.C.; visualization, Z.C. and Y.L.; supervision, Y.Z. and P.W.; project administration, Y.Z. and P.W.; funding acquisition, Y.Z. and P.W. All authors have read and agreed to the published version of the manuscript.

Funding

This research was funded by the grants from the Guangzhou Science and Technology Program, grant number Nos. 202102010251 and 2024A03J1156.

Data Availability Statement

The datasets generated and/or analyzed during the current study are available from the corresponding author upon reasonable request.

Acknowledgments

We thank all authors for their contributions to this work.

Conflicts of Interest

The authors declare no conflicts of interest.

References

  1. Bagdonas, E.; Raudoniute, J.; Bruzauskaite, I.; Aldonyte, R. Novel aspects of pathogenesis and regeneration mechanisms in COPD. Int. J. Chronic Obstr. Pulm. Dis. 2015, 10, 995–1013. [Google Scholar]
  2. Ko, F.W.; Chan, K.P.; Hui, D.S.; Goddard, J.R.; Shaw, J.G.; Reid, D.W.; Yang, I.A. Acute exacerbation of COPD. Respirology 2016, 21, 1152–1165. [Google Scholar] [CrossRef] [PubMed]
  3. Poh, T.Y.; Mac Aogáin, M.; Chan, A.K.; Yii, A.C.; Yong, V.F.; Tiew, P.Y.; Koh, M.S.; Chotirmall, S.H. Understanding COPD-overlap syndromes. Expert Rev. Respir. Med. 2017, 11, 285–298. [Google Scholar] [CrossRef] [PubMed]
  4. Wang, Q.; Liu, S. The effects and pathogenesis of PM2. 5 and its components on chronic obstructive pulmonary disease. Int. J. Chronic Obstr. Pulm. Dis. 2023, 18, 493–506. [Google Scholar] [CrossRef]
  5. Negewo, N.A.; Gibson, P.G.; McDonald, V.M. COPD and its comorbidities: Impact, measurement and mechanisms. Respirology 2015, 20, 1160–1171. [Google Scholar] [CrossRef]
  6. Lozano, R.; Naghavi, M.; Foreman, K.; Lim, S.; Shibuya, K.; Aboyans, V.; Abraham, J.; Adair, T.; Aggarwal, R.; Ahn, S.Y.; et al. Global and regional mortality from 235 causes of death for 20 age groups in 1990 and 2010: A systematic analysis for the Global Burden of Disease Study 2010. Lancet 2012, 380, 2095–2128. [Google Scholar] [CrossRef]
  7. Yin, P.; Wu, J.; Wang, L.; Luo, C.; Ouyang, L.; Tang, X.; Liu, J.; Liu, Y.; Qi, J.; Zhou, M.; et al. The burden of COPD in China and its provinces: Findings from the global burden of disease study 2019. Front. Public Health 2022, 10, 859499. [Google Scholar] [CrossRef]
  8. Singhvi, D.; Bon, J. CT imaging and comorbidities in COPD: Beyond lung cancer screening. Chest 2021, 159, 147–153. [Google Scholar] [CrossRef]
  9. Budoff, M.J.; Nasir, K.; Kinney, G.L.; Hokanson, J.E.; Barr, R.G.; Steiner, R.; Nath, H.; Lopez-Garcia, C.; Black-Shinn, J.; Casaburi, R. Coronary artery and thoracic calcium on noncontrast thoracic CT scans: Comparison of ungated and gated examinations in patients from the COPDGene cohort. J. Cardiovasc. Comput. Tomogr. 2011, 5, 113–118. [Google Scholar] [CrossRef]
  10. Lynch, D.A.; Austin, J.H.; Hogg, J.C.; Grenier, P.A.; Kauczor, H.U.; Bankier, A.A.; Barr, R.G.; Colby, T.V.; Galvin, J.R.; Gevenois, P.A.; et al. CT-definable subtypes of chronic obstructive pulmonary disease: A statement of the Fleischner Society. Radiology 2015, 277, 192–205. [Google Scholar] [CrossRef]
  11. Lynch, D.A.; Moore, C.M.; Wilson, C.; Nevrekar, D.; Jennermann, T.; Humphries, S.M.; Austin, J.H.M.; Grenier, P.A.; Kauczor, H.U.; Han, M.K.; et al. CT-based visual classification of emphysema: Association with mortality in the COPDGene study. Radiology 2018, 288, 859–866. [Google Scholar] [CrossRef] [PubMed]
  12. Shen, D.; Wu, G.; Suk, H.I. Deep learning in medical image analysis. Annu. Rev. Biomed. Eng. 2017, 19, 221–248. [Google Scholar] [CrossRef] [PubMed]
  13. Ramadoss, R.; Vimala, C. Classification of Pulmonary Emphysema using Deep Learning. In Proceedings of the 2022 International Conference on Electronic Systems and Intelligent Computing (ICESIC), Chennai, India, 22–23 April 2022. [Google Scholar]
  14. Parui, S.; Parbat, D.; Chakraborty, M. A deep learning paradigm for computer aided diagnosis of emphysema from lung HRCT images. In Proceedings of the 2022 International Conference on Computing in Engineering & Technology (ICCET), Lonere, India, 12–13 February 2022. [Google Scholar]
  15. Polat, Ö.; Şalk, İ.; Doğan, Ö.T. Determination of COPD severity from chest CT images using deep transfer learning network. Multimed. Tools Appl. 2022, 81, 21903–21917. [Google Scholar] [CrossRef]
  16. Du, R.; Qi, S.; Feng, J.; Xia, S.; Kang, Y.; Qian, W.; Yao, Y. Identification of COPD from multi-view snapshots of 3D lung airway tree via deep CNN. IEEE Access 2020, 8, 38907–38919. [Google Scholar] [CrossRef]
  17. Wu, Y.; Du, R.; Feng, J.; Qi, S.; Pang, H.; Xia, S.; Qian, W. Deep CNN for COPD identification by Multi-View snapshot integration of 3D airway tree and lung field. Biomed. Signal Process. Control 2023, 79, 104162. [Google Scholar] [CrossRef]
  18. Ho, T.T.; Kim, T.; Kim, W.J.; Lee, C.H.; Chae, K.J.; Bak, S.H.; Kwon, S.; Jin, G.; Park, E.; Choi, S.; et al. A 3D-CNN model with CT-based parametric response mapping for classifying COPD subjects. Sci. Rep. 2021, 11, 34. [Google Scholar] [CrossRef]
  19. Ahmed, J.; Vesal, S.; Durlak, F.; Kaergel, R.; Ravikumar, N.; Remy-Jardin, M.; Maier, A. COPD classification in CT images using a 3D convolutional neural network. In Proceedings of the Bildverarbeitung für die Medizin 2020: Algorithmen–Systeme–Anwendungen, Berlin, Germany, 15–17 March 2020. [Google Scholar]
  20. Xue, M.; Jia, S.; Chen, L.; Huang, H.; Yu, L.; Zhu, W. CT-based COPD identification using multiple instance learning with two-stage attention. Comput. Methods Programs Biomed. 2023, 230, 107356. [Google Scholar] [CrossRef]
  21. Xu, C.; Qi, S.; Feng, J.; Xia, S.; Kang, Y.; Yao, Y.; Qian, W. DCT-MIL: Deep CNN transferred multiple instance learning for COPD identification using CT images. Phys. Med. Biol. 2020, 65, 145011. [Google Scholar] [CrossRef] [PubMed]
  22. Humphries, S.M.; Notary, A.M.; Centeno, J.P.; Strand, M.J.; Crapo, J.D.; Silverman, E.K.; Lynch, D.A. Deep learning enables automatic classification of emphysema pattern at CT. Radiology 2020, 294, 434–444. [Google Scholar] [CrossRef]
  23. Liu, L.; Li, Y.; Wu, Y.; Ren, L.; Wang, G. LGI Net: Enhancing local-global information interaction for medical image segmentation. Comput. Biol. Med. 2023, 167, 107627. [Google Scholar] [CrossRef]
  24. Zhou, P.; Shi, W.; Tian, J.; Qi, B.; Li, B.; Hao, H.; Xu, B. Attention-based bidirectional long short-term memory networks for relation classification. In Proceedings of the 54th Annual Meeting of the Association for Computational Linguistics, Berlin, Germany, 7–12 August 2016. [Google Scholar]
  25. Ma, C.; Gu, Y.; Wang, Z. TriConvUNeXt: A Pure CNN-Based Lightweight Symmetrical Network for Biomedical Image Segmentation. J. Imaging Inform. Med. 2024, 1, 1–13. [Google Scholar] [CrossRef] [PubMed]
  26. Liu, Z.; Mao, H.; Wu, C.Y.; Feichtenhofer, C.; Darrell, T.; Xie, S. A convnet for the 2020s. In Proceedings of the IEEE/CVF Conference on Computer Vision and Pattern Recognition (CVPR), New Orleans, LA, USA, 18–24 June 2022. [Google Scholar]
  27. Li, J.; Xia, X.; Li, W.; Li, H.; Wang, X.; Xiao, X.; Wang, X.; Xiao, X.; Wang, R.; Zhen, M. Next-vit: Next generation vision transformer for efficient deployment in realistic industrial scenarios. arXiv 2022, arXiv:220705501. [Google Scholar]
  28. Shah, V.; Keniya, R.; Shridharani, A.; Punjabi, M.; Shah, J.; Mehendale, N. Diagnosis of COVID-19 using CT scan images and deep learning techniques. Emerg. Radiol. 2021, 28, 497–505. [Google Scholar] [CrossRef] [PubMed]
  29. Kollias, D.; Arsenos, A.; Soukissian, L.; Kollias, S. MIA-COV19D: COVID-19 detection through 3-D chest CT image analysis. In Proceedings of the 2021 IEEE/CVF International Conference on Computer Vision (ICCV), Montreal, QC, Canada, 10–17 October 2021. [Google Scholar]
  30. Varchagall, M.; Nethravathi, N.; Chandramma, R.; Nagashree, N.; Athreya, S.M. Using deep learning techniques to evaluate lung cancer using CT images. SN Comput. Sci. 2023, 4, 173. [Google Scholar] [CrossRef]
  31. Kienzle, D.; Lorenz, J.; Schön, R.; Ludwig, K.; Lienhart, R. COVID detection and severity prediction with 3D-ConvNeXt and custom pretrainings. In Proceedings of the 17th European Conference on Computer Vision (ECCV), Tel Aviv, Israel, 23–27 October 2022. [Google Scholar]
  32. Xie, W.; Jacobs, C.; Charbonnier, J.P.; Slebos, D.J.; van Ginneken, B. Emphysema subtyping on thoracic computed tomography scans using deep neural networks. Sci. Rep. 2023, 13, 14147. [Google Scholar] [CrossRef]
  33. Geng, K.; Shi, Z.; Zhao, X.; Wang, J.; Leader, J.; Pu, J. BeyondCT: A deep learning model for predicting pulmonary function from chest CT scans. arXiv 2024, arXiv:2408.05645. [Google Scholar]
Figure 1. CT images acquired from (a,b) the patients without COPD, from (c,d) the patients with COPD.
Electronics 13 04443 g001
Figure 2. Number of slices per case in CT dataset.
Electronics 13 04443 g002
Figure 3. Architecture of the designed local-to-global deep framework.
Electronics 13 04443 g003
Figure 4. Confusion matrices for different deep models. (a) Shah et al. [28]; (b) Ahmed et al. [19]; (c) Xu et al. [21]; (d) Kolias et al. [29]; (e) Humphries et al. [22]; (f) Varchagall et al. [30]; (g) Kienzle et al. [31]; (h) Xie et al. [32]; (i) Geng et al. [33]; (j) Ours.
Electronics 13 04443 g004
Table 1. Comparisons of different deep models for COPD diagnosis.
MethodsACCSENSPEAUC
Shah et al. [28] (2021)72.55%41.18%88.24%63.14%
Ahmed et al. [19] (2020)78.43%88.24%73.53%81.49%
Xu et al. [21] (2020)82.35%70.59%88.24%82.52%
Kolias et al. [29] (2021)82.35%64.71%91.18%87.37%
Humphries et al. [22] (2020)84.31%70.59%91.18%83.22%
Varchagall et al. [30] (2023)72.55%70.59%73.53%79.93%
Kienzle et al. [31] (2022)88.24%70.59%97.06%92.90%
Xie et al. [32] (2023)84.31%88.24%82.35%89.62%
Geng et al. [33] (2024)72.55%58.82%79.41%72.32%
Ours96.08%94.12%97.06%95.32%
Table 2. Influences of different modules on COPD diagnosis.
GLABGGABBiLSTMACCSENSPEAUC
76.47%94.12%67.65%89.10%
82.35%70.59%88.24%91.18%
80.39%94.12%73.53%90.83%
82.35%76.47%85.29%90.83%
88.24%70.59%97.06%94.81%
86.27%82.35%88.24%91.70%
86.27%94.12%82.35%92.91%
96.08%94.12%97.06%95.32%
Table 3. COPD identification via the models with different numbers of CT slices in each group.
Number of Group SlicesACCSENSPEAUC
590.20%76.47%97.06%91.52%
1096.08%94.12%97.06%95.32%
1590.20%82.35%94.12%94.46%
2090.20%76.47%97.06%92.56%
Table 4. COPD identification via the designed deep models with different losses.
InputLoss FunctionsACCSENSPEAUC
Fixed Slicescross entropy loss (120)82.35%76.47%85.29%89.27%
cross entropy loss (268)88.24%82.35%91.18%91.52%
cross entropy loss (400)80.39%64.71%88.24%88.58%
Variable Slicescross entropy loss92.16%88.24%94.12%95.16%
slice-aware loss96.08%94.12%97.06%95.32%
Disclaimer/Publisher’s Note: The statements, opinions and data contained in all publications are solely those of the individual author(s) and contributor(s) and not of MDPI and/or the editor(s). MDPI and/or the editor(s) disclaim responsibility for any injury to people or property resulting from any ideas, methods, instructions or products referred to in the content.

