Article

Research on Closed-Loop Control of Screen-Based Guidance Operations in High-Speed Railway Passenger Stations Based on Visual Detection Model

1
Institute of Computing Technologies, China Academy of Railway Sciences Co., Ltd., Beijing 100081, China
2
School of Management, Capital Normal University, Beijing 100089, China
3
School of Information Science and Engineering, Shenyang University of Technology, Shenyang 110870, China
*
Author to whom correspondence should be addressed.
Electronics 2024, 13(22), 4400; https://doi.org/10.3390/electronics13224400
Submission received: 12 September 2024 / Revised: 26 October 2024 / Accepted: 8 November 2024 / Published: 10 November 2024

Abstract

:
Due to adjustments to the operation plan of guided trains at high-speed railway stations, a large amount of information is inevitably displayed, sometimes with delays, omissions, and misalignments. The effective management of guidance information can provide important support for the personnel flow operation of high-speed railway stations. Aiming to meet the requirements of high real-time and high accuracy of guided job control, a closed-loop control method based on a guided job is proposed, which provides enhanced text detection and recognition in a target area. Firstly, using the introduction of the triplet attention mechanism in YOLOv5 and the addition of fusion modules, the feature pyramid network is used to enhance the effective feature and feature interactions between the modules to improve the detection speed of the display. Then, the text on the guide screen is recognized and extracted in combination with the PaddleOCR model, and then, the results are proofread against the original plan to adjust the screen information. Finally, the effectiveness and feasibility of the method are verified by experimental data, with the accuracy of the improved model reaching 90.6% and the speed reaching 1 ms, which meets the requirement of real-time closed-loop control of Screen-Based Guidance Operations.

1. Introduction

As an important transport hub, high-speed railway stations are characterized by heavy passenger flow and intensive operation plans, and the provision of accurate guiding information is crucial for guiding passengers entering the station and waiting for trains. However, the guiding information at high-speed rail passenger stations faces complex and ever-changing situations when dealing with various emergencies, thus making a large screen of guiding information prone to problems such as delayed, omitted, and misplaced operational information, which in turn affects the flow of passengers in the station. If not handled in a timely manner, this misinformation may lead to congestion in the station, thus triggering a security incident; under extreme passenger flow conditions, it may even lead to serious congestion, such as paralysis of ticket gates, chaos on the platform, and other catastrophic accidents. Therefore, it is very important to manage the guidance operation accurately.
At present, when an information error occurs in guiding Screen-Based Guidance Operations, the detection method for operation information errors mainly relies on manual correction and inspection by on-site staff. When the error is found, the on-site staff notify the operator in the general control room via hand-held terminal equipment to reload or update the guiding screen information. Although this method can discover and address wrong information in a timely manner, it requires a significant amount of manual labor and a lengthy correction cycle.
Furthermore, in the context of a highly complex transportation hub such as a high-speed railway station, the internal systems are intricately intertwined. The transmission and processing of information encompass numerous interconnected links, making the system highly susceptible to disruptions. Consequently, single-point monitoring of the display signal may jeopardize the overall stability of the system. Additionally, stringent security measures necessitate strict limitations on the transmission of video signals within the high-speed rail station, restricting their display solely to the large screens located within the station’s premises. As a result, management of the guidance screen signal is confined to the output system itself.
Moreover, when large screens exhibit errors or deviations in display performance parameters, such as brightness and color stability, a solitary video signal cannot be effectively isolated for detection, nor can it prevent underlying hardware issues. Given these considerations, it becomes evident that relying on traditional wire transmission methods to address these challenges is insufficient and impractical. Therefore, innovative solutions must be sought to tackle the intricate problems associated with the high-speed railway station’s display systems.
With the rapid development of computer vision, machine vision has been widely used in industrial automation, automatic driving, medical diagnosis, intelligent monitoring, and other fields, significantly improving production efficiency and intelligence level [1]. With the continuous progress of sensor technology, adaptive control systems, and intelligent vehicle networking, detection and control systems for public transportation are developing and becoming more intelligent and accurate. However, although these technologies have made remarkable progress, there is still a certain research gap in the specific field of text recognition regarding orientation screens in high-speed rail stations. Although OCR technology is applied to many scenarios, such as general character recognition, document and bill text recognition, license plate recognition, etc. [2], due to the variety of orientation screens in high-speed railway stations, the layout and displayed content are complex, and the layout includes charts and pictures with different colors and fonts. In particular, there are often thematic orientation and propaganda films and other information on these large screens in stations, and there are many interfering factors, so it is impossible to recognize text in the target area simply via OCR recognition technology.
At present, there are few studies at home and abroad on the detection and recognition of high-speed railway passenger station guide screens. For research on text recognition, many scholars have improved the relevant algorithms according to different business scenarios. For example, Zhu Jianwei et al. [3] proposed a text information recognition method for vehicle-mounted remote sensing images and established a high-precision screening algorithm incorporating maximum stable extreme value region detection and a stroke width transform character recognition optimization algorithm based on edge pixel points to realize the recognition of highway billboards. Xiao Ke et al. [4] proposed an edge-enhanced detection method to extract the maximum stable extreme region (MSER) of high-quality edge enhancement under the conditions of lighting and blurring effects and to analyze and identify the non-MSER pairs of components through geometric feature filtering, which is applicable to the recognition of Chinese text in natural scene images. Chen Weida et al. [5] introduced a module called Soft Attention Mask Embedding, which combines Transformer with coded high-level features and computes soft attention to generate a mask close to the text boundary to suppress background noise. Shivakumara et al. [6] developed a method to extract dominant pixels from the edge portion by using gradient vector flow, and Sobel Edge Detection was used to identify the possible English text regions, but it is not good for Chinese recognition. Baek Y et al. [7] pointed out a neural network-based method for scene text detection that effectively identifies text regions by analyzing the affinity between characters. This method aims to overcome the limitations of traditional rigid word-level bounding box training methods in handling arbitrary shape text areas. However, the generalization ability of the method needs more testing for verification, especially in the case of different languages and font styles. C. K. Ch’ng a et al. [8] proposed a new scene text detection method, which mainly aimed to address the lack of curve-oriented text in the existing dataset and increased the directional diversity of the dataset by expanding the text detection range to include curve-oriented text, benchmarked on the Total-Text dataset using the fine-tuned DeconvNet to assess robustness to curved text. However, during practical application to information recognition on the guide screen in high-speed railway stations, this method has some potential disadvantages, such as the processing speed not being as fast as the traditional method; complex background interference, text density, lighting changes, and angle changes affecting the detection accuracy; and the high computational cost and professionalism required to maintain the deep learning model. Wentong Wu et al. [9] addressed this by combining local full convolutional networks (FCNs) with the YOLO-v5 algorithm. The application effects of the R-CNN, FRCN, and R-FCN methods on feature extraction were analyzed, and the YOLO-v5 algorithm was optimized by using the multi-scale anchor mechanism of fast R-CNN to enhance its adaptability to images of different sizes. However, when this method is applied to information recognition on the guidance screen in high-speed railway stations, it may face some challenges, such as high real-time requirements, different target types, large consumption of computing resources, environmental adaptability, and difficulty of model maintenance. These factors may affect its applicability and efficiency in the real-time information identification system of high-speed railway stations. Due to the interference of other advertisements and other texts in the HSR station, the text recognition model alone cannot be used to extract the text in a specific target area, so it needs to be combined with a specific target detection algorithm.
The mainstream deep learning algorithms for target detection in the guided homework plan information display area can be divided into two categories. One class is two-stage target detection algorithms; such algorithms generate the target region to be selected in advance and then classify and locate the target region to be selected, which are large-scale deep neural network algorithms, such as R-CNN [10], Fast R-CNN [11], and Faster-CNN [12]. Such algorithms have high accuracy and flexibility, but due to the complexity of the model structure, the execution speed is slow and cannot meet the efficient demand of real-time detection. In addition, the operation of this type of model requires strong arithmetic support, so this type of algorithm is usually limited to heavy cloud servers with high computing power [13]. The other category is one-stage target detection algorithms, which directly classify and localize targets in the feature map, without generating the target region to be selected in advance, but directly predicting it, which is faster and more suitable for real-time detection of dense targets, such as SSD [14], RetinaNet [15], YOLO series [16,17,18], etc. Therefore, one-stage target detection algorithms have become the mainstream choice for time-sensitive requirements.
YOLO series as a classic representative of one-stage algorithms, which is able to deal with classification and regression tasks at the same time, has the capability for fast detection, has a small model size, and also performs well in detection accuracy, which is suitable for deployment on embedded platforms and edge computing devices. In view of the limited backend arithmetic resources and deployment space resources of high-speed railway station guidance screens, this paper designs a closed-loop management framework based on train arrival and departure and the passenger guidance operation plan. The framework adopts the improved YOLOv5 model [19] for the target detection of the guidance screen and extracts the display information of the target area through the PaddleOCR model. The method can save arithmetic resources and construct a visual model to solve the target detection and text recognition challenges in the guided operation area while meeting the real-time and accuracy requirements. Finally, the method is validated and analyzed by experimental data. The main contributions of this paper are as follows:
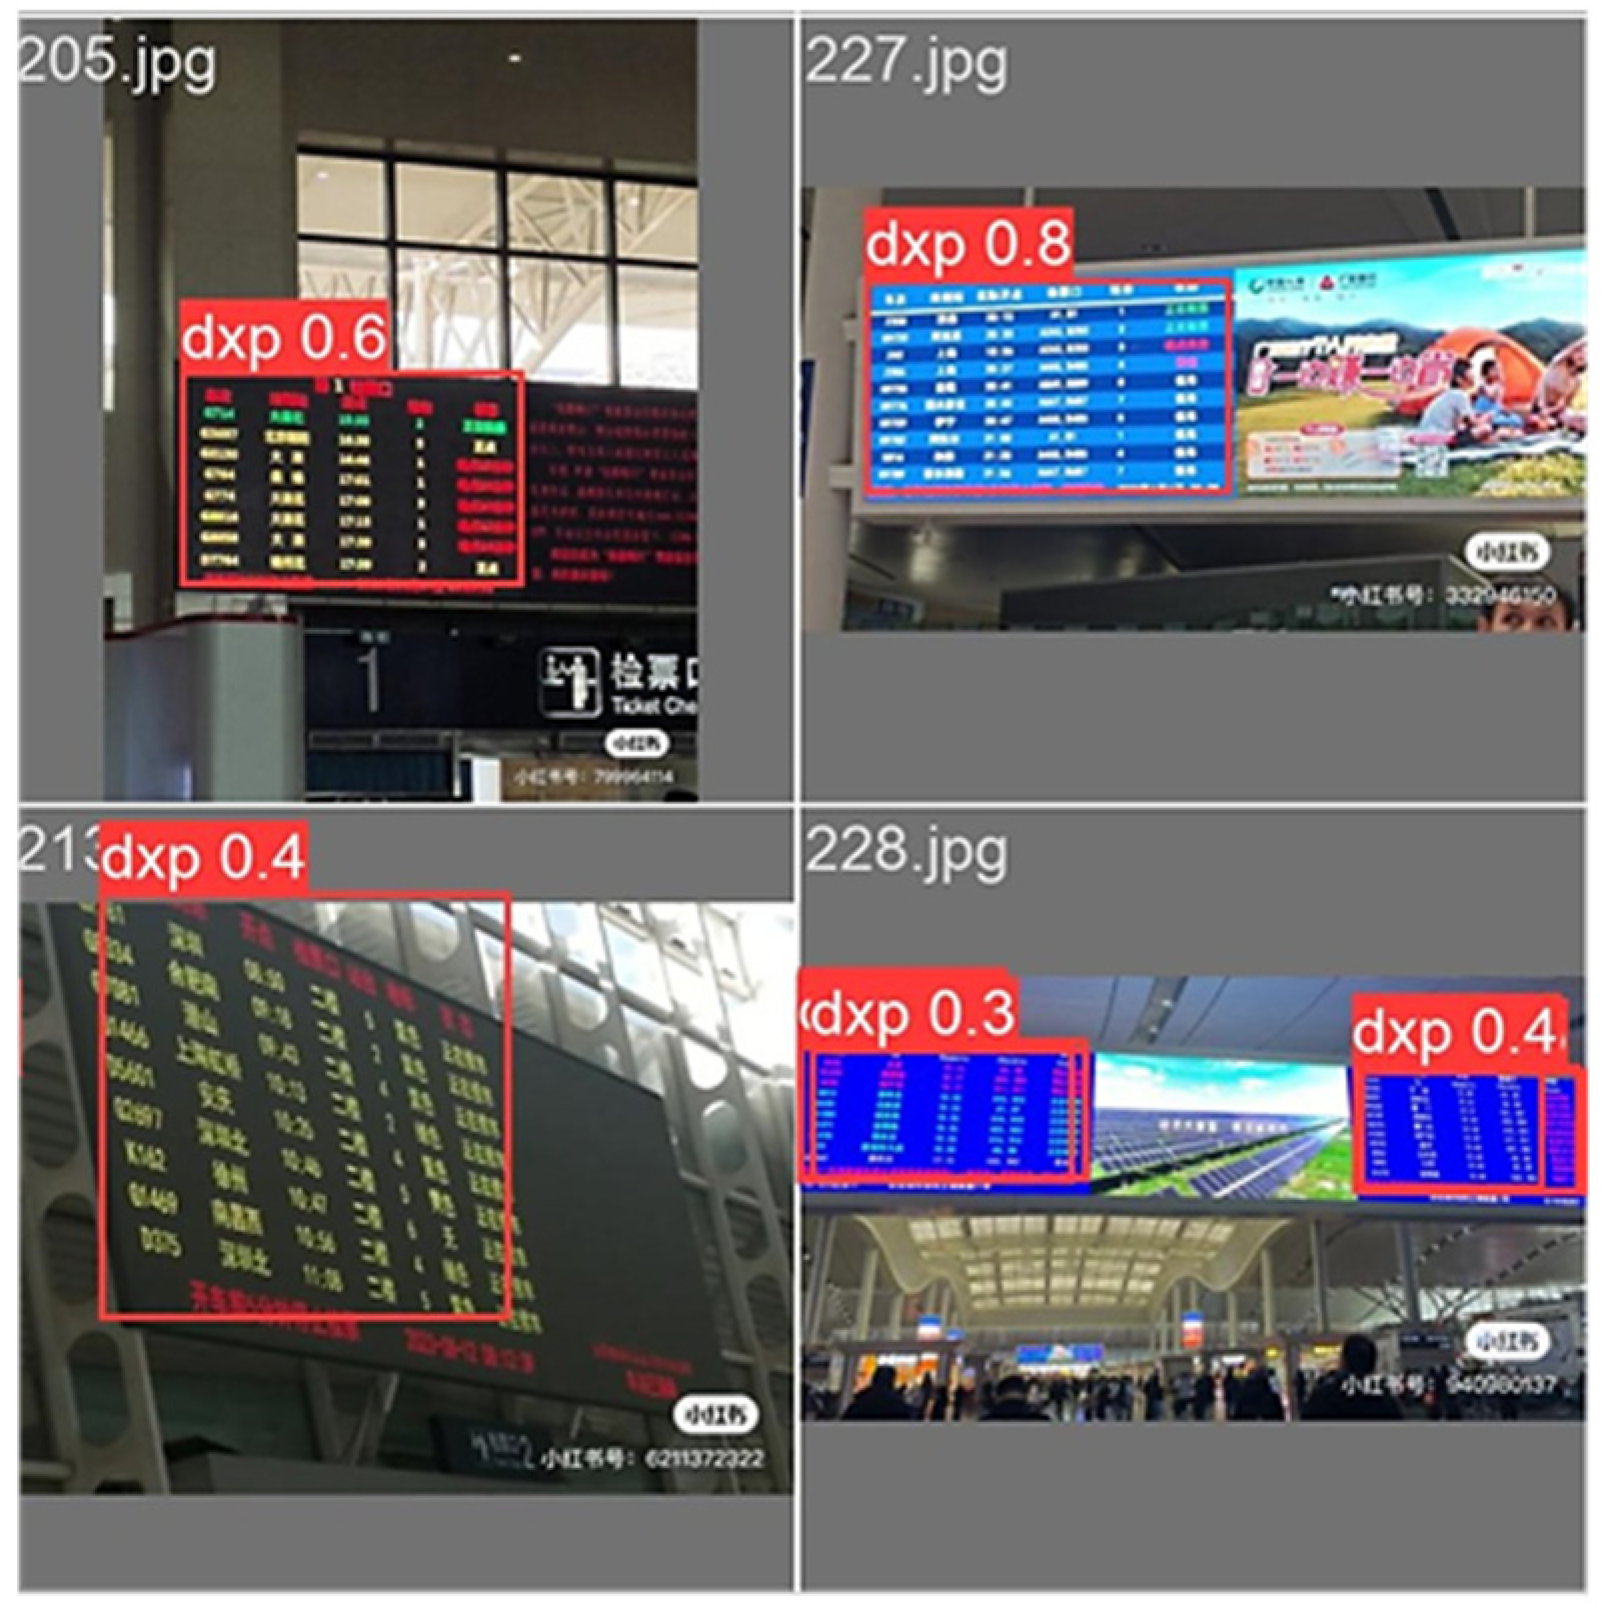
  • To address the issue of detecting text information within the target area, an automated closed-loop control method is proposed that integrates the YOLOv5 model with the PaddleOCR model.
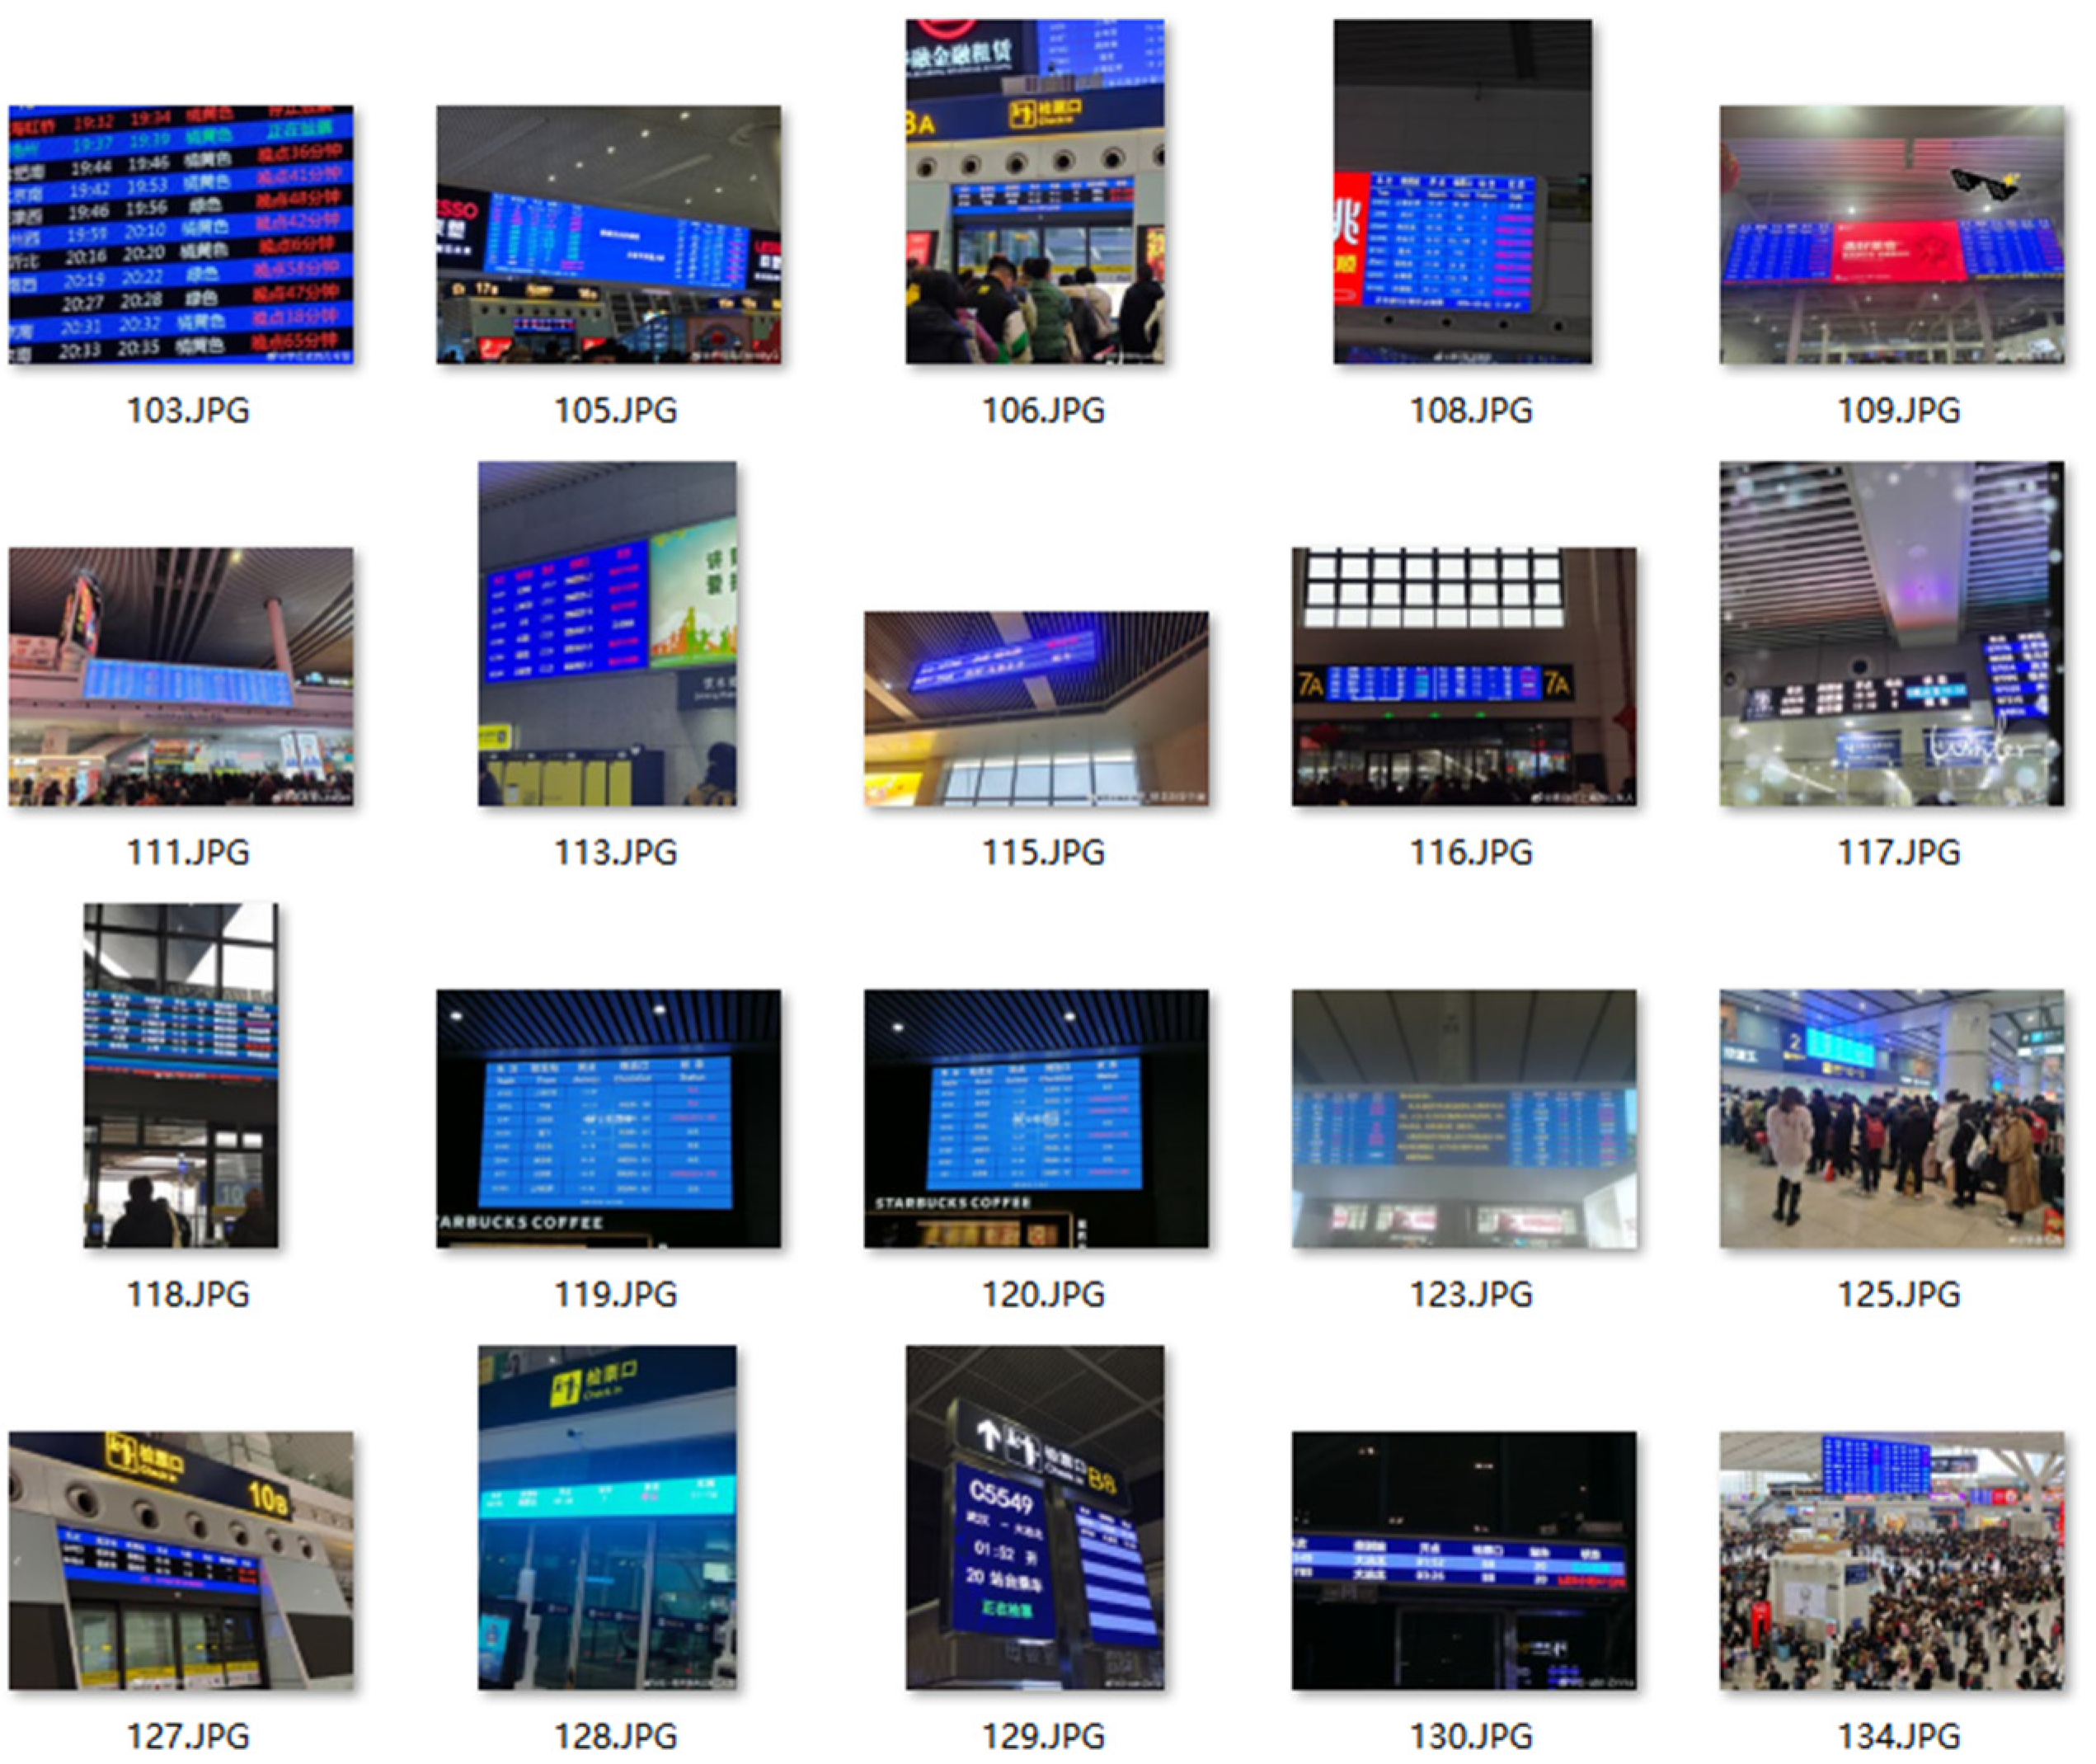
  • For the purposes of more accurately simulating the detection of guide screens, a comprehensive dataset comprising images of guide screens from high-speed rail stations has been assembled and developed.
  • A method of integrating the triple attention mechanism with the feature pyramid network to improve the accuracy and speed of detection is proposed.
The structure of this paper is as follows: Section 2 outlines the general framework of the closed-loop control system for the steering panel, detailing the improvements made to the YOLOv5 model and the PaddleOCR model. Section 3 describes the construction of the dataset and the experimental setup for the model, including the environment configuration, the training process, the ablation experiments, and the comparative experiments. The results of the model experiments are then discussed and analyzed. Finally, Section 4 concludes by discussing the potential applications of the proposed model in various fields and suggesting future research directions.

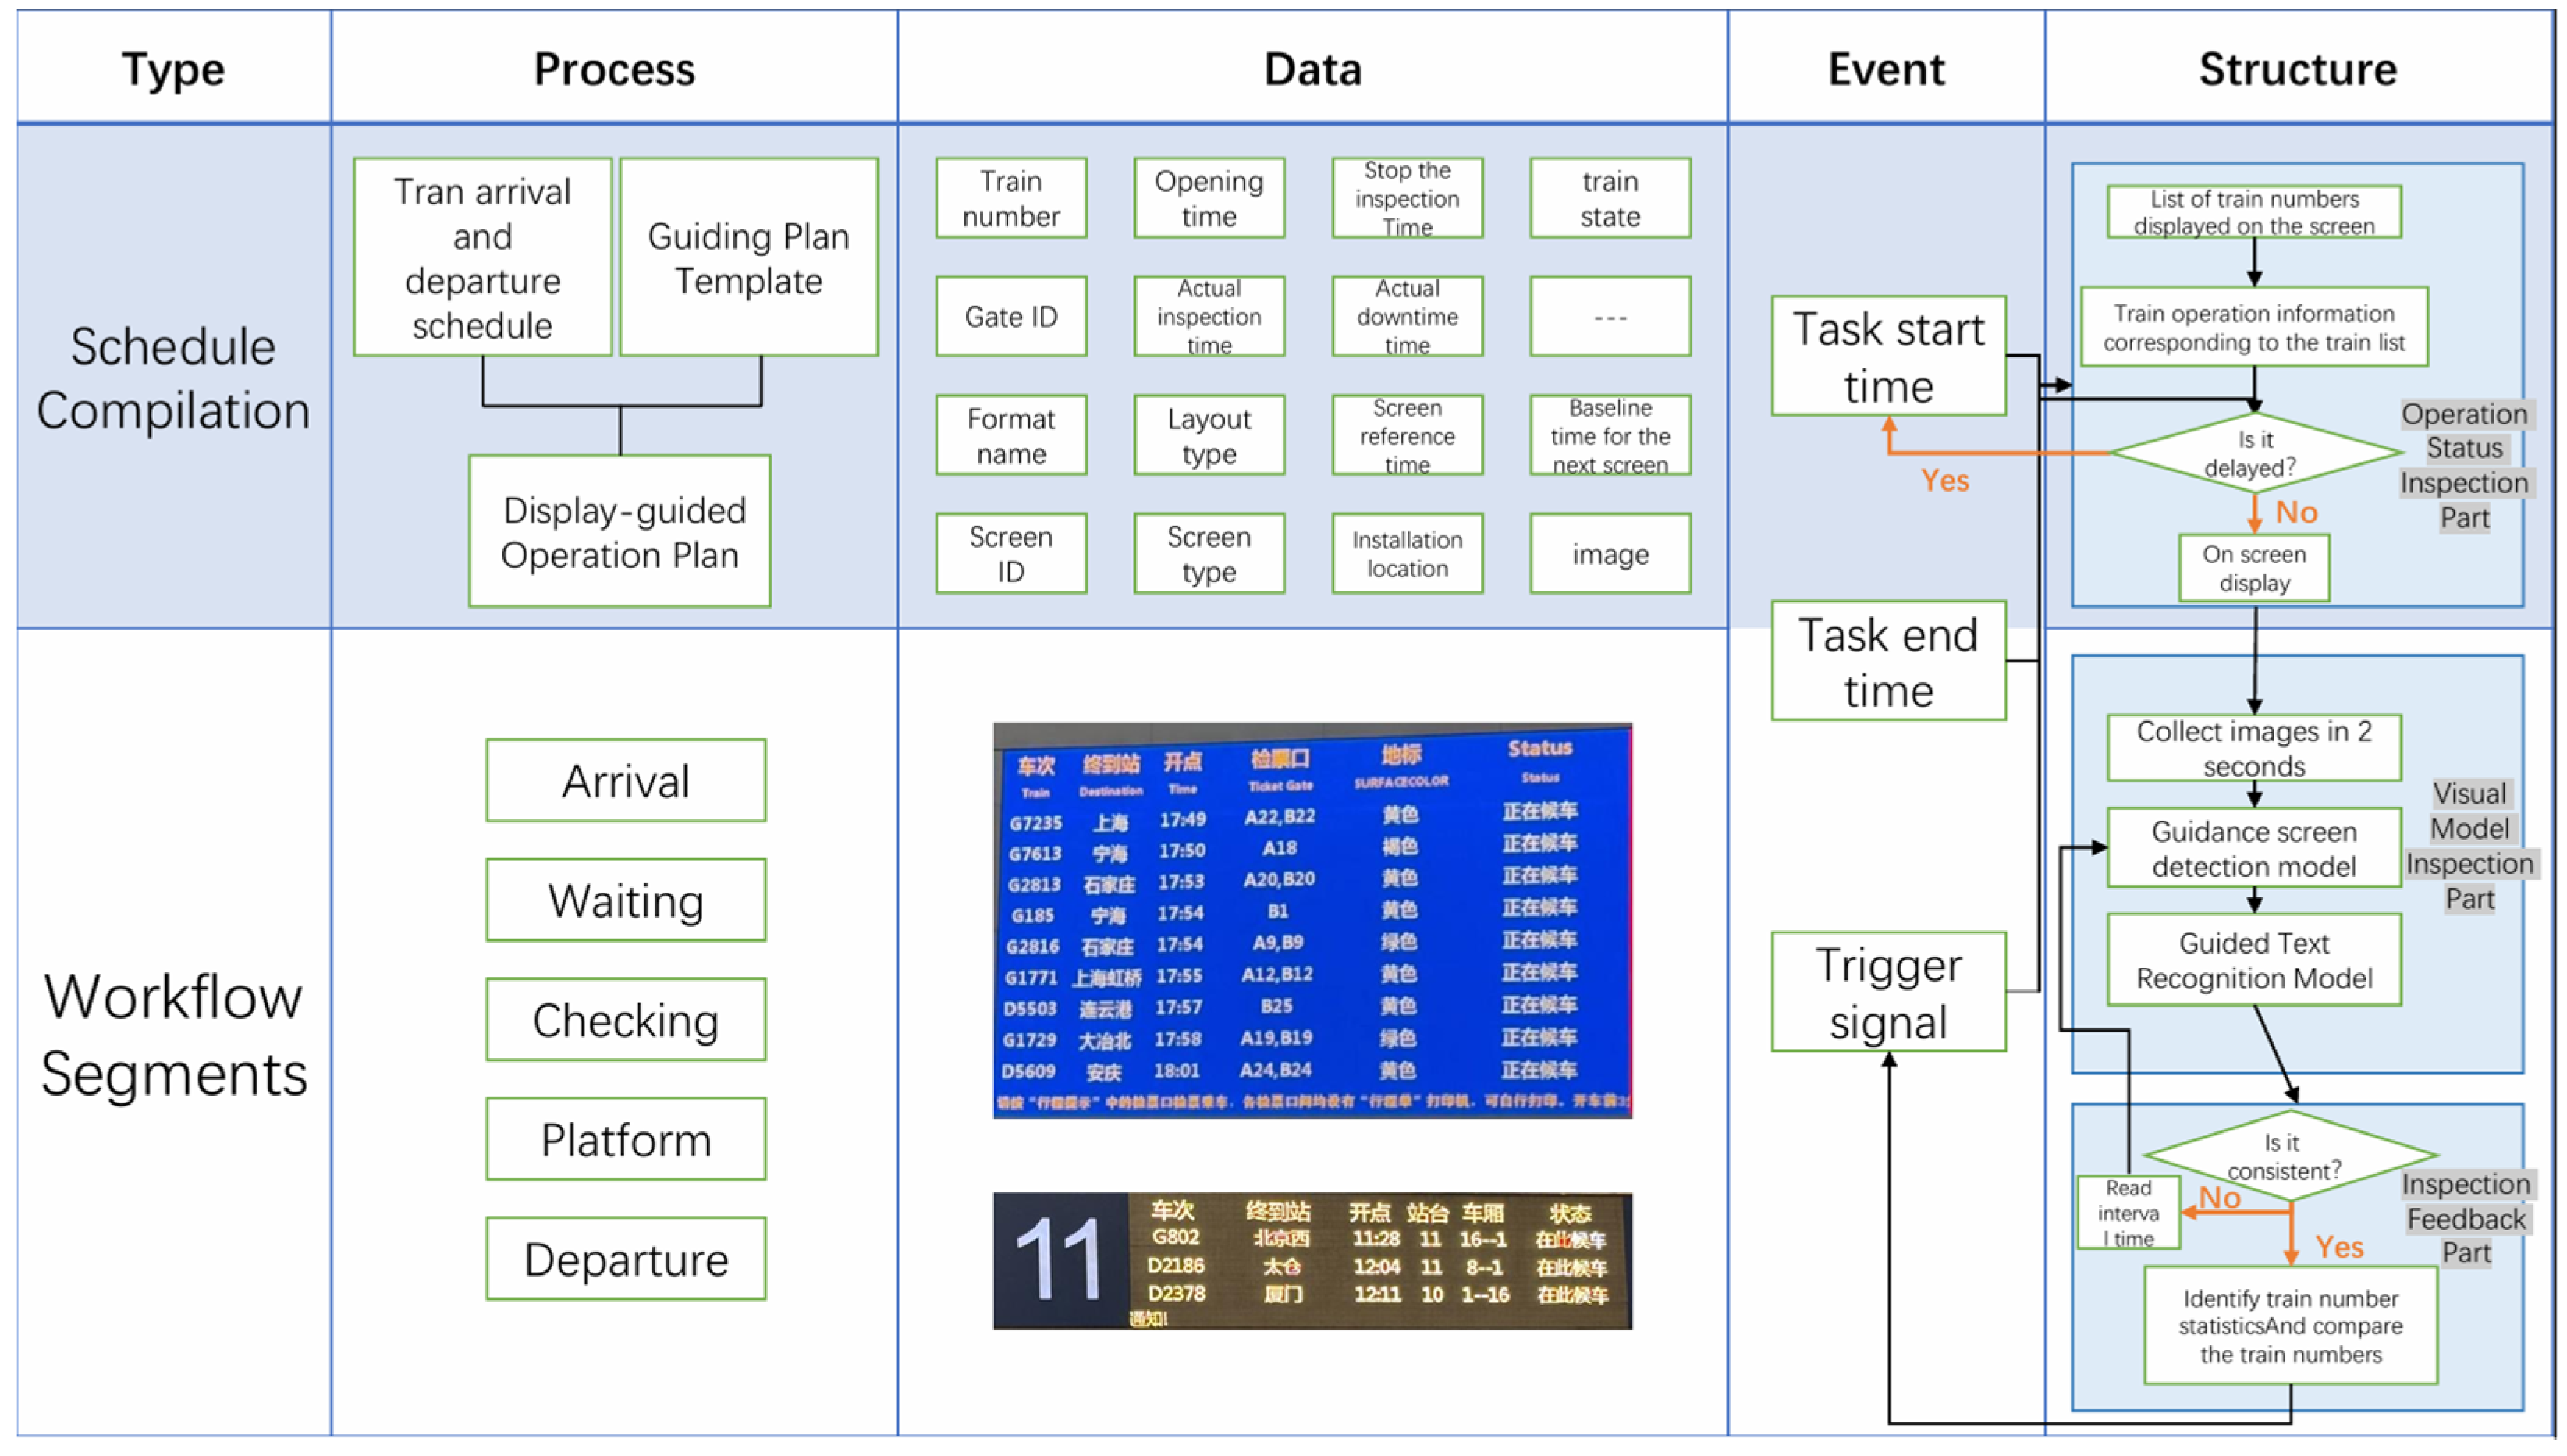
2. Design of Machine Vision-Guided Operation Closed-Loop Control Framework

2.1. Framework Design

The proposed framework is designed from the comprehensive consideration of five aspects: operation type, operation process, data involved, response events, and detection process structure. Its structure is shown in Figure 1. The framework design philosophy emphasizes enhancing the adaptability and responsiveness of the system to various operating states. The characteristics and advantages of the proposed method are discussed from the perspective of system adaptability.
In terms of operation types and processes, a flexible plan template is built in, which can be automatically adjusted according to the dynamic changes in the actual arrival and departure time of the train, thus providing suitable information display solutions for diverse display scenarios. Specifically, in the application scenario of railway passenger stations, the system provides the overall train operation information at the waiting hall level to ensure that passengers can obtain a comprehensive travel reference. At the same time, at each ticket gate, the system displays information about upcoming trains, including but not limited to the train number, destination, estimated departure time, and possible delay notices, so as to improve the waiting experience of passengers and the accuracy of station information services. This dynamic integration mechanism ensures that when the schedule changes, the system can quickly call new data, update the information display content, and maintain system stability and information accuracy.
At the data level, it can comprehensively collect and process key data such as train number, departure time, and operation status. By monitoring these data streams in real time, the system is able to detect any subtle changes in the train’s operating status and immediately invoke the relevant data to update the information display, demonstrating excellent adaptability to the dynamic operating environment.
In the event-triggering mechanism, an efficient state monitoring module is designed, which can trigger the screen display and detection signal only when the train state changes. This precise data call mechanism avoids unnecessary consumption of computing resources, reduces unnecessary continuous detection, and improves resource utilization efficiency and information processing accuracy.
In the detection process design, it is mainly divided into three parts. In the operation status inspection part, train delays are taken as the key index. The core of this link is to monitor and verify the timeliness of the information on the screen in real time to ensure accurate transmission of train operation statuses. In the visual model inspection part, the modified YOLOv5 model and PaddleOCR model are adopted to detect and recognize the content on the information screen. The purpose is double verification: once is to confirm whether the content displayed on the information screen is consistent with the actual state of the train, and the other is to check whether the display state of the display screen itself is in the normal working range. In the operation inspection feedback part, the emphasis is on train number statistics and comparative analysis. The purpose of this step is to provide a reasonable resource allocation plan for the station through accurate statistics on the number and type of trains, including the waiting room space, the number of ticket gates, and the allocation of service personnel, so as to improve the overall efficiency.

2.2. Machine Vision Models

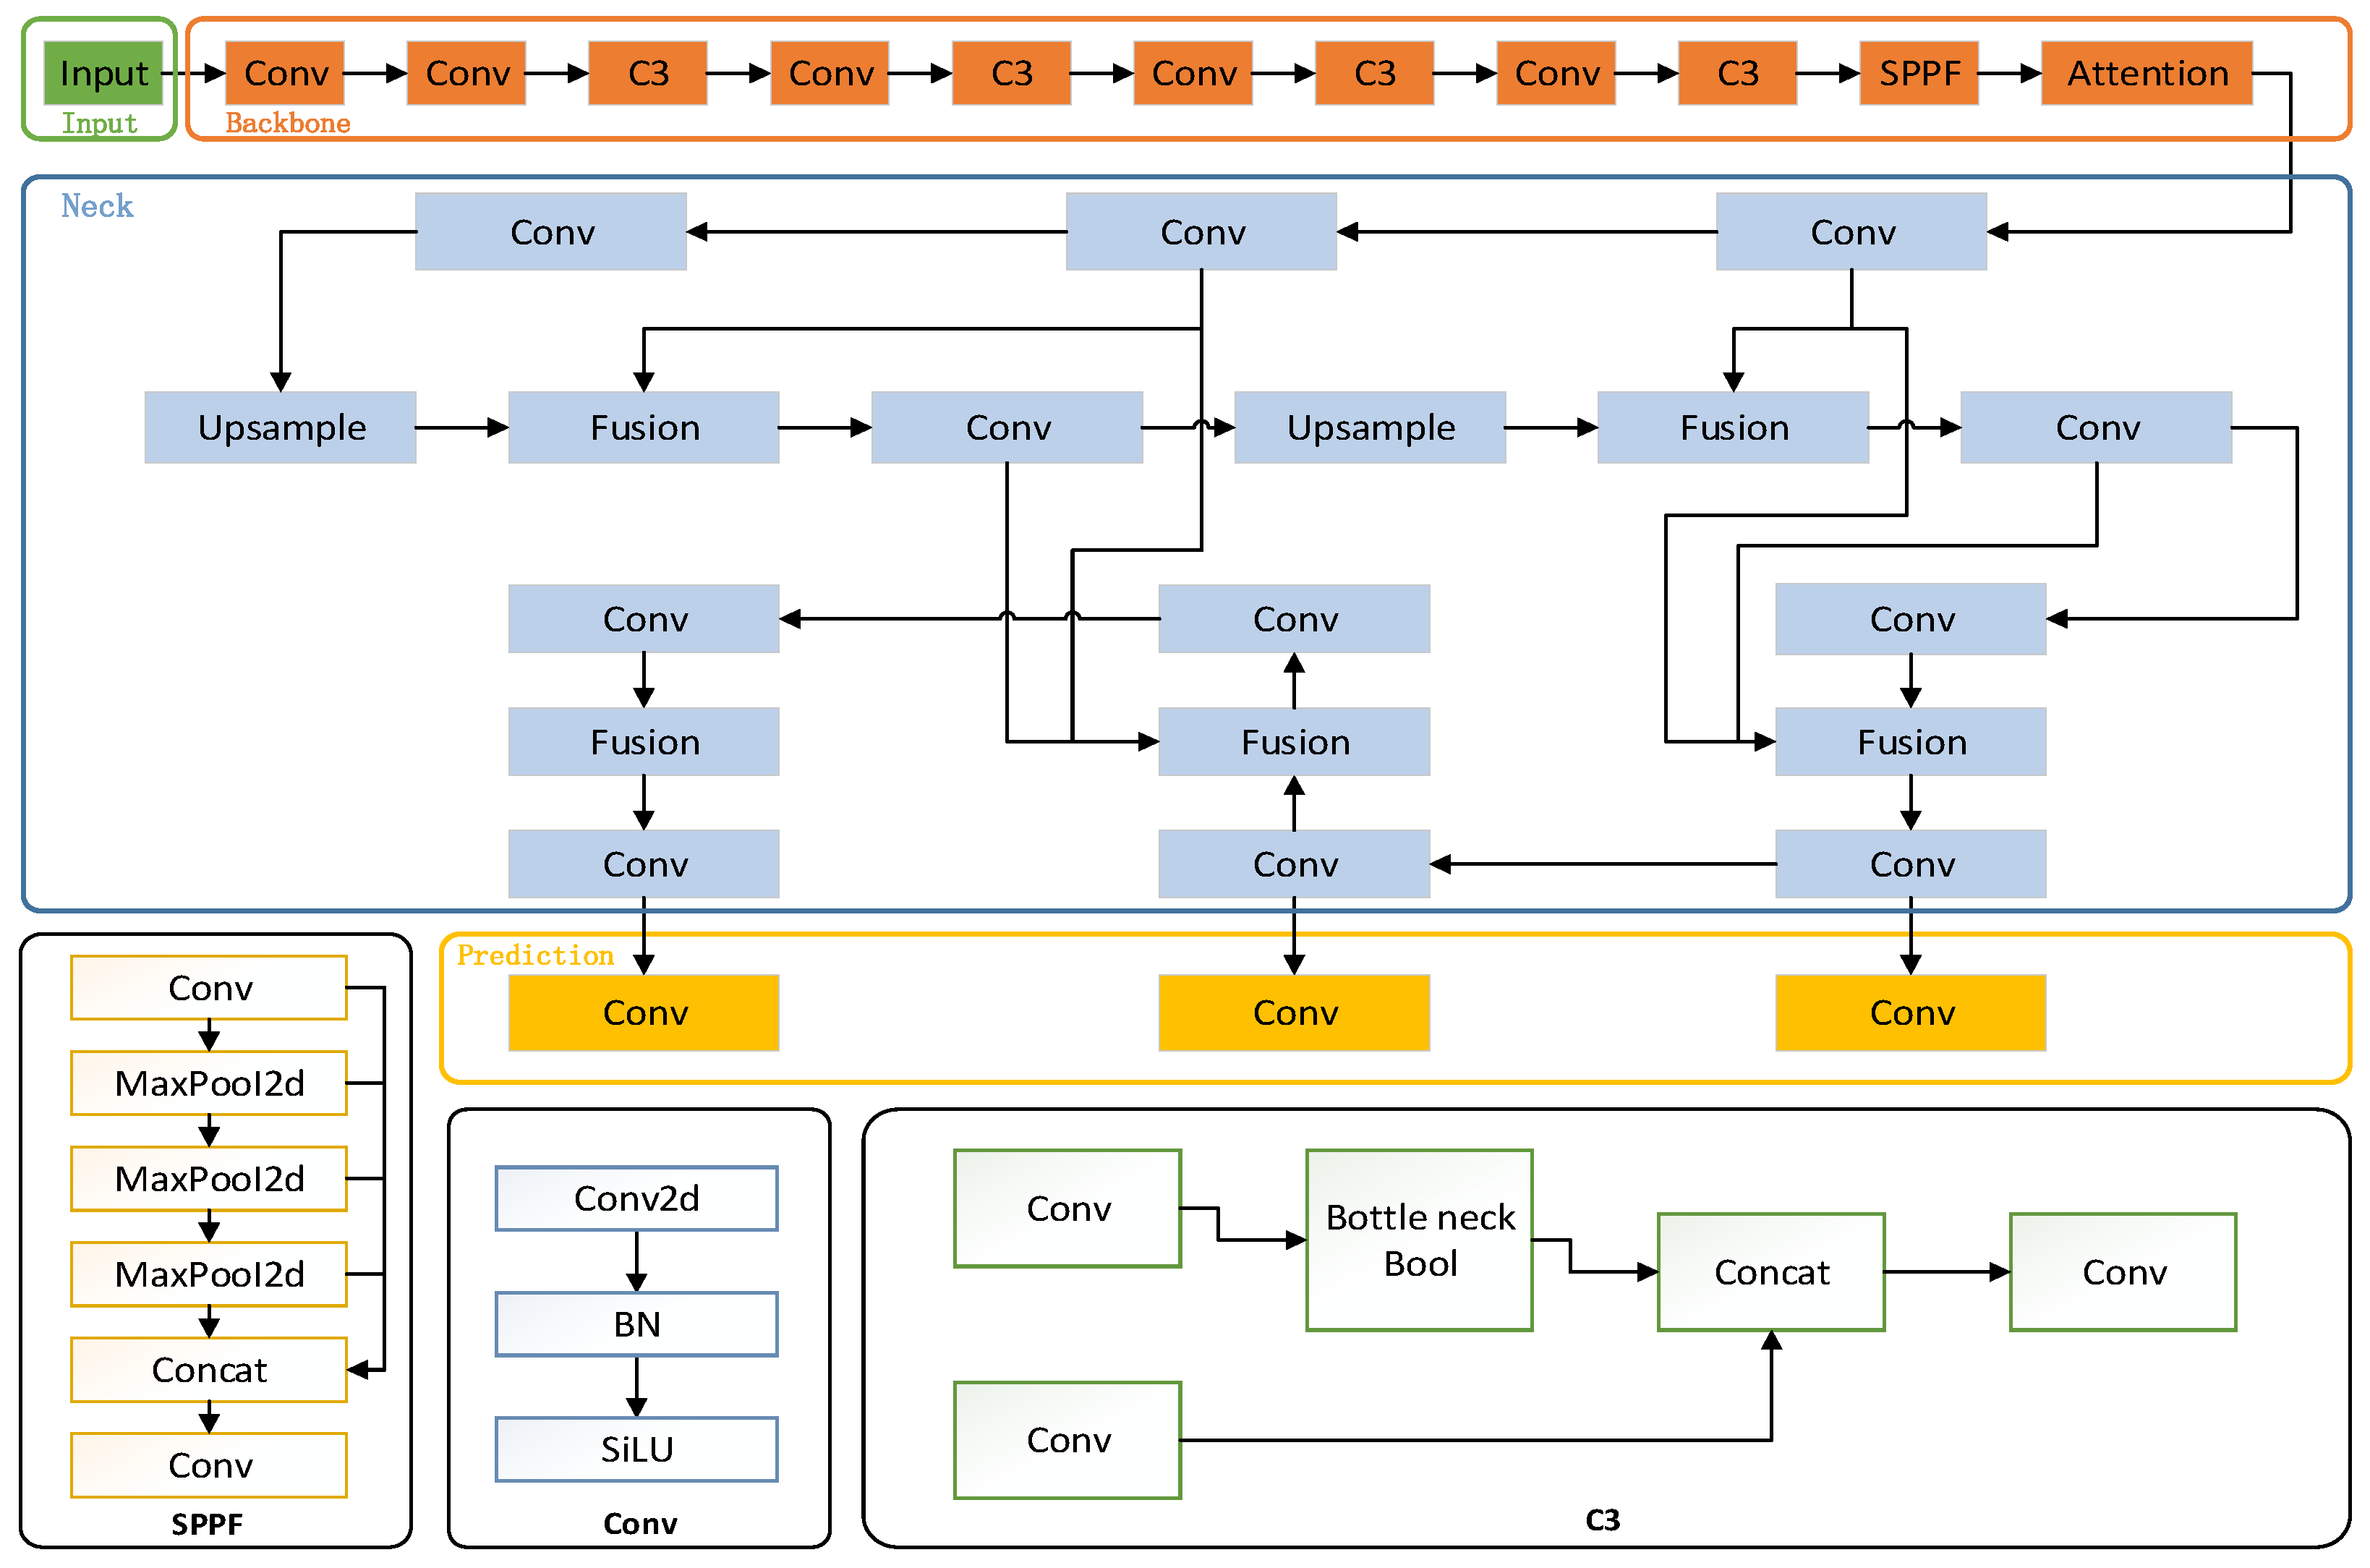
2.2.1. Based on the Improved YOLOv5 Guide Screen Detection Model

As YOLOv5 excels in multi-scale feature fusion using an optimized anchor frame design to predict bounding boxes of different sizes, YOLOv6 no longer uses the anchor frame aid, which converts the image to a uniform size through data enhancement at the input stage [20], which can have an impact on the accuracy of target recognition on different guiding screens. YOLOv8 also uses anchor frames to improve detection accuracy, but its complex model structure makes the detection speed lower, and YOLOv5 is more advantageous in small object detection and fastness. Therefore, this paper is based on the YOLOv5 network, and the improved target detection model structure obtained is shown in Figure 2. The network mainly includes four parts: Input, Backbone, Neck and Prediction. For the demand of faster response speed and high accuracy, as well as the characteristics of dense information and inconsistent colors of information in different operation status trains in the guiding screen image, in the Input part, the SPPF module is used to improve the SPP to improve the speed of the recognition processing without increasing the volume of the model, and the triplet-attention mechanism [21] is used to improve the model’s local feature extraction ability in the spatial dimension and the channel dimension. To address the problem of accurate recognition of guiding screen images with different scales, in the Neck part, through the feature pyramid network, the Fusion [22] module is added to perform multi-scale feature fusion on the features extracted from the Backbone to improve the model’s recognition ability of the operating area of the guiding screen; through fusion of multi-scale feature maps outputted from the Backbone and the Neck layers, the model is enhanced in the detection of the performance of the model in detecting targets of different sizes and contextual relationships by fusing the multi-scale feature map output from the Backbone and Neck layers.
In YOLOv5, the SPP module achieves the acquisition of sensory field information by maximizing different kernel pools and fusing features, which significantly enhances the representation of the feature map. The main optimization of SPPF for SPP is that the original parallel structure of SPP is changed to a serial structure, which achieves a faster processing speed [23]. In addition, SPPF further enhances the efficiency of feature extraction by specifying a convolutional kernel so that the output after each pooling becomes the input for the next pooling. The SPPF module and the FPN network aim to enhance the model’s ability to detect targets at different scales through multi-scale feature fusion, which allows the model to focus on important features at multiple scales. The attention mechanism enhances the representation ability of the feature maps at different levels in the FPN, enabling the model to better capture the detailed information of the target. Therefore, the feature maps at different scales generated from the Backbone and Neck layers are further fused through SPPF and FPN, and the model’s detection performance for targets of different sizes and contextual relationships is improved by combining the high-level semantic information with the low-level detail information through up-sampling and splicing operations. The above improvements can make it possible to shorten the detection time and improve the detection accuracy when detecting the guide screen area.
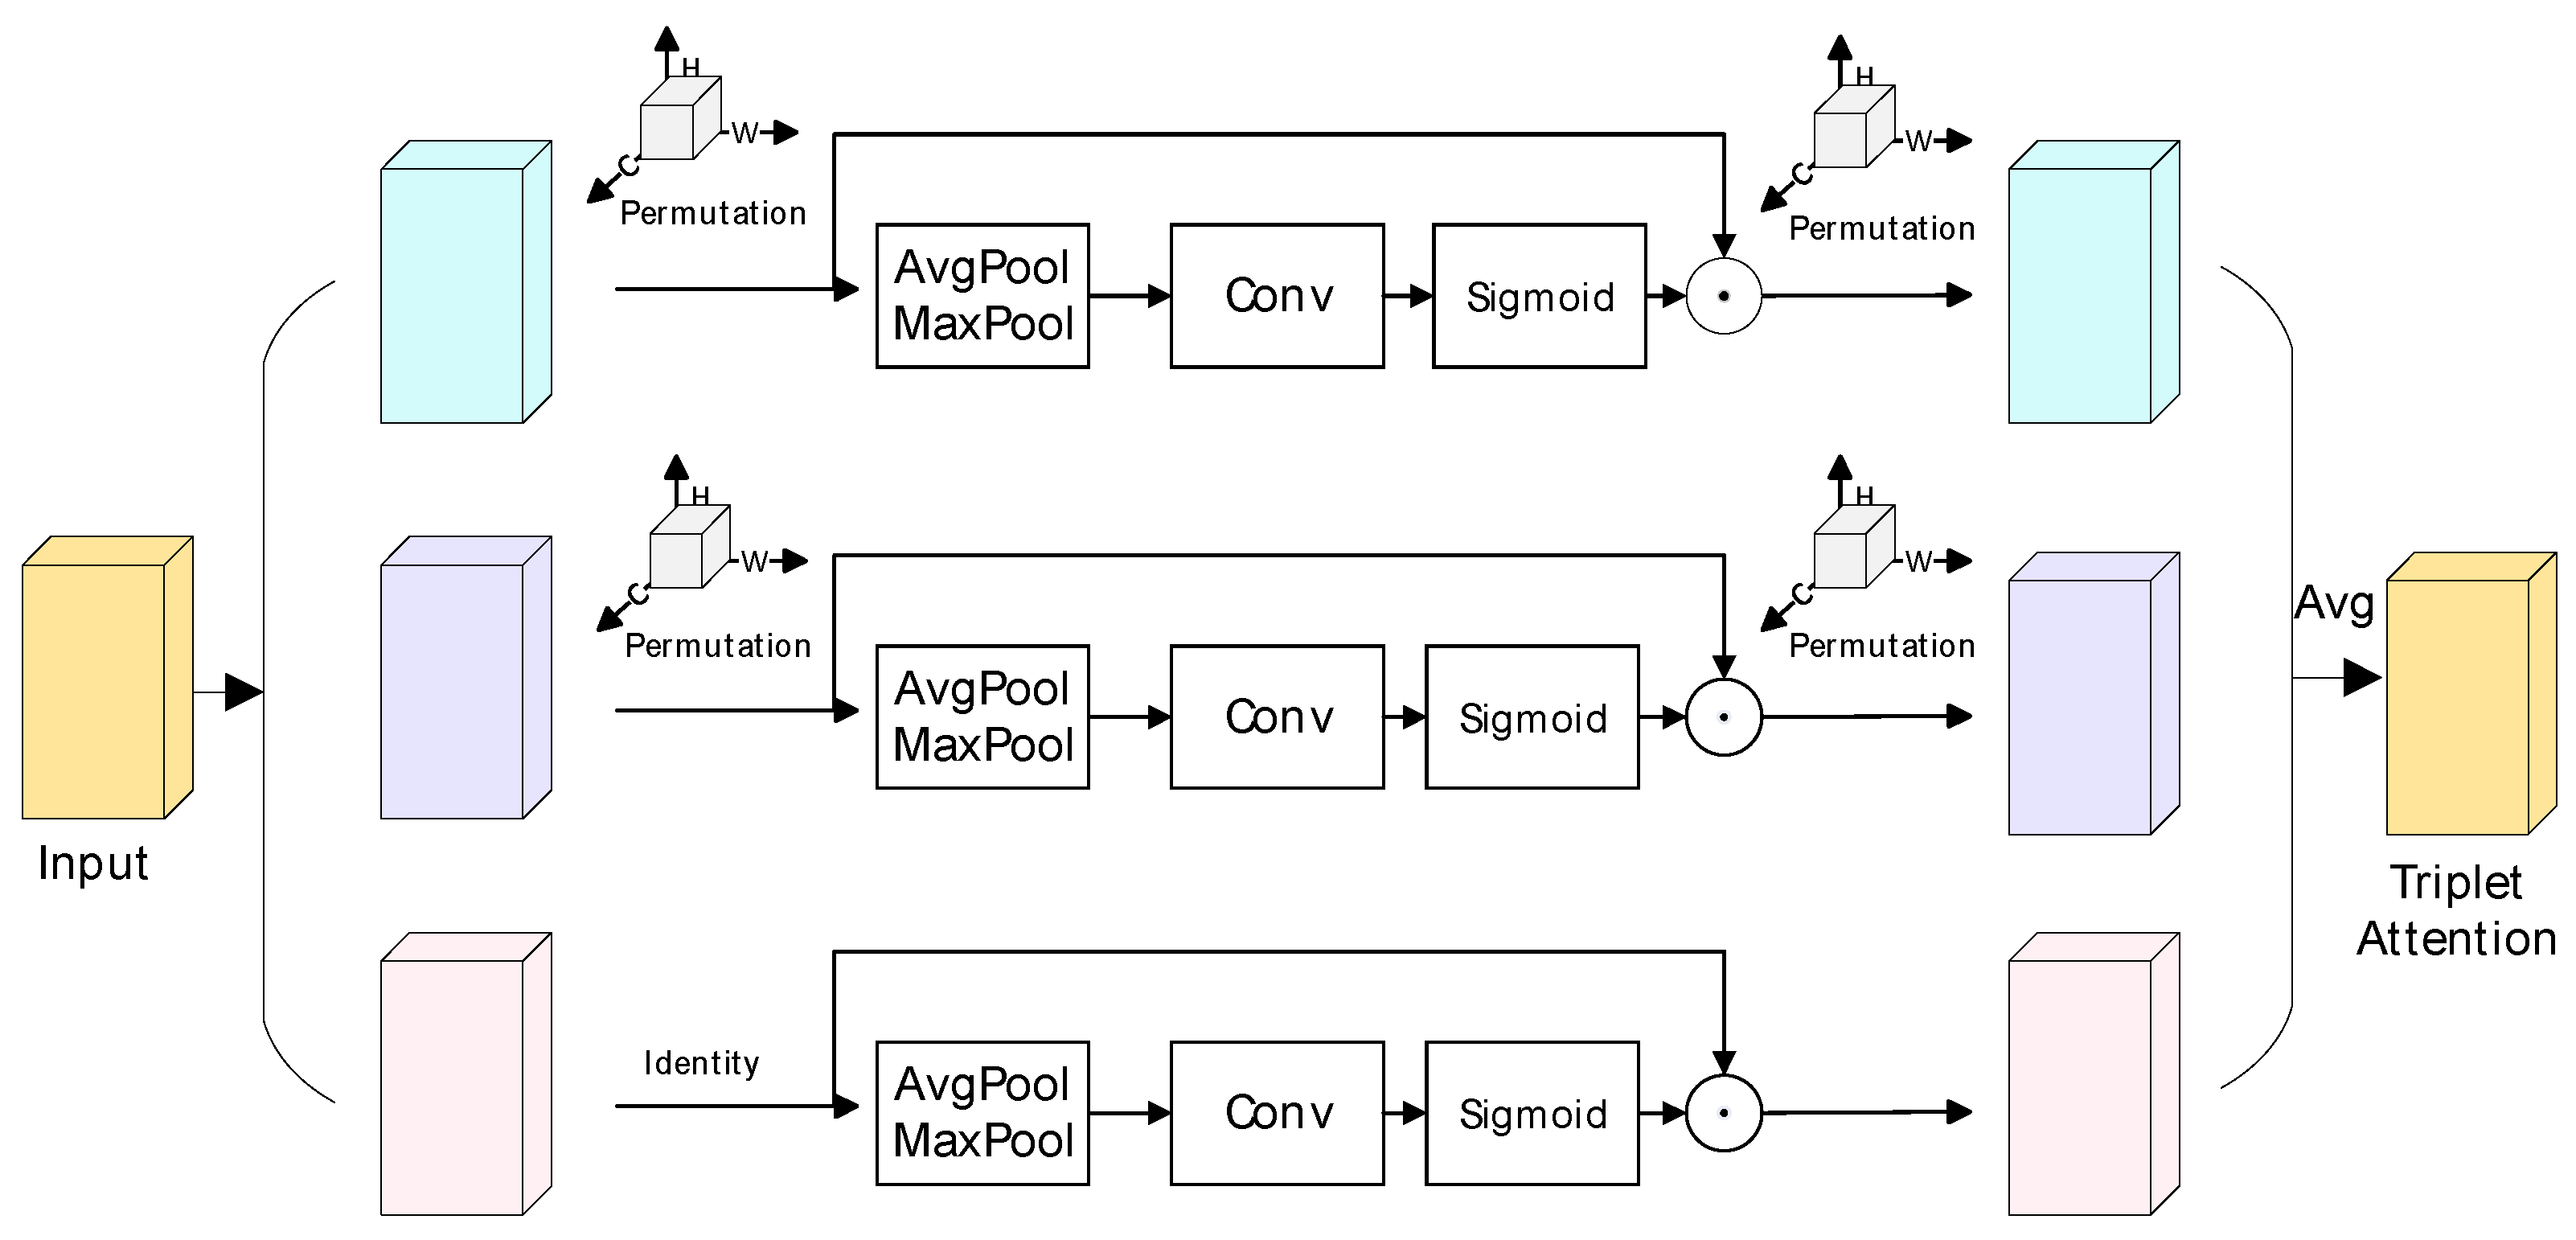
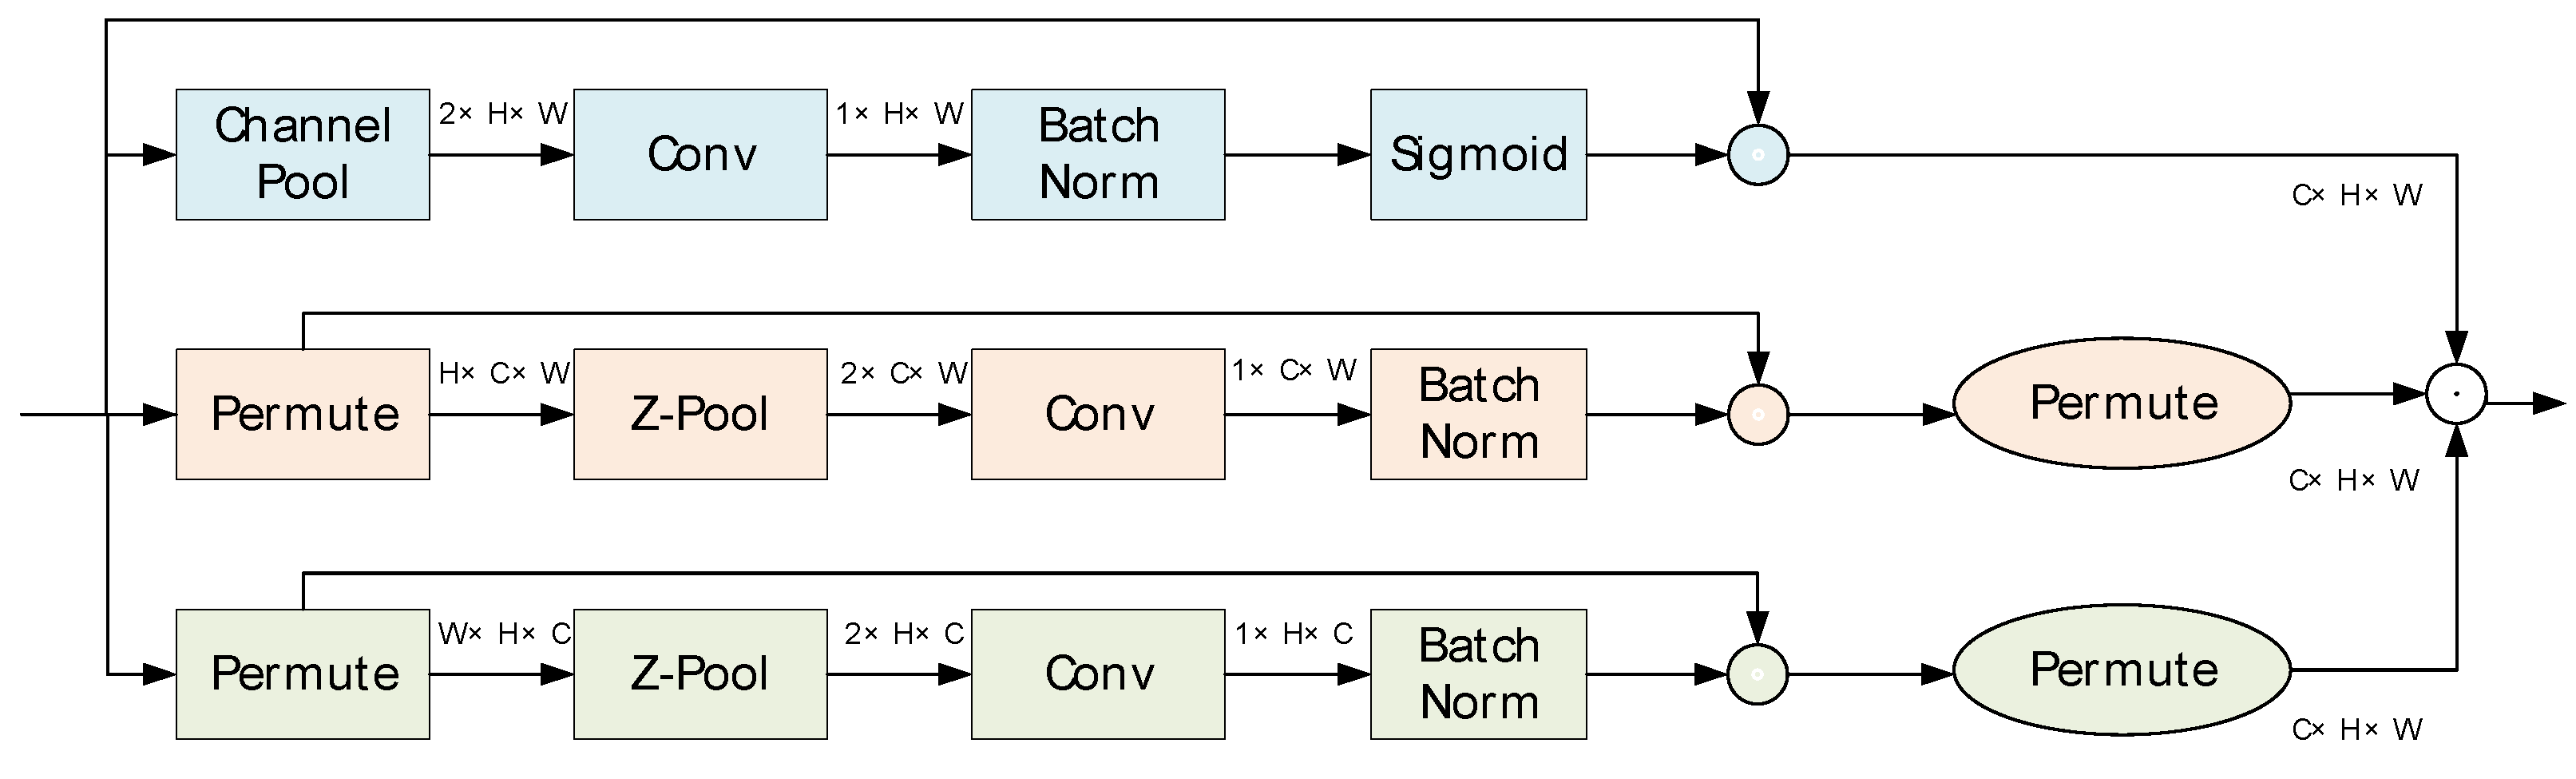
  • Triplet Attention Mechanism
The core idea behind the triplet attention mechanism lies in the use of a three-way parallel structure in order to explore the interactions between data in different dimensions and thus assign different importance weights to the input data. The principle is shown in Figure 3, where initially, the input feature tensor is fed into three branches, each of which independently performs a specific reorganization of the tensor to capture cross-dimensional interactions from different perspectives. Subsequently, the restructured features are processed through pooling and convolutional layers to compute attention weights, which are normalized by a Sigmoid activation function. Multiplying the computed weights with the restructured features enhances the critical features and reduces the impact of non-critical features. Finally, the features are transformed back to their original dimensional layout. Since the triplet attention mechanism handles both spatial and channel dimensional interactions and is computationally efficient, it significantly improves the performance of the network in visual tasks [24].
The structure of the triplet attention mechanism is shown in Figure 4. The mechanism not only efficiently captures the interdependence between channels as well as spatial locations but also has a relatively low computational cost. The three parallel branches of triplet attention are used to reveal the interaction information between the spatial dimension (height H and width W) and the channel dimension (C), respectively. Each branch takes the input tensor through reorganization and processes it through a pooling layer (Z-pooling) and a convolutional layer of dimensions to produce the corresponding attention weights, which are processed by a Sigmoid activation function, applied to the reorganized input tensor, and restored to the original data structure.
2.
Characteristic Pyramid Network
The feature pyramid network (FPN), an improvement and adaptation of the feature fusion variant in YOLOv5, is fundamental for achieving multi-scale feature fusion and consists of multiple feature maps at different scales, each representing a specific scale. These feature maps are constructed in a bottom-to-top order, and different spatial sampling strategies are used for each layer of feature maps to ensure that feature information at each scale is preserved.
The FPN structure enhances the transfer of semantic features through a top-down process, while the bottom-up process enhances the transfer of localization features, enabling deep feature aggregation for different layers of the detection task. The FPN structure is shown in Figure 5, where the top-down transfers and fuses the high-level feature information through up-sampling to obtain the predicted feature map. The left pyramid is the result obtained after down-sampling from bottom to top, while the right pyramid represents the network structure after up-sampling the top layer of the left pyramid. The fusion of the feature maps is achieved by lateral joining, i.e., combining the output of the up-sampling with the feature maps of the same size in the left pyramid, and finally reducing the aliasing that may be induced by the up-sampling by an additional convolution operation.
The feature pyramid module plays a crucial role in the task of detecting the guide screen operation area at a high-speed railway station. By fusing different levels of feature maps in the network, a multilevel feature representation is formed, which effectively solves the problem of different scales and enables the network to detect guide screen operation areas of different scales simultaneously. The feature pyramid module solves the feature misalignment problem by helping the network to better align features at different levels through side connections and top-down paths. In addition, it is able to combine low-level features with high-level features, which helps the network to better identify the guide screen operating regions.

2.2.2. PaddleOCR-Based Text Recognition Model

PaddleOCR is an open source, highly efficient Optical Character Recognition (OCR) system known for its superior accuracy and robustness in the text recognition field. PaddleOCR’s lightweight design allows it to run very smoothly on resource-constrained devices. In addition, PaddleOCR can be flexibly integrated into various applications, including mobile applications and embedded systems. It is mainly used for multi-language recognition, such as Chinese, and has shown excellent recognition results. When dealing with text recognition in different versions of guided work, it can accurately identify the text information on the guided screen, which provides reliable data for the statistical analysis of information in the subsequent work detection and feedback module. Therefore, this paper chooses PaddleOCR as the text recognition algorithm to recognize the text in the guiding screen area, which provides strong technical support for text recognition in the guiding screen area due to its high accuracy in recognizing Chinese and other characters.

3. Experimental Results

3.1. Dataset

Since the existing publicly available text recognition datasets are mainly used for detecting and recognizing all texts, and most of them annotate street billboards and are used to distinguish billboards, traffic signs, and other signs, they lack information on the types of high-speed railway station guidance screens and are not applicable to the needs of a high-speed railway station for guidance screen detection. In order to study and evaluate the effect of the visual model design of HSR station guidance screen in practical application, this study constructs the High-Speed Rail Station Guidance Screen Photo Dataset. The objective of this dataset is to provide a series of real, high-definition images of high-speed railway station guidance screens for evaluating the usability of the visual model of the guidance screens, which covers different types of station entry screens, ticket screens, platform screens, etc., and includes images of different scales and angles of the guidance screens with different layouts (white characters on yellow background, white characters on blue background, etc.) and thematic guidance in complex scenarios. The data sources are the image information extracted from the established cameras at the passenger station site, the guiding screen collected from the network, and the image information taken at the site. According to the type of guidance screen classification, it is mainly divided into two categories: one is the LED black and yellow screen, as shown in Figure 6, and the other is the LCD blue and white screen, as shown in Figure 7; both types of guidance screens are installed indoors.
In this paper, we use the self-constructed high-speed railway station guide screen photo dataset to compare the performance of different detection algorithms in terms of performance test and accuracy. The data are annotated using an image annotation tool (LabelImg-1.8.0). The HSGSPD dataset has a total of 3020 images and is sequentially divided into training, validation, and test sets in the ratio of 6:2:2. Among them, 1812 images are used as training data, 604 images are used as validation data, and 604 images are used as test data.

3.2. Experimental Setting

The experiments were conducted using the Python3.9 language as well as the PyTorch2.1.2+cpu deep learning framework. The main parameters for algorithm training are the use of an SGD optimizer, a setting threshold of IoU at 0.25, and a number of experimental model iterations of 20 rounds. The software development environment and hardware development platform configurations for this paper are shown in Table 1 and Table 2, respectively.

3.3. Evaluation Indicators

The evaluation metrics for this study using the guide screen detection algorithm are as follows:
(1)
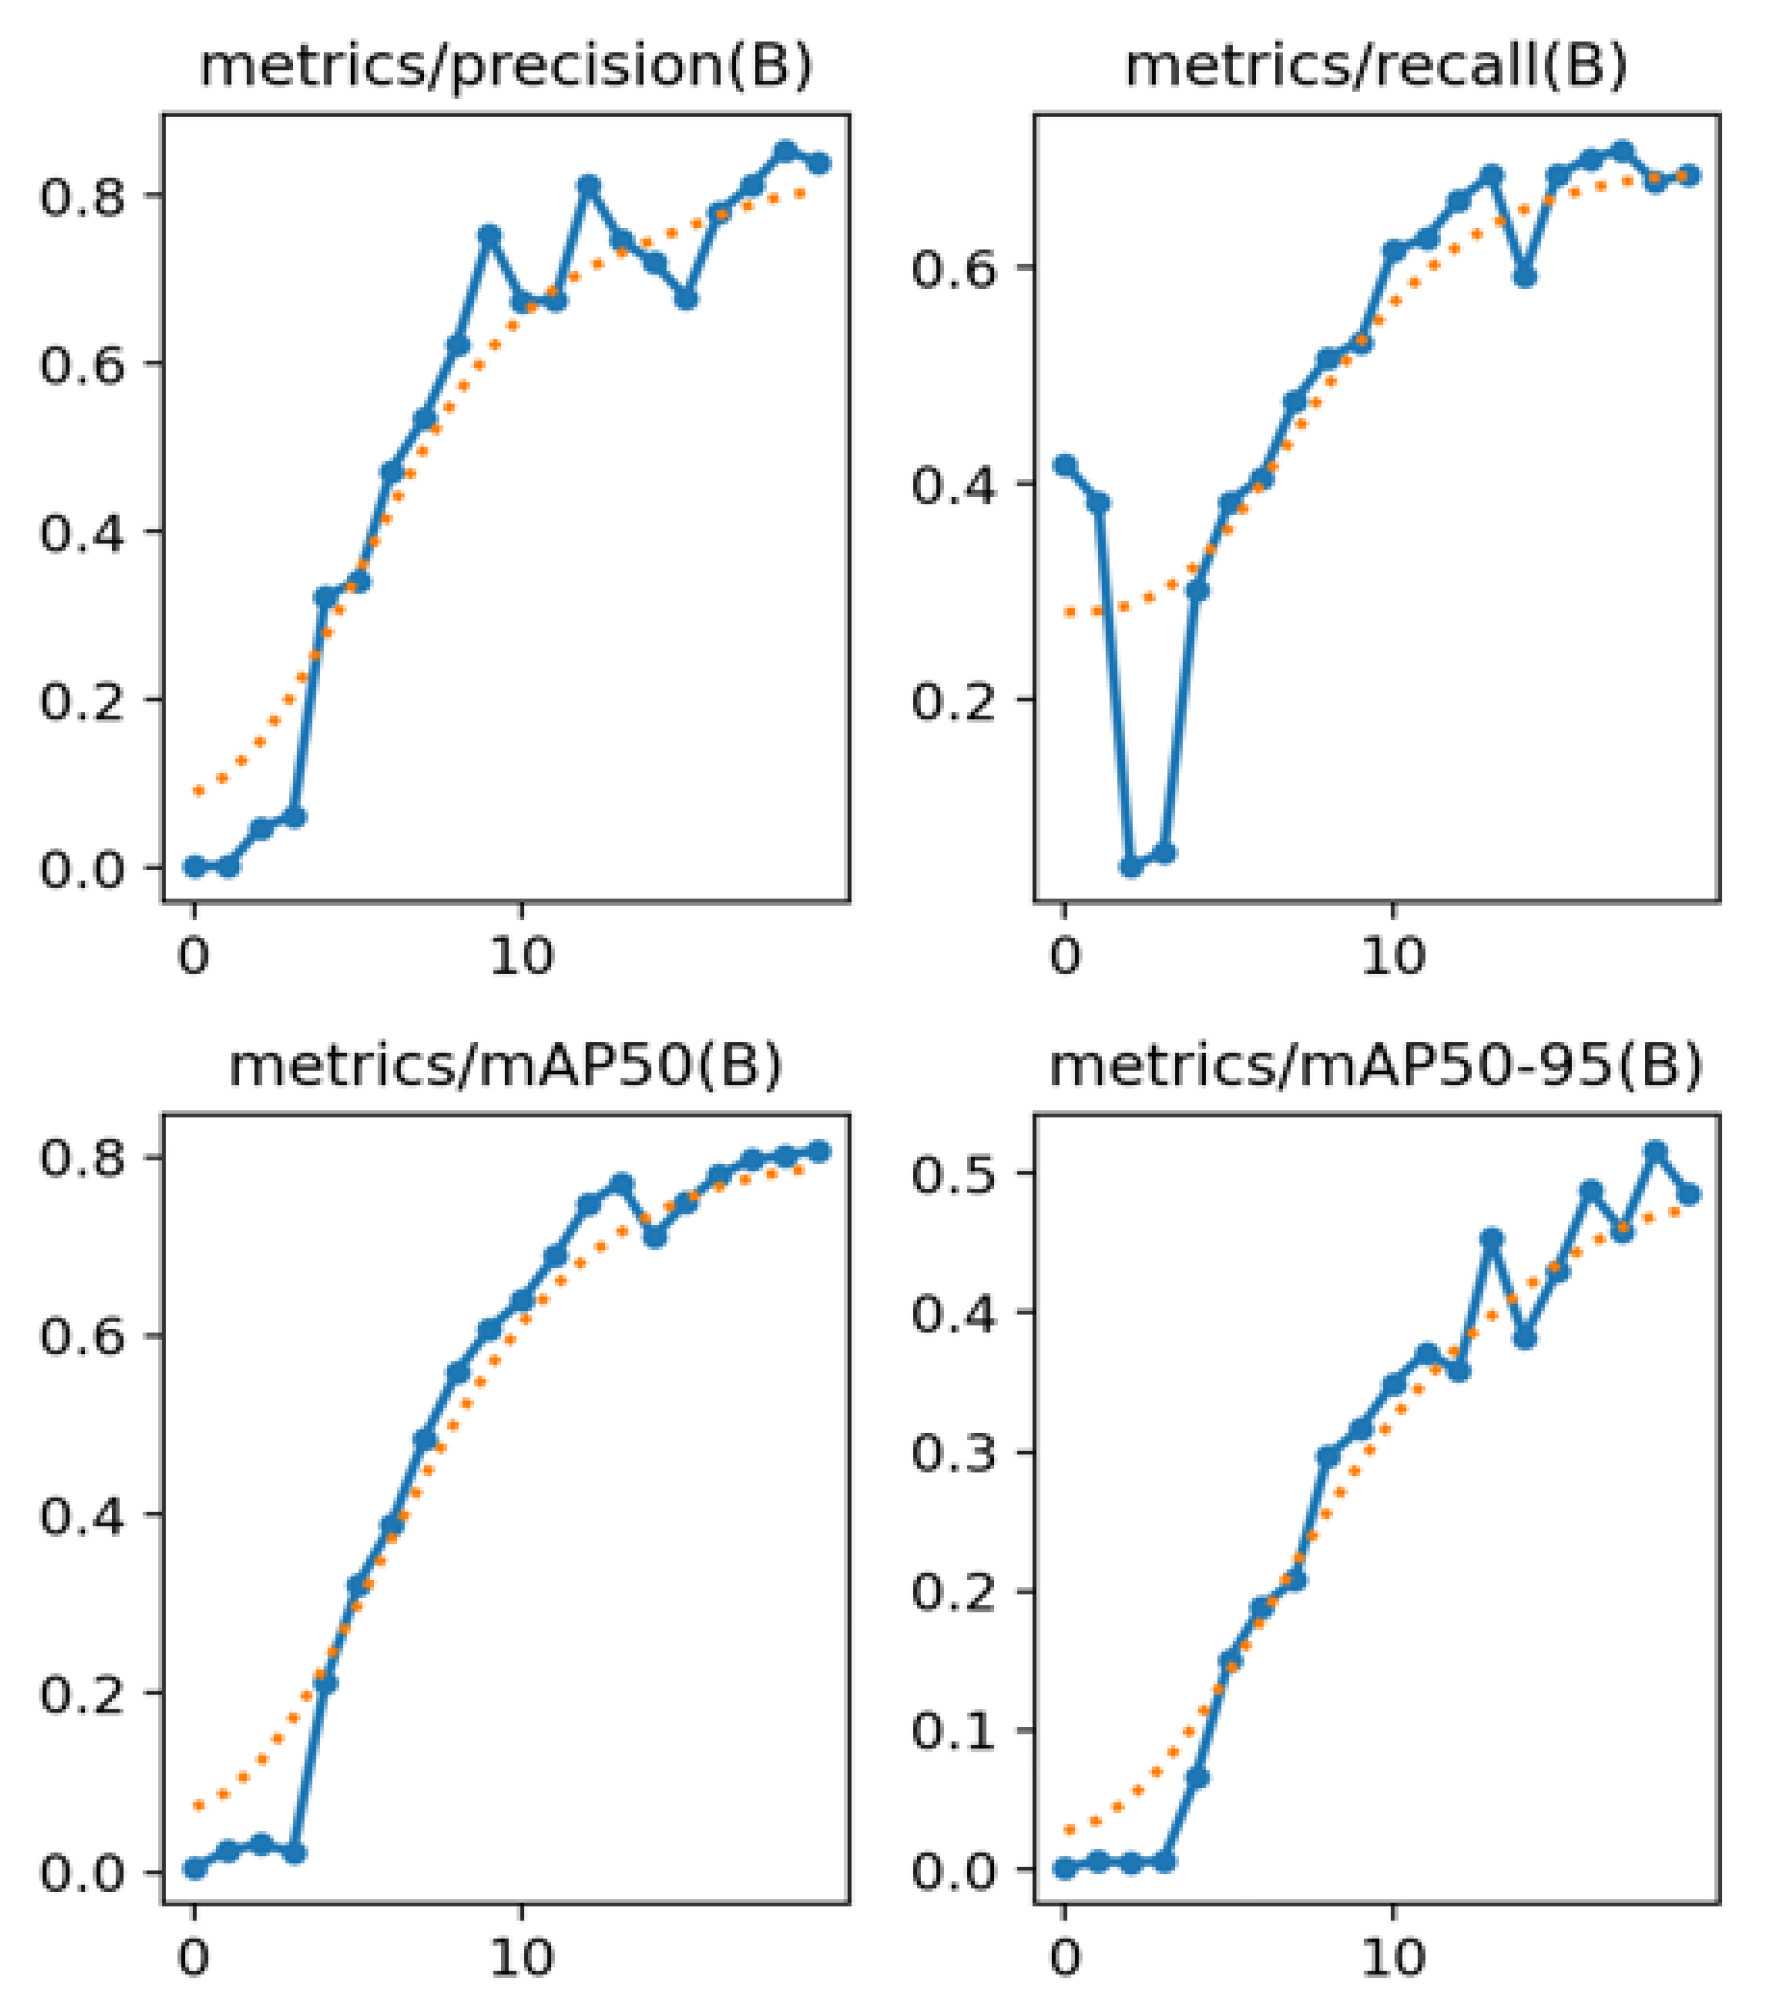
Precision indicates the proportion of positive samples detected that are truly positive, i.e., the accuracy of the detection frame. Precision rate is defined as follows:
P r e c i s i o n = T P T P + F P
where TP (True Positive) denotes the number of positive samples predicted as positive and FP (False Positive) denotes the number of negative samples predicted as positive.
(2)
Recall indicates how many of the actual positive samples are detected, i.e., sensitivity. Recall is defined as follows:
R e c a l l = T P T P + F N
where TP (True Positive) denotes the number of positive class samples correctly identified by the model and FN (False Negative) denotes the number of positive class samples incorrectly identified as negative by the model.
(3)
Comprehensive Evaluation Indicator F-Measure (F1 Score) is used to weigh precision and recall. F-Measure is defined as follows:
F 1   S c o r e = 2 R e c a l l     P r e c i s i o n R e c a l l + P r e c i s i o n
In target detection tasks, which are often used to evaluate model performance, especially when dealing with unbalanced datasets, it is important to consider precision and recall together.
(4)
mAP50(B) is a metric used to comprehensively evaluate the performance of a target detection model at an IoU threshold of 0.5.
(5)
mAP50-95 is a metric used to assess model performance, which represents the average of the model’s Average Precision across all categories as the IoU (intersection and concurrency ratio) threshold is varied from 0.5 to 0.95.

3.4. Experiments on the GPU

The model box loss, classification loss, and deep feature loss curves over time are shown in Figure 7. These metrics are used as key performance indicators to guide model learning, and each represents the model’s performance in target localization, classification, and feature extraction.
Box loss: In guided screen recognition detection, box loss is used to measure the deviation between the target bounding box predicted by the model and the actual target bounding box. Box loss is usually calculated based on the location (e.g., coordinates of the center point) and size (e.g., width and height) of the bounding box. By minimizing the box loss, the model is able to learn how to more accurately locate the target on the guidance screen.
Classification loss: Classification loss is used to measure the accuracy of the model’s prediction of the target category on the guide screen. In guidance screen recognition detection, classification loss measures the difference between the model’s output category probability distribution and the true category labels. By minimizing the classification loss, the model learns how to more accurately identify and classify different target objects on the guidance screen.
Deep feature loss: In guided screen recognition detection, deep feature loss is a metric used to measure the performance of a model in feature extraction. Deep feature loss can be calculated by comparing the difference between the model’s predicted feature maps and the true feature maps. By minimizing the depth feature loss, the model is able to learn how to extract the depth features of the target on the guide screen more efficiently, thus improving the accuracy of recognition and detection.
As the training progresses, the losses of each item in Figure 8 gradually decrease, which indicates that the model performs well during the training process. The blue curve indicates the change in the results over time; the orange curve indicates a smoothed version of the loss function during the training process, characterizing the trend of the loss function over time and the change in the model’s performance during the training process.
The dynamics of precision, recall, mean Average Precision@50 (mAP50), and mean Average Precision@50-95 (mAP50-95) over time during the training process of the model are shown in Figure 9. These evaluation metrics have value domains between 0 and 1, where 0 represents the absence of any correct prediction, while 1 represents a completely accurate prediction. As can be seen from the figure, both precision and recall show an upward trend, followed by a gradual slowdown in growth; the overall trends of mAP50 and mAP50-95 also steadily increase. It proves that the performance of the improved model on the training data is improving, and it can identify the positive class samples more accurately while reducing false predictions.

3.4.1. Ablation Experiments

In order to verify the impact of the improved feature fusion and feature interaction on the model performance, this paper uses YOLOv5 as the benchmark model for the experiments and conducts experiments on the effectiveness of the triplet attention mechanism and the feature pyramid network fusion. The ablation experiments are conducted to verify whether using triplet attention as the Backbone can improve the processing speed of the model while guaranteeing the accuracy of model detection; the feature pyramid network is verified by adding the Fusion module to verify whether the feature pyramid network can improve the accuracy of the model, and the experimental results are shown in Table 3, where ‘√ ‘ indicates that the corresponding method is added.
As seen in Table 3, the addition of Attention in Improvement 1 enhances the model’s ability to characterize the guidance screens of high-speed rail stations, making it helpful for the model to better capture the local details and global contextual information of the guidance screens and enhances the model’s recall rate, which is improved by 1.8 percentage points. Improvement 2 retains only the feature pyramid network, which improves the accuracy by 1.1 per cent, the mAP50 value by 2.2 per cent, and the preprocessing speed by 0.1 ms, improving the speed of detection. The improved YOLOv5 improves accuracy by 5.8%, recall by 0.4%, mAP50 by 1.5%, mAP50-95 by 1.6%, and preprocessing speed by 0.2 ms compared to the benchmark model. The experimental results show that the improved YOLOv5 model in this paper has higher accuracy and speed due to the fusion of the feature layers in the network. This is due to the fact that the fusion of feature layers in the network effectively improves the extraction and analysis of features, thus improving the robustness of the model.

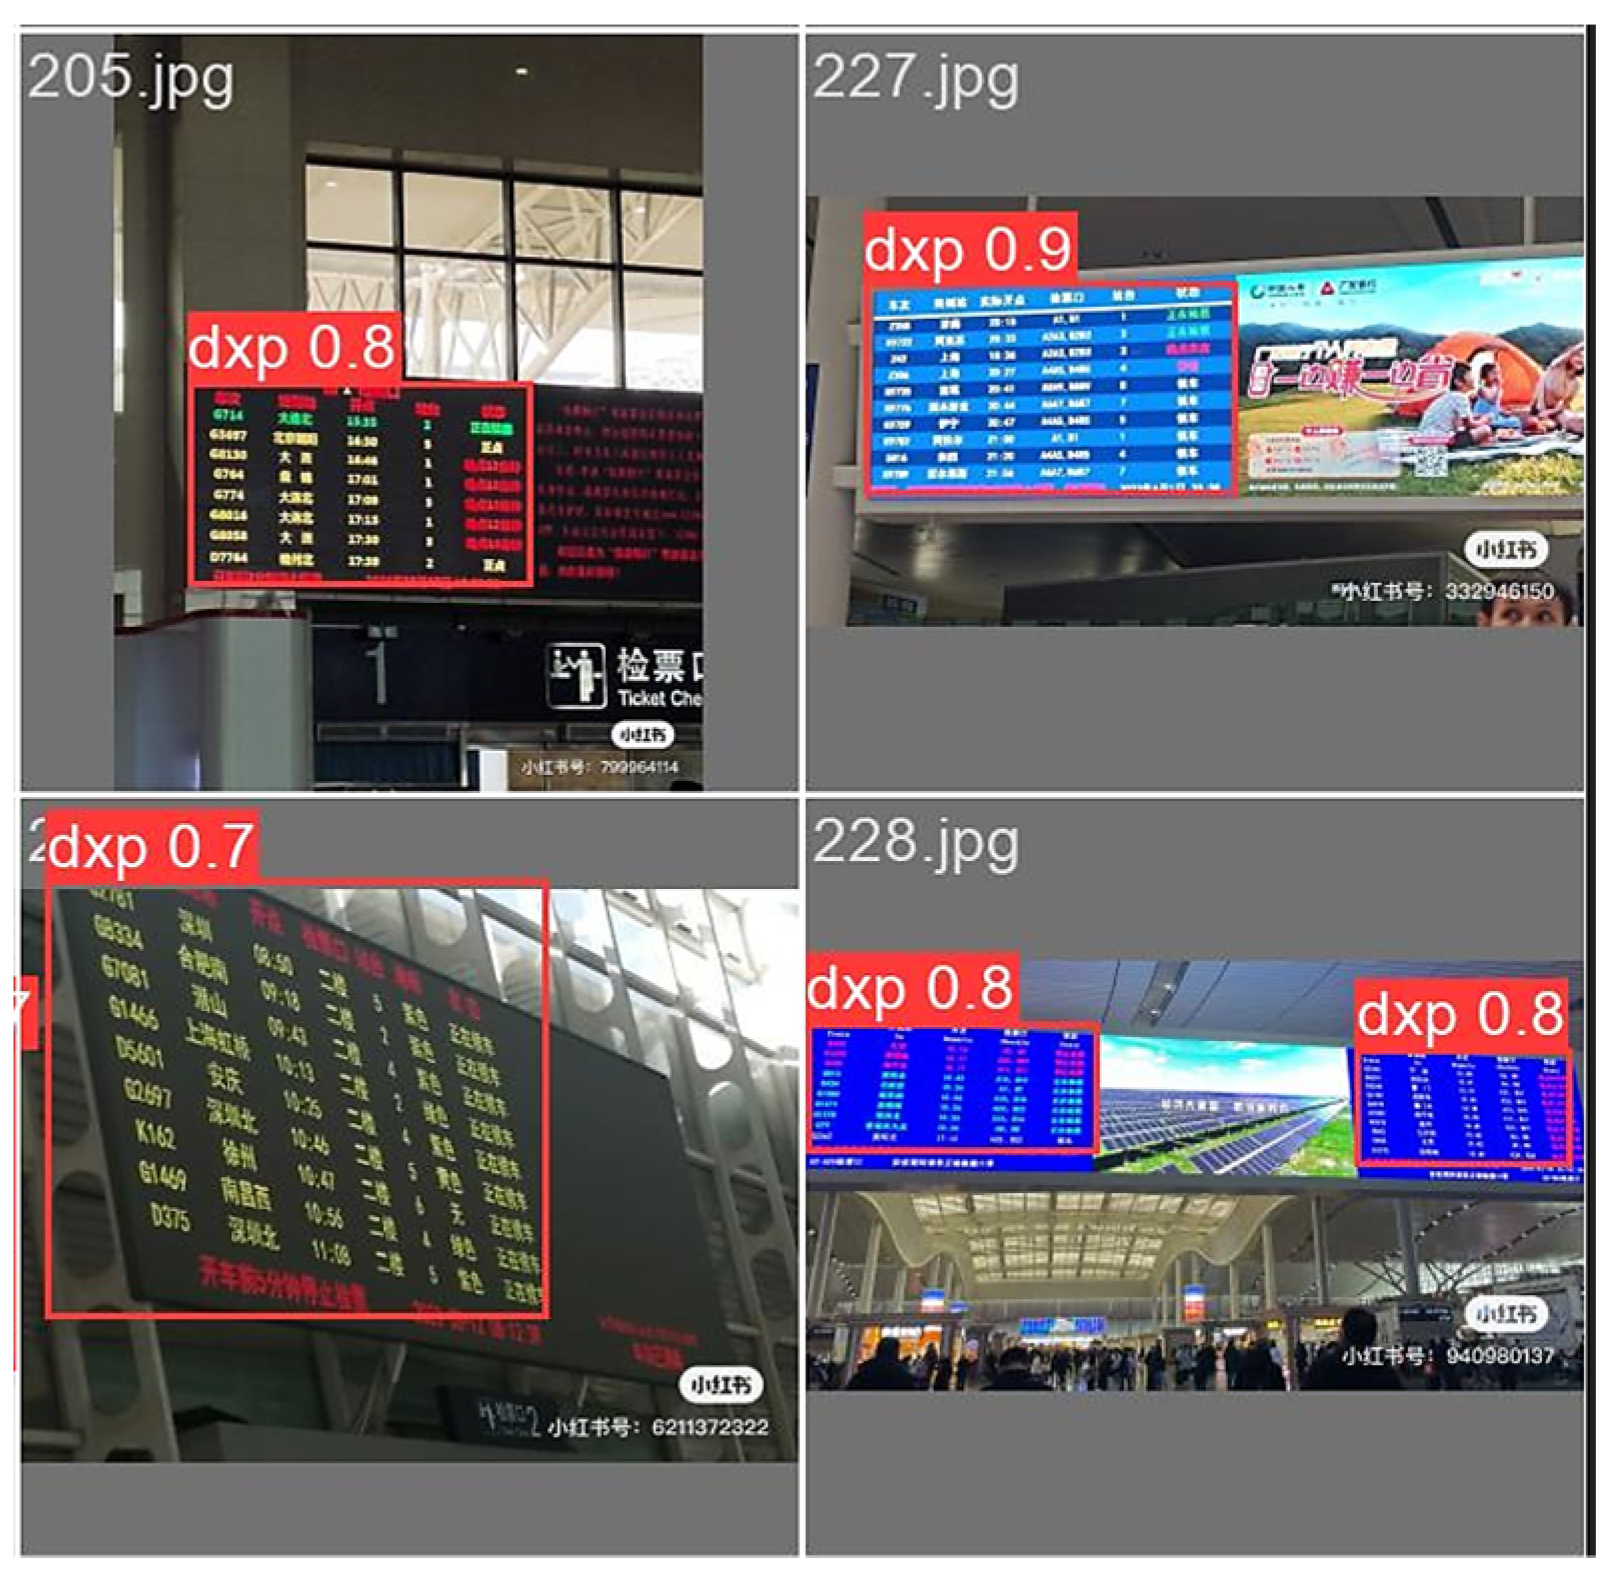
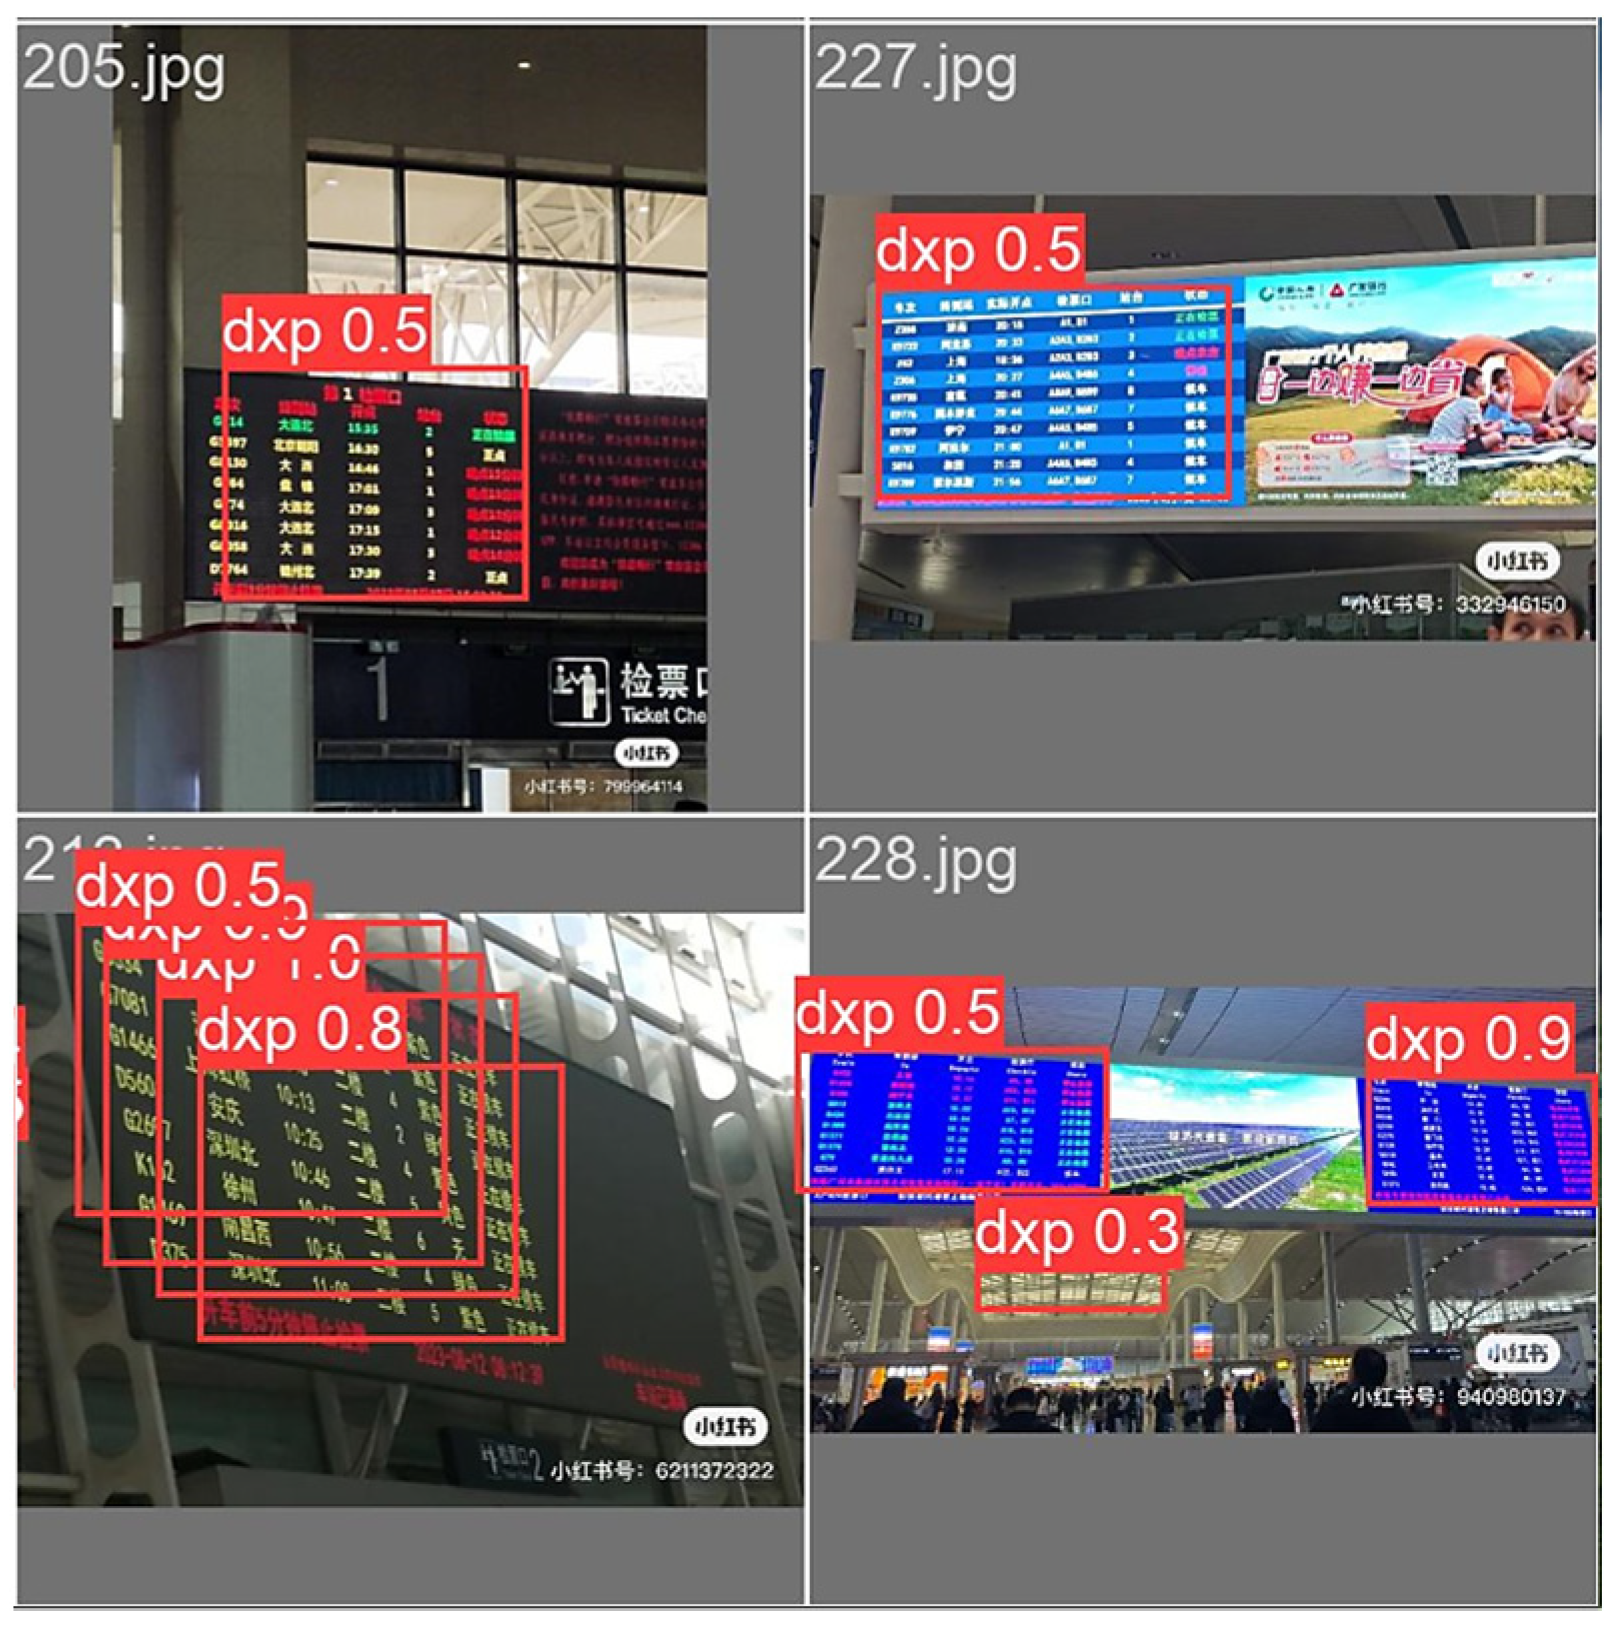
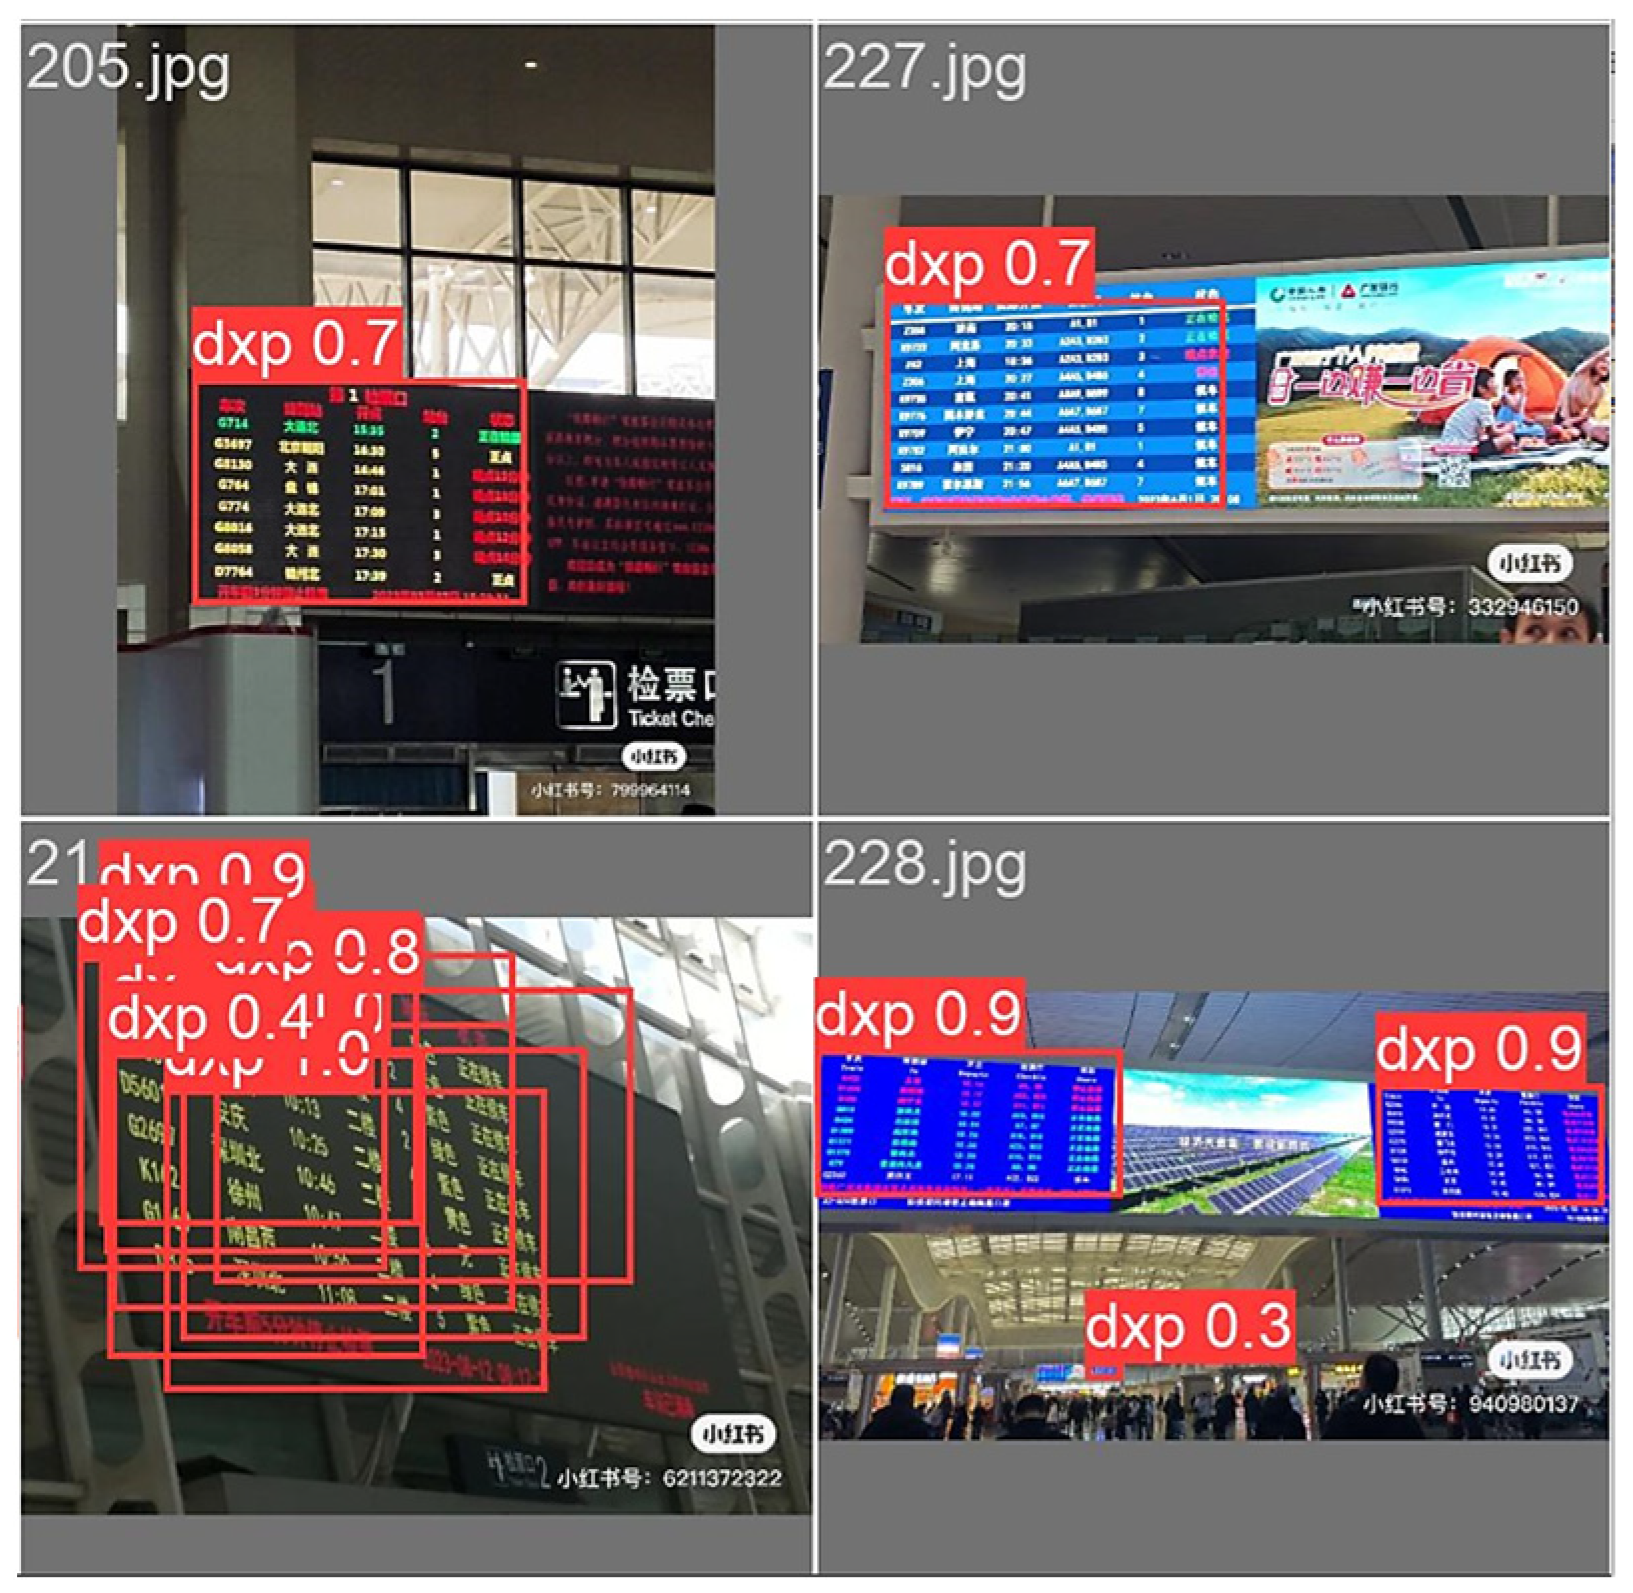
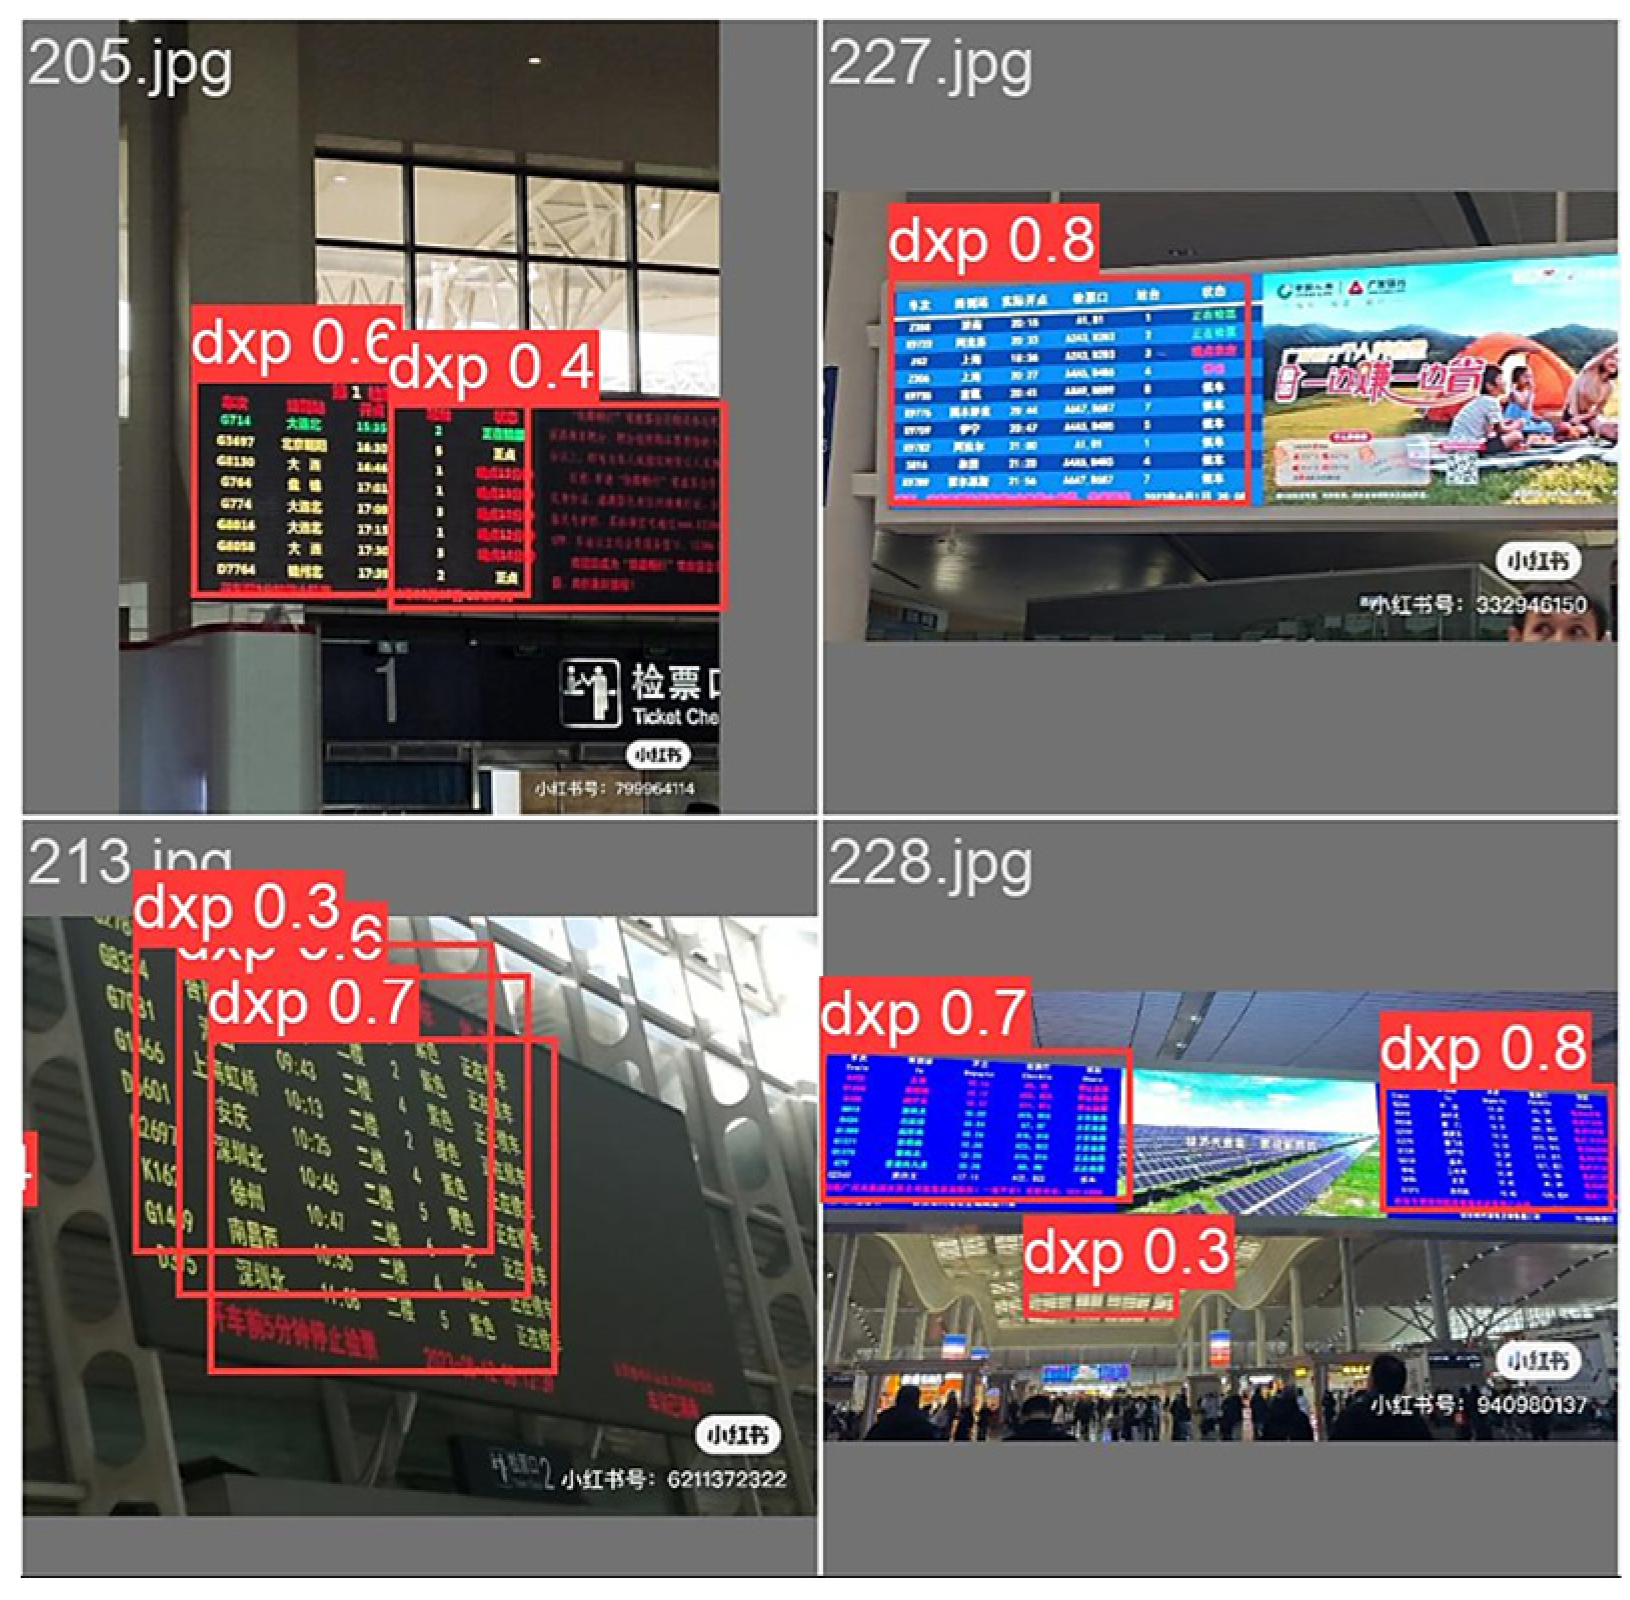
3.4.2. Comparison Experiments

In order to verify the effectiveness of the improved model, four representative models—SSD, YOLOv5, YOLOV6, and YOLOv8—were selected to conduct a comparative test under the same dataset. SSD, YOLOv6, and YOLOv8 were selected as comparison models because they are representative in the field of target detection. SSD is known for its simple structure and fast detection, while YOLOv6 and YOLOv8 have improved their accuracy and speed. The results are shown in Table 4. The results show that the improved YOLOv5 model has the highest precision, recall, Map 50 value, Map 50–95 value, and preprocessing speed compared to other models, reaching 90.1%, 76.5%, 86.1%, 56%, and 0.5 ms, respectively, which significantly improves the accuracy and speed of detection. Compared with the unimproved YOLOv5 model, the correct rate increased by 5.8 percentage points and the preprocessing speed increased by 0.2 ms. Overall, in the scenario of guiding screen detection in high-speed railway stations, the improved YOLOv5 model demonstrated intentional detection accuracy while maintaining low model complexity, which verified its superiority in guiding screen detection.
In order to analyze the performance of the improved YOLOv5 model in guided screen recognition scenarios, different versions of guided screen images with yellow characters on black background and white characters on blue background in the test set are used as the test set for validation, and the results of the experiments are shown in Figure 10, Figure 11, Figure 12, Figure 13 and Figure 14. In the figure, different label names are shown above the box: “dxp” stands for guided screen, and the value on the right side of the label name indicates the confidence level of the label in the category; the larger the value is, the higher the confidence level of the category is and the higher the accuracy of its model prediction is.
As seen in Figure 10, the SSD model is not effective in predicting the guiding screen with yellow characters on a black background and multiple iterative predictions with low confidence are seen in the prediction of the guiding screen with white characters on a blue background. Although the location of the screen can be fully detected for the guide screen, the accuracy of the screen is low, and it cannot meet the need to complete the efficient detection of the guide screen in the case of tight time constraints.
As seen in Figure 11, the original YOLOv5 algorithm has mis-detected and re-detected the text regions of the guiding screen, and all of them have a low confidence level. When predicting the guiding screen with white text on a blue background, there are cases of mistakenly detecting the ceiling as a guiding screen. The ability to detect the guide screen is weak, and the guide screen cannot be correctly and completely detected at a tilted angle.
From Figure 12, it can be seen that the YOLOv6 algorithm has multiple re-tests when predicting a guide screen with yellow letters on a black background on a slanted angle, and also when predicting a guide screen with white letters on a blue background, it has mistakenly detected the ceiling as a guide screen. The accuracy of detection is low, and it is easy to report errors, which will affect the normal work of the certification system.
As seen in Figure 13, the YOLOv8 model appears to repeat the detection recognition process, and its recognition confidence is low. When predicting the guide screen with white characters on a blue background, there is also a case of mistakenly detecting the ceiling as a guide screen. In addition, its accuracy rate is low, which cannot meet the needs of the task of detecting guidance screens in high-speed railway stations.
The effect of the improved YOLOv5 target detection algorithm in this paper is shown in Figure 14; the improved model after training has a better ability to recognize guide screens, its predicted confidence scores are higher, and the fit of the position of the confidence frame is better, which indicates that the improved model has a stronger anti-jamming ability and has better robustness for complex environments, reducing the probability of misdetection and re-detection, which demonstrates the effectiveness of the model.
For the text recognition part of the guide screen, the text detected by the PaddleOCR model in the guide screen area is recognized, and its recognition effect is shown in Figure 15, Figure 16 and Figure 17. As can be seen from the figure, the general version of the PaddleOCR model for high-speed rail station guiding screen operation area text recognition has a high accuracy, and the character segmentation and detection of positioning have high capability to meet the needs of guiding screen text recognition. The correct rate of recognition reaches 99%, the corresponding speed can reach 0.5 ms, and the position of character arrangement and character combination after recognition are accurate. Therefore, the PaddleOCR base model is directly applied to complete the text recognition task in the closed-loop control of Screen-Based Guidance Operations.

4. Conclusions

This study proposes a method based on the closed-loop control of Screen-Based Guidance Operations, which is used to solve the problem of efficient and real-time closed-loop management of Screen-Based Guidance Operations. The method meets the detection speed and accuracy requirements of high-speed railway station scenarios and has a lightweight design to make it more suitable for scenario applications. For model training and experiments, this paper self-constructs and labels a guide screen dataset of the actual high-speed railway station environment. Then, an improved YOLOv5 model is proposed for the detection of the guide screen operation area in high-speed railway stations, in which the triplet attention mechanism and pyramid feature network structure are used to increase the ability of feature extraction and feature interaction and, at the same time, effectively improve the accuracy and speed of the model’s detection. Due to the high time requirement of trains operating in high-speed railway stations, compared with manual detection, this model can perform errata more quickly and meet the time requirement in high-speed railway stations with higher accuracy and speed. Finally, PaddleOCR is combined to achieve accurate recognition of text in the detected area. Without verifying the speed and accuracy of the improved model, this paper compares it with other detection models through ablation experiments. The experimental results show that the improved YOLOv5 model demonstrates excellent performance in the guide screen detection task and is able to accurately and quickly detect the operating area of the guide screen. Meanwhile, PaddleOCR also has high performance in text recognition and can cope with the recognition of different fonts. The combination of the two can meet the requirements of the closed-loop control of guided operation plans in a complex high-speed railway station environment. Future research on the identification and detection of guidance screens in high-speed railway stations will mainly focus on the following directions: first, improve the accuracy and real-time detection of identification; second, enhance the adaptive ability of the system; and third, optimize user interaction experience. Specific methods include the following: First, more advanced image processing and machine learning algorithms can be developed to improve the recognition accuracy of elements such as text and ICONS on the guidance screen, especially in complex lighting and crowded environments. Secondly, deep learning technologies such as convolutional neural network (CNN) and recurrent neural network (RNN) can be introduced to realize real-time detection and recognition of the content of the guidance screen. In addition, the method based on multi-source data fusion, combined with cameras, sensors, and other data sources, can improve the robustness of the detection of guidance screen recognition. In addition, according to different scenarios and user needs, the algorithm of an adaptive adjustment identification strategy can be developed, so that the system can automatically adjust the detection parameters according to the environment changes. Finally, human–computer interaction technologies, such as natural language processing and gesture recognition, can be explored to optimize the interactive experience between users and the guidance screen and provide passengers with more convenient and intelligent navigation services. Through the in-depth discussion of these research directions, it is expected that the leapfrog development of identification and detection technology of guidance screens in high-speed railway stations can be achieved.

Author Contributions

Conceptualization, C.X.; methodology, C.D.; validation, M.L.; formal analysis, C.X. and C.D.; investigation, Y.S.; data curation, Y.S. and T.S.; writing—original draft preparation, C.X.; writing—review and editing, M.L. and Q.W.; visualization, Q.W. and C.D.; supervision, M.L. and C.X. All authors have read and agreed to the published version of the manuscript.

Funding

This research was supported by the key project of China Academy of Railway Sciences Group Corporation, grant number 2022YJ284, 2023YJ125.

Data Availability Statement

The data presented in this study are available from the corresponding author on request due to the data being extracted from specific scenarios.

Conflicts of Interest

Author Chunjie Xu was employed by the company Institute of Computing Technologies, China Academy of Railway Sciences Corporation Ltd. The remaining authors declare that the research was conducted in the absence of any commercial or financial relationships that could be construed as a potential conflict of interest.

References

  1. Wu, X.; Sahoo, D.; Hoi, S.C.H. Recent advances in deep learning for object detection. Neurocomputing 2020, 396, 39–64. [Google Scholar] [CrossRef]
  2. Long, S.; He, X.; Yao, C. Scene text detection and recognition: The deep learning era. Int. J. Comput. Vis. 2021, 129, 161–184. [Google Scholar] [CrossRef]
  3. Zhu, J.; Li, C.; Huang, Y.; Wang, J.; Zhong, S. Research and Application of Text Information Extraction from Vehicle-mounted Remote Sensing Expressway Billboard Data. Remote Sens. Inf. 2022, 37, 126–130. [Google Scholar] [CrossRef]
  4. Xiao, K.; Dai, S.; He, Y.; Sun, L. Chinese Text Extraction Method from Natural Scene Images Based on Urban Surveillance. Comput. Res. Dev. 2019, 56, 1525–1533. [Google Scholar] [CrossRef]
  5. Chen, W.; Wang, L.; Tao, D. Scene Text Recognition Method Integrating Soft Attention Mask Embedding. J. Image Graph. 2024, 29, 1381–1391. [Google Scholar] [CrossRef]
  6. Shivakumara, P.; Phan, T.Q.; Tan, C.L. A laplacian approach to multi-oriented text detection in video. IEEE Trans. Pattern Anal. Mach. Intell. 2010, 33, 412–419. [Google Scholar] [CrossRef] [PubMed]
  7. Baek, Y.; Lee, B.; Han, D.; Yun, S.; Lee, H. Character region awareness for text detection. In Proceedings of the IEEE/CVF Conference on Computer Vision and Pattern Recognition, Long Beach, CA, USA, 15–20 June 2019; pp. 9365–9374. [Google Scholar]
  8. Ch’ng, C.K.; Chan, C.S. Total-Text: A Comprehensive Dataset for Scene Text Detection and Recognition. In Proceedings of the 2017 14th IAPR International Conference on Document Analysis and Recognition (ICDAR), Kyoto, Japan, 9–15 November 2017; pp. 935–942. [Google Scholar] [CrossRef]
  9. Wu, W.; Liu, H.; Li, L.; Long, Y.; Wang, X.; Wang, Z.; Li, J.; Chang, Y. Application of local fully Convolutional Neural Network combined with YOLO v5 algorithm in small target detection of remote sensing image. PLoS ONE 2021, 16, e0259283. [Google Scholar] [CrossRef] [PubMed]
  10. Girshick, R.; Donahue, J.; Darrell, T.; Malik, J. Rich feature hierarchies for accurate object detection and semantic segmentation. In Proceedings of the IEEE Conference on Computer Vision and Pattern Recognition, Columbus, OH, USA, 23–28 June 2014; pp. 580–587. [Google Scholar]
  11. Girshick, R. Fast r-cnn. In Proceedings of the IEEE International Conference on Computer Vision, Santiago, Chile, 13–16 December 2015; pp. 1440–1448. [Google Scholar]
  12. Ren, S.; He, K.; Girshick, R.; Sun, J. Faster R-CNN: Towards real-time object detection with region proposal networks. IEEE Trans. Pattern Anal. Mach. Intell. 2016, 39, 1137–1149. [Google Scholar] [CrossRef] [PubMed]
  13. Li, M.; Ke, Z.; Yu, D.; Zhang, J.; Jia, J.; Liu, L. Vehicle license plate number recognition algorithm based on mobile edge calculation. Comput. Eng. Des. 2021, 42, 3151–3157. [Google Scholar]
  14. Liu, W.; Anguelov, D.; Erhan, D.; Szegedy, C.; Reed, S.; Fu, C.Y.; Berg, A.C. SSD: Single Shot MultiBox Detector. In Computer Vision—ECCV 2016; Leibe, B., Matas, J., Sebe, N., Welling, M., Eds.; Lecture Notes in Computer Science; Springer: Cham, Switzerland, 2016; Volume 9905. [Google Scholar]
  15. Ross, T.Y.; Dollár, G.K.H.P. Focal loss for dense object detection. In Proceedings of the IEEE International Conference on Computer Vision, Venice, Italy, 22–29 October 2017; pp. 2980–2988. [Google Scholar]
  16. Redmon, J.; Divvala, S.; Girshick, R.; Farhadi, A. You Only Look Once: Unified, Real-Time Object Detection. In Proceedings of the 2016 IEEE Conference on Computer Vision and Pattern Recognition (CVPR), Las Vegas, NV, USA, 27–30 June 2016; pp. 779–788. [Google Scholar]
  17. Redmon, J.; Farhadi, A. Yolov3: An incremental improvement. arXiv 2018, arXiv:1804.02767. [Google Scholar]
  18. Redmon, J.; Farhadi, A. YOLO9000: Better, faster, stronger. In Proceedings of the IEEE Conference on Computer Vision and Pattern Recognition, Honolulu, HI, USA, 21–26 July 2017; pp. 7263–7271. [Google Scholar]
  19. Home—Ultralytics YOLOv5 Docs. Available online: https://docs.ultralytics.com/zh/models/yolov5/ (accessed on 2 July 2024).
  20. Wang, L.; Bai, J.; Li, W.; Jiang, J. Research Progress of YOLO Series Object Detection Algorithms. Comput. Eng. Appl. 2023, 59, 15–29. [Google Scholar]
  21. Misra, D.; Nalamada, T.; Arasanipalai, A.U.; Hou, Q. Rotate to attend: Convolutional triplet attention module. In Proceedings of the IEEE/CVF Winter Conference on Applications of Computer Vision, Waikoloa, HI, USA, 5–9 January 2021; pp. 3139–3148. [Google Scholar]
  22. Lin, T.Y.; Dollár, P.; Girshick, R.; He, K.; Hariharan, B.; Belongie, S. Feature pyramid networks for object detection. In Proceedings of the IEEE Conference on Computer Vision and Pattern Recognition, Honolulu, HI, USA, 21–26 July 2017; pp. 2117–2125. [Google Scholar]
  23. Jia, J.; Yang, H.; Lu, X.; Li, M.; Li, Y. Operator Behavior Analysis System for Operation Room Based on Deep Learning. Math. Probl. Eng. 2022, 2022 Pt 8, 6374040. [Google Scholar] [CrossRef]
  24. Li, R.; Li, P.; Dai, M.; Ma, X.; Li, G. Crowd Counting Estimation Model Based on Multi-View Projection Fusion of Railway Passenger Station Video. Chin. Railw. Sci. 2012, 43, 182–192. [Google Scholar]
Figure 1. Closed-loop control framework for Screen-Based Guidance Operations.
Electronics 13 04400 g001
Figure 2. Improved YOLOv5 network structure diagram.
Electronics 13 04400 g002
Figure 3. Principle of the triplet attention mechanism.
Electronics 13 04400 g003
Figure 4. Structure of the triplet attention mechanism.
Electronics 13 04400 g004
Figure 5. Structure of the characteristic pyramid horizontally connected network.
Electronics 13 04400 g005
Figure 6. Yellow characters on black background guide screen partial data.
Electronics 13 04400 g006
Figure 7. White characters on blue background guide screen partial data.
Electronics 13 04400 g007
Figure 8. Box loss, classification loss, and depth feature loss curves.
Electronics 13 04400 g008
Figure 9. p-value, R-value, mAP50 vs. mAP50-95 curves.
Electronics 13 04400 g009
Figure 10. Effect of SSD algorithm detection.
Electronics 13 04400 g010
Figure 11. YOLOv5 algorithm detection effect.
Electronics 13 04400 g011
Figure 12. Effect of YOLOv6 algorithm detection.
Electronics 13 04400 g012
Figure 13. YOLOv8 algorithm detection effect.
Electronics 13 04400 g013
Figure 14. Detection effect of Improved YOLOv5.
Electronics 13 04400 g014
Figure 15. PaddleOCR algorithm recognition effect (Angle directly facing).
Electronics 13 04400 g015
Figure 16. PaddleOCR algorithm recognition effect (Angle of the right oblique side).
Electronics 13 04400 g016
Figure 17. PaddleOCR algorithm recognition effect (Angle of the left oblique side).
Electronics 13 04400 g017
Table 1. Software environment development.
Name of the EnvironmentConfiguration NameReleases
Software Developmentdetection modellingdevelopment language
recognition modelPaddleOCR
development languagePython 3.9
Table 2. Hardware environment development.
Name of the EnvironmentConfiguration NameReleases
Hardware DevelopmentCUDA12.3
operating systemWindows 10
GPUsNVIDIA GeForce MX230
CPUIntel(R) Core (TM) i7-1065G7
memory8203 MB
Table 3. Results of ablation experiments.
ModelsAttentionFusionPrecision%Recall/%mAP50/%mAP 50–95%Speed
YOLOv5--84.30%76.10%84.60%54.40%0.7 ms
Change1-86.10%72.10%81.80%53.40%0.7 ms
Change2-85.40%75.50%86.80%53.80%0.6 ms
Improved YOLOv590.10%76.50%86.10%56%0.5 ms
Table 4. Comparative experimental results.
ModelsPrecision%Recall/%mAP50/%mAP 50–95%Speed
SSD67.60%64.60%71.20%51.30%2.5 ms
YOLOv584.30%76.10%84.60%54.40%0.7 ms
YOLOV673.10%72.10%75.70%48.20%1.5 ms
YOLOV874.40%70.9%76.30%49%1.8 ms
Improved YOLOv590.10%76.50%86.10%56%0.5 ms
Disclaimer/Publisher’s Note: The statements, opinions and data contained in all publications are solely those of the individual author(s) and contributor(s) and not of MDPI and/or the editor(s). MDPI and/or the editor(s) disclaim responsibility for any injury to people or property resulting from any ideas, methods, instructions or products referred to in the content.

