Article

Rethinking the Non-Maximum Suppression Step in 3D Object Detection from a Bird’s-Eye View

1
School of Intelligent Manufacturing and Control Engineering, Shanghai Polytechnic University, Shanghai 201209, China
2
School of Computer and Information Engineering, Shanghai Polytechnic University, Shanghai 201209, China
3
School of Artificial Intelligence and Automation, Huazhong University of Science and Technology, Wuhan 430074, China
*
Author to whom correspondence should be addressed.
Electronics 2024, 13(20), 4034; https://doi.org/10.3390/electronics13204034
Submission received: 15 September 2024 / Revised: 10 October 2024 / Accepted: 12 October 2024 / Published: 14 October 2024

Abstract

:
In camera-based bird’s-eye view (BEV) 3D object detection, non-maximum suppression (NMS) plays a crucial role. However, traditional NMS methods become ineffective in BEV scenarios where the predicted bounding boxes of small object instances often have no overlapping areas. To address this issue, this paper proposes a BEV intersection over union (IoU) computation method based on relative position and absolute spatial information, referred to as B-IoU. Additionally, a BEV circular search method, called B-Grouping, is introduced to handle prediction boxes of varying scales. Utilizing these two methods, a novel NMS strategy called BEV-NMS is developed to handle the complex prediction boxes in BEV perspectives. This BEV-NMS strategy is implemented in several existing algorithms. Based on the results from the nuScenes validation set, there was an average increase of 7.9% in mAP when compared to the strategy without NMS. The NDS also showed an average increase of 7.9% under the same comparison. Furthermore, compared to the Scale-NMS strategy, the mAP increased by an average of 3.4%, and the NDS saw an average improvement of 3.1%.

1. Introduction

The core of 3D object detection lies in accurately locating objects within a three-dimensional space, a crucial aspect for various applications such as autonomous driving [1,2], robotic navigation [3], and virtual reality [4]. While LiDAR-based methods [5,6,7,8,9,10] have made significant strides, camera-based bird’s-eye view (BEV) 3D object detection [11,12,13,14,15,16] has increasingly garnered attention in recent years due to its rich semantic information and lower deployment costs.
In the BEV perspective, the non-overlapping nature of instances leads to varying IoU distributions for predictions across different categories. For small object instances, such as pedestrians, which occupy only a minimal area on the ground, this area is always smaller than the output resolution of the algorithm. When common object detection algorithms are applied to generate prediction boxes for these small targets, the resulting boxes cover only a tiny area. As a result, redundant prediction boxes do not intersect with the true positive prediction boxes.
To address this issue, Scale-NMS [11] was proposed for use in BEV 3D object detection. This method involves iteratively enumerating the scaling factors and corresponding IoU thresholds for each detection category to achieve relatively stable detection results. However, for different algorithms, the scaling factor for the same category often requires additional adjustment. Scale-NMS operates by scaling the candidate boxes of different categories according to their designated scaling factors, and then, applying an IoU threshold to manage the prediction boxes surrounding the true positive ones. This approach, however, not only disrupts the geometric integrity of the prediction boxes but also limits its effectiveness to those boxes that are in close proximity to the true positives, overlooking whether more distant boxes should also be subjected to Scale-NMS processing.
Scale-NMS may fail to handle certain special cases correctly in some scenarios. As shown in Figure 1 (detection results before applying NMS), the predicted bounding boxes of two cars overlap. Directly applying non-maximum suppression using an intersection over union threshold is inappropriate in this situation. The NMS strategy should not only consider the IoU threshold but also incorporate a distance threshold. This ensures that when bounding boxes of different objects overlap, the normal processing of each prediction is not disrupted.
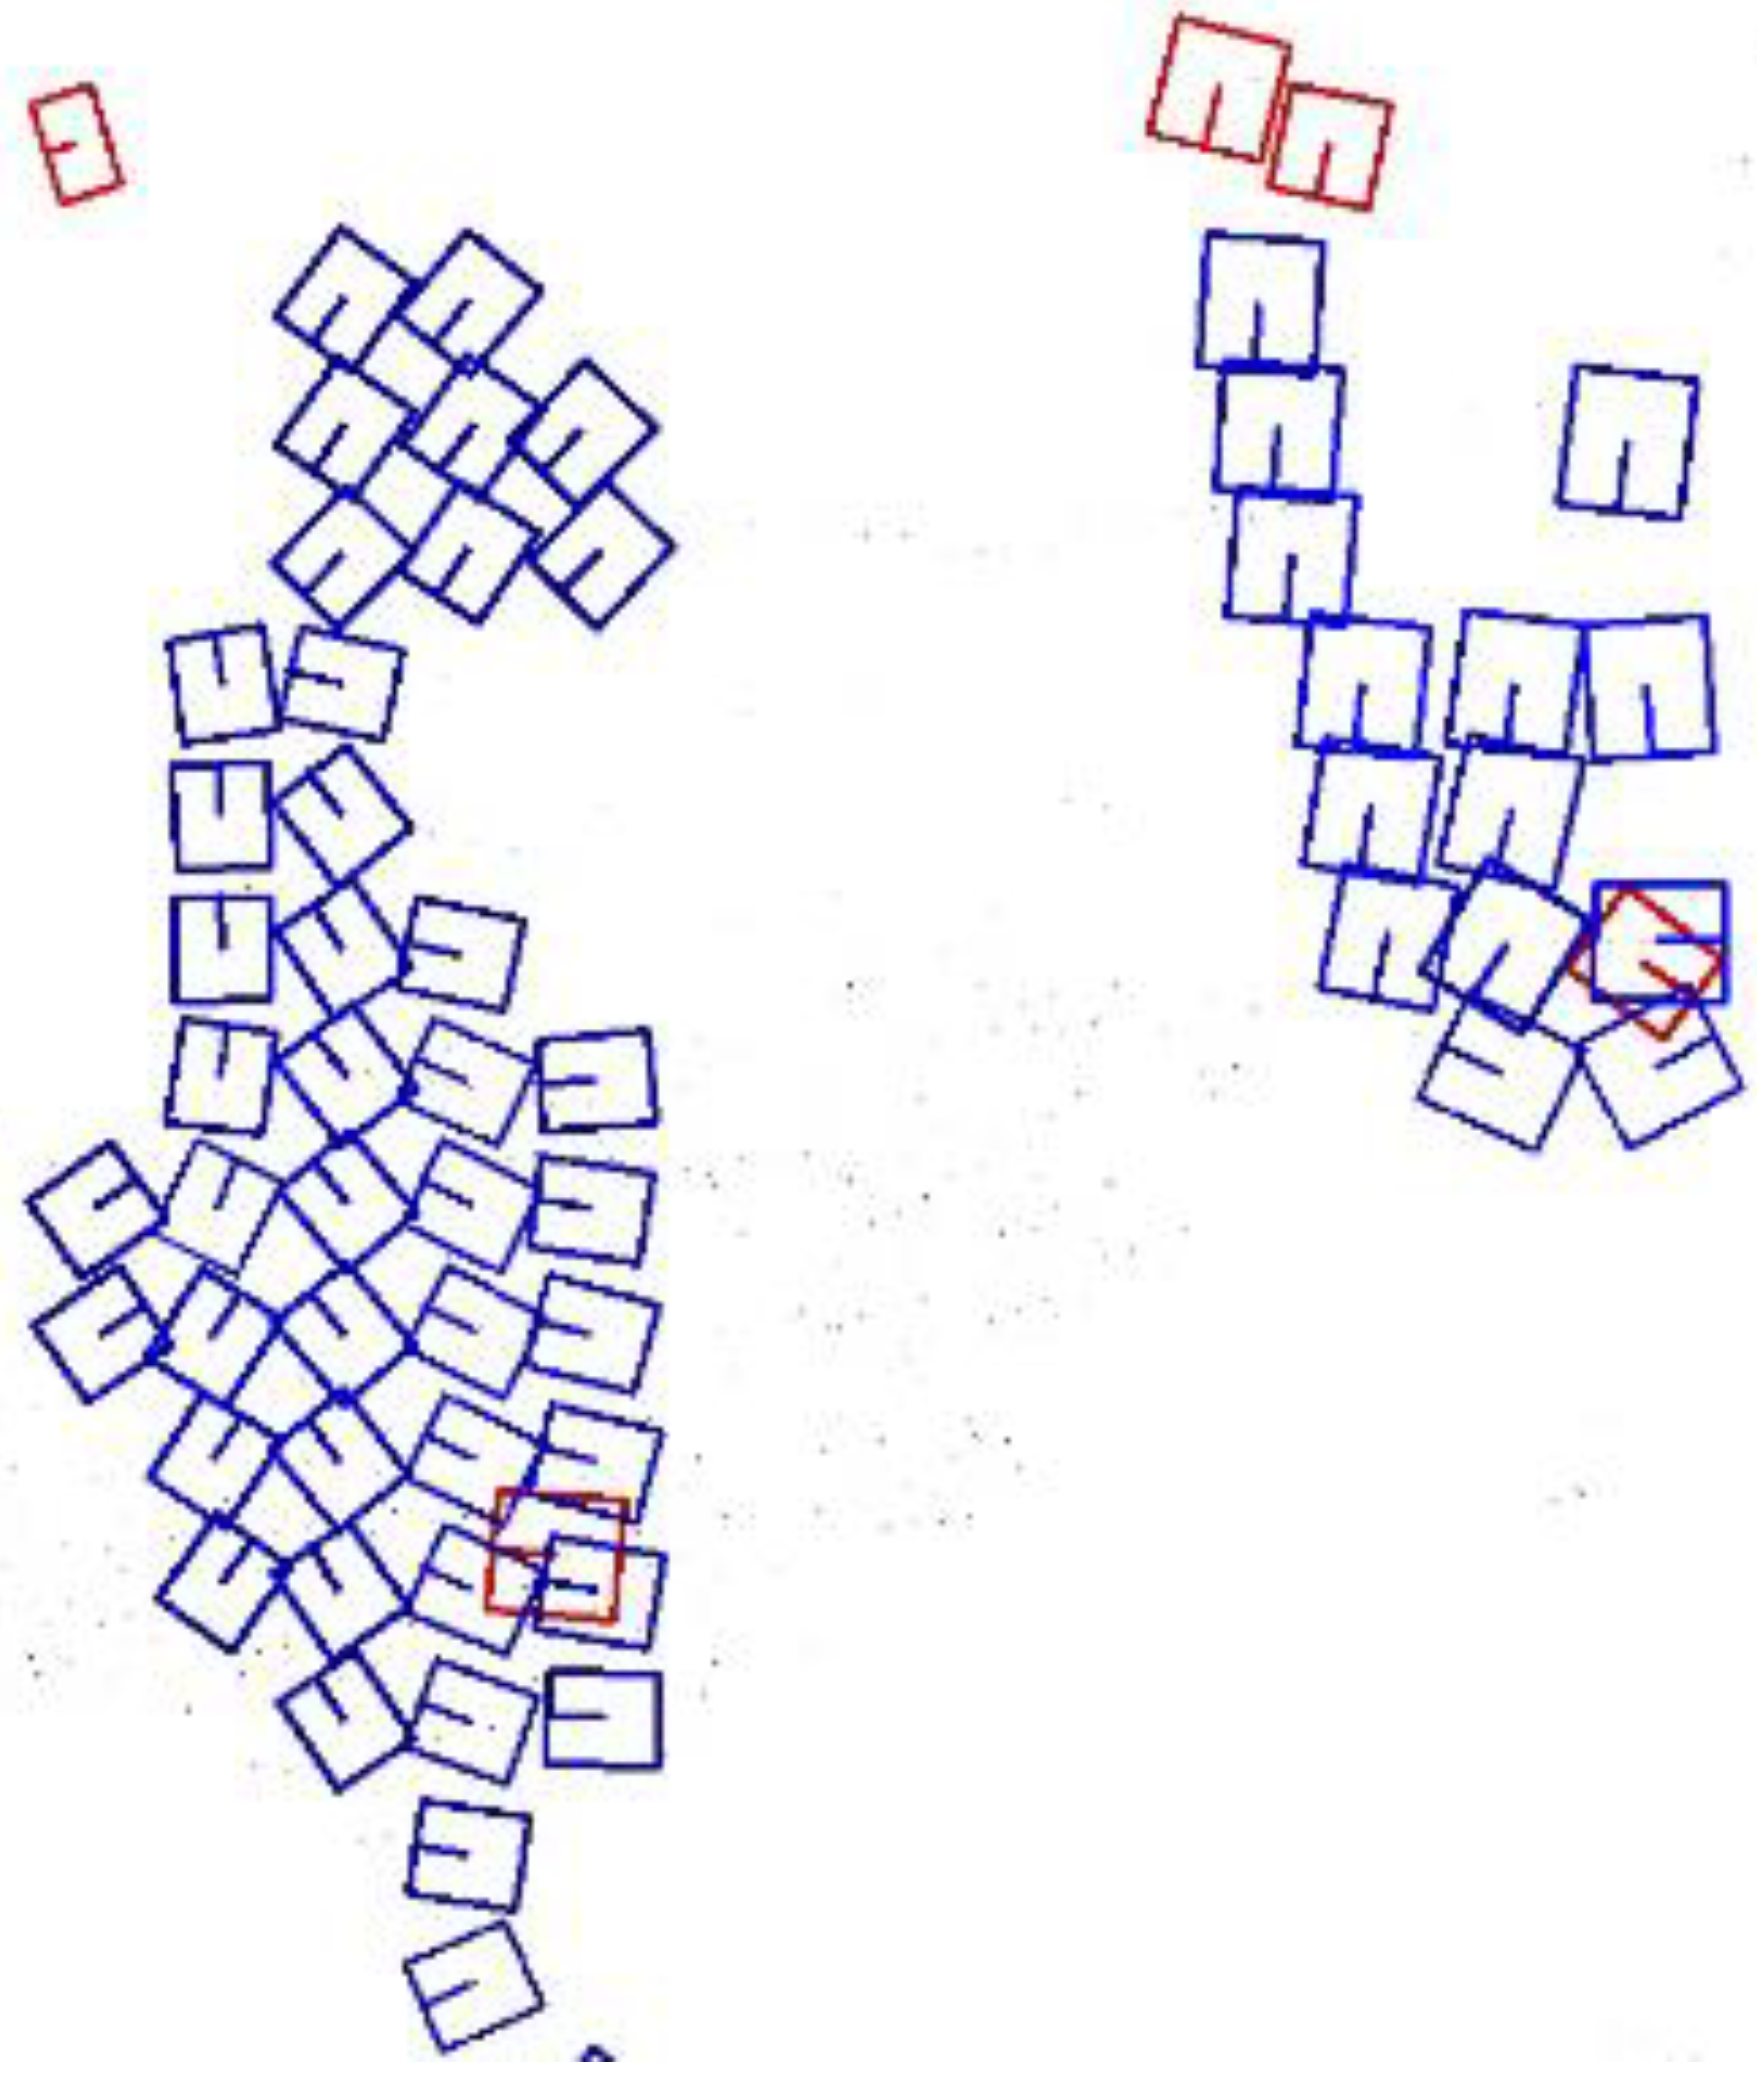
Moreover, in the bird’s-eye view, small-object instances do not overlap. As illustrated in Figure 2 (detection results before applying NMS), the blue boxes represent the predicted bounding boxes, while the red boxes are the ground truth (GT) bounding boxes. Around each small GT bounding box, a large number of predicted boxes are clustered. Similarly, around each true positive predicted box, there are also several predicted boxes that require NMS based on the IoU threshold. To address this, a distance threshold needs to be introduced to define the predicted boxes that are far from the true positive box and require separate processing.
In the post-processing of 3D object detection from a BEV perspective, directly replicating the conventional NMS approach is not appropriate. To address this, this paper introduces a new NMS strategy tailored for the BEV perspective, referred to as BEV-NMS. The process begins by utilizing the proposed BEV circular search method (B-Grouping) to determine the appropriate distance threshold based on the specific scale of the prediction boxes. This threshold is then used to identify all relevant prediction boxes within the defined distance from the original prediction box. Subsequently, the BEV IoU computation method (B-IoU), which is based on relative position and absolute spatial information, is applied to calculate the IoU values directly, regardless of whether the boxes intersect. Finally, BEV-NMS produces the processed detection results based on the IoU threshold.
In BEV (bird’s-eye view) perspective 3D object detection, prediction boxes and ground truth (GT) boxes are used to describe the position, size, and orientation of objects in three-dimensional space. Prediction boxes are generated by the detection model and represent the model’s estimation of the object’s location, while GT boxes are manually annotated to reflect the true positions of objects, serving as reference standards during model training. Both are described using nine parameters: (x, y, z, x_size, y_size, z_size, yaw_x, yaw_y, yaw_z). Specifically, (x, y, z) represent the position of the box center in three-dimensional space, where x and y are planar coordinates, and z indicates the object’s height. (x_size, y_size, z_size) represent the dimensions of the box, corresponding to its length, width, and height, respectively. (yaw_x, yaw_y, yaw_z) represent the orientation angles of the box, indicating the object’s rotation relative to the ground.
In this paper, during the non-maximum suppression operation, the 3D prediction and GT boxes are converted into 2D prediction and GT boxes. Specifically, the simplified 2D boxes are represented as follows: ( x 1 , y 1 , x 2 , y 2 , r y ), where x 1 and y 1 denote the coordinates of the box’s top-left corner, x 2 and y 2 denote the coordinates of the bottom-right corner, and ry represents the box’s orientation angle in the 2D plane. This transformation retains the position, size, and orientation information while simplifying the 3D detection problem into a 2D plane problem, thereby facilitating the execution of the NMS operation.
The rest of the structure of this paper is as follows: Section 2 introduces related work on vision-based 3D object detection, highlighting the advantages of 3D object detection in the BEV view, as well as various NMS strategies, emphasizing the benefits of the BEV-NMS strategy in the BEV view. Section 3 details the implementation of BEV-NMS, including the IoU calculation method (B-IoU), the circular search method in the BEV view (B-Grouping), and the overall BEV-NMS process. In Section 4, we evaluate the performance of our method through experiments, discuss the impact of the B-Grouping strategy on BEV-NMS, and visualize two representative frames. Finally, Section 5 briefly summarizes the paper and highlights its contributions.
Specifically, the main contributions of this paper are as follows:
  • This paper proposes a BEV circular search method (B-Grouping) that utilizes variable distance thresholds to search for all relevant prediction boxes that require processing.
  • This paper introduces a BEV IoU computation method (B-IoU) based on relative position and absolute spatial information. This method allows for the calculation of IoU values between non-overlapping boxes without the need for scaling factors.
  • This paper proposes a BEV-NMS strategy for post-processing prediction boxes in the BEV view, based on B-Grouping and B-IoU. The effectiveness of this strategy is validated on the nuScenes dataset, showing improvements in various detection metrics across multiple algorithms after applying BEV-NMS.

2. Related Work

2.1. Vision-Based 3D Object Detection

Extracting 3D information about objects and scenes from images is a fundamental step in vision-based 3D object detection. A crucial part of this process is recovering depth information from the 2D perspective view of an image. Some monocular camera-based algorithms [12,17,18] estimate depth using geometric assumptions. For instance, FCOS3D [12] projects the center of a 3D object box onto a 2D image, obtaining a 2.5D center (X, Y, depth), which serves as one of the regression targets. DD3D [17] is an end-to-end, single-stage monocular 3D object detection method designed with pre-training and weight sharing. However, its reliance on geometric constraints and prior knowledge results in relatively low detection accuracy, prompting increased interest in multi-view 3D object detection. LSS [19] was the first method to explore mapping multi-view features into BEV space. Building on the view transformation in LSS, BEVDet [11] introduced an additional network in the BEV view for further feature extraction and proposed Scale-NMS to post-process the prediction boxes of small objects. DETR3D [13] employs sparse, object-level queries, with each query corresponding to the 3D center of an object. BEVDet 4D [14] extends BEVDet by integrating a temporal fusion module, enabling autonomous driving perception tasks in 4D space–time. BEVFormer [15] uses deformable cross-attention for the image-to-BEV view transformation. PETR [16] attaches 3D spatial information encoding to image features before feature extraction. Fast-BEV [20] introduces a lightweight view transformation module and an efficient BEV encoder, enabling faster BEV perception on automotive onboard chips, which is crucial for real-time autonomous driving applications. In 3D object detection tasks from the BEV perspective, the initially generated detection results are unique. A large number of redundant false positive prediction boxes around small objects significantly impact the final detection accuracy, making NMS (non-maximum suppression) an essential component in the post-processing stage.

2.2. Various NMS Strategies

Non-maximum suppression is typically applied in the post-processing stages of edge detection and object detection tasks. It is a technique used to eliminate redundant bounding boxes, ensuring that each target is marked by only one bounding box. The basic NMS approach removes overlapping boxes by directly discarding those with lower confidence scores, which can lead to the loss of valuable information. Soft-NMS [21], instead of removing overlapping candidate boxes outright, dynamically reduces their confidence scores based on the degree of overlap. DIoU-NMS [22] suggests that if the center points of adjacent boxes are closer to the center of the current highest-scoring box, those boxes are more likely to be redundant. Cluster-NMS [23] improves target localization by clustering candidate boxes, and then, applying NMS within each cluster. Softer NMS [24] refines the bounding boxes by adjusting them according to the variance in the distribution, pulling the predicted boxes closer to the actual object distribution. Adaptive NMS [25] introduces a dynamic suppression strategy, adjusting the IoU threshold based on the density of surrounding objects. Scale-NMS [11] was specifically proposed to address the issue of non-overlapping small object prediction boxes in the BEV perspective, where traditional NMS fails. This method applies specific scaling factors to different categories before performing NMS. However, this BEV perspective NMS approach only considers prediction boxes close to the true positive boxes of small objects, neglecting those that are farther away.

3. Method

3.1. BEV-NMS Overview

As illustrated in Figure 3, the entire BEV-NMS strategy consists of three main components: data loading and preparation, model forward propagation, and the post-processing stage.
During the data loading and preparation phase, multi-view RGB images are first packaged into a multi-channel input tensor, which is fed into the model as a single entity. Each channel corresponds to the image data from one of the views, allowing the model to process information from multiple perspectives simultaneously.
In the forward propagation phase, images captured by multiple cameras are input into the model concurrently. Each camera’s image is processed through an independent channel. The backbone network then extracts features from the input images; this feature extraction network can be any network such as ResNet [26] or Swin Transformer [27]. ResNet is chosen for its stability and widespread use, while Swin Transformer is selected for its powerful self-attention mechanism and outstanding performance, both offering strong versatility across various visual tasks.
The feature maps extracted from multiple cameras are first concatenated to form a multi-channel tensor. Each camera’s feature map occupies a different channel in the input tensor, thus retaining the perspective information of each view within a single combined tensor. This concatenated feature map contains scene information from various camera perspectives. Subsequently, these features are passed through a view transformation module [19], which converts the perspective view into a bird’s-eye view (BEV). In the BEV feature map, the model further encodes the features. Specifically, the perspective transformer inputs the extracted image perspective features into the depth prediction module, which densely predicts the depth of each pixel in the image through classification. In this manner, depth values are not directly predicted as continuous variables but are derived through depth classification, with each pixel being assigned probability values for multiple depth categories. For each pixel, the depth classification scores are combined with the extracted image features. This step integrates the originally two-dimensional image features with depth information, imparting three-dimensional characteristics. Utilizing the depth classification scores and image features, the perspective transformer renders the image features into predefined point clouds. Each pixel is projected into multiple points in three-dimensional space based on its corresponding depth prediction, thereby generating a three-dimensional point cloud. In the generated three-dimensional point cloud, a pooling operation is applied along the vertical direction (i.e., the Z-axis) to aggregate the point cloud information onto a bird’s-eye view (BEV) feature map. This operation compresses the three-dimensional features onto the BEV plane, thereby producing the final BEV feature map. Finally, using a detection head network, the model predicts the 3D bounding boxes, class labels, and confidence scores of the objects on the encoded BEV feature map. The CenterPoint [28] network is particularly effective at leveraging contextual information, accurately extracting object location information from the features extracted by the higher layers of the network. Therefore, CenterPoint is chosen as the detection head network in this work.
In the final post-processing stage, BEV-NMS is applied. For the initially generated predictions, the first step is to filter out low-confidence candidate boxes based on a confidence score threshold, which helps reduce inaccurate predictions. Next, the filtered prediction boxes are sorted in descending order of their scores. The BEV circular search method (B-Grouping) is then applied sequentially to the processed list of prediction boxes. This method determines the appropriate distance threshold based on the specific scale of each prediction box and uses this threshold to search for all relevant prediction boxes within the specified distance from the current prediction box. For each prediction box that meets the distance threshold, the BEV IoU computation method (B-IoU) is applied. This method calculates the IoU value directly, regardless of whether the two boxes intersect. Finally, the BEV-NMS-processed detection results are obtained based on the IoU threshold.

3.2. BEV IoU Computation Method (B-IoU)

The method for calculating the BEV perspective IoU based on relative position and absolute spatial information is as follows.
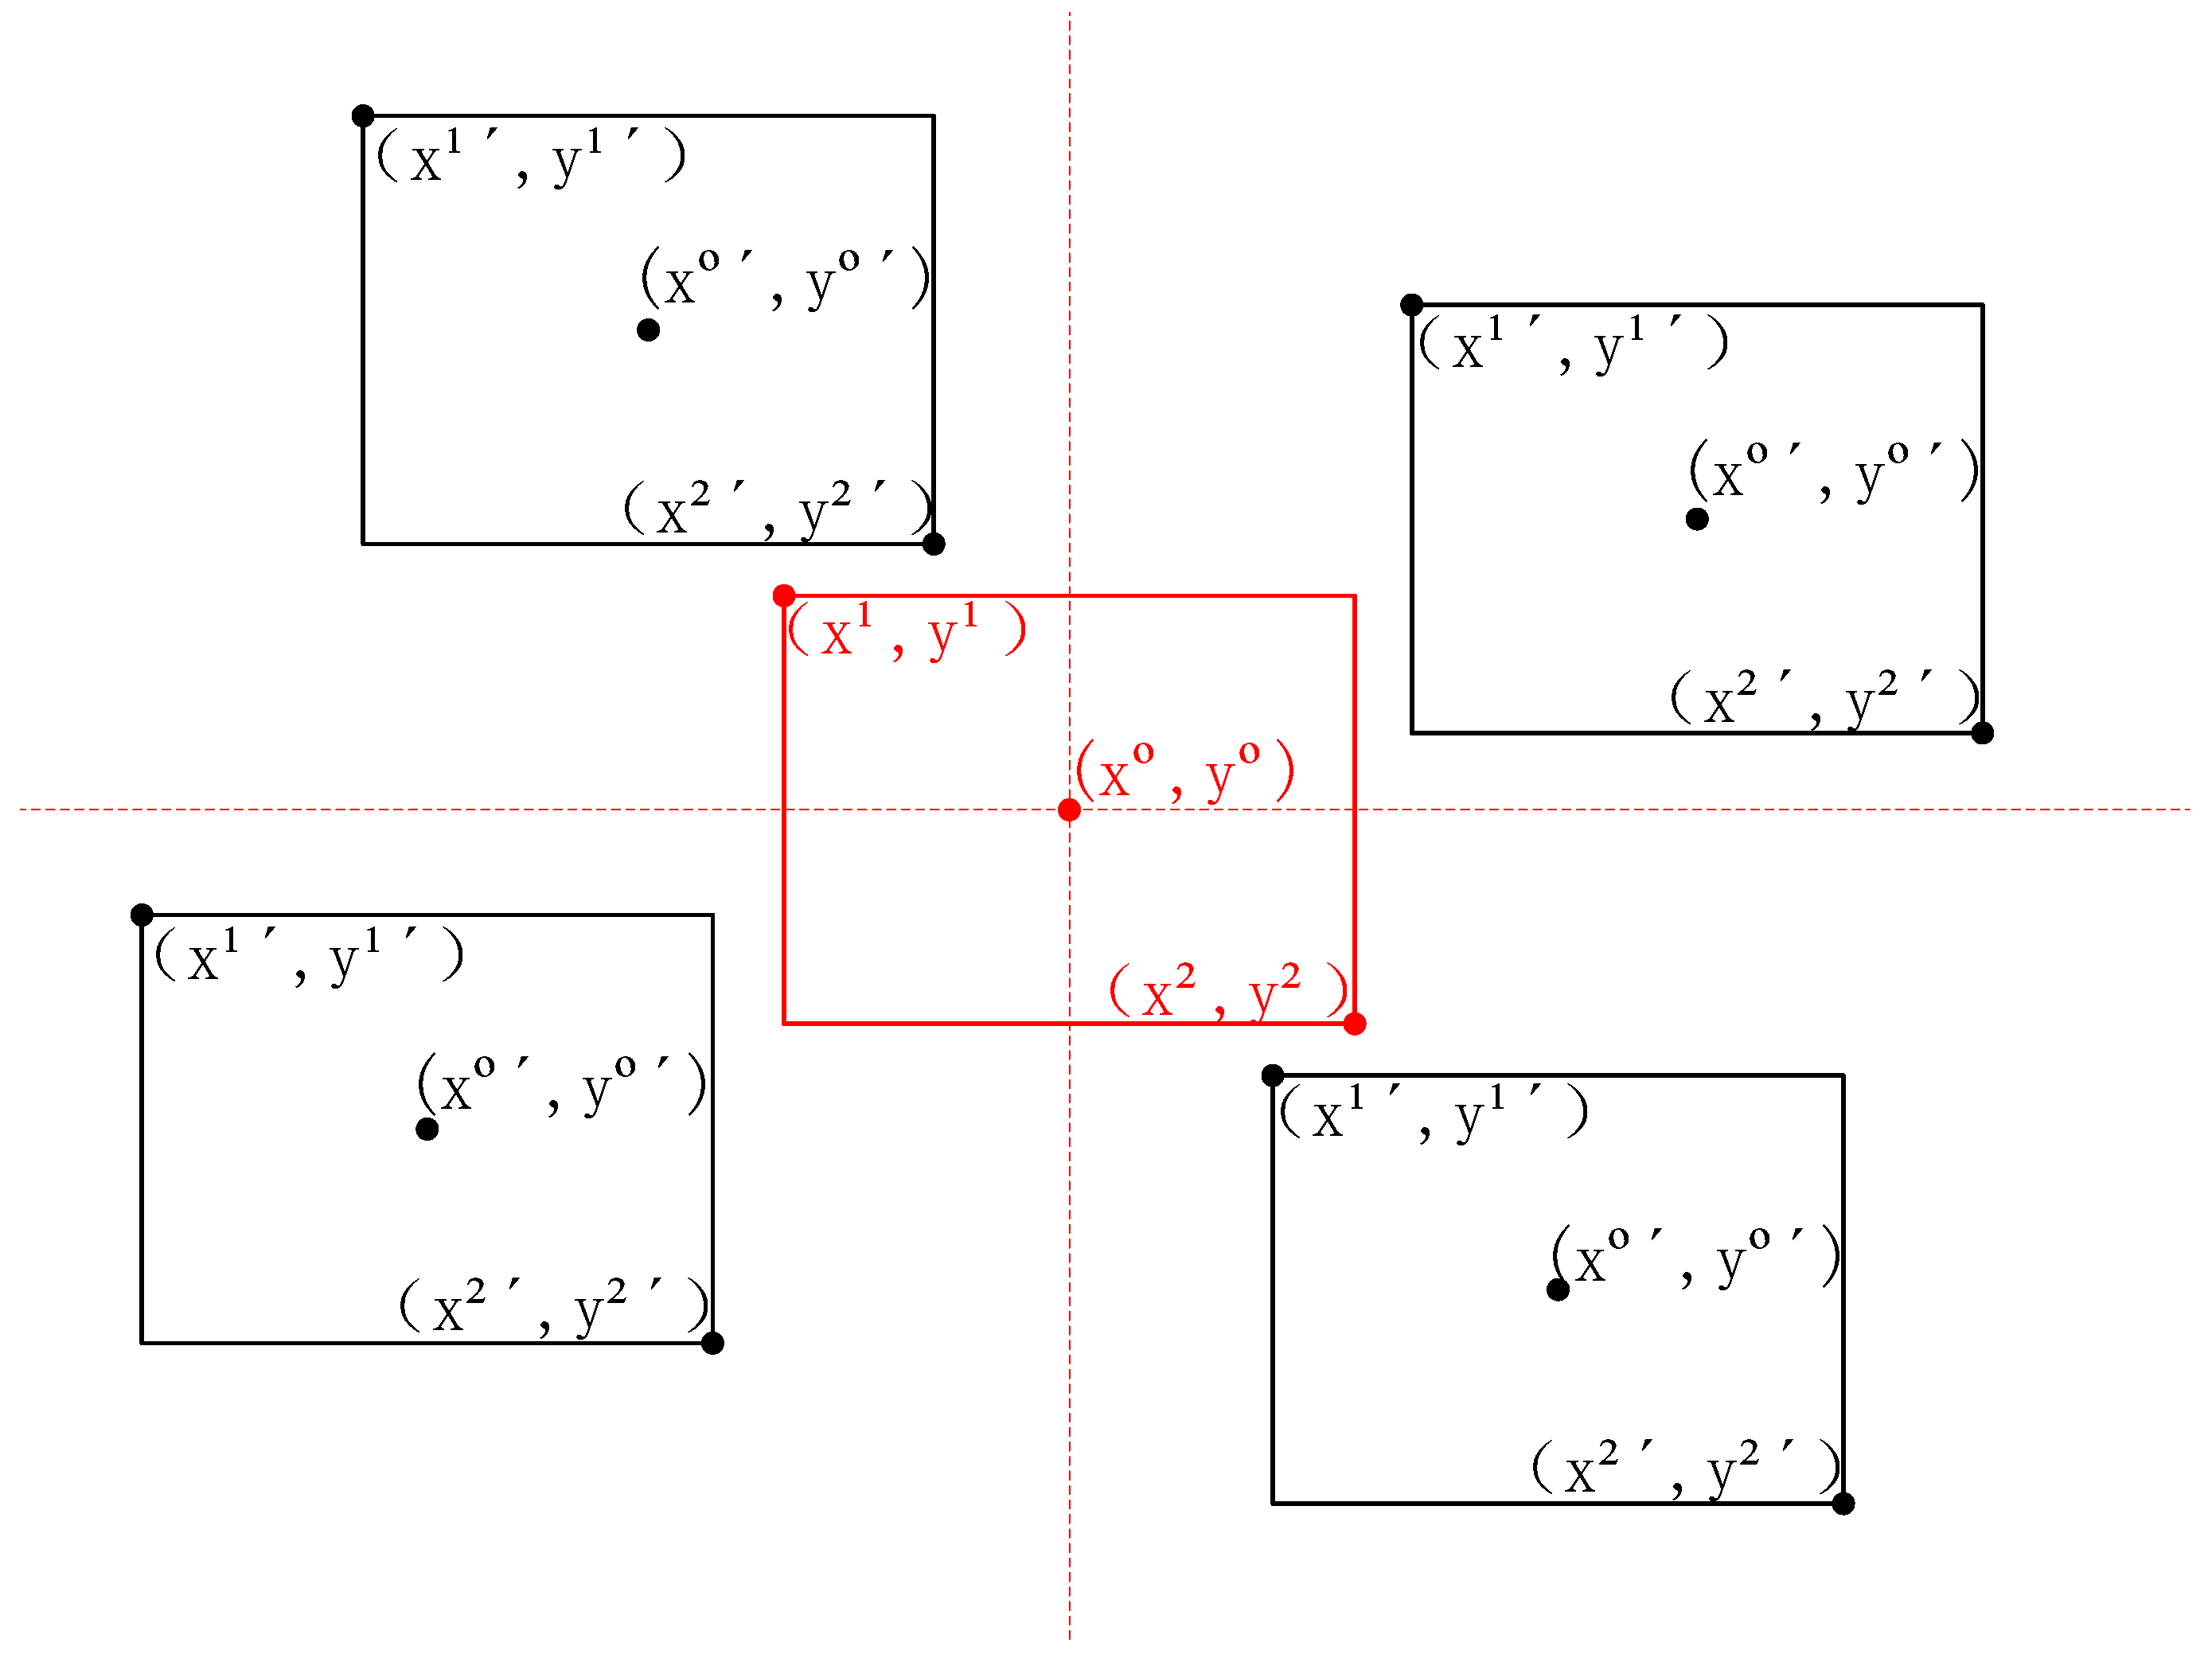
First, the relative orientation of the two boxes is determined using their center coordinates, as shown in Figure 4. The red box represents the selected prediction box, defined as box A. The surrounding four black boxes represent the possible positions of nearby prediction boxes relative to box A, defined as box B. There are four possible orientations: upper left, lower left, upper right, and lower right.
Taking the example where box B appears in the lower right position relative to box A, both box A and box B are scaled by a factor of k, where k is a positive number. This scaling involves enlarging the corner coordinates of both boxes by k times, ensuring that the two enlarged boxes intersect while maintaining their relative positions. As shown in Figure 5, which illustrates the scenario where box B is in the lower right position, the specific IoU calculation is as follows.
The width and height of the intersection are
Width:
W i n t e r = k x 2 k x 1 ,
Height:
H i n t e r = k y 2 k y 1 ,
The area of the intersection is
S i n t e r = W i n t e r H i n t e r ,
The enlarged bounding box area is as follows:
S A = k 2 ( x 2 x 1 ) ( y 2 y 1 ) ,
S B = k 2 ( x 2 x 1 ) ( y 2 y 1 ) ,
The enlarged union area is
S u n i o n = S A + S B S i n t e r ,
Calculation of IoU:
I o U = S i n t e r S u n i o n ,
I o U = W i n t e r H i n t e r S A + S B W i n t e r H i n t e r ,
I o U = k 2 x 2 x 1 y 2 y 1 k 2 x 2 x 1 y 2 y 1 + x 2 x 1 y 2 y 1 x 2 x 1 y 2 y 1 ,
Simplified:
I o U = x 2 x 1 y 2 y 1 x 2 x 1 y 2 y 1 + x 2 x 1 y 2 y 1 x 2 x 1 y 2 y 1 ,
It can be observed that the scaling factor k does not affect the actual IoU value. The IoU is determined solely by the relative position and the absolute scale information of box A and box B. In scenarios where prediction boxes for small objects in the BEV perspective rarely overlap, B-IoU can directly compute the IoU between prediction boxes without the need for any scaling operations.

4. BEV Circular Search Method (B-Grouping)

In the BEV perspective, prediction boxes for small target instances rarely overlap. Around a true positive prediction box, there are some prediction boxes that require NMS using an IoU threshold. Prediction boxes for adjacent large targets tend to intersect. This necessitates the introduction of a variable distance threshold, which is generated based on the size of the prediction box itself. For small targets, prediction boxes that are farther from the box under consideration and need processing can be selected autonomously. For large targets, prediction boxes that are closer to the box under consideration can be chosen autonomously.
As shown in Figure 6 and Figure 7, the red box represents the GT box, and the blue boxes are prediction boxes that have not undergone NMS. The yellow-highlighted box is assumed to be a true positive prediction box. A green circular frame is used as the search area, with the center of the true positive prediction box as the origin. The width of the box (scaled down by a certain factor, focusing on the smaller side) is used as the radius to perform the B-Grouping operation. Any prediction boxes with their center points within the circular area will participate in the B-IoU calculation.

5. BEV-NMS Strategy

The BEV-NMS strategy is based on the proposed IoU calculation method (B-IoU) and the BEV perspective circular search method (B-Grouping). The logic of BEV-NMS is detailed in Algorithm 1.
Algorithm 1 Improved NMS with Rough Distance Filtering
 1:
Input:  B = { b 1 , b 2 , , b n } : Set of bounding boxes, S: Set of confidence scores corresponding to the bounding boxes, i o u _ t h r e s h : IoU threshold for fine filtering.
 2:
Initialize an empty set B s e l e c t e d { }
 3:
Sort B based on S in descending order.
 4:
while B is not empty do
 5:
    b i B [ 0 ]
 6:
   Add b i to B s e l e c t e d
 7:
    A r e a i = b i [ w ] b i [ h ]
 8:
   if  A r e a i > 1 then
 9:
      d i s t _ t h r e s h = 0.5 ∗ b i [ h ]
10:
   else
11:
      d i s t _ t h r e s h = 2.4 ∗ b i [ h ]
12:
   end if
13:
   for  b j B [ 1 : ]  do
14:
      d i s t distance between b i & b j
15:
     if  d i s t < = d i s t _ t h r e s h  then
16:
         r o u g h _ d i s t _ f i l t e r [ j ] True
17:
         t r u e _ i n d i c e s j
18:
     else
19:
         r o u g h _ d i s t _ f i l t e r [ j ] False
20:
     end if
21:
   end for
22:
   for  k B [ 1 : ] [ r o u g h _ d i s t _ f i l t e r ]  do
23:
      i o u s B I o U ( b i , b k )
24:
      i n d s i o u s > i o u _ t h r e s h
25:
   end for
26:
   for  t t r u e _ i n d i c e s  do
27:
     if  i n d s [ t ] = F a l s e  then
28:
         r o u g h _ d i s t _ f i l t e r [ t r u e _ i n d i c e s [ t ] ] F a l s e
29:
     end if
30:
   end for
31:
    B B [ 1 : ] [ r o u g h _ d i s t _ f i l t e r ]
32:
end while
33:
 
34:
return  B s e l e c t e d
In this approach, an empty set B select is initialized to store the indices of the prediction boxes that meet the criteria after applying BEV-NMS. Specifically, the process begins by sorting all the bounding boxes in descending order based on their confidence scores. The bounding boxes are then rearranged according to this sorted order.
The algorithm proceeds by iterating over the set B, which contains the bounding boxes. The first prediction box in the set B, which has the highest score, is selected and added to the B select set. The distance threshold is then adjusted based on the size of this selected box.
Next, a rough distance filtering is performed to identify the remaining boxes in B that are within the adjusted distance threshold from the selected box B [ 0 ] . The indices of these boxes are identified. For each of these boxes, the B-IoU method is used to calculate the IoU between them and the selected box B [ 0 ] . Only the indices of boxes with an IoU less than the threshold are retained.
Finally, all indices in B that do not meet the IoU threshold are removed, and the B set is updated. This process is repeated until the B set is empty. The resulting B select set contains the indices of the prediction boxes that meet the criteria after the BEV-NMS strategy has been applied.

6. Experiments

6.1. Dataset

This paper conducts comprehensive experiments on the large-scale dataset nuScenes [29] and DAIR-V2X [30]. The nuScenes dataset contains 1000 driving scenes, which were collected using six cameras. The dataset is divided into a training set, validation set, and test set, containing 700, 150, and 150 scenes, respectively. Across the entire dataset, there are up to 1.4 million annotated 3D bounding boxes, covering 10 categories: car, truck, bus, trailer, construction vehicle, pedestrian, motorcycle, bicycle, barrier, and traffic cone. nuScenes is chosen for this research due to its high-quality data, extensive annotations, and wide adoption in the research community. Its complexity and variety of urban scenarios make it an excellent dataset for evaluating 3D object detection algorithms in real-world environments. Drawing on the approach used in CenterPoint [28], this paper defines the region of interest (ROI) within a 51.2 m range on the ground plane. By default, the resolution is set to 0.8 m.
The DAIR-V2X dataset [30] is a large-scale, multi-modality dataset. The dataset includes images from vehicles and roadside units, the benchmark consists of three tracks to simulate different scenarios. In this study, we focuses on DAIR-V2X-I, which only contains images from fixed mounted cameras. Specifically, DAIR-V2X-I includes around ten thousand images, divided into 50%, 20%, and 30% for the training, validation, and test sets, respectively. We follow the benchmark to use the average perception of the bounding box, similar to KITTI [31].

6.2. Evaluation Metrics

For camera-based BEV 3D object detection, the following official metrics are predefined: mean average precision (mAP), mean average translation error (mATE), mean average scale error (mASE), mean average orientation error (mAOE), mean average velocity error (mAVE), mean average attribute error (mAAE), nuScenes detection score (NDS) and frames per second (FPS). The mAP metric is similar to the mAP used in 2D object detection for measuring precision and recall. NDS is an overall score that integrates the six aforementioned metrics. Below is a formal explanation of each evaluation metric used in the nuScenes dataset.
mAP is a standard object detection metric that measures the accuracy of detecting and classifying objects based on the IoU between predicted and ground truth boxes.
mAP = 1 | C | c C A P c
|C| is the total number of object classes, APc is the average precision for class c, calculated based on IoU thresholds. The mAP is computed by averaging AP across different IoU thresholds.
mATE measures the error in translation (i.e., position) between predicted 3D bounding boxes and ground truth boxes.
mATE = 1 N i = 1 N t i pred t i gt
t i p r e d is the center position of the i-th predicted bounding box. t i g t is the center position of the i-th ground truth bounding box. N is the total number of matched predicted and ground truth bounding boxes.
mASE measures the error in the scale (i.e., width, height, and depth) of the predicted 3D bounding boxes compared to ground truth boxes.
mASE = 1 N i = 1 N s i pred s i gt s i gt
s i p r e d is the dimensions (width, height, and depth) of the i-th predicted bounding box. s i g t is the dimensions of the i-th ground truth bounding box. N is the total number of matched predicted and ground truth bounding boxes.
mAOE measures the error in orientation (i.e., heading direction) between predicted 3D bounding boxes and ground truth boxes.
mAOE = 1 N i = 1 N min | θ i pred θ i gt | , 2 π | θ i pred θ i gt |
θ i p r e d is the heading angle of the i-th predicted bounding box, θ i g t is the heading angle of the i-th ground truth bounding box, and N is the total number of matched predicted and ground truth bounding boxes.
mAVE measures the error in velocity between predicted and ground truth objects.
mAVE = 1 N i = 1 N v i pred v i gt
v i p r e d is the velocity of the i-th predicted object, v i g t is the velocity of the i-th ground truth object, and N is the total number of matched predicted and ground truth objects.
mAAE measures the error in predicting attributes (e.g., whether a vehicle is parked or moving) of objects.
mAAE = 1 N i = 1 N 1 ( a i pred a i gt )
a i p r e d is the attribute of the i-th predicted object, a i g t is the attribute of the i-th ground truth object, N is the total number of matched predicted and ground truth objects, 1 is an indicator function that equals 1 if the attributes do not match and 0 if they match.
NDS is a composite score that combines several metrics, including mAP, mATE, mASE, mAOE, mAVE, and mAAE, to provide an overall evaluation of a model’s performance.
NDS = 1 10 5 · mAP + ( 1 min ( 1 , mATE X ATE ) ) + ( 1 min ( 1 , mASE X ASE ) ) + ( 1 min ( 1 , mAOE X AOE ) ) + ( 1 min ( 1 , mAVE X AVE ) ) + ( 1 min ( 1 , mAAE X AAE ) )
X ATE , X ASE , X AOE , X AVE , X AAE are normalization constants for each corresponding error; mAP has a weight of 5, while the other error metrics each have a weight of 1.

6.3. Implementation Details

Following the approach used in BEVDet [11], this paper trains the models using the AdamW [32] optimizer. Gradient clipping is applied, with a learning rate of 2 × 10⁻⁴ and a batch size of 8 on a single NVIDIA GeForce RTX 3090 GPU. This paper adopts image data augmentations including random cropping, random scaling, random flipping, and random rotation, and also adopts BEV data augmentations including random scaling, random flipping, and random rotation.

6.4. Main Results

As shown in Table 1, this paper compares the inference results on the nuScenes [29] dataset by evaluating the post-processing performance in BEVDet-Tiny [11] with no NMS, Scale-NMS, and the proposed BEV-NMS. Compared to the case where no NMS is used, applying the BEV-NMS strategy results in a 9.9% increase in mAP and an 8.1% increase in NDS. When compared to using Scale-NMS, the BEV-NMS strategy leads to a 2.8% improvement in mAP and a 3.9% improvement in NDS.
As shown in Table 2, this paper compares the inference results on the nuScenes [29] dataset by evaluating the post-processing performance in BEVDet4D [14] with no NMS, Scale-NMS, and the proposed BEV-NMS. When comparing the case without NMS, applying the BEV-NMS strategy results in a 5.9% increase in mAP and a 7.7% increase in NDS. Compared to using Scale-NMS, BEV-NMS shows a 4.1% improvement in mAP and a 2.4% improvement in NDS. Combined with the results from Table 1, these findings demonstrate the feasibility and effectiveness of the proposed BEV-NMS strategy across multiple existing models.
As shown in Table 3, this paper presents a comparison of different paradigms on the nuScenes validation set, specifically contrasting BEVDet4D [14] using the BEV-NMS strategy with other BEV-based 3D object detection methods.
As shown in Table 4, this paper presents the results of three types of objects, car, pedestrian (ped.), and cyclist (cyc.). Each object is categorized into three settings according to the difficulty defined in [4] on the DAIR-V2X validation set. Specifically, contrasting BEVDet4D [14] using the BEV-NMS strategy with other 3D object detection methods.

6.5. Ablation Study

This paper conducts several ablation experiments using the nuScenes [29] dataset to investigate the impact of the B-Grouping strategy on BEV-NMS. All experiments are based on the BEVDet4D [14] model. The analysis focuses on the effect of setting different distance thresholds for instances of varying sizes on the performance of BEV-NMS. The results are presented in Table 5.

6.6. Qualitative Results and Analysis

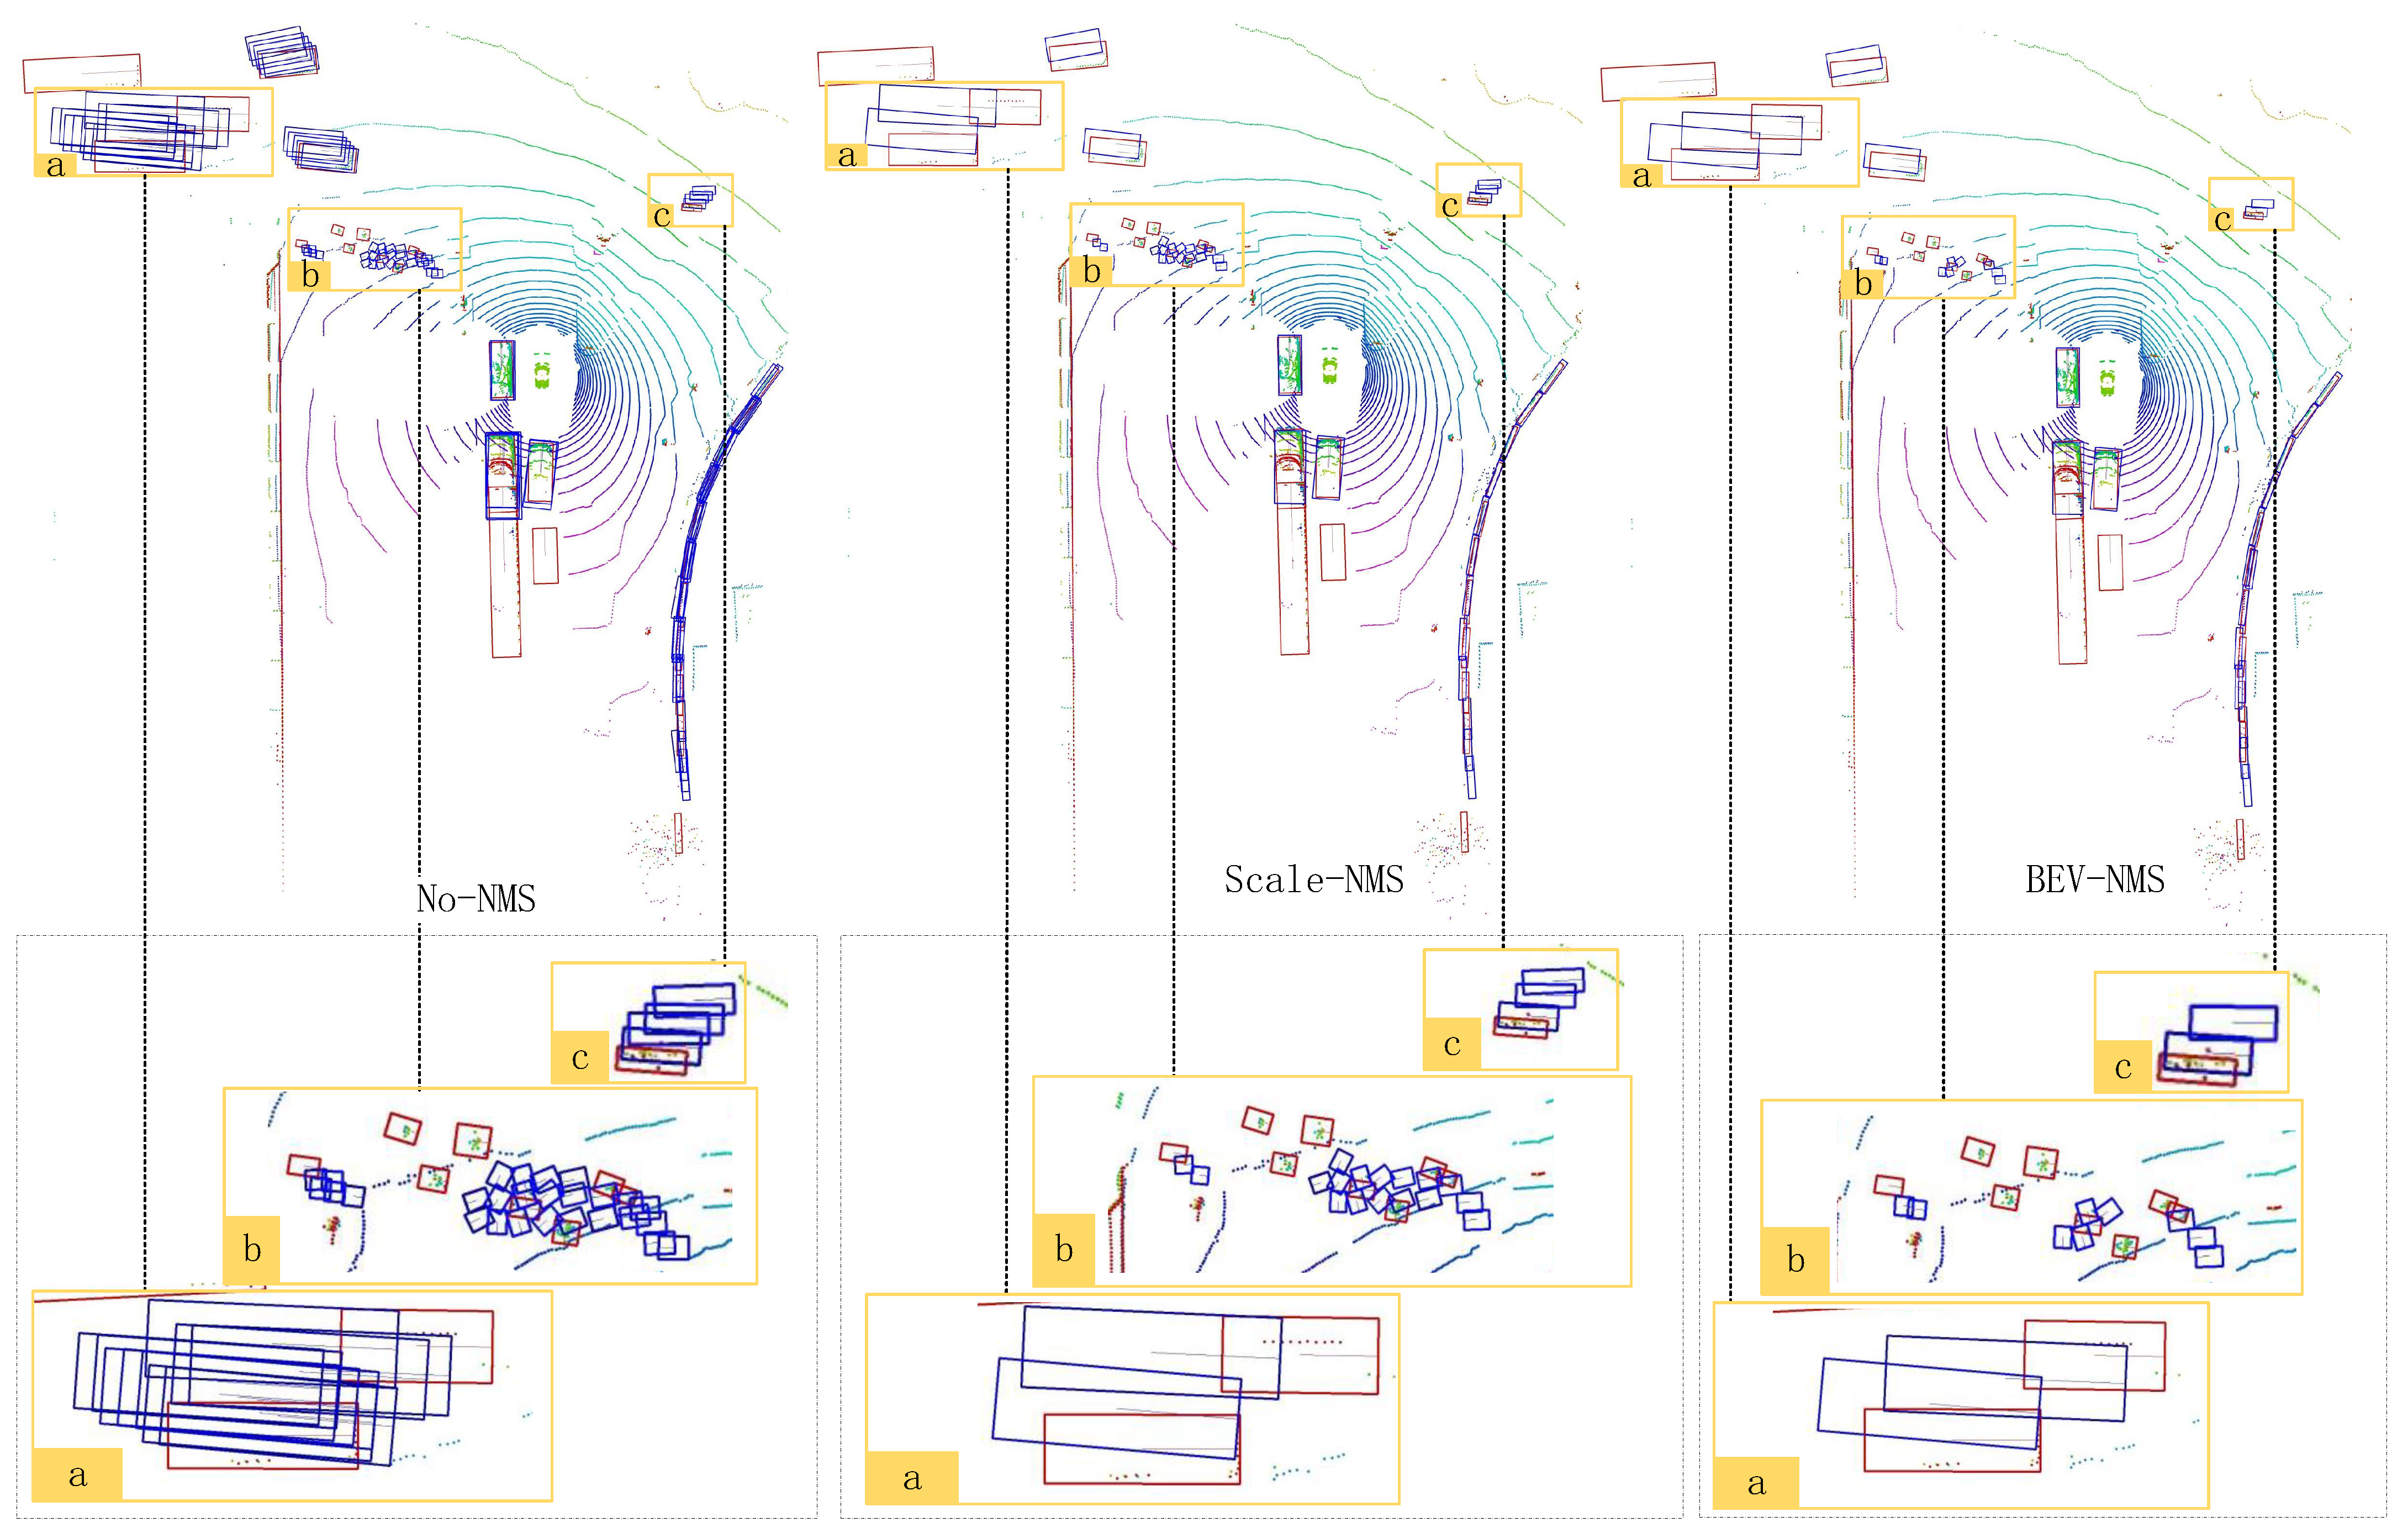
In this section, the paper presents and compares the visual results of three different strategies: without using the NMS strategy, using the Scale-NMS [11] strategy, and using the BEV-NMS strategy.
For cases where prediction boxes for large-sized instances overlap, as shown in Figure 8, the results from left to right are as follows: without applying the NMS strategy, applying the Scale-NMS strategy, and applying the BEV-NMS strategy. In the NMS strategy, prediction boxes are filtered in descending order of their scores. In region “a”, the prediction box in the lower left corner has the highest score among all the boxes. The Scale-NMS strategy uses this box as a reference and directly filters out the highest-scoring prediction box from another frame.
However, in the BEV-NMS strategy proposed in this paper, the B-Grouping strategy effectively addresses this issue. It ensures that NMS filtering is applied only within the prediction box group of a single instance. As a result, the final retained prediction boxes for both large-sized instances are the highest-scoring ones from their respective groups.
In region “c”, the IoU between the prediction boxes does not meet the filtering criteria of the Scale-NMS strategy. However, the B-Grouping filtering radius in the BEV-NMS strategy is relatively large for small targets. This allows the inclusion of prediction boxes that do not intersect with the true positive prediction box. These distant prediction boxes are then filtered based on the IoU value calculated using the B-IoU method.
As shown in Figure 9, this frame contains many small-sized instances. In the left region “a”, the results are without applying the NMS strategy. In the middle region “a”, the results show the application of the Scale-NMS strategy. Compared to the results without using NMS, many redundant prediction boxes still surround the small-sized instances. In the right region “a”, the BEV-NMS strategy has been applied. This method effectively removes the redundant prediction boxes around the small instances and retains the best prediction box.
A similar situation can be observed in region “b” of Figure 8, where the effectiveness of the Scale-NMS strategy is evident. However, in region “c” of Figure 8, the IoU between the prediction boxes of small targets does not meet the filtering criteria of the Scale-NMS strategy. As a result, some false positive prediction boxes are retained. The BEV-NMS strategy, on the other hand, uses a larger B-Grouping filtering radius for small targets. This allows it to include prediction boxes that do not overlap with the true positive prediction box. These distant prediction boxes are then filtered based on the IoU value calculated using the B-IoU method.

7. Conclusions

This paper proposes a 3D object detection method based on a camera’s bird’s-eye view, referred to as the BEV-NMS strategy. This strategy provides a novel approach to address the challenges of densely packed, non-overlapping prediction boxes for small-sized instances in the BEV perspective, as well as the overlapping prediction boxes for large-sized instances. The BEV-NMS strategy includes a circular search method called B-Grouping and a BEV-specific IoU calculation method, B-IoU, which combines relative position and absolute spatial information. The feasibility of the BEV-NMS strategy has been validated across several existing algorithms. Based on the results from the nuScenes validation set, there was an average increase of 7.9% in mAP when compared to the strategy without NMS. The NDS also showed an average increase of 7.9% under the same comparison. Furthermore, compared to the Scale-NMS strategy, the mAP increased by an average of 3.4%, and the NDS saw an average improvement of 3.1%.
Although the B-Grouping and B-IoU strategies address the overlapping and non-overlapping situations for targets of different sizes, the existing methods may still have limitations when dealing with extremely dense target distributions or targets with complex shapes. Especially in higher-density and more complex urban environments, further optimization of search strategies and IoU calculation methods may be necessary to more accurately handle target overlaps and localization errors. Moreover, while the current models perform well in detecting and recognizing common traffic targets, they may underperform when it comes to finer-grained object categories. Future research could explore how to extend the BEV-NMS method to more complex and diverse object categories without sacrificing performance, in order to address the rich variety of targets and dynamic changes in real-world traffic scenarios.

Author Contributions

Conceptualization, B.L.; data curation, B.L.; formal analysis, B.L.; funding acquisition, S.S. and L.A.; investigation, B.L.; methodology, B.L.; project administration, B.L.; resources, B.L.; software, B.L.; supervision, S.S. and L.A.; validation, B.L.; visualization, B.L.; writing—original draft, B.L.; writing—review and editing, S.S. and L.A. All authors have read and agreed to the published version of the manuscript.

Funding

This research received no external funding.

Data Availability Statement

The datasets used in this study, specifically nuScenes and DAIR-V2X, are publicly accessible. The original data presented in the study are openly available in https://www.nuscenes.org/nuscenes and https://thudair.baai.ac.cn/index.

Conflicts of Interest

The authors declare no conflicts of interest.

References

  1. Chen, Z.; Li, Z.; Zhang, S.; Fang, L.; Jiang, Q.; Zhao, F.; Zhou, B.; Zhao, H. Autoalign: Pixel-instance feature aggregation for multi-modal 3D object detection. arXiv 2022, arXiv:2201.06493. [Google Scholar]
  2. Wang, Y.; Mao, Q.; Zhu, H.; Deng, J.; Zhang, Y.; Ji, J.; Li, H.; Zhang, Y. Multi-modal 3D object detection in autonomous driving: A survey. Int. J. Comput. Vis. 2023, 131, 2122–2152. [Google Scholar] [CrossRef]
  3. Antonello, M.; Carraro, M.; Pierobon, M.; Menegatti, E. Fast and robust detection of fallen people from a mobile robot. In Proceedings of the 2017 IEEE/RSJ International Conference on Intelligent Robots and Systems (IROS), Vancouver, BC, Canada, 24–28 September 2017; pp. 4159–4166. [Google Scholar]
  4. Wohlgenannt, I.; Simons, A.; Stieglitz, S. Virtual reality. Bus. Inf. Syst. Eng. 2020, 62, 455–461. [Google Scholar] [CrossRef]
  5. Lang, A.H.; Vora, S.; Caesar, H.; Zhou, L.; Yang, J.; Beijbom, O. Pointpillars: Fast encoders for object detection from point clouds. In Proceedings of the IEEE/CVF Conference on Computer Vision and Pattern Recognition, Long Beach, CA, USA, 15–20 June 2019; pp. 12697–12705. [Google Scholar]
  6. Qi, C.R.; Su, H.; Mo, K.; Guibas, L.J. Pointnet: Deep learning on point sets for 3D classification and segmentation. In Proceedings of the IEEE Conference on Computer Vision and Pattern Recognition, Honolulu, HI, USA, 21–26 July 2017; pp. 652–660. [Google Scholar]
  7. Shi, S.; Guo, C.; Jiang, L.; Wang, Z.; Shi, J.; Wang, X.; Li, H. Pv-rcnn: Point-voxel feature set abstraction for 3D object detection. In Proceedings of the IEEE/CVF Conference on Computer Vision and Pattern Recognition, Seattle, WA, USA, 13–19 June 2020; pp. 10529–10538. [Google Scholar]
  8. Deng, J.; Shi, S.; Li, P.; Zhou, W.; Zhang, Y.; Li, H. Voxel r-cnn: Towards high performance voxel-based 3D object detection. In Proceedings of the AAAI Conference on Artificial Intelligence, Virtually, 2–9 February 2021; Volume 35, pp. 1201–1209. [Google Scholar]
  9. Shi, S.; Wang, X.; Li, H. Pointrcnn: 3D object proposal generation and detection from point cloud. In Proceedings of the IEEE/CVF Conference on Computer Vision and Pattern Recognition, Long Beach, CA, USA, 15–20 June 2019; pp. 770–779. [Google Scholar]
  10. He, C.; Li, R.; Li, S.; Zhang, L. Voxel set transformer: A set-to-set approach to 3D object detection from point clouds. In Proceedings of the IEEE/CVF Conference on Computer Vision and Pattern Recognition, New Orleans, LA, USA, 18–24 June 2022; pp. 8417–8427. [Google Scholar]
  11. Huang, J.; Huang, G.; Zhu, Z.; Ye, Y.; Du, D. Bevdet: High-performance multi-camera 3D object detection in bird-eye-view. arXiv 2021, arXiv:2112.11790. [Google Scholar]
  12. Wang, T.; Zhu, X.; Pang, J.; Lin, D. FCOS3D: Fully convolutional one-stage monocular 3D object detection. In Proceedings of the IEEE/CVF International Conference on Computer Vision, Montreal, BC, Canada, 11–17 October 2021; pp. 913–922. [Google Scholar]
  13. Wang, Y.; Guizilini, V.C.; Zhang, T.; Wang, Y.; Zhao, H.; Solomon, J. DETR3D: 3D object detection from multi-view images via 3D-to-2D queries. In Proceedings of the Conference on Robot Learning, PMLR, Auckland, New Zealand, 14–18 December 2022; pp. 180–191. [Google Scholar]
  14. Huang, J.; Huang, G. BEVDet4D: Exploit temporal cues in multi-camera 3D object detection. arXiv 2022, arXiv:2203.17054. [Google Scholar]
  15. Li, Z.; Wang, W.; Li, H.; Xie, E.; Sima, C.; Lu, T.; Qiao, Y.; Dai, J. Bevformer: Learning bird’s-eye-view representation from multi-camera images via spatiotemporal transformers. In Proceedings of the European Conference on Computer Vision, Tel Aviv, Israel, 23–27 October 2022; Springer: Cham, Switzerland, 2022; pp. 1–18. [Google Scholar]
  16. Liu, Y.; Wang, T.; Zhang, X.; Sun, J. Petr: Position embedding transformation for multi-view 3D object detection. In Proceedings of the European Conference on Computer Vision, Tel Aviv, Israel, 23–27 October 2022; Springer: Cham, Switzerland, 2022; pp. 531–548. [Google Scholar]
  17. Park, D.; Ambrus, R.; Guizilini, V.; Li, J.; Gaidon, A. Is pseudo-lidar needed for monocular 3D object detection? In Proceedings of the IEEE/CVF International Conference on Computer Vision, Montreal, BC, Canada, 11–17 October 2021; pp. 3142–3152. [Google Scholar]
  18. Wang, T.; Pang, J.; Lin, D. Monocular 3D object detection with depth from motion. In Proceedings of the European Conference on Computer Vision, Tel Aviv, Israel, 23–27 October 2022; Springer: Cham, Switzerland, 2022; pp. 386–403. [Google Scholar]
  19. Philion, J.; Fidler, S. Lift, splat, shoot: Encoding images from arbitrary camera rigs by implicitly unprojecting to 3D. In Proceedings of the Computer Vision–ECCV 2020: 16th European Conference, Glasgow, UK, 23–28 August 2020; Proceedings, Part XIV 16. Springer: Cham, Switzerland, 2020; pp. 194–210. [Google Scholar]
  20. Li, Y.; Huang, B.; Chen, Z.; Cui, Y.; Liang, F.; Shen, M.; Liu, F.; Xie, E.; Sheng, L.; Ouyang, W.; et al. Fast-BEV: A Fast and Strong Bird’s-Eye View Perception Baseline. IEEE Trans. Pattern Anal. Mach. Intell. 2024, 1–14. [Google Scholar] [CrossRef] [PubMed]
  21. Bodla, N.; Singh, B.; Chellappa, R.; Davis, L.S. Soft-NMS–improving object detection with one line of code. In Proceedings of the IEEE International Conference on Computer Vision, Venice, Italy, 22–29 October 2017; pp. 5561–5569. [Google Scholar]
  22. Zheng, Z.; Wang, P.; Liu, W.; Li, J.; Ye, R.; Ren, D. Distance-IoU loss: Faster and better learning for bounding box regression. In Proceedings of the AAAI Conference on Artificial Intelligence, New York, NY, USA, 7–12 February 2020; Volume 34, pp. 12993–13000. [Google Scholar]
  23. Zheng, Z.; Wang, P.; Ren, D.; Liu, W.; Ye, R.; Hu, Q.; Zuo, W. Enhancing geometric factors in model learning and inference for object detection and instance segmentation. IEEE Trans. Cybern. 2021, 52, 8574–8586. [Google Scholar] [CrossRef] [PubMed]
  24. He, Y.; Zhu, C.; Wang, J.; Savvides, M.; Zhang, X. Bounding box regression with uncertainty for accurate object detection. In Proceedings of the IEEE/CVF Conference on Computer Vision and Pattern Recognition, Long Beach, CA, USA, 15–20 June 2019; pp. 2888–2897. [Google Scholar]
  25. Liu, S.; Huang, D.; Wang, Y. Adaptive nms: Refining pedestrian detection in a crowd. In Proceedings of the IEEE/CVF Conference on Computer Vision and Pattern Recognition, Long Beach, CA, USA, 15–20 June 2019; pp. 6459–6468. [Google Scholar]
  26. He, K.; Zhang, X.; Ren, S.; Sun, J. Deep residual learning for image recognition. In Proceedings of the 2016 IEEE Conference on Computer Vision and Pattern Recognition, Las Vegas, NV, USA, 27–30 June 2016; pp. 770–778. [Google Scholar]
  27. Liu, Z.; Lin, Y.; Cao, Y.; Hu, H.; Wei, Y.; Zhang, Z.; Lin, S.; Guo, B. Swin transformer: Hierarchical vision transformer using shifted windows. In Proceedings of the IEEE/CVF International Conference on Computer Vision, Montreal, BC, Canada, 11–17 October 2021; pp. 10012–10022. [Google Scholar]
  28. Yin, T.; Zhou, X.; Krahenbuhl, P. Center-based 3D object detection and tracking. In Proceedings of the IEEE/CVF Conference on Computer Vision and Pattern Recognition, Nashville, TN, USA, 20–25 June 2021; pp. 11784–11793. [Google Scholar]
  29. Caesar, H.; Bankiti, V.; Lang, A.H.; Vora, S.; Liong, V.E.; Xu, Q.; Krishnan, A.; Pan, Y.; Baldan, G.; Beijbom, O. nuscenes: A multimodal dataset for autonomous driving. In Proceedings of the IEEE/CVF Conference on Computer Vision and Pattern Recognition, Seattle, WA, USA, 13–19 June 2020; pp. 11621–11631. [Google Scholar]
  30. Yu Haibao, L.Y.; Mao, S. Dair-v2x: A large-scale dataset for vehicle-infrastructure cooperative 3D object detection. In Proceedings of the IEEE/CVF Conference on Computer Vision and Pattern Recognition, New Orleans, LA, USA, 18–24 June 2022; pp. 21361–21370. [Google Scholar]
  31. Geiger, A.; Lenz, P.; Urtasun, R. Are we ready for autonomous driving? the kitti vision benchmark suite. In Proceedings of the 2012 IEEE Conference on Computer Vision and Pattern Recognition, Providence, RI, USA, 16–21 June 2012; pp. 3354–3361. [Google Scholar]
  32. Loshchilov, I.; Hutter, F. Decoupled weight decay regularization. arXiv 2017, arXiv:1711.05101. [Google Scholar]
Figure 1. The predicted boxes for two large-target instances have intersected with each other.
Electronics 13 04034 g001
Figure 2. A small-target GT box is surrounded by a large number of predicted boxes.
Electronics 13 04034 g002
Figure 3. The overall flowchart consists of three parts: data loading and preparation, model forward propagation, and the post-processing stage.
Electronics 13 04034 g003
Figure 4. Possible scenarios that may occur between box B and box A.
Electronics 13 04034 g004
Figure 5. The scenario where box B is located at the lower right of box A.
Electronics 13 04034 g005
Figure 6. The B-Grouping strategy for the predicted boxes of small-target instances.
Electronics 13 04034 g006
Figure 7. The B-Grouping strategy for the predicted boxes of large-target instances.
Electronics 13 04034 g007
Figure 8. The results of the same scene with large-sized instances without using the NMS strategy, using the Scale-NMS strategy, and using the BEV-NMS strategy.
Electronics 13 04034 g008
Figure 9. The results of the same scene with small-sized instances without using the NMS strategy, using the Scale-NMS strategy, and using the BEV-NMS strategy.
Electronics 13 04034 g009
Table 1. BEVDet-Tiny is used as the baseline for comparing the experimental results related to NMS methods.
NMS TypemAPNDSmATEmASEmAOEmAVEmAAE
None0.2370.3520.7600.2810.6020.7810.226
Scale-NMS0.3080.3940.7150.2800.5970.7780.230
BEV-NMS0.3360.4330.6080.2850.5310.7320.195
Note: Bold values in the table indicate the best performance.
Table 2. BEVDet4D is used as the baseline for comparing the experimental results related to NMS methods.
NMS TypemAPNDSmATEmASEmAOEmAVEmAAE
None0.4030.4920.6360.3370.3570.4270.339
Scale-NMS0.4210.5450.5790.2580.3290.3010.191
BEV-NMS0.4620.5690.5130.2600.3320.3120.189
Note: Bold values in the table indicate the best performance.
Table 3. Comparison of different paradigms on the nuScenes validation set.
ModelmAPNDSmATEmASEmAOEmAVEmAAEFPS
FCOS3D0.3430.4150.7250.2630.4221.2920.1531.7
DD3D0.4180.4770.5720.2490.3681.0410.124-
DETR3D0.4120.4790.6410.2550.3940.8450.1332.0
BEVFormer0.4450.5350.6310.2570.4050.4350.1431.7
BEVDet0.3970.4770.5950.2570.3550.8180.1881.9
BEVDet4D0.4210.5450.5790.2580.3290.3010.1911.9
PETR0.4210.5240.6810.2670.3570.3770.1863.4
BEVDepth0.4120.5350.5650.2660.3580.3310.190-
FAST-BEV0.4130.5350.5840.2790.3110.3290.20619.7
Ours0.4620.5690.5130.2600.3320.3120.1891.1
Note: Bold values in the table indicate the best performance.
Table 4. Comparison of different paradigms on the DAIR-V2X validation set.
MethodCar (IoU = 0.5)Ped. (IoU = 0.25)Cuc. (IoU = 0.25)
EasyMidHardEasyMidHardEasyMidHard
BEVDet58.2348.0547.9413.2712.8912.7119.3718.8918.61
BEVDet4D59.6351.9749.0615.2814.5414.3220.5920.5720.36
BEVFormer61.3750.7350.7316.8915.8215.9522.1622.1322.06
BEVDepth75.5063.5863.6734.9533.4233.2755.6755.4755.34
Ours76.7164.7964.6040.1838.2938.1959.4359.1759.03
Note: Bold values in the table indicate the best performance.
Table 5. Based on the BEVDet4D model, this paper analyzes the impact of setting different distance thresholds for instances of varying sizes on the performance of BEV-NMS.
ModelmAPNDSmATEmASEmAOEmAVEmAAE
Large SizeSmall Size
0.22.40.4370.5550.5260.2610.3400.3150.189
0.52.40.4620.5690.5130.2600.3320.3120.189
1.02.40.4610.5680.5180.2610.3360.3150.190
1.52.40.4590.5690.5090.2600.3300.3110.190
0.50.50.4490.5630.5210.2610.3360.3130.189
0.51.00.4590.5680.5180.2610.3360.3130.189
0.51.50.4600.5680.5180.2610.3370.3140.190
0.52.40.4620.5690.5130.2600.3320.3120.189
0.53.00.4610.5680.5180.2610.3360.3150.190
Note: Bold values in the table indicate the best performance.
Disclaimer/Publisher’s Note: The statements, opinions and data contained in all publications are solely those of the individual author(s) and contributor(s) and not of MDPI and/or the editor(s). MDPI and/or the editor(s) disclaim responsibility for any injury to people or property resulting from any ideas, methods, instructions or products referred to in the content.