Article

Edge-Computing-Enabled Abnormal Activity Recognition for Visual Surveillance

1
Department of Basic Sciences, General Administration of the Preparatory Year, King Faisal University, Al-Ahsa 31982, Saudi Arabia
2
Data Engineering Unit, Veritas Technologies, Pune 411045, Maharashtra, India
3
School of Computer Science, UPES, Dehradun 248007, Uttarakhand, India
*
Authors to whom correspondence should be addressed.
Electronics 2024, 13(2), 251; https://doi.org/10.3390/electronics13020251
Submission received: 24 November 2023 / Revised: 27 December 2023 / Accepted: 2 January 2024 / Published: 5 January 2024
(This article belongs to the Special Issue Recent Research in Positioning and Activity Recognition Systems)

Abstract

:
Due to the ever increasing number of closed circuit television (CCTV) cameras worldwide, it is the need of the hour to automate the screening of video content. Still, the majority of video content is manually screened to detect some anomalous incidence or activity. Automatic abnormal event detection such as theft, burglary, or accidents may be helpful in many situations. However, there are significant difficulties in processing video data acquired by several cameras at a central location, such as bandwidth, latency, large computing resource needs, and so on. To address this issue, an edge-based visual surveillance technique has been implemented, in which video analytics are performed on the edge nodes to detect aberrant incidents in the video stream. Various deep learning models were trained to distinguish 13 different categories of aberrant incidences in video. A customized Bi-LSTM model outperforms existing cutting-edge approaches. This approach is used on edge nodes to process video locally. The user can receive analytics reports and notifications. The experimental findings suggest that the proposed system is appropriate for visual surveillance with increased accuracy and lower cost and processing resources.

1. Introduction

A CCTV-based system can be used to monitor various events at many public places. Imbibing intelligence and automation in processing video captured by these systems can be useful in many ways, ranging from traffic monitoring to vandalism detection. Prompt and timely actions can be taken as soon as an abnormal event is detected in the live video streams. Visual surveillance may encompass a number of tasks. It has applications in moving object detection [1], abandoned object detection [2], pedestrian detection [3], car make or model detection that may be helpful in accident sites and traffic violations [4], socio-cognitive behaviors of crowds [5], anomaly detection in road traffic [6], shop lifting [7], etc. Object detection has been one of the most important phases in a typical vision-based surveillance system. It is the first step in extracting the most useful pixels from a video feed. The study, presented in [1], looks at a variety of related methodologies, significant obstacles, applications, and resources, including datasets and web-sources. When video sequences are collected using IP cameras, the work provides a complete review of the moving object task suitable for a number of visual surveillance scenarios. To prevent bomb blasts from causing environmental and economic damage, automated smart visual surveillance is needed to keep a watch on the open spaces and infrastructures and to identify the items left behind in public places [2]. Commonly used approaches to identify abandoned objects are based on background segmentation for static object identification, feature extraction, object classification, and activity analysis [2]. Pedestrian detection and tracking have been an important function in traffic and road safety surveillance systems [6]. Traditional models have trouble dealing with complexity, turbulence, and the presence of a dynamic environment, but intelligent analytics and modeling can help overcome these difficult issues [3]. Protection of high rise civil engineering structures and human occupants from strong winds and earthquakes is crucial to human life, the economy, and the environment. The problem of vibration suppression of structures is an active, vast, and growing research field among mechanical, control, and civil engineers. The design of a vibration controller with high performance for passive, semi-active, active, and hybrid control of building structures is a challenging task due to model uncertainties and external disturbances. The main objective of a structural control system is to reduce the vibration of the high rise building structures when external disturbances such as strong winds, earthquakes, or heavy dynamic loads act on them.
In previous works, researchers have developed many interesting computer-based systems and techniques for various tasks associated with visual surveillance. However, these systems are either one-node heavy systems or rely on cloud resources for analytics. It means when connecting more than one camera, the data streams are sent to a cloud server for data analytics. It requires latency and bandwidth issues apart from heavy investments. In recent times, with the advent of the internet of things (IoT) and edge computing, the focus has shifted to performing computation as close to the source as possible. The edge computing model envisages a major part of computation happening on the edge of the network, i.e., the node itself. This requirement raises many concerns for performing video analytics on the edge devices due to the limited computation resources, memory, and power availability.
The present work proposes an edge-based visual surveillance system, where a range of abnormal activities can be detected from a video stream with the help of local analytics performed on an edge node. A deep learning model is deployed on each of the nodes (low-cost Raspberry Pi with an edge camera) and further connected to a cloud server for notifications and consumer interface. The rest of the paper is organized as follows. Section 2 reviews some of the related work in the fields of video analytics and visual surveillance, including edge-based visual surveillance and some deep learning models for video analytics. Section 3 describes the proposed system and methodology in detail. Next, Section 4 presents the experimental results and a comparison with other state-of-the-art approaches. Finally, conclusions and references can be found.

2. Related Work

2.1. Visual Analytics and Surveillance Systems

Understanding human behavior is essential for a variety of present and future interactions among people and smart systems and entities [5]. For instance, with prevalent CCTV-based surveillance systems, such knowledge might aid in detecting (and resolving as soon as feasible) incidents of hazardous, hostile, or just disruptive conduct in public meetings. Intense amounts of video data have prompted efforts to classify video information into categories such as human activities and complicated events. A growing body of work focuses on calculating effective local feature descriptors from spatio-temporal volumes [8]. Human activity recognition in videos is an important task in visual surveillance. One rationale behind such a classification is to detect abnormal activities in videos. Mliki et al. [9] adapted convolutional neural networks, which are generally used for classification, to identify humans. Furthermore, the categorization of human activities is performed in two ways: an immediate classification of video sequences and a complete classification of video sequences. They used the UCF-ARG dataset. One-shot learning (OSL) is becoming popular in many computer vision tasks, including action recognition. Contrary to conventional algorithms, which rely on massive datasets for training, OSL seeks to learn information about item classes with the help of one or a few training samples. The work described in [10] provides a deep learning model that can categorize and locate activities identified with the help of a single-shot detector technique employing the bounding box that has been deliberately trained to recognize common and uncommon actions for security surveillance applications.
Wassim et al. [11] used a feature approach to detect abnormal activities in crowded scenes on the UCSD anomaly detection dataset. The first category is motion features calculated using optical flow; the second is the size of moving individuals within frames; and the third is motion magnitude. Nawaratne et al. [12] described an incremental spatiotemporal learner (ISTL) addressing some of the challenges in anomaly localization and classification in real-time surveillance applications. ISTL is the unification of fuzzy aggregation with active learning in order to continuously learn and update the distinction between an anomaly and the normality that emerges over time. Anomaly detection using sparse encoding has shown encouraging results. Zhou et al. [13] used three joint neural architectures called “Anomalynet” for detecting anomalies in a video stream. Human aberrant behavior can occur at various timelines and can be divided into two categories: short-term and long-term. A uniform pre-defined timescale seems insufficient to represent a variety of abnormalities that occur throughout varying time periods [4]. Therefore, a useful approach for detecting anomalous human behavior is multi-timescale trajectory prediction, as proposed in the work of Rodrigues et al. [14]. To address the issue of fewer negative examples, the technique employs an unsupervised learning method that uses the spatiotemporal autoencoder to locate and extract the negative samples, containing anomalous behaviors, from the dataset. On this foundation, a spatiotemporal convolutional neural network (CNN) with a basic structure and minimal computational complexity has been given in [15]. More atypical human activity recognition systems are proposed in [16,17,18]. Beddiar et al. [19] and Pareek et al. [20] provide surveys on vision-based human activity recognition, discussing some of the recent breakthroughs, challenges, datasets, and emerging applications of the concept.
In activity recognition [21], optical flow refers to the pattern of apparent motion of objects, surfaces, and edges in a visual scene caused by the relative motion between the observer and the scene [22,23]. Optical flow is often used to track and understand the movement of objects in video sequences. In the context of activity recognition, optical flow can be employed to analyze the dynamics and motion patterns of human activities. By tracking the flow of pixels between consecutive frames, it becomes possible to extract information about the direction and speed of motion, which can contribute to the recognition of various activities such as walking, running, or gestures in a video [21,22,23].

2.2. Edge Computing for Visual Surveillance

Edge computing is a model where computing happens locally. It is performed so as to minimize the reliance on servers. There are local computing nodes performing computation and with some storage capabilities. In traditional visual surveillance systems having a network of CCTV cameras, the video stream is first sent to a common server and from there, it is analyzed either manually or automatically. This model involves data bandwidth, privacy, and security issues due to the huge amount of data that needs to be transmitted through a network. Edge computing brings computing resources closer to the source. In the present model, an anomaly detection model runs on each individual node. Many surveillance systems have recently been proposed in the literature [24,25,26,27,28,29,30,31,32,33].
There are many small-sized embedded devices suitable for computer vision tasks, such as the Jetson Nano, Google’s Coral, and Intel’s Myriad-X vision processing unit [24]. The latest breakthrough is the VPU, developed by Intel. It focuses on the parallel processing of neural networks, having high-speed inference processing and low power consumption. They can be used in embedded systems, drones, or systems powered by external power supplies. Myriad-X is available on the market. It has been used for object classification and for an object detection system on a Raspberry Pi.
An Edge-based surveillance system can be a helpful and useful remote monitoring tool for elderly patients [26]. The work of Yang et al. [28] describes the edge-based set-up of detecting and tracking the target vehicles using unmanned aerial vehicles (UAVs). They use a CNN model for object detection and further classification. Due to the power and computational limitations of UAVs, some of the processing in the system is offloaded to a local mobile-enabled computing (MEC) server. This approach makes the overall system computationally and power consumption-wise more efficient.
The edge devices have limited power and, therefore, restricted processing power. Pradeepkumar et al. [29] discuss a method to maintain the object detection accuracy of about 95% by just transmitting 5–10% of the frames captured by the edge camera. Ananthanarayanan et al. [30] propose an edge computing-based anomalous traffic detection video surveillance system that works on live video streams. Multiview activity recognition and summarization is a difficult task due to many challenges like view overlapping, inter-view correlations, and stream disparities [31]. Researchers have been trying to find innovative solutions to these problems. Combining this with edge computing can be very beneficial. Hussain et al. [31] proposed a framework to bring the task of multiview video summarization to an edge computing platform. The data is shown in Table 1.

2.3. Deep Learning Models for Video Classification

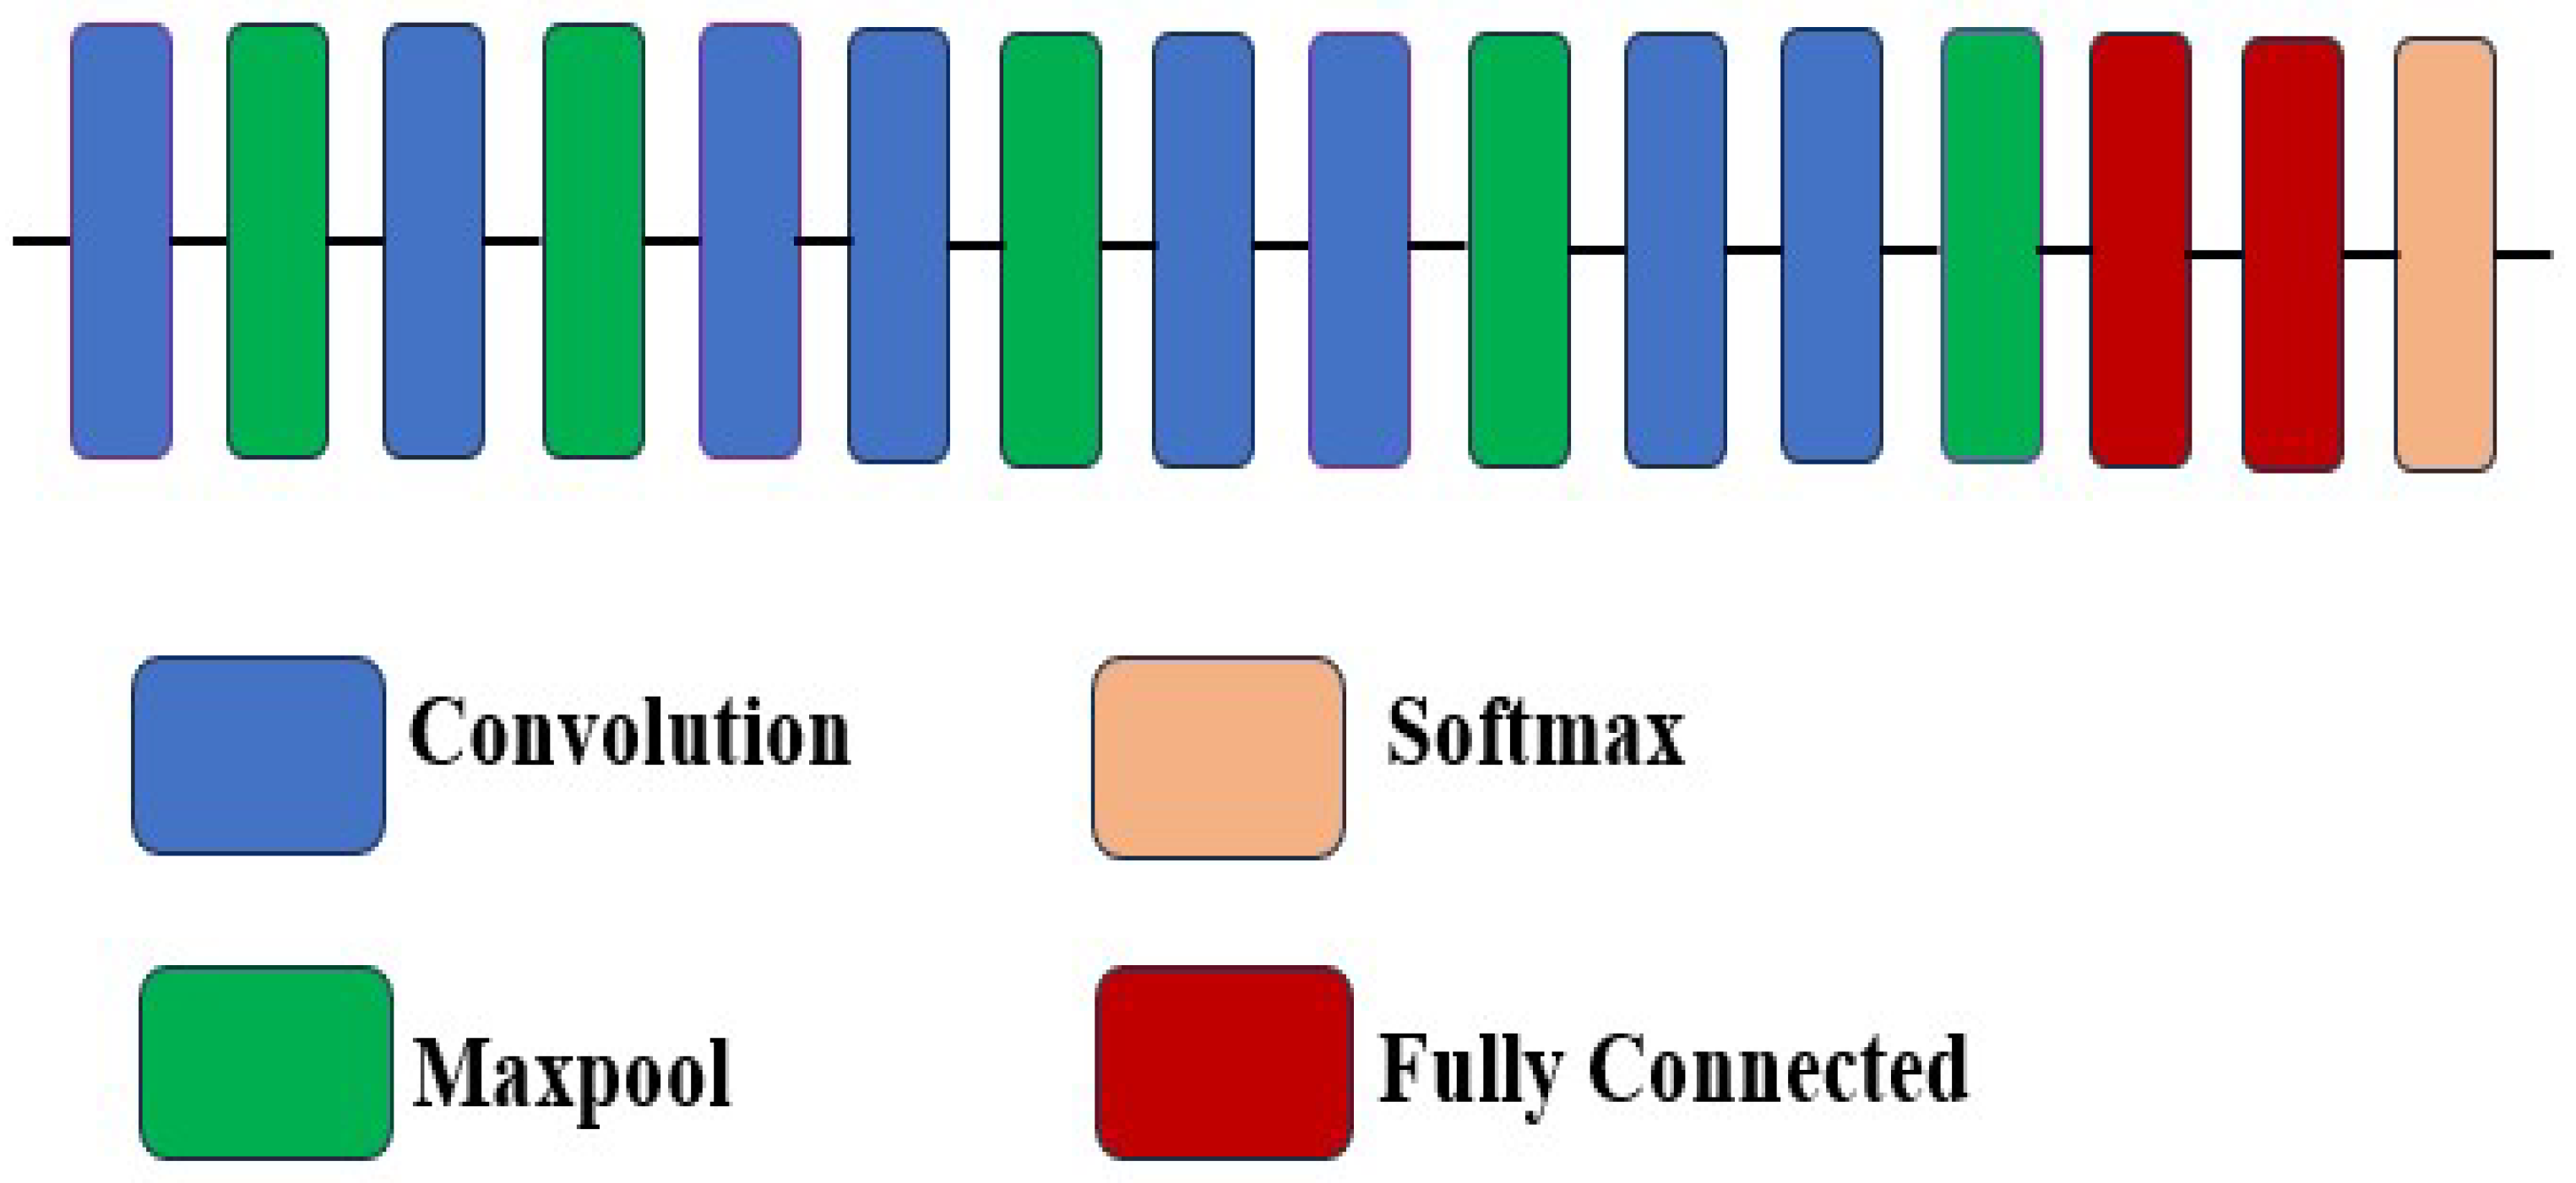
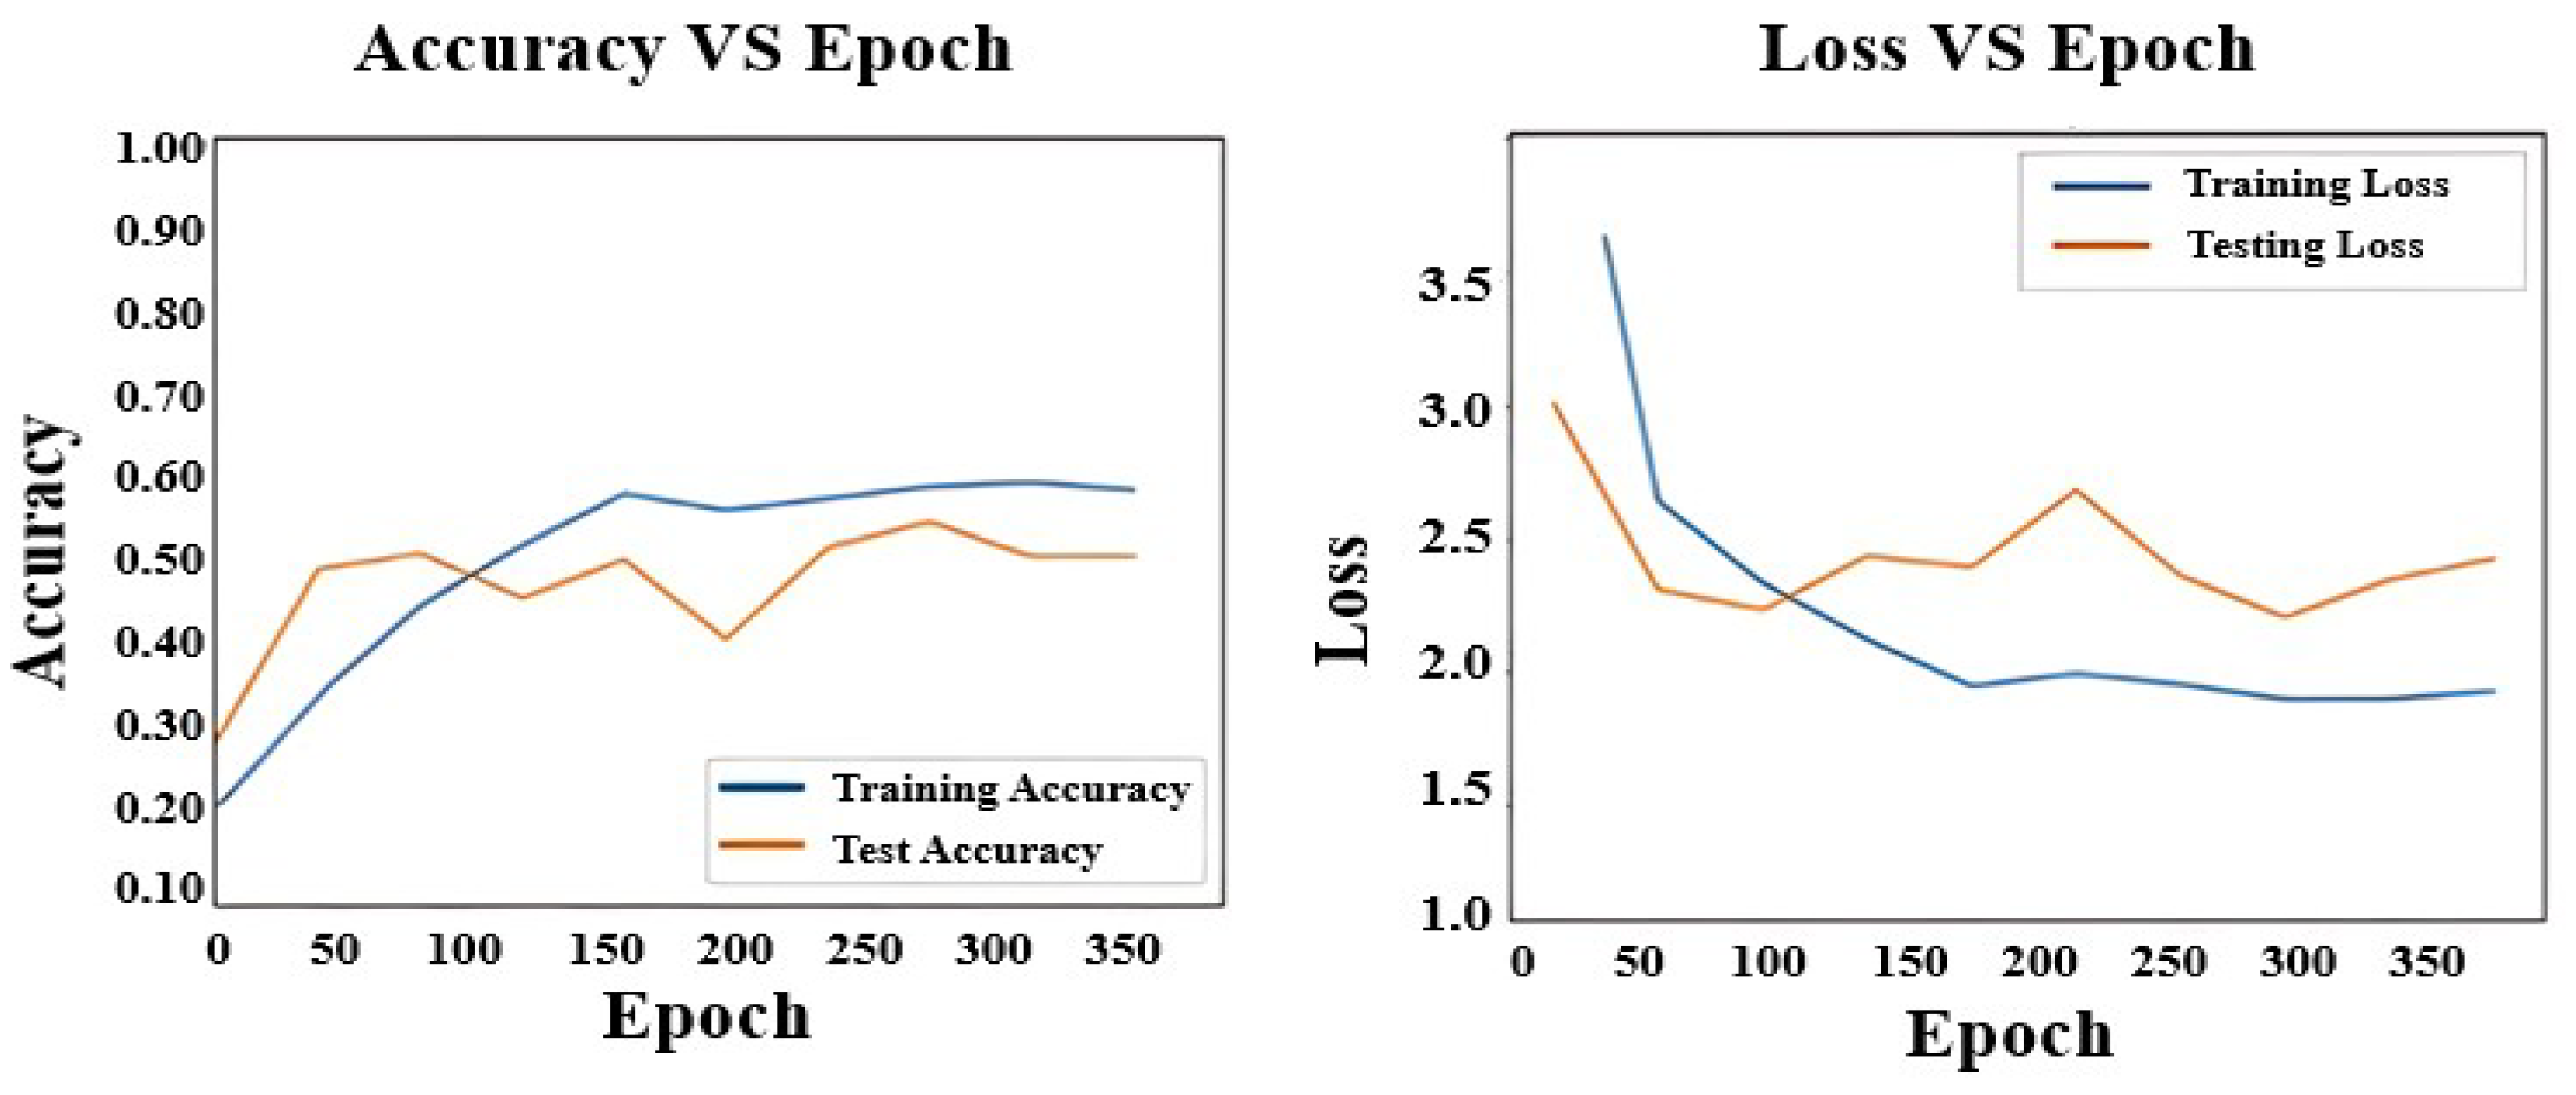
2.3.1. Convolutional 3D (C3D)

C3D is a 3-D convolutional neural network (CNN). It employs a series of 3 × 3 × 3 convolutional kernels, as well as a 2 × 2 × 2 pooling at all layers. It consists of eight convolutional layers, five pooling layers, and two fully connected (FC) layers. At the top, there is an output layer with softmax activation. This architecture has been extensively used as a feature extraction mechanism in videos as it is capable of representing the temporal aspects very well. Figure 1 shows the basic layout of the C3D deep learning architecture.
Tran et al. [34] contrasted the t-SNE-based spatio-temporal feature discrimination of activity classes on the UCF 101 dataset using the ImageNet model and the C3D model. The latter had clear class discrimination in the form of activity instance clusters.

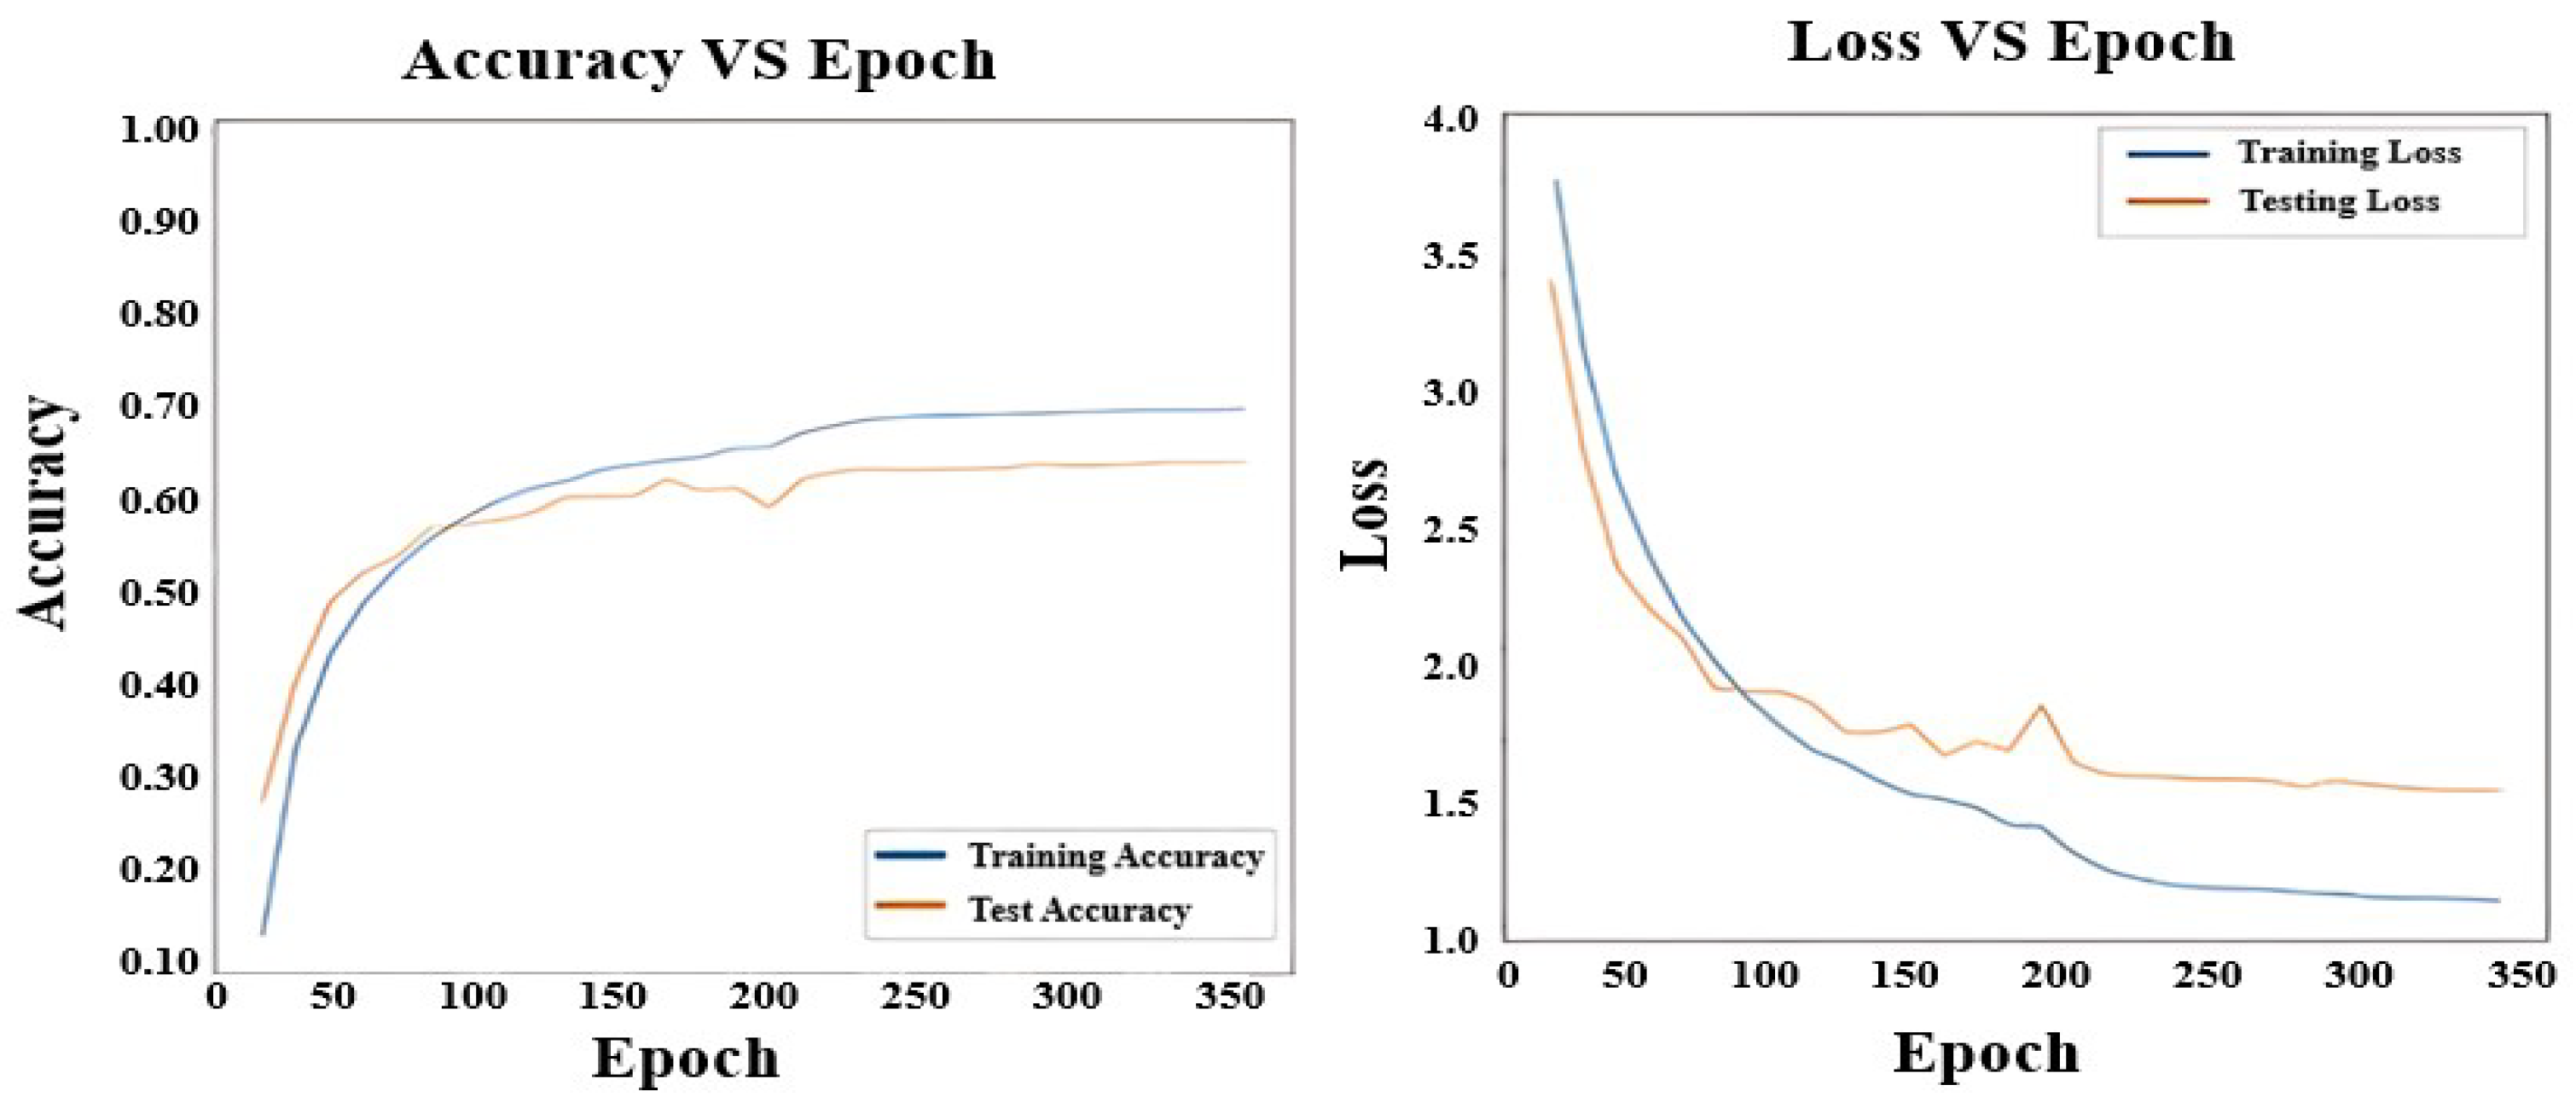
2.3.2. Recurrent Neural Network (RNN)

RNN allows the network to acquire long-term dependencies in a sequence, which implies it can take the complete context into account when creating a prediction. An RNN is a layer made of memory cells. The benefit of using a recurrent neural network for sequence learning is that it preserves a memory of the complete sequence, blocking prior information from being forgotten. In the simplest form, there are three layers: an input, an intermediate (hidden), and an output. In this case, the first layer (input layer) accepts the input and the hidden layer activations are subsequently applied in order to eventually obtain the output. Figure 2 shows the basic RNN block.
It takes X 0 from the series of inputs first, then outputs H 0 , which, along with X 1 , is the next step’s input. The inputs for the following step are H 0 and X 1 at that point. Also, the input with X 2 for the next step is H 1 from the following, and so on. In this vein, while training, it is important to learn the individual case. The equation for the present status is given in Equation (1),
H t = f H t 1 , X t
Further, it is transformed with the help of an activation function, which is tanh in the present case, as given in Equation (2),
H t = t a n h W h h H t 1 + W x h X t
The final output Y t , is given by the following Equation (3),
Y t = W h y H t

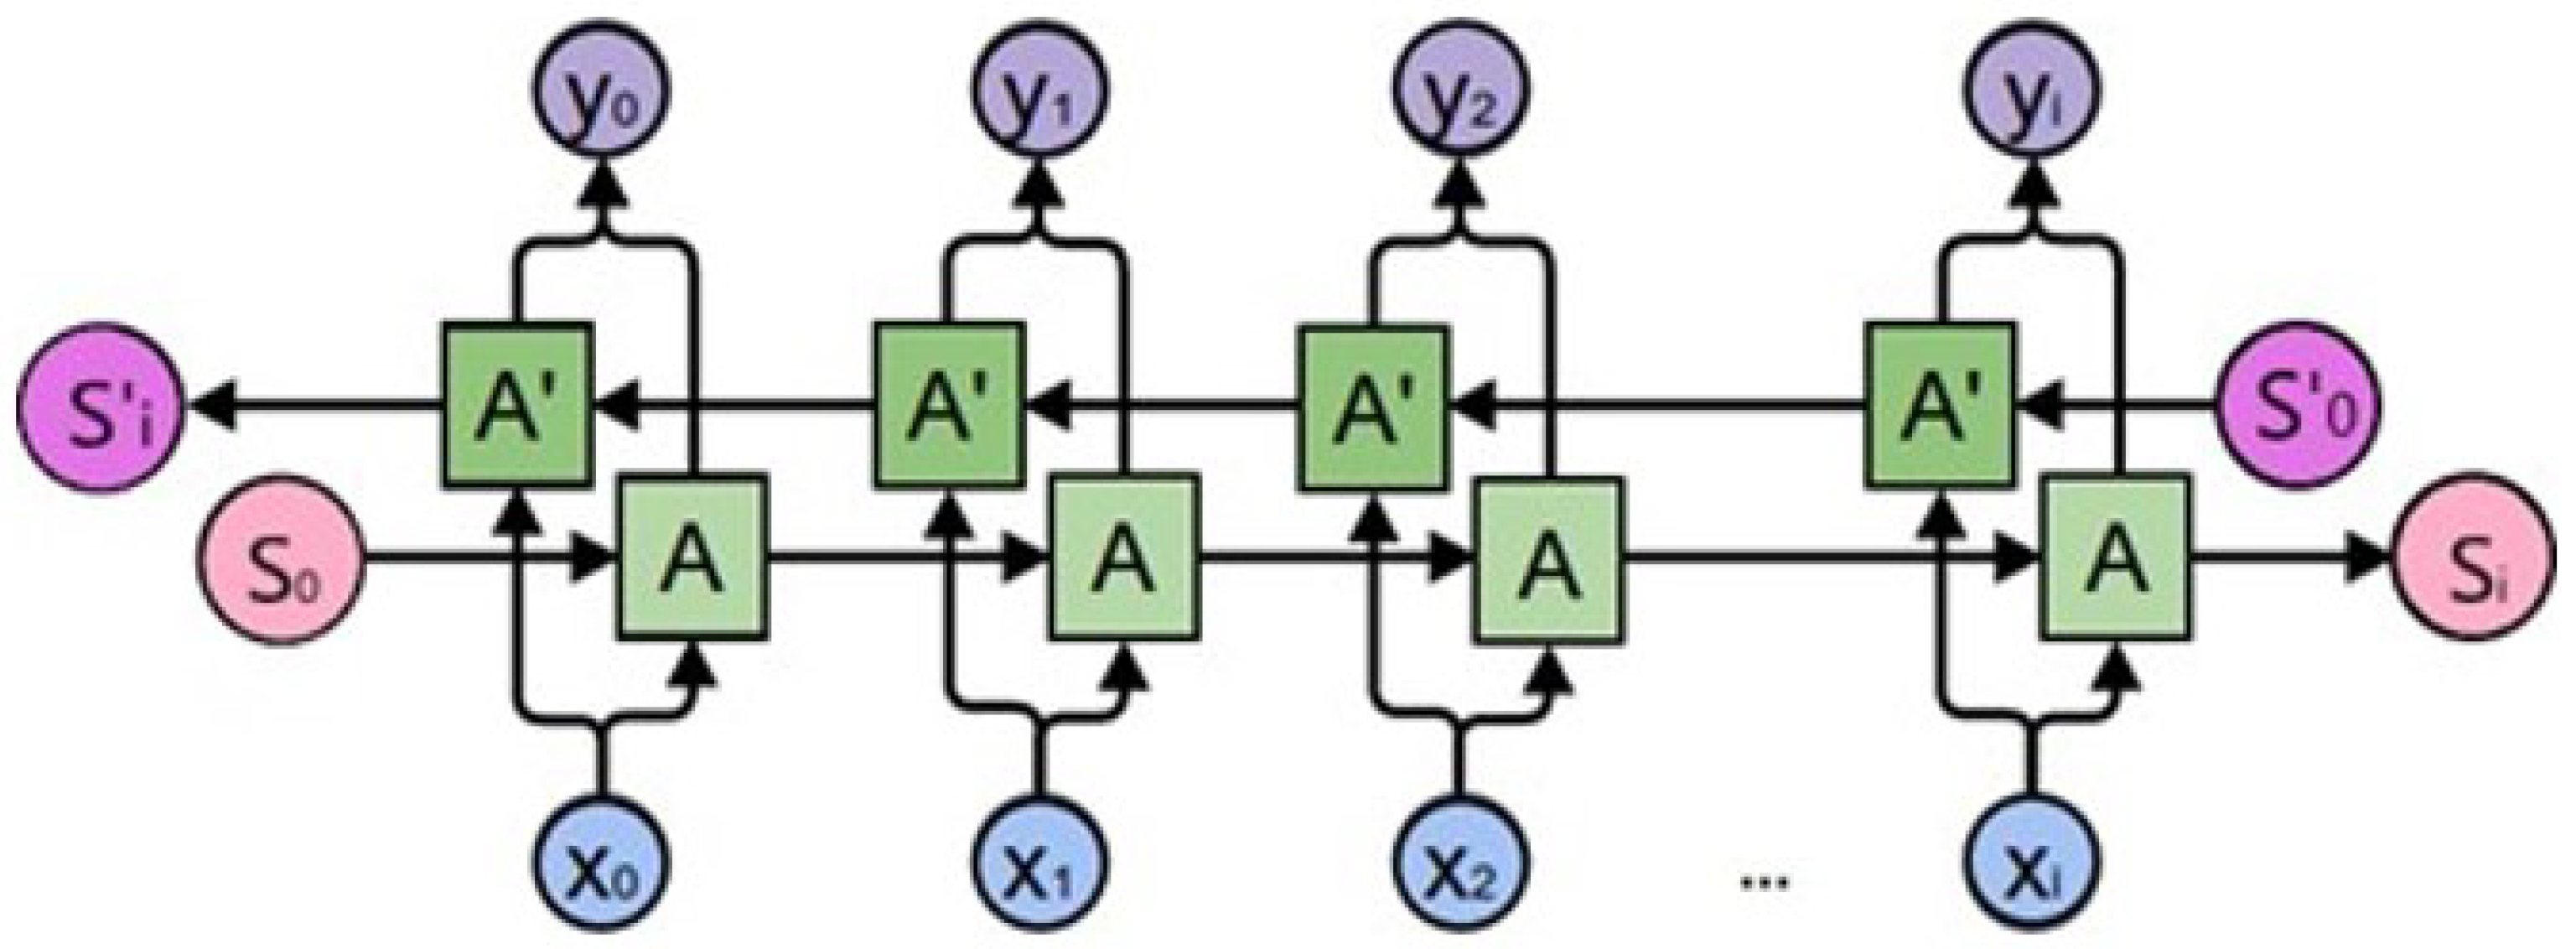
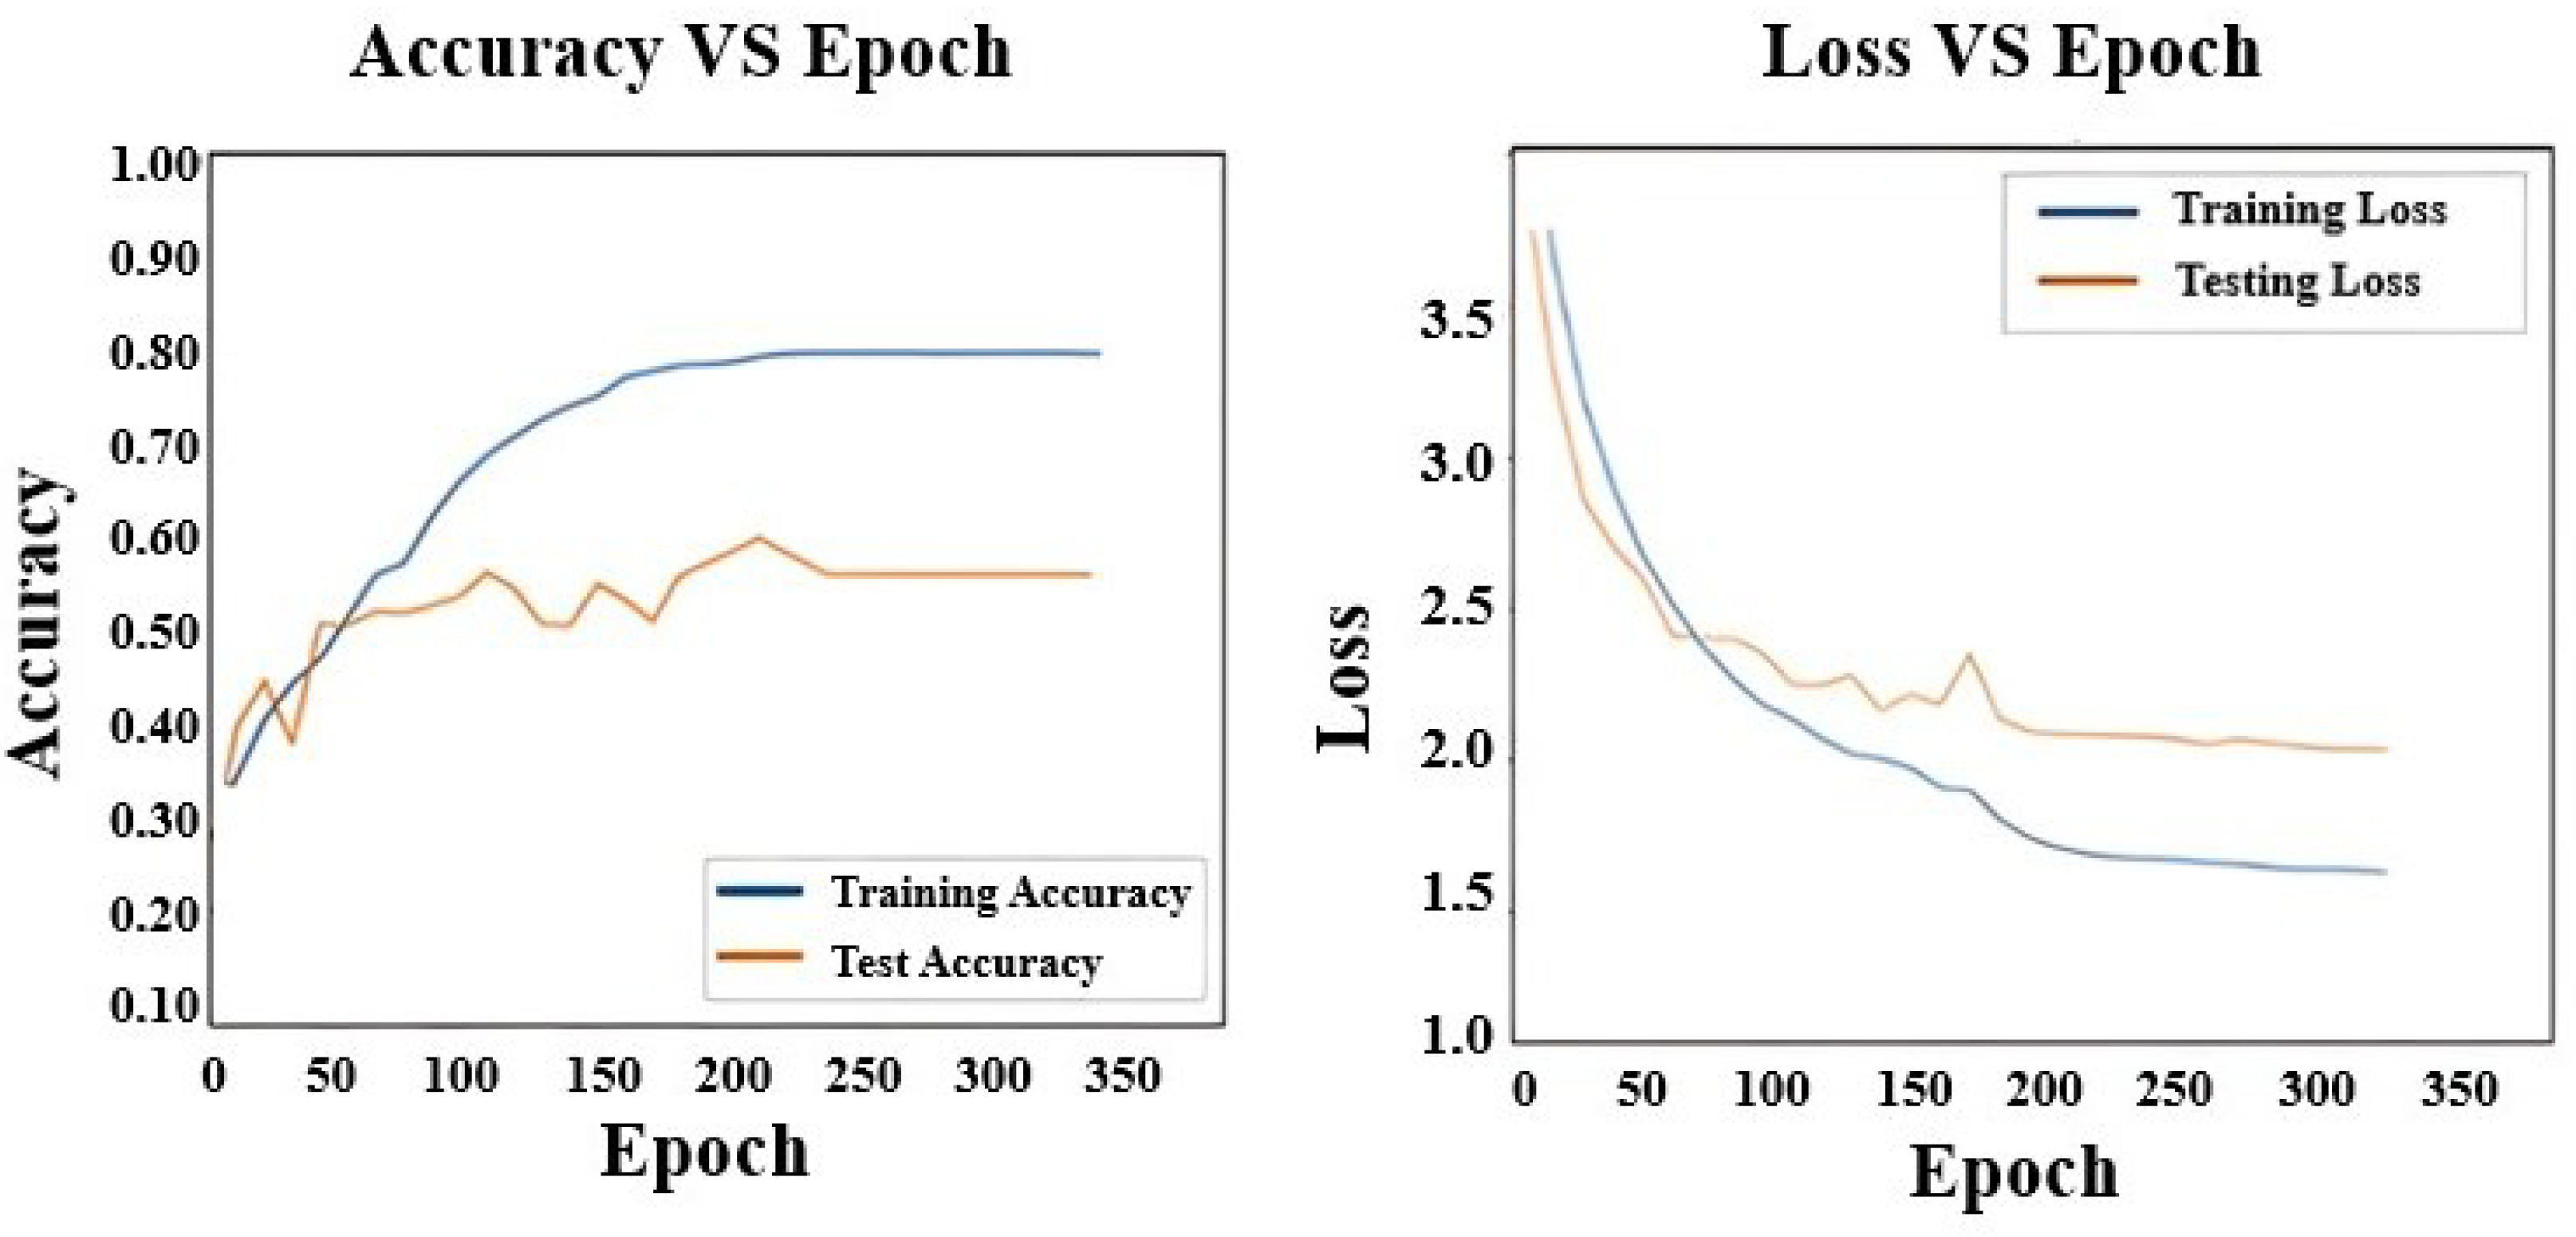
2.3.3. Bidirectional LSTM (Bi-LSTM)

The current output of a bidirectional LSTM is not only recognized with prior data, but also with subsequent data. The output of a Bi-LSTM is characterized by the combined output of two LSTM cells [35,36]. This structure enables the networks to keep track of the sequence of data in both directions (i.e., backward and forward) at all time steps. It enables the processing of data in both directions and learns from it. This architecture is advantageous over the unidirectional model in that the two hidden states can store and process data from both the past and the future at any given point in time. A typical Bi-LSTM architecture is shown in Figure 3. It adds a hidden layer that sends information backwards in order to process such data more flexibly.
The Bi-LSTM is linked to a fully connected hidden layer, which is then connected to a three-neuron softmax output layer. A dropout is used to prevent overfitting between the Bi-LSTM layer and the hidden layer, as well as between the hidden layer and the output layer.

3. Proposed System and Methodology

The following sections describe the methodology used for training and testing the deep learning model for abnormal activity recognition in videos.

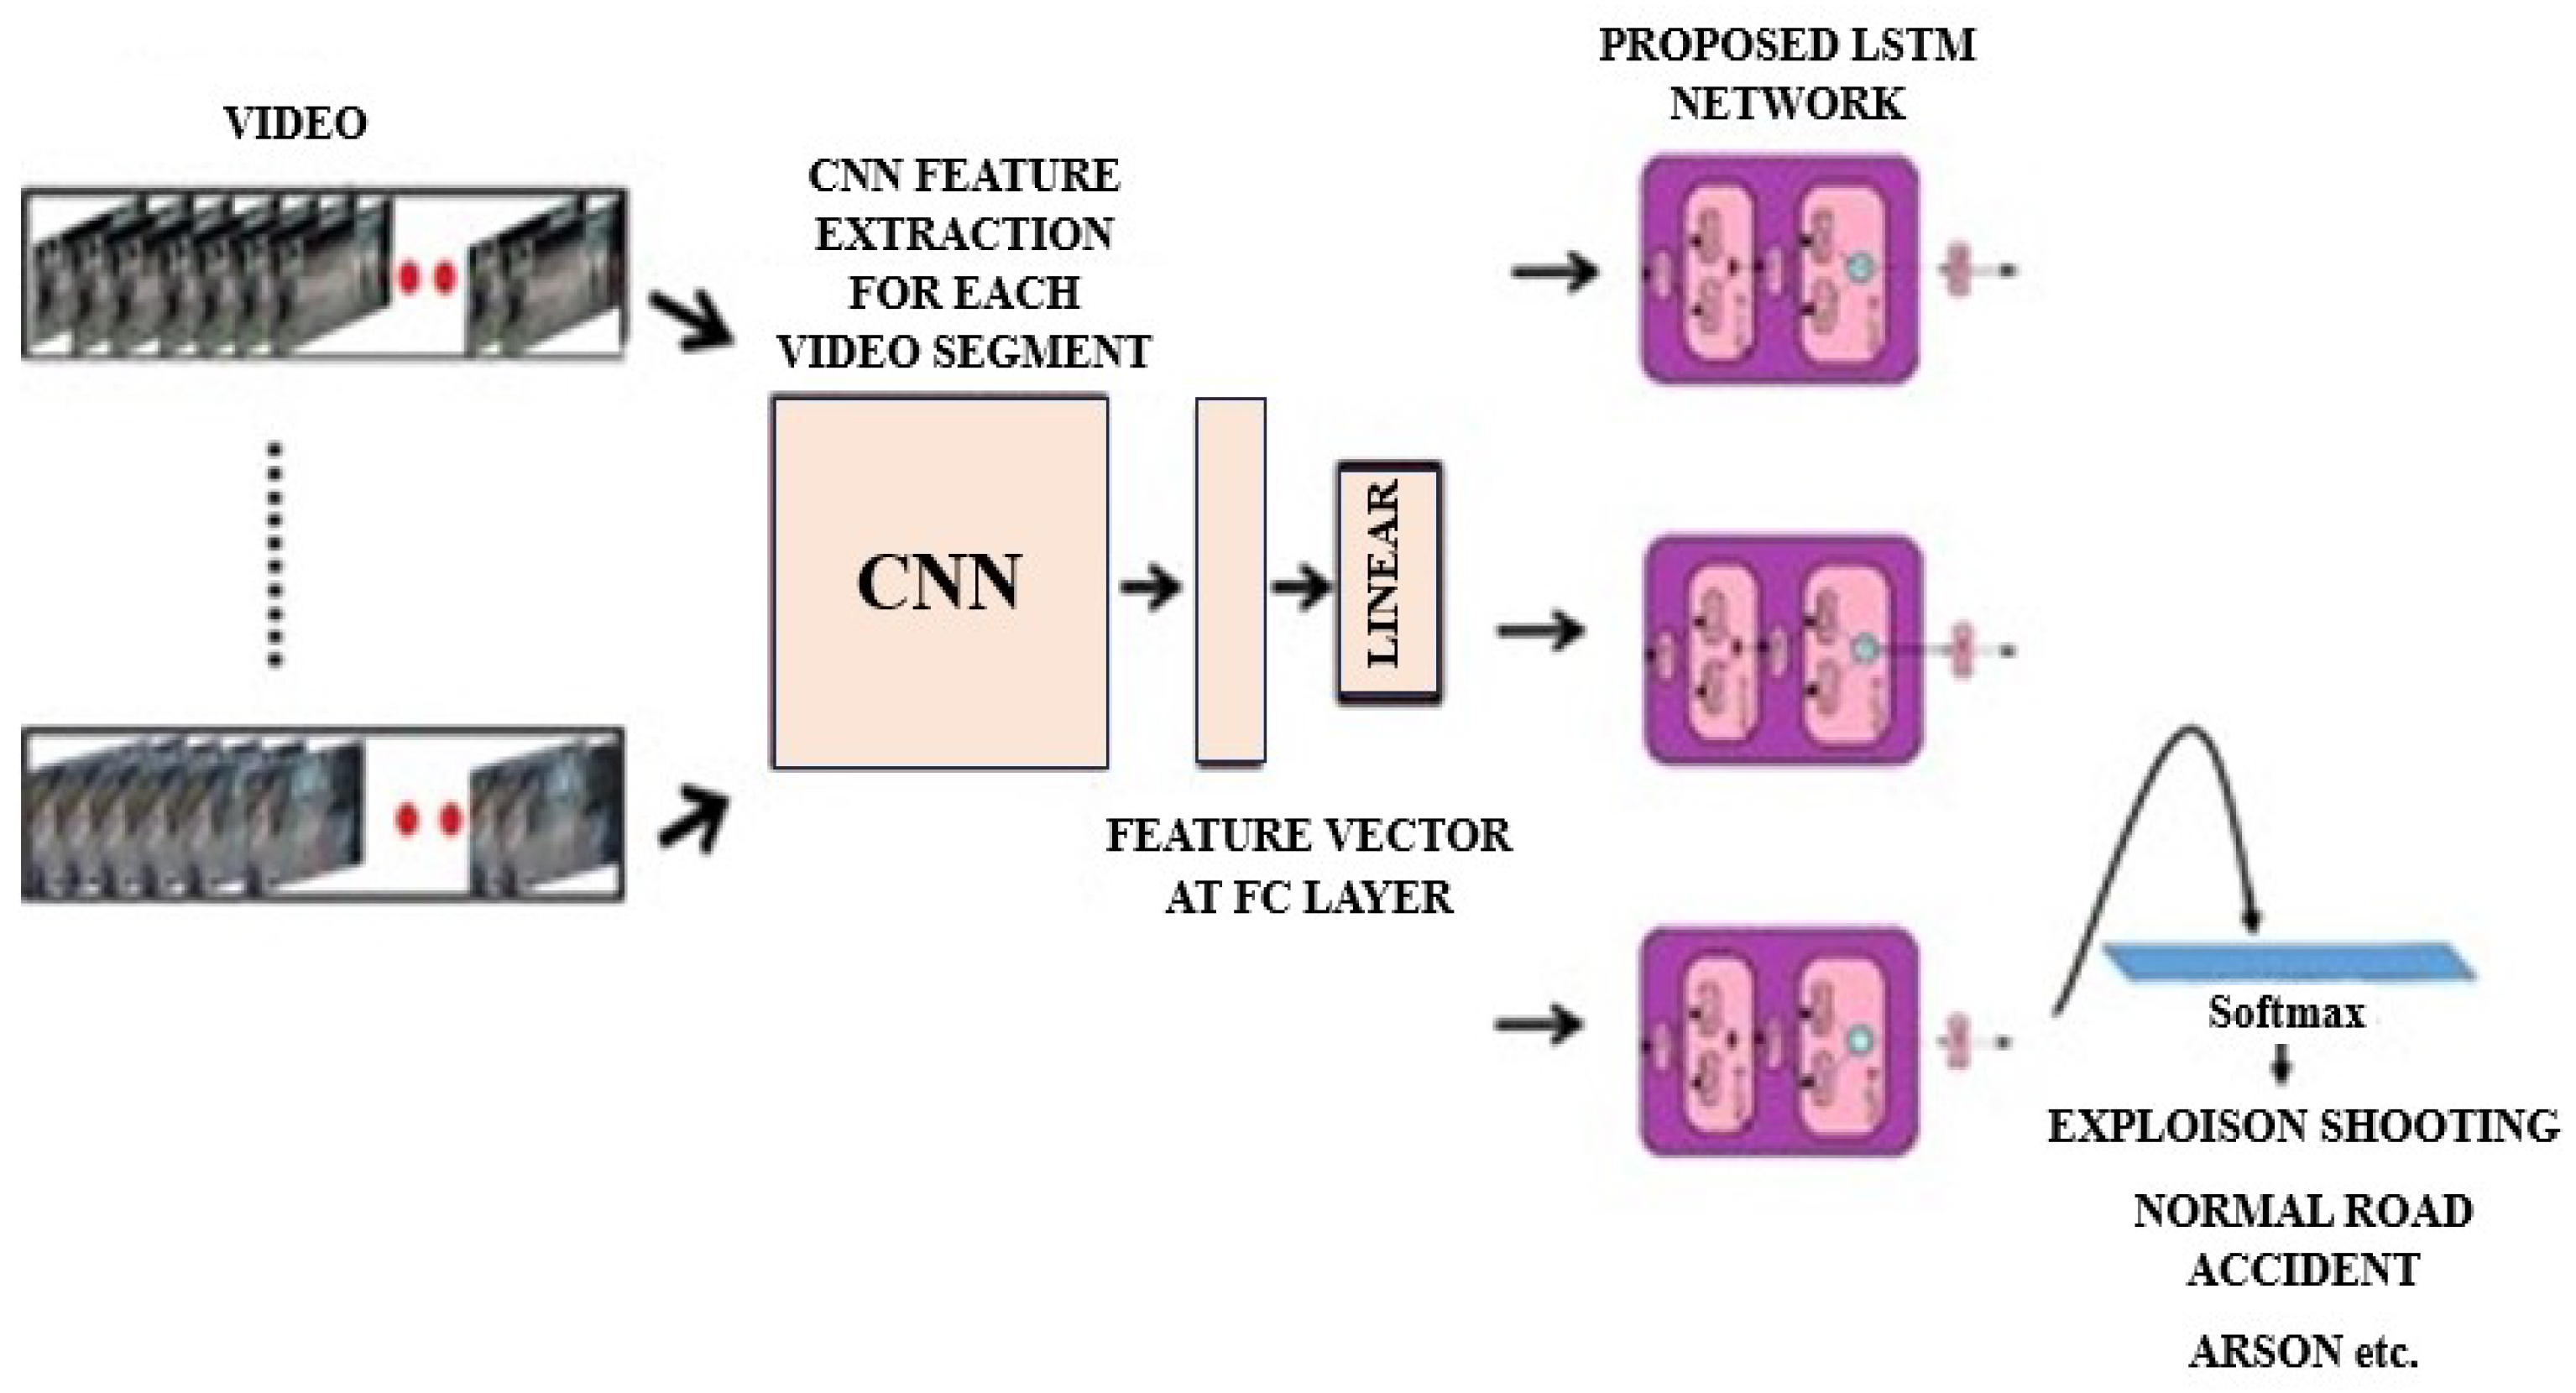
3.1. Proposed Deep Learning Architecture and Methodology for Anomaly Detection

Figure 4 depicts the data flow diagram of the proposed approach. For feature extraction, we use a CNN, which is followed by a Bi-LSTM network for sequence learning. The CNN model is used to extract features from the input frames and is similar to Inception architecture as shown in Figure 5. When the frames have specific deviations from the abnormalities or items, this structure is used to extract spatial information that are important. The optional addition of further layers may not significantly improve performance while increasing computational complexity. The extracted features are then converted into sequences of extracted features. Each footage was incorporated into a 40-frame sequence. So, we merge the sampled 40 frames together, save it to a disc, and now we can train a model without having to send the input image data through the CNN model each time.
The CNN uses all of the small variations in each frame to identify hidden patterns in photographs. The RNN, for activity recognition in a video, learns these variances in the sequential fashion.
Since some base layers would be too difficult to even consider optimizing when using backpropagation, the proposed model helps solve the problem of gradient vanishing. Figure 6 shows a network with an architecture that is equivalent to four LSTM cells in total. ReLU is the activation function that is used within the organization. It approaches more information ahead of time due to backward passes at a given time step. We choose modules and connect them in order to create a network that serves our needs. The Activity Detection contribution should be a time series, and the LSTM’s fundamental structure ensures that it can maintain temporal dimension features.
With enough regularization, a huge network can be completely optimized for a problem, such as L2 weight decay and dropout. Testing has no effect on training. The neural network’s predictions are coupled to real-world variables. During learning, the F1 score for activities is determined. Throughout the training cycle, the training dataset should be randomized. Each new window for a new prediction causes the neural network’s state to be reset.
For validation, 25% of the information is isolated from the dataset, and the categorical crossentropy is utilized for error computation of the validation data. If C is the number of classes, then the categorical crossentropy H ( y , p ) can be calculated as per Equation (4),
H ( y , p ) = i = 1 c y i · l o g ( p i )
where y i is the true probability of class i, and p i is the predicted probability of class i. For multiple examples involving multiple batches, the cross entropy can be calculated as per the formula given in Equation (5),
H ( y , p ) = 1 N j = 1 N i = 1 C y i j · l o g ( p i j )
where N is the number of samples in a batch, and C is the total number of classes. y i j is the true probability of class i for sample j, and p i j is the predicted probability of class i for sample j.
For cost minimization, Adam optimization with a learning rate of 1 × 10 5 is employed. Batch normalization can be useful in training as well. The basic idea behind batch normalization is that layers are standardized by mean and variance, with the goal of having a mean of zero and a standard deviation of one throughout the batch. The result is then directly standardized and balanced. The scaling multiplier and offset parameter are used to rescale contributions to 0 and the value is set to 1.

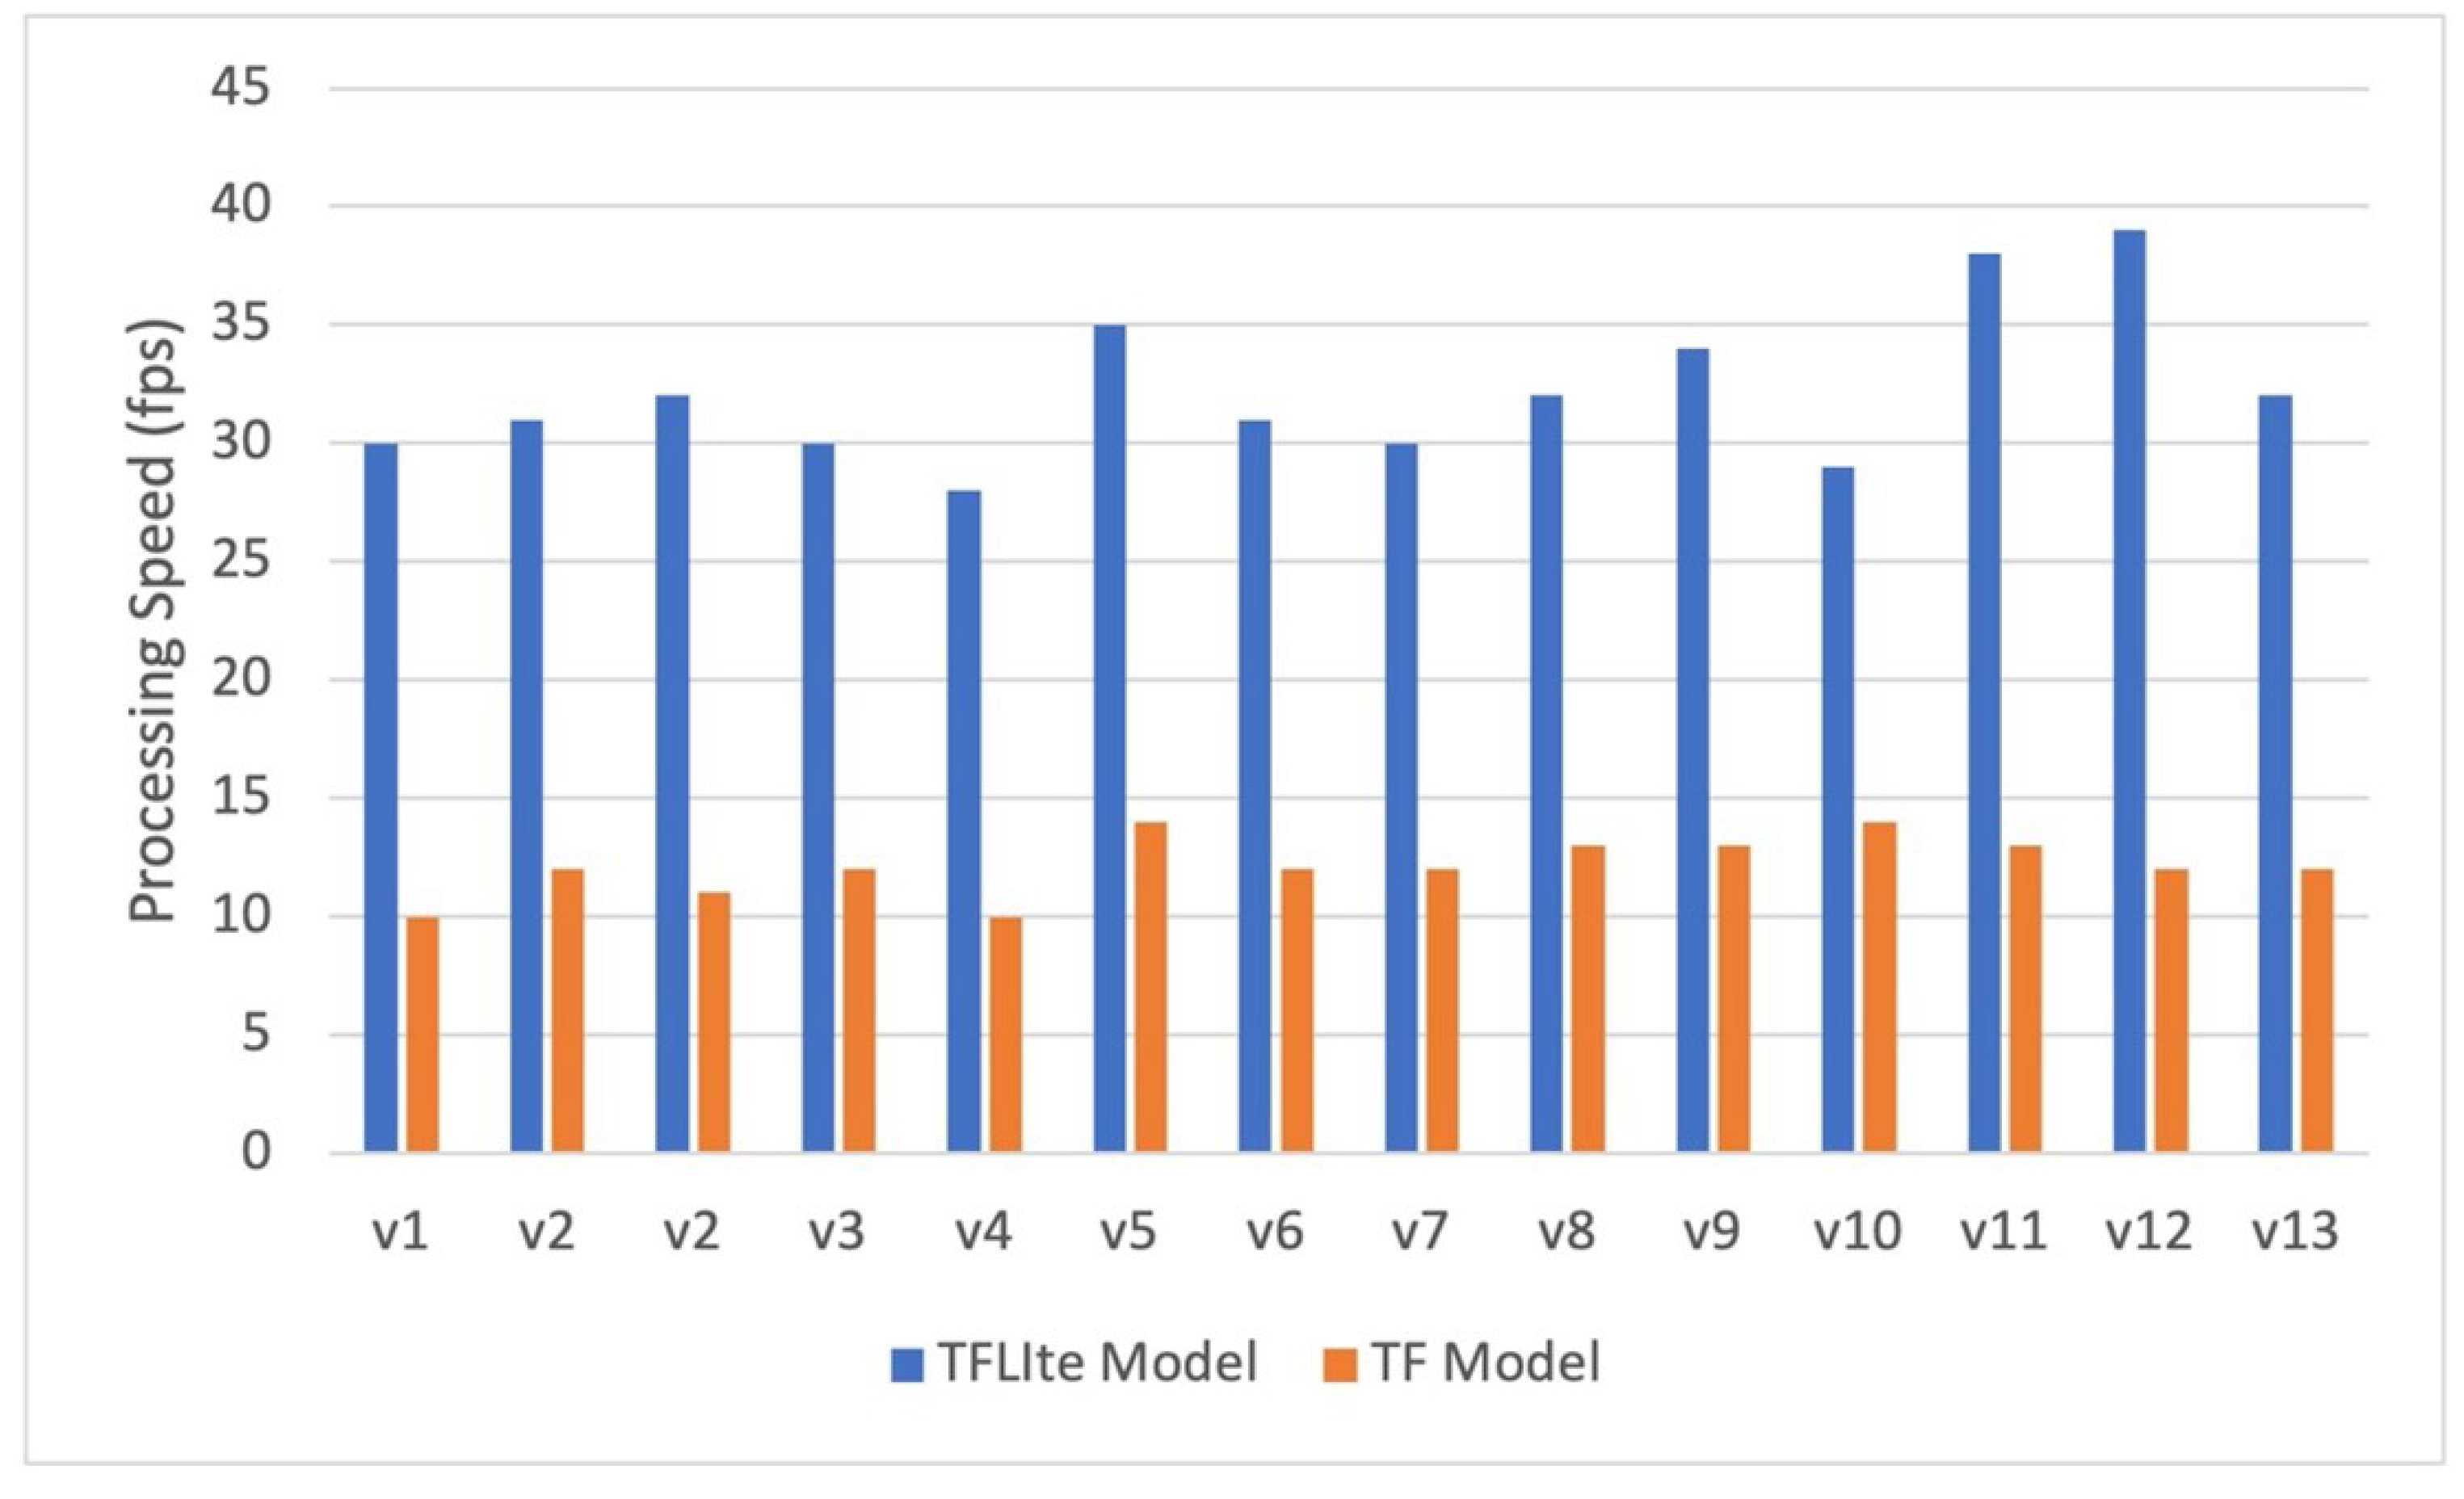
3.2. Edge Deployment of the Model

In order to reduce the size of the trained model, a post-training quantization is applied on the model, For this purpose, the tensorflow lite (TFlite) library is used. Quantization reduces the precision of the weights and activations of the model. Instead of using 32-bit floating-point precision (float32), quantization converts the model to use lower bit-width integers (8-bit integers). It results in a reduction in the memory and computational requirements of the model, making it more efficient for deployment on devices with limited resources. A 75% reduction in model size is achieved in this way.
Furthermore, the model is deployed on multiple edge nodes (using Raspberry Pi). The layered architecture of the proposed edge computing-based framework has been shown in Figure 7. There are three layers in the architecture. There is an edge sensor layer, or the physical layer at the bottom, that has Raspberry Pi 4 nodes with a camera, a power source, and other components to capture the video stream. It is then passed to the video analytics layer, where deep learning models analyze the data for necessary anomaly labeling. This layer is followed by the user (or consumer) layer, where various services may be subscribed to by the user based on their preference.

4. Experimental Results

4.1. Experimental Setup

Experiments were conducted on a PC with a Ryzen 7 quad-core processor, an Nvidia GPU, 16 GB of RAM, and Ubuntu 20.04 installed. The software stack consists of scikit-learn and Keras with the TensorFlow backend, and all of the applications were written in Python. The networks were trained for 500 epochs, and the Adam optimizer was utilized for optimization. The entire program took about 6–7 h to finish. On the UCF-Crime Dataset, the approach was tested.

4.2. Description of the Datasets Used

The dataset used for the experimentation contains a subset of videos from a publicly available UCF-crime dataset [37], including CCTV footage videos from YouTube and other sources. The dataset (Table 2) includes large, uncut surveillance videos containing 13 genuine anomalies such as abuse, arrest, assault, accident, burglary, and so on. These anomalies were chosen because they have a significant impact on public security. There is 950 unedited genuine surveillance footage with clear abnormalities available, as well as 950 regular videos. Our dataset is divided into two parts: the training set, which contains 700 normal and 710 anomalous videos, and the testing set, which contains the remaining 250 normal and 240 anomalous videos. In the films, both the training and testing sets remember each of the 13 anomalies in separate temporal locations. Every one of the 13 anomalies in the recordings is present in both the training and testing sets. A section of the recordings also contains various oddities.

4.3. Results

The proposed technique is tried on 25% of the recordings in each dataset. A portion of the right and misclassified visual results are in Figure 8. Our strategy accepts a test video as input and extracts features. The extracted features are taken care of for the proposed model in the segment for time stretch T. The model returns the yield for each segment. Lastly, the video is grouped into the highest recurrence class in output.
In Figure 9, lines 3 and 7 are misclassified, where “accident” is delegated to “abuse” and “assault” is named “burglary”. These off-base expectations are because of the identity of visible content and the movement of the camera. The proposed technique is assessed on the GEFORCE GTX 1660 Ti Max Q GPU for feature extraction, training, and testing.
Table 3 shows the different accuracy measures for the proposed method. It includes precision, recall, and F1 Score, which were calculated for true and predicted values, respectively.

4.4. Comparative Performance Analysis and Discussion

Here, the comparative analysis with three other state-of-the-art, popular video classification techniques has been given. For comparison, RNN, LSTM, and Bi-LSTM architectures have been used. Table 4 provides the classification accuracy of these methods along with the proposed method.
Figure 10 shows the loss and accuracy curves for the C3D model architecture. Similarly, Figure 11, Figure 12 and Figure 13 display the loss and accuracy curves for Bi-LSTM, RNN, and the proposed model. It is evident from the loss and accuracy curves that the proposed method outperforms other methods.
The quantized (TFLite Model) and non-quantized (TF Model) versions of the deep learning model were tested on a non-GPU Raspberry Pi 4 B edge device. The parameters of accuracy, energy consumption efficiency, and processing speed were evaluated. For testing purposes, video recordings with a frame size of 640 × 480 × 3 were used. To analyze the performance of quantized and non-quantized models, both models were run on the Raspberry Pi node for a test sample comprising 13 videos (v1–v13). The accuracy of the quantized model was recorded as 79.90%, and the non-quantized model achieved an accuracy of 80.10% with an error margin of just 0.20%.
Furthermore, the comparison of processing speeds of quantized and non-quantized models is shown in Figure 14. The average processing speed (in fps) for the quantized model is 32.21, making the model ideal for real-time processing. On the other hand, the average speed of the non-quantized model was 12.14 fps. To calculate the energy efficiency of both models on edge nodes, the energy consumption metric fps/watt, as described in [38], was used. Figure 15 provides a comparison of the energy efficiency of quantized and non-quantized models. The quantized model has an average energy efficiency of 3.88 fps/watt, while the non-quantized model has an energy efficiency rate of 1.40 fps/watt. The quantized model is 2.77 times more efficient compared to the non-quantized model.

4.5. Limitations of the Current Work and Future Scope

The present work describes a method for training a deep learning model to detect and classify abnormal activities from video footage. Although the experimental results show satisfactory performance, the classification accuracy of the proposed technique is also considered. However, the model has been trained and tested on limited data and only uses 13 classes. The moderate size of data and classes was chosen in order to deploy the trained model on resource-constrained edge devices. A basic quantization technique was used for model compression. The work may open directions for further exploration and investigation by other researchers. More data, alternate model architectures, model compression methods, and edge computing architectures can further advance this work.

5. Conclusions

Visual surveillance is an important application area in the field of computer vision. With the widespread presence of CCTV cameras, there is a need to automate the task of taking proactive steps against anomalous incidences. Nonetheless, there are some challenges in processing the video data collected by multiple cameras at a central location, such as bandwidth, latency, high computation resource requirements, etc. In order to overcome this issue, an edge-based visual surveillance system has been proposed wherein the video analytics to spot anomalous incidences in the video stream is performed on the edge nodes. Different deep learning models were trained to recognize 13 abnormal types of incidence in video. A custom Bi-LSTM model performs better than other state-of-the-art methods. This model is deployed on the edge nodes to process the video locally. Analytics reports and notifications can be sent to the user. Experimental results show that the proposed system is suitable for visual surveillance with improved accuracy and reduced cost and computational resources.

Author Contributions

Conceptualization, L.G., S.K. and C.M.S.; methodology, L.G., S.K. and C.M.S.; software, M.A., L.G. and C.M.S.; validation, M.A., S.K., L.G. and C.M.S.; formal analysis, M.A., S.K. and L.G.; investigation, M.A., L.G., C.M.S. and S.K.; resources, M.A., S.K. and L.G.; data curation, M.A., S.K. and L.G.; writing—original draft preparation, L.G., S.K. and C.M.S.; writing—review and editing, M.A., L.G. and C.M.S.; visualization, M.A., L.G., S.K. and C.M.S.; supervision, L.G., S.K. and C.M.S.; project administration, M.A.; funding acquisition, M.A. All authors have read and agreed to the published version of the manuscript.

Funding

This work was supported by the Deanship of Scientific Research, the Vice Presidency for Graduate Studies and Scientific Research, King Faisal University, Saudi Arabia (Grant No. 5403).

Data Availability Statement

Data is contained within the article.

Conflicts of Interest

Author Lakshay Goyal was employed by Data Engineering Unit, Veritas Technologies, Pune, India. The remaining author declares that the research was conducted in the absence of any commercial or financial relationships that could be construed as a potential conflict of interest.

References

  1. Sharma, L.; Lohan, N. Performance analysis of moving object detection using BGS techniques in visual surveillance. Int. J. Spatio-Temporal Data Sci. 2019, 1, 22–53. [Google Scholar] [CrossRef]
  2. Tripathi, R.K.; Jalal, A.S.; Agrawal, S.C. Abandoned or removed object detection from visual surveillance: A review. Multimed. Tools Appl. 2019, 78, 7585–7620. [Google Scholar] [CrossRef]
  3. Gawande, U.; Hajari, K.; Golhar, Y. Pedestrian detection and tracking in video surveillance system: Issues, comprehensive review, and challenges. In Recent Trends in Computational Intelligence; Intechopen: London, UK, 2020; pp. 1–24. [Google Scholar]
  4. Gundogdu, E.; Parıldı, E.S.; Solmaz, B.; Yücesoy, V.; Koç, A. Deep learning-based fine-grained car make/model classification for visual surveillance. In Proceedings of the Counterterrorism, Crime Fighting, Forensics, and Surveillance Technologies, Warsaw, Poland, 11–12 September 2017; SPIE: Bellingham, WA, USA, 2017; Volume 10441, pp. 179–184. [Google Scholar]
  5. Zitouni, M.S.; Sluzek, A.; Bhaskar, H. Towards understanding socio-cognitive behaviors of crowds from visual surveillance data. Multimed. Tools Appl. 2020, 79, 1781–1799. [Google Scholar] [CrossRef]
  6. Santhosh, K.K.; Dogra, D.P.; Roy, P.P. Anomaly detection in road traffic using visual surveillance: A survey. ACM Comput. Surv. (CSUR) 2020, 53, 1–26. [Google Scholar] [CrossRef]
  7. Ansari, M.A.; Singh, D.K. An expert video surveillance system to identify and mitigate shoplifting in megastores. Multimed. Tools Appl. 2022, 81, 22497–22525. [Google Scholar] [CrossRef]
  8. Wu, Z.; Yao, T.; Fu, Y.; Jiang, Y.G. Deep learning for video classification and captioning. In Frontiers of Multimedia Research; ACM: New York, NY, USA, 2017; pp. 3–29. [Google Scholar]
  9. Mliki, H.; Bouhlel, F.; Hammami, M. Human activity recognition from UAV-captured video sequences. Pattern Recognit. 2020, 100, 107140. [Google Scholar] [CrossRef]
  10. Sunil, A.; Sheth, M.H.; Shreyas, E. Usual and unusual human activity recognition in video using deep learning and artificial intelligence for security applications. In Proceedings of the 2021 Fourth International Conference on Electrical, Computer and Communication Technologies (ICECCT), Erode, India, 15–17 September 2021; IEEE: Piscataway Township, NJ, USA, 2021; pp. 1–6. [Google Scholar]
  11. Wassim, A. Abnormal Activity Detection In Crowded Scenes Using Video Surveillance. In Proceedings of the Cyber-Physical Systems and Control, Sydney, Australia, 21–25 April 2020; pp. 106–118. [Google Scholar]
  12. Nawaratne, R.; Alahakoon, D.; De Silva, D.; Yu, X. Spatiotemporal anomaly detection using deep learning for real-time video surveillance. IEEE Trans. Ind. Inform. 2019, 16, 393–402. [Google Scholar] [CrossRef]
  13. Zhou, J.T.; Du, J.; Zhu, H.; Peng, X.; Liu, Y.; Goh, R.S.M. Anomalynet: An anomaly detection network for video surveillance. IEEE Trans. Inf. Forensics Secur. 2019, 14, 2537–2550. [Google Scholar] [CrossRef]
  14. Rodrigues, R.; Bhargava, N.; Velmurugan, R.; Chaudhuri, S. Multi-timescale trajectory prediction for abnormal human activity detection. In Proceedings of the IEEE/CVF Winter Conference on Applications of Computer Vision, Snowmass Village, CO, USA, 1–5 March 2020; pp. 2626–2634. [Google Scholar]
  15. Fan, Z.; Yin, J.; Song, Y.; Liu, Z. Real-time and accurate abnormal behavior detection in videos. Mach. Vis. Appl. 2020, 31, 72. [Google Scholar] [CrossRef]
  16. Ullah, W.; Ullah, A.; Haq, I.U.; Muhammad, K.; Sajjad, M.; Baik, S.W. CNN features with bi-directional LSTM for real-time anomaly detection in surveillance networks. Multimed. Tools Appl. 2021, 80, 16979–16995. [Google Scholar] [CrossRef]
  17. Singh, T.; Vishwakarma, D.K. A deeply coupled ConvNet for human activity recognition using dynamic and RGB images. Neural Comput. Appl. 2021, 33, 469–485. [Google Scholar] [CrossRef]
  18. Shreyas, D.; Raksha, S.; Prasad, B. Implementation of an anomalous human activity recognition system. SN Comput. Sci. 2020, 1, 168. [Google Scholar] [CrossRef]
  19. Beddiar, D.R.; Nini, B.; Sabokrou, M.; Hadid, A. Vision-based human activity recognition: A survey. Multimed. Tools Appl. 2020, 79, 30509–30555. [Google Scholar] [CrossRef]
  20. Pareek, P.; Thakkar, A. A survey on video-based human action recognition: Recent updates, datasets, challenges, and applications. Artif. Intell. Rev. 2021, 54, 2259–2322. [Google Scholar] [CrossRef]
  21. Kumar, S.; Kumar, S.; Raman, B.; Sukavanam, N. Human action recognition in a wide and complex environment. In Proceedings of the Real-Time Image and Video Processing 2011, San Francisco, CA, USA, 1 January 2011; SPIE: Bellingham, WA, USA, 2011; Volume 7871, pp. 176–187. [Google Scholar]
  22. Kumar, S.; Kumar, S.; Sukavanam, N.; Raman, B. Human visual system and segment-based disparity estimation. AEU-Int. J. Electron. Commun. 2013, 67, 372–381. [Google Scholar] [CrossRef]
  23. Kumar, S.; Kumar, S.; Sukavanam, N.; Raman, B. Dual tree fractional quaternion wavelet transform for disparity estimation. ISA Trans. 2014, 53, 547–559. [Google Scholar] [CrossRef]
  24. Cob-Parro, A.C.; Losada-Gutiérrez, C.; Marrón-Romera, M.; Gardel-Vicente, A.; Bravo-Muñoz, I. Smart video surveillance system based on edge computing. Sensors 2021, 21, 2958. [Google Scholar] [CrossRef]
  25. Zhang, J.; Xu, C.; Gao, Z.; Rodrigues, J.J.; de Albuquerque, V.H.C. Industrial pervasive edge computing-based intelligence IoT for surveillance saliency detection. IEEE Trans. Ind. Inform. 2020, 17, 5012–5020. [Google Scholar] [CrossRef]
  26. Rajavel, R.; Ravichandran, S.K.; Harimoorthy, K.; Nagappan, P.; Gobichettipalayam, K.R. IoT-based smart healthcare video surveillance system using edge computing. J. Ambient. Intell. Humaniz. Comput. 2022, 13, 3195–3207. [Google Scholar] [CrossRef]
  27. Ahmed, I.; Ahmad, M.; Rodrigues, J.J.; Jeon, G. Edge computing-based person detection system for top view surveillance: Using CenterNet with transfer learning. Appl. Soft Comput. 2021, 107, 107489. [Google Scholar] [CrossRef]
  28. Yang, B.; Cao, X.; Yuen, C.; Qian, L. Offloading optimization in edge computing for deep-learning-enabled target tracking by internet of UAVs. IEEE Internet Things J. 2020, 8, 9878–9893. [Google Scholar] [CrossRef]
  29. Kumar, P.P.; Pal, A.; Kant, K. Resource efficient edge computing infrastructure for video surveillance. IEEE Trans. Sustain. Comput. 2021, 7, 774–785. [Google Scholar] [CrossRef]
  30. Ananthanarayanan, G.; Bahl, P.; Bodík, P.; Chintalapudi, K.; Philipose, M.; Ravindranath, L.; Sinha, S. Real-time video analytics: The killer app for edge computing. Computer 2017, 50, 58–67. [Google Scholar] [CrossRef]
  31. Hussain, T.; Muhammad, K.; Ullah, A.; Del Ser, J.; Gandomi, A.H.; Sajjad, M.; Baik, S.W.; de Albuquerque, V.H.C. Multiview summarization and activity recognition meet edge computing in IoT environments. IEEE Internet Things J. 2020, 8, 9634–9644. [Google Scholar] [CrossRef]
  32. Aishwarya, D.; Minu, R. Edge computing based surveillance framework for real time activity recognition. ICT Express 2021, 7, 182–186. [Google Scholar]
  33. Subramanian, R.R.; Vasudevan, V. A deep genetic algorithm for human activity recognition leveraging fog computing frameworks. J. Vis. Commun. Image Represent. 2021, 77, 103132. [Google Scholar] [CrossRef]
  34. Tran, D.; Bourdev, L.; Fergus, R.; Torresani, L.; Paluri, M. Learning spatiotemporal features with 3d convolutional networks. In Proceedings of the IEEE International Conference on Computer Vision, Santiago, Chile, 7–13 December 2015; pp. 4489–4497. [Google Scholar]
  35. Sultani, W.; Chen, C.; Shah, M. Real-world anomaly detection in surveillance videos. In Proceedings of the IEEE Conference on Computer Vision and Pattern Recognition, Salt Lake City, UT, USA, 18–23 June 2018; pp. 6479–6488. [Google Scholar]
  36. Landi, F.; Snoek, C.G.; Cucchiara, R. Anomaly locality in video surveillance. arXiv 2019, arXiv:1901.10364. [Google Scholar]
  37. UCF Dataset. Real-world Anomaly Detection in Surveillance Videos. Available online: https://www.crcv.ucf.edu/projects/real-world/ (accessed on 3 October 2022).
  38. Amanatidis, P.; Iosifidis, G.; Karampatzakis, D. Comparative Evaluation of Machine Learning Inference Machines on Edge-class Devices. In Proceedings of the 25th Pan-Hellenic Conference on Informatics, Volos, Greece, 26–28 November 2021; pp. 102–106. [Google Scholar]
Figure 1. C3D deep learning architecture.
Electronics 13 00251 g001
Figure 2. RNN architecture.
Electronics 13 00251 g002
Figure 3. Bi-LSTM architecture.
Electronics 13 00251 g003
Figure 4. The flow diagram of the anomaly detection approach.
Electronics 13 00251 g004
Figure 5. Inception model architecture.
Electronics 13 00251 g005
Figure 6. The Proposed Model.
Electronics 13 00251 g006
Figure 7. Layered Edge Computing Visual Surveillance Framework.
Electronics 13 00251 g007
Figure 8. Examples of various anomalies from the training and testing.
Electronics 13 00251 g008
Figure 9. Predictions of the Proposed Model for Action Recognition for test recordings. The red text style shows wrong prediction of our strategy.
Electronics 13 00251 g009
Figure 10. Loss and Accuracy of C3D.
Electronics 13 00251 g010
Figure 11. Loss and Accuracy of Bi-LSTM.
Electronics 13 00251 g011
Figure 12. Loss and Accuracy of RNN.
Electronics 13 00251 g012
Figure 13. Loss and Accuracy on Proposed Model.
Electronics 13 00251 g013
Figure 14. Comparison of processing speeds of quantized (TFLite Model) and non-quantized (TF Model).
Electronics 13 00251 g014
Figure 15. Comparison of energy efficiencies of quantized (TFLite Model) and non-quantized (TF Model).
Electronics 13 00251 g015
Table 1. Comparative Analysis of Some Edge Computing Based Visual Surveillance Systems.
ReferencesYearFeaturesHardwareAlgorithmDataset
Cob-Parro et al. [24]2021Human detection and classificationUpSquared2 system, Intel Myriad XMobileNetSSD ModelEPFL dataset
Zhang et al. [25]2020Surveillance saliency detection DAVIS, UVSD
Rajavel et al. [26]2022Patient surveillance, fall detectionRaspberry Pi 3, IP CamerasFour-layered IoT architecture including sensors, processing, and cloudAuvinet (2010), DIRO-Université de Montréal Dataset
Ahmed et al. [27]2021Person Detection, Edge ComputingEdge camera, VPU, local server, cloudOne stage deep learning-based person detector- CenterNetSelf-recorded dataset 2k images
Yang et al. [28]2020Vehicle detection and trackingUAV, camera, MECCNN architecture, hierarchical ML tasks distribution (HMTD) frameworkImageNet
Pradeepkumar et al. [29]2021Vehicular traffic monitoringCamera, edge nodeYLLO object detector, BATS bandwidth optimizer algorithmsMS-COCO, UA-Detrac
Ananthanarayanan et al. [30]2017Abnormal traffic patternsSteerable Cameras‘Rocket’ software stack, DNNCrowd-sourced videos
Hussain et al. [31]2020Multiview video summarization, activity recognitionMovidius NCS, vision sensor, wireless sensorLightweight CNN, autoencoders, SVMMVS Office, UCF-50, and YouTube 11 Datasets
Aishwarya et al. [32]2021Normal and abnormal activity recognition in indoor environmentRaspberry Pi, CameraCNN, Background SegmentationOwn dataset (SRMIT)
Subramanian et al. [33]2021Fog+Activity Detection Genetic Algorithm + Background SegmentationHolllywood2, UCF-ARG, KTH
Table 2. The number of recordings of every anomaly in the dataset.
AnomalyVideos
Abuse50
Arrest50
Arson50
Assault50
Burglary100
Explosion50
Fighting50
Road Accidents150
Robbery150
Shooting50
Shoplifting50
Stealing100
Vandalism50
Normal Videos950
Table 3. Accuracy Measures of Proposed Method.
EventPrecisionRecallF1 Score
Arrest0.790.790.79
Arson0.790.780.78
Assault0.780.780.78
Burglary0.790.790.79
Explosion0.810.810.81
Hitting0.790.790.79
Road Accidents0.810.790.80
Robbery0.780.780.78
Shooting0.770.790.78
Shoplifting0.770.790.78
Stealing0.780.780.78
Vandalism0.790.800.79
Normal Events0.790.810.80
Table 4. Accuracy Comparison of Different Models.
ModelTraining AccuracyTest Accuracy
C3D55.16%45.87%
RNN85.61%59.34%
Bi-LSTM66.46%60.96%
Proposed Model91.62%80.92%
Disclaimer/Publisher’s Note: The statements, opinions and data contained in all publications are solely those of the individual author(s) and contributor(s) and not of MDPI and/or the editor(s). MDPI and/or the editor(s) disclaim responsibility for any injury to people or property resulting from any ideas, methods, instructions or products referred to in the content.

