Article

A Low-Cost Test Platform for Performance Analysis of Phasor Measurement Units

1
Faculty of Electrical Engineering, Mechanical Engineering and Naval Architecture, University of Split, Ruđera Boškovića 32, 21000 Split, Croatia
2
Faculty of Electrical Engineering and Computing, University of Zagreb, Unska 3, 10000 Zagreb, Croatia
*
Author to whom correspondence should be addressed.
Electronics 2024, 13(2), 245; https://doi.org/10.3390/electronics13020245
Submission received: 14 December 2023 / Revised: 30 December 2023 / Accepted: 3 January 2024 / Published: 5 January 2024

Abstract

:
In this paper, a customizable low-cost voltage waveform generator based on a real-time desktop PC and embedded data acquisition card synchronized with Coordinated Universal Time (UTC) is presented. A software approach to phase-locked loop synchronization with an external Global Positioning System (GPS) pulse signal is utilized to achieve a time uncertainty of ± 1 μ s. This avoids expensive hardware modules for synchronization and timing purposes, which are commonly presented in literature. Besides the application for controlling the test platform, our own phasor data concentrator (PDC) application is running concurrently on the host PC. The latter is used for collecting and comparing the syncrophasor data from the test platform against the syncrophasor data measured by phasor measurement units (PMUs) under the test. The paper describes all procedures for generating reference test signals. Numerous case studies were performed, and experimental results for steady-state compliance as well as frequency ramp and phase modulation tests for dynamic compliance are presented in detail. All tests confirm that customizable test platform meets the requirements of IEEE/IEC standards. Compared to other calibrators, the cost as well as the specifications and point-by-point concept of data processing makes the described test platform suitable for performance analysis of PMU algorithms implemented on various development boards.

1. Introduction

The growing penetration of distributed energy sources is introducing new paradigms into the distribution network. The challenges that arise are the two-way flow of power and energy, faster frequency variations, reduced network inertia, large power fluctuations that cause additional dynamics [1,2,3]. All this and more presents great difficulties in protecting and managing the system [4,5,6]. Moreover, an undeniable increase in the adoption of microgrids will also introduce new problems in ensuring the main goal, which is to maintain power system stability [7,8,9].
The solution that emerges is the use of phasor measurement units (PMU) in distribution networks, which can improve existing supervisory control and data acquisition (SCADA) systems [10,11,12]. Generally, PMU measures the magnitude and phase of the voltage and current of a three-phase system, as well as the frequency and the rate of change of frequency (ROCOF). The current scientific publication dealing with data from PMUs is all about analyzing and solving problems like voltage monitoring, state estimation, oscillation monitoring, islanding detection, fault location and faulty line detection as well as optimal PMU placement in network nodes [13,14,15,16].
The complex network topology of distribution networks as well as the increased number of micronetworks requires the use of a large number of PMUs which must therefore be affordable. Microcontrollers with analog-to-digital converters (ADC) that support interruptions have enabled relatively inexpensive hardware platforms to be used for OpenPMU projects. Among popular platforms are those based on STM32Fxxx MCUs [17,18,19]. Another group is based on a system-on-chip (SoC) solution with embedded FPGA encompassing low-cost development boards based on one side [20,21,22] and a high-performance NI-cRIO FPGA platform on the other side [23,24,25]. According to [3,21,26], the two most common SoC platforms for OpenPMU projects are BeagleBone Black (BBB) and Rasberry-Pi. They are generally used for rapid hardware-in-the-loop prototyping, i.e., proof-of-concept developments. Thus, PMU solutions based on the BeagleBone Black platform are described in [27,28,29,30], while approaches based on the Rasberry-Pi platform are presented in [31,32,33,34]. It should be pointed out that BBB is superior over the Raspberry-Pi platform due to the presence of two programmable real-time (RT) units.
The biggest challenge facing PMU researchers and developers is to determine the syncrophasor phase angle, and for this purpose devices need to have a global positioning system (GPS) synchronization module or external one-pulse-per-second (PPS) signal. Unfortunately, many of the proposed solutions have problems with ensuring required accuracy. In general, PMU devices must comply with current standards [35,36], which define error limits and test methods separately for P and M class devices at steady-state and dynamic conditions. Commercial testing and calibration devices used today, such as FLUKE 6135A/PMUCAL or OMICRON CMC256+, are extremely expensive and thus not readily available to all researchers [37]. This is also true for PMU calibrators with a theoretical total vector error (TVE) of the order of 0.0x% used in national metrology institutes or by some research groups [38,39]. Today’s development of low-cost PMU devices, which is taking place in different directions, necessarily implies the need for simpler and cheaper custom-made test platforms. It should be pointed out that in [3,17,40], authors use an emulated GPS signal for low-cost PMU testing purposes. However, more realistic test platforms are necessary for research and validation of new algorithms as well as for comparison of various algorithms used to determine syncrophasors [24,25,41,42,43,44,45]. Moreover, a custom-made test platform should have the possibility of performing additional test case studies for the purpose of academic research, which usually goes beyond what is possible with commercially available PMU calibrators.
Our aim is to significantly reduce the costs of necessary equipment in comparison to other calibrators available on the market as is discussed in [37]. This paper presents a test platform based on a desktop PC and digital-to-analog card, whose main purpose is testing of various PMUs and research of syncrophasor applications. Moreover, without any modifications, it can be used for direct performance comparison of PMU under the test with a corresponding high accuracy PMU. Due to the real-time operating system (RTOS) approach, a software-based phase-locked loop (PLL) synchronized by an external one-PPS signal is utilized to achieve a phase accuracy of 0.02 while ensuring a TVE of less than 0.1%. In this way we have avoided expensive equipment such as NI PXI-6682 or NI PXI-6683 modules used for synchronization and timing purposes in calibrators described in [23,29,39]. Furthermore, a newly proposed point-by-point concept of data processing can also be used for research and development of power grid disturbance simulators, as well as for evaluation of various power quality and protection equipment [46,47].

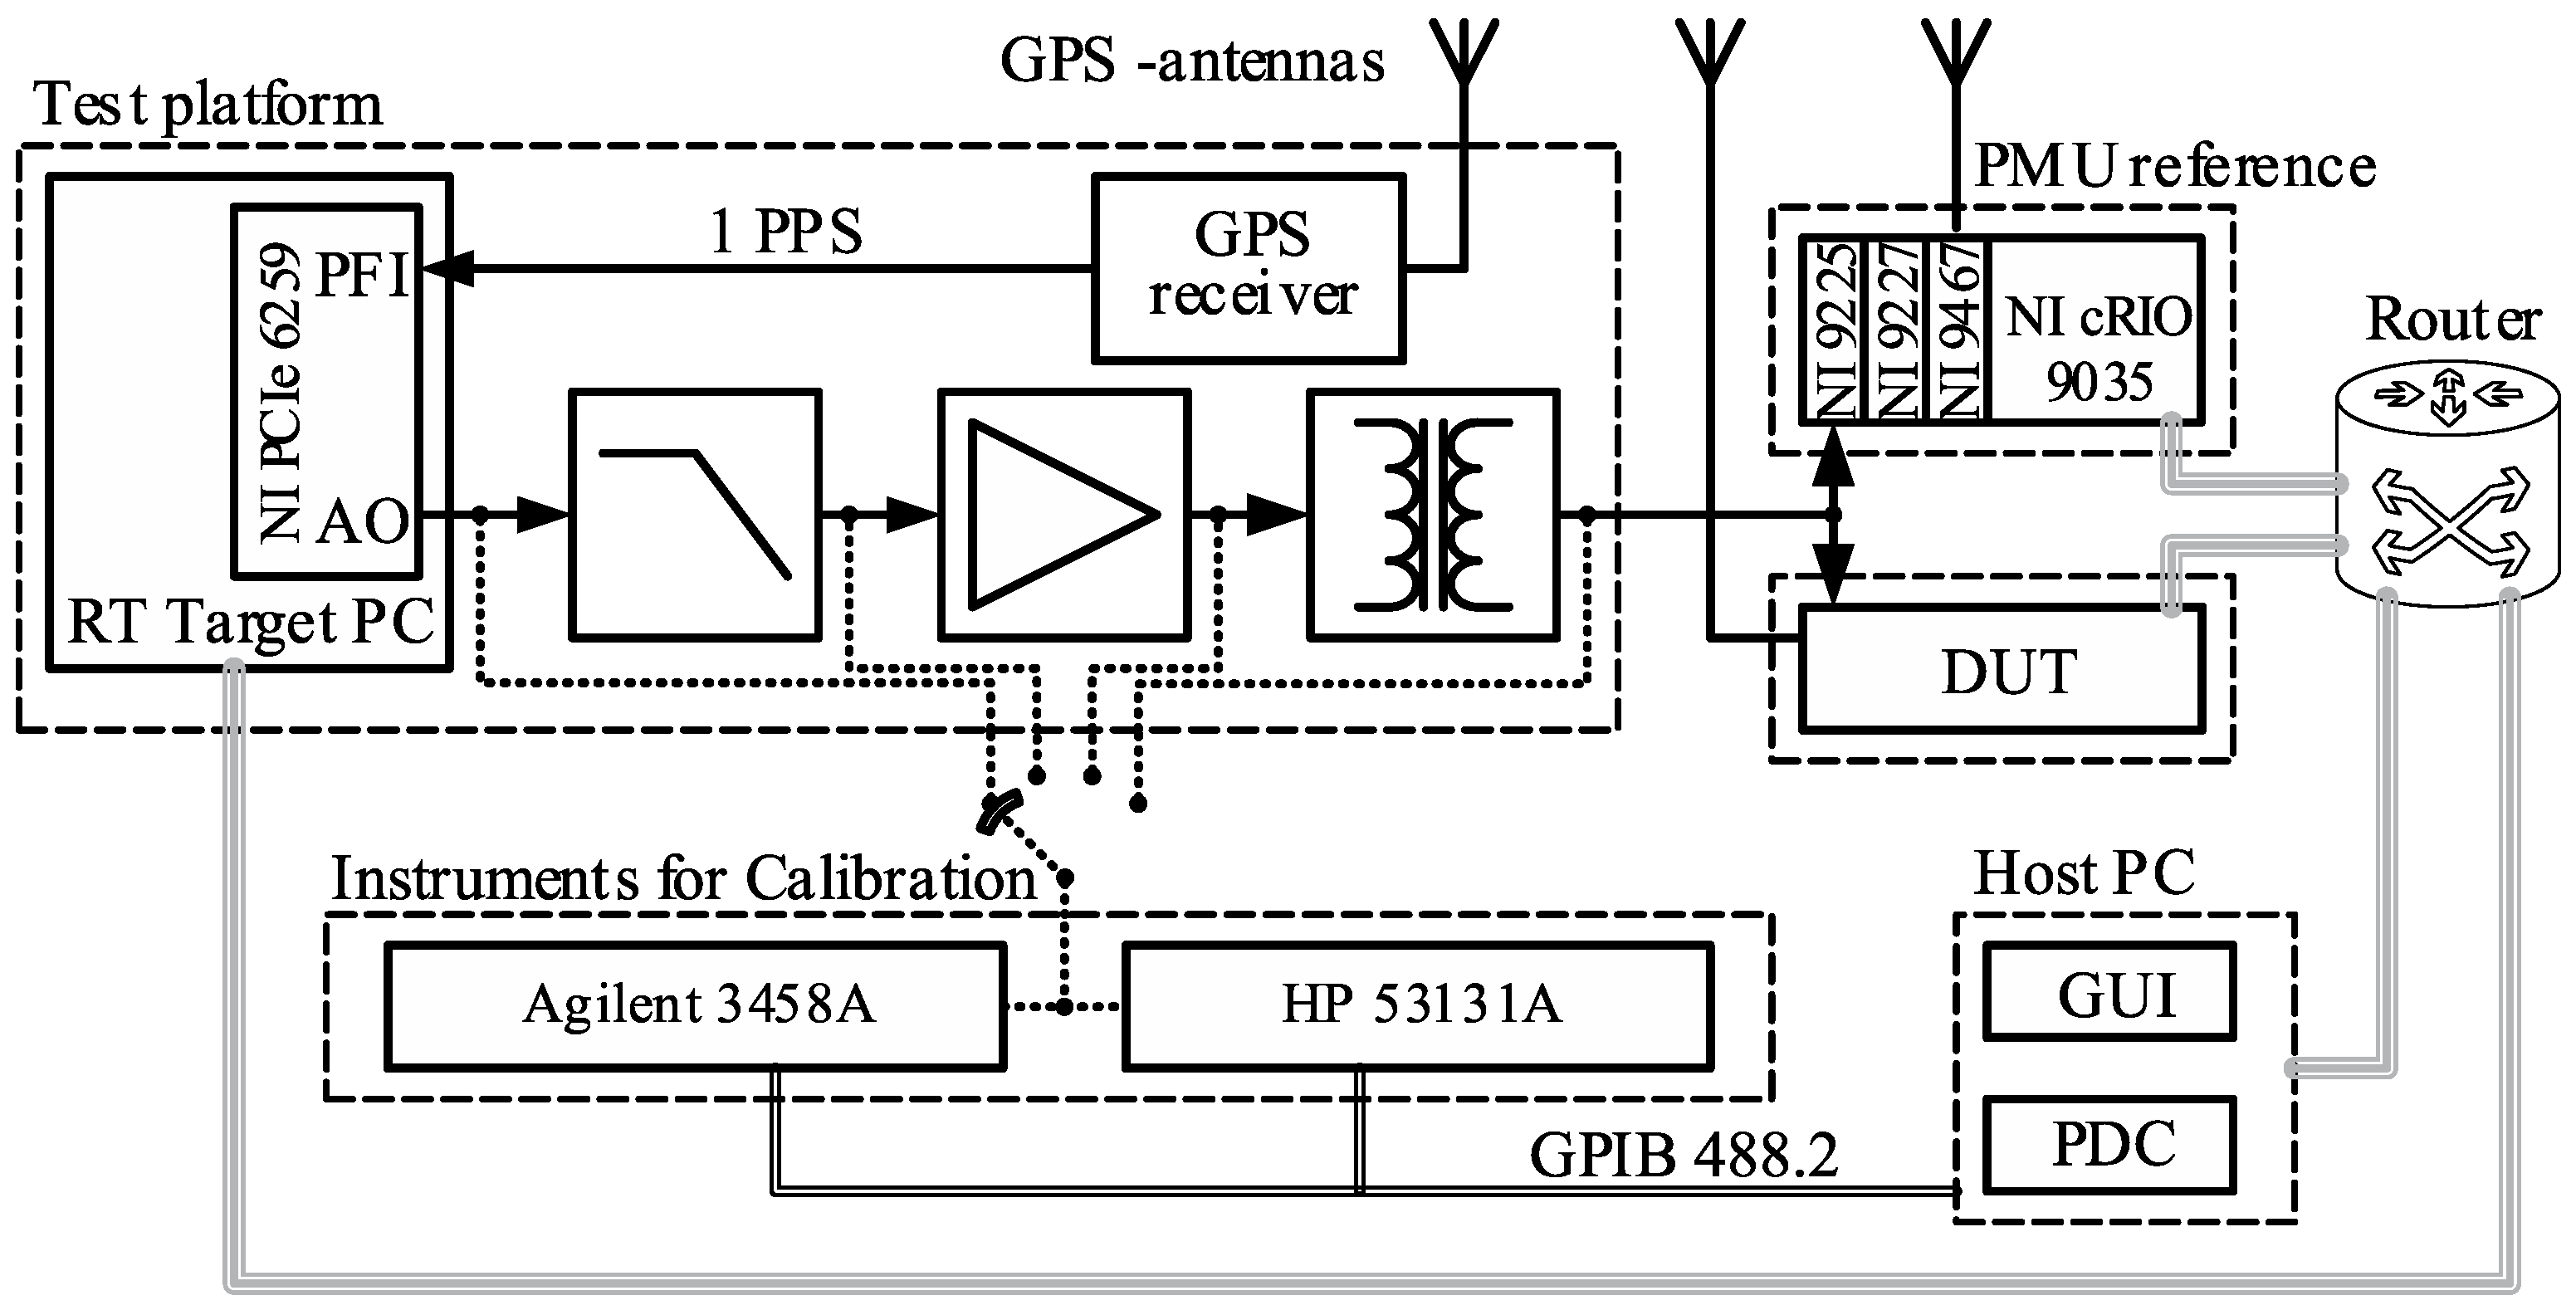
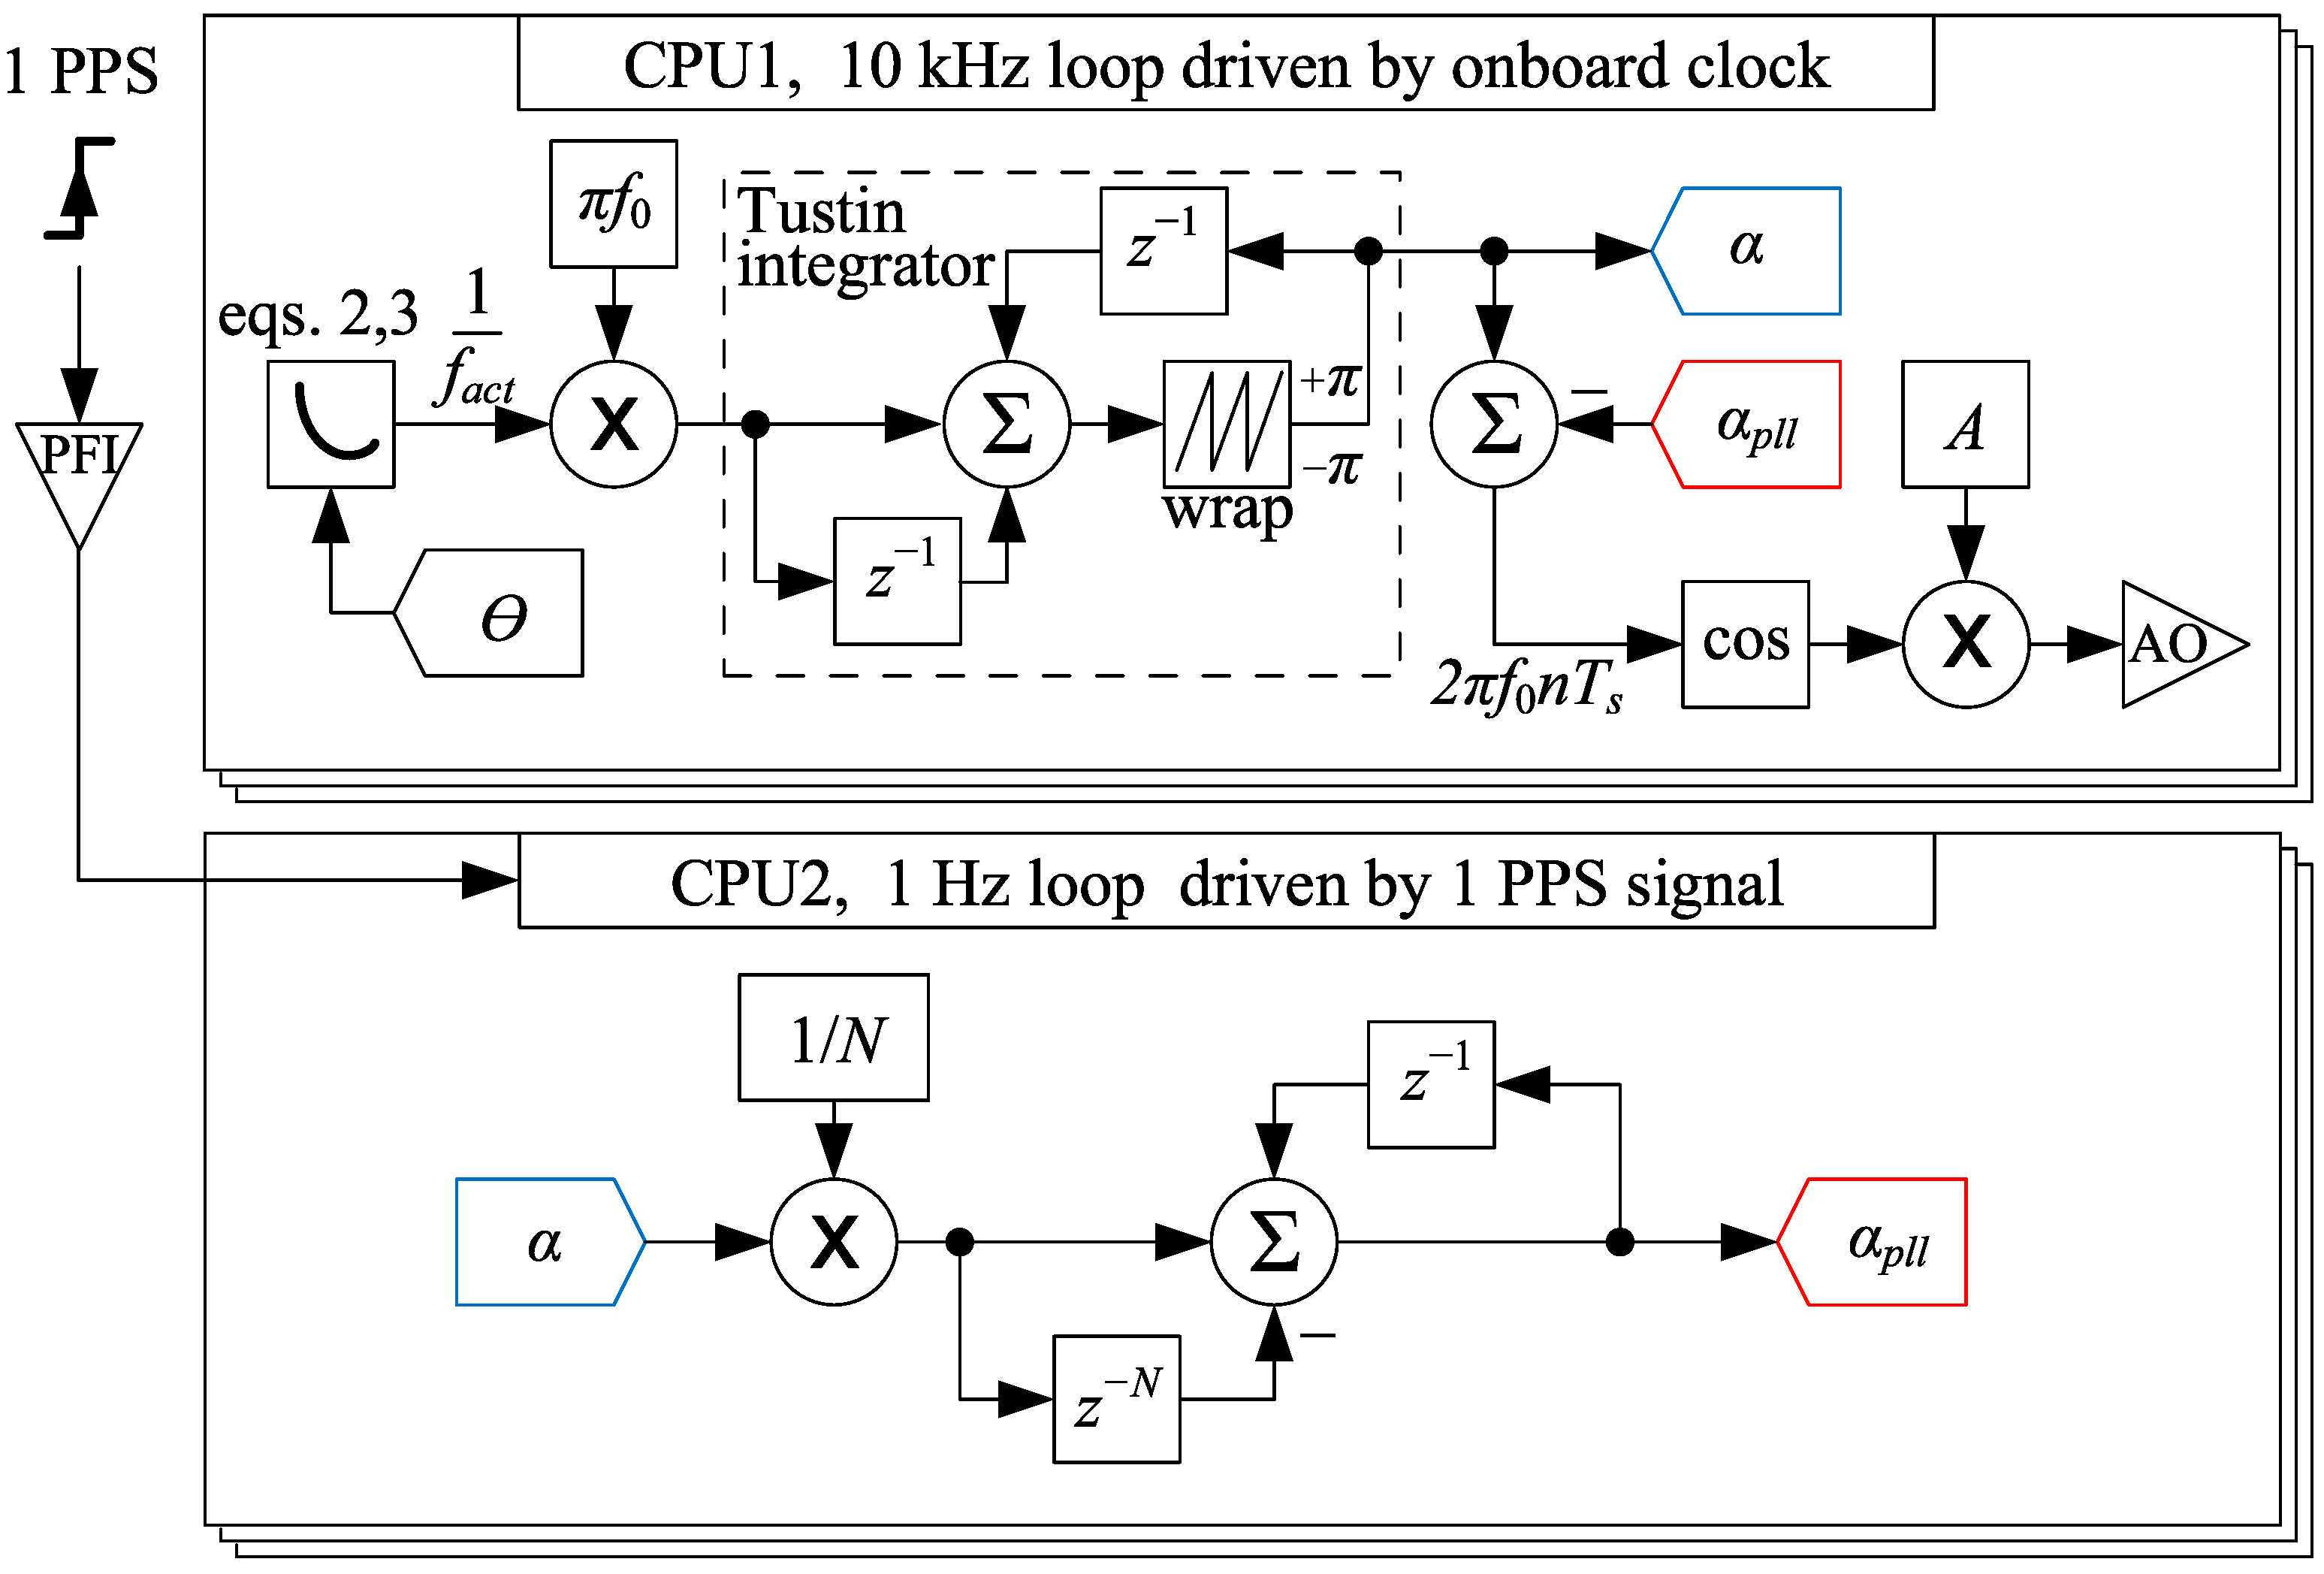
2. System Description

The block diagram of the test platform proposed in this paper is shown in Figure 1. The test platform consists of a desktop PC with a data acquisition (DAQ) card, a low-pass filter, an amplifier, a transformer and a GPS receiver for generating a one-PPS signal. As with any calibration system for testing PMUs, it is necessary to generate reference waveforms with a time accuracy better than ± 1 μ s. On a target PC with Phar Lap RTOS, an algorithm was implemented to synthesize a reference sine wave signal of arbitrary amplitude, phase and frequency. This signal is generated at the 16-bit analog output (AO) of the National Instruments (NI) PCIe 6259 DAQ card [48]. It is important to emphasize that the output voltage is generated in a point-by-point manner every 100 μ s unlike the more common approach of using a block-by-block stream of data. The system is synchronized using a Grove-GPS (Air530) receiver manufactured by Seeed Studio with respect to Coordinated Universal Time (UTC). To assess the delay in the propagation of the time synchronization information as well as to validate the manufacturer-declared time accuracy, the corresponding PPS signal was compared against the reference PPS signal obtained from the traceable Meinberg M1000 modular time server system. A maximum difference of less than 100 ns is observed, which ensures a good level of accuracy for our test platform.
The software-based PLL implemented in the RT target PC is triggered by an external 1 PPS signal from a GPS receiver over a programmable function input (PFI) line of DAQ card. The analog output signal is first filtered by a low-pass filter to reduce the quantization noise contained in the output signal, and then it is amplified by a TPA3116D2 class-D audio amplifier manufactured by Texas Instruments. The amplifier output drives a toroidal transformer, which serves to achieve substation-rated voltage as well as for galvanic isolation purposes.
The traceable 8.5-digit digital multimeter (DMM) Agilent 3458A is used to validate the accuracy of the generated reference voltage. The traceable universal frequency counter HP 53131A is used to verify the system clock frequency and consequently the frequency of the generated reference voltage. Finally, dynamic test signals are verified by a reference PMU consisting of a cRIO-9035 chassis with an NI-9467 time synchronization module and NI-9225 voltage measurement module. According to manufacturer specifications, the declared accuracy of the PMU voltage measurement module is ±(0.05% of reading + 0.008% of full scale range) at ambient temperature ( 25 ± 5 ) C [49]. It is to be noted that the NI reference PMU utilizes a certified synchrophasor estimation algorithm based on a generic recursive DFT algorithm as is discussed in [50]. The PMU reference is also equipped with a module NI 9227 for measuring current synchrophasors but this paper is only focused on the voltage synchrophasor. The NI-6259 DAQ card, unlike NI-9225 and cRIO-9035, provides information on the built-in temperature used for temperature compensation purposes, which is described in the next section.
As can be seen from Figure 1, the LabVIEW development environment on the host PC is used for three main purposes: (i) programming the RT target PC, (ii) controlling external measurement instruments and (iii) as a phasor data concentrator (PDC) for collecting and comparing syncrophasor data from our test platform and reference PMU. Although for the sake of simplicity only one phase of the signal is shown in the block diagram, the test platform can easily be extended to encompass the three-phase system since the multi-channel DAQ card is used.

3. Test Platform Calibration

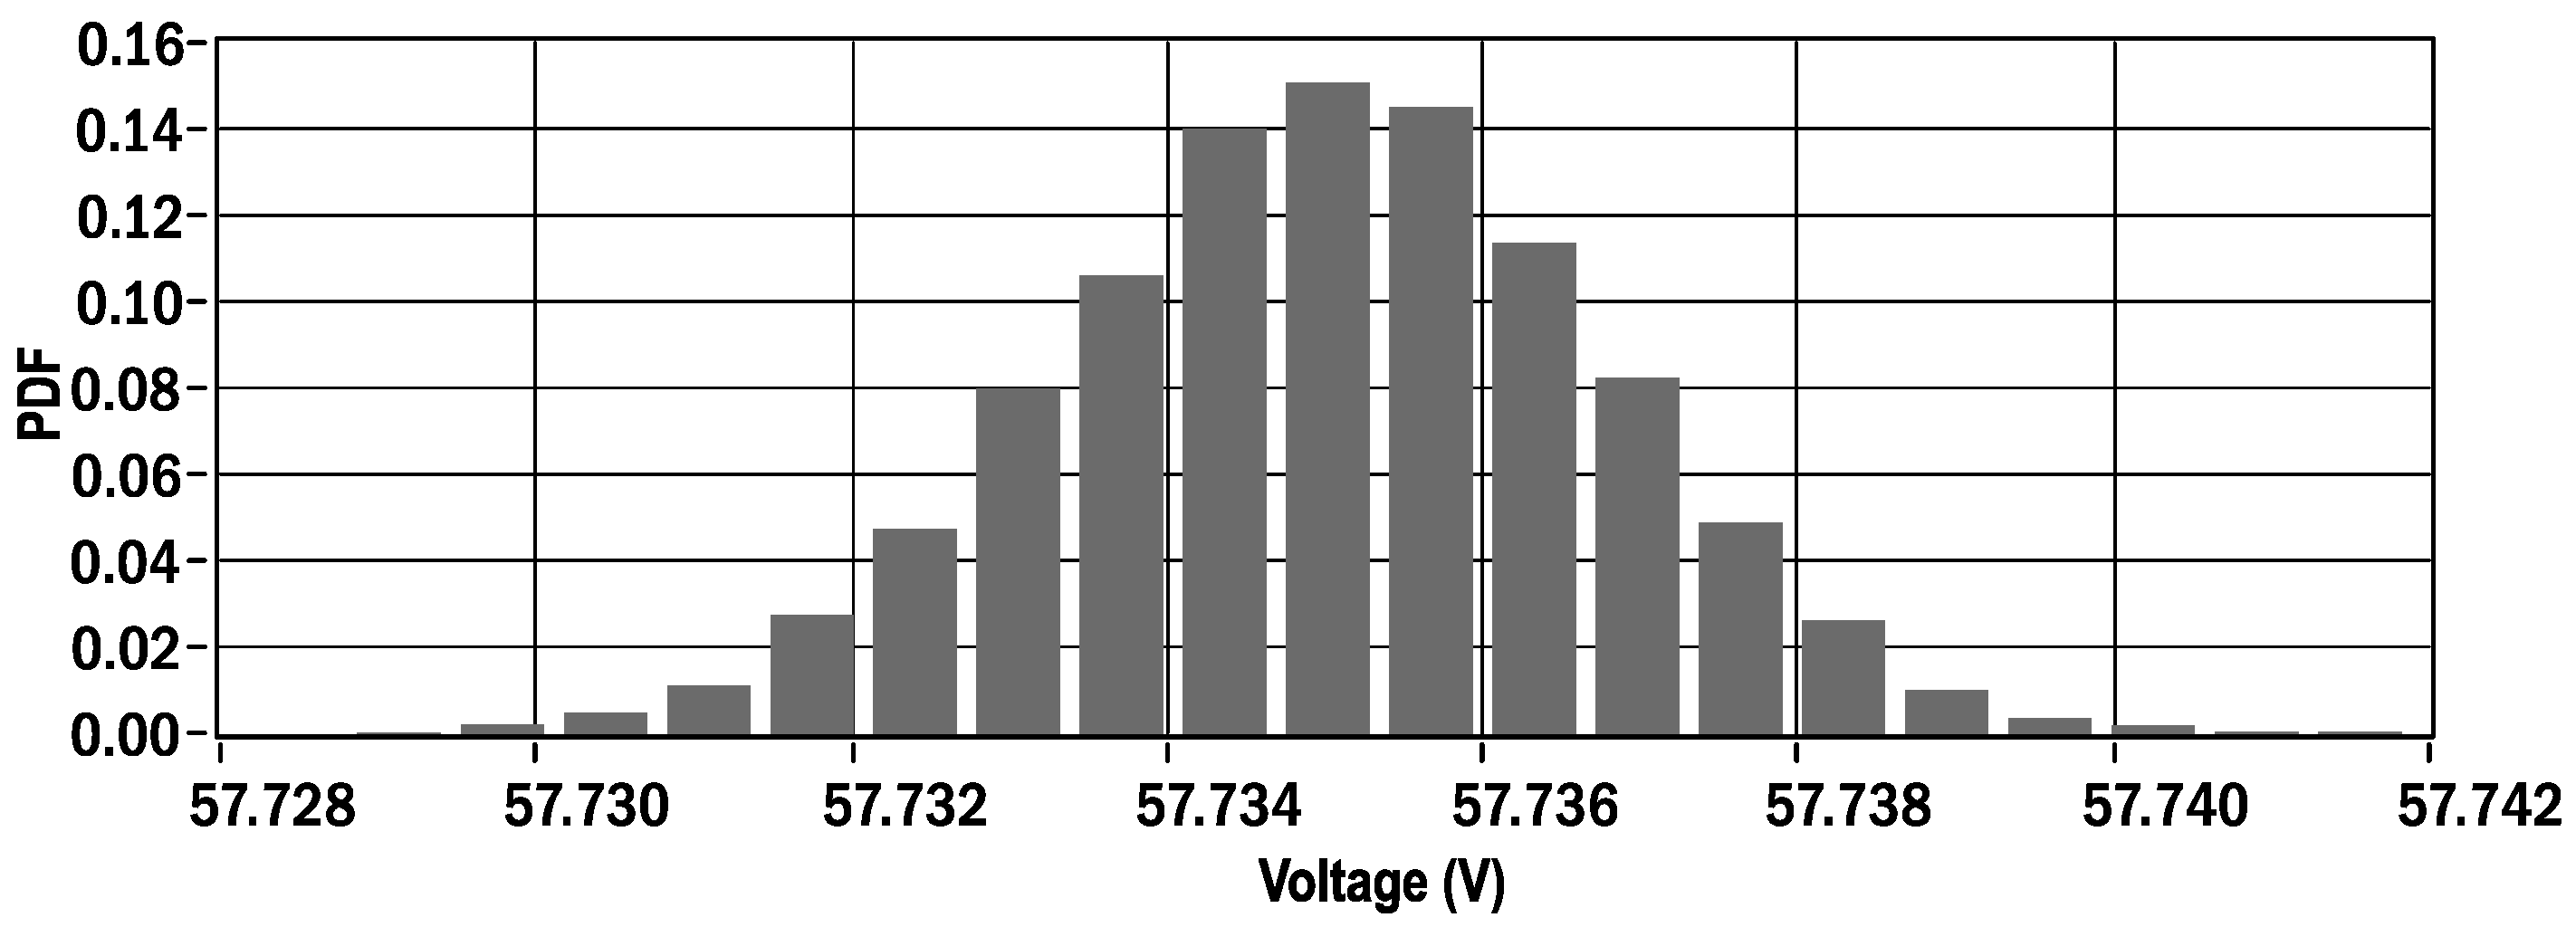
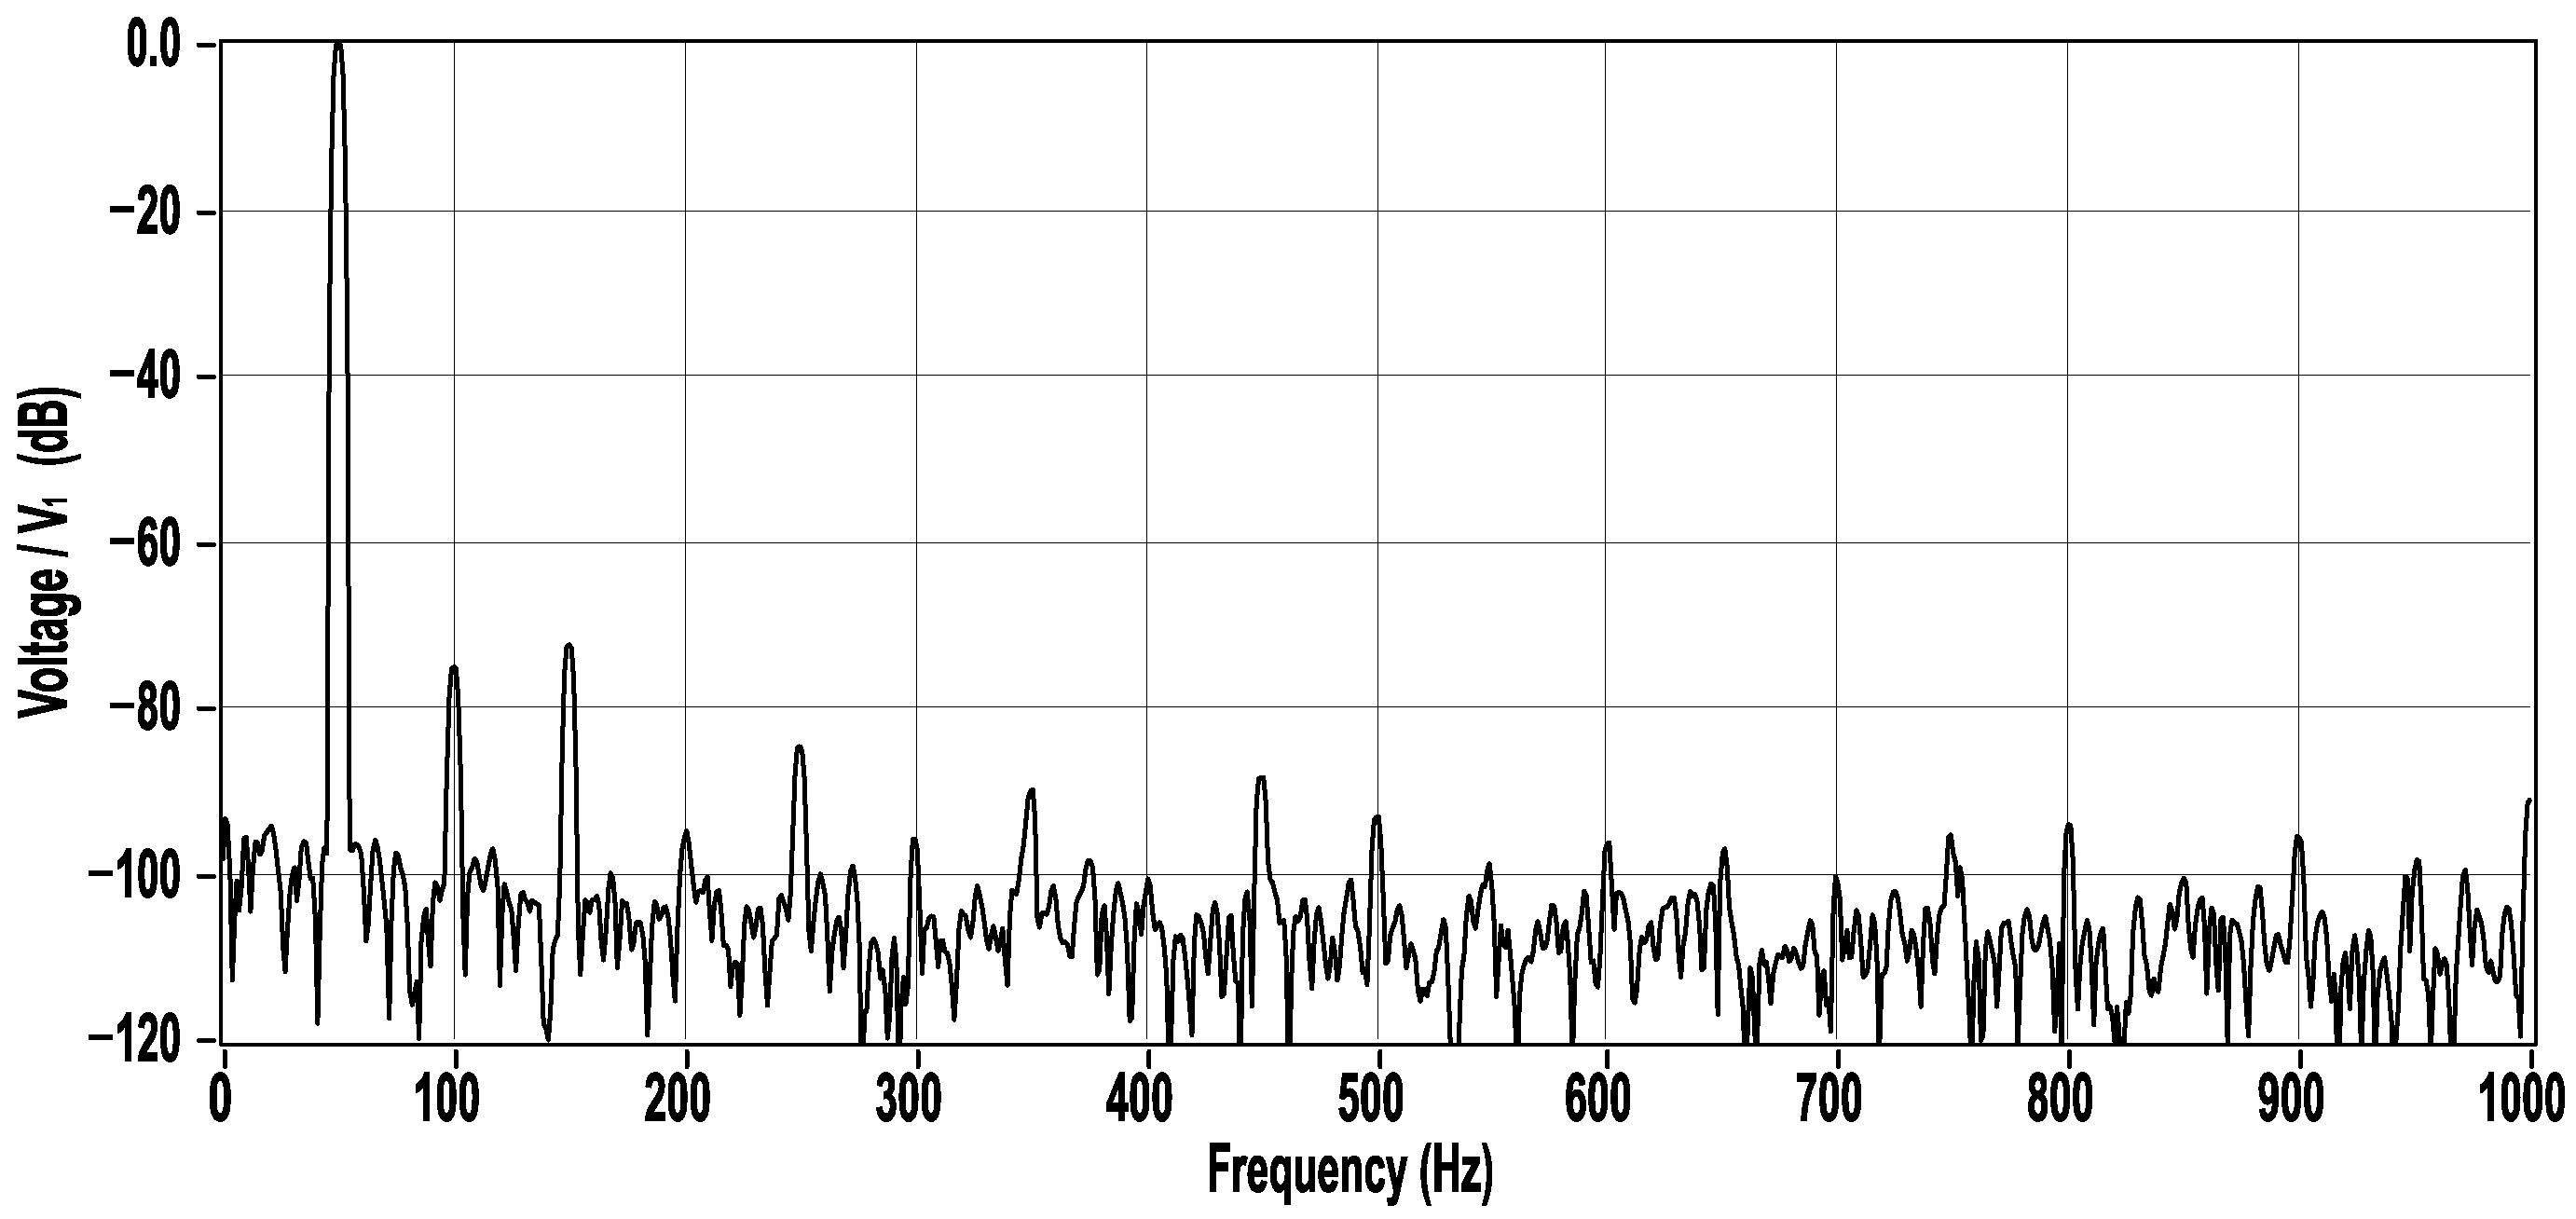
3.1. Voltage Calibration

It has already been said that a low-cost equipment will be used for performing experiments, so the voltage calibration needs to be performed first. Many DAQ cards have built-in temperature sensors for autocalibration purposes, and so NI PCIe 6259 is no exception. Autocalibration is usually performed for only one operating temperature, i.e., near actual ambient temperature. However, if the ambient temperature varies during operation, an error can occur due to an inadequate temperature drift compensation algorithm. DAQ cards generally have sufficiently good precision, but their guaranteed accuracy is relatively low. According to [48], analog output voltage absolute accuracy ( A A ) given in Equation (1) at full-scale range ( F S R ) is valid immediately following internal calibration and assumes the device is operating within ± 10 C from the last performed external temperature calibration:
A A = O V · G E + F S R · O E , G E = 85 + 9 · Δ θ , O E = 104 + 2 · Δ θ ,
where O V is the set output voltage, G E is the temperature dependent gain error (expressed in ppm of O V ), O E is the temperature-dependent offset error (expressed in ppm of F S R ) and Δ θ is the absolute temperature difference between the built-in and the autocalibration temperature, respectively. According to Equation (1), for F S R = 5 V and Δ θ of only 1 C, absolute accuracy is equal to 1000 μ V.
If the analog output voltage of the DAQ card is verified on sufficiently accurate equipment, for instance on the DMM Agilent 3458A, then its steady-state absolute accuracy can be improved by up to 500 μ V.
Given that the purpose of this paper is to generate AC signals, after DAQ card autocalibration at 23 C, rms calibration of sine output voltage was carried out. It is important to note that even for ambient temperature variations of ± 10 C, the steady-state accuracy of generated AC output voltage remains within ± 50 ppm from the set voltage of 3.3 Vrms.

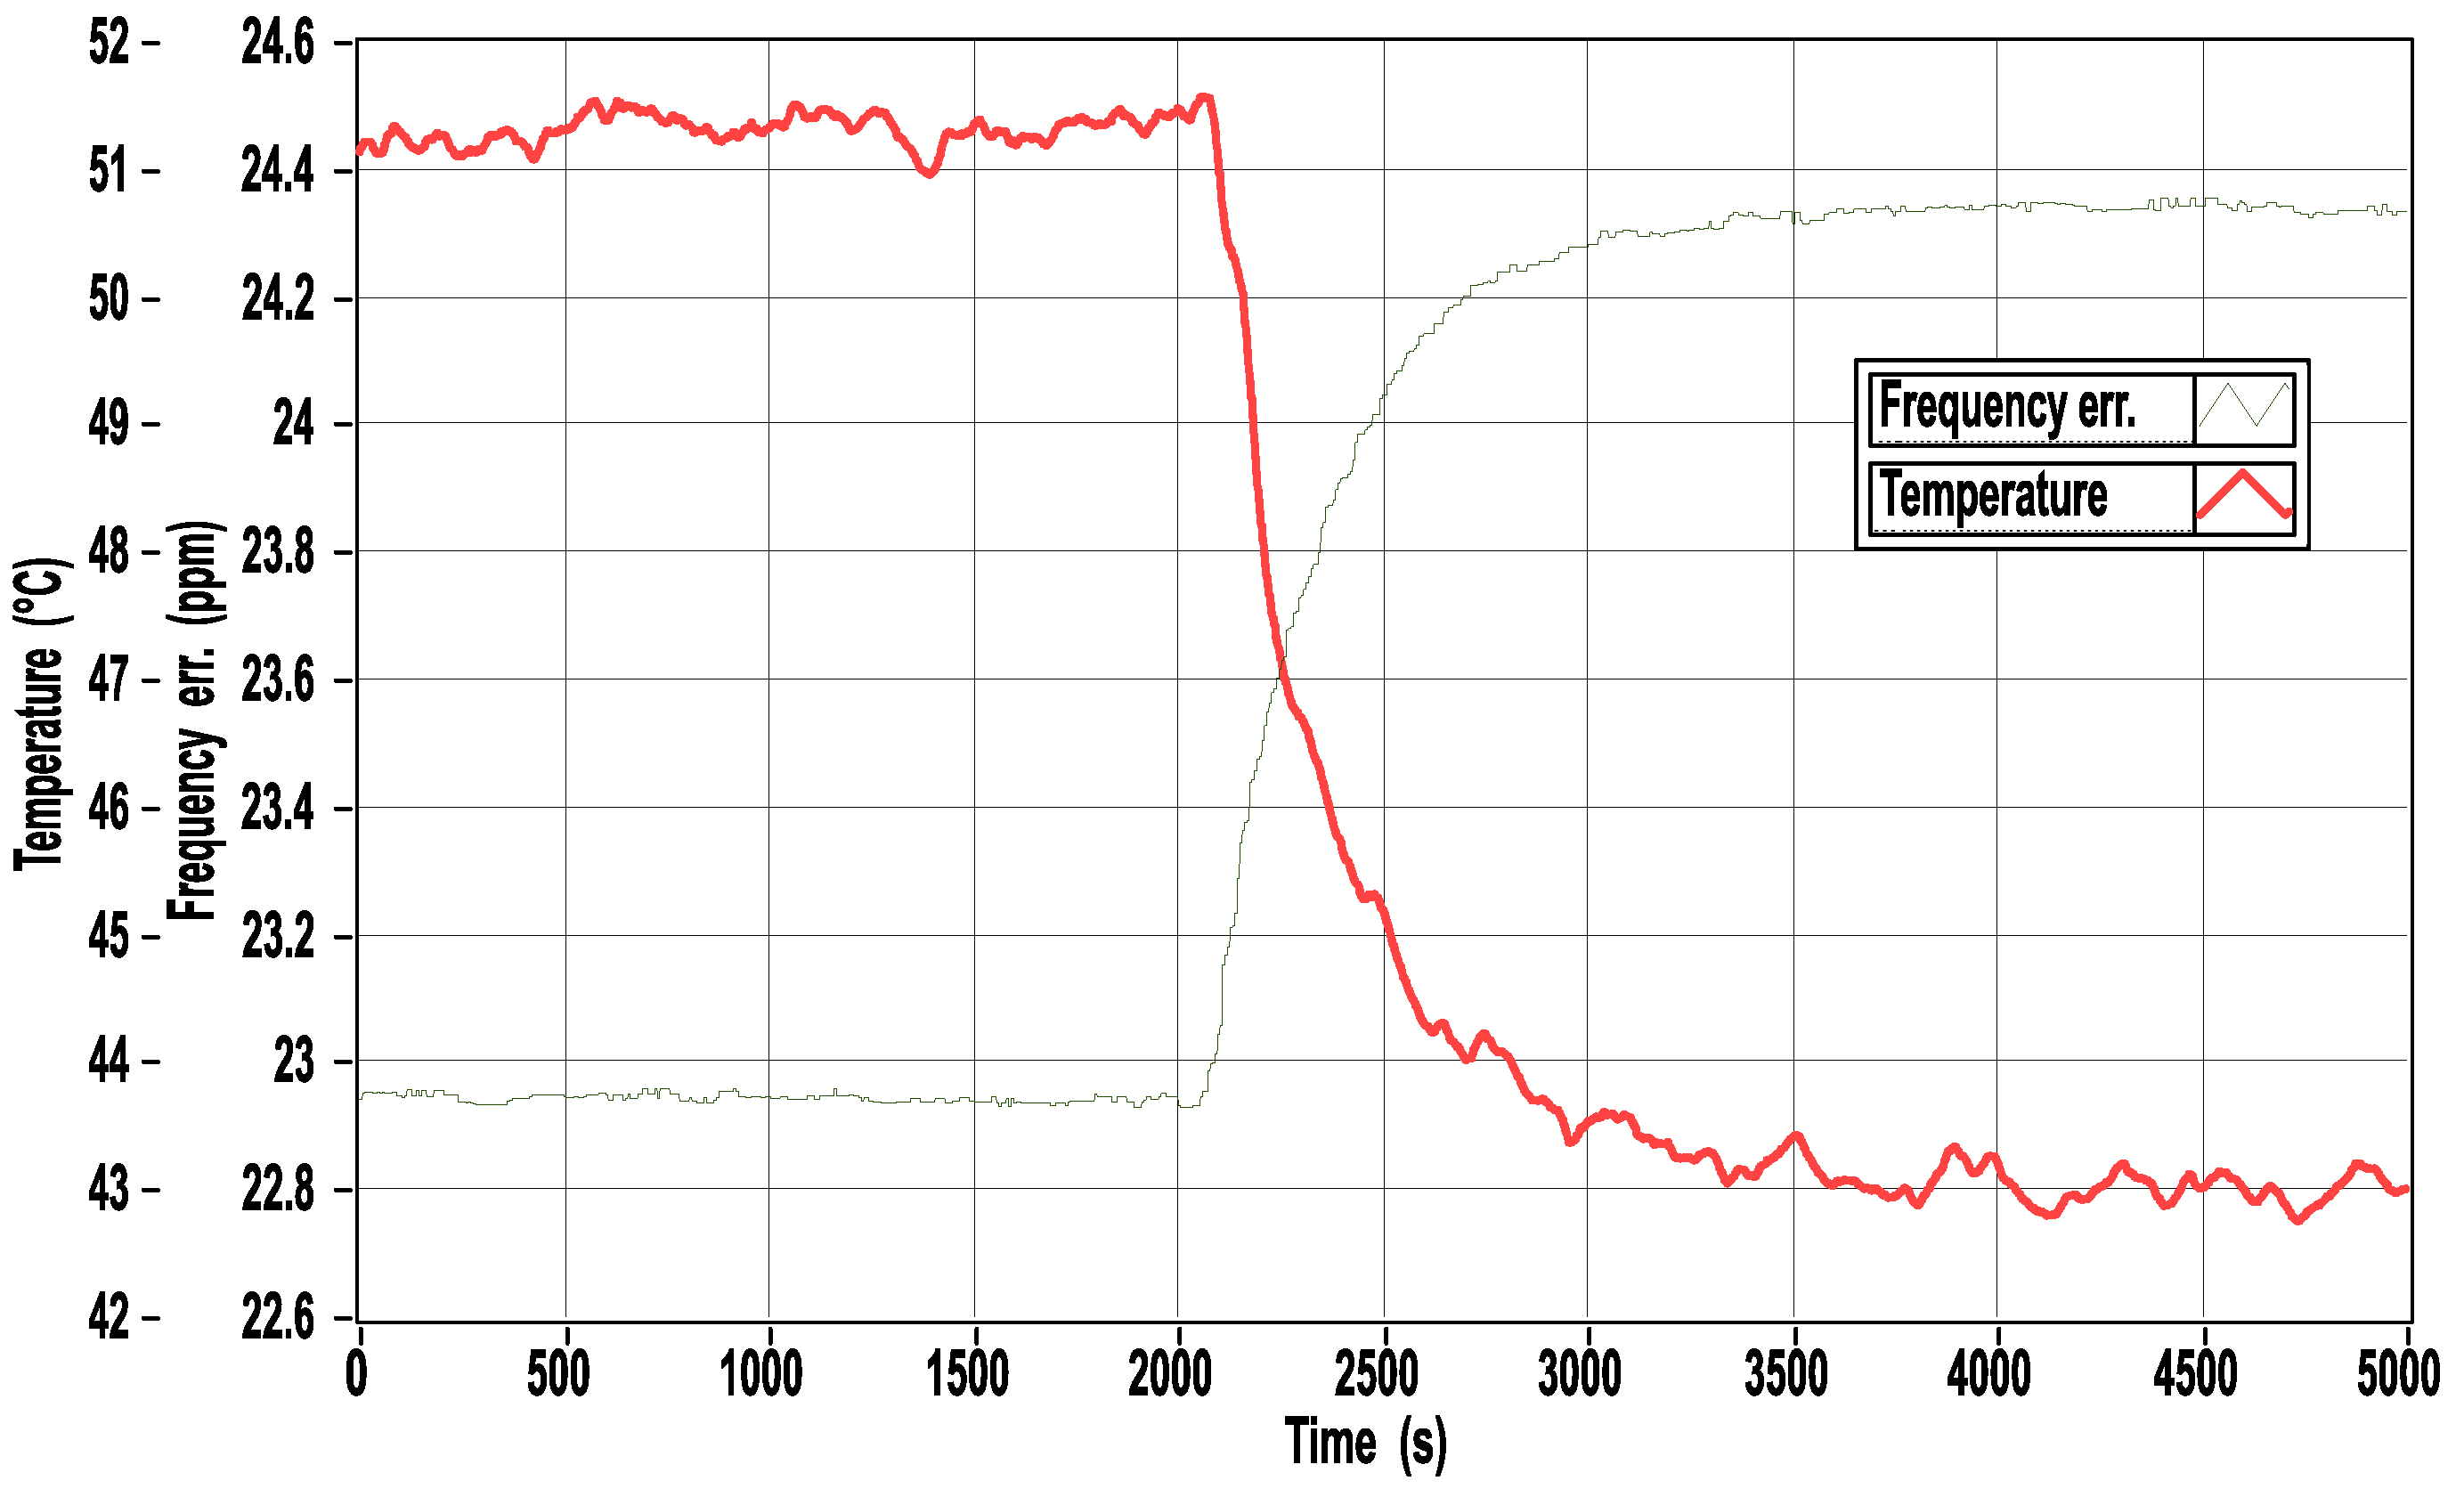
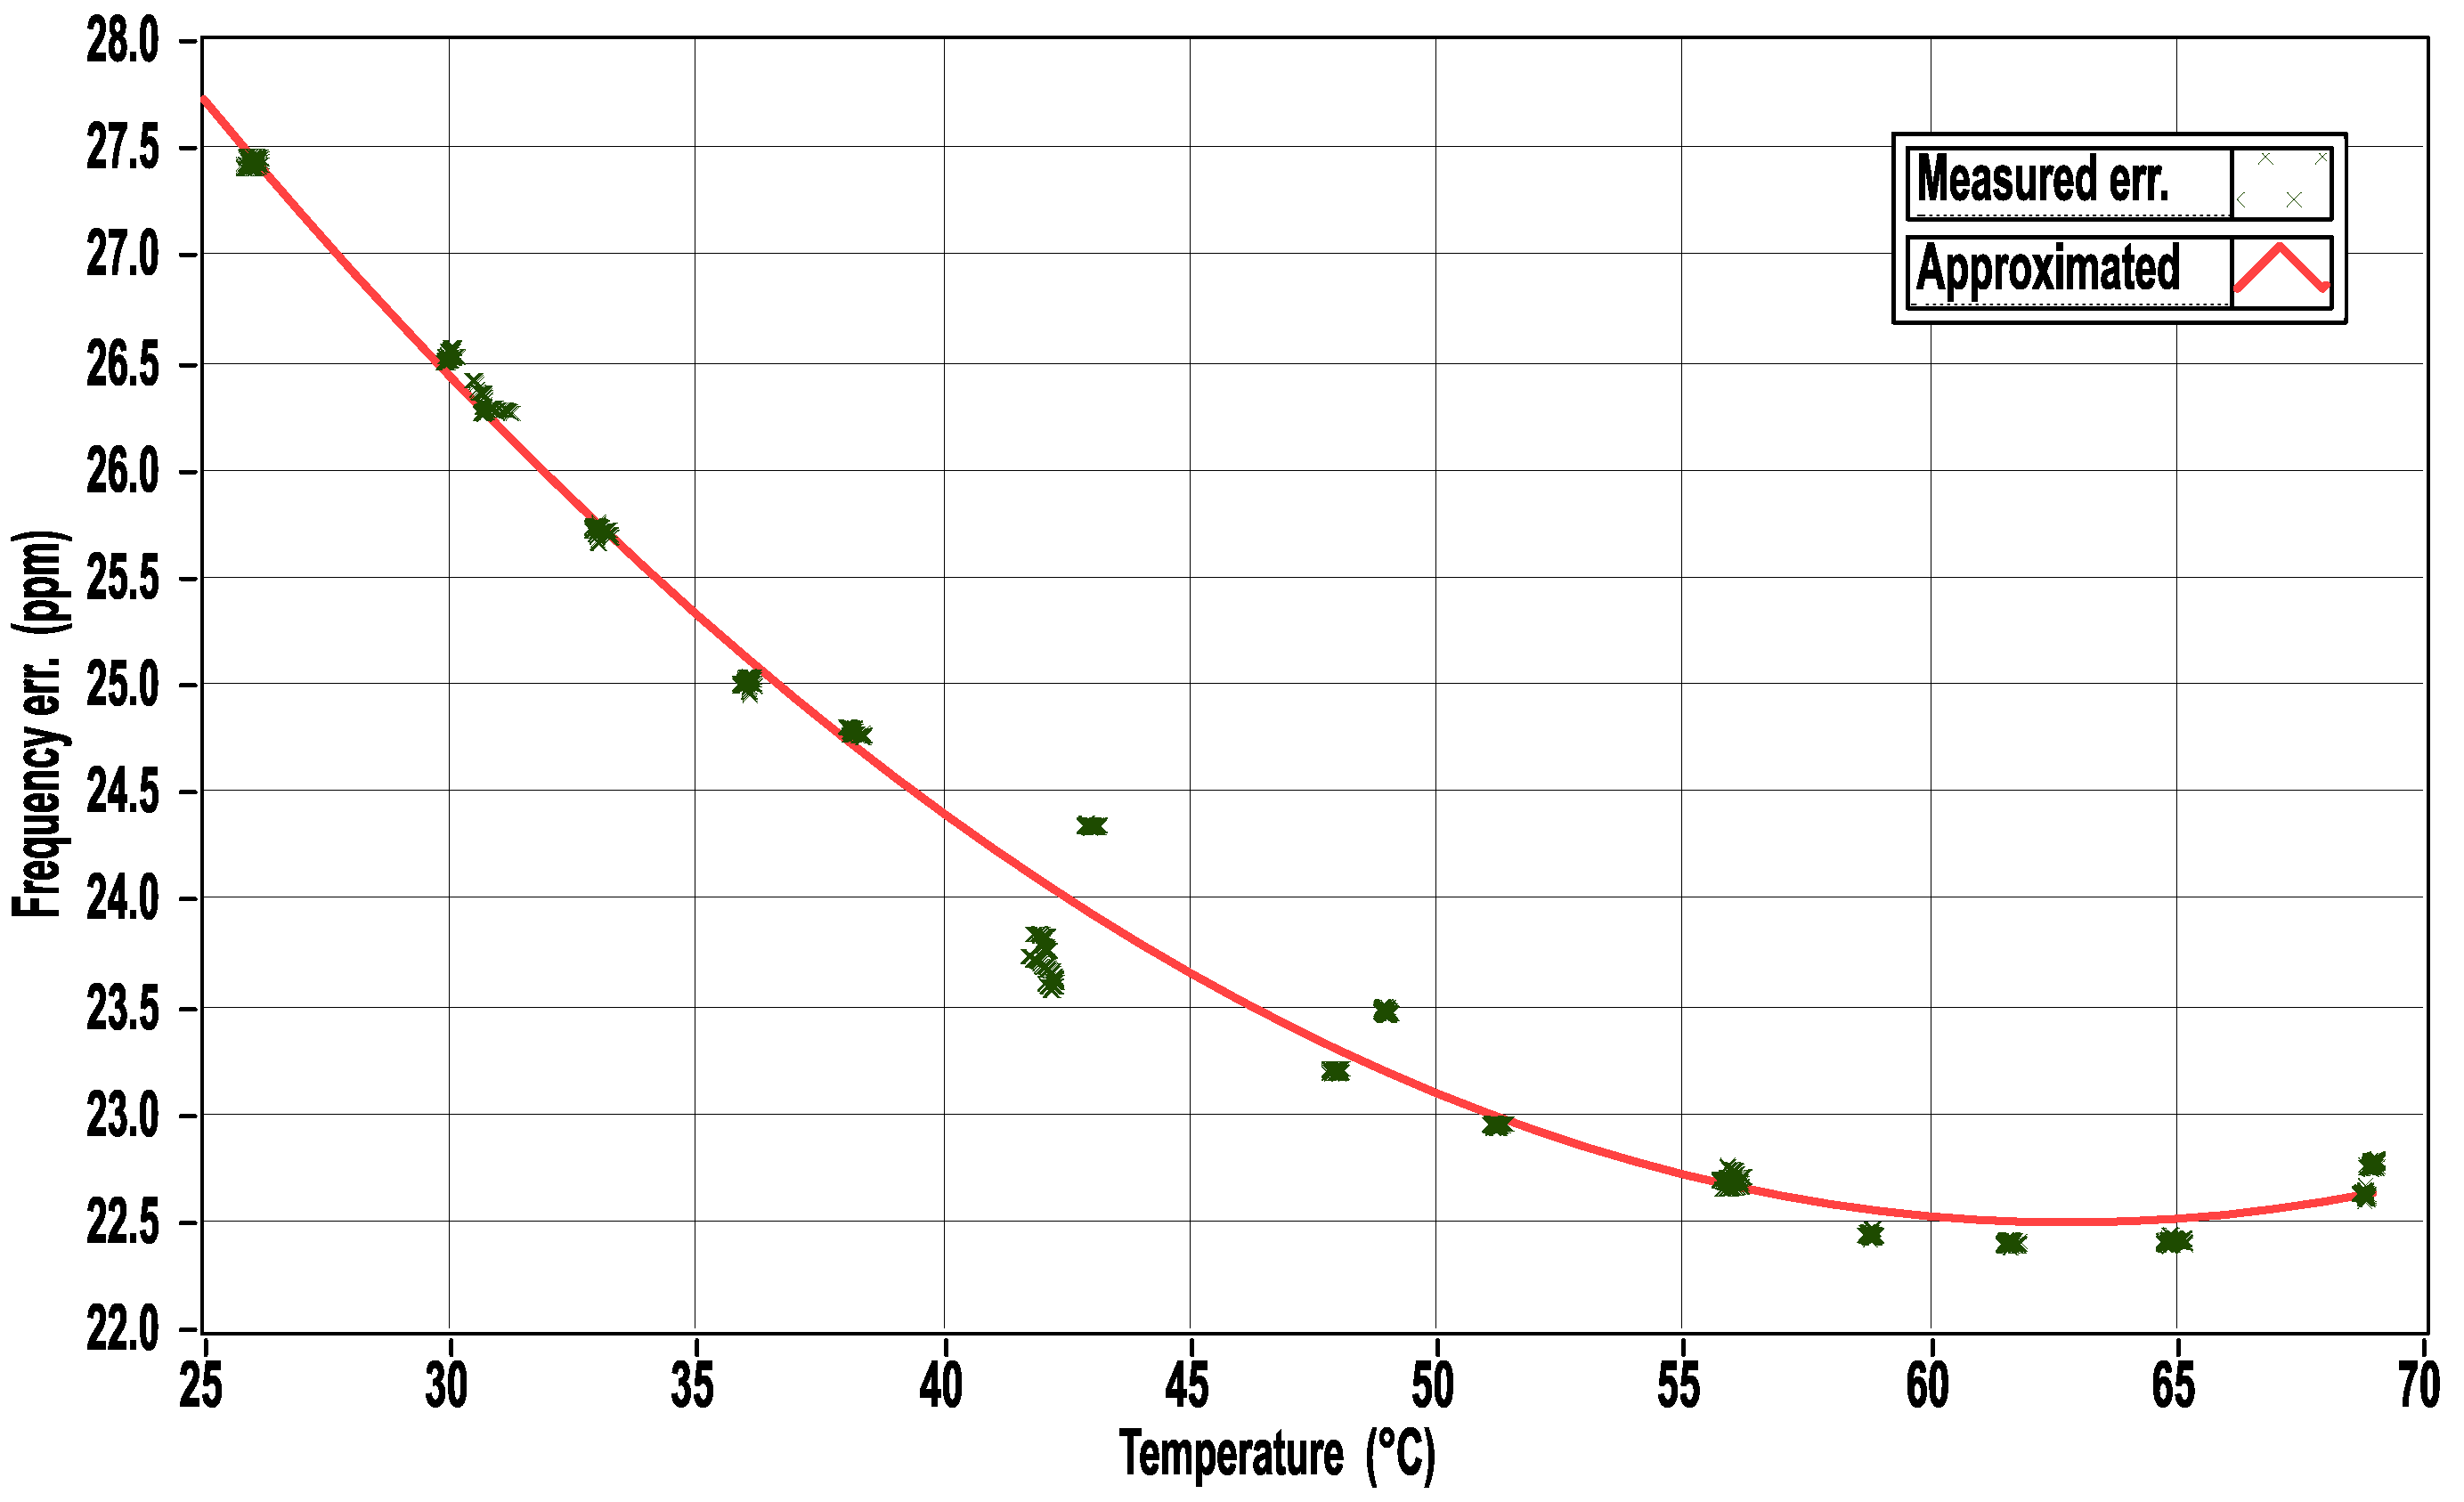
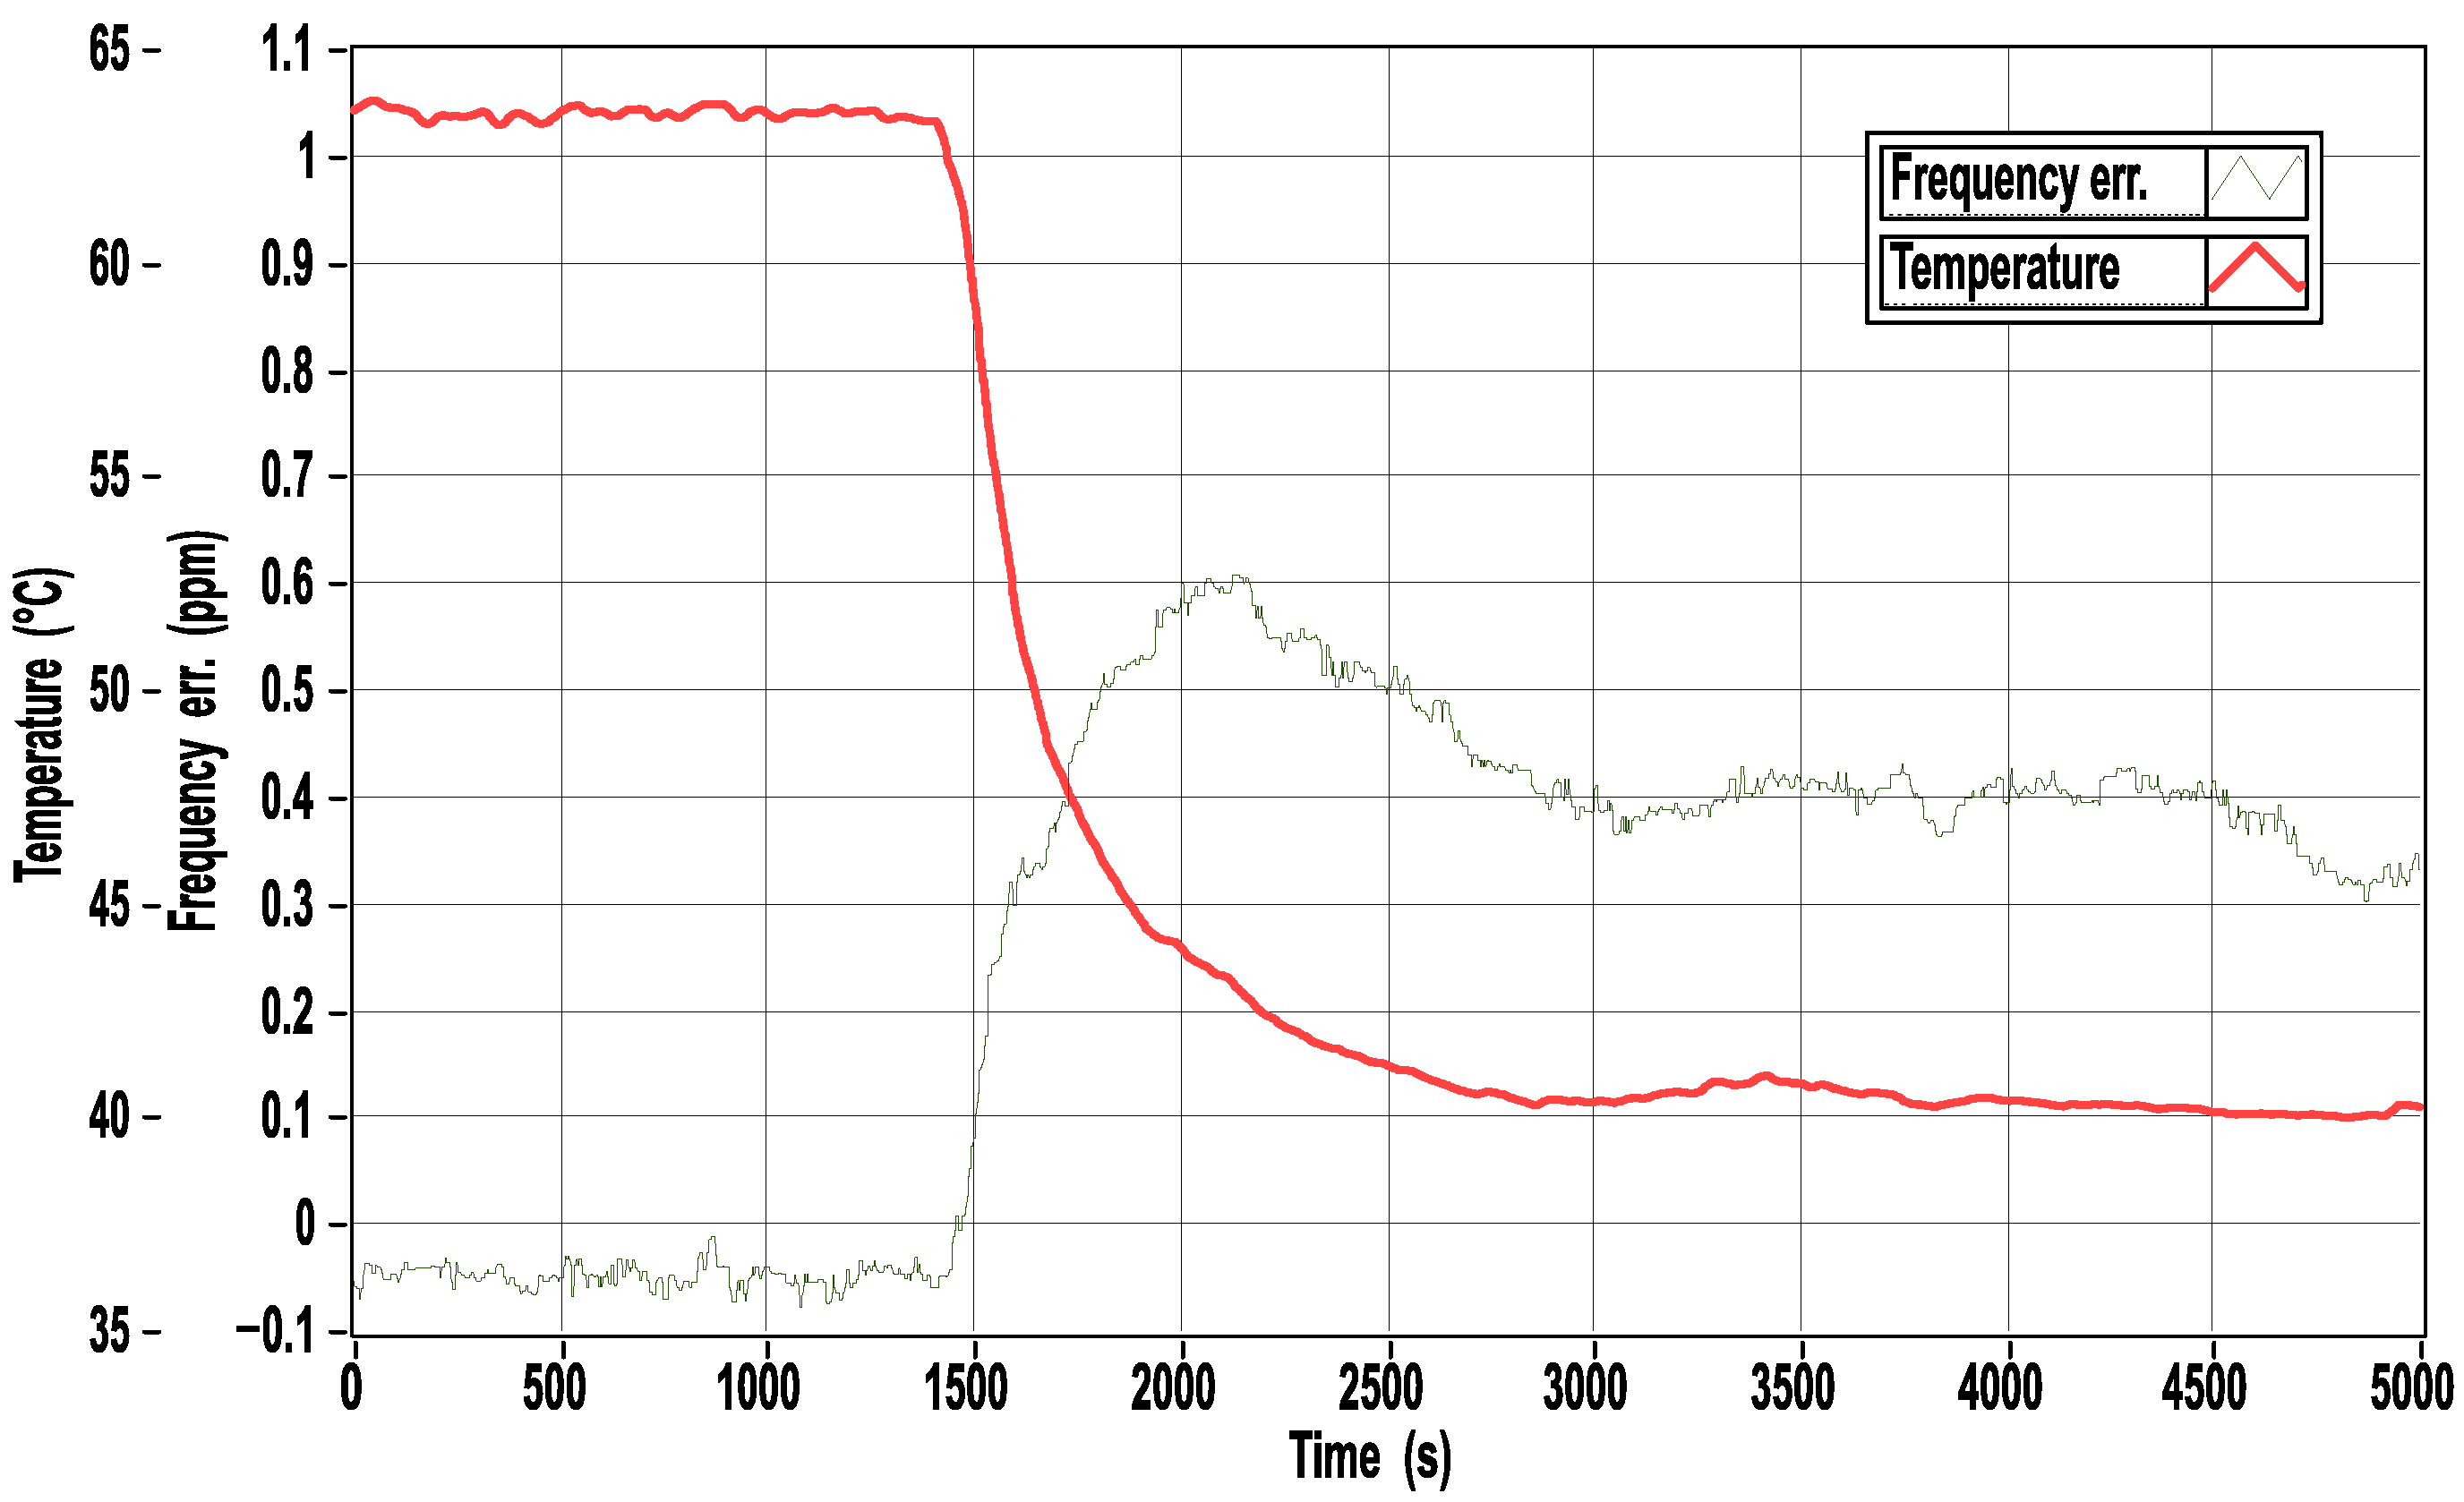
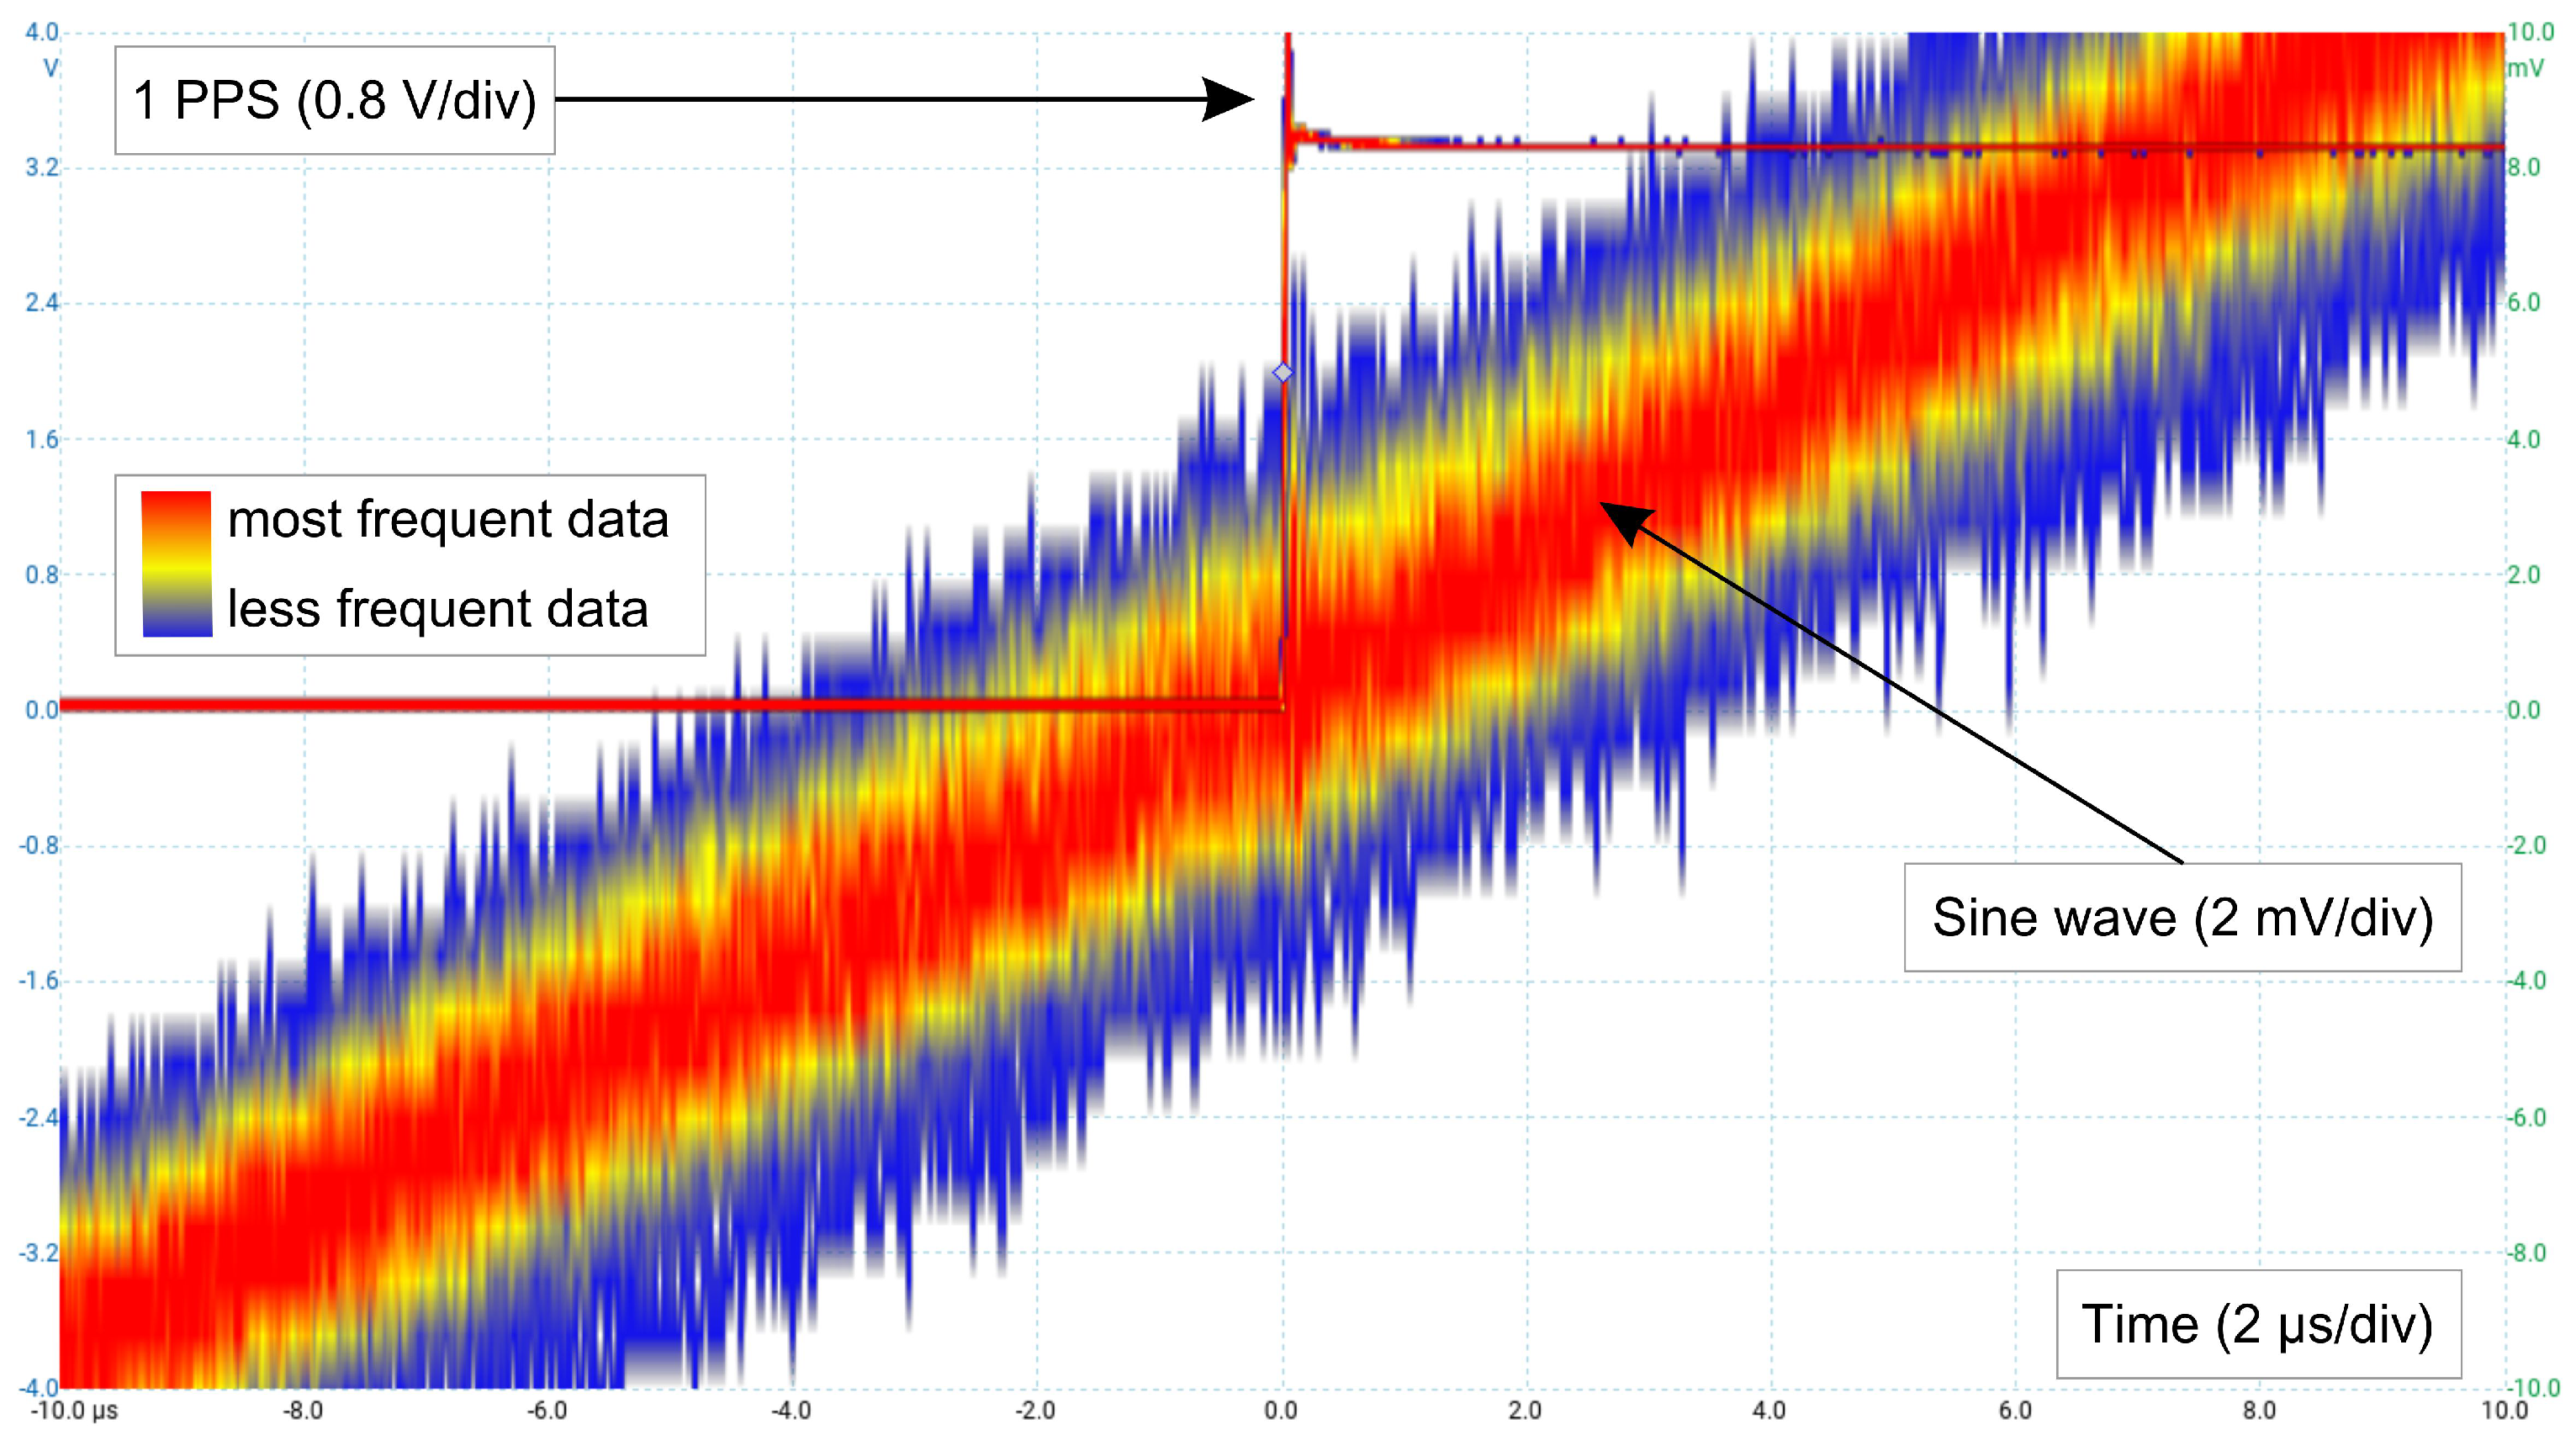
3.2. Onboard Clock Calibration

The frequency of the quartz oscillator also depends on the ambient temperature. Figure 2 shows the corresponding built-in DAQ card temperature and steady-state frequency error of analog output voltage when the ambient temperature varies from 34 C to 25 C. Unlike the built-in voltage autocalibration procedure, for the DAQ card there is no possibility of onboard clock frequency autocalibration. Therefore, it is necessary to determine the relative frequency error of the generated voltage, caused by system clock temperature drift, as a function of temperature. This is done using the universal frequency counter HP 53131A, which has a specified accuracy of the internal oscillator as better than 5 ppb. Figure 3 shows the DAQ card system clock relative frequency error versus built-in DAQ card temperature.
It is evident that the relative frequency error Δ f ( θ ) of the generated voltage undergoes a quadratic temperature dependence. Using the least squares method, it is possible to determine the coefficients of the respective quadratic function:
Δ f ( θ ) = 36.906 0.4587 · θ + 0.0036492 · θ 2 ,
where Δ f is expressed in ppm, and θ is the temperature (in C) obtained from built-in DAQ card sensor. Based on the built-in DAQ card temperature, the set output frequency should be scaled according to:
f s e t = f a c t 1 + Δ f ( θ ) ,
where f a c t is the actual frequency of analog output voltage. In accordance with the above model, it is possible to perform RT temperature drift frequency correction of the system clock. After the RT frequency correction algorithm is applied to eliminate the influence of temperature variations, frequency accuracy of analog output voltage has been significantly increased.
Figure 4 shows the built-in DAQ card temperature and relative frequency error of the generated voltage when the ambient temperature changes from 45 C to 25 C. As can be observed, the output frequency is stable in a wide temperature range, i.e., for the entire observed temperature range in Figure 3 the error is less than ± 1 ppm. For the used PC chassis and ambient temperature range (0–50) C, the declared manufacturer base clock accuracy is 50 ppm [48]. Hence, one can conclude that the DAQ card analog output frequency accuracy has been improved for at least an order of magnitude. Determining the exact clock frequency is especially important in cases of short-term interruptions, i.e., loss of GPS signal. Furthermore, this will also ensure steady-state frequency uncertainty better than 0.1 mHz as stipulated by [36].

3.3. Phase (Bias) Correction

The third parameter to be controlled is the signal phase angle. Namely, the phase error is a direct consequence of the onboard clock error. The principle of phase correction relies on a newly introduced software based PLL synchronization considering an external 1 PPS signal. The block diagram of software PLL algorithm is illustrated in Figure 5. On a quad-core processor, RTOS oversees the execution of two loops separately on each dedicated core. The fast loop is executed on the first CPU core (CPU1) and is driven by an onboard clock with 10 kHz sample rate. Within this loop the angular position α is calculated using the Tustin integrator. However, an angular position error occurs due to an onboard clock error, which can be compensated by a built-in DAQ card temperature ( θ ). Based on this temperature and Equation (2), one can approximate an onboard clock error and consequently adjust the slope of the angular position ramp. Since the DAQ card temperature changes relatively slowly, this information needs to be updated once every few tens of seconds.
For illustration purposes, let us consider a 50 Hz cosine signal with 200 points per period. If we assume an ideal onboard clock, then the angular position increment is equal to 1.8 , that is, 100 μ s. However, when the onboard clock drifts by 20 ppm, this will result in an actual sample period equal to T s = 99.998 μ s and consequently will generate a 50.001 Hz cosine wave. In other words, after every second rollover, the cumulative angular position error would be 0.36 . Thus, if one wants to generate a 50 Hz cosine wave in the fast loop, the angular position increment needs to be equal to 1.799964 , i.e., 20 ppm less than 1.8 in order to compensate for this error. Hence, set frequency should be scaled in accordance with Equation (3) by a factor of 1 / [ 1 + Δ f ( θ ) ] .
Unfortunately, in a real-world scenario the described frequency compensation is not sufficient to maintain a stable enough angular position. For fine-tuning of the angular position, the slow loop triggered by a hardware interruption is executed on the second CPU core (CPU2). Namely, an appropriate routine creates a timing source to drive the slow loop using the external 1 PPS signal over a programmable function interface (PFI). On every second rollover, the slow loop reads the current angular position α from the fast loop, which gives a slowly varying phase offset that needs to be driven to zero, i.e., aligned with the 1 PPS signal. The average phase offset ( α p l l shown in Figure 5) is estimated using a N-th order moving average filter realized in recursive form.
Bearing in mind the fact that the distance between two consecutive 50 Hz cosine wave samples is approximately equal to 1.8 , to achieve the uncertainty of the phase determination at the scale of 0.02 , a filter order of at least N 100 is required. On the other hand, excessive filter order values should be avoided to prevent disruption of overall system dynamics on sudden temperature changes. The estimated α p l l is used to correct the angular position ( α ) in the fast loop over the next second. For such a correctly aligned angular position, the calculated cosine function is multiplied by the set amplitude (A) and then sent to the analog output (AO). It is worth noting that the nominal frequency ( f 0 ) unambiguously determines the duration of power line cycle and since angular position and time are inherently connected, within the fast loop (approximately 10 kHz) driven by onboard clock in Figure 5, the described procedure may be used for an estimation of actual time with ± 1 μ s accuracy.
At the same time, in the RT target PC, another challenging task is to determine the exact time tag and send standardized messages. Namely, the target PC has readily available processed data samples but, due to the onboard clock error, they are not aligned with exact 20 ms multiples of UTC time. Based on that fact, from two successive data samples a linear interpolation is employed to estimate data that correspond to exact 20 ms multiples of UTC time.
To evaluate the performance of the internal time synchronization, disciplined by the external 1 PPS signal, the generated output voltage reference was compared against the 1 PPS signal using an oscilloscope following the procedure explained in [36]. A sine wave, rather than cosine wave, was chosen since the highest slope coincides with the rising edge of the 1 PPS signal. In this way, it was also possible to assess and compensate for the time delay introduced by RTOS and software-based PLL. Figure 6 shows multiple repeated zero crossings of the generated sine wave reference triggered by the external 1 PPS signal acquired on the oscilloscope using 12-bit ADC at 40 MS/s. Instead of the oscilloscope’s average mode of operation, which shows almost perfect alignment (for 100 averaged waveforms) of a fundamental harmonic with the external 1 PPS signal, the oscilloscope’s persistence mode of operation is used to present measurement noise and estimate time jitter caused by operation of both RTOS and software based PLL. On the same enlarged view (2 μ s/div, 2 mV/div) the red color statistically indicates the most frequent data, i.e., the fundamental harmonic is discriminated from measurement noise. As can be observed, the region where the fundamental harmonic spends most of its time is bounded within ± 1 μ s, which is equivalent to ± 0.018 for the nominal grid frequency of 50 Hz.
Magnitude accuracy validation was also carried out beside the assessment of phase accuracy. The measurement uncertainty of rated voltage 100 / 3 V obtained by traceable DMM, is illustrated with the histogram shown in Figure 7. As can be seen, with a 99% level of confidence the expanded uncertainty of output voltage is equal to ± 6 mV. Note that the Bode diagrams for the filter, amplifier and transformer shown in Figure 1 are thoroughly characterized and compensated to minimize propagation of uncertainty to output voltage [39].

4. Phasor Data Concentrator

Generally, PDC is an application that combines RT data from several PMUs and can output a single stream to the higher level PDCs [1,11]. In our case, our own simplified PDC is running on the host PC, and is used for collecting and comparing data during various tests. It should be pointed out that, besides generating arbitrary test waveforms, the test platform is able to communicate with the PDC application using standardized PMU messages at the reporting rate of 50 frames per second. This procedure can be described in six steps as follows:
(a)
Configure and open TCP connection to PMU and RT target PC,
(b)
Send configuration frames to PMUs, receive corresponding header frames and send command frames to turn on data transmission,
(c)
Receiving data messages and parsing syncrophasor and time stamp data,
(d)
Harmonization of syncrophasor data according to the time stamp,
(e)
Calculation of error and visualization of relevant data,
(f)
Return to (c) until the end of test sequence is reached.
Note that step (d) is the most challenging task for the host PC. In order to align randomly received TCP messages, a long enough data buffer must be used. The buffer size depends on the number of PMUs and network topology but in our case, this is not an issue since our laboratory setup consists of three devices in a local area network as is shown in Figure 1.
The error calculated in step (e) is expressed by the TVE, i.e., normalized value of the difference between the measured and reference synchrophasors. Other errors discussed in standard [35] for steady-state compliance as well as compliance for numerous dynamic tests such as sinusoidal amplitude and phase modulation test, frequency ramp tests and step changes in phase and magnitude are also possible to visualize on the host PC. However, it is important to note that the end user can select whether the reference synchrophasor is obtained from the test platform or from the reference PMU.

5. Algorithms for Generating Test Sequences

As can be seen from Figure 5, the simplest test signal is a pure sine wave. When the described test platform is used to produce a signal with higher harmonics, they are separately calculated in the fast loop, as is illustrated in Figure 8. The angular position α is multiplied by the order h of the higher harmonic and then corresponding phase ϕ h is added. After that, the calculated cosine is multiplied by the corresponding harmonic amplitude A h . The harmonics are then summed and sent to the analog output (AO).
In this paper, we have focused on, in our opinion, the two most demanding dynamic compliance tests [35]. The frequency ramp test with a rate of R f = ± 1 Hz/s is executed for P class in range f 0 ± 2 Hz (for M class ± 5 Hz). This test is performed according to the expression from the standard for the frequency offset Δ f ( n T s ) = R f n T s . After applying the Tustin integrator, the corresponding phase change for the first dynamic test sequence (dts) is equal to:
Δ α d t s 1 ( n T s ) = π R f ( n T s ) 2 .
The second dynamic test sequence takes into account phase modulation and is given by:
Δ α d t s 2 ( n T s ) = k a cos ( 2 π f m n T s π ) ,
where k a is the phase angle modulation factor and f m is the modulation frequency in Hz. Depending on test selector position in Figure 8, either Equation (4) or Equation (5) is added to the nominal grid angular position 2 π f 0 n T s .

6. Results and Discussion

Since the DAQ card produces an output signal in a range of a few volts, the rated voltage level of 100 / 3 V is achieved by means of an amplifier and an output transformer. However, both elements are nonlinear in their nature. Thus, it is necessary to evaluate the total harmonic distortion (THD) of the rated output voltage waveform. Figure 9 shows the output voltage spectrum for a pure sine wave reference acquired by 16-bit ADC at 6.25 MS/s. As it can be observed, higher harmonics are less than 72 dB. Even with present modulation harmonics at multiples of 10 kHz, the THD calculated for a 3.125 MHz bandwidth is less than 0.1% as required by [35,36].
During steady-state tests in the range of ( f 0 ± 2 ) Hz, without higher harmonics, the TVE, frequency error (FE) and ROCOF error (RFE) were an order of magnitude better than stipulated [35]. This statement can easily be verified from the responses shown in Figure 10, namely, for the first and the last 5 s corresponding to nominal grid frequency as well as for other constant steady-state sections. Note that FE was confirmed by HP 53131A. Moreover, while performing tests with an additional higher harmonic, TVE, FE and RFE were also better than required but experimental results are omitted here since the focus is on more demanding dynamic responses rather than analysis of steady-state accuracy.
Accuracy assessment for dynamic tests is performed by comparing data from the test platform and the high accuracy reference PMU [49,50], which are received in real time by the PDC with a reporting rate equal to 50 frames per second [24]. The frequency ramp test in Figure 10 consists of a series of seven sections. The voltage magnitude error (ME) during the test was less than 0.1%. The phase error (PE) at the nominal frequency was less than 0.02 , while the PE was approximately 0.05 for the maximum frequency deviation. Consequently, during this demanding test, the TVE was less than 0.1%. The only PMU variable that exceeded the limit was the absolute value of RFE, but only in the exclusion interval.
The magnitude and phase modulation have been performed with a 5 s test sequence duration, for variation of f m in steps of 0.2 Hz. Figure 10 also shows two consecutive phase modulation test responses for f m = 1 Hz and f m = 2 Hz, while k a = 0.1 . In [35], more stringent error limits for modulation tests and different reporting rates are introduced in comparison to the previous release of the standard. In all modulation tests which were carried out, FE, RFE, and TVE were less than stipulated when taking into account the unit’s reporting rate. To emphasize this achievement, the vertical axis range in Figure 10 coincides with the prescribed limits for FE and RFE. In the latter case, the TVE was less than 0.2%, while the standard for this test allows for as much as 3%.

7. Conclusions

A low-cost PMU test platform based on an RT target PC and DAQ card is created using the proposed design approach. To obtain a ubiquitous substation’s rated voltage an amplifier and output transformer are employed. The system presented has been credibly validated at steady state using a traceable DMM and universal frequency counter. Moreover, a temperature drift compensation algorithm has been used to improve overall accuracy beyond the declared manufacturer specifications for the onboard clock. A new software-based PLL is proposed for onboard clock correction and synchronization with an external 1 PPS signal acquired from GPS. The paper describes all procedures for generating test signals in accordance with the requirements of the standard.
For the purpose of performing dynamic tests our test platform is compared against accurate high-performance PMU. The paper presents detailed experimental results for the two most challenging dynamic compliance tests, i.e., frequency ramp and phase modulation tests. Performance test analysis shows that FE, RFE and TVE are significantly lower than stipulated limits. The obtained accuracy allows the application of the presented test platform as a standalone calibrator for low-cost PMUs since it has a “test uncertainty ratio” of at least ten as required by the standard. For even more accurate measurements, without any modifications, it enables the end user to easily compare a PMU under test against a reference PMU for various test signals. The point-by-point approach of signal generation also enables the application of the test platform as a grid disturbance simulator, i.e., by making it suitable for testing of power quality analyzers and grid protection relays.

Author Contributions

Conceptualization, G.P. and M.D.; methodology, M.D. and G.P.; software, A.K. and M.J.; validation, M.J.; investigation, A.K., M.D. and M.J.; data curation, A.K. and G.P.; writing—original draft preparation, A.K.; writing—review and editing, M.D., G.P. and M.J.; visualization, A.K.; funding acquisition, G.P. All authors have read and agreed to the published version of the manuscript.

Funding

This paper is fully supported by Croatian Science Foundation under the project ”Power system disturbance simulator and non-sinusoidal voltages and currents calibrator IP-2019-04-7292”.

Data Availability Statement

Data are contained within the article.

Conflicts of Interest

The authors declare no conflict of interest. The funders had no role in the design of the study; in the collection, analyses, or interpretation of data; in the writing of the manuscript; or in the decision to publish the results.

Abbreviations

The following abbreviations are used in this manuscript:
ADCAnalog-to-Digital Converter
AOAnalog Output
BBBBeagleBone Black
DAQData AcQuisition
DFTDiscrete Fourier Transform
DMMDigital MultiMeter
FEFrequency Error
FPGAField Programmable Gate Array
FSRFull Scale Range
GPSGlobal Positioning System
MEMagnitude Error
NINational Instruments
PDCPhasor Data Concentrator
PEPhase Error
PFIProgrammable Function Input
PLLPhase-Locked Loop
PMUPhasor Measurement Unit
PPSPulse-per-Second
RFEROCOF Error
ROCOFRate of Change of Frequency
RTReal-Time
RTOSReal-Time Operating System
SCADASupervisory Control and Data Acquisition
SoCSystem-on-Chip
TVETotal Vector Error
UTCCoordinated Universal Time

References

  1. Biswal, C.; Sahu, B.K.; Mishra, M.; Rout, P.K. Real-Time Grid Monitoring and Protection: A Comprehensive Survey on the Advantages of Phasor Measurement Units. Energies 2023, 16, 4054. [Google Scholar] [CrossRef]
  2. Singh, A.; Parida, S. Estimation of frequency and phasor using enhanced nonlinear least error squares method for synchrophasor application. Electr. Power Syst. Res. 2021, 201, 107494. [Google Scholar] [CrossRef]
  3. Carducci, C.G.C.; Lipari, G.; Giaquinto, N.; Ponci, F.; Monti, A. Error Model in Single-Board Computer-Based Phasor Measurement Units. IEEE Trans. Instrum. Meas. 2020, 69, 6155–6164. [Google Scholar] [CrossRef]
  4. Arefin, A.A.; Baba, M.; Singh, N.S.S.; Nor, N.B.M.; Sheikh, M.A.; Kannan, R.; Abro, G.E.M.; Mathur, N. Review of the Techniques of the Data Analytics and Islanding Detection of Distribution Systems Using Phasor Measurement Unit Data. Electronics 2022, 11, 2967. [Google Scholar] [CrossRef]
  5. Dashti, R.; Daisy, M.; Mirshekali, H.; Shaker, H.R.; Hosseini Aliabadi, M. A survey of fault prediction and location methods in electrical energy distribution networks. Measurement 2021, 184, 109947. [Google Scholar] [CrossRef]
  6. Qasim Khan, M.; Mohamud Ahmed, M.; Haidar, A.M. An accurate algorithm of PMU-based wide area measurements for fault detection using positive-sequence voltage and unwrapped dynamic angles. Measurement 2022, 192, 110906. [Google Scholar] [CrossRef]
  7. Sobbouhi, A.R.; Vahedi, A. Transient stability prediction of power system; a review on methods, classification and considerations. Electr. Power Syst. Res. 2021, 190, 106853. [Google Scholar] [CrossRef]
  8. Ahmed, M.; Meegahapola, L.; Vahidnia, A.; Datta, M. Stability and Control Aspects of Microgrid Architectures–A Comprehensive Review. IEEE Access 2020, 8, 144730–144766. [Google Scholar] [CrossRef]
  9. Dusabimana, E.; Yoon, S.G. A Survey on the Micro-Phasor Measurement Unit in Distribution Networks. Electronics 2020, 9, 305. [Google Scholar] [CrossRef]
  10. Sufyan, M.A.A.; Zuhaib, M.; Anees, M.A.; Khair, A.; Rihan, M. Implementation of PMU-Based Distributed Wide Area Monitoring in Smart Grid. IEEE Access 2021, 9, 140768–140778. [Google Scholar] [CrossRef]
  11. Hojabri, M.; Dersch, U.; Papaemmanouil, A.; Bosshart, P. A Comprehensive Survey on Phasor Measurement Unit Applications in Distribution Systems. Energies 2019, 12, 4552. [Google Scholar] [CrossRef]
  12. Lee, Y.; Song, H. Decentralized Load Shedding Method Based on Voltage Stability Margin Index Using Synchrophasor Measurement Technology. Electronics 2018, 7, 277. [Google Scholar] [CrossRef]
  13. Joshi, P.M.; Verma, H. Synchrophasor measurement applications and optimal PMU placement: A review. Electr. Power Syst. Res. 2021, 199, 107428. [Google Scholar] [CrossRef]
  14. Liu, Y.; Wu, L.; Li, J. D-PMU based applications for emerging active distribution systems: A review. Electr. Power Syst. Res. 2020, 179, 106063. [Google Scholar] [CrossRef]
  15. Ahmed, W.; Nayel, M.; El-Mohandes, M.T.; Gabbar, H. Simulated testing algorithm for μPMU full observation of unbalanced radial distribution grid. Electr. Power Syst. Res. 2021, 191, 106842. [Google Scholar] [CrossRef]
  16. Shahriar, M.; Habiballah, I.; Hussein, H. Optimization of Phasor Measurement Unit (PMU) Placement in Supervisory Control and Data Acquisition (SCADA)-Based Power System for Better State-Estimation Performance. Energies 2018, 11, 570. [Google Scholar] [CrossRef]
  17. Grando, F.L.; Denardin, G.W.; Moreto, M.; De Pelegrini Lopes, J. A PMU prototype for Synchronized Phasor and frequency measurements for smart grid applications. In Proceedings of the 2015 IEEE 13th Brazilian Power Electronics Conference and 1st Southern Power Electronics Conference (COBEP/SPEC), Fortaleza, Brazil, 29 November 2015–2 December 2015; pp. 1–6. [Google Scholar] [CrossRef]
  18. Femine, A.D.; Gallo, D.; Landi, C.; Luiso, M. A Design Approach for a Low Cost Phasor Measurement Unit. In Proceedings of the 2019 IEEE International Instrumentation and Measurement Technology Conference (I2MTC), Auckland, New Zealand, 20–23 May 2019; pp. 1–6. [Google Scholar] [CrossRef]
  19. Seger, P.V.H.; Grando, F.L.; Lazzaretti, A.E.; Moreto, M.; Denardin, G.W.; Pastro, C.R. Power System Monitoring Through Low-Voltage Distribution Network Using freePMU. IEEE Trans. Ind. Appl. 2022, 58, 3153–3163. [Google Scholar] [CrossRef]
  20. Romano, P.; Paolone, M.; Chau, T.; Jeppesen, B.; Ahmed, E. A high-performance, low-cost PMU prototype for distribution networks based on FPGA. In Proceedings of the 2017 IEEE Manchester PowerTech, Manchester, UK, 18–22 June 2017; pp. 1–6. [Google Scholar] [CrossRef]
  21. Joglekar, A.; Gurrala, G.; Kumar, P.; Joseph, F.C.; Kiran, T.S.; Sahasranand, K.R.; Tyagi, H. Open-Source Heterogeneous Constrained Edge-Computing Platform for Smart Grid Measurements. IEEE Trans. Instrum. Meas. 2021, 70, 1–12. [Google Scholar] [CrossRef]
  22. Samantaray, S.R.; Nanda, S.; Dash, P. A Fast and Adaptive Dynamic Phasor Estimation Algorithm Implemented on Field Programmable Gate Array (FPGA). IEEE Trans. Ind. Electron. 2022, 69, 2088–2098. [Google Scholar] [CrossRef]
  23. Romano, P.; Paolone, M. Enhanced Interpolated-DFT for Synchrophasor Estimation in FPGAs: Theory, Implementation, and Validation of a PMU Prototype. IEEE Trans. Instrum. Meas. 2014, 63, 2824–2836. [Google Scholar] [CrossRef]
  24. Xu, S.; Liu, H.; Bi, T.; Martin, K.E. A High-Accuracy Phasor Estimation Algorithm for PMU Calibration and Its Hardware Implementation. IEEE Trans. Smart Grid 2020, 11, 3372–3383. [Google Scholar] [CrossRef]
  25. Li, J.; Xu, S.; Liu, H.; Bi, T. High-accuracy and low-complexity phasor estimation method for PMU calibration. CSEE J. Power Energy Syst. 2021, 7, 1202–1212. [Google Scholar] [CrossRef]
  26. Schofield, D.; Mohapatra, D.; Chamorro, H.R.; Roldan-Fernandez, J.M.; Abdellah, K.; Gonzalez-Longatt, F. Design and Implementation of Low-Cost Phasor Measurement Unit: PhasorsCatcher. Energies 2022, 15, 3172. [Google Scholar] [CrossRef]
  27. Zhao, X.; Laverty, D.M.; McKernan, A.; Morrow, D.J.; McLaughlin, K.; Sezer, S. GPS-Disciplined Analog-to-Digital Converter for Phasor Measurement Applications. IEEE Trans. Instrum. Meas. 2017, 66, 2349–2357. [Google Scholar] [CrossRef]
  28. Tosato, P.; Macii, D.; Brunelli, D. Implementation of phasor measurement units on low-cost embedded platforms: A feasibility study. In Proceedings of the 2017 IEEE International Instrumentation and Measurement Technology Conference (I2MTC), Turin, Italy, 22–25 May 2017; pp. 1–6. [Google Scholar] [CrossRef]
  29. Tosato, P.; Macii, D.; Luiso, M.; Brunelli, D.; Gallo, D.; Landi, C. A Tuned Lightweight Estimation Algorithm for Low-Cost Phasor Measurement Units. IEEE Trans. Instrum. Meas. 2018, 67, 1047–1057. [Google Scholar] [CrossRef]
  30. Tosato, P.; Macii, D.; Fontanelli, D.; Brunelli, D.; Laverty, D. A Software-based Low-Jitter Servo Clock for Inexpensive Phasor Measurement Units. In Proceedings of the 2018 IEEE International Symposium on Precision Clock Synchronization for Measurement, Control, and Communication (ISPCS), Geneva, Switzerland, 30 September–5 October 2018; pp. 1–6. [Google Scholar] [CrossRef]
  31. Leccese, F.; Cagnetti, M.; Di Pasquale, S.; Giarnetti, S.; Caciotta, M. A New Power Quality Instrument Based on Raspberry-Pi. Electronics 2016, 5, 64. [Google Scholar] [CrossRef]
  32. Mingotti, A.; Peretto, L.; Tinarelli, R.; Angioni, A.; Monti, A.; Ponci, F. Calibration of Synchronized Measurement System: From the Instrument Transformer to the PMU. In Proceedings of the 2018 IEEE 9th International Workshop on Applied Measurements for Power Systems (AMPS), Bologna, Italy, 26–28 September 2018; pp. 1–5. [Google Scholar] [CrossRef]
  33. Carducci, C.G.C.; Lipari, G.; Bosbach, N.; Raimondo, T.D.; Ponci, F.; Monti, A. A Versatile Low-Cost OS-based Phasor Measurement Unit. In Proceedings of the 2019 IEEE International Instrumentation and Measurement Technology Conference (I2MTC), Auckland, New Zealand, 20–23 May 2019; pp. 1–6. [Google Scholar] [CrossRef]
  34. Singh, A.; Parida, S.K. Power System Frequency and Phasor Estimation for a Low-Cost Synchrophasor Device Using the Nonlinear Least-Square Method. IEEE Trans. Ind. Appl. 2022, 58, 39–48. [Google Scholar] [CrossRef]
  35. IEC/IEEE 60255-118-1-2018; IEEE/IEC International Standard—Measuring Relays and Protection Equipment—Part 118-1: Synchrophasor for Power Systems—Measurements. IEEE: Piscataway, NJ, USA, 2018. [CrossRef]
  36. IEEE Std C37.242-2013; IEEE Guide for Synchronization, Calibration, Testing, and Installation of Phasor Measurement Units (PMUs) for Power System Protection and Control. IEEE: Piscataway, NJ, USA, 2013. [CrossRef]
  37. Grando, F.L.; Lazzaretti, A.E.; Denardin, G.W.; Moreto, M.; Neto, H.V. A Synchrophasor Test Platform for Development and Assessment of Phasor Measurement Units. IEEE Trans. Ind. Appl. 2018, 54, 3122–3131. [Google Scholar] [CrossRef]
  38. Frigo, G.; Colangelo, D.; Derviškadić, A.; Pignati, M.; Narduzzi, C.; Paolone, M. Definition of Accurate Reference Synchrophasors for Static and Dynamic Characterization of PMUs. IEEE Trans. Instrum. Meas. 2017, 66, 2233–2246. [Google Scholar] [CrossRef]
  39. Frigo, G.; Derviškadić, A.; Colangelo, D.; Braun, J.; Paolone, M. Characterization of uncertainty contributions in a high-accuracy PMU validation system. Measurement 2019, 146, 72–86. [Google Scholar] [CrossRef]
  40. Grando, F.L.; Denardin, G.W.; Moreto, M. Test platform for analysis and development of Phasor Measurement Units (PMU). In Proceedings of the 2016 12th IEEE International Conference on Industry Applications (INDUSCON), Curitiba, PR, Brazil, 20–23 November 2016; pp. 1–6. [Google Scholar] [CrossRef]
  41. Abdolkhalig, A.; Zivanovic, R. Phasor measurement based on IEC 61850-9-2 and Kalman–Filtering. Measurement 2014, 50, 126–134. [Google Scholar] [CrossRef]
  42. Hajimolahoseini, H.; Taban, M.R.; Soltanian-Zadeh, H. Extended Kalman Filter frequency tracker for nonstationary harmonic signals. Measurement 2012, 45, 126–132. [Google Scholar] [CrossRef]
  43. Belega, D.; Petri, D.; Dallet, D. Accurate frequency estimation of a noisy sine-wave by means of an interpolated discrete-time Fourier transform algorithm. Measurement 2018, 116, 685–691. [Google Scholar] [CrossRef]
  44. Mejia-Barron, A.; Granados-Lieberman, D.; Razo-Hernandez, J.; Amezquita-Sanchez, J.; Valtierra-Rodriguez, M. Harmonic PMU Algorithm Based on Complex Filters and Instantaneous Single-Sideband Modulation. Electronics 2019, 8, 135. [Google Scholar] [CrossRef]
  45. Mingotti, A.; Costa, F.; Cavaliere, D.; Peretto, L.; Tinarelli, R. On the Importance of Characterizing Virtual PMUs for Hardware-in-the-Loop and Digital Twin Applications. Sensors 2021, 21, 6133. [Google Scholar] [CrossRef]
  46. Hu, Y.; Cheng, J.; Zhou, Y.; Chen, G. Control strategy of a high power grid simulator for the test of renewable energy grid converter. In Proceedings of the IECON 2017—43rd Annual Conference of the IEEE Industrial Electronics Society, Beijing, China, 29 October–1 November 2017; pp. 7747–7752. [Google Scholar] [CrossRef]
  47. Bountouris, P.; Tzelepis, D.; Abdulhadi, I.; Coffele, F. Dynamic Model of Commercially Available Inverters with Validation Against Hardware Testing. IEEE Trans. Power Syst. 2022, 38, 2007–2017. [Google Scholar] [CrossRef]
  48. NI 6259; Device Specifications. National Instruments: Austin, TX, USA, 2016.
  49. NI 9225; Operating Instructions and Specifications. National Instruments: Austin, TX, USA, 2014.
  50. Adhikari, P.M.; Hooshyar, H.; Vanfretti, L. Experimental Quantification of Hardware Requirements for FPGA-Based Reconfigurable PMUs. IEEE Access 2019, 7, 57527–57538. [Google Scholar] [CrossRef]
Figure 1. Block diagram of the proposed test platform.
Electronics 13 00245 g001
Figure 2. Built-in DAQ card temperature and analog output frequency error response to change of ambient temperature from 34 C to 25 C.
Electronics 13 00245 g002
Figure 3. DAQ card clock frequency error vs. built-in DAQ card temperature.
Electronics 13 00245 g003
Figure 4. Built-in DAQ card temperature and voltage frequency error response to change of ambient temperature with temperature drift compensation algorithm enabled.
Electronics 13 00245 g004
Figure 5. Block diagram of a dual-core algorithm for software PLL synchronization by an external 1 PPS signal.
Electronics 13 00245 g005
Figure 6. Repeated output zero crossings waveforms triggered by the 1 PPS signal in the oscilloscope’s persistence mode of operation.
Electronics 13 00245 g006
Figure 7. Histogram of rated output voltage obtained for 1000 readings.
Electronics 13 00245 g007
Figure 8. Block diagram of algorithm for selecting various test sequences.
Electronics 13 00245 g008
Figure 9. Magnitude spectrum of normalized rated output voltage.
Electronics 13 00245 g009
Figure 10. Amplitude, phase, frequency deviation, ROCOF, FE, RFE, ME, PE and TVE responses for: (left) frequency ramp tests ( R f = ± 1 Hz/s), and (right) phase modulation tests ( k a = 0.1 , f m = 1 Hz, and f m = 2 Hz).
Electronics 13 00245 g010
Disclaimer/Publisher’s Note: The statements, opinions and data contained in all publications are solely those of the individual author(s) and contributor(s) and not of MDPI and/or the editor(s). MDPI and/or the editor(s) disclaim responsibility for any injury to people or property resulting from any ideas, methods, instructions or products referred to in the content.

